Embed Size (px)
Citation preview
Journal of Industrial Engineering and ManagementJIEM, 2013 – 6(4): 831-859 – Online ISSN: 2013-0953 – Print ISSN: 2013-8423
http://dx.doi.org/10.3926/jiem.635
Building evacuation: Principles for the analysis of basic structures
through dynamic flow networks
Salvador Casadesús-Pursals, Federico Garriga-Garzón
Universitat Politècnica de Catalunya (Spain)
[email protected], [email protected]
Received: November 2012Accepted: July 2013
Abstract:
Purpose: The main purpose of this paper is to perform an analysis of the factors determining
the architectural configuration of buildings for the mobility of people, using dynamic flow
networks and considering group formation in the evacuation process.
Design/methodology/approach: For a long time it has been considered that once an evacuation
begins, movement on the evacuation route mainly obeys mechanical factors; people occupy the
free spaces which lead to evacuation more or less automatically. However, recent research has
emphasized the need to consider people’s behavior; one of the aspects considered in this work
is group formation, with its significant influence on the evacuation process. In positions of
convergence and their branches things become considerably more complicated; as well as
occupants’ behavioral aspects other relevant factors such as the geometry of the premises are
critical in this process. Authors propose models, in which nodes are strategically placed, besides
taking into consideration aspects of behavior. Several cases are analyzed.
Findings: The solution proposed in this paper is to analyze the problem through dynamic flow
networks, using a macroscopic model in a deterministic environment in which the evolution of
the quantities characterizing the problem at regular intervals is represented, obtaining a
reasonably accurate and reliable understanding of the development of the evacuation.
Originality/value: A precise model of evacuation routes, convergence points and branches which
includes a consideration of occupants’ behavior is obtained using stochastic models with
microscopic analysis, in which people’s behavior is considered individually, this solution is
-831-

Journal of Industrial Engineering and Management – http://dx.doi.org/10.3926/jiem.635
complex, difficult to apply with many occupants and in large enclosures, and also, this way does
not lead to optimal solutions.
Keywords: building evacuation, evacuation optimization, optimal evacuation of buildings
1. Introduction
The problem of building evacuation has been dealt with extensively from different viewpoints:
Construction/Fire Safety, mathematics, and psychology/behavioral sciences, highlighting
different classifications for each subject, so the field of mathematics may consider a
classification of continuous or discrete models, stochastic or deterministic, heuristic, or
simulation models which in turn may be deterministic or stochastic. Moreover, models which
include individuals are called microscopic models, whereas macroscopic models are those
which analyze groups of people. As far as the scope is concerned, it is customary to deal with
the evacuation of buildings, sports facilities, ships, trains and urban areas separately. A
comprehensive reference on the problem can be found in EVACMOD, a website where much of
the up-to-date information available on the evacuation of buildings can be found.
The problem of evacuating buildings was born along with large buildings and the assessment of
people’s safety. Starting in the seventies with the study of cases in which research is
conducted on incidents using scientific methodology; Bryan’s (1983) work being pioneering.
These works have been developed over time with highly relevant results, leading to numerous
publications, the most noteworthy of which is that by the multidisciplinary team under the
auspices of NIST which conducted a detailed study of the September 11, 2001 attacks in New
York. The importance of these studies is that from them arise relevant conclusions from which
technical requirements and safety standards are adopted in buildings across the world.
In the eighties the study of dimensions and the movement of people begin, and the first
mathematical formulations that provide estimates for evacuation times appear. A solid
reference on the dimensions of individuals and the movement of people in buildings can be
found in works undertaken by Fruins (1971-1987) in the U.S.A; Pauls (1984) in Canada and
Predtechenskii and Milinskii (1969-1978) in the Soviet Union. Among the most important
recent models on human locomotion are Weidmann and Buchmueller (2007), Nelson and
MacLennan (1996) and Kholshenikov, Shields, Boyce and Samoshin (2009).
Among mathematical models, the problem of building evacuation evolves decisively when
using flow networks, which is thanks to Berlin (1980). The first formulation of the problem to
be optimized was by Francis (1981), and later Francis together with Chalmet and Saunders
(1982) suggest the optimization of building evacuation networks by incorporating dynamic flow
networks, so that later Francis and Kisko (1985) develop the first version of EVACNET
software, an application that determines evacuation times and the optimal distribution of
occupants towards the exits. Years later Choi, Hamacher and Tüfekci (1988) consider flow
-832-
Journal of Industrial Engineering and Management – http://dx.doi.org/10.3926/jiem.635
networks with capacity constraints and arcs with variable capacity, also, in the nineties work by
Hope and Tardos (1994) is relevant as they present algorithms applicable to different dynamic
flow networks, generally quickest flow for problems with multiple source nodes; dynamic
lexicografic maximum flow problem and the earliest arrival flow problem, making it possible to
determine the maximum number of people evacuated from a specified area. Meanwhile,
Hamacher and Tjandra (2001) provide a collection of mathematical models developed building
evacuation until that date. Tjandra and Hamacher (2003) solve the evacuation of buildings
where the number of occupants is not known, the earliest arrival flow capacity model with time
dependent problems. These same authors address multi-objective problems that determine the
evacuation of premises establishing priority for occupants closest to risk points. Baumann and
Skutella (2009) develop a polynomial algorithm that solves the earliest arrival flow with
multiple source nodes and a destination node, considering the problem of continuous flow.
Kamiyama, Katoh and Atsushi (2008) develops algorithms for the implementation of the
solutions presented by Hope and Tardos. More recent work such as by Fang, Zong, Li and
Xiong (2011) used genetic or ant colony algorithms to be optimized in large sports venues.
Continuing in the field of mathematical modeling, another perspective for studying the problem
of evacuating buildings is that of physical models, the first in this field being fluid dynamics
and gas kinetic models, in which they compare the movement of people with fluid dynamics or
gas flow, and Henderson (1974) draws an analogy between the mass of people and the
physical principles of gases by adapting Maxwell Boltzmann functions. A remarkable aspect of
these models is Social Force Models in which it is considered that the movement of people is
due to social forces and individual’ goals, and the authors who start this work are Helbing and
Molnar (1995). Currently these microscopic models have been extensively developed so that as
well as considering purely physical aspects they also incorporate aspects of people's behavior,
which makes them extremely interesting models. Also within the field of physical models we
find Cellular Automaton whose first models were by Fukui and Ishibashi (1999) and Blue and
Adler (2000), and which are dynamic models that discretize space, so individuals are
considered as particles with a degree of freedom that occupy discrete space elements called
cells and can move to neighboring cells with certain transition probabilities according to preset
goals.
In recent years software simulation applications have flourished in the study of building
evacuation, among which we might mention: AENEAS, ALLSAFE, CRISP, EGRESS, EXITT,
EVACSIM, EVI, EXIT-89, EXODUS, GRIDFLOW, LEGION, MAGNETIC MODEL, PATHFINDER,
PEDFLOW, PEDGO, PEDROUTE, SIMULEX, SIMWALK, STEPS, TIMTEX, TSEA, WAY OUT. Among
the huge number of published papers it is worth referring to the work by Gwynne (2009) who
demonstrates that simple modeling of the physical aspects does not adequately reproduce the
building evacuation process in situations in which people’s behavior is implicit, a concept, the
study of behavior, which is nothing new, as Frantzich and Benthorn (1999) published a paper
on how the occupants of an IKEA store in Helsingborg Sweden made a choice of exits. Also,
-833-

Journal of Industrial Engineering and Management – http://dx.doi.org/10.3926/jiem.635
Galea, Sharp and Lawrence (2008) investigated the factors that determine the flow ratio at
junctions, and more recently Köster Seitz, Treml, Hartmann and Klein (2011) analyzed the
formation of groups in the evacuation process. All this suggests that the current trend is in
multidisciplinary models, mathematical models that incorporate and attempt to reproduce
individuals’ behavior, one of which is the formation of groups referred to in this paper.
2. Defining structures in buildings
In order to study the evacuation of buildings the basic structures need to be defined:
evacuation routes, confluences and branches (see Figure 1). Many buildings can be modeled by
only considering these three elements.
A circulation route is a set of dependent units placed successively from a source to a
destination, linked by consecutive arcs. The joining of various routes or exit areas that
converge in one place leads to a confluence, similarly, when a single unit or circulation route
diverges into several separate routes a branch is formed.
Figure 1. Evacuation route, confluence, and branch
To model the problem of architectural design elements which make up the basic structures of
the evacuation system a descriptive analysis of each situation is undertaken and then
represented by a flow network. The static flow network consists of nodes and arcs, the node
elements being busy at the outset or at any time during the evacuation process, while the arcs
represent the circulation elements (corridors, stairwells, hallways, etc.).
The dynamic network used to represent the process of evacuating the building is defined from
the static network. The modeling adopted is that presented by Francis et al. (1982) with some
special features that provide a more accurate modeling which allows for the consideration of
behavioral elements such as group formation. The nodes are not located in the center of the
premises but rather at specific points in the network, so there is a greater correspondence
between architectural elements and their representation, in this way a corridor in a building is
defined by a node and an arc. In an identical manner to that used in conventional networks h
periods of magnitude δ are considered, for example 50 periods of 10 seconds, 100 periods of 5
seconds 100, etc. To construct the dynamic network, h copies of the static network are made
-834-

Journal of Industrial Engineering and Management – http://dx.doi.org/10.3926/jiem.635
and they represent the building and expand in time periods, the initial period starts at the
moment 0 and the final period ends at the moment T, where T = h × δ . For each node j of the
static model, (h + 1) copies are made and are positioned sequentially and numbered from left
to right according to the index i of the corresponding period by correlated natural numbers 0,
1, 2,. . . h, then a similar procedure for the arcs, each arc (j–j´) representing the displacement
of occupants from j to j' starting in period i, h copies are made, the required number to model
the displacement of all occupants from the source node j to the destination j´. There are also
arcs (j-j) called retention arcs which represent the development of the occupation of node j.
A diagram of the basic network variables can be seen in Figure 2, enclosures k j and capacity
enclosures cj are variables which characterize the nodes, while flow capacity cj-j (people per
period) and circulation time tj-j (periods) are variables belonging to the arcs.
Figure 2. Basic network variables
The capacity of enclosures cj depends on the effective surface area of the enclosure as well as
the size of the occupants and the separation between them reflected as occupying density d j.
j ej jc a d= (1)
Flow capacity cj-j’ of an arc or peak flow depends on the minimum effective width wej-j´ between
the units j and j´ and on the maximum flow that can be registered on this path. The minimum
effective width has been defined by Pauls (1984).
j j' e j j' j j'c (w f )− − −= δ (2)
Flow capacity tj-j’ of the occupants in premises or a group, between nodes (j-j´) depends on
the distance lj-j, and the average flow speed vj-j´ which is developed on the path, and is
expressed in periods.
)v/l(t 'jj'jj'jj δ= −−− (3)
To estimate the size of the occupying densities, flows and displacement speeds it is possible to
use occupancy and locomotion models provided by Fruins (1971-1987).
3. Dynamic analysis of circulation routes
As already defined, an evacuation route is a set of n dependent units (n ≥ 3) located
successively and connected by (n-1) arcs. Figure 3 shows an evacuation route made up of a
source node or several circulation nodes A, B, C, D, E, F, and a destination node DS which can
-835-

Journal of Industrial Engineering and Management – http://dx.doi.org/10.3926/jiem.635
be accessed from the arcs O-A, A-B,..., F-DS. In origin of evacuation nodes the occupying
densities, the physical conditions of the circulation route (horizontal flow, ramp, stairs, etc.), as
well as the personal characteristics of the occupants determine displacement speeds towards
the next node.
Figure 3. Architectural configuration of an evacuation route
The dynamic analysis of circulation routes is divided into three parts: a descriptive analysis of
the problem which allows for the observation of the physical conditions that determine the
development of the evacuation, followed by the variables observed being placed in the
dynamic network, and finally obtaining the resultant mathematical relations from the process.
3.1. Descriptive analysis of circulation in an evacuation route
To perform the analysis the simplest circulation route is used, that formed by a source node O
occupied by kO people, a single movement node A of length L in which two sections of lengths
l1 y l2 are considered, a section l3 representing the length taken up by the delay, a destination
node DS, an arc O-A which connects the source node O with the circulation A and another A-
DS which links A with the destination DS. It is assumed that the capacity of circulation in the
corridor cO-A is superior to that of the exit cA-DS, giving rise to the existence of delays, and it is
considered that the corridor has a capacity cA, in a way that access to it can be affected.
The initial circulation times between O-A and A-DS are the variables τO-A and τA-DS which are
considered to be of periods 2 and 1 respectively. Figure 4 shows the development of the
evacuation in a deterministic context without delays at the outset and assuming constant flow,
and three stages can be observed: a transitory exit process from source node O, a stationary
circulation process in the corridor A, and a transitory occupation process of the destination DS.
In the first period xO-A(1) people are leaving the source node O and access the corridor A with a
flow value xO-A(1) the maximum possible cO-A, the flow capacity value between O and A. See
Figure 4 in which the first half of corridor A is occupied, the people who have left O at the end
of the first period find themselves halfway along the route as the circulation time is two
periods.
In the second period the xO-A(1) people from the first period that were occupying the first half
of the corridor move to the second half and others xO-A(2) access the corridor requiring
-836-
Journal of Industrial Engineering and Management – http://dx.doi.org/10.3926/jiem.635
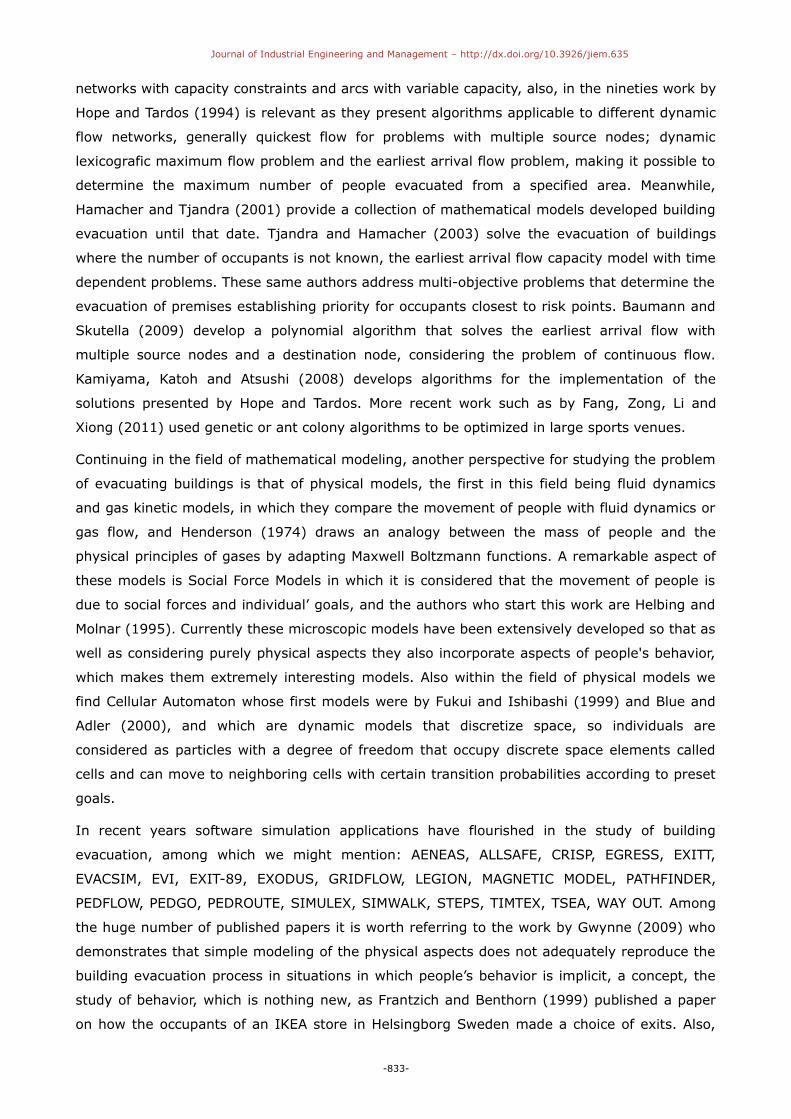
immediate calculation of occupancy the areas O and A at the end of the period every time it is
observed that the entire surface of the corridor has been occupied; presumably having not
reached maximum occupancy cA. If the circulation time τO-A is of two periods, when they have
elapsed, the first occupants who had left the premises at source O in the first period, at the
end of the second period have reached the exit area A.
Figure 4. Descriptive analysis of the development of circulation in an evacuation route
Finally, in the third period there is an entry flow xO-A(3) in corridor A and an exit flow xA-DS(3),
the difference between the number of people entering the corridor and those that leave is the
increase in occupation recorded during the period. In the following periods until the corridor
reaches its maximum capacity the process is transitory, in each period corridor occupation
increases until it reaches its maximum capacity at which time the next stage, defined as the
stationary process, begins. When the corridor reaches its capacity cA the process becomes
stationary, the same number of people enter the corridor as leave it, a situation which is
maintained for a few periods. In the final periods when no entries are recorded into corridor A
the process is once again transitory. Finally when there are no occupants in O to maintain a
stable circulation flow the process is once again transitory, corridor A is emptied from its
maximum capacity, the occupants from A start occupying DS.
-837-

Journal of Industrial Engineering and Management – http://dx.doi.org/10.3926/jiem.635
Papers that have studied the formation of groups often begin with the phrase "Families survive
together or die together", as it is an undeniable fact that people affected by an evacuation
process may be individuals subject to a specific group be it family, friends or an organization.
If when modeling an evacuation route the initial formation of groups is taken into account the
situation becomes more complex (see Figure 5), where it can be seen that in the source the kO
occupants are forming different groups, in the moments when the occupants are in area A the
groups remain in occupancy densities lower than expected.
Figure 5. Initial formation of groups in the evacuation process of a single route
Group formation can be modeled using macroscopic models, the exit vector values of the area
should take the values corresponding to this situation. When working with fine networks,
reduced time intervals, the differences to microscopic models are irrelevant.
m
O Ojj 1
k (0) k (0)=
= ∑ (4)
At a source node with an occupancy KO in which m groups form, the occupants of the various
groups complete the occupation of the node, a fact shown in the expression (4). There are
situations in which groups that form initially are numerous, consisting of more than twenty
people, for example this situation occurs in the evacuation of large venues visited by school
groups; in such cases an alternative solution to the problem is to consider each group as a
source node. Another commonly observed situation consists of the formation of groups
according to the circulation speed during the evacuation process which is relevant in situations
in which evacuation routes are relatively long.
People’s individual displacement speed is a random variable, a stochastic process that
corresponds to a normal distribution. On long routes it has been observed as a standard that
three groups usually form: an initial group in which faster moving people are placed, a large
middle group consisting of people who move more slowly due to their fitness level, attitude to
the process of evacuation or impossibility of overtaking, and a final group with people moving
at a slower rate. Considering these three displacement speeds for each group, it is possible to
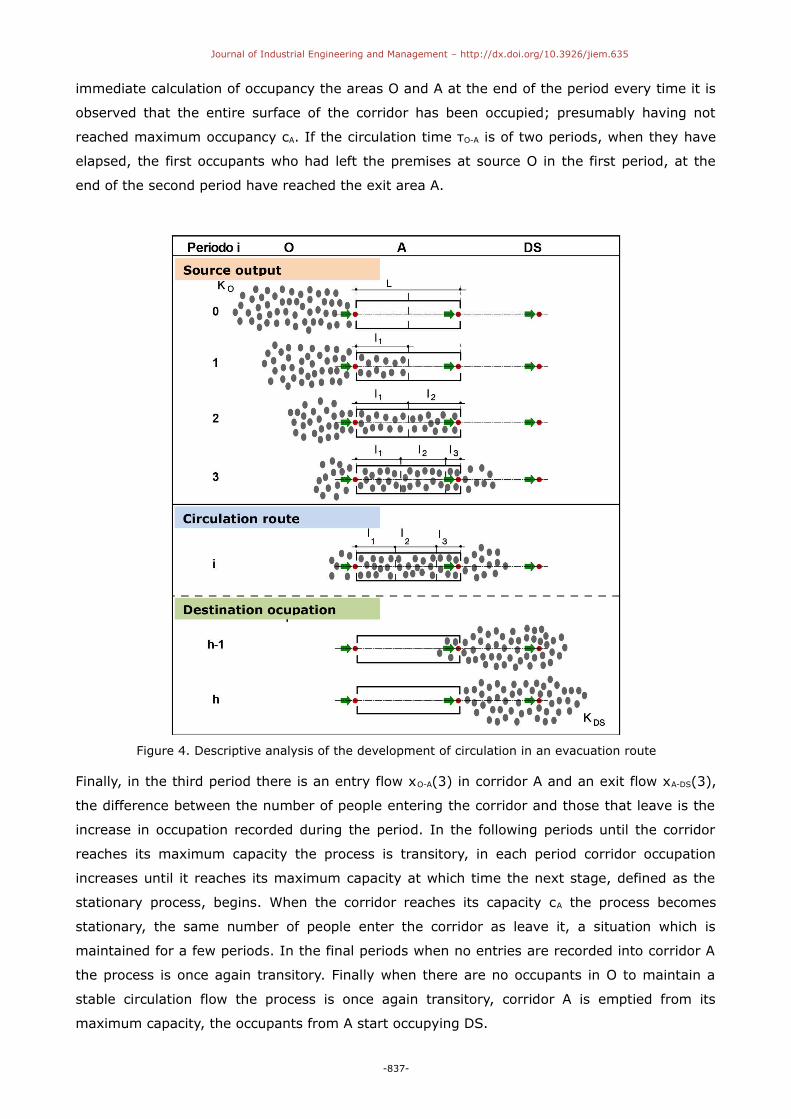
model in dynamic network giving the situation shown in Figure 6.
-838-
Journal of Industrial Engineering and Management – http://dx.doi.org/10.3926/jiem.635
Figure 6. Groups forming in the evacuation route due to the speed of movement
In the solution proposed for these cases, modeling using a dynamic network, you lose the
identity of the groups as the model used is a macroscopic model, but the incidence of this
effect is taken into account in the evacuation process.
3.2. Dynamic network of an evacuation route
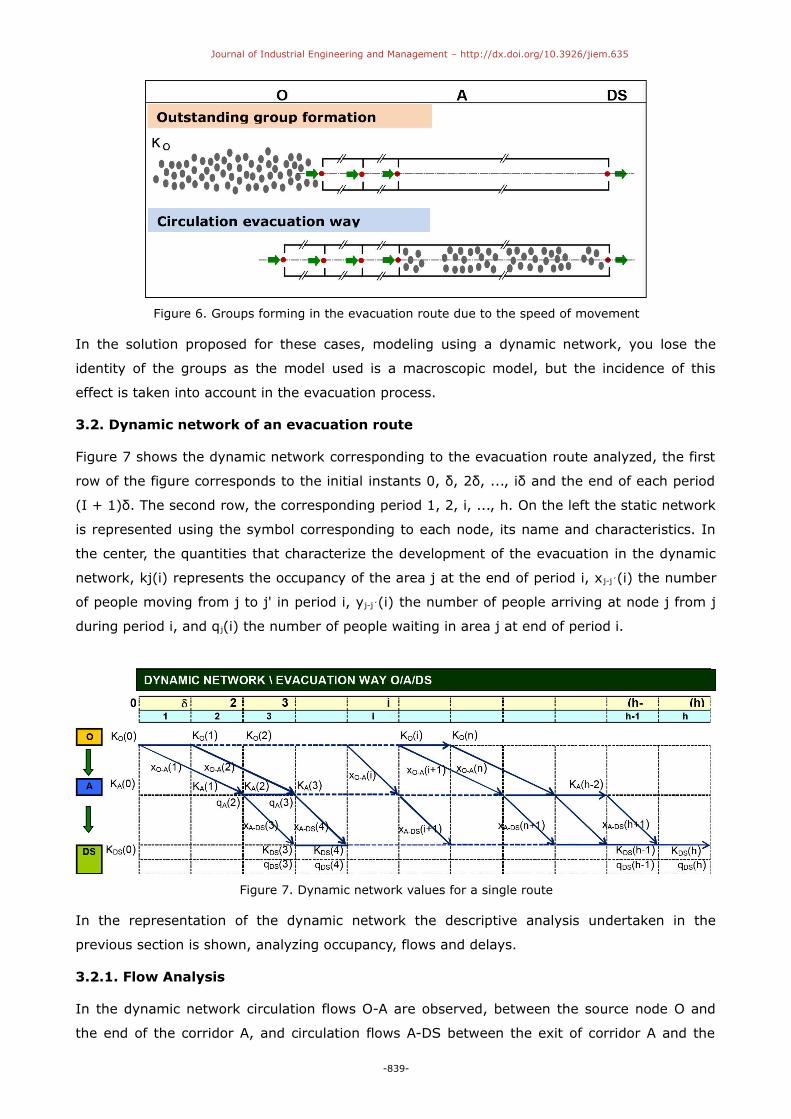
Figure 7 shows the dynamic network corresponding to the evacuation route analyzed, the first
row of the figure corresponds to the initial instants 0, δ, 2δ, ..., iδ and the end of each period
(I + 1)δ. The second row, the corresponding period 1, 2, i, ..., h. On the left the static network
is represented using the symbol corresponding to each node, its name and characteristics. In
the center, the quantities that characterize the development of the evacuation in the dynamic
network, kj(i) represents the occupancy of the area j at the end of period i, x j-j´(i) the number
of people moving from j to j' in period i, yj-j´(i) the number of people arriving at node j from j
during period i, and qj(i) the number of people waiting in area j at end of period i.
Figure 7. Dynamic network values for a single route
In the representation of the dynamic network the descriptive analysis undertaken in the
previous section is shown, analyzing occupancy, flows and delays.
3.2.1. Flow Analysis
In the dynamic network circulation flows O-A are observed, between the source node O and
the end of the corridor A, and circulation flows A-DS between the exit of corridor A and the
-839-
Journal of Industrial Engineering and Management – http://dx.doi.org/10.3926/jiem.635
destination DS. xO-A´(1) is the number of people moving from O to A in the first period and
yO-A(3), yO-A(3) = xO-A´(1+2) represent arrivals at A from O during the third period as a
circulation time of two periods is assumed. In the initial periods yO-A(1) e yO-A(2) are zero as in
these periods there are no arrivals at A.
With regard to circulation towards DS, xA-DS´(1) y xA-DS´(2) have zero values since there are no
occupants at A. In the third period xA-DS´(3) takes the capacity value cA-DS for the path between
A and DS, and since the circulation time is of a period the resulting arrivals are yA-DS´(4). If
there are situations of group formation, the exit flows from each node x j-j´ will represent that
situation.
3.2.2. Analysis of occupancy and delays
In this analysis it is worth distinguishing between evacuation source nodes, circulation nodes
and evacuation destination nodes. In the source node O it is observed that kO(0) represents
the initial occupation of this area, kO(1) the occupancy at the end of the first period, kO(2) the
occupancy at the end of the second period, and so on until reaching the moment when no
occupants remain kO(n) = 0 at which time the evacuation from the area is complete. In the
intermediate node occupancy kA(0) is the initial value, with kA(1) representing occupancy at
the end of the first period. The occupancy of an intermediate node has two components: the
people who are circulating and those who are delayed. People that are circulating are those
who abandoned O in the first period xO-A´(1), and those who are delayed qA-DS´(i), in this case
qA-DS´(1) = 0 since no occupant has reached the exit, which makes it impossible for any delays
to exist. In the second period occupancy kA(2) is determined by xO-A´(1) y xO-A´(2), people who
have accessed A during the first and second periods respectively, in this case there are again
no people delayed qA-DS´(2) = 0. Throughout the third period xO-A´(1) people reach the end of A;
who are those who left O during the first period, ie yO-A(3), of all these people xA-DS(3) go
towards DS. The difference between the arrivals and departures [yO-A´(3) – xA-DS(3)] are the
people who are delayed qA´(3). The occupation of A defined by kA(3) is given by the sum of the
people waiting at the end of the period qA´(3) and those who have accessed A defined by xO-A´(2)
y xO-A´(3).
With respect to the occupancy of destination node DS, there are qDS´(·) people waiting and
xA-DS(i) people abandoning A circulating to the safe destination DS. The occupancy of DS at the
end of period h is represented by kDS(h), occupancy that matches the initial occupancy kO(0)
since it corresponds to the end of the evacuation. While qA(i) is a delay, qDS(i) represents the
people waiting at destination DS. Knowing the delays at the end of each period facilitates the
analysis of the impact of these delays on the development of the evacuation, so for example,
long waits can generate occupants’ nervousness, which is extremely important to know in an
emergency situation. The analysis of the circulation in a corridor and its representation through
a dynamic network allows us to know the process of evacuation in an evacuation route.
-840-
Journal of Industrial Engineering and Management – http://dx.doi.org/10.3926/jiem.635
3.3. Relations describing circulation in an evacuation route
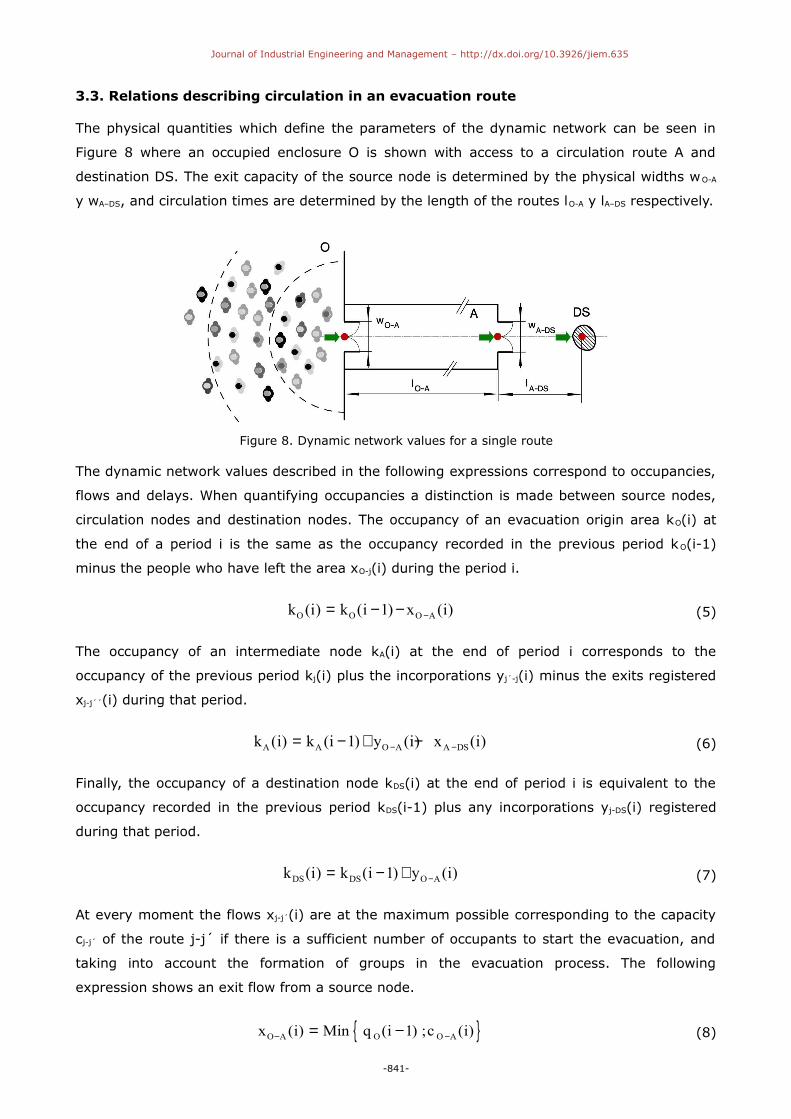
The physical quantities which define the parameters of the dynamic network can be seen in
Figure 8 where an occupied enclosure O is shown with access to a circulation route A and
destination DS. The exit capacity of the source node is determined by the physical widths wO-A
y wA–DS, and circulation times are determined by the length of the routes lO-A y lA–DS respectively.
Figure 8. Dynamic network values for a single route
The dynamic network values described in the following expressions correspond to occupancies,
flows and delays. When quantifying occupancies a distinction is made between source nodes,
circulation nodes and destination nodes. The occupancy of an evacuation origin area kO(i) at
the end of a period i is the same as the occupancy recorded in the previous period kO(i-1)
minus the people who have left the area xO-j(i) during the period i.
O O O Ak (i) k (i 1) x (i)−= − − (5)
The occupancy of an intermediate node kA(i) at the end of period i corresponds to the
occupancy of the previous period kj(i) plus the incorporations yj´-j(i) minus the exits registered
xj-j´´(i) during that period.
A A O A A DSk (i) k (i 1) y (i) x (i)− −= − + − (6)
Finally, the occupancy of a destination node kDS(i) at the end of period i is equivalent to the
occupancy recorded in the previous period kDS(i-1) plus any incorporations yj-DS(i) registered
during that period.
DS DS O Ak (i) k (i 1) y (i)−= − + (7)
At every moment the flows xj-j´(i) are at the maximum possible corresponding to the capacity
cj-j´ of the route j-j´ if there is a sufficient number of occupants to start the evacuation, and
taking into account the formation of groups in the evacuation process. The following
expression shows an exit flow from a source node.
{ }O A O O Ax (i) Min q (i 1) ;c (i)− −= − (8)
-841-

Journal of Industrial Engineering and Management – http://dx.doi.org/10.3926/jiem.635
While at an intermediate node the expression is transformed as follows:
{ }A DS A O A A DSx (i) Min q (i 1) y (i) ;c (i)− − −= − + (9)
With regard to the delays qj(i) which are recorded in the area j corresponding to the value in
the previous period qj(i-1) plus the increment of the difference between entries y j´-j(i) and exits
xj´-j(i) during the period.
O A O A O A A DSq (i) q (i 1) y (i) x (i)− − − −= − + − (10)
Delays are a very important element in the study of this problem, which makes it an essential
area of study.
3.4. Numerical applications for the study of an evacuation route
Below is an analysis corresponding to the evacuation of premises with occupied by 198 people.
Figure 9 shows the dynamic network as well as a presentation of the calculations undertaken,
while Figure 10 shows a table of the results. This example uses periods of 10 seconds, with
maximum flows of 15 and 12 people / period, constant circulation times of 2 and 1
respectively, where delays at the initiation of the evacuation are not supposed and the capacity
of A is not considered significant.
Figure 9. Dynamic network of an evacuation route used as an example
The figure shows how in each period 15 people leave the source node until we reach period 13
when the evacuation of O is finalized, just as it is shown that in each period 12 people head to
the destination DS leaving three people trapped in A for each period, while an increase in
occupancy is observed at the destination, the evacuation ending after 20 periods, giving an
evacuation time of 200 seconds. Occupancy of O decreases, while occupancy of DS increases,
and A reaches a maximum value of 63 people.
The representation of the evacuation route through a dynamic network uncovers the
calculation process of the evacuation. In the example a deterministic model has been used in
which circulation obeys the conditions of hydraulic flow, the exit flows from the source node
and the exit flows from A are constant, these flows are not altered by the destination node
capacity, and also delays occur in A. The results table shows in detail the values which
-842-

Journal of Industrial Engineering and Management – http://dx.doi.org/10.3926/jiem.635
characterize the process and from which a graphical analysis of the results can be made if
deemed appropriate.
Figure 10. Example: Table of results of the dynamic network of an evacuation route
4. Dynamic analysis of confluences
In buildings there are locations where the confluence of movement from several areas occur or
the confluence of several evacuation routes go into one. Movement through confluences is
complex because there are many possible configurations depending on the geometrical
conditions of the area. Figure 11 shows three possible configurations: perpendicular flows,
opposing flows and adjacent flows.
Figure 11. Examples of confluence configurations
When, after a confluence, movement continues to form a single flow it is known as a simple
confluence.
The existence of groups has a major effect on the confluence, there are situations in which the
group has a significant effect on its operation, it has been observed in residential compounds that
when families are involved in the evacuation process groups are maintained, whereas if there is no
link between the individuals in the groups at the confluence the situation is more orderly.
-843-
Journal of Industrial Engineering and Management – http://dx.doi.org/10.3926/jiem.635
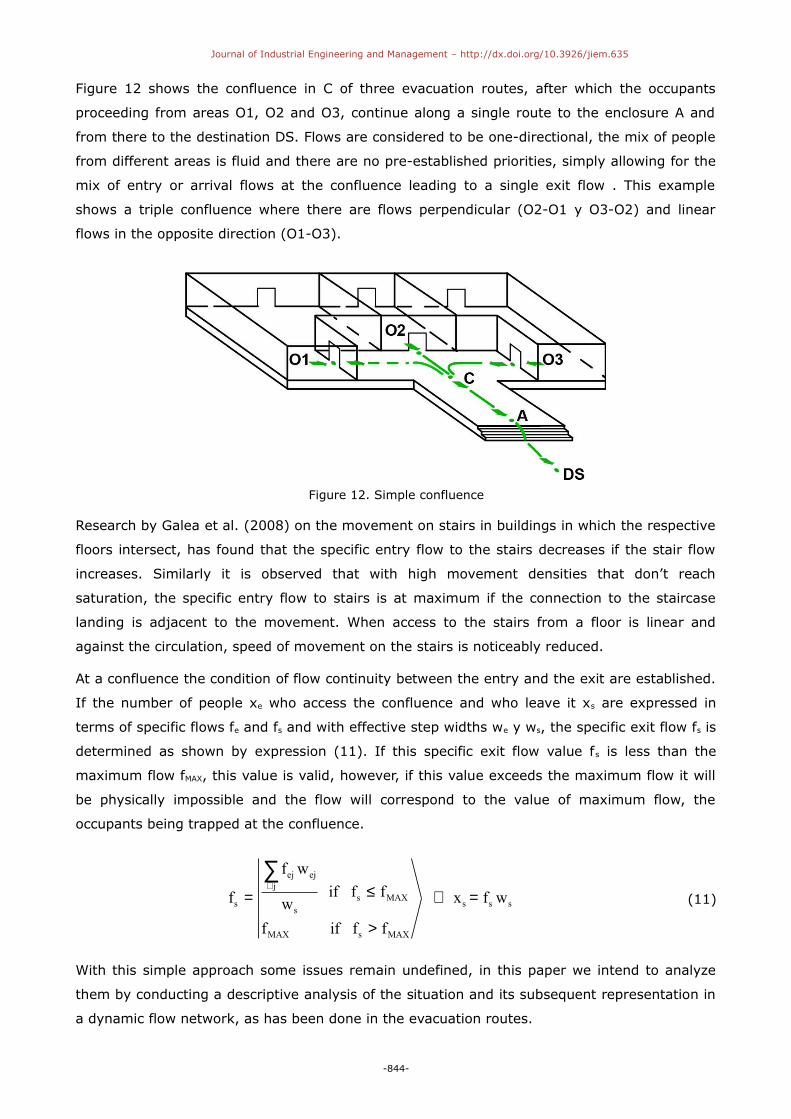
Figure 12 shows the confluence in C of three evacuation routes, after which the occupants
proceeding from areas O1, O2 and O3, continue along a single route to the enclosure A and
from there to the destination DS. Flows are considered to be one-directional, the mix of people
from different areas is fluid and there are no pre-established priorities, simply allowing for the
mix of entry or arrival flows at the confluence leading to a single exit flow . This example
shows a triple confluence where there are flows perpendicular (O2-O1 y O3-O2) and linear
flows in the opposite direction (O1-O3).
Figure 12. Simple confluence
Research by Galea et al. (2008) on the movement on stairs in buildings in which the respective
floors intersect, has found that the specific entry flow to the stairs decreases if the stair flow
increases. Similarly it is observed that with high movement densities that don’t reach
saturation, the specific entry flow to stairs is at maximum if the connection to the staircase
landing is adjacent to the movement. When access to the stairs from a floor is linear and
against the circulation, speed of movement on the stairs is noticeably reduced.
At a confluence the condition of flow continuity between the entry and the exit are established.
If the number of people xe who access the confluence and who leave it xs are expressed in
terms of specific flows fe and fs and with effective step widths we y ws, the specific exit flow fs is
determined as shown by expression (11). If this specific exit flow value fs is less than the
maximum flow fMAX, this value is valid, however, if this value exceeds the maximum flow it will
be physically impossible and the flow will correspond to the value of maximum flow, the
occupants being trapped at the confluence.
ej ejj
s MAXs s s s
s
MAX s MAX
f w
if f ff x f ww
f if f f
∀ ≤= ⇒ =
>
∑(11)
With this simple approach some issues remain undefined, in this paper we intend to analyze
them by conducting a descriptive analysis of the situation and its subsequent representation in
a dynamic flow network, as has been done in the evacuation routes.
-844-

Journal of Industrial Engineering and Management – http://dx.doi.org/10.3926/jiem.635
4.1. Descriptive analysis of confluence movement
A case analysis is made of two areas O1 and O2 occupied by people kO1 and kO2 respectively,
with an area A in which flows merge occurs giving access to evacuation point DS. Significant
factors considered within this process are physical characteristics of the occupants and
confluence surface, given that both factors determine its full capacity cO1-O2-A, as well as access
route lengths lO1-A and lO2-A and the physical conditions of movement which determine the travel
time to confluence τO1-A and τO2-A. This supposes a value of 2 and 1 respectively. Route length lA-
DS gives rise to supposed flow capacity τA-DS of 1 period. The movement capacities in confluence
cO1-A, cO2-A for entrances and cA-DS for exit depend on effective minimum widths wO1-A, wO2-A and
wA-DS respectively. Figure 13 shows the descriptive process analysis without taking jams at the
start of evacuation into account.
Figure 13. Process in a simple confluence
In the first period, xO1-A(1) people coming from source node O1 and xO2-A(1) people coming from
O2 head towards confluence A. If flow capacities O2 are of 1 and 2 periods, the xO2-A(1) people
coming from O2 arrive at the confluence at the end of the first period whereas those xO1-A(1)
-845-

Journal of Industrial Engineering and Management – http://dx.doi.org/10.3926/jiem.635
coming from O1 can be found halfway along their route, where these arrivals are yO2-A(2) and
yO1-A(3) supposing capacity cA is not reached.
Throughout the second period, the xO2-A(1) people who left O2 during the first period arrive at A
giving rise to the xA-DS(2) people who leave the confluence to head towards destination DS. The
xO1-A(1) people coming from O1 are circulating in the confluence, this being the flow capacity of
2 periods. xO2-A(2) people coming from O2 and xO1-A(2) people coming from O1 commence
evacuation. During this period flows xO1-A(1) and xO2-A(2) merge with xA-DS(2) people leaving the
confluence simultaneously. The difference between entrances and exits are the qA(2) people
held up. Occupancy of A is determined by the flow balance and people held up. People in
movement and those waiting are also taken into account.
In the third period, the situation is similar to that in the previous period as a mergence of flows
between occupants coming from O1 and O2 takes place. Two entrance flows and one exit flow
proceed through the confluence. Occupancy in confluence A increases until reaching full
capacity, the point at which the transitory period finalizes and the stationary period
commences.
In the stationary period, the number of people entering the confluence corresponds to the
number of people leaving it. The difficulty arises when determining the number of people
coming from O1 and O2 who have access to it. A simple solution consists in each period of
establishing the proportion taken from access width. In other cases access configuration or
personal characteristics of the occupants are also taken into consideration. These values, which
are habitually defined via the confluence loading function ΦC, are adjusted using evacuation
simulations.
Figure 14. Existence of groups in a confluence process
-846-

Journal of Industrial Engineering and Management – http://dx.doi.org/10.3926/jiem.635
A transitory process arises when no occupants remain in source nodes O1 and O2 whereas a
resulting transitory emptying process arises when no further occupants enter the confluence. A
maximum number of people leave the confluence period-on-period until no occupants are left.
In a simple confluence the mergence between occupants develops in an orderly way with no
pre-established priorities. If, on the other hand, we analyze the existence of groups in a
confluence process, it can be seen that priorities between these groups are often established.
People entering a confluence in an automatic way respect the groups by prioritizing the
movement of a specific group, such as in Figure 14 where the occupants of O1 give priority to
the group proceeding from O2. Although those situations in which a total respect for
established groups occurs have been verified in hotel evacuations, there is a noticeable
uncertainty over whether this process observed in relatively non-severe situations would be
maintained in emergency situations.
4.2. Dynamic network of a confluence
Figure 15 shows the dynamic network which enables the study of a simple confluence
evacuation. Both the initial and final moments of each period and the periods corresponding to
the network are shown at the top of the figure, an outline of the static network is shown on the
left, and the values characterizing the development of the evacuation within the dynamic
network are shown in the centre. Said values are: occupancies kj(i), exit flows xj-j´(i), arrival
flows yj-j´(i), and the number of people waiting at the end of the corresponding period q j(i).
Figure 15. Values of a simple confluence dynamic network
4.2.1. Flow analysis
Two exit flows xO1-A(1) y xO2-A(1) corresponding to those people leaving O1 and O2 respectively
can be observed in the first period. In the second period what can be seen is an arrival flow
yO1-A(2), corresponding to those people who have left node O1 in the first period, together with
four exit flows. The first of these exit flows xO1-A(1) refers to those people who have left O1 at
the start of the first period and who have arrived at A at the end of the second period, where
-847-

Journal of Industrial Engineering and Management – http://dx.doi.org/10.3926/jiem.635
the exits of O1 and O2 in this period are xO2-A(2) y xO1-A(2 ). Finally xA-DS(2) people leave A to
head towards destination DS.
Three arrival flows are produced during the third period, two towards node A, these being
yO1-A(3) and yO2-A(3), and a third yA-DS(3) towards destination DS. As in the previous period,
four exit flows take place: xO1-A(2), xO1-A(3), xO2-A(3), and xA-DS(3). This process continues
period-on-period until evacuation is completed.
4.2.2. Occupancy and congestion analysis
Initial occupancy in evacuation source nodes are given as kO1(0) and kO2(0) and occupancies at
the end of the first period are given as kO1(1) and kO2(1). Occupancy in any non-initial node is
given by people who are either moving along or waiting. Finally, occupancy of confluence node
A is kA(1).
Congestion is expressed as qA(i) and qDS(i), where qA(i) is people held up in A and qDS(i) is
people found at destination DS.
4.3. Mathematical relationships describing confluence movement
In order to establish the implicit mathematical relationships in a confluence, its physical
conditions and principal values need to be taken into account. Figure 16 shows passage widths
wO1-A and wO2-A which give confluence access and width of confluence exit wA-DS. On the other
hand, route times are given by route lengths lO1-A, lO2-A, and lA-DS, personal characteristics of the
occupants, and physical conditions of movement.
Figure 16. Example of a confluence
Following on from this, the principal mathematical relationships established in the dynamic
network, the corresponding expressions for node occupancy, and flows are then defined. What
can be seen is that the expressions given for the study of congestion in an evacuation route
are identical thus occupancy of the origin evacuation nodes kOj(i) is given by the occupancy
registered in the previous period kOj(i-1) minus the people who have left the node in the
present period xO-A(i).
-848-

Journal of Industrial Engineering and Management – http://dx.doi.org/10.3926/jiem.635
Oj Oj Oj Ak (i) k (i 1) x (i)−= − − (12)
Occupancy in confluence kA(i) corresponds with occupancy in the previous node kA(i-1)
increased by arrivals produced during the present period yOj-A(i) minus exits registered xA-DS(i).
A A O1 A O2 A A DSk (i) k (i 1) y (i) y (i) x (i)− − −= − + + − (13)
Finally, occupancy of destination node kDS(i) is given by occupancy registered in the previous
period kDS(i-1) increased by arrivals produced during period yA-DS(i).
DS DS O Ak (i) k (i 1) y (i)−= − + (14)
While the intermediate node has not yet reached full capacity, movement flows xO-A(i) will be at
their highest possible cO-A. However, when the confluence reaches saturation, it is complex to
predict the number of people proceeding from the source nodes who will head towards it. A
reasonable formula, therefore, is the proportionality criterion of access widths applied
period-on-period.
{ }A A O O A
Oj A
A A Oj A O AMAX O1 A O2 A
k (i*) c Min q (i 1);c (i)x (i)
k (i*) c x 1
−−
− − − −
≤ −= > φ φ + φ =
(15)
Movement towards destination node xA-DS(i) will be the highest possible cA-DS at all times.
{ }A DS A O A A DSx (i) Min q (i 1) y (i) ;c (i)− − −= − + (16)
Following group formation, the process is similar to that in a simple confluence. What must be
highlighted is the behavior of the proportionality function ΦOj-A which commonly takes the form
ΦOj-A(i) using values 0 or 1 with the finality of establishing priorities between occupants from
O1 and O2. This is known as the traffic-light function.
4.4. Numerical application for confluence study
Below is an example of the evacuation of two areas occupied by 110 and 165 people
respectively. The evacuation routes from the source nodes have a capacity of 8 and 12
people per period and the access route to its destination has a capacity of 18. This thus
causes a jam in the confluence. Figure 17 shows the corresponding dynamic network in
which the development of confluence occupancy in the occupancy of A can be seen. It also
states that following 18 periods all the occupants in their entirety can be found in
destination DS.
Occupancy of O1 and O2 reduces period-on-period whereas that of destination DS increases.
What can also be seen is confluence occupancy which is at its highest in the fourteenth period.
This entirely takes place in the established conditions of constant flows.
-849-

Journal of Industrial Engineering and Management – http://dx.doi.org/10.3926/jiem.635
Figure 17. Example of a confluence dynamic network
The values given in the dynamic network can be arranged in a table (Figure 18) to enable a
detailed analysis. This table can then be used to produce various analytical calculations and
graphs, such as diagrams of occupancy or flows registered at each exit.
Figure 18. Example of a confluence result table
5. Dynamic analysis of branches
A branch (Figure 19) occurs when the occupants of a building are able to choose between
several movement areas in order to continue their route towards an evacuation destination.
Figure 19 shows a simple branch in which the occupants of area O reach area R from which
they have the option of choosing between two alternative passage routes taking them either to
destination DS1 or DS2 There is always a reason as to why these occupants head towards
either DS1 or DS2, although no supposition can be made beforehand in favor of either DS1 or
DS2.
-850-

Journal of Industrial Engineering and Management – http://dx.doi.org/10.3926/jiem.635
Figure 19. Example of a branch
Several authors, such as Predtechenskii and Milinskii (1969-1978), Frantzich and Benthorn
(1999), etc, have rigorously studied movement conditions within a branch. It is worth
highlighting investigations carried out by Chen, Li and Zhang (2012) in which they reproduce
the passage and exit selections in branches in particular building types using simulation
models based on cellular automatas.
5.1. Descriptive analysis of movement in a branch
The process used in the study of branches has been identical as that followed in the study of
evacuation routes and confluences, a detailed analysis of evacuation development, its
representation through a dynamic network, and the deduction of the principal mathematical
relationships. Figure 20 considers an area O occupied by kO people with access to an area A in
which the branch is produced giving access to two circulation routes heading towards
destinations DS1 and DS2. Considered significant in this process are actual branch
configuration, its physical characteristics, personal characteristics of the occupants, and
knowledge the occupants have of the building thus conditioning them to head towards one or
other destination. Access capacity of the branch is given by c O-A and its exit capacity is given by
cA-DS1 and cA-DS2. The moment the branch occurs is established at the precise moment of arrival
of τO-A. Likewise, τA-DS1 and τA-DS2 set the destination in the same way as travel times. It is
supposed that the value of flow capacity is of one period, no delays occur at the start of
evacuation, and also that a group of people are ready at O to commence evacuation.
Figure 20 shows the descriptive analysis of the process. In the first period, xO-A(1) people
coming from source node O head towards branch A; if flow capacity τO-A is of one period, at the
end of said period these people will arrive at the branch point giving rise to yO-A(2) arrivals,
thus producing a branch in the following period. It is supposed that capacity cA is not reached.
In the second period, xO-A(2) people coming from source node O will head towards branch A.
Likewise, the people arriving at confluence yO-A(2) select the evacuation route which leads
them to destination DS1 or DS2, where xA-DS1(2) is the people heading towards DS1 and xA-DS2(2)
is those heading towards DS2, occupying routes A-DS1 and A-DS2 respectively.
Occupancy kA(2) of branch A is evaluated using the people in movement together with those
held up. If there were a difference between entrance and exits, there would be qA(2) people
-851-

Journal of Industrial Engineering and Management – http://dx.doi.org/10.3926/jiem.635
held up in A. If flow capacity τA-DS1 y τA-DS2 is of one period, at the end of said period yA-DS1(3)
and yA-DS2(3) will arrive at DS1 and a DS2 respectively.
Figure 20. Analysis of the branch process
In the third period, the exit flow from source node xO-A(3) and the exit flows from A towards
destinations xA-DS1(3) and xA-DS2(3) must be taken into consideration. Said flows will develop
identically to those described in previous sections. Those people leaving the source in the
previous period yO-A(3) arrive at the branch and yA-DS1(3) and yA-DS2(3) people are incorporated
heading towards the destination. Occupancy within the area of branch A increases until
reaching full capacity, at which time the transitory filling period of the branch finalizes and the
stationary period commences. In said stationary period, the number of people entering the
branch corresponds with those who leave. The difficulty arises in determining the number of
people heading towards each destination DS1 and DS2. A simple solution is to establish
proportionality in each period from access widths and in other cases access configuration or
-852-

Journal of Industrial Engineering and Management – http://dx.doi.org/10.3926/jiem.635
personal characteristics of the occupants. These values are very often adjusted using
evacuation simulations and are generically indicated using the exit function of branch ΦR. A
transitory process results once again when no occupants remain in source node O. Finally,
when no further occupants enter, the branch enters a transitory emptying process in which a
maximum number of people leave to head towards one of the destinations until no occupants
are left.
Figure 21. Existence of groups in a branch process
When considering occupant groups in the branches, maintenance of groups must be referred
to. In a simple branch it has been considered that an orderly distribution is undertaken in
which occupants can head towards either O1 or O2 indistinctively. When groups have been
formed, however, these groups are maintained and the entire cluster heads to one or the other
destination. This situation takes place above all in the evacuation of hotels as it is obvious to
consider that the family group is maintained. A similar situation occurs in groups made up of
schoolchildren and has even been observed in exhibition halls in any nature of groups. It can
be seen in Figure 21 that occupants remain in groups in their respective destinations DS1 and
DS2. It is logical to assume that this process observed in non-severe situations would be
maintained in emergency situations. Pressure is lower than in confluences.
5.2. Dynamic network in a branch
Figure 22 gives a representation using a dynamic network. What can be seen on the left of the
graph is the static network outline and in the centre are the values characterizing evacuation
-853-

Journal of Industrial Engineering and Management – http://dx.doi.org/10.3926/jiem.635
development in the dynamic network. kj(i) gives area occupancy j at the end of period i, xj-j´(i)
the number of people who move from j to j´ in period i, yj-j´(i) gives the number of people who
arrive at node j´ after leaving j during period i, and finally q j(i) gives the number of people
held up in area j at the end of period i.
By analyzing flows, what can be seen in the first period is how xO-A(1) people leave source node
O and how a flow of people leave O in this period xO-A(2) and a flow of xO-A(1) people from the
previous period. This gives rise to yO-A(2) arrivals in the period and generates flows xA-DS1(2)
and xA-DS2(2). The process continues while occupants remain in the origin areas of evacuation.
Likewise, what can also be seen are occupancies of the four areas O, A, DS1 and DS2 period-
on-period, recording jams in area A.
Figure 22. Values of a simple branch dynamic network
5.3. Mathematical relationships describing movement in a branch
Flows, occupancies and jams are given by values presented in Figure 23. The route, therefore,
from source node O to the centre of the branch is given by lO-A, where the route to each
destination is lA-DS1 and lA-DS2 respectively. Personal characteristics of the occupants and physical
conditions of movement determine the average speed reached along each route. Path capacity
is given by minimum effective widths wj-j´, where path width giving access to the branch is wO-A
and widths giving access to destinations is wO-A, respectively.
The modelling of branches is complex as personal characteristics and branch configuration are
taken into account. It is a contrasted fact that in emergency situations occupants tend to use
evacuation routes they are familiar with. Their familiarity with the building is therefore
decisive. The most significant physical aspects are signage, lighting conditions and alarm
system characteristics. Given the complexity and number of factors, the modelling of
evacuation using flow networks with branches must be experimented in order to gain
approximations which enable the most plausible forecasts possible.
-854-

Journal of Industrial Engineering and Management – http://dx.doi.org/10.3926/jiem.635
Figure 23. Values of a simple branch dynamic network
The exit flow from source node xO-A(i) will be the highest possible at all times.
{ }O A A O Ax (i) Min q (i 1) ;c (i)− −= − (17)
At the branch exit, the relation of flows is assumed proportional to their widths. This operates
correctly when the occupants are familiar with the area and thus find one or the other exit
indistinctive. Function ΦR is taken following trials.
[ ]{ }A DSj A DSj A O A O Ax (i) Min q (i 1) y (i 1) ; c (i)− − − −= φ − + −
A DSj A DSj A TOTAL(w ) / w− −φ =
A DSjj
1−∀
φ =∑(18)
When groups have been formed, the process is similar to that in a simple branch. The
proportionality function ΦA–DSj takes the values 0 or 1 to establish distribution of occupants
heading towards DS1 or DS2.
5.4. Numerical application of the branch study
Figure 24 shows flows, occupancies and jams period-on-period corresponding to the
evacuation of an area occupied by 200 people with a path capacity of 15 people per period to
the branch area and from the branch to each destination of 8 and 5 people per period
respectively, with flow capacities of one period being in the three arcs.
As in previous examples, the network values have been arranged in a table (Figure 25) in
order to enable result analysis. What can be seen is how source node O1 remains occupied
until period 14, in which the last 5 occupants are evacuated. Likewise, what can also be seen is
that the branch node remains occupied until period 17, in which 3 people head towards
-855-

Journal of Industrial Engineering and Management – http://dx.doi.org/10.3926/jiem.635
destination DS1 and 2 towards destination DS2. At the end, 123 people can be found in
destination DS1 and 77 in destination DS2.
Figure 24. Example of a branch
In the same way as occupancies are analyzed, flows can also be observed. In the first period,
15 people can be seen to move from source node O1 until branch A, a further 15 people leave
node O1 in the second period, 8 people head towards DS1 and 5 towards DS2, etc. Flows can
thus be observed period-on-period and jams can also be seen in a similar way; 2 people are
held up in the second period, 4 in the third, 6 in the fourth and so on therefore reaching a
maximum value of 26 in period 14.
Figure 25. Example of branch result table
-856-
Journal of Industrial Engineering and Management – http://dx.doi.org/10.3926/jiem.635
6. Conclusions
A proposal is put forward in this paper for the resolution of building evacuation problems using
dynamic flow networks within deterministic surroundings. It shows that when operating
rigorously an excellent model is achieved. Dynamic flow networks are a powerful tool which
enable a precise and complete formalization of the building evacuation problem and which give
satisfactory results, as seen in the proposed examples. Although the numerical problem
acquires a different value, the solution in buildings of big dimensions has exactly the same
detail, consistency and precision as those presented in this paper.
Among the most relevant contributions is the way in which the representation of the building
using a flow network is carried out. The nodes are situated strategically in order to achieve
optimal modeling, thus, for instance, a passageway is represented using a node and an arc.
The node is situated at the end of the passage in the direction of movement while the arc
represents movement between it and the previous node. A direct relationship between
architectural factors and the network it represents is achieved enabling the given results to
have a physical sense with an immediate interpretation. When this proposal is applied to
circulation routes, confluences and branches, it improves classical networks which situate
nodes in the centre of areas and the arcs are also limited to showing passage between one
another.
Another significant contribution has been the consideration of behavioral aspects. Although
various microscopic models consider individual behavior, there is a lack of knowledge of
behaviors such as group formation, differences in movement speeds, and confluence and
branch behaviors in macroscopic models. This is considered to be of great interest due to the
difficulty in the study of problems in buildings with a large number of occupants. This paper
studies behavioral aspects using dynamic network flows.
Finally, mathematical expressions have been adapted from classical networks to the modeling
proposed in this paper and also to the inclusion of behavioral aspects of the individuals
subjected to the evacuation process.
References
Baumann, N., & Skutella, M. (2009). Solving evacuation problems efficiently: Earliest arrival
flows with multiple sources. Mathematics of Operations Research, 34, 499-512.
http://dx.doi.org/10.1287/moor.1090.0382
Berlin, G.N., (1980). A network analysis of building egress system. ORSA/TIMS meeting
Washington.
Blue, J.V., & Adler, J.L. (2000). Cellular automata microsimulation of bi- directional pedestrian
flows. J. Trans. Research Board, 1678, 135-141. http://dx.doi.org/10.3141/1678-17
Bryan, J.L. (1983). A Review of the Examination and Analysis of the Dynamics of Human
Behavior in the Fire at the MGM Grand Hotel, Clark Country, Nevada, as Determined from a
-857-
Journal of Industrial Engineering and Management – http://dx.doi.org/10.3926/jiem.635
Selected Questionnaire Population. Fire safety Journal, 5, 233-240.
http://dx.doi.org/10.1016/0379-7112(83)90021-8
Chen, Ch., Li, J., & Zhang, D. (2012). Study on evacuation behaviors at a T-shaped confluence
by a force-driving cellular automata model. Physica A: Statistical Mechanics and its
Applications, 391(7).
Choi, W., Hamacher, S., & Tufekci, S. (1988). Modelling of building evacuation problems by
network flows with side constraints. European Journal of Operational Research, 35, 98-110.
http://dx.doi.org/10.1016/0377-2217(88)90382-7
EVACMOD. http://www.evacmod.net/.
Fang, Z., Zong, X., Li, Q., & Xiong, S. (2011). Hierarchical multi objective evacuation routing in
stadium using ant colony optimization approach. Journal of Transportation Geography, 19,
443-451. http://dx.doi.org/10.1016/j.jtrangeo.2010.10.001
Francis, R.L. (1981). A Uniformity principle for evacuation route allocation. Journal of Research
of National Bureau of Standards, 86, 509-513. http://dx.doi.org/10.6028/jres.086.023
Francis, R.L., Chalmet, L.G., & Saunders, P. B. (1982). Network models for building evacuation.
Management Science, 28, 86-105. http://dx.doi.org/10.1287/mnsc.28.1.86
Francis, R.L., & Kisko, T.M. (1985). EVACNET+: A Computer program to determine Optimal
building evacuation plans. Fire Safety Journal, 9, 211-220. http://dx.doi.org/10.1016/0379-
7112(85)90009-8
Frantzich, H., & Benthorn, L. (1999). Managing evacuating people from facilities during a fire
emergency. Facilities, 17(9), 325-330.
Fruins, J.J. (1971-1987). Pedestrian planning and design. Elevator World. Library of Congress
Catalog, number 70-159312.
Fukui, M., Ishibashi, Y. (1999). Jamming transition in cellular automaton models for pedestrian
on passageway. J. Phys Soc, 68: 3738. http://dx.doi.org/10.1143/JPSJ.68.3738
Hamacher, H.W., & Tjandra, S.A. (2001). Mathematical Modelling of Evacuation Problems: A
State of Art. Reports of the ITWM, 24.
Helbing, D., & Molnar, P. (1995). Social force model for pedestrian dynamics. Physical Review
E, 4282-4286. http://dx.doi.org/10.1103/PhysRevE.51.4282
Henderson, L.F. (1974). On the fluid mechanics of human crowd motion. Transportation
Research, 8, 509-515. http://dx.doi.org/10.1016/0041-1647(74)90027-6
Hope, B., & Tardos, E. (1994). Polynomial time algorithms for some evacuations problems.
Proceedings of the Fifth Annual SIAM Symposium on Discrete Algorithms, 433-441.
Galea, E.R., Sharp, G., & Lawrence, P.J. (2008). Investigating the Representation of Merging
Behavior at the Floor-Stair Interface in Computer Simulation of Multi-Floor Building
-858-

Journal of Industrial Engineering and Management – http://dx.doi.org/10.3926/jiem.635
Evacuation. Journal of Fire Protection Engineering, 18, 291-316.
http://dx.doi.org/10.1177/1042391508095092
Gwyne, S. (2009). Safety in numbers. How human being react to fire. Magazine Significance,
March, 14-19.
Kamiyama, N., Katoh, N., & Atsushi, T. (2008). An efficient algorithm for the evacuation
problem in certain class of networks with uniform path-lengths. Discrete Applied
Mathematics.
Kholshenikov, V.V., Shields, T.H., Boyce, K.E., & Samoshin, D.A. (2009). Recent developments
in pedestrian flow theory and Research in Russia. Fire Safety Journal, 43, 108-118.
http://dx.doi.org/10.1016/j.firesaf.2007.05.005
Köster, G., Seitz, M., Treml, F., Hartmann, D., & Klein, W. (2011). On modeling the influence of
group formations in a crowd. Contemporary Social Science, 6(3), 397-414.
http://dx.doi.org/10.1080/21582041.2011.619867
Nelson, H.E., & McLennan, H.A. (1996). Emergency Movement. The SFPE Handbook of Fire
Protection Engineering, 3286-3295.
Pauls, J.L. (1984). The movement of people in buildings and design solutions for means of
egress. Fire Technology, 20(1). http://dx.doi.org/10.1007/BF02390046
Predtechenskii, W.M., & Milinskii, A.I. (1969-1978). Planning for foot traffic flow in buildings.
Amerind Publishing Co. New Delhi., National Bureau of Standards, U.S. Dep. Commerce,
PB-294 993-T.
Tjandra, S.A., & Hamacher, H.W. (2003). Dynamic Network Optimization with Application to
the Evacuation Problems. PhD thesis, Technische Universität Kaiserslautern, Germany.
Weidmann, U., & Buchmueller, S. (2007). Parameters of pedestrians, pedestrian traffic, and
walking facilities. Swiss Federal Institute of Technology - Institute for Transport Planning and
Systems, Zurich.
Journal of Industrial Engineering and Management, 2013 (www.jiem.org)
Article's contents are provided on a Attribution-Non Commercial 3.0 Creative commons license. Readers are allowed to copy, distribute
and communicate article's contents, provided the author's and Journal of Industrial Engineering and Management's names are included.
It must not be used for commercial purposes. To see the complete license contents, please visit
http://creativecommons.org/licenses/by-nc/3.0/.
-859-