Embed Size (px)
Citation preview

2012
Building for the long term

22012 AT A GLANCE
6MESSAGE FROM THE CHAIRMAN
8MESSAGE FROM THE PRESIDENT AND CHIEF EXECUTIVE OFFICER
11OUR CLIENTS, THE DEPOSITORS
17MANAGEMENT REPORT
18 Macroeconomic Environment23 Portfolio Offering27 Analysis of Overall Performance29 Analysis of Performance by Asset Class41 Changes in Assets43 Risk Management56 Compliance
59CONTRIBUTION TO QUÉBEC’S ECONOMIC DEVELOPMENT
63 The Caisse’s Achievements in Québec
75RESPONSIBLE INVESTMENT
76 Responsible Investment Report83 Sustainable Development Report
89REPORTS OF THE BOARD OF DIRECTORS AND BOARD COMMITTEES
117BOARD OF DIRECTORS AND EXECUTIVE COMMITTEE
118 Organizational Structure 120 Board of Directors122 Executive Committee
125FINANCIAL REPORT
131COMBINED FINANCIAL STATEMENTS

Building for the long term
In 2012, our organization rallied to define the strategies and tools that will be needed for the new realities of the global economy in the years to come.
These initiatives were carried out with a long-term view and their implementation will enable the Caisse to continue to best serve its clients, the depositors, and to contribute to the growth of Québec’s economy.
CAISSE DE DÉPÔT ET PLACEMENT DU QUÉBEC AR 2012 1

CAISSE DE DÉPÔT ET PLACEMENT DU QUÉBEC AR 2012 2
2012 at a glance
$176.2 B
As a result of net investment results of $14.9 B and net deposits of $2.3 B.
$17.2 B INCREASE IN NET ASSETS
10.7% 10.7% ANNUALIZED RETURN
Since the restructuring of the portfolios in July 2009.
SPECIALIZED PORTFOLIOS POSTED POSITIVE RESULTS
1515 out of out of 1616CAISSE OVERALL RETURN IN 2012
9.6%
CHANGES IN CAISSE NET ASSETS FROM 2007 TO 2012(in billions of dollars)
155.4
120.1
131.6
176.2
2007 2008 2009 2010 2011 2012
180
170
160
150
140
130
120
110
151.7
159.0
17.9¢
An expense ratio that places the Caisse among the leaders in its category.
PER $100 OF AVERAGE NET ASSETS
$50.7 B$50.7 BNET INVESTMENT RESULTS
Since the restructuring of the portfolios in July 2009.DBRS, Moody’s and Standard
& Poor’s once again affirmed the highest credit ratings – with a stable outlook – for the Caisse and CDP Financial.
AAAHIGHEST CREDIT RATINGS AFFIRMED
9.2% annualized return for the four-year period ended December 31, 2012.
CAISSE DE DÉPÔT ET PLACEMENT DU QUÉBEC AR 2012 3
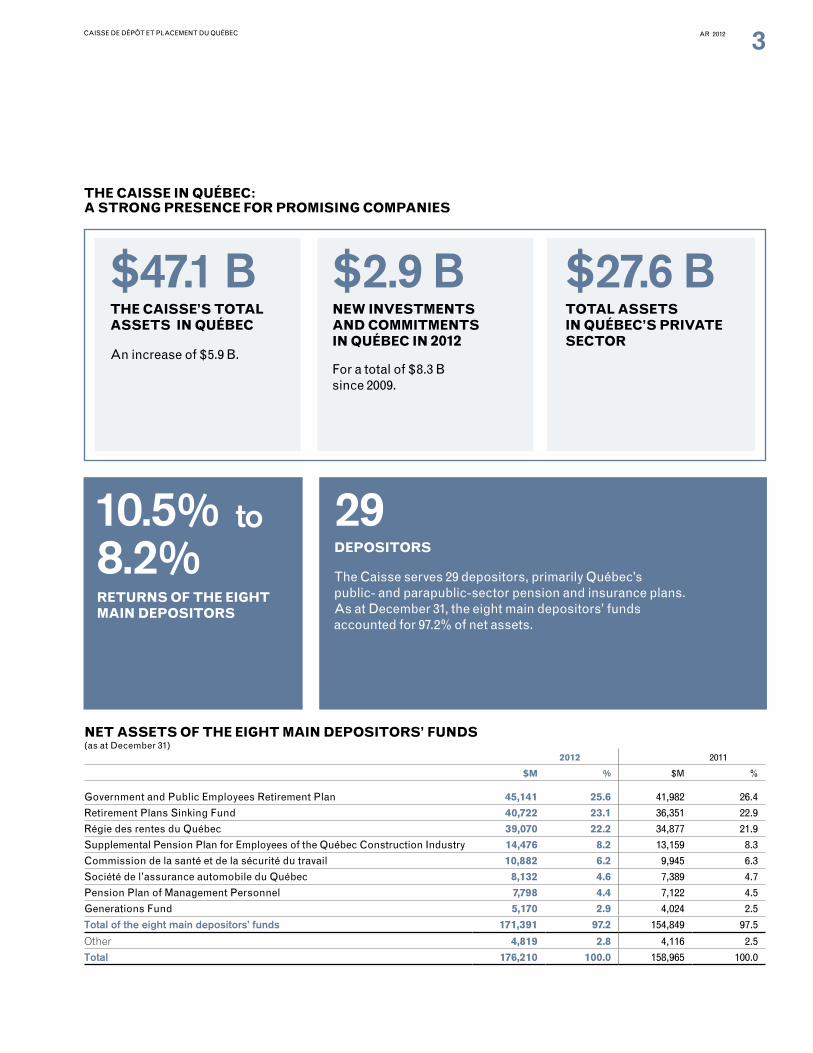
THE CAISSE IN QUÉBEC: A STRONG PRESENCE FOR PROMISING COMPANIES
8.2%RETURNS OF THE EIGHT MAIN DEPOSITORS
$47.1 B$47.1 B $2.9 B$2.9 BAn increase of $5.9 B.
For a total of $8.3 B since 2009.
$27.6 B$27.6 BTOTAL ASSETS IN QUÉBEC’S PRIVATE SECTOR
THE CAISSE’S TOTAL ASSETS IN QUÉBEC
NEW INVESTMENTS AND COMMITMENTS IN QUÉBEC IN 2012
NET ASSETS OF THE EIGHT MAIN DEPOSITORS’ FUNDS(as at December 31)
2012 2011
$M % $M %
Government and Public Employees Retirement Plan 45,141 25.6 41,982 26.4
Retirement Plans Sinking Fund 40,722 23.1 36,351 22.9
Régie des rentes du Québec 39,070 22.2 34,877 21.9
Supplemental Pension Plan for Employees of the Québec Construction Industry 14,476 8.2 13,159 8.3
Commission de la santé et de la sécurité du travail 10,882 6.2 9,945 6.3
Société de l’assurance automobile du Québec 8,132 4.6 7,389 4.7
Pension Plan of Management Personnel 7,798 4.4 7,122 4.5
Generations Fund 5,170 2.9 4,024 2.5
Total of the eight main depositors’ funds 171,391 97.2 154,849 97.5
Other 4,819 2.8 4,116 2.5
Total 176,210 100.0 158,965 100.0
29DEPOSITORS
The Caisse serves 29 depositors, primarily Québec’s public- and parapublic-sector pension and insurance plans. As at December 31, the eight main depositors’ funds accounted for 97.2% of net assets.
10.5% to

CAISSE DE DÉPÔT ET PLACEMENT DU QUÉBEC AR 2012 4

CAISSE DE DÉPÔT ET PLACEMENT DU QUÉBEC AR 2012 5
Messages from the Chairman and from the President and Chief Executive Officer

CAISSE DE DÉPÔT ET PLACEMENT DU QUÉBEC AR 2012 6
The current year was one of achievement, as the Caisse continued to reposition itself. The Board of Directors is pleased to note that the strategic orientations defined in co-operation with the depositors is taking shape and that major changes are in progress.
The solid tools and measures now in place will allow the Caisse to act on investment opportunities in promising sectors, in Québec and elsewhere in the world. The year’s results bear witness to the relevance of this strategy and everyone’s commitment to it. The Board is pleased with this progress and recognizes the scope of the changes implemented.
New iNvestmeNt strategies
During the year, the Board ratified several initiatives that will enable the Caisse to apply new investment strategies designed to capitalize on structural changes in the global economy. The new Global Quality Equity portfolio is a case in point. The portfolio is based on in-depth analysis of businesses, independent of market indexes. As well, the Private Equity team received a mandate to invest in publicly traded companies by building long-term relationships.
In an equally disciplined and strategic manner, the Caisse invested in tangible assets with intrinsic value, taking advantage of the depositors’ long-term horizon. It also increased its invest-ments in such sectors as real estate, infrastructure and energy, while broadening its expertise and knowledge with highly qualified employees.
CoNstaNt, diversified support for QuébeC’s eCoNomiC developmeNt
In line with its mission, and after rigorous analysis, the Caisse continued its various initiatives to help Québec businesses achieve their full potential with growth projects at home and abroad. Its actions took many forms, including:
• investments in the form of loans or equity stakes in many Québec companies;
• support for well-managed small and medium-sized businesses throughout Québec, in partnership with Desjardins Group;
• support for well-established Québec companies that want to expand or to step up their presence internationally, including CGI, GENIVAR and Innergex Renewable Energy;
• the Sodemex Fund, through which the Caisse invests in several small-cap mining companies established in Québec;
• the Teralys Capital Fund, a private venture capital fund that enables Québec’s technology companies to accelerate their growth; and
• the launch, in co-operation with several partners, of Prêt à entreprendre, an initiative to encourage a new wave of Québec entrepreneurs.
The Caisse’s assets in Québec increased by $5.9 billion, reaching $47.1 billion as at December 31, 2012. The Board endorses these initiatives, which yield positive results and benefit Québec as a whole.
Message from the Chairman of the Board

CAISSE DE DÉPÔT ET PLACEMENT DU QUÉBEC AR 2012 7
oNgoiNg improvemeNt of busiNess proCesses
The Board also noted the continuing progress made to reinforce the management support functions, an initiative begun in 2011. It is especially satisfied with improvements in information technology, human resources and financial control, as well as monitoring of major investments, a key aspect of risk management. In this way, the Caisse has put in place rigorous measures to simplify its business processes and gain an edge in decision-making and execution. The Board also salutes employees for their utmost dedication in carrying out these initiatives.
I would also like to acknowledge my colleagues on the Board of Directors and the remarkable work they did in providing counsel to the Caisse as it implemented its strategic orien-tations during the year.
I also want to thank Claudette Carbonneau and Pierre Fitzgibbon, who left the Board in 2012 after years of dedicated service. Their equally seasoned replacements are Rita Dionne-Marsolais, Jean La Couture and Gilles Godbout. In addition, André Legault succeeded Jocelyne Dagenais as a non-independent director and as President and Chief Executive Officer of the Commission administrative des régimes de retraite et d’assurances (CARRA). I extend a most cordial welcome to these new Board members.
Finally, the progress made during the year would not have been possible without the vision and inspiration of our President and Chief Executive Officer, Michael Sabia, who rallied the support of the Caisse’s most important asset – its employees.
RobeRt tessieRChairman of the Board

CAISSE DE DÉPÔT ET PLACEMENT DU QUÉBEC AR 2012 8
In my mind, 2012 is not important in and of itself. The year is important because it is part of a series of years. A period during which we have repositioned la Caisse so that we achieve our mission in a world that is very different than the one of even five or six years ago. A few themes come to mind.
balance. The new balance that we have struck between returns and risk. The simple but important idea of under-standing thoroughly the assets that we invest in. To have the right tools and to master risks so that we can take the decisions needed to meet the expectations of our clients, our depositors.
Performance. The performance that we have delivered in a volatile and turbulent environment, thanks to an overall portfolio that is today better aligned with the world economy. Since we restruc-tured our portfolios in 2009, our average annual returns: 10.7%. Proceeds from our investment activities: $50.7B. Which bring our assets to $176.2B.
Flexibility. The flexibility that we have built, which gives us the agility we need to seize the interesting investment opportunities that are available in today’s world – always with the goal of producing long-term returns for our depositors. This same flexibility is now permitting us to put in place new investment strategies to take advantage of changes in the structure of the world economy – once again, to the benefit of our depositors and Québec’s businesses.
Québec. Where we have significantly increased our investments, always prioritizing promising businesses and always with an eye to their development and expansion. In terms of numbers, over the last four years, we have undertaken $8.3B of new investments and investment commitments.
Beyond all of that, in my judgment, nothing demonstrates profound change better than when a group of people change how they think about themselves and the work they do. That’s what happened at la Caisse in 2012. And collectively, that’s the thing that we are most proud of.
a broad CollaboratioN
We posed this question to our people: given the importance of the changes that are under way in the economic and financial environment, what are the guiding principles for our work in such a world?
Through a series of meetings over a period of many months, in small groups, large groups, in workshops and online, our people thought about and debated which convictions and which behaviours would best serve la Caisse.
Message from the Presidentand Chief Executive Officer

CAISSE DE DÉPÔT ET PLACEMENT DU QUÉBEC AR 2012 9
Michael sabiaPresident and Chief Executive Officer
Several hundred of our employees participated actively in this broad collaboration. The result is not a directive from top management. It is not a “little red book.”
It’s the affirmation of what our people are, of how they define themselves, and of what they aspire to be.
In my view, it is in the simplicity, the humility and yet the ambition that flow from these ideas that should give Québecers confidence in the future of la Caisse.
a builder for the loNg term iN QuébeC aNd iN the world
our convictions
• Solidly anchored in Québec, we invest in high quality businesses and projects.
• We understand deeply the assets and markets in which we invest.
• Along with our partners, we play an influential role in the world’s markets.
• Our performance is the result of our investment expertise and our operational know-how.
• The confidence that our clients have in us is the product of the quality of our service and the quality of our returns.
our behaviours
• To learn and to understand, we listen with respect.
• We always act with humility, judgment and integrity.
• We take pride in contributing to the success of our colleagues and to the success of la Caisse.
• We participate in debates with openness and frankness.
• We work together, always sharing knowledge.
• We act on our convictions.

CAISSE DE DÉPÔT ET PLACEMENT DU QUÉBEC AR 2012 10
Depth of expertise and processes
deepeN the uNderstaNdiNg of assets aNd seCtors
•• Emphasize in-house portfolio managementEmphasize in-house portfolio management
•• Develop multidisciplinary researchDevelop multidisciplinary research
•• Strengthen operational and sector expertiseStrengthen operational and sector expertise
•• Continue to integrate risk management and investment decisionsContinue to integrate risk management and investment decisions
simplifY approaChes
•• Improve systems and processes to achieve greater operational efficiencyImprove systems and processes to achieve greater operational efficiency
Québec
Absolute-return management
iNvest iN the marKet we KNow best
•• Seek out and seize the best business and investment opportunitiesSeek out and seize the best business and investment opportunities
•• Serve as a bridge between Québec companies and global marketsServe as a bridge between Québec companies and global markets
•• Strengthen the next generation of entrepreneurial and financial leadershipStrengthen the next generation of entrepreneurial and financial leadership
foCus oN QualitY
•• Invest on the basis of strong convictions rather than Invest on the basis of strong convictions rather than major stock-market indexesmajor stock-market indexes
•• Select high-quality companiesSelect high-quality companies
•• Foster long-term relationships with promising companiesFoster long-term relationships with promising companies
Emerging markets
Less-liquid assets
CapitaliZe oN growth iN these marKets
•• Understand emerging markets better by drawing on the expertise Understand emerging markets better by drawing on the expertise of local partners with in-depth understanding of themof local partners with in-depth understanding of them
•• Increase direct and indirect investments in these regionsIncrease direct and indirect investments in these regions
target taNgible assets
•• Invest in assets whose value is directly linked to the real economyInvest in assets whose value is directly linked to the real economy
•• Increase investments in private equity, infrastructure and real estateIncrease investments in private equity, infrastructure and real estate
ouR FoRwaRd-looking PRioRitiesouR FoRwaRd-looking PRioRities
CAISSE DE DÉPÔT ET PLACEMENT DU QUÉBEC AR 2012 11
Our Clients, the Depositors

CAISSE DE DÉPÔT ET PLACEMENT DU QUÉBEC AR 2012 12
CONSTRUCTIVE COLLABORATIONCONSTRUCTIVE COLLABORATIONIn 2012, the Caisse substantially stepped up the consultations and discussions it held with depositors to review its strategic orientations, investment strategy and portfolio offering. Such collaboration with clients contributes to its goal of meeting their needs more effectively in a changing environment.
Our Clients, the Depositors
SERVICES THAT ANTICIPATE FUTURE CHALLENGES
In 2012, after a review of its strategic orientations, the Caisse established a new investment strategy aimed at generating depositors’ target returns in the years to come. The new aspects of this strategy can be broken down into four components:
• Emphasize absolute-return management to invest in the best publicly traded companies.
• Increase investments in the less-liquid asset classes: private equity, infrastructure and real estate.
• Invest in Québec to generate returns and contribute to its economic development.
• Capitalize on the growth of emerging markets.
To ensure the strategy can be deployed in an evolving economic and financial environment, the Caisse considered introducing changes to the portfolios offered to depositors, most notably by:
• refocusing the Hedge Fund portfolio;
• creating the Global Quality Equity portfolio and adding a relationship-investing mandate, focused on developing long-term relationships with promising companies, to the Private Equity portfolio;
• closing out the Global Equity portfolio; and
• gradually shifting the Emerging Markets Equity portfolio from index management to active management.
The Caisse also reviewed its strategic asset allocation and examined the following scenarios:
• an increase in the weight of less-liquid assets;
• an increase in direct and indirect investments in emerging markets; and
• a decrease in the weight of fixed-income securities.
The Caisse’s advisory services teams presented these scenarios to the depositors and reviewed with them the impacts of such changes on their investment policy.
01 01 Net investment results of Net investment results of $14.9 billion and net deposits $14.9 billion and net deposits
of $2.3 billion brought depositors’ of $2.3 billion brought depositors’ net assets to $176.2 billion as at net assets to $176.2 billion as at December 31, 2012. These amounts December 31, 2012. These amounts take into account the arrival of four take into account the arrival of four new depositors in 2012, bringing the new depositors in 2012, bringing the total to 29. total to 29.
02 02 In 2012, the Caisse made In 2012, the Caisse made changes to its portfolio changes to its portfolio
offering to facilitate the implemenoffering to facilitate the implemen--tation of the new aspects of its tation of the new aspects of its investment strategy in the years to investment strategy in the years to come and to meet depositors’ needs come and to meet depositors’ needs more effectively.more effectively.
03 03 All the large depositors chose All the large depositors chose to revise their investment to revise their investment
policies so as to optimize their asset policies so as to optimize their asset allocation as a function of the new allocation as a function of the new features of the portfolio offering.features of the portfolio offering.
HIGHLIGHTSHIGHLIGHTS

CAISSE DE DÉPÔT ET PLACEMENT DU QUÉBEC AR 2012 13
SUSTAINED CONSULTATIONS AND DISCUSSIONS WITH DEPOSITORS
The service offering was revised over several months as part of a series of consultations and discussions with the depositors. The Strategic Asset Allocation Expertise Group, which comprises experts from the Caisse and the depositors, played an active advisory role in the process.
The Caisse’s strategic orientations and the changes resulting from their implementation were central to the discussions at three forums that brought together members of the Caisse’s senior management and senior officials of the main depositors. In addition, representatives for the depositors had the oppor-tunity to speak with Caisse executives and portfolio managers during three seminars on the economic outlook, asset allocation and the portfolio offering.
More specifically, changes to the investment policy of the Hedge Fund portfolio, and their implementation beginning in July 2012, were discussed and agreed to with the depositors concerned. Furthermore, the Global Quality Equity portfolio and the relationship-investing mandate as part of the Private Equity portfolio were presented to all depositors at an information session in the fall of 2012. In this context, 19 of the 29 depositors amended their investment policies to reflect the new changes, which took effect on January 1, 2013.
The Caisse also met with the depositors in the fall of 2012 to propose that they make a strategic shift by significantly increasing the weight of less-liquid assets in their benchmark portfolios. Some of them chose to amend their investment policies as a result, and others began to work on such amendments.
Finally, the various changes associated with the closing-out of the Global Equity portfolio, as a result of the creation of the Global Quality Equity portfolio, were discussed with the depositors beginning in the fall of 2012 and continued into the first quarter of 2013.
ENHANCED COMMUNICATION ACTIVITIES AND TOOLS
Other initiatives rounded out the array of communication activities and tools offered to the depositors in 2012. For example, at luncheon conferences, employees had the oppor-tunity to meet with representatives of the Régie des rentes du Québec and the Commission de la construction du Québec to discuss the challenges they face and their expectations of the Caisse.
Finally, the Caisse carried out its reporting to the depositors in a spirit of continued improvement. For example, it improved its periodic reports with:
• the creation of a section on the monitoring of depositors’ liquidity risk in the semi-annual newsletter on risk;
• the addition of a section on interest rate overlay mecha-nisms in the document on asset classes, produced by the investment policy advisory team; and
• the development of interest rate monitoring mechanisms and their integration into the monthly reports to depositors to facilitate duration management of certain funds.
CAISSE DE DÉPÔT ET PLACEMENT DU QUÉBEC AR 2012 14
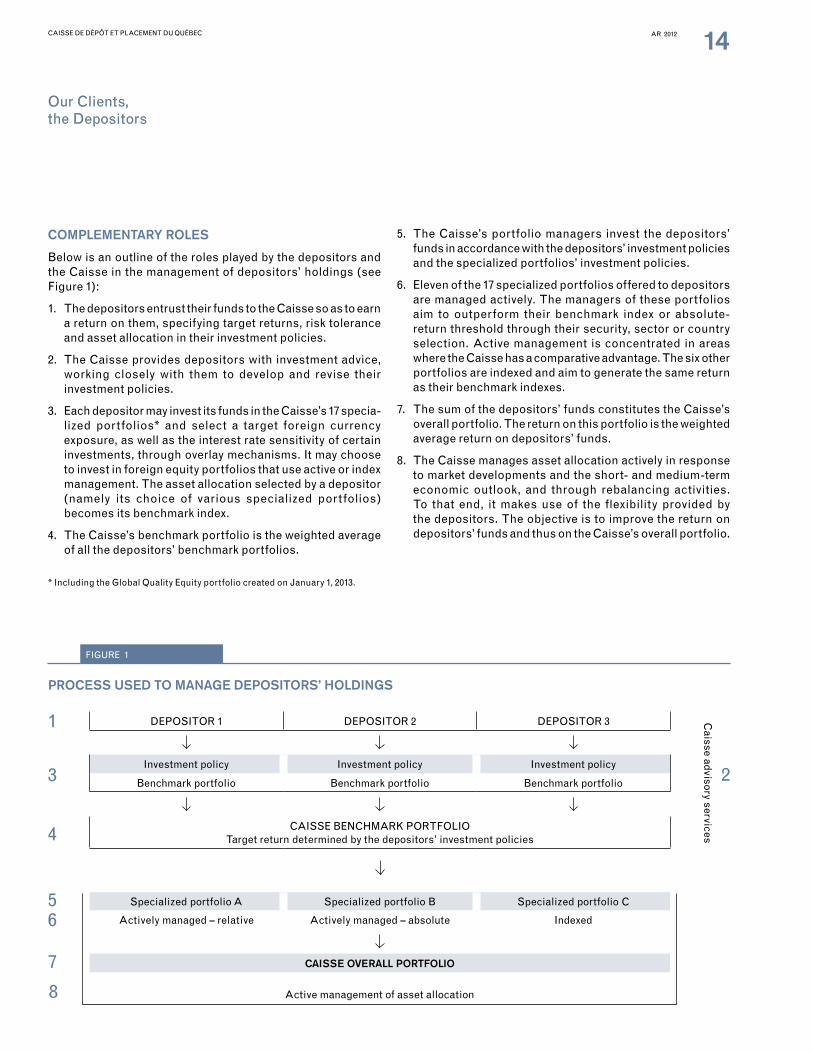
COMPLEMENTARY ROLES
Below is an outline of the roles played by the depositors and the Caisse in the management of depositors’ holdings (see Figure 1):
1. The depositors entrust their funds to the Caisse so as to earn a return on them, specifying target returns, risk tolerance and asset allocation in their investment policies.
2. The Caisse provides depositors with investment advice, working closely with them to develop and revise their investment policies.
3. Each depositor may invest its funds in the Caisse’s 17 specia-lized portfolios* and select a target foreign currency exposure, as well as the interest rate sensitivity of certain investments, through overlay mechanisms. It may choose to invest in foreign equity portfolios that use active or index management. The asset allocation selected by a depositor (namely its choice of various specialized portfolios) becomes its benchmark index.
4. The Caisse’s benchmark portfolio is the weighted average of all the depositors’ benchmark portfolios.
5. The Caisse’s portfolio managers invest the depositors’ funds in accordance with the depositors’ investment policies and the specialized portfolios’ investment policies.
6. Eleven of the 17 specialized portfolios offered to depositors are managed actively. The managers of these portfolios aim to outperform their benchmark index or absolute-return threshold through their security, sector or country selection. Active management is concentrated in areas where the Caisse has a comparative advantage. The six other portfolios are indexed and aim to generate the same return as their benchmark indexes.
7. The sum of the depositors’ funds constitutes the Caisse’s overall portfolio. The return on this portfolio is the weighted average return on depositors’ funds.
8. The Caisse manages asset allocation actively in response to market developments and the short- and medium-term economic outlook, and through rebalancing activities. To that end, it makes use of the flexibility provided by the depositors. The objective is to improve the return on depositors’ funds and thus on the Caisse’s overall portfolio.
Our Clients, Our Clients, the Depositorsthe Depositors
* Including the Global Quality Equity portfolio created on January 1, 2013.
Caisse advisory services
Active management of asset allocation
PROCESS USED TO MANAGE DEPOSITORS’ HOLDINGS
DEPOSITOR 1 DEPOSITOR 2 DEPOSITOR 3
Investment policy Investment policy Investment policy
Benchmark portfolio Benchmark portfolio Benchmark portfolio
CAISSE BENCHMARk PORTFOlIO Target return determined by the depositors’ investment policies
Specialized portfolio A Specialized portfolio B Specialized portfolio C
Actively managed – relative Actively managed – absolute Indexed
CAISSE OVERALL PORTFOLIO
1
3 2
4
5
7
6
8
FIGURE 1

CAISSE DE DÉPÔT ET PLACEMENT DU QUÉBEC AR 2012 15
THE DEPOSITORS
In 2012, the Caisse had 29 depositors, primarily Québec public- and parapublic-sector pension and insurance plans. Table 2 lists the eight main depositors’ funds, which represented 97.2% of depositors’ net assets as at December 31, 2012.
DEPOSITORS’ INDIVIDUAL RETURNS
The overall return is the weighted average return on depositors’ funds. Each depositor obtains a return that is a function of its investment policy, which determines the proportion of funds invested in each specialized portfolio. The returns obtained by the eight main depositors in 2012 ranged from 8.2% to 10.5%. For the past four years, the annualized returns for these depositors ranged from 8.9% to 9.6%.
TABlE 2
THE EIGHT MAIN DEPOSITORS’ FUNDS
Type of plan Description
11 GOvERNMENT AND PUBlIC EMPlOyEES RETIREMENT PlAN
Pension plan
The plan consists primarily of contributions by employees who work in Québec’s health and social services sector, education system and public sector. The plan is administered by the Commission administrative des régimes de retraite et d’assurances.
22 RETIREMENT PlANS SINkING FUND
Pension plan
The fund provides for payment of retirement benefits that are the responsibility of the government, according to the provisions of the retirement plans for the public and parapublic sectors. The fund is financed by the Government of Québec and administered by the Ministère des Finances et de l’Économie.
33 RÉGIE DES RENTES DU QUÉBEC
Pension planThe Régie des rentes contributes to Québecers’ income security, notably by providing for payment of a retirement pension. The plan is mandatory and the contributions are made by employees and employers.
44SUPPlEMENTAl PENSION PlAN FOR EMPlOyEES OF THE QUÉBEC CONSTRUCTION INDUSTRy
Pension planThe plan is administered by the Commission de la construction du Québec. The contributions to the plan are paid by construction industry employers and workers.
55 COMMISSION DE lA SANTÉ ET DE lA SÉCURITÉ DU TRAvAIl
Insurance planThe Commission mainly compensates workers who have had work-related accidents and contributes to their rehabilitation. It is financed by contributions from Québec employers.
66 SOCIÉTÉ DE l’ASSURANCE AUTOMOBIlE DU QUÉBEC
Insurance planThe Société compensates victims of vehicular accidents and promotes traffic safety. It is financed mainly by fees collected for driver’s licences and vehicle registration.
77 PENSION PlAN OF MANAGEMENT PERSONNEl
Pension planThe plan consists of contributions by management employees in the public and parapublic sectors. The plan is administered by the Commission administrative des régimes de retraite et d’assurances.
88 GENERATIONS FUND
Other
The Generations Fund was created in June 2006 under the Act to reduce the debt and establish the Generations Fund. The amounts accumulated in the fund are dedicated exclusively to repaying the debt. The fund is administered by the Ministère des Finances et de l’Économie.

CAISSE DE DÉPÔT ET PLACEMENT DU QUÉBEC AR 2012 16
The following table presents a comparison of depositors’ net assets as at December 31, 2011, and as at December 31, 2012.
THE CAISSE’S 29 DEPOSITORS(fair value as at December 31 – in millions of dollars)
Depositors’ net assets
First deposit
2012 2011
$ % $ %
PENSION PlANS
Régie des rentes du Québec 1966 39,070 22.2 34,877 21.9Supplemental Pension Plan for Employees
of the Québec Construction Industry 1970 14,476 8.2 13,159 8.3Government and Public Employees Retirement Plan 1973 45,141 25.6 41,982 26.4Pension Plan of Management Personnel 1973 7,798 4.4 7,122 4.5Individual Plans 1977 190 0.1 178 0.1Pension Plan of Elected Municipal Officers 1989 173 0.1 159 0.1Régime complémentaire de rentes des techniciens ambulanciers/
paramédics et des services préhospitaliers d’urgence 1990 340 0.2 301 0.2Ministère des Finances et de l’Économie, Government of Québec1
Retirement Plans Sinking Fund 1994 40,722 23.1 36,351 22.9 Superannuation Plan for the Members of the Sûreté du Québec –
caisse employeurs 2009 303 0.2 144 0.1Régime de retraite de l'Université du Québec 2004 253 0.2 226 0.2Régime de retraite du personnel des CPE et des garderies
privées conventionnées du Québec 2005 124 0.1 97 –Régime de retraite pour certains employés de la
Commission scolaire de la Capitale 2006 36 – 37 –Régime de rentes pour le personnel non enseignant
de la Commission des écoles catholiques de Montréal 2007 219 0.1 222 0.1Superannuation Plan for the Members of the Sûreté du Québec –
caisse participants 2007 173 0.1 130 0.1Régime de retraite des employés de la Ville de Laval 2007 114 0.1 95 –Retirement Plan for Active Members of the Centre hospitalier
Côte-des-Neiges 2010 68 – 65 –Fonds commun de placement des régimes de retraite de l'Université Laval2 2012 114 0.1 – –Fiducie globale Ville de Magog2 2012 41 – – –Régime de retraite des employées et employés de la Ville de Sherbrooke2 2012 13 – – –
INSURANCE PlANSRégie des marchés agricoles et alimentaires du Québec 1967 8 – 7 –La Financière agricole du Québec 1968 271 0.2 218 0.2Autorité des marchés financiers 1969 622 0.4 592 0.4Commission de la santé et de la sécurité du travail 1973 10,882 6.2 9,945 6.3Société de l'assurance automobile du Québec 1978 8,132 4.6 7,389 4.7Fédération des producteurs de bovins du Québec 1989 4 – 7 –Survivor’s Pension Plan 1997 361 0.2 356 0.2Conseil de gestion de l'assurance parentale 2005 3 – 2 –
OTHER DEPOSITORSOffice de la protection du consommateur 1992 87 – 75 –Société des alcools du Québec 1994 118 0.1 121 0.1Ministère des Finances et de l’Économie, Government of Québec1
Generations Fund 2007 5,170 2.9 4,024 2.5 Accumulated Sick leave Fund 2008 750 0.4 769 0.5 Fonds d’information sur le territoire 2011 352 0.2 315 0.2Agence du revenu du Québec2 2012 82 – – –Total 176,210 100.0 158,965 100.0
1. The Ministère des Finances et de l’Économie entrusts the Caisse with a total of five funds. 2. New depositor in 2012.
TABlE 3

CAISSE DE DÉPÔT ET PLACEMENT DU QUÉBEC AR 2012 17
Management Report
CAISSE DE DÉPÔT ET PLACEMENT DU QUÉBEC AR 2012 18
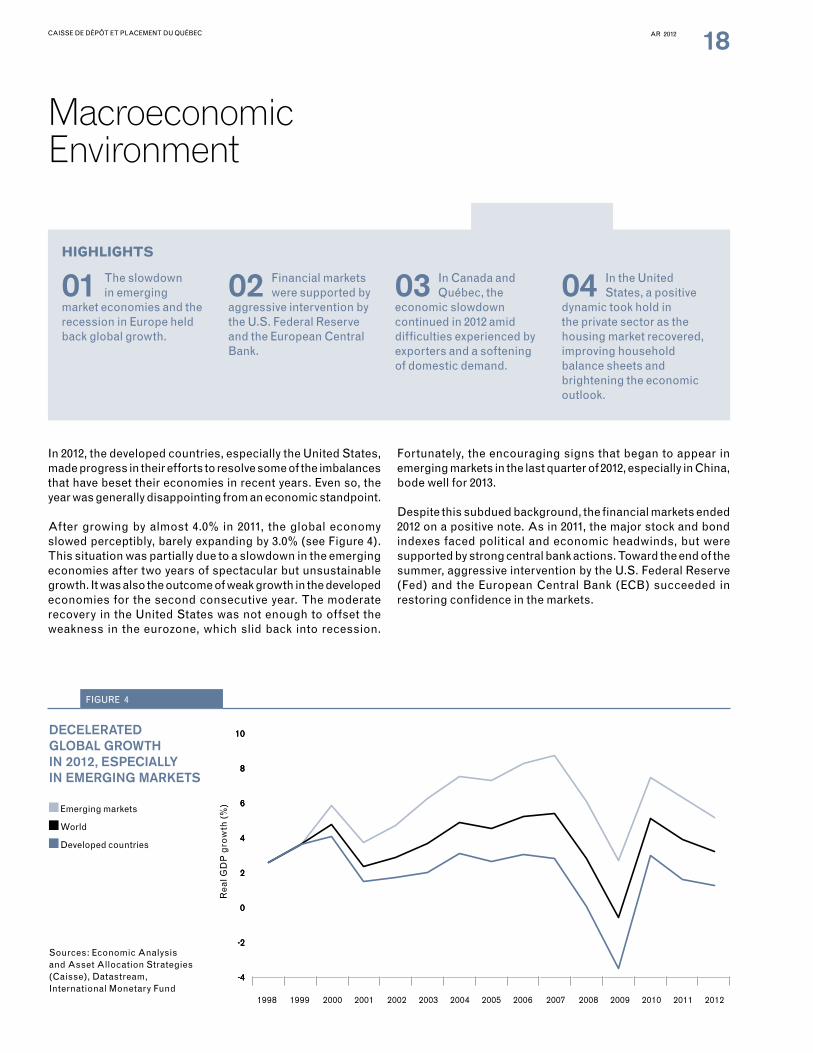
In 2012, the developed countries, especially the United States, made progress in their efforts to resolve some of the imbalances that have beset their economies in recent years. Even so, the year was generally disappointing from an economic standpoint.
After growing by almost 4.0% in 2011, the global economy slowed perceptibly, barely expanding by 3.0% (see Figure 4). This situation was partially due to a slowdown in the emerging economies after two years of spectacular but unsustainable growth. It was also the outcome of weak growth in the developed economies for the second consecutive year. The moderate recovery in the United States was not enough to offset the weakness in the eurozone, which slid back into recession.
Fortunately, the encouraging signs that began to appear in emerging markets in the last quarter of 2012, especially in China, bode well for 2013.
Despite this subdued background, the financial markets ended 2012 on a positive note. As in 2011, the major stock and bond indexes faced political and economic headwinds, but were supported by strong central bank actions. Toward the end of the summer, aggressive intervention by the U.S. Federal Reserve (Fed) and the European Central Bank (ECB) succeeded in restoring confidence in the markets.
Macroeconomic Environment
01 01 The The slowdown slowdown in emerging in emerging
market economies and the market economies and the recession in Europe held recession in Europe held back global growthback global growth..
02 02 FFinancial markets inancial markets were supported by were supported by
aggressive intervention by aggressive intervention by the U.S. Federal Reserve the U.S. Federal Reserve and the European Central and the European Central BankBank..
03 03 In In Canada and Canada and Québec, the Québec, the
economic slowdown economic slowdown continued in 2012 amid continued in 2012 amid difficulties experienced by difficulties experienced by exporters and a softening exporters and a softening of domestic demandof domestic demand. .
04 04 In In the United the United States, a positive States, a positive
dynamic took hold in dynamic took hold in the private sector as the the private sector as the housing market recovered, housing market recovered, improving household improving household balance sheets and balance sheets and brightening the economic brightening the economic outlookoutlook. .
HIGHLIGHTS HIGHLIGHTS
1998 1999 2000 2001 2002 2003 2004 2005 2006 2007 2008 2009 2010 2011 2012
-4
-2
0
2
4
6
8
10
-4
-2
0
2
4
6
8
10
-4
-2
0
2
4
6
8
10DecelerateD global growth in 2012, especially in emerging markets
Emerging markets
World
Developed countries
Sources: Economic Analysis and Asset Allocation Strategies (Caisse), Datastream, International Monetary Fund
FIGURE 4
Rea
l GD
P g
row
th (
%)

CAISSE DE DÉPÔT ET PLACEMENT DU QUÉBEC AR 2012 19
EuropeEurope found itself on the financial markets’ radar screen for a large portion of 2012. The year began well with the success of the ECB’s Long-Term Refinancing Operations. This program, announced in December 2011, injected massive amounts of liquidity into Europe’s banking system and bolstered investor confidence. But the euphoria was short-lived.
By spring, it was clear that Spain’s economy and public finances had deteriorated more seriously than previously thought. And in May the political uncertainty in Greece spiked and remained elevated until summer.
These events, combined with the high level of public debt and economic weakness in several peripheral countries, revived concerns about the viability of the single currency. They also contributed to a significant widening of the yield spreads of Spanish and Italian bonds vis-à-vis German bonds (see Figure 5).
As bond yields in the peripheral countries surged, the ECB pledged to do whatever was necessary to preserve the eurozone. In September, it unveiled its Outright Monetary Transactions program for open-ended purchases of indebted countries’ bonds on specified conditions. This announcement significantly reduced the likelihood that the eurozone would break up. This also led European government bond spreads to narrow sharply and contributed to the rally in the world’s equity markets.
The positive developments on the financial markets notwith-standing, the eurozone ended the year in the grip of a severe recession. The decline was largely attributable to consid-erable tightening of fiscal policy in the peripheral countries and the high degree of uncertainty that prevailed from late spring until early summer. In December, the eurozone’s overall unemployment rate exceeded 11.8%, its highest level since the monetary union was created. Unemployment reached more than 26.0% in Spain and almost 27.0% in Greece toward year-end.
2007 2008 2009 2010 2011 2012
1
2
3
4
5
6
7
8high volatility of spanish anD italian 10-year bonD yielDs
Italy
Spain
France
Germany
Source: Bloomberg
FIGURE 5

CAISSE DE DÉPÔT ET PLACEMENT DU QUÉBEC AR 2012 20
United StatesIn the United States, economic growth and the financial markets were affected significantly by these global developments as well as by domestic political uncertainty and the actions of the Fed. In particular, uncertainty related to the fiscal cliff1 weighed on the economy for most of the year, with negative effects becoming apparent as early as spring 2012.
This situation prompted the Fed to take an even more accom-modative monetary policy stance. Most notably, it launched two programs of open-ended asset purchases, which were conditional on improvements in the labour market: the one for mortgage-backed securities and the other for long-term treasury bonds. The economy and the financial markets responded positively to these measures.
The economy grew at an overall rate of 2.2% and non-farm business-sector productivity was up 3.1% in 2012. Even more important, households continued to repair their balance sheets and reduce their debt-to-assets ratio from a peak of 27.0% at the start of 2009 to 20.4% at the end of 2012.
As well, the housing sector entered a sustainable recovery. Housing starts increased significantly and house prices began to rise. This improvement is welcome because the real estate sector has a positive impact on household balance sheets and is a significant driver of growth. Finally, the federal government made progress, albeit modest, in improving its fiscal position: government spending fell by 1.7% in 2012, and the budget deficit as a percentage of GDP went from 8.2% at the end of 2011 to 6.7% at the end of 2012. On a quarterly basis, private domestic demand clearly took over from government spending (see Figure 6).
Macroeconomic Macroeconomic EnvironmentEnvironment
1. The fiscal cliff refers to a series of income tax increases and government spending cuts slated to take effect automatically on January 1, 2013.
2007 2008 20102009 2011 2012
-10
-8
-6
-4
-2
0
2
4
6
8
10growth of private Domestic DemanD anD government spenDing(as a percentage)
Government spending
Private domestic demand
FIGURE 6
Sources: Economic Analysis and Asset Allocation Strategies (Caisse), Global Insight

CAISSE DE DÉPÔT ET PLACEMENT DU QUÉBEC AR 2012 21
Emerging Markets Growth generally slowed in the emerging market economies during the year (see Figure 7), mainly because of internal factors, such as supply constraints and financial imbalances, but also amid weak domestic demand in the developed economies.
China’s growth slowed significantly as a result of monetary tightening implemented 12 to 18 months earlier and a substantial decrease in the government’s capital spending, which returned to a more sustainable level after the strong stimulus provided in 2009.
India’s weaker growth also flagged in 2012 amid the impact of previous interest rate increases, slow approval of new projects and timid structural reforms.
In Brazil, previous monetary tightening to counteract infla-tionary pressures resulted in a further decrease in growth, which reached only 0.9% in 2012. Brazilian policymakers adopted a series of monetary and fiscal measures to stimulate the economy, however, it became increasingly clear that growth was curtailed by weakness in the supply side of the economy.
That being said, a broad range of production and demand indicators suggests that growth accelerated in the emerging economies in the latter part of 2012 in response to stimulative policies. Governments in emerging markets have limited remaining monetary and fiscal leeway, however. Policymakers must introduce structural reforms to ensure their economies are innovative and flexible and offer strong growth potential.
CanadaThe difficult global economic environment contributed signi-ficantly to the slowing of the Canadian economy in 2012. Partially as a result of the increasing trade deficit in the first three quarters of the year, Canada’s real GDP expanded by 1.8% versus 2.6% in 2011. After a solid performance in 2010 and 2011, the growth of final domestic demand was adversely affected by tighter fiscal policy, lower non-residential private investment and the onset of a period of adjustment in the residential real estate sector in the second half of the year.
In this context, the Bank of Canada held its key rate at 1.0% all year despite its concerns about high levels of household debt. Moreover, the slowdown in emerging markets, combined with increased energy output in the United States, caused prices
2005 2006 2007 2008 2009 2010 2011 2012
-4
-2
0
2
4
6
8
10
12
14
16growth Down sharply in the main emerging markets in 2012
China
India
Brazil
FIGURE 7
Sources: Economic Analysis and Asset Allocation Strategies (Caisse), Datastream
Qu
arte
rly
GD
P g
row
th (
%)

CAISSE DE DÉPÔT ET PLACEMENT DU QUÉBEC AR 2012 22
Macroeconomic Macroeconomic EnvironmentEnvironment
to drop for many Canadian natural resource producers. As a result, the Toronto Stock Exchange underperformed the other major stock markets in 2012 (see Figure 8).
QuébecQuébec’s economy also slowed in 2012, with real GDP expanding by 1.0%. There are several reasons for this weak growth. During the year, the manufacturing sector and exports were constrained by the global slowdown and the strong Canadian dollar. The value of Québec’s exports to Europe was down by almost 9.0% in 2012 because of the recession on the Continent. The output of Québec’s manufacturing sector was down by close to 1.5%. Final domestic demand also slowed. Consumer spending fell in the first half of the year, mainly because of a drop in consumer confidence. The beginning of a period of adjustment in the residential real estate sector during the second half of 2012 also affected growth.
Despite this difficult environment, the rather favourable developments in the job market and private non-residential investments, as much in machinery and equipment (+10.4%) as in non-residential buildings (+9.3%), was nevertheless reassuring. The unemployment rate remained stable on average in 2012, compared to 2011, at a relatively low level, providing support for consumer spending.
conclUsion
The year was disappointing in some respects but ended on a more positive note. Tail risk in the eurozone appears to have been reduced considerably. The United States made substantial progress in addressing its fundamental problems, and many emerging economies showed signs of returning to vigorous growth. In this context, 2013 is looking like a year of transition toward a more robust global economy with a stronger rate of growth. But, to ensure such an outcome, in many countries, especially in the eurozone, more suitable monetary and fiscal policies will have to be implemented, and structural reforms will have to continue.
90
95
100
105
110
115
Feb.2012
March2012
April2012
May2012
June2012
July2012
Aug.2012
Sept.2012
Oct.2012
Nov.2012
Dec.2012
Jan.2012
s&p/tsX again heavily DepenDent on commoDity prices in 2012(January 1, 2012 = 100)
Weighted average spot prices of WTI (0.7) and gold (0.3)
S&P/TSX
FIGURE 8
Sources: Economic Analysis and Asset Allocation Strategies (Caisse), Bloomberg

CAISSE DE DÉPÔT ET PLACEMENT DU QUÉBEC AR 2012 23
a DiversifieD offering
The Caisse offers depositors the ability to allocate their funds to various specialized portfolios, each consisting of securities from a single asset class (see Table 9). The management approach and parameters for each portfolio are set out in an investment policy that specifies the investment universe, benchmark index, target returns and objectives for value added (for actively managed portfolios), as well as risk monitoring with clearly defined concentration and active or absolute risk limits, as applicable.
cUstomiZeD strategies
In addition to its 17 specialized portfolios, since April 1, 2010, the Caisse has offered overlay strategies that enable each depositor to establish customized exposure to foreign currencies as a function of its portfolio makeup and risk tolerance. Moreover, since January 1, 2012, depositors have also been able to adjust their exposure to the interest-rate sensitivity of some invest-ments by using overlay mechanisms. As such, the Caisse enhanced its advisory services so that it can assist depositors more effectively when they establish their investment policies and choose the appropriate hedging strategies, taking their liabilities into account.
01 01 The The Caisse manages Caisse manages a diversified portfolio a diversified portfolio
comprising 17 specialized portfolios. comprising 17 specialized portfolios. Eleven of these portfolios, Eleven of these portfolios, representing approximately 79% representing approximately 79% of net assets, are managed actively.of net assets, are managed actively.
02 02 In In 2012, the Caisse made2012, the Caisse made significantsignificant changes to its changes to its
portfolio offering. Most of them portfolio offering. Most of them will take effect in 2013.will take effect in 2013.
03 03 The The benchmark indexes benchmark indexes were changed for the were changed for the
Long Term Bond, Real Estate Long Term Bond, Real Estate Debt, Real Estate and Hedge Fund Debt, Real Estate and Hedge Fund portfolios.portfolios.
HIGHLIGHTS HIGHLIGHTS
PortfolioOffering
specialiZeD portfolio offering(as at December 31, 2012)
ACTIVELY MANAGED INDEXED OBJECTIVES
FIXED INCOME BondsReal Estate Debt
Short Term InvestmentsLong Term Bonds
Reduce the portfolio’s overall risk level
Match depositors’ assets and liabilities
INFLATION-SENSITIVE INVESTMENTS
InfrastructureReal Estate
Real Return Bonds Have exposure to markets whose investment income is indexed to inflation
Partially hedge the inflation risk associated with the liabilities of several depositors
EQUITY Canadian EquityGlobal EquityGlobal Quality Equity1
Private Equity
U.S. EquityEAFE EquityEmerging Markets Equity
Increase depositors’ long-term target returns
OTHER INVESTMENTS
Hedge FundsAsset AllocationABTN
Achieve diversification and complementarity
1. This specialized portfolio was created on January 1, 2013.
TABLE 9

CAISSE DE DÉPÔT ET PLACEMENT DU QUÉBEC AR 2012 24
PortfolioPortfolioOfferingOffering
main changes to portfolio offering
In 2012, working with the depositors, the Caisse made changes to the selection of portfolios offered to depositors to deploy the new components of its investment strategy in the years to come. The main changes include:
• Refocusing the Hedge Fund portfolio on strategies that complement the traditional asset classes, starting July 1, 2012.
• Creation of the Global Quality Equity portfolio to focus on companies with a stable, predictable return on invested capital, as of January 1, 2013.
• Addition to the Private Equity portfolio of a relationship-investing mandate geared to development of long-term relationships with promising companies, as of January 1, 2013.
• Gradual closing-out of the Global Equity portfolio, starting July 1, 2013.
• A gradual transition from indexed management to active management for the Emerging Markets Equity portfolio, starting July 1, 2013.
In addition, in November 2012, the Caisse completely closed out the Québec International portfolio, which had begun on April 1, 2010.
benchmark inDeXes
For each specialized portfolio, with the exception of the Asset Allocation portfolio and the ABTN portfolio, a benchmark index is used to compare the portfolio managers’ results with the corresponding market. The following changes were made to the portfolios’ indexes:
• On January 1, 2012, the DEX Adjusted Long Term Government Bond Index was modified to increase the weighting of the Long Term Bond portfolio in provincial bonds.
• Since January 1, 2012, the benchmark for the Real Estate Debt portfolio has been the DEX Universe Bond Index. The sale of the international component of the portfolio was completed in 2011, which justified removal of the Giliberto-Levy portion (10%) of the benchmark index.
• On July 1, 2012, the Adjusted Aon Hewitt – Real Estate Index was modified to add the DEX 30 Day T-Bill Index, to reflect the cash held by the Real Estate portfolio.
• Since July 1, 2012, the benchmark of the Hedge Funds portfolio has been in transition. When the transition period ends on July 1, 2013, the benchmark index will go from 10 strategies to three: futures management, market-neutral and global macro.
• On January 1, 2013, the index of the Private Equity portfolio was changed to reflect the portfolio’s composition more accurately. The change was due to the addition of the relationship-investing mandate and the higher proportion of direct investments in companies. The index now consists of 50% State Street Private Equity Index (Adjusted) and 50% MSCI World Hedged.
• The Global Quality Equity portfolio was created on January 1, 2013. Its index consists of 85% MSCI ACWI Unhedged and 15% DEX 91 Day T-Bill. The benchmark index is intended to reflect a traditional equity market investment, but adjusted for the level of portfolio risk.
Table 10, p. 25, gives a list of the benchmark indexes of the specialized portfolios and the changes made over the past four years.

CAISSE DE DÉPÔT ET PLACEMENT DU QUÉBEC AR 2012 25
TABLEAU 9TABLE 10
changes in benchmark inDeXes over 4 years(as at December 31, 2012)
SPECIALIzED PORTFOLIO BENCHMARk INDEX
short term investments(Created July 1, 1998)
DEX 91 Day T-Bill
bonDs (Created October 1, 1996)
DEX Universe Bond (Adjusted) since July 1, 2010. Formerly DEX Universe Bond
long term bonDs(Created April 1, 2005)
DEX Long Term Government Bond (Adjusted) since July 1, 2010. Formerly DEX Long Term Government Bond
real estate Debt(Created April 1, 1995)
DEX Universe Bond since January 1, 2012, Real Estate Debt index (index consists of 90% DEX Universe Bond and 10% of Giliberto-Levy Hedged) since January 1, 2010, to December 31, 2011. Formerly 90% of DEX Universe Bond and 10% of Barclays CMBS B Hedged
real retUrn bonDs(Created January 1, 2004)
DEX Real Return Bond
infrastrUctUre(Created July 1, 2010)
Infrastructure (index consists of a basket of infrastructure-related public securities, hedged)
real estate(Created October 1, 1985)
Aon Hewitt - Real Estate (Adjusted) since January 1, 2010. Formerly Aon-Real Estate
canaDian eqUity(Created July 1, 1995)
Canadian Equity (index consists of 90% S&P/TSX Capped and 10% Morningstar National Bank Québec Index) since March 1, 2011. Formerly S&P/TSX Capped
global eqUity(Created April 1, 2010)
MSCI ACWI Unhedged
U.s. eqUity(Created April 1, 2010)
S&P 500 Unhedged
eafe eqUity(Created April 1, 2010)
MSCI EAFE Unhedged
emerging markets eqUity(Created January 1, 1995)
MSCI EM Unhedged
private eqUity(Created July 1, 2003)
Private Equity (index consists of 70% State Street Private Equity Index Adjusted and 30% MSCI World, Hedged) effective since July 1, 2010. Formerly 60% S&P 500 Hedged and 40% MSCI EAFE Hedged
heDge fUnD(Created April 1, 2003)
Dow Jones Credit Suisse Hedge Fund Index Adjusted (Hedged)

CAISSE DE DÉPÔT ET PLACEMENT DU QUÉBEC AR 2012 26
PortfolioPortfolioOfferingOffering
benchmark portfolio
The weighted average of the asset allocations specified in the depositors’ investment policies is used to determine the compo-sition of the Caisse’s benchmark portfolio. As at December 31, 2012, the benchmark portfolio’s exposure to fixed income and equities was down slightly, and its positions in inflation-sensitive investments were up, in relation to year-end 2011 (see Table 11).
overall portfolio
In addition, as at December 31, 2012, the Caisse’s overall portfolio reflected a decrease in the weightings of the bond portfolios and inflation-sensitive investments, and an increase in the weightings of the Short Term Investment and Real Estate Debt portfolios as well as Equity, in relation to year-end 2011.
TABLE 11
composition of the benchmark portfolio anD changes in the overall portfolio (percentage of depositors’ net assets)
benchmark portfolio
as at December 31, 2012as at
December 31, 2011 overall portfolio
lower limit
%
benchmark portfolio
%
Upper limit
%
Benchmark portfolio
%
as at December 31,
2012%
as at December 31,
2011%
fixed incomeShort Term Investments 0.2 1.1 8.7 1.2 5.1 4.3
Bonds 21.2 26.1 33.0 26.4 25.0 26.2
Long Term Bonds 2.0 2.3 4.3 2.3 2.1 2.3
Real Estate Debt 2.9 5.8 8.5 5.9 4.3 4.2
total 35.3 35.8 36.5 37.0inflation-sensitive
investmentsReal Return Bonds 0.2 0.8 2.6 0.8 0.7 0.8
Infrastructure 1.7 4.5 7.6 3.9 3.6 3.6
Real Estate 7.7 11.4 14.7 10.7 10.3 11.5
total 16.7 15.4 14.6 15.9
equityCanadian Equity 8.0 12.4 16.8 12.9 12.6 11.7
Global Equity 3.3 7.2 11.0 5.8 7.8 6.8
Québec International 0.0 0.1 0.6 3.2 0.0 2.9
U.S. Equity 1.6 5.9 10.0 4.9 5.8 5.1
EAFE Equity 1.7 6.1 10.4 6.1 5.6 5.7
Emerging Markets Equity 1.5 4.4 7.0 3.9 5.0 3.7
Private Equity 6.6 9.9 13.0 9.8 10.2 9.9
total 46.0 46.6 47.0 45.8
other investmentsHedge Funds 0.1 2.0 3.2 2.2 1.8 2.1
Asset Allocation 0.0 0.0 1.0 0.0 0.6 0.8
ABTN N/A N/A N/A N/A (0.5) (1.6)
total 100.0 100.0 100.0 100.0
1. The benchmark portfolio and its upper and lower limits are the result of the weighted average of the depositors’ respective benchmark portfolios.
1 1

CAISSE DE DÉPÔT ET PLACEMENT DU QUÉBEC AR 2012 27
01 01 The The weighted weighted average return on average return on
depositors funds was 9.6% depositors funds was 9.6% and net investment results and net investment results totalled $14.9 billion in 2012totalled $14.9 billion in 2012..
02 02 The The annual returns annual returns of the eight main of the eight main
depositors ranged from depositors ranged from 8.2% to 10.5% in 2012, and 8.2% to 10.5% in 2012, and from 8.9% to 9.6% over the from 8.9% to 9.6% over the four-year period ended four-year period ended December 31, 2012December 31, 2012..
03 03 The The annualized annualized return is 9.2% for return is 9.2% for
the four-year period ended the four-year period ended December 31, 2012.December 31, 2012.
04 04 SinSince the reorgace the reorga--nization of its nization of its
portfolios in July 2009, the portfolios in July 2009, the Caisse had an annualized Caisse had an annualized return of 10.7%.return of 10.7%.
HIGHLIGHTS HIGHLIGHTS
Analysis of Overall Performance
The Caisse’s investment teams performed well in 2012 in an environment of very low interest rates and volatile stock markets. Globally, the Caisse’s portfolio was managed in such a way as to protect it from a rise in interest rates but also, at the start of the year, from a stock market decline related to concerns over the European crisis and the “fiscal cliff” in the United States. Thereafter, the portfolio’s exposure to equities was gradually increased as concerns abated.
The Caisse’s overall portfolio had a 9.6% weighted average return on depositors’ funds as at December 31, 2012, outper-forming the 9.3% return on its benchmark portfolio (see Table 14, p. 28).
long-term retUrns
For the four-year period ended December 31, 2012, despite the unrealized decreases in value recorded in the first half of 2009, the Caisse had a 9.2% return (see Table 13, p. 28), a performance that is almost identical to the return on the benchmark portfolio. All asset classes generated positive returns during the period, particularly Equity, with an 11.8% return (see Table 14, p. 28).
Reorganization of portfolios in July 2009In the first half of 2009, the Caisse reorganized its operations. In particular, it completed an extensive overhaul of its portfolio offering and risk management and it also repositioned the portfolios in the Real Estate sector. Since making these major changes, the Caisse has achieved an annualized return of 10.7%, equivalent to net investment results of $50.7 billion. This return exceeds that of the benchmark portfolio of 9.2% (see Table 12).
All asset classes contributed to this value added by outper-forming their benchmark indexes during this period. Fixed Income generated net investment results of $14.7 billion with a 7.7% annualized return. In Inflation-Sensitive Investments, the Infrastructure and Real Estate portfolios generated annua-lized returns of 26.7% and 10.7%, respectively. This asset class generated $10.3 billion in net investment results, of which $9.9 billion is attributable to these two portfolios. Equity made the largest contribution, with net investment results of $22.8 billion. Of that amount, $8.1 billion is attributable to the Private Equity portfolio and its 18.3% annualized return.
portfolio retUrns since the reorganiZation of the portfolios in jUly 2009
Asset class
Net investment results
$B
Annualized return
%Index
%
Fixed Income 14.7 7.7 6.4
Inflation-Sensitive Investments 10.3 14.4 11.3
Equity 22.8 11.0 10.1
total1 50.7 10.7 9.2
1. The total includes Hedge Fund, ABTN, Asset Allocation, Overlay Strategies, Commodities and cash activities.
2. Net investment results are net of operating expenses.
TABLE 12
2

CAISSE DE DÉPÔT ET PLACEMENT DU QUÉBEC AR 2012 28
cUrrency eXposUre anD heDging
The majority of foreign investments of the less-liquid portfolios, such as the Infrastructure, Real Estate and Private Equity portfolios, are hedged against currency fluctuations through foreign currency hedging instruments. The Caisse does not hedge investments held by the liquid portfolios, such as the portfolios of publicly traded securities, because the procyclical nature of the Canadian dollar enhances the diversification and the risk-reduction features of the foreign currencies in these portfolios. Net exposure to foreign currencies was about 27% of the Caisse’s total assets as at December 31, 2012.
geographic Diversification
In addition to investing in Québec and the rest of Canada, the Caisse is active on global markets, with investments in a range of asset classes. As at December 31, 2012, the proportion of total assets invested outside Canada was 42.6%, up 2.2% from year-end 2011 (see Table 15). Most of the Caisse’s foreign investments are in industrialized countries, mainly the United States. The share represented by emerging markets continued to increase, in line with the Caisse’s strategy of generating returns through greater exposure to the economic growth of these countries.
Analysis of Analysis of Overall PerformanceOverall Performance
net assets anD retUrns in relation to benchmark inDeXes(for periods ended December 31, 2012)
1 year 4 years
net assetsnet investment
results return indexNet investment
results Return Index
Asset class $b $m % % $M % %
Fixed Income 64.0 2,291 3.9 3.2 13,192 6.1 6.2
Inflation-Sensitive Investments 25.5 2,514 11.1 13.1 8,313 9.6 8.1
Equity 82.3 8,779 12.2 12.4 26,177 11.8 11.4
Hedge Funds 3.2 130 4.7 4.0 769 6.0 5.3
Asset Allocation 1.1 (422) N/A N/A (363) N/A N/A
ABTN1 (0.8) 1,686 N/A N/A N/A N/A N/A
total2,3,4 176.2 14,937 9.6 9.3 50,166 9.2 9.2
1. The financing of the ABTN portfolio exceeds the fair market value of the investments and is the main reason for the negative net assets.2. The total includes Overlay Strategies and cash activities. 3. For the four-year period, the contributions of the ABTNs and the Commodities portfolio are included in this line.4. See Note 3 of the General Notes.
TABLE 14
total assets by region1
(as at December 31 – as a percentage)
2012 20112
Canada 57.4 59.6
United States 20.3 18.6
Eurozone 7.2 6.7
United kingdom 4.5 5.0
Japan 1.5 1.8
Emerging markets 5.7 5.0
Other 3.4 3.3
total 100.0 100.0
1. Based on the country where the headquarters of the company or of the issuer is located or, for real estate, the geographic location of the property.
2. Certain reclassifications have been made to ensure that the data is consistent with the presentation adopted in 2012.
TABLE 15
caisse retUrns (for periods ended December 31 – as a percentage)
The Caisse’s overall return
2012 9.6
2011 4.0
2010 13.6
2009 10.0
4 years (2009-2012) 9.2
1. Weighted average return on depositors’ funds.
1
TABLE 13
CAISSE DE DÉPÔT ET PLACEMENT DU QUÉBEC AR 2012 29
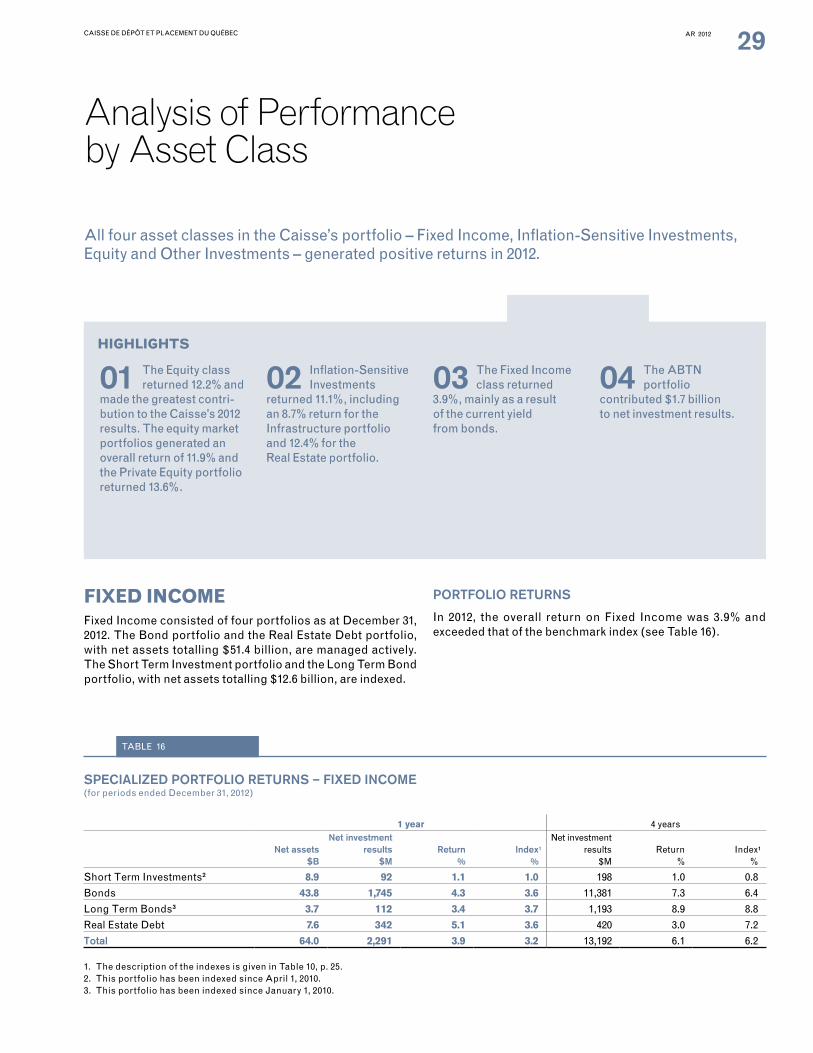
FIXED INCOMEFIXED INCOMEFixed Income consisted of four portfolios as at December 31, 2012. The Bond portfolio and the Real Estate Debt portfolio, with net assets totalling $51.4 billion, are managed actively. The Short Term Investment portfolio and the Long Term Bond portfolio, with net assets totalling $12.6 billion, are indexed.
PORTFOLIO RETURNS
In 2012, the overall return on Fixed Income was 3.9% and exceeded that of the benchmark index (see Table 16).
Analysis of Performance by Asset Class
HIGHLIGHTS HIGHLIGHTS
All four asset classes in the Caisse’s portfolio – Fixed Income, Inflation-Sensitive Investments, Equity and Other Investments – generated positive returns in 2012.
01 01 The The Equity class Equity class returned 12.2% and returned 12.2% and
made the greatest contrimade the greatest contri--bution to the bution to the CaiCaisse’s 2012 sse’s 2012 results. The equity market results. The equity market portfolios generated an portfolios generated an overall return of 11.9% and overall return of 11.9% and the Private Equity portfolio the Private Equity portfolio returned 13.6%.returned 13.6%.
02 02 InfInflation-Sensitive lation-Sensitive Investments Investments
returned 11.1%, including returned 11.1%, including aann 8.7% return for the 8.7% return for the Infrastructure portfolio Infrastructure portfolio and 12.4% for the and 12.4% for the Real Estate portfolio.Real Estate portfolio.
03 03 The The Fixed Income Fixed Income class returned class returned
3.9%, mainly as a result 3.9%, mainly as a result of of the the current current yieldyield from bondsfrom bonds..
04 04 The The ABTN ABTN portfolio portfolio
contributed $1.7 billion contributed $1.7 billion to net investment results.to net investment results.
SPECIALIZED PORTFOLIO RETURNS – FIXED INCOME(for periods ended December 31, 2012)
1 year 4 years
Net assets $B
Net investment results
$MReturn
%Index
%
Net investment results
$MReturn
%Index
%
Short Term Investments2 8.9 92 1.1 1.0 198 1.0 0.8
Bonds 43.8 1,745 4.3 3.6 11,381 7.3 6.4
Long Term Bonds3 3.7 112 3.4 3.7 1,193 8.9 8.8
Real Estate Debt 7.6 342 5.1 3.6 420 3.0 7.2
Total 64.0 2,291 3.9 3.2 13,192 6.1 6.2
1. The description of the indexes is given in Table 10, p. 25.2. This portfolio has been indexed since April 1, 2010.3. This portfolio has been indexed since January 1, 2010.
1 1
TABLE 16

CAISSE DE DÉPÔT ET PLACEMENT DU QUÉBEC AR 2012 30
Analysis of Performance Analysis of Performance by Asset Classby Asset Class
Short Term Investments The Short Term Investment portfolio is invested in highly liquid securities. It generates a fairly low return but ensures preser-vation of capital, considerable liquidity and diversification.
ReturnThe portfolio generated 1.1%, a return that is almost identical to that of its benchmark index (see Table 16, p. 29). As in 2011, the return is due to an environment of very low interest rates, given that the Bank of Canada kept its key rate at 1% throughout the year.
BondsThe Bond portfolio consists mainly of bonds issued by the Government of Canada, the governments of the provinces of Canada and various public and private corporations. The portfolio provides a return commensurate with its low level of risk and is a source of current yield and liquidity. It also provides diversification and helps protect the overall portfolio.
The portfolio is managed actively with a focus on the diversifi-cation of sources of value added. The strategies are geared to the economic and monetary cycles, and relative-value opera-tions contribute regularly to its returns.
ReturnThe Bond portfolio generated a 4.3% return, outperforming its benchmark index (see Table 16, p. 29). The return is attributable mainly to the current yield on the securities in the portfolio. The value added in relation to the index is due mainly to strategies based on the reduction of the systemic risk arising from the European crisis as well as relative-value strategies for corporate bonds.
For the four-year period ended December 31, 2012, the portfo-lio’s 7.3% return outperformed its index. Overall, the portfolio generated positive absolute returns because of the conside-rable decline in medium- and long-term interest rates during the period. Corporate bonds generated the highest return and a large portion of the portfolio’s value added.
Table 17 gives the DEX bond index returns according to maturity and issuer. In 2012, yields on Government of Canada bonds fell slightly, especially for medium- and long-term maturities. Narrower credit spreads for corporate bonds are the reason for their 6.2% return. Generally speaking, this positive perfor-mance and current yield are the reasons for the DEX’s return for the year.
Long Term BondsThe Long Term Bond portfolio is indexed. It generates a return consistent with its low level of risk and is a source of the current yield.
ReturnThe portfolio generated a return of 3.4%, underperforming its benchmark index (see Table 16, p. 29). The return is due mainly to the current yield on the securities in the portfolio, given that interest rates fluctuated very little during the year. The under-performance stems from the cost of rebalancing the portfolio to reflect the new weighting of the components of the index, in effect since January 1, 2012.
DEX BOND INDEX RETURNS(as a percentage)
2012 2011DEXBond Indexes Short Term Medium Term Long Term Total Short Term Medium Term Long Term Total
Federal 1.1 2.9 4.5 2.1 4.5 11.6 19.8 8.4
Provincial 1.6 3.9 3.7 3.4 5.1 11.5 18.2 13.2
Québec 1.6 3.9 3.5 3.3 5.4 11.3 18.2 13.6
Corporate 3.9 8.1 9.5 6.2 4.7 9.0 15.8 8.2
Universe 2.0 4.6 5.2 3.6 4.7 10.9 18.1 9.7
TABLE 17
CAISSE DE DÉPÔT ET PLACEMENT DU QUÉBEC AR 2012 31
Real Estate Debt The Real Estate Debt portfolio consists mainly of Canadian commercial mortgages. The portfolio is expected to generate a higher return than bonds and also provides a substantial and fairly stable current yield. Its credit risk is low because of a prudent underwriting approach and the high quality of the assets.
The portfolio is managed actively. The managers may carry out various securitization and syndication operations as well as acquire or sell mortgage assets to rebalance and diversify the portfolio or to mitigate the risk of individual transactions. Since 2010, the portfolio’s credit risk has been reduced significantly with a strategy that emphasizes high-quality Canadian assets.
ReturnThe Real Estate Debt portfolio returned 5.1%, outperforming its benchmark index (see Table 16, p. 29). In an environment of very low interest rates, the portfolio generated a stable current yield exceeding that of the index.
In 2012, the portfolio’s managers maintained their leading position in Québec while increasing their market shares in Ontario and Western Canada. They exceeded their transaction-volume target while maintaining the credit quality of the underwritten assets, despite a strategy to protect the return over the long term, including the use of interest rate floors. Credit performance continued to be excellent, with none of the portfolio’s loans in default as at December 31, 2012.
For the four-year period ended December 31, 2012, the portfolio underperformed its index with a return of 3.0%. The under-performance is due to a significant decline in the value of the portfolio’s international assets amid deteriorating funda-mentals in the real estate and real estate debt markets in the United States and Europe in 2009. Even so, gains on the sale of such assets, as well as sustained results from the Canadian assets offset this decrease and generated a positive absolute return for the period.
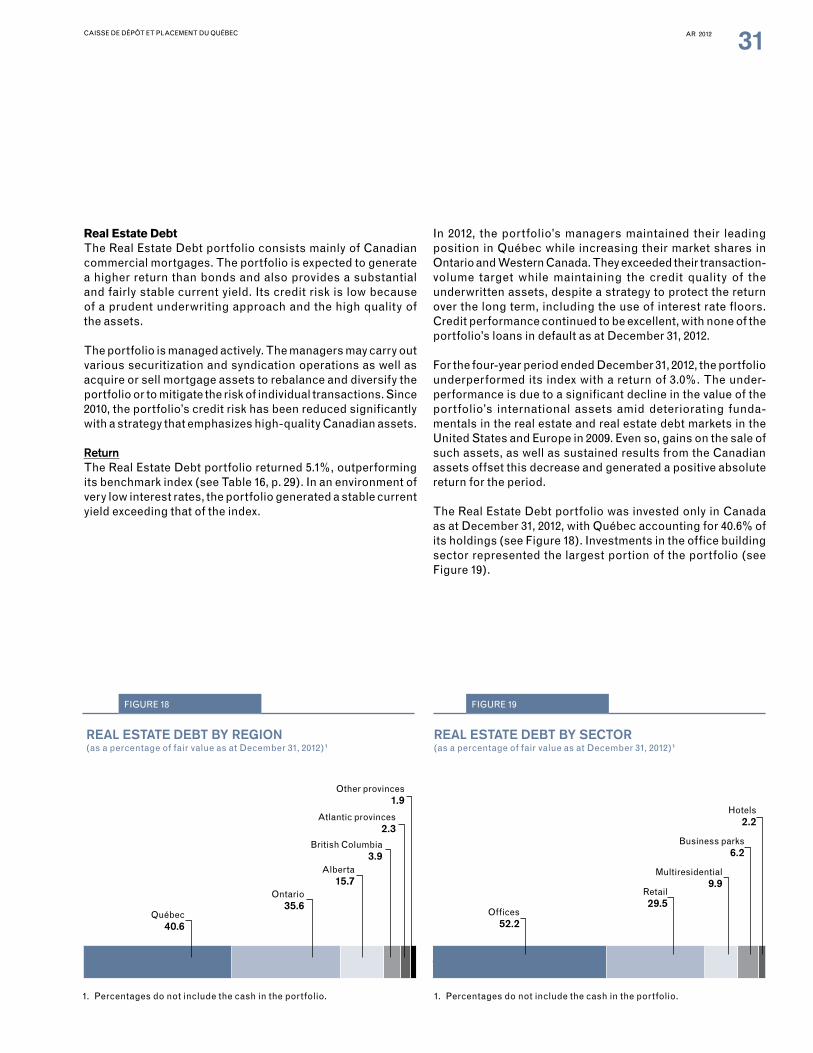
The Real Estate Debt portfolio was invested only in Canada as at December 31, 2012, with Québec accounting for 40.6% of its holdings (see Figure 18). Investments in the office building sector represented the largest portion of the portfolio (see Figure 19).
REAL ESTATE DEBT By SECTOR(as a percentage of fair value as at December 31, 2012)1
FIGURE 19
Retail 29.5
Multiresidential 9.9
Hotels 2.2
Offices 52.2
Business parks 6.2
1. Percentages do not include the cash in the portfolio.
REAL ESTATE DEBT By REgION(as a percentage of fair value as at December 31, 2012)1
FIGURE 18
Alberta 15.7
British Columbia 3.9
Atlantic provinces 2.3
Ontario 35.6
Québec 40.6
Other provinces 1.9
1. Percentages do not include the cash in the portfolio.

CAISSE DE DÉPÔT ET PLACEMENT DU QUÉBEC AR 2012 32
Analysis of Performance Analysis of Performance by Asset Classby Asset Class
INFLATION-SENSITIVE INFLATION-SENSITIVE INVESTMENTSINVESTMENTSInflation-Sensitive Investments comprised three portfolios as at December 31, 2012. The Infrastructure portfolio and the Real Estate portfolio, with net assets totalling $24.3 billion, are managed actively, whereas the Real Return Bond portfolio, with $1.2 billion in net assets, is indexed.
PORTFOLIO RETURNS
The overall return on Inflation-Sensitive Investments for 2012 was 11.1%, thereby underperforming the benchmark index (see Table 20).
Real Return Bonds The Real Return Bond portfolio is indexed. It offers a return commensurate with its low level of risk and provides a hedge against inflation.
ReturnThe portfolio generated a 2.7% return, which is very close to that of its benchmark index (see Table 20). In a context of stable real rates and inflation expectations, more than half of the return is attributable to increase in the price of the securities in the portfolio; the other portion is due to the current yield. The diffe-rence vis-à-vis the return on the index is primarily due to the cost of replicating the index.
InfrastructureThe Infrastructure portfolio consists of regulated and monopo-listic assets and assets that generate revenues under long-term contracts, with high, stable cash flows that are foreseeable over the long term. It includes mainly direct stakes in companies that operate airports, oil, gas and electricity transmission and distribution systems and water distribution systems or that have passenger transportation contracts and concessions.
The portfolio’s strategy calls for direct and long-term invest-ments (10 years or more) made with strategic and financial partners. Active management focuses on high-quality companies that stand out with their lower risk profile and reduced sensitivity to economic fluctuations.
ReturnThe Infrastructure portfolio returned 8.7%, underperforming its benchmark index (see Table 20). The absolute return is consistent with the portfolio’s expected long-term return. It is attributable to the holdings’ positive operating performance in a difficult macroeconomic environment, especially in the Energy sector, and to a high level of current return.
SPECIALIZED PORTFOLIO RETURNS – INFLATION-SENSITIVE INVESTMENTS(for periods ended December 31, 2012)
1 year 4 years
Net assets $B
Net investment results
$MReturn
%Index
%
Net investment results
$MReturn
%Index
%
Real Return Bonds2 1.2 34 2.7 2.9 413 12.2 11.5
Infrastructure3 6.3 511 8.7 15.0 3,935 22.4 16.9
Real Estate 18.0 1,969 12.4 13.2 3,965 5.4 5.5
Inflation-Sensitive Investments 25.5 2,514 11.1 13.1 8,313 9.6 8.1
1. The description of the indexes is given in Table 10, p. 25.2. This portfolio has been indexed since January 1, 2010.3. This line combines the Investments and Infrastructures specialized portfolio from January 1, 2009, to June 30, 2010,
and the Infrastructure portfolio since July 1, 2010.
1 1
TABLE 20
CAISSE DE DÉPÔT ET PLACEMENT DU QUÉBEC AR 2012 33
The portfolio’s benchmark index consists of publicly traded securities whose valuations are more volatile than those of the investments in the portfolio. It is therefore difficult to pass judgment on its return vis-à-vis the index over a one-year period.
During the year, in a buoyant market fuelled by very low interest rates and abundant capital, the managers proceeded with caution; they rebalanced the portfolio to ensure sector and geographic diversification, laying the foundation for more vigorous growth over the long term. Asset sales totalled $1.0 billion and included partial divestment of the stake in Heathrow Airport Holdings (HAH, formerly BAA). New invest-ments totalled $0.5 billion. They include an increase of 10% (from 20% to 30%) in the European public transit leader Keolis, an investment held in partnership with SNCF, and a new interest in a public-private partnership in Australia, in co-operation with Plenary Group.
For the four-year period ended December 31, 2012, the 22.4% return on the composite of the Investments and Infrastructures portfolio, before July 1, 2010, and the Infrastructure portfolio after that date outperformed the benchmark index. This high absolute return is due primarily to a solid operating perfor-mance by the companies in the portfolio, a decline in interest rates in recent years and the current return. To protect the portfolio from potential interest-rate increase, the managers began implementing a hedging strategy at the end of 2012.
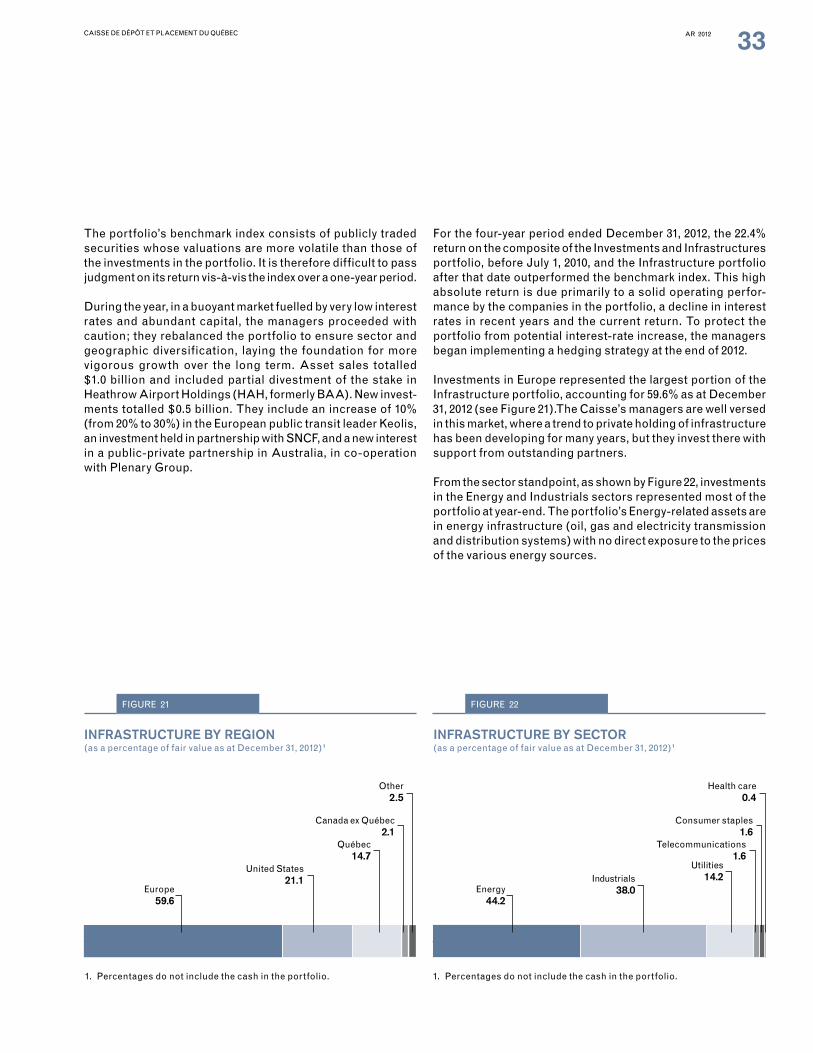
Investments in Europe represented the largest portion of the Infrastructure portfolio, accounting for 59.6% as at December 31, 2012 (see Figure 21).The Caisse’s managers are well versed in this market, where a trend to private holding of infrastructure has been developing for many years, but they invest there with support from outstanding partners.
From the sector standpoint, as shown by Figure 22, investments in the Energy and Industrials sectors represented most of the portfolio at year-end. The portfolio’s Energy-related assets are in energy infrastructure (oil, gas and electricity transmission and distribution systems) with no direct exposure to the prices of the various energy sources.
0.000000 16.666700 33.333401 50.000101 66.666801 83.333502
INFRASTRUCTURE By SECTOR(as a percentage of fair value as at December 31, 2012)1
FIGURE 22
Energy 44.2
Telecommunications 1.6
Industrials 38.0
Health care 0.4
Consumer staples 1.6
1. Percentages do not include the cash in the portfolio.
Utilities 14.2
02 04 06 08 0 100
INFRASTRUCTURE By REgION(as a percentage of fair value as at December 31, 2012)1
FIGURE 21
Europe 59.6
Québec 14.7
United States 21.1
Other 2.5
Canada ex Québec 2.1
1. Percentages do not include the cash in the portfolio.

CAISSE DE DÉPÔT ET PLACEMENT DU QUÉBEC AR 2012 34
Analysis of Performance Analysis of Performance by Asset Classby Asset Class
Real Estate The Real Estate portfolio consists mainly of direct investments in shopping centres, office buildings and multiresidential properties. The portfolio generates a high current return that exceeds that of fixed-income securities. It also provides diver-sification and a hedge against inflation through indexing of leases.
The portfolio is managed using a diversification approach, with emphasis on high-quality buildings that tend to be in large, promising markets. In 2012, the managers continued the portfolio repositioning, begun in 2011, by adding multiresi-dential buildings and selling hotels.
ReturnThe Real Estate portfolio returned 12.4%, underperforming its benchmark index (see Table 20, p. 32). Its return is due mainly to its results in the shopping centre sector, primarily in Canada, and its solid and stable current return. In 2012, a restructuring of the share ownership of Ivanhoé Cambridge, completing the revision of its business model, initiated last year, required valuation of the company according to the new International Financial Reporting Standards (IFRS). The valuation had a positive impact on the portfolio’s return.
The difference vis-à-vis the index is largely attributable to the non-strategic hotel sector, particularly hotels in Canada, and to the results generated by office buildings in Canada and Europe.
Notable acquisitions by the portfolio managers in 2012 include additional stakes in shopping centres in Canada and Brazil, as well as office buildings in Paris and New York City and residential buildings in California and London at a total cost of $2.2 billion. Further commitments were carried out in order to invest in real estate funds managed by three of the best-performing managers. The sales involved mainly interests in shopping centres in Canada and the United States. Moreover, special attention was paid to development projects. The year’s new commitments to construction, expansion and redeve-lopment projects totalled $2.2 billion.
For the four-year period ended December 31, 2012, the portfolio generated 5.4%, a return that is almost identical to that of the benchmark index.
As at December 31, 2012, investments in Canada represented 48.8% of the portfolio’s fair value and those in the United States 24.1%, versus 49.2% and 23.5%, respectively, at year-end 2011 (see Figure 23). Retail properties accounted for 39.9% of the portfolio and office buildings 30.7%, versus 40.7% and 30.7%, respectively, at year-end 2011 (see Figure 24).
FIGURE 23
United States 24.1
Western Europe 20.4
Québec 16.6
Developed Asia 0.9
Canada ex Québec 32.2
Emerging markets 5.8
1. Percentages do not include the cash in the portfolio.
REAL ESTATE By REgION(as a percentage of fair value as at December 31, 2012)1
REAL ESTATE By SECTOR(as a percentage of fair value as at December 31, 2012)1
FIGURE 24
Retail 39.9
Offices 30.7
Multiresidential 6.6Hotels
7.0Investment funds
9.2
Mortgages 3.3
Other 3.3
1. Percentages do not include the cash in the portfolio.

CAISSE DE DÉPÔT ET PLACEMENT DU QUÉBEC AR 2012 35
EQUITY EQUITY The Equity asset class consisted of six portfolios as at December 31, 2012. The Canadian Equity, Global Equity and Private Equity portfolios, with net assets totalling $53.6 billion, are managed actively. The U.S. Equity, EAFE Equity and Emerging Markets Equity portfolios, with net assets totalling $28.7 billion, are indexed.
The publicly traded equity portfolios offer long-term returns that exceed fixed-income returns, while providing a hedge against inflation over the long term. The Private Equity portfolio offers the possibility of a return that exceeds that of the equity markets over a long-term horizon.
PORTFOLIO RETURNS
The overall return on Equity for 2012 was 12.2% and underper-formed that of the benchmark index (see Table 25).
Canadian EquityThe Canadian Equity portfolio consists mainly of securities of publicly traded companies. It is managed actively with a long-term horizon. Security selection is based on qualitative analysis of the fundamental value of businesses, supported by macroeconomic analysis. This approach is rounded out by absolute-performance strategies with a low correlation to the equity market.
ReturnThe Canadian Equity portfolio returned 6.6%, underperforming its benchmark index (see Table 25).
In 2012, the Canadian market underperformed the international markets (see Figure 26, p. 36), mainly because of:
• the preponderance of companies in the Materials and Energy sectors, which generally underperformed the broad market; and• the performance of Canadian financial-sector securities,
which had a strong 17.6% return but significantly underper-formed the financials of the other developed countries, which advanced about 30% as they rebounded much more signifi-cantly from their sharp declines of recent years.
SPECIALIZED PORTFOLIO RETURNS – EQUITy(for periods ended December 31, 2012)
1 year 4 years
Net assets $B
Net investment results
$MReturn
%Index
%
Net investment results
$MReturn
%Index
%
Canadian Equity 22.0 1,279 6.6 7.7 6,270 10.8 12.0
Global Equity 13.8 1,575 14.0 13.6 N/A N/A N/A
U.S. Equity2,3 10.2 1,075 13.5 13.4 2,429 10.4 9.4
EAFE Equity2,4 9.8 1,246 15.2 14.7 1,496 5.3 5.3
Emerging Markets Equity2 8.7 1,024 15.8 15.6 2,270 13.1 13.3
Equity Markets5,6 64.5 6,646 11.9 12.0 18,543 11.2 11.5
Private Equity 17.8 2,133 13.6 14.1 7,634 14.3 11.6
Equity5,6 82.3 8,779 12.2 12.4 26,177 11.8 11.4
1. The description of the indexes is given in Table 10, p. 25.2. These portfolios have been indexed since April 1, 2010.3. This line includes the U.S. Equity (Hedged) and U.S. Equity (Unhedged) specialized portfolios from January 1, 2009, to March 31, 2010,
and the U.S. Equity specialized portfolio since April 1, 2010.4. This line includes the Foreign Equity (Hedged) and Foreign Equity (Unhedged) specialized portfolios from January 1, 2009, to March 31, 2010,
and the Europe, Australasia & Far East (EAFE) Equity specialized portfolio since April 1, 2010.5. The contribution of the Québec International portfolio, closed out on November 30, 2012, is included in this line.6. For the four-year period, the contribution of the Global Equity portfolio is included in this line.
1 1
TABLE 25

CAISSE DE DÉPÔT ET PLACEMENT DU QUÉBEC AR 2012 36
Analysis of Performance Analysis of Performance by Asset Classby Asset Class
The portfolio’s absolute return stems from advances by seven of the 10 Canadian stock market sectors during the year. The difference is due exclusively to security selection in the Materials sector. The portfolio continues to be positioned to take advantage of urbanization in emerging economies. Even though this investment theme lagged in 2012 amid concerns about a slowdown in China, it has a promising long-term outlook.
The Morningstar National Bank Québec Index, which was included in the benchmark index in 2011 to better represent the reality of Québec’s economy in the portfolio, outperformed the S&P/TSX Index in 2012. At year-end, Québec securities accounted for 23.3% of the portfolio, whereas they represented 12.7% of the Toronto Stock Exchange index.
For the four-year period ended December 31, 2012, the portfolio’s 10.8% return underperformed its benchmark index. This diffe-rence is due mainly to security selection in the Energy, Materials, Financial and Health care sectors, and an underweight position in Telecommunications. Absolute-return strategies, however, added value during the period.
Global EquityThe Global Equity portfolio consists of securities traded on stock exchanges in the countries of the MSCI ACWI Index (United States, Canada, Europe, Australasia, Far East and emerging markets). The portfolio is managed actively using four approaches: sector-specific internal management comple-mented by absolute-return strategies with low equity-market correlation; externally managed sector- and country-specific mandates; and investments on the Shanghai and Shenzhen stock exchanges as a Qualified Foreign Institutional Investor (QFII), a designation granted to the Caisse by the Chinese regulatory authorities.
In 2012, a new capitalized absolute-management mandate was added to the portfolio. The mandate focuses mainly on companies offering a stable, foreseeable return on invested capital. The objective is to reduce the portfolio’s volatility while maintaining a high return. This mandate was the basis for the creation of the Global Quality Equity portfolio as at January 1, 2013.
ReturnThe Global Equity portfolio returned 14.0%, outperforming its benchmark index (see Table 25, p. 35) during a year in which the main foreign stock markets made substantial gains, with the exception of Brazil.
EQUITy MARKET PERFORMANCE IN 2012(December 31, 2011 = 100, in Canadian dollars)
S&P/TSX
S&P 500
MSCI EAFE
MSCI EM
Source: Rimes
FIGURE 26
90
95
100
105
110
115
120
Dec.2011
June2012
July2012
Aug.2012
Oct.2012
Nov.2012
Sept.2012
March2012
Jan.2012
Feb.2012
April2012
May2012
Dec.2012
CAISSE DE DÉPÔT ET PLACEMENT DU QUÉBEC AR 2012 37
The portfolio’s value added is due mainly to security-selection strategies in the various sectors, in particular Energy and Health care, as well as absolute-return strategies.
U.S. Equity ReturnThe indexed U.S. Equity Portfolio generated 13.5%, a return that is almost identical to the performance of its benchmark index (see Table 25, p. 35).
EAFE Equity ReturnThe indexed EAFE Equity Portfolio returned 15.2%, outper-forming its benchmark index (see Table 25, p. 35). The difference is due mainly to a realized dividend-tax rate in some countries that is lower than that used to calculate the MSCI EAFE Index.
The returns on the various components of the index differed significantly in 2012. Germany advanced by a solid 28.0% whereas Spain, which was hard hit by its public-finance problems, returned only 0.7% on the year.
Emerging Markets Equity ReturnThe indexed Emerging Markets Equity portfolio returned 15.8%, outperforming its benchmark index (see Table 25, p. 35). The portfolio’s value added is due mainly to optimization of index management to take advantage of attractive prices and securities borrowing and lending.
In 2012, five of the six main emerging markets had returns ranging from 14.1% to 23.2%. Only Brazil had a negative return (-2.2%), mainly because of the substantial devaluation of its currency.
Private Equity The Private Equity portfolio consists primarily of direct stakes in companies in various sectors of the economy, especially defensive sectors and niches offering stable, predictable cash flows. It also includes stakes in well-managed investment funds, which are used to position the Caisse strategically in certain industries and regions.
The portfolio is managed actively, with an emphasis on investment categories and types based on economic cycles and market inefficiencies: leveraged-buyout financing, development capital, and subordinated debt and distressed debt operations carried out with specialized funds. The target companies are noted for their value-creation strategies, compe-titive advantages, resilient financial results and moderate leverage. The managers pay close attention to the quality of the management teams and the partners they invest with so that they can develop plans for growth and operational impro-vements to further enhance returns.
ReturnThe Private Equity portfolio generated a 13.6% return, under-performing its benchmark index (see Table 25, p. 35). Almost half of the portfolio’s absolute return is due to leveraged-buyout financing. Development capital, distressed debt and restructuring funds, and earnings from the sale of assets also contributed to the return.
In 2012, the managers worked to rebalance and diversify the portfolio to reduce its concentration risk. For example, they reduced the investment in Quebecor Media, increased the portfolio’s direct investments and reduced the weight of leveraged-buyout funds in favour of funds specializing in development capital and distressed debt. Asset sales totalled $4.1 billion and new investments totalled $5.0 billion, with $4.0 billion of direct investments, including $1.8 billion in Québec and $1.0 billion in funds.
The direct investments include those made in the following Québec companies: CGI ($1 billion), lnnergex Renewable Energy ($100 million), GENIVAR ($98.5 million) and Laurentian Bank ($100 million). A positioning based on restructuring in the North American energy sector gave rise to a $400-million investment in the Canadian company MEG Energy.

CAISSE DE DÉPÔT ET PLACEMENT DU QUÉBEC AR 2012 38
Analysis of Performance Analysis of Performance by Asset Classby Asset Class
For the four-year period ended December 31, 2012, the portfolio’s 14.3% return is significantly higher than that of the benchmark index. Development capital and leverage-buyout financing, as well as investment funds, generated most of the return. The main factors are improved operational performance, reduced debt and higher earnings recorded by the companies in the portfolio. As well, the companies carried out refinancing opera-tions to take advantage of low interest rates and to adjust their loan maturities. The management team also took advantage of favourable market conditions to reposition the portfolio of funds with transactions on the secondary market.
Figure 27 shows that investments in the United States represented 38.5% of the portfolio’s fair value as at December 31, 2012, followed by Québec with 26.7% and Europe with 20.1%.
OTHER INVESTMENTSOTHER INVESTMENTS
PORTFOLIO RETURNS
Hedge Funds The Hedge Fund portfolio consists of investments in external hedge funds. It offers the possibility of a return that is higher than the return on bonds but lower than the return on equities, with a view to preservation of capital. It also ensures diversi-fication as a result of its low correlation with traditional asset classes, such as bonds and publicly traded equities.
The portfolio is managed actively with an emphasis on comple-mentary strategies, selection of external managers and operational due diligence. In July 2012, the managers began to accelerate the repositioning of the portfolio by concentrating on strategies that offer a risk-return profile that is neutral in relation to the Caisse’s overall portfolio.
ReturnThe Hedge Fund portfolio returned 4.7%, outperforming its benchmark index (see Table 28, p. 39). The return is due to positive results from global macro and distressed debt strategies. As for the futures strategies, they did not produce the expected results in the market context that prevailed in 2012.
Asset AllocationThe Asset Allocation portfolio consists of various positions in the financial markets in the form of derivative financial instru-ments. Its objective is to adjust the Caisse’s exposure to the main asset classes in a flexible manner and to calibrate the risk-return profile of the Caisse’s overall portfolio.
The purpose of the consolidated Asset Allocation operations is to actively manage the allocation of assets in the Caisse’s overall portfolio over an investment horizon of less than three years. There are two types of asset allocation operations:
• Operations based on derivatives, which are used mainly to protect the portfolio from the risk of extreme fluctuations and are recorded in the Asset Allocation portfolio; and • Operations to overweight and underweight the specialized
portfolios, which are recorded in the portfolios themselves.
United States 38.5
Québec
26.7
Europe 20.1
Canada ex Québec 8.4
Asia-Pacific 4.0
Other 2.3
PRIVATE EQUITy By REgION(as a percentage of fair value as at December 31, 2012)1
FIGURE 27
1. Percentages do not include the cash in the portfolio.

CAISSE DE DÉPÔT ET PLACEMENT DU QUÉBEC AR 2012 39
ReturnAs at December 31, 2012 the net investment results of the Asset Allocation portfolio amounted to -$422 million. This result is due mainly to overweighting and underweighting on the equity and bond markets during the year. Such decisions were based partially on the conviction that, given the current level of interest rates, which are at a historic low, bonds will generate less attractive returns than other asset classes in the years to come.
For the four-year period ended December 31, 2012, the port-folio’s net investment results amount to -$363 million, mainly because of the 2012 results.
ABTNThe ABTN portfolio was created in 2010 to improve the transpa-rency of these assets. The portfolio consists of asset-backed term notes (ABTNs). These notes have an average maturity of four years and generate quarterly interest income.
The ABTN portfolio comprises activities that are being discon-tinued. A key component of the portfolio management strategy is therefore controlling and reducing risks. In 2010, the mana-gers put in place hedges that reduced market exposure by almost 50%. In 2011, the hedges helped reduce portfolio vola-tility in a jittery market. Starting in 2012, the objective was to carry out transactions so as to close out some of the positions. The portfolio’s operations are scheduled to end in 2016 or 2017.
ReturnAs at December 31, 2012, the contribution of the ABTN port-folio to the net investment results totalled $1.7 billion, mainly because of higher market values as a result of the securities’ approaching average maturities and a narrowing of the rate spreads for the underlying assets (see Table 28). This result has made it possible to reduce the ABTN provision from $4.0 billion to $2.2 billion.
Since the end of 2008, the provision has gone from $5.6 billion to $2.2 billion. This reduction is attributable to the approa-ching average maturities of the securities and improved credit conditions.
SPECIALIZED PORTFOLIO RETURNS
Table 29 (p. 40) shows the returns on the specialized portfolios in relation to their benchmark indexes for periods of one and four years ending December 31, 2012.
SPECIALIZED PORTFOLIO RETURNS – OTHER INVESTMENTS(for periods ended December 31, 2012)
1 year 4 years
Net assets $B
Net investment results
$MReturn
%Index
%
Net investment results
$MReturn
%Index
%
Hedge Funds 3.2 130 4.7 4.0 769 6.0 5.3
Asset Allocation 1.1 (422) N/A N/A (363) N/A N/A
ABTN2 (0.8) 1,686 N/A N/A N/A N/A N/A
1. The description of the indexes is given in Table 10, p. 25.2. The financing of the ABTN portfolio exceeds the fair market value of the investments and is the main reason for the negative net assets.
1 1
TABLE 28

CAISSE DE DÉPÔT ET PLACEMENT DU QUÉBEC AR 2012 40
Analysis of Performance Analysis of Performance by Asset Classby Asset Class
SPECIALIZED PORTFOLIO RETURNS IN RELATION TO BENCHMARK INDEXES(for periods ended December 31, 2012)
1 year 4 years
Specialized portfolio 2012 Index Net assetsNet investment
results Return Index Net investment
results Return Index$B $M % % $M % %
Fixed IncomeShort Term
Investments2
DEX 91 Day T-Bill
8.9 92 1.1 1.0 198 1.0 0.8 Bonds DEX Universe Bond
(Adjusted) 43.8 1,745 4.3 3.6 11,381 7.3 6.4 Long Term Bonds3 DEX Long Term
Government Bond (Adjusted) 3.7 112 3.4 3.7 1,193 8.9 8.8
Real Estate Debt DEX Universe Bond 7.6 342 5.1 3.6 420 3.0 7.2 Total 64.0 2,291 3.9 3.2 13,192 6.1 6.2 Inflation-Sensitive
InvestmentsReal Return Bonds3 DEX Real Return Bond 1.2 34 2.7 2.9 413 12.2 11.5 Infrastructure4 Infrastructure 6.3 511 8.7 15.0 3,935 22.4 16.9 Real Estate Aon Hewitt – Real Estate
(Adjusted) 18.0 1,969 12.4 13.2 3,965 5.4 5.5 Total 25.5 2,514 11.1 13.1 8,313 9.6 8.1 EquityCanadian Equity Canadian Equity 22.0 1,279 6.6 7.7 6,270 10.8 12.0 Global Equity MSCI ACWI (Unhedged) 13.8 1,575 14.0 13.6 N/A N/A N/A
U.S. Equity2,5 S&P 500 (Unhedged) 10.2 1,075 13.5 13.4 2,429 10.4 9.4 EAFE Equity2,6 MSCI EAFE (Unhedged) 9.8 1,246 15.2 14.7 1,496 5.3 5.3 Emerging Markets
Equity2
MSCI EM (Unhedged)
8.7 1,024 15.8 15.6 2,270 13.1 13.3 Equity Markets7,8 64.5 6,646 11.9 12.0 18,543 11.2 11.5 Private Equity Private Equity 17.8 2,133 13.6 14.1 7,634 14.3 11.6 Total7,8 82.3 8,779 12.2 12.4 26,177 11.8 11.4 Other InvestmentsHedge Funds Dow Jones Credit
Suisse Hedge Fund Index (Adjusted Hedged) 3.2 130 4.7 4.0 769 6.0 5.3
Asset Allocation 1.1 (422) N/A N/A (363) N/A N/A
ABTN9 (0.8) 1,686 N/A N/A N/A N/A N/A
Total10,11 176.2 14,937 9.6 9.3 50,166 9.2 9.2
1. The description of the indexes is given in Table 10, p. 25.2. These portfolios have been indexed since April 1, 2010.3. These portfolios have been indexed since January 1, 2010.4. This line includes the Investments and Infrastructures specialized portfolio from January 1, 2009, to June 30, 2010, and the Infrastructure specialized
portfolio since July 1, 2010.5. This line includes the U.S. Equity (Hedged) and U.S. Equity (Unhedged) specialized portfolios from January 1, 2009, to March 31, 2010, and the
U.S. Equity specialized portfolio since April 1, 2010.6. This line includes the Foreign Equity (Hedged) and Foreign Equity (Unhedged) specialized portfolios from January 1, 2009, to March 31, 2010, and
the Europe, Australasia and Far East (EAFE) Equity specialized portfolio since April 1, 2010.7. The contribution of the Québec International portfolio, closed out on November 30, 2012, is included in this line.8. For the four-year period, the contribution of the Global Equity portfolio is included in this line.9. The financing of the ABTN portfolio exceeds the fair market value of the investments and is the main reason for the negative net assets.10. For the four-year period, the contributions of the ABTNs and the Commodities portfolio are included in this line.11. The total includes Overlay Strategies and cash activities.
1
TABLE 29

CAISSE DE DÉPÔT ET PLACEMENT DU QUÉBEC AR 2012 41
DEPOSITORS’ NET ASSETS
In 2012, depositors’ net assets increased by $17.2 billion, including net investment results of $14.9 billion attributable mainly to the Equity asset class and $2.3 billion of depositors’ net deposits (see Table 30).
The $176.2 billion of depositors’ net assets includes a $637-million consolidation adjustment stemming from early adoption of International Financial Reporting Standards (IFRS) for the Real Estate portfolio, which includes the subsi-diary Ivanhoé Cambridge. The consolidation adjustment is presented separately as additional information to the combined statement of net assets in the Caisse’s financial statements. The restructuring of Ivanhoé Cambridge’s share ownership required that Ivanhoé Cambridge be measured and presented as an investment as at December 31, 2012, in accordance with IFRS. This valuation reflects the fair value of the business, including the fair value of its real estate assets, the quality of the portfolio and integrated management of the platform.
Depositors’ net assets rose from $120.1 billion as at December 31, 2008, to $176.2 billion as at December 31, 2012. The increase came essentially from net investment results of $50.1 billion and depositors’ net contributions of $5.9 billion.
TOTAL ASSETS
As at December 31, 2012, total assets reached $213.8 billion, up from $191.3 billion as at December 31, 2011, for an increase of $22.5 billion (see Table 31, p. 42). The increase consists of reinvested investment income, unrealized increases in the value of investments and depositors’ contributions. While maintaining a strong financial position, the Caisse managed its liabilities carefully, ensuring the percentage of liabilities remained stable in relation to total assets, or close to 18%. Liabilities include short selling of securities, securities sold under repurchase agreements, derivatives and the financing programs of the Caisse subsidiary CDP Financial, used mainly to finance real estate investments.
Changes in Assets
HIGHLIGHTSHIGHLIGHTS
01 01 DepDepositors’ net assets ositors’ net assets increased by $17.2 billion increased by $17.2 billion
to $176.2 billionto $176.2 billion..02 02 Net Net investment results investment results
totalled $14.9 billion, 59%totalled $14.9 billion, 59% of of which was from Equitywhich was from Equity..
03 03 DepDepositors’ total net deposits ositors’ total net deposits amounted to $2.3 billion.amounted to $2.3 billion.
ANALYSIS Of chANgES IN DEPOSITORS’ NET ASSETS(for the period 2009-2012 – in billions of dollars)
2009 2010 2011 2012 2009-2012
Depositors’ net assets, beginning of year 120.1 131.6 151.7 159.0 120.1
Investment income 5.0 4.8 5.2 5.6 20.6
Gains (losses) on the sale of investments 4.5 1.6 (0.5) 2.4 8.0
Unrealized increase in value of investments 2.6 11.6 1.3 7.2 22.7
Operating expenses (0.3) (0.3) (0.3) (0.3) (1.2)
Net investment results1 11.8 17.7 5.7 14.9 50.1
Depositors’ net contributions (0.3) 2.4 1.5 2.3 5.9
Depositors’ net assets, end of year 131.6 151.7 159.0 176.2 176.2
1. Net investment results include income generated by depositors’ demand deposits and term deposits.
TAbLE 30

CAISSE DE DÉPÔT ET PLACEMENT DU QUÉBEC AR 2012 42
Changes in AssetsChanges in Assets
ASSETS UNDER MANAgEMENT AND ASSETS UNDER ADMINISTRATION
The $32.4-billion increase in the Caisse’s assets under management and assets under administration in 2012 was due primarily to the acquisition by MCAP, a subsidiary of Otéra Capital, of a controlling interest in MCAP Services Corporation (MSC). MSC administers slightly more than $35 billion of Canadian residential mortgages.
NET INVESTMENT RESULTS
In 2012, the Caisse recorded net investment results of $14.9 billion, versus $5.7 billion the previous year (see Table 31). Net investment results were therefore positive and up from 2011. The main driver of the increase was the performance of equity markets and private equity, which together generated $8.8 billion of total results for the Equity asset class, or 59% of net investment results.
The favourable results achieved in 2012 are also attributable to the Inflation-Sensitive Investments and Fixed Income asset classes as well as to the AbTN portfolio, which contributed $2.5 billion, $2.3 billion and $1.7 billion, respectively. More specifically, the results for the AbTN portfolio were due to improved market values of the positions held, owing to the approaching average maturities of securities in the portfolio and a narrowing of credit spreads on the underlying assets.
The analysis of operating expenses and external management fees is presented on page 126.
DEPOSITORS’ NET DEPOSITS (WIThDRAWALS)
As at December 31, 2012, depositors’ total net deposits of $2.3 billion were mainly attributable to contributions by the Retirement Plans Sinking Fund, the Generations Fund and four new depositors.
RESULTS AND chANgES IN DEPOSITORS’ NET ASSETS AND TOTAL ASSETS UNDER MANAgEMENT (for years ended December 31 - in millions of dollars)
2012 2011
Investment income 5,590 5,142
Less:
Operating expenses 284 269
Net investment income 5,306 4,873
Gains (losses) on the sale of investments 2,454 (495)
Total realized income 7,760 4,378
Unrealized increase in value of investments and liabilities related to investments 7,177 1,368
Net investment results 14,937 5,746
Depositors' net deposits 2,308 1,477
Increase in depositors' net assets 17,245 7,223
Depositors' net assets, beginning of year 158,965 151,742
Depositors' net assets, end of year 176,210 158,965
Liabilities (primarily assets financed by borrowing) and non-controlling interests 37,590 32,323
Depositors’ total assets 213,800 191,288
Assets under management 7,423 8,731
Assets under administration 37,913 4,159
Assets under management and assets under administration 45,336 12,890
Total assets under management 259,136 204,178
TAbLE 31

CAISSE DE DÉPÔT ET PLACEMENT DU QUÉBEC AR 2012 43
RISK MANAgEMENT AT ThE cAISSE IN 2012
The markets again experienced turbulent periods in 2012 because of financial, economic and political uncertainty in the eurozone and the United States. Even so, action by the central banks to inject liquidity into the markets, as well as an upturn in manufacturing and real estate in the United States, helped create a more positive outlook for the global economy (see Macroeconomic Environment, p. 18).
Despite the more positive outlook, several major risks must be considered over the longer term:
• The economic and fiscal situation in Europe continues to be a source of important concern. The United States also faces problems related to the debt ceiling and political disagreement over ways to address this issue. These situa-tions could affect bond yields and the markets generally.
• It is increasingly clear that substantial changes are taking place in North America’s energy landscape. In 2012, natural gas touched a record low of less than $2 a unit, and the price spread between Alberta crude (WCS) and Texas crude (WTI) widened, with Canadian oil trading at a discount of almost $40 a barrel toward year-end. The impacts on Canada’s energy sector (the stock market and the economy generally) were, and could continue to be, substantial.
• Interest rates remain at historic lows, and credit spreads have returned to levels comparable to their historical average. In such a context, investors targeting an absolute return could be tempted to sacrifice the credit quality of their portfolios by purchasing products offering a higher return, causing spreads to narrow further. Even though this phenomenon contributes to the performance of risk assets on a short-term horizon, it may create excesses if it lasts too long. The Caisse must therefore continue to closely monitor the markets for asset bubbles.
EVOLUTION Of RISK MEASURES
The substantial support provided by central banks, and the gradual reduction of systemic risks prompted the Caisse to reduce the rather defensive bias of the overall portfolio. The overall portfolio’s relative exposure to the equity markets went from an underweight position of more than $4 billion at the end of 2011 to an overweight position of $1.5 billion at the end of 2012. This change is the main reason for the evolution of the risk profile of the Caisse’s overall portfolio between the start and the end of 2012 (see Figure 32, p. 44).
In addition to greater relative exposure to the equity markets, the Caisse’s portfolio maintains its protection against an increase in interest rates. Despite this slightly procyclical positioning of the overall portfolio, its level of market risk continues to be moderate, from both active and absolute standpoints.
Risk Management
01 01 As aAs at December 31, 2012, the t December 31, 2012, the Caisse’s Caisse’s oveoverall risk profile rall risk profile
was generally comparable to the was generally comparable to the profile at year-end 2011.profile at year-end 2011.
02 02 The The Caisse made various Caisse made various improvements to its risk improvements to its risk
management processes and tools management processes and tools during the year.during the year.
03 03 The The Caisse created an Caisse created an Investment-Risk Committee Investment-Risk Committee
to further integrate risk management to further integrate risk management decisions and portfolio investment decisions and portfolio investment strategy.strategy.
HIGHLIGHTSHIGHLIGHTS

CAISSE DE DÉPÔT ET PLACEMENT DU QUÉBEC AR 2012 44
Risk ManagementRisk Management
Jan.2012
Feb.2012
March2012
April2012
May2012
June2012
July2012
Aug.2012
Sept.2012
Oct.2012
Nov.2012
Dec.2012
Dec.2011
31.8
31.6
31.4
31.2
31.0
30.8
30.6
30.4
30.2
30.0
29.8
5
4
3
2
1
0
-1
-2
-3
-4
-5
cAISSE MARKET RISK AND DEVIATION fROM ThE EQUITY MARKET bENchMARK
Absolute risk (%)
Exposure to equity markets ($b)
FIGURE 32E
xpo
sure
to e
qu
ity
mar
kets
($
b)
Ab
solu
te r
isk
(%)
MARKET RISK – AbSOLUTE1
(as a percentage of total net value of the asset class as at December 31)
Asset class 2012 2011
Fixed Income 9.1 9.0
Inflation-Sensitive Investments 39.8 41.5
Equity 46.8 47.1
Other Investments2 1.2 1.5
Overall 30.6 30.0
1. The VaR figures are for a 1,500-day horizon at a 99% level of confidence. The 2011 year-end levels have been recalculated to incorporate methodological improvements to the interest rate curves developed in 2012.
2. The risk of the Other Investments asset class is given as a percentage of the Caisse’s net assets. This asset class contains the Hedge Fund, AbTN and Asset Allocation portfolios.
TAbLE 33
MARKET RISK – AcTIVE1
(as a percentage of total net value of the asset class as at December 31)
Asset class 2012 2011
Fixed Income 1.4 1.1
Inflation-Sensitive Investments 12.9 16.2
Equity 5.4 4.6
Other Investments2 1.1 1.5
Overall 4.4 3.4
1. The VaR figures are for a 1,500-day horizon at a 99% level of confidence. The 2011 year-end levels have been recalculated to incorporate methodological improvements to the interest rate curves developed in 2012.
2. The risk of the Other Investments asset class is given as a percentage of the Caisse’s net assets. This asset class contains the Hedge Fund, AbTN and Asset Allocation portfolios.
TAbLE 34

CAISSE DE DÉPÔT ET PLACEMENT DU QUÉBEC AR 2012 45
Absolute and active market risk As at December 31, 2012, the market risk of the Caisse’s overall portfolio was slightly higher than the level as at December 31, 2011. Absolute risk went from 30.0% at the end of 2011 to 30.6% at the end of 2012. Active risk rose from 3.4% to 4.4% during the same period (see Tables 33 and 34 and Figure 35). Despite this slight increase, the overall portfolio’s market risk continues to be well below the levels observed from 2009 to 2010.
While the absolute risk of the Caisse’s overall portfolio has risen slightly, the absolute risk of the Inflation-Sensitive Investments, Equity and Other Investments has fallen. This contraflow phenomenon is due to greater exposure to asset classes that have been historically more volatile. In each of these classes, the investments are, however, less volatile or more diversified than they were in 2011.
The decrease in the absolute and active risks of Inflation-Sensitive Investments is due mainly to better diversification of the Infrastructure portfolio, as a result of a decrease in the investment in Heathrow Airport Holdings (HAH, formerly bAA) and the addition of new investments to the portfolio. The lower absolute risk of the Equity class is attributable to greater diver-sification of the Canadian Equity portfolio and gradual adoption in the Global Equity portfolio of a strategy that emphasizes quality securities whose historical volatility is less than that of the market index. Implementation of this strategy is also the
reason for the increase in active risk, because the portfolio’s construction diverges more from the composition of the index. This phenomenon should continue in 2013 with the implemen-tation of the Caisse’s strategic orientations. The decrease in absolute and active risk for the Other Investments class is due mainly to termination of transactions and the approaching maturities of the other securities in the AbTN portfolio.
Credit risk In 2012, the Caisse continued to reduce the bonds portfolio’s exposure to investments that have a rating below bbb- or are non-rated, as well as its exposure to debt securities issued by foreign companies. The decrease in credit risk exposure was offset by an increase in exposure to securities issued by Canadian provinces. On the whole, the level of credit risk was stable during the year.
The Caisse uses credit VaR to measure and monitor this risk. It also performs its own fundamental credit analyses.
Concentration riskThe size of some major investments was reduced in 2012, notably the stakes in Quebecor Media and Heathrow Airport Holdings (HAH, formerly bAA), which are held by the Private Equity and Infrastructure portfolios, respectively. These changes, combined with greater diversification in the Canadian Equity portfolio, helped reduce concentration risk during the year.
Dec.2012
June2009
Dec.2009
June2010
Dec.2010
June2011
Dec.2011
June2012
12
10
8
6
4
2
0 27
29
31
33
35
37
39
Act
ive
risk
Ab
solu
te r
isk
chANgES IN MARKET RISK MEASUREMENT SINcE 2009 (VaR 99%, risk measurements as a percentage)
Absolute risk – Overall
Absolute risk – benchmark
Active risk
FIGURE 35

CAISSE DE DÉPÔT ET PLACEMENT DU QUÉBEC AR 2012 46
Counterparty risk During the year, the credit quality of several counterparties with which the Caisse negotiates and conducts financial transac-tions continued to require special attention. Uncertainty over the economic, political and fiscal situation in Europe prompted the Caisse to maintain a low exposure to this risk and to monitor it actively.
Each day, the Caisse tracks a series of financial indicators for each of its counterparties. The counterparties’ financial health is also reviewed periodically by a group whose members are drawn from its risk team and the investment teams that specialize in the financial sector. Throughout the year, the Caisse actively managed changes in the credit quality of its counterparties while keeping this risk at a low level (see Figure 36).
Liquidity risk In a market context in which uncertainty and volatility were high, the Caisse and its real estate subsidiaries had $41 billion of liquidity as at December 31, 2012. This would enable the Caisse to respect its potential commitments, even in the event of a major market correction.
Risk ManagementRisk Management
chANgES IN EXPOSURE TO cOUNTERPARTY RISK 1(in billions of dollars)
Exposure without payments being offset
Exposure according to negotiated ISDA agreements2
Number of over-the-counter contracts (in thousands)
Dec
. 201
1
Jan.
201
2
Feb.
201
2
Mar
ch 2
012
Ap
ril 2
012
May
201
2
Jun
e 20
12
Jul
y 20
12
Aug
.201
2
Sep
t. 20
12
Oct
. 201
2
Nov
. 201
2
Dec
. 201
2
4.14.1
2.62.6
0.40.4
3.73.7
2.22.2
0.20.2
3.63.6
2.42.4
0.40.4
2.72.7
2.32.3
0.10.1
2.42.4 2.32.3
0.10.1
2.82.8
2.22.2
0.10.1
3.23.2
0.30.3
2.22.2
3.43.4
0.10.1
2.92.9
2.32.3
0.10.1
2.82.8
2.42.4
0.10.1
2.52.52.42.4
2.82.8
2.52.5 2.52.5
0.10.1
2.52.52.52.5
0.10.10.10.1
FIGURE 36
1. This figure excludes the counterparty risk incurred directly by the real estate subsidiaries and the hedges related to AbTNs.2. Under ISDA agreements, net exposure is gross exposure less the netting of amounts at risk and the exchange of collateral.

CAISSE DE DÉPÔT ET PLACEMENT DU QUÉBEC AR 2012 47
IMPROVEMENT Of RISK MANAgEMENT METhODOLOgIES AND TOOLS
Improvements in the quantitative analysis of risk Risk measurement tools play a double role: they are used for control purposes and also serve as portfolio management tools. Several initiatives were taken in 2012 to strengthen the Risk group’s ability to support the investment teams.
The Caisse developed the ability to further analyze its portfolio in terms of risk factors. This transversal project involved the investment teams, the Depositors and Strategic Initiatives team and the Risk group. A flexible approach has been adopted to quantify the portfolios’ exposures to one or more investable risk factors, such as the S&P 500 Index, Canadian 10-year bond yields or the USD-CAD exchange rate, which provides a synthetic, simplified view of the portfolio and can be used to calibrate portfolio hedging operations.
The Caisse also enhanced its oversight abilities of derivatives positions by developing additional monitoring tools.
To improve its ability to analyze risk, several changes were made to simplify and standardize risk measurement applications. These improvements reduced the operational risk related to production of risk measurements, reduced the production time, increased the reliability of the results and enhanced the risk analysis capability. In parallel, several initiatives were carried out, such as the use of new interest rate curves and geographic classification aimed at data quality. These initiatives improved the precision and reliability of the risk measurements as well as the risk analysis capability.
Improved modelling of the market risk of infrastructure investments To obtain an estimate that better reflects the market risk of the portfolio of private assets, in 2012 the Caisse began a funda-mental review of the methodology used for the Infrastructure portfolio. The specific aspects of each investment are now taken into account in risk modelling, with the result that market risk measurements are more precise and relevant. This project will continue in 2013, when this innovative approach will be applied to all investments in the Infrastructure portfolio.
Stress testsIn 2012, the risk teams, in co-operation with the economic analysis and asset allocation teams, continued to perform stress tests to model various scenarios and to quantify their potential impacts on the Caisse’s overall portfolio. Detailed analyses involving various scenarios and stress tests were completed for several major financial risks that could signifi-cantly affect the Caisse’s results.
Enhancement of credit analysesIn 2011, the Caisse decided to go forward and develop the high degree of expertise required to analyze its investments in the credit markets in greater detail and depth. This direction is based on the industry’s best practices, in particular those proposed by the Financial Stability Forum. In 2012, the Risk group put in place a new analytical framework, in co-operation with fixed income managers. Internal credit ratings based on stringent analysis of credit risk are now established for the most important investments.
Analysis of each depositor’s liquidity risk The Risk group continued to refine its ability to monitor liquidity risk by extending its analytical capability to treat each deposi-tor’s portfolio, while constantly enhancing its calculation methodology. This enabled the Caisse to respond to various requests from the depositors, mainly concerning the impact that a change in asset allocation would have on their liquidity risk.

CAISSE DE DÉPÔT ET PLACEMENT DU QUÉBEC AR 2012 48
REVIEW Of OVERSIghT AND PROcESSES
Investment-Risk CommitteeThe Caisse accelerated the integration of risk management into its investment operations in 2012 by creating an Investment-Risk Committee. The Committee’s activities are summarized on page 49. Their objective, in particular, is to create a culture of constructive criticism to ensure that investments and portfolio strategies are analyzed thoroughly.
Investment processesDuring the year, the investment processes of the various teams were reviewed with the objective of increasing the Risk group’s contribution throughout the processes. The main recommen-dations arising from this work include involving the Risk group further upstream, especially the business unit risk managers, and closer co-operation with the investment groups throughout the investment process.
Processes to manage enterprise risk The Caisse’s two subsidiaries, Ivanhoé Cambridge and Otéra Capital, put in place processes to manage enterprise risk, primarily to identify, analyze and mitigate the risks related to their operations more effectively.
Geopolitical riskAs part of the implementation of the Caisse’s strategic orienta-tions, the Risk group developed a new methodology to assess risks associated with emerging markets. The methodology addresses macroeconomic, legal, security and business-environment risks, which are often substantial in such countries. In concert with the investment teams, the Risk group performed in-depth analyses, including fieldwork in China and brazil, two priority countries.
Operational risksThe Operational Risk Committee, put in place last year, continued to co-ordinate the Caisse’s efforts to monitor and reduce its operational risks. The Committee placed priority on the main risks identified and ensured that they were analyzed and that mitigation measures were deployed. In this way the Caisse’s operational risks were reduced.
The mandate of the operational risk management team was redefined during the year to take into account work done by the other monitoring and oversight functions and to ensure better co-ordination of activities. The methodological work begun in 2011 continued to ensure better risk identification. Specific work concerning reputational risk was carried out, and the findings were submitted to the Operational Risk Committee.
OversightAn oversight framework and an investment policy were established for the new Global Quality Equity portfolio, covering the portfolio’s management as well as the security-approval process. This new portfolio is managed on the basis of absolute, rather than relative, risk and so a new type of oversight was implemented that meets this need, as well as new approaches to the management of publicly traded securities, as each position is now reviewed and analyzed in depth by an investment committee.
It is also worth noting that several existing investment policies were amended in 2012. For example, a relationship-based strategy was added to the Private Equity portfolio, and the investment strategy of the Hedge Fund portfolio has been refined. The investment policy of the Infrastructure portfolio was also revised, taking into account its sustained growth target and market conditions.
As part of the process to analyze new investment operations, more than 30 new financial instruments were reviewed. The analyses addressed operational and strategic impacts. This transversal work involves most of the Caisse’s units.
Risk ManagementRisk Management

CAISSE DE DÉPÔT ET PLACEMENT DU QUÉBEC AR 2012 49
ThE RISK-RETURN DIALOgUE
Risk management is inseparable from the investment and portfolio management processes. because the investment teams must consciously take risks to generate target returns, the risk-return relationship is an integral part of their activities. In this context, robust risk management is vital to ensure that the Caisse’s managers take calculated risks and control them effectively.
Risk management governance ensures the transparency of the Caisse’s investment operations. The aspects of accountability discussed at each meeting of the board’s Risk Management Committee include:
• the review of investments specified by the investment policies and the Integrated Risk Management Policy (IRMP);• the analysis of each portfolio’s risks in relation to the returns
obtained; and• the analysis of major concentrations and risk factors.
The risk-return reports, which are central to the Caisse’s approach, provide an in-depth analysis of the activities carried out, the results obtained and the related risk assessments. The risk and investment teams prepare the risk-return reports together, improving their quality and clarify them for the various stakeholders, including the Risk Management Committee. These reports serve to reinforce the risk-return dialogue at the Caisse.
The Investment-Risk Committee, a subcommittee of the Executive Committee, has a mandate to:
• review the Caisse’s overall portfolio strategy by: – revising the macroeconomic scenario monthly; – approving the overall strategy and the resulting
transactions;
• review the strategy by asset class by: – revising the strategic investment plans for each
specialized portfolio; – analyzing major market-related news and its potential
impact; – reviewing investment opportunities and determining
the need for analyses of future transactions; and
• approve major transactions by ensuring they are in line with the strategy adopted for the asset class and for the Caisse’s overall portfolio.
In this way, the Investment-Risk Committee promotes teamwork upstream from the investment process and stimulates constructive criticism. The issues identified by the Committee, such as major prospective risks or concentrations, are analyzed by multidisciplinary teams comprised of economists, portfolio managers and risk managers. Among the analyses are stress tests which are based on the Caisse’s major prospective risks and are used to assess their impact on the portfolios. The risk and investment teams also work together to ensure that risk limits are respected and that action plans are developed if adjustments are needed. The action plans are monitored in collaboration with the investment teams.
In this way, the investment and risk teams maintain a dialogue throughout the year. The support that the risk team gives the portfolio managers, along with constructive criticism, is part and parcel of the Caisse’s practices and strengthens its risk culture.
The risk management team is continuing to develop its approach to go “beyond measurement” to ensure sound oversight of risks while providing portfolio managers with advisory services that enhance the investment processes.

CAISSE DE DÉPÔT ET PLACEMENT DU QUÉBEC AR 2012 50
ThE RISK gOVERNANcE MODEL
To ensure rigorous risk management, the Caisse places priority on the three following areas:
• Knowledge and constructive criticism by: – monitoring major risk factors; – carrying out in-depth analyses of investments, the
portfolio and how investments are interrelated; – having constructive discussions between the teams
and within the Investment-Risk Committee on strategies and opportunities;
• Oversight and discipline through: – policies that reflect the risk management philosophy; – structured and shared risk management and
investment processes;
• Development of effective analytical methodologies with: – quantitative and qualitative tools that support risk
taking.
The purpose of the Risk group, which plays a key role in deploying this approach, is to:
• ensure a risk-return balance in the exercise of its second level of risk control;• procure effective risk management tools;• provide front-line risk management support to the portfolio
managers; and• promote a sound risk management culture.
The team’s objective is to be regarded as a reference for:
• the analysis of investment products;• transversal knowledge of portfolios and interrelations
between investments; and• transversal knowledge of the Caisse’s business functions to
ensure proactive management of operational risks.
Integrated Risk Management PolicyThe Caisse has adopted a global and centralized approach to risk management oversight in the form of the Integrated Risk Management Policy (IRMP).
The policy is reviewed regularly and is designed to foster a disci-plined risk management culture and stringent practices. More specifically, the IRMP defines risk management governance, sets the level of risk deemed acceptable to prevent excessive losses, aligns the level of risk with value-added objectives and aims to allocate risk effectively.
The IRMP is the cornerstone of risk oversight. It includes reporting mechanisms and describes different aspects of risk management, particularly:
• the guiding principles, namely the risk model and the independence of the support teams in integrated risk management;
• the organizational structure, the normative framework, gover-nance and sharing of responsibilities;
• the risk tolerance;
• limits on authorization of transactions and outsourcing of management;
• the Caisse’s overall concentration limits (related to issuers and emerging markets);
• the framework for new investment activities, outsourcing of management and use of derivative financial instruments; and
• the management of different types of risk.
Levels of risk management controlRisk management is ultimately the responsibility of the board of Directors. Even so, managers at all levels are required to incorporate risk management into their daily decision-making process. All employees of the Caisse and its mandataries must apply it in carrying out their duties.
Risk ManagementRisk Management

CAISSE DE DÉPÔT ET PLACEMENT DU QUÉBEC AR 2012 51
Governance of risk management is based on three levels of control:
Level 1 – The managers, who are primarily responsible for managing risks related to operations under their purview.
Level 2 – The Investment-Risk Committee, a subcommittee of the Executive Committee, assisted by the Risk group and the Compliance and Responsible Investment Team. The Operational Risk Committee (ORC), a subcommittee of the Executive Committee, assisted by the Risk group.
Level 3 – The board of Directors and its Risk Management and Audit Committees, in addition to Internal Audit.
To ensure the necessary objectivity and rigour, teams independent of the investment teams are responsible for defining and overseeing the IRMP and the investment policies of the specialized portfolios, while monitoring their application.
Investment policies and risk budgetsThe investment policies serve as the framework for the portfolio managers’ work. Each specialized portfolio has an investment policy that defines its investment philosophy, management style, investment universe, benchmark index, absolute-return or value-added objective and risk oversight, including concen-tration and risk limits.
A risk limit, or risk budget, is set for each specialized portfolio and the Caisse’s overall portfolio. The risk budget takes into account each portfolio’s absolute-return or value-added objective. For the Caisse’s overall portfolio, the risk limit reflects the diversification effect of all the specialized portfolios.
RISK MODEL
At the Caisse, the risk model is the basis used for the identi-fication, assessment and management of risks. It establishes a common language to ensure the various stakeholders can communicate effectively about risk management. The risk model also fosters stringent and exhaustive analysis of each risk. Ultimately, this process leads to the implementation of investment strategies that generate stable and sustained returns in line with depositors’ expectations.
This model divides the risks inherent in the Caisse’s operations into three broad categories: business risks, financial risks and operational risks (see Figure 37). Each category consists of subcategories to identify all possible risks accurately. Each risk requires a specific management approach.
RISKMODEL
Human resources
Process management
System management
Theft and fraud
Disaster
Compliance
LegalStrategic
Reputation
Market
Liquidity
Credit, concentration and
counterparty
BUSINESS
RIS
KS
OP
ER
AT
ION
AL
RIS
K
S
FINANCIAL RIS
KS
ThE cAISSE’S RISK MODEL
FIGURE 37

CAISSE DE DÉPÔT ET PLACEMENT DU QUÉBEC AR 2012 52
Business risksStrategic riskStrategic risk is the possibility that an event related to the practices or relationships of the Caisse, its subsidiaries or its employees will contravene its mission, culture and fundamental values.
Strategic risk is also related to the inadequacy of business strategies and deficiencies in the implementation of the Caisse’s strategic orientations. The Caisse will be exposed to strategic risk if its resources are not allocated according to its established priorities.
The Caisse manages this risk with a structured strategic planning process that involves all its units. Strategic orienta-tions are proposed by the Executive Committee, approved by the board of Directors and communicated to all employees. Annual business plans are then drawn up. The members of the board of Directors and of the Executive Committee receive a quarterly summary of the Caisse’s activities.
Reputational riskReputational risk is the possibility that an event related to the business practices or relationships of the Caisse, its subsi-diaries or its employees will adversely affect its image or cause the public to lose confidence in it. This risk could detract from the Caisse’s ability to achieve its objectives.
All directors, officers and employees are responsible for carrying out their activities so as to minimize reputational risk.
The Caisse manages and controls this risk through codes of ethics and professional conduct for directors, officers and employees, training programs, effective internal management and governance practices, and a set of policies and procedures, including its Policy on Responsible Investment. The Caisse also ensures that the information it provides internally and exter-nally is truthful and has been verified, and it aims to ensure that the public and the media gain a better understanding of its operations. The Caisse also monitors matters concerning it and issues public positions as necessary.
Financial risksMarket riskMarket risk is the risk of financial loss arising from changes in the value of financial instruments. The value of a financial instrument may be affected by changes in market variables, particularly interest rates, foreign exchange rates, share prices and commodity prices. The risk arises from the volatility of prices of financial instruments, which, in turn, result from the volatility of such market variables. The Caisse manages all market risks in an integrated manner. The main elements that give rise to risks such as sector, country and issuer are taken into account. To manage market risk, the Caisse may use derivative financial instruments that are traded on exchanges or directly with banks and securities dealers.
Value at riskThe Caisse measures market risk using a statistical technique known as value at risk (VaR). This technique, used by most investment firms and financial institutions, covers all the assets held by the Caisse. The Caisse determines the VaR for each instrument in its specialized portfolios and aggregates the information for the overall portfolio. Two types of risk are assessed: the absolute VaR of the Caisse’s benchmark portfolio and of overall portfolio, and the VaR of active management.
VaR is based on a statistical measurement of the volatility of the market value of individual portfolio positions and their corre-lations. VaR uses historical data to estimate the loss expected during a given period according to a predetermined confidence level. For example, with a 99% confidence level, VaR indicates a loss that should exceed this level in only 1% of cases.
One of the advantages of VaR is that it incorporates the risks of a wide range of investments into a single measurement, providing an overall risk measurement for a portfolio and even for a set of portfolios.
Risk ManagementRisk Management
CAISSE DE DÉPÔT ET PLACEMENT DU QUÉBEC AR 2012 53
The Caisse uses the historical simulation approach to assess VaR. This method is based primarily on the assumption that the fluctuation of securities observed during a given period can be used to infer future fluctuation of the securities. It requires historical data series for all the risk factors required to assess the returns on the instruments. In the absence of such historical data, especially for less liquid products, such as private equity and real estate, proxies and various mathematical models are used to calculate VaR. Historical data from 1,500 days of obser-vation of risk factors, such as variations in exchange rates, interest rates and financial asset prices, are used to assess the volatility of returns and the correlation between returns on various assets.
The results of calculations obtained with this methodology do not make it possible to estimate, on the basis of a specific event, the amount of the loss that a portfolio would incur if such an event recurred.
The methodology used by the Caisse estimates a portfolio’s risk by annualizing its potential daily loss, that is, by assuming that the amounts lost throughout the year will be reinvested to maintain the same level of risk. In summary, this methodology means that the effects on the portfolio of the most adverse events observed over a one-day horizon will be repeated several times a year.
It is inappropriate to make a connection between the calculation of VaR at 99% used by the Caisse and a specific historical event. This methodology is not intended for such an objective. It seeks to provide the Caisse’s managers with the means to assess and manage portfolio risk dynamically.
VaR measures risk under normal market conditions. Therefore, losses realized may greatly differ from VaR when the historically observed interrelationship between risk factors is disrupted.
because VaR is not designed to be used on its own, the Caisse uses complementary limits and measurements. In particular, the investment policies set concentration limits (region, sector, instrument, issuer, etc.) as well as loss limits.
Absolute risk and active riskThe same method is used to calculate the absolute risk of the Caisse’s benchmark portfolio and its overall portfolio.
The absolute risk of the benchmark portfolio is the result of the risk of the benchmark indexes related to the asset classes that make up the portfolio at a given date. For example, if the depositors choose to increase the weighting of bonds and to reduce the weighting of publicly traded equities in their benchmark portfolio, the risk will automatically decrease, given bonds’ lower volatility. The expected long-term absolute return will therefore also decrease.
The absolute risk of the overall portfolio is the result of the risk of the positions that make up the Caisse’s overall portfolio at a given date.
Active risk represents the possibility that the Caisse’s return will differ from the benchmark portfolio’s return owing to active management of its portfolio. The greater the active risk, the more the overall portfolio’s expected absolute return (see Figure 38, p. 54) will differ from the benchmark portfolio’s return.
The absolute risk of the Caisse’s benchmark portfolio and the active risk and the absolute risk of the overall portfolio are measured regularly and are subject to various limits.
Stress testsThe Caisse also uses stress tests to assess the losses of a specialized portfolio and the Caisse’s overall portfolio in extreme circumstances. The stress test is a risk measurement that complements VaR by estimating the impact of extreme circumstances on returns. Such circumstances have a low probability of occurring but are likely to give rise to substantial losses. Using different types of extreme scenarios, the stress test measures the loss of value of a position after a variation in one or more often interrelated risk factors, such as equity prices, interest rates, credit spreads, foreign exchange rates, commodity prices and market volatility.
Like VaR, a stress test agregates the risk of many positions in a single overall measurement, making it possible to analyze losses for a portfolio or for a set of portfolios, according to selected extreme scenarios.

CAISSE DE DÉPÔT ET PLACEMENT DU QUÉBEC AR 2012 54
credit, concentration and counterparty riskCredit riskCredit risk is the possibility of a loss of market value in the event that a borrower, an endorser, a guarantor or a counter-party does not honour its obligation to repay a loan or fulfill any other financial obligation, or experiences a deterioration of its financial position.
Credit risk analysis involves measuring the probability of default and the recovery rate on debt securities held by the Caisse as well as monitoring changes in the credit quality of issuers and groups of issuers1 whose securities are held in all the Caisse’s portfolios. In managing credit risk, the Caisse frequently monitors changes in the ratings issued by rating agencies and compares them with in-house credit ratings, whenever available. It also uses the credit VaR for its bond, Long Term bond, Real Return bond and Real Estate Debt portfolios.
Credit VaR is a statistical measurement that incorporates information on the current and potential creditworthiness of the issuers in a portfolio, their interrelations and the level of loss in case of default. This measurement therefore estimates potential losses over a given period in accordance with a specified confidence level. The Caisse assesses credit VaR over a one-year period with a 99% confidence level.
Concentration riskConcentration risk analysis measures the fair value of all the financial products related to a single issuer or group of issuers1 with similar characteristics (region, industry, credit rating).
Concentration limits have been established for each specia-lized portfolio, taking into account the investment philosophy and the risk tolerance. In addition, concentration limits for the Caisse’s overall portfolio, for each issuer and for emerging markets, have also been established.
Counterparty riskCounterparty risk is the credit risk from current or potential exposure related to the Caisse’s operations involving over-the-counter financial instruments.
Transactions involving derivatives are carried out with financial institutions whose credit ratings are established by recognized rating agencies and for which operational limits are set by senior management. Moreover, the Caisse enters into legal agreements based on the standards of the International Swaps and Derivatives Association (ISDA)2 to benefit from the netting of amounts at risk and the exchange of collateral to ensure the Caisse limits its net exposure to this credit risk.
1. A group of issuers is a set of issuers controlled by a parent company.2. ISDA promotes sound risk management practices and issues legal opinions on netting and collateral arrangements.
Risk ManagementRisk Management
cOMPONENTS Of ThE cAISSE’S RISK AND RETURN
+
=
+
=
FIGURE 38
CAISSE bENCHMARK PORTFOLIO
Absolute risk of Caisse benchmark portfolio
Return on benchmark indexes: beta ( )
ACTIVE MANAGEMENT Active risk Relative return: alpha ( )
CAISSE OVERALL PORTFOLIO
Absolute risk of the Caisse overall portfolio
Weighted average return on depositors’ funds

CAISSE DE DÉPÔT ET PLACEMENT DU QUÉBEC AR 2012 55
Current exposure to counterparty risk is measured daily under the legal agreement in effect. Potential exposure to counter-party risk is measured monthly.
Liquidity riskLiquidity risk is the possibility that the Caisse may not conti-nuously be able to fulfill undertakings related to its financial liabilities without having to obtain funds at abnormally high costs or being obliged to sell assets. It also corresponds to the risk that it may not be possible to sell investments rapidly or to invest without having a significant adverse effect on the price of the investment in question.
Compliance with preset rules is reviewed every month, in addition to the daily monitoring of liquidity. The Caisse simulates various scenarios to assess the potential impact of different market events on its liquidity position. The managers responsible assess the liquidity of the markets on which the Caisse’s financing operations are based. They also ensure the Caisse is active in different financial markets and maintains relationships with credit rating agencies that rate the Caisse as well as providers of capital.
Operational risksOperational risk corresponds to the risk of losses resulting from inadequacy or deficiency attributable to individuals, processes, systems or external events. Operational risk includes legal risk.
Identification, analysis and mitigation of operational risks rely on a monitoring process that is internal (compilation of incidents, use of indicators) as well as external, and on an assessment of the practices and controls in place.
human resources management riskThe risk related to human resources management includes such elements as recruiting and retention (recruiting and retaining competent, honest and motivated personnel), training (maintaining and developing employee competencies) and evaluating performance and compensation (ensuring fair, equitable and competitive compensation based on performance).
Process management riskThe risk arising from process management is related to the processes for input, settlement and tracking of transactions, and errors that may arise in the execution of the processes in place. In addition to internal causes, this risk may arise from the poor quality of services rendered by subcontractors, suppliers and business partners.
System management riskThe Caisse is exposed to a risk in the event of deficiency of its information technology infrastructure or computer systems. This deficiency may result from a breakdown or other malfunction that could cause delays or an interruption in opera-tions that is not caused by a disaster.
Theft and fraud riskThis is the risk of losses arising from intentional acts to defraud, to embezzle funds or to appropriate the assets of the Caisse or of its depositors.
Disaster riskDisaster risk is the risk of losses resulting from the interruption of business as a result of a natural or other disaster.
compliance riskCompliance risk corresponds to the risk of loss resulting from non-compliance with regulatory obligations, with policies and directives, or with professional and ethical standards and practices specific to the Caisse’s operations. It occurs in the event that the Caisse fails to fulfill its duties.
Legal riskLegal risk is related to the obligations and rights associated with the Caisse’s operations and the legislative framework under which they are carried out. Important aspects of legal risk are related to compliance with laws and regulations to which the Caisse and its management teams are subject. They also depend on the assurance that the agreements entered into by the Caisse accurately reflect the planned transactions and contain the appropriate provisions. Legal risk also refers to the risk of lawsuits that may affect the Caisse.

CAISSE DE DÉPÔT ET PLACEMENT DU QUÉBEC AR 2012 56
Compliance activities include oversight to ensure adherence to the depositors’ investment policies and the investment policies of the specialized portfolios, the Code of Ethics and Professional Conduct, the Language Policy and the Information Disclosure Policy.
INVESTMENT POLIcIES
An important aspect of the compliance programs involves certifying compliance with the depositors’ investment policies and the investment policies of the specialized portfolios. In 2012, certificates of compliance with these policies were issued to the depositors twice, on June 30 and December 31. Moreover, reports were developed to facilitate monitoring of compliance with the policies.
The Sentinel compliance tool was implemented for the Private Equity sector in 2012 after being deployed for all liquid-market and real estate investments in recent years.
cODE Of EThIcS AND PROfESSIONAL cONDUcT
Compliance personnel ensure the Caisse’s officers and employees abide by the Code of Ethics and Professional Conduct, which emphasizes the importance of appropriate conduct, taking into account the organization’s practices, respect for individuals and groups, and compliance with laws, regulations and policies applicable to the Caisse. The Code also includes a pre-approval process for employees’ personal transactions.
At the beginning of each year, all employees must complete declarations on compliance with the Code and the situation of their personal portfolios. Furthermore, they are obliged to report any situation they have reason to consider a breach of the Code.
In 2012, all employees were invited to take an interactive training course on the Code of Ethics and Professional Conduct. They also received a guide to the application of the Code, to facilitate their understanding of ethical issues and to illustrate, in a question-and-answer format, the principles they must respect.
The Code is available on the Caisse website (www.lacaisse.com) under the Governance tab.
Compliance
01 01 The The Sentinel compliance tool Sentinel compliance tool was deployed for the Private was deployed for the Private
Equity sector.Equity sector.02 02 All All employees were asked employees were asked
to take an interactive training to take an interactive training course on the Code of Ethics and course on the Code of Ethics and Professional Conduct.Professional Conduct.
03 03 The The Caisse created a standing Caisse created a standing committee to develop and committee to develop and
apply its Language Policy.apply its Language Policy.
HIGHLIGHTSHIGHLIGHTS

CAISSE DE DÉPÔT ET PLACEMENT DU QUÉBEC AR 2012 57
INfORMATION AccESS
The Caisse processes requests for access to documents under the Act respecting access to documents held by public bodies and the protection of personal information. In 2012, the Caisse processed six requests for document access within the legally prescribed time limit. Of the six requests, three were accepted in full and three were accepted in part. The requests concerned primarily documents on investments, sponsorship costs and travelling and representation expenses. None of the requests were subject to an application for review by the Commission d’accès à l’information.
LANgUAgE POLIcY
The Caisse complies with the requirements of the Charter of the French language and its Language Policy, which stipulates French as the daily language of work for all its employees. It considers the quality and use of French in its oral and written communication to be of paramount importance. In that context, it provides its employees with tools that contribute to the correct use of French, as well as a variety of reference works, including a lexicon that it developed on terminology specific to its own opera-tions. In 2012, the employee newsletter published approximately 20 articles on the proper use of expressions and idioms. In these articles, the Caisse also encouraged employees to use the tools and references available on the website of the Office québécois de la langue française. It also launched La pause linguistique, an electronic bulletin featuring advice on using the right word, exercises to develop language skills and word-related tips and tricks.
With the adoption of a new government policy on the use and quality of French in the public service, the Caisse reviewed its Language Policy to align it with government policy. The policy was submitted to the Office québécois de la langue française for approval.
Finally, early in 2012, the Caisse created a standing committee, comprising key people from various units of the organization, to develop and apply its Language Policy. During the year, the committee worked on such matters as changes to the Policy and an awareness campaign.
cOMPLAINT MANAgEMENT
The Caisse has designated Ginette Depelteau, Senior Vice-President, Compliance and Responsible Investment, to receive complaints and analyze them with all due attention. Complaints can be conveyed to her by phone (514 847-5901), fax (514 281-9334) or email ([email protected]).

CAISSE DE DÉPÔT ET PLACEMENT DU QUÉBEC AR 2012 58
CAISSE DE DÉPÔT ET PLACEMENT DU QUÉBEC AR 2012 59
Contribution to Québec’s Economic Development

CAISSE DE DÉPÔT ET PLACEMENT DU QUÉBEC AR 2012 60
Seek out and Seize the beSt buSineSS and inveStment opportunitieS
Serve aS a bridGe betWeen QuÉbeCCompanieS andGLobaL marketS
StrenGthen the next Generation of entrepreneuriaL and finanCiaL LeaderShip
BUILDINGBUILDINGSTRONGSTRONGQUÉBECQUÉBECCOMPANIESCOMPANIES
CAISSE DE DÉPÔT ET PLACEMENT DU QUÉBEC AR 2012 61
The Caisse: Firmly committed to Québec companies and Québec
A key investor in QuébecThe Caisse provides financing and business advice to promi-sing Québec companies at all stages of their development. They benefit from the Caisse’s one-of-a-kind approach: financing complemented by access to the Caisse’s business networks in Québec and abroad, business advice from finance and management specialists, and opportunities to network with professionals and corporate directors highly regarded in their fields.
In recent years, the Caisse has undertaken many new initiatives in all regions of Québec, with emphasis on three types of action:
• Seek out and seize the best business and investment opportunities
• Serve as a bridge between Québec companies and global markets
• Strengthen the next generation of entrepreneurial and financial leadership
Accordingly, the Caisse strives to generate a return for its depositors and contribute to the growth of Québec’s companies and economy. These two aspects of its mission go hand in hand and allow the Caisse to best serve the interests of its clients, its partner companies and Québec as a whole.
Significant results for QuébecIn 2012, the Caisse continued to strengthen its presence and play its leading role in Québec. Its new commitments and investments amounted to $2.9 billion, and total assets reached $47.1 billion.
The Caisse has made $8.3 billion in new investments and commitments in Québec since 2009, and 540 Québec companies currently benefit from its support.
The Caisse’s action plan is based on the principles outlined in the statement on its contribution to Québec’s economic development (see page 74).
IN-DEPTHKNOWLEDGEOF QUÉBEC CRITICALMASS
LONG-TERMINVESTORROLE GLOBALREACH
>> >>>> >>
FOUR COMPARATIVE ADVANTAGES THAT BENEFIT THE MOST PROMISING COMPANIES
The Caisse draws on its distinctive strengths to invest in the market it knows best – Québec – and to support the growth of businesses at all stages of development.

CAISSE DE DÉPÔT ET PLACEMENT DU QUÉBEC AR 2012 62
totaL aSSetS in QuÉbeC
neW inveStmentS in and CommitmentS to QuÉbeC CompanieS in 2012, for a totaL of
$8.3 b$8.3 bSinCe 2009
$47.1 b
$2.9 b $2.9 b
inCreaSe in totaL aSSetS in QuÉbeC
$5.9 b$5.9 b
totaL aSSetS in QuÉbeC’S private SeCtor
$27.6 b
partner of more than 540 QuÉbeC CompanieS
540
The Caisse in Québec in 2012:Taking action for business growth
buiLdinGS in QuÉbeC
• MORE THAN 40 TOP-TIER propertieS
• ALMOST 400 MORTGAGE finanCinGS
440440

CAISSE DE DÉPÔT ET PLACEMENT DU QUÉBEC AR 2012 63
The Caisse’s achievements in Québec
inveStinG in SeCtorS We knoW WeLL
In 2012, the Caisse made many investments in Québec. At the end of the year, total assets stood at $47.1 billion, up $5.9 billion from the previous year (see Table 39).
Significant increase in the private sectorMost of the increase occurred in the private sector, where investments were up by $5.1 billion, reflecting the Caisse’s commitment to Québec’s companies – the engine of the province’s economic growth and job creation.
To facilitate an understanding of the Caisse’s investments in Québec, Table 39 presents its total assets by investment type: bonds, investments by the Real Estate group, publicly traded equities and investments by the Private Equity group (including infrastructure). In 2012, total assets increased in each of these classes.
Seek out and seize the best business and investment opportunities
CaiSSe totaL aSSetS in QuÉbeC by inveStment type(as at December 31 – in billions of dollars)
2012 2011
Bonds 27.7 25.7
Real Estate group 9.0 7.6
Equity Markets 4.7 3.3
Private Equity group 5.7 4.6
total 47.1 41.2
Private sector 27.6 22.5
Public sector 19.5 18.7
total 47.1 41.2
TABlE 39

CAISSE DE DÉPÔT ET PLACEMENT DU QUÉBEC AR 2012 64
The Caisse’s achievements The Caisse’s achievements in Québecin Québec
BONDSBONDS a key roLe in private and pubLiC finanCinG
The Caisse’s total assets of bond securities issued by Québec’s public and private sectors totalled $27.7 billion as at December 31, 2012, up $2.0 billion from the previous year (see Table 40).
The Caisse plays an active role in the financing of private-sector businesses by providing loans or buying bonds. For many Québec companies, the Caisse is a long-standing partner that has participated in the financing of their various growth initiatives.
As at December 31, 2012, the Caisse’s total assets in the private sector stood at $8.2 billion, up $1.2 billion from the previous year.
The Caisse also plays a key role in the financing of Québec’s public bodies, by providing liquidity to this critical market. As at December 31, 2012, in addition to Québec government bonds, the Caisse held $9 billion of Québec public-sector bonds.
CaeThe Caisse has a $50-million stake in The Caisse has a $50-million stake in a private financing of approximately a private financing of approximately $350 million in this global leader in $350 million in this global leader in modelling, simulation and training for modelling, simulation and training for civil aviation and defence. The Caisse’s civil aviation and defence. The Caisse’s support allowed CAE to continue support allowed CAE to continue diversifying its products and services diversifying its products and services so as to extend its reach and enhance so as to extend its reach and enhance its competitiveness in global markets.its competitiveness in global markets.
TABlE 40
aSSetS in QuÉbeC – bondS(as at December 31 – in billions of dollars)
2012 2011
Québec public sectorGovernment of Québec 10.5 9.7
Hydro-Québec 5.6 5.6
Other crown corporations 2.3 2.1
Municipalities and para-governmental corporations 1.1 1.3
Subtotal 19.5 18.7
private sector: corporate securities 8.2 7.0
total 27.7 25.7

CAISSE DE DÉPÔT ET PLACEMENT DU QUÉBEC AR 2012 65
REAL ESTATE REAL ESTATE TOP-TIER PROPERTIES
The Caisse is well established in the real estate sector through its Ivanhoé Cambridge and Otéra Capital subsidiaries. It has been investing in this sector since 1967 and has become one of the largest real estate investors in Québec, with total assets of $9.0 billion as at December 31, 2012 (see Table 41).
The Caisse has built a portfolio of high-quality properties that symbolize Québec’s economic growth, such as Place Ville Marie in Montréal, and the province’s outstanding architec-tural heritage, such as the Château Frontenac and the Édifice Price in Québec City. At year-end, the Caisse owned more than 40 buildings in Québec, including 24 shopping centres and 12 office buildings, worth a total of $5.9 billion. The Caisse has real estate holdings from one end of the province to the other, with $700 million of the assets outside Québec’s major cities. Furthermore, in 2012 more than $500 million of new real estate investments was authorized.
Through its operations, Ivanhoé Cambridge helps maintain a pool of high-level expertise in Québec in all the real estate disci-plines, including asset management, property development, leasing and operations.
Actively lending in QuébecThrough its Otéra Capital subsidiary, the Caisse is one of Québec’s largest mortgage lenders, providing $3.1 billion of financing for almost 400 properties. In 2012, it financed close to $1 billion of commercial mortgages in Québec.
Table 42 presents the Real Estate group’s top 10 Québec investments.
PLACE STE-FOY AND GALERIES RIVE-NORDIvanhoé Cambridge invested $225 million to buy out its Ivanhoé Cambridge invested $225 million to buy out its partner and become the sole owner of two shopping centres: partner and become the sole owner of two shopping centres: Place Ste-Foy in Québec City and Galeries Rive-Nord in Place Ste-Foy in Québec City and Galeries Rive-Nord in Repentigny.Repentigny.
GaLerieS d’anjouIn partnership with Cadillac Fairview, Ivanhoé Cambridge In partnership with Cadillac Fairview, Ivanhoé Cambridge invested $86 million in Galeries d’Anjou, where an invested $86 million in Galeries d’Anjou, where an extensive expansion and renovation project will include extensive expansion and renovation project will include a 100,000-square-foot Simons store.a 100,000-square-foot Simons store.
neW offiCe buiLdinG in LavaLIvanhoé Cambridge invested $30 million to build a six-story Ivanhoé Cambridge invested $30 million to build a six-story office building on the Centropolis site in the heart of office building on the Centropolis site in the heart of downtown laval. The 3055 Saint-Martin Ouest, is one of downtown laval. The 3055 Saint-Martin Ouest, is one of the largest construction projects of the past five years.the largest construction projects of the past five years.
reaL eState Group aSSetS and CommitmentS in QuÉbeC(as at December 31 - in millions of dollars)
2012 2011
assetsundisbursed
commitmentsassets and undisbursed
commitments AssetsUndisbursed
commitmentsAssets and undisbursed
commitments
Retail 3,871 51 3,922 3,280 89 3,369
Offices 3,603 245 3,848 3,254 129 3,383
Other 1,533 181 1,714 1,021 127 1,148
total 9,007 477 9,484 7,555 345 7,900
TABlE 41
top 10 QuÉbeC inveStmentS –reaL eState Group (as at December 31, 2012)
700 De la Gauchetière, Montréal
Centre CDP Capital, Montréal
Centre Eaton de Montréal, Montréal
Fairview Pointe-Claire, Pointe-Claire
Galeries d'Anjou, Montréal
laurier Québec, Québec
le 1000 De la Gauchetière, Montréal
Place Ste-Foy, Québec
Place Ville Marie, Montréal
Rockland, Mont-Royal
TABlE 42

CAISSE DE DÉPÔT ET PLACEMENT DU QUÉBEC AR 2012 66
SMALL CAPS SMALL CAPS
AN ADDITIONAL AN ADDITIONAL $150 MILLION $150 MILLION TO STRENGTHENTO STRENGTHENQUÉBEC’SQUÉBEC’SSMALL CAPS SMALL CAPS
Since 2011, the Caisse’s investment teams have had an amount specifically Since 2011, the Caisse’s investment teams have had an amount specifically allocated to Québec’s publicly traded small caps. In the spring of 2012, the Caisse allocated to Québec’s publicly traded small caps. In the spring of 2012, the Caisse increased this amount from $50 million to $200 million to continue supporting the increased this amount from $50 million to $200 million to continue supporting the growth of promising and profitable Québec businesses destined to become world-growth of promising and profitable Québec businesses destined to become world-class corporations. class corporations.
SenSioWith a $1.8-million investment, the Caisse supported this Québec company in With a $1.8-million investment, the Caisse supported this Québec company in connection with the technology-marketing phase for processing stereoscopic connection with the technology-marketing phase for processing stereoscopic images. SENSIO sells its technologies under licences while providing quality images. SENSIO sells its technologies under licences while providing quality content to support them. content to support them.
EQUITY MARKETS EQUITY MARKETS faCiLitatinG the GroWth of QuÉbeC’S pubLiCLy traded CompanieS
Québec companies accounted for $4.7 billion of the Canadian Equity portfolio as at December 31, 2012. These holdings are up by almost $1.4 billion from the previous year and by $2.6 billion since the end of 2009.
This growth demonstrates the Caisse’s intention to capitalize on the significant comparative advantage offered by its proximity to and close relationships with local companies, and the extensive knowledge of the Québec market that it has developed as a result. Table 43 lists the Caisse’s top 10 positions in Québec.
Since March 2011, the benchmark index of the Canadian Equity portfolio has included the Morningstar National Bank Québec Index, which is comprised exclusively of Québec companies. In 2012, the portfolio’s weighting of Québec securities increased 2.3%, reaching 23.3% at year-end. By way of comparison, Québec companies represented 12.7% of the S&P/TSX Index. This overweight position reflects the Caisse’s deep knowledge of the Québec market and its confidence in Québec businesses.
The Caisse also continued to support the growth of Québec’s publicly traded small caps. In 2012, it added $150 million to the amount allocated to the Québec Small Cap mandate, created in 2011. For such businesses, access to public capital markets is often the key to growth.
The Caisse’s achievements The Caisse’s achievements in Québecin Québec
top 10 QuÉbeC poSitionS – eQuity marketS(as at December 31, 2012)
Bombardier
Canadian National Railway Company
CGI Group
Dollarama
Gildan Activewear
National Bank of Canada
Power Corporation of Canada
Rona
Saputo
SNC-lavalin Group
TABlE 43
CAISSE DE DÉPÔT ET PLACEMENT DU QUÉBEC AR 2012 67
MID-SIZED AND MID-SIZED AND LARGE COMPANIES LARGE COMPANIES
CONCRETESUPPORT FORQUÉBEC’SMID-SIZED ANDLARGE COMPANIES
CamopLaSt SoLideaLThe Caisse increased from 23.8% to The Caisse increased from 23.8% to 28.3% its stake in this global leader in 28.3% its stake in this global leader in the design, manufacture and distrithe design, manufacture and distri--bution of tires, rubber tracks and bution of tires, rubber tracks and traction systems for the off-road-traction systems for the off-road-vehicle market. The Caisse has thereby vehicle market. The Caisse has thereby reaffirmed its support for Camoplast reaffirmed its support for Camoplast Solideal.Solideal.
CGiThe Caisse invested $1 billion in The Caisse invested $1 billion in the global information technology the global information technology leader CGI when it acquired logica leader CGI when it acquired logica PlC, a British company. After more PlC, a British company. After more than 70 successful acquisitions, CGI than 70 successful acquisitions, CGI more than doubled its size with this more than doubled its size with this transaction, becoming the world’s transaction, becoming the world’s fifth-largest IT player.fifth-largest IT player.
ENVIRO-VIRIDIS deveLopment CorporationThe Caisse committed $12.5 million The Caisse committed $12.5 million to Enviro-Viridis, a Montréal-area to Enviro-Viridis, a Montréal-area company that specializes in waste and company that specializes in waste and recycling management. The investment recycling management. The investment will allow the company to pursue will allow the company to pursue growth opportunities, in particular growth opportunities, in particular through acquisitions in its industry.through acquisitions in its industry.
innerGex reneWabLe enerGy inC.The Caisse acquired a block of shares The Caisse acquired a block of shares of almost $100 million in this leading of almost $100 million in this leading Canadian renewable-energy producer. Canadian renewable-energy producer. The investment contributed to the The investment contributed to the company’s acquisition of a 70% interest company’s acquisition of a 70% interest in a Québec power plant and a wind in a Québec power plant and a wind power project in British Columbia. power project in British Columbia. The Caisse is a long-standing partner The Caisse is a long-standing partner of Innergex, having made its first of Innergex, having made its first investments in 1995.investments in 1995.
maetta SCienCeSThe Caisse contributed $3.25 million The Caisse contributed $3.25 million of a $6.5-million investment made in of a $6.5-million investment made in partnership with the Fonds de solidarité partnership with the Fonds de solidarité FTQ. Maetta Sciences manufactures FTQ. Maetta Sciences manufactures implants and medical instruments as implants and medical instruments as well as parts for the aerospace industry, well as parts for the aerospace industry, and the Caisse has been its partner and the Caisse has been its partner since 2006.since 2006.
finLoC 2000The Caisse extended a $5-million The Caisse extended a $5-million loan to this company, which provides loan to this company, which provides financial services to businesses, financial services to businesses, specifically the financing of rolling specifically the financing of rolling equipment. The investment will allow equipment. The investment will allow Finloc 2000 to offer its expertise to Finloc 2000 to offer its expertise to more independent contractors, thereby more independent contractors, thereby contributing to the growth of Québec’s contributing to the growth of Québec’s manufacturing sector.manufacturing sector.
Groupe moreauThe Caisse provided a $5.4-million loan The Caisse provided a $5.4-million loan to this established Abitibi business to this established Abitibi business with cutting-edge expertise in natural with cutting-edge expertise in natural resources. The Caisse’s support will resources. The Caisse’s support will allow it to extend its reach across allow it to extend its reach across Québec and explore markets in the rest Québec and explore markets in the rest of Canada and ultimately the internaof Canada and ultimately the interna--tional arena.tional arena.
SSQ, Life inSuranCe Company inC.The Caisse made a $20-million The Caisse made a $20-million investment in SSQ, life Insurance investment in SSQ, life Insurance Company Inc., in addition to a Company Inc., in addition to a $30-million loan it had already $30-million loan it had already provided, for a total of $50 million. provided, for a total of $50 million. The investment will allow SSQ, a leader The investment will allow SSQ, a leader in Québec’s insurance and financial in Québec’s insurance and financial services industry, to continue growing services industry, to continue growing and pursue its strategic priorities.and pursue its strategic priorities.
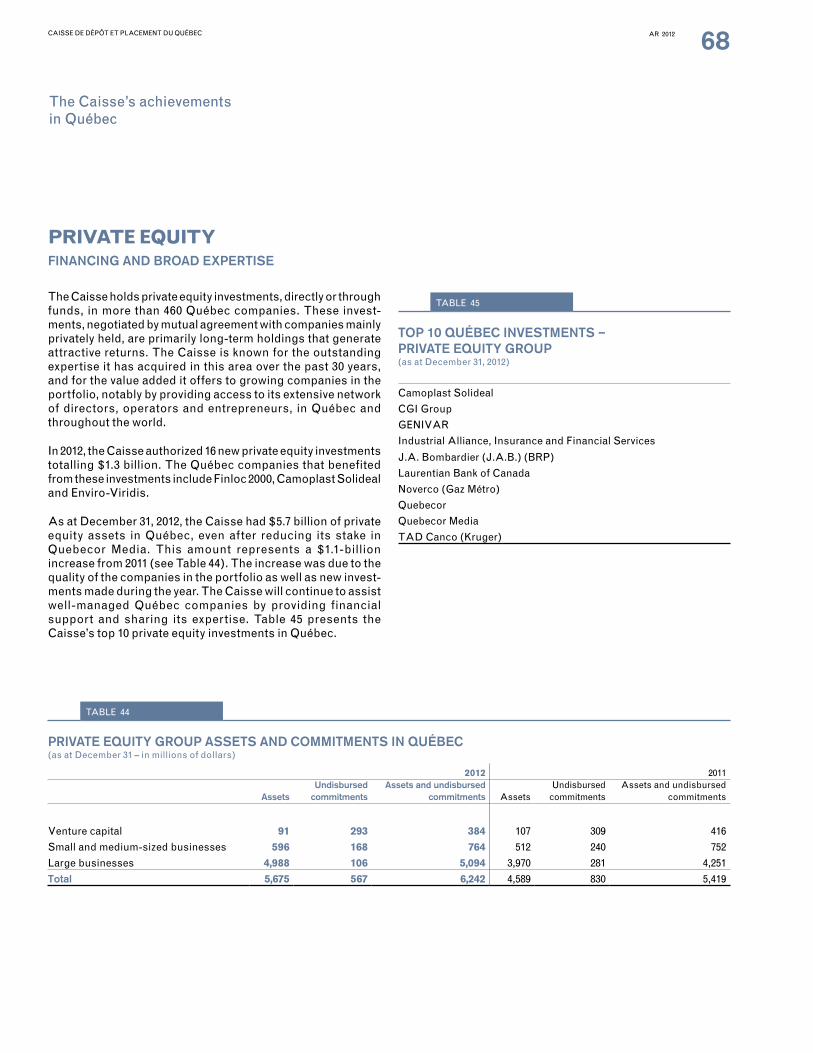
CAISSE DE DÉPÔT ET PLACEMENT DU QUÉBEC AR 2012 68
PRIVATE EQUITY PRIVATE EQUITY finanCinG and broad expertiSe
The Caisse holds private equity investments, directly or through funds, in more than 460 Québec companies. These invest-ments, negotiated by mutual agreement with companies mainly privately held, are primarily long-term holdings that generate attractive returns. The Caisse is known for the outstanding expertise it has acquired in this area over the past 30 years, and for the value added it offers to growing companies in the portfolio, notably by providing access to its extensive network of directors, operators and entrepreneurs, in Québec and throughout the world.
In 2012, the Caisse authorized 16 new private equity investments totalling $1.3 billion. The Québec companies that benefited from these investments include Finloc 2000, Camoplast Solideal and Enviro-Viridis.
As at December 31, 2012, the Caisse had $5.7 billion of private equity assets in Québec, even after reducing its stake in Quebecor Media. This amount represents a $1.1-billion increase from 2011 (see Table 44). The increase was due to the quality of the companies in the portfolio as well as new invest-ments made during the year. The Caisse will continue to assist well-managed Québec companies by providing financial support and sharing its expertise. Table 45 presents the Caisse’s top 10 private equity investments in Québec.
The Caisse’s achievements The Caisse’s achievements in Québecin Québec
private eQuity Group aSSetS and CommitmentS in QuÉbeC(as at December 31 – in millions of dollars)
2012 2011
assetsundisbursed
commitmentsassets and undisbursed
commitments AssetsUndisbursed
commitmentsAssets and undisbursed
commitments
Venture capital 91 293 384 107 309 416
Small and medium-sized businesses 596 168 764 512 240 752
large businesses 4,988 106 5,094 3,970 281 4,251
total 5,675 567 6,242 4,589 830 5,419
TABlE 44
top 10 QuÉbeC inveStmentS – private eQuity Group (as at December 31, 2012)
Camoplast Solideal
CGI Group
GENIVAR
Industrial Alliance, Insurance and Financial Services
J.A. Bombardier (J.A.B.) (BRP)
laurentian Bank of Canada
Noverco (Gaz Métro)
Quebecor
Quebecor Media
TAD Canco (Kruger)
TABlE 45

CAISSE DE DÉPÔT ET PLACEMENT DU QUÉBEC AR 2012 69
deSjardinS Group: fueLLinG the momentum of QuÉbeC’S reGionS
In 2010, the Caisse entered into a partnership with Desjardins Group, a financial institution that is highly integrated into Québec’s social and economic fabric. The purpose of the agreement is to support the development and growth of Québec SMEs. Its first component is the $200-million Capital Croissance PME fund created to meet the financing needs of small businesses. The second component has earmarked $400 million for successful medium-sized businesses with solid growth and profitability prospects.
teraLyS: ContributinG to a dynamiC venture CapitaL induStry
In 2009, the Caisse took part in the creation of the Teralys Capital Fund with a $250-million commitment. The fund has a mandate to develop and support venture capital funds and therefore develop strong technology companies in Québec. Teralys was very active in 2012: it authorized $220 million of investments in venture capital funds. It is currently the largest fund of funds in Canada.
The Caisse as a catalystThe Caisse also contributes to the vitality of the venture capital industry as a major partner in 12 investment funds, for a total commitment of $230 million. At the end of 2012, these funds had $375 million of authorized commitments in Québec. The Caisse’s contribution has prompted other investors to inject more than $1 billion of additional financing, representing a multiplier effect of about five times the Caisse’s initial commitment. In this way, the Caisse acts as a catalyst for the venture capital industry.
QuÉbeC manufaCturinG fund: SupportinG manufaCturerS
The Caisse created the Québec Manufacturing Fund (QMF) in 2006 with a $100-million investment. The QMF helps Québec’s manufacturing sector grow by investing in businesses with $20 million to $100 million of annual revenues.
Through the QMF’s investments and operational support, businesses can position themselves effectively to compete in global markets. In 2012, the QMF pursued its mission by supporting many companies as they developed strategic priorities, action plans and optimization solutions.
Sodemex mininG fund: inveStinG in a promiSinG SeCtor
Since 1997, the Caisse has been the sole owner of the Sodemex fund, which comprises small cap Québec mining companies in the exploration phase. It represents close to $50 million of investments and has interests in more than 60 companies with market capitalizations below $500 million.
DEVELOPING SMEDEVELOPING SMEss THROUGH PARTNERSHIPS THROUGH PARTNERSHIPSPromising SMEs are found everywhere in Québec, in all of its industries. In addition to providing know-how and financial support, the Caisse supports their growth by developing partnerships and creating investment funds with other key actors in Québec.
SUCCESSFUL SUCCESSFUL AGREEMENT AGREEMENT FOR SMEFOR SMEss
Since 2010, more than 130 Québec businesses have received a total of $308 million Since 2010, more than 130 Québec businesses have received a total of $308 million in financial support. In 2012, the Caisse and Desjardins Group invested $55 million in financial support. In 2012, the Caisse and Desjardins Group invested $55 million in more than 60 SMEs in every region of Québec.in more than 60 SMEs in every region of Québec.
CAISSE DE DÉPÔT ET PLACEMENT DU QUÉBEC AR 2012 70
inveStinG in the internationaL GroWth of QuÉbeC CompanieS
The Caisse is of the view that Québec’s economic growth and wealth creation depend largely on the ability of its companies to carve out a place in global markets and to increase their exports. Today, competition, much like business opportunities, comes from the four corners of the globe.
Québec has the ability to meet this challenge, and the Caisse can play a major role – as a bridge to the world – for Québec companies with the potential to conquer global markets.
The Caisse serves promising Québec companies by taking advantage of its international reach, investing in global markets, foreign business networks and expertise in new markets. Its goal is to support their growth projects so that they can become champions in the international arena – for the benefit of Québec as a whole.
This bridge-to-the-world vision is achieved not only with investments, but also with networking opportunities that may lead to partnerships and with forums on best practices to successfully deal with the challenges of globalization.
Serve as a bridge betweenQuébec companiesand global markets
QUÉBECQUÉBECBUSINESSESBUSINESSESCOMPETING COMPETING IN THE GLOBALIN THE GLOBALMARKETPLACEMARKETPLACE
CGiThe Caisse was involved The Caisse was involved in CGI’s international in CGI’s international expansion project, providing expansion project, providing $1 billion as the company $1 billion as the company made its largest acquimade its largest acqui--sition ever – the purchase sition ever – the purchase of logica PlC, a British of logica PlC, a British company. CGI is now the company. CGI is now the world’s fifth-largest player in world’s fifth-largest player in the information technology the information technology sector.sector.
GenivarIn August 2012, Genivar In August 2012, Genivar acquired the British acquired the British company WSP Group to company WSP Group to become one of the largest become one of the largest consulting engineering firms consulting engineering firms in the world. The Caisse in the world. The Caisse supported the firm with a supported the firm with a $98.5-million investment $98.5-million investment related to this major internarelated to this major interna--tional transaction.tional transaction.
novateChThe Caisse invested close The Caisse invested close to $17 million in Novatech, to $17 million in Novatech, a company specialized in a company specialized in the manufacture of steel the manufacture of steel door panels, door glass door panels, door glass and patio doors. With an and patio doors. With an established presence in established presence in global markets, the company global markets, the company was looking for a way to was looking for a way to enter the Asian market. The enter the Asian market. The Caisse supported Novatech Caisse supported Novatech in taking steps to organize a in taking steps to organize a meeting with a specialist in meeting with a specialist in business practices relevant business practices relevant to this market.to this market.
The Caisse’s achievements The Caisse’s achievements in Québecin Québec

CAISSE DE DÉPÔT ET PLACEMENT DU QUÉBEC AR 2012 71
Sme paSSport
The Caisse is a partner in SME Passport, a training and support program launched in 2012 by the Board of Trade of Metropolitan Montreal and Québec International. The program is offered to businesses with the ambition and the potential to develop international markets. From the businesses that apply each year, 20 are selected to receive a complete range of services and activities designed to accelerate their international development. In addition to providing funding for the program, the Caisse offers the selected companies operational expertise and access to its business network.
hSbC
The Caisse and HSBC Bank Canada have joined forces to support promising investment projects, both here and internationally. In 2012, their partnership provided two Québec companies, Groupe Moreau and Bariatrix Nutrition Inc., with made-to-measure financing to help them continue to grow and strengthen their positioning in their respective industries.
exportinG QuÉbeC – SmaLL buSineSS ConQuerinG the WorLd
The Caisse supports Exporting Québec – Small Business Conquering the World, an initiative of the World Trade Centre Montréal. This program emphasizes the most promising markets where Québec companies can develop international business. For each of the identified markets, small businesses are offered a series of activities based on the stage of their inter-national development, including seminars and talks, buyers meetings, trade missions and training workshops.
INITIATIVES THAT CONTRIBUTE TOINITIATIVES THAT CONTRIBUTE TO THE INTERNATIONAL SUCCESS OF QUÉBEC SMETHE INTERNATIONAL SUCCESS OF QUÉBEC SMEssThe Caisse believes that SMEs active in global markets contribute to the growth of Québec’s regions. For that reason, it works with various economic actors to carry out initiatives customized to the needs of businesses starting up international expansion projects.

CAISSE DE DÉPÔT ET PLACEMENT DU QUÉBEC AR 2012 72
FOSTERING ENTREPRENEURSHIP AND BUSINESS SUCCESSION
The Caisse considers the next generation of entrepreneurial leadership essential to Québec’s economic development. It therefore takes part in initiatives to train the entrepreneurs of tomorrow and is associated with organizations and groups that promote entrepreneurship and help business owners carry out their projects.
Prêt à entreprendre: Supporting new entrepreneursWith other partners, including Desjardins Group, Québec’s Ministère des Finances et de l’Économie, the Fédération des chambres de commerce du Québec, the Fondation de l’entrepreneurship and its Réseau M – Mentorat pour entre-preneurs, and Quebecor, the Caisse has implemented Prêt à entreprendre, a support program for new entrepreneurs. This initiative supports the most promising entrepreneurs in all regions of Québec to give them better opportunities to succeed. The program provides financial support and access to ongoing mentoring and technical expertise. Twenty-one entrepreneurs have been selected to benefit from the program since June 2012.
Fondation de l’entrepreneurship: Surveying Québec entrepreneursSince 2009, the Caisse has supported the Fondation de l’entrepreneurship in its broad survey of Québec entrepre-neurs, called the Indice entrepreneurial québécois (IEQ), conducted in collaboration with léger Marketing. The 2012 edition of the survey revealed positive momentum in Québec entrepreneurship.
École d’Entrepreneurship de Beauce The Caisse is a major partner of the École d’Entrepreneurship de Beauce (EEB), an institution dedicated to training Québec’s next generation of entrepreneurs. The Caisse’s support includes an bursary program, including the Région éloignée de la Beauce (Beauce-remote region) bursary and the Création d’entreprise (business creation) bursary. Since the program was launched in the fall of 2010, the Caisse has awarded 10 bursaries worth a total of $105,000, allowing the recipients to pay a portion of their EEB tuition fees and to take advantage of this training program for entrepreneurs.
Groupement des chefs d’entreprise du QuébecThe Caisse supports the Groupement des chefs d’entreprise du Québec, an organization that supports Québec business owners at every stage of their companies’ development, with training, meetings and workshops on specific subjects. The Groupement des chefs d’entreprise du Québec is a unique mutual-support network that focuses above all on business owners, helping them grow personally and achieve greater success. Working with the Business Development Bank of Canada, National Bank and Royal Bank, the Caisse helped develop the Prosperity tool, an initiative to support the development of business owners and their successors in all regions of Québec.
Strengthen the next generation of entrepreneurial and financial leadership
The Caisse’s achievements The Caisse’s achievements in Québecin Québec

CAISSE DE DÉPÔT ET PLACEMENT DU QUÉBEC AR 2012 73
Collège des administrateurs de sociétésThe Caisse supports the Collège des administrateurs de sociétés affiliated with Université laval. The college designs professional development programs for directors, executives and business owners so that they will be better equipped for corporate governance. In partnership with McMaster University, it has developed a university-level governance certificate that is recognized across the country. Since the program was created in 2005, the certificate has been awarded to 505 members of more than 1,000 corporate boards. Finally, the college has expanded internationally under partnership agreements with the Institut Français des Administrateurs, in Paris, and the Institut Marocain des Administrateurs, in Rabat.
Québec Entrepreneurship ContestThe Caisse is a partner in the Québec Entrepreneurship Contest, an initiative begun in 1998. The contest has two categories, student entrepreneurship and business creation. It awards scholarships to budding entrepreneurs who are often at the stage of developing a business plan.
SUPPORTING INITIATIVES TO ENHANCE FINANCIAL EXPERTISE
Talent is vital for a dynamic financial industry. The Caisse firmly believes the industry must continue to invest in the development of a large pool of financial expertise. In 2012, it continued to share its expertise by forging even stronger links with universities so as to foster a new generation of financial talent.
Partnerships with universities, including business schools, are central to the Caisse’s approach. The following initiatives were taken in 2012:
• Financial support for an Université laval study on entrepreneurship;
• Financial support for the Fonds de placement HEC.
• Financial support for Concordia University’s portfolio management program and its sustainable development and responsible investment program.
• Financial support for an Université de Sherbrooke study on responsible investment.
• Support for the creation of a short post-graduate program in finance for engineers at the École de technologie supérieure.
• Presentations on careers in finance to about 200 students at six Québec universities.
• The hiring of 32 students and 13 interns.
In 2012, the Caisse created a committee to foster the next generation of women in finance. The committee has a mandate to propose initiatives to attract and retain more women in investment and management positions at the Caisse. Actions taken in 2012 include focus groups of Caisse professionals as well as training and conferences on the importance of diversity in management positions.
Supporting initiatives to strengthen Québec’s financial sectorThe Caisse’s contribution to Québec’s financial sector can be measured in a number of ways. First, it is worth noting that, of the $3.2 billion of banking transactions that the Caisse carries out each day, almost two-thirds are handled by banks and brokers in Québec.
Furthermore, the Caisse and its Real Estate group spend close to $580 million in Québec each year. These extensive operations require almost 2,000 Québec suppliers and help create or maintain many jobs in Québec, and also further the development of financial expertise. The Caisse’s Policy on Contracts for the Acquisition or leasing of Goods and Services also facilitates its contribution to economic development and sustainable development. The goal of this policy is to encourage Québec suppliers that meet the Caisse’s cost and quality criteria.
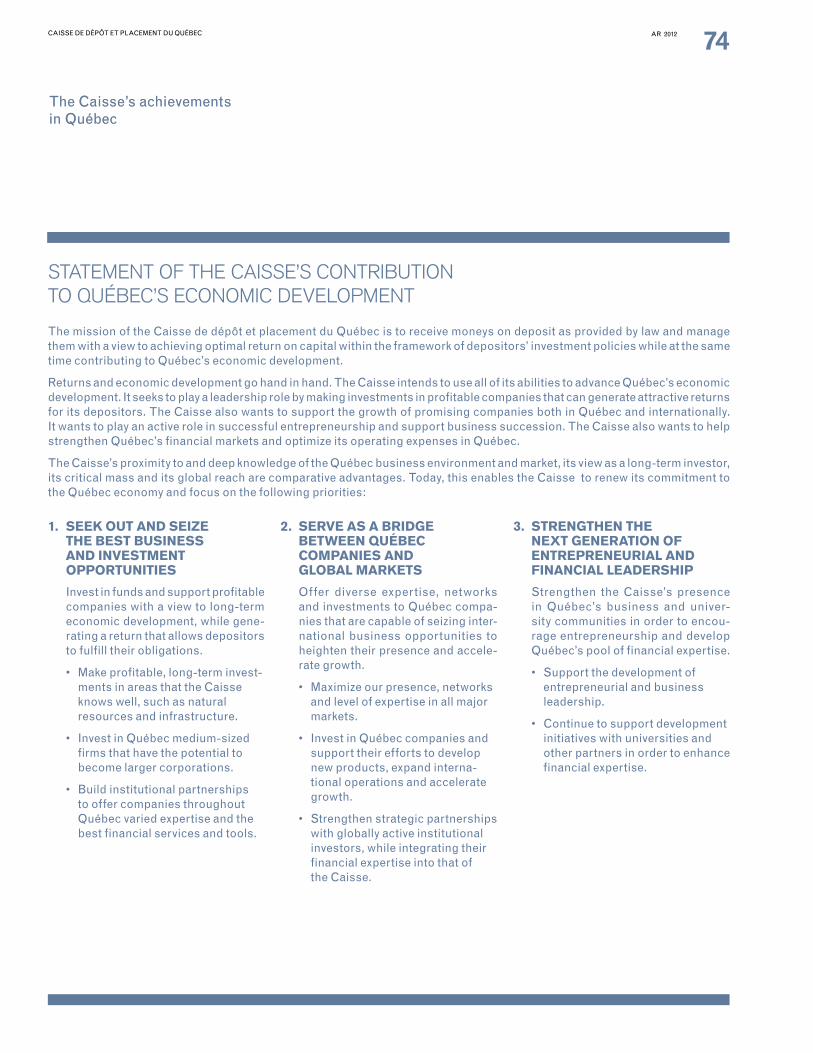
CAISSE DE DÉPÔT ET PLACEMENT DU QUÉBEC AR 2012 74
The mission of the Caisse de dépôt et placement du Québec is to receive moneys on deposit as provided by law and manage them with a view to achieving optimal return on capital within the framework of depositors’ investment policies while at the same time contributing to Québec’s economic development.
Returns and economic development go hand in hand. The Caisse intends to use all of its abilities to advance Québec’s economic development. It seeks to play a leadership role by making investments in profitable companies that can generate attractive returns for its depositors. The Caisse also wants to support the growth of promising companies both in Québec and internationally. It wants to play an active role in successful entrepreneurship and support business succession. The Caisse also wants to help strengthen Québec’s financial markets and optimize its operating expenses in Québec.
The Caisse’s proximity to and deep knowledge of the Québec business environment and market, its view as a long-term investor, its critical mass and its global reach are comparative advantages. Today, this enables the Caisse to renew its commitment to the Québec economy and focus on the following priorities:
1. SEEk OUT AND SEIzE THE BEST BUSINESS AND INVESTMENT OPPORTUNITIES
Invest in funds and support profitable companies with a view to long-term economic development, while gene-rating a return that allows depositors to fulfill their obligations.
• Make profitable, long-term invest-ments in areas that the Caisse knows well, such as natural resources and infrastructure.
• Invest in Québec medium-sized firms that have the potential to become larger corporations.
• Build institutional partnerships to offer companies throughout Québec varied expertise and the best financial services and tools.
2. SERVE AS A BRIDGE BETwEEN QUÉBEC COMPANIES AND GlOBAl MARkETS
Offer diverse expertise, networks and investments to Québec compa-nies that are capable of seizing inter-national business opportunities to heighten their presence and accele-rate growth.
• Maximize our presence, networks and level of expertise in all major markets.
• Invest in Québec companies and support their efforts to develop new products, expand interna-tional operations and accelerate growth.
• Strengthen strategic partnerships with globally active institutional investors, while integrating their financial expertise into that of the Caisse.
3. STRENGTHEN THE NExT GENERATION OF ENTREPRENEURIAl AND FINANCIAl lEADERSHIP
Strengthen the Caisse’s presence in Québec’s business and univer-sity communities in order to encou-rage entrepreneurship and develop Québec’s pool of financial expertise.
• Support the development of entrepreneurial and business leadership.
• Continue to support development initiatives with universities and other partners in order to enhance financial expertise.
STATEMENT OF THE CAISSE’S CONTRIBUTION TO QUÉBEC’S ECONOMIC DEVELOPMENT
The Caisse’s achievements The Caisse’s achievements in Québecin Québec

CAISSE DE DÉPÔT ET PLACEMENT DU QUÉBEC AR 2012 75
Responsible Investment

CAISSE DE DÉPÔT ET PLACEMENT DU QUÉBEC AR 2012 76
RESPONSIBLE INVESTMENT APPROACH
In making investments, the Caisse is guided by its mission, as well as by its depositors’ investment policies and concerns, particularly with respect to risk management and responsible investment.
The Caisse invests in shares of publicly traded and privately held companies, debt securities, real estate, infrastructure and other assets. These investments are managed actively, or passively through investments that replicate market indexes to reproduce their returns.
With its actively managed investments, the Caisse usually takes a long-term view. This approach gives it enough flexibility to foster responsible investment practices with an eye to returns for its depositors. The Caisse believes that if businesses manage environmental, social and governance factors (ESG factors) proactively and effectively, they are more likely to achieve sustainability and to create value over the long term.
The Caisse does not apply security selection criteria and does not exclude investments solely on the basis of ESG criteria. Furthermore, it occasionally makes investments in sectors considered controversial. In such cases, the Caisse applies the approach defined in its Policy on Responsible Investment. The policy is available on its website (www.lacaisse.com).
Responsible Investment Report
HIGHLIGHTS HIGHLIGHTS
01 01 IntIntegration of ESG criteria egration of ESG criteria into several asset classes. into several asset classes. 02 02 VotVoting at 4,807 shareholder ing at 4,807 shareholder
meetings. meetings. 03 03 TheTheme-based shareholder me-based shareholder engagement.engagement.
THE CAISSE’S RESPONSIBLE INVESTMENT APPROACH
Vision The Caisse is a responsible shareholder and acts in a fiduciary spirit to provide
risk-adjusted, long-term returns.
Policies Policy on Responsible Investment Policy on Principles Governing the Exercise of Voting Rights of Public Companies
Approach Integration of ESG criteria
Shareholder engagement
Exclusion
Activities Exercise of voting rights
Direct dialogue
Collaborative initiatives
Dialogue between stakeholders and industry
Risk analysis
Research
Review of individual cases
TAblE 46

CAISSE DE DÉPÔT ET PLACEMENT DU QUÉBEC AR 2012 77
The Caisse takes a three-pronged approach: it includes ESG criteria in its analysis of actively managed investments, it engages shareholders and it occasionally excludes specific securities from the overall portfolio or the actively managed portfolio.
1. Inclusion of ESG criteria: ESG criteria are taken into account in the overall analysis of an actively managed investment.
2. Shareholder engagement: The Caisse engages in a proactive dialogue with corporate executives. As an active investor, it carries out initiatives with the officers and directors of its investee companies so as to encourage them to address ESG criteria more effectively. Through these initiatives, the Caisse seeks to improve the level of corporate information available and to influence business practices. Shareholder engagement also includes making representations to regulatory authorities and exercising voting rights at share-holder meetings.
3. Exclusion: In exceptional circumstances, such as a violation of local or international law, the Caisse may exclude securities from its overall portfolio or its actively managed portfolio. Such cases are reviewed by an internal committee made up of employees from different units, including the investment teams.
Table 46 (p. 76) describes the Caisse’s approach to responsible investment.
2012 RESPONSIBLE INVESTMENT REPORT
The Caisse’s three-pronged Policy on Responsible Investment involved various initiatives in 2012.
1. Integration of ESG criteria Integration of ESG criteria into the various asset classes is important because the Caisse is a long-term investor that emphasizes active management. Such criteria are difficult to measure, however, because the information obtained is often non-financial and therefore difficult to quantify. Developing tools and conducting research are essential to help the portfolio managers take such criteria into account. Figure 47 provides an explanation of ESG criteria.
Integrating ESG criteria into asset classes Public markets When the Caisse makes an active-management decision on public markets, it considers ESG criteria in an overall analysis of the potential investment.
In 2012, the Caisse continued developing tools for the equity markets. It had already developed a fundamental analysis model and a tool for integrating ESG criteria into evaluations of investments in the mining sector to ascertain the related risks. The model was enhanced with the addition of a checklist for each investment sector. The checklist establishes an ESG risk profile for each industry sector and assigns a risk rating. Sector ratings are based on the Caisse’s Policy on Responsible Investment and specialized independent research, as well as on the experience and judgment of its managers and analysts. The sector ratings address each ESG risk and are submitted to the Caisse’s Responsible Investment Committee for approval.
FIGuRE 47
The degree to which the Caisse takes The degree to which the Caisse takes environmental, social and governance criteria environmental, social and governance criteria into account depends on the company, the into account depends on the company, the type of industry and the investment vehicle type of industry and the investment vehicle selected. These criteria are reviewed during selected. These criteria are reviewed during the analysis that precedes an investment the analysis that precedes an investment decision and at meetings with company decision and at meetings with company executives as issues arise.executives as issues arise.
Environmental criteriaInclude for example the impact of company activities on climate and greenhouse gas emissions, pollution, scarcity of resources and site rehabilitation.
Social criteriaInclude for example human rights, consent of local communities, working conditions, and health and safety.
Governance criteriaInclude for example executive compensation, election and mandate of directors.
WHAT ARE ESG CRITERIA?

CAISSE DE DÉPÔT ET PLACEMENT DU QUÉBEC AR 2012 78
Furthermore, a section added to the Caisse’s investment documents is used by analysts to rate companies on each ESG criterion. In 2013, the managers will rate companies in the S&P/TSX Index.
Private markets For the Caisse’s private equity investments, ESG criteria are taken into account from the outset, as part of the investment analysis process. The due diligence performed before the investment also allows the Caisse to review a company’s ESG profile in greater depth. A management support tool was developed in 2012 to compare companies with their peers from the information available on listed companies. The tool is used to determine sector-based ESG risks.
Fixed income In fixed income, the work focused essentially on corporate bonds. In 2012, the Caisse began by carrying out a study of best practices for integrating ESG criteria into the management of this asset class. It then developed two tools that help managers integrate each of these criteria. The first tool positions the companies in the portfolio according to sector indicators in the industries in which they operate, and the second develops a profile of each company and determines its potential risks.
ResearchResearch is fundamental for integration of ESG criteria. The Caisse encourages it, in part by requesting that securities brokers include an ESG analysis in their reports. The Caisse also subscribes to the services of various specialized research firms and attends ESG conferences.
In 2012, the Caisse became involved with the Finance & Sustainability Initiative to organize a conference on academic research on responsible investment. The conference was held on September 21, 2012, and for the first time enabled academics and students from several Québec universities to present their findings on ESG criteria and to discuss them with asset managers, representatives of institutional investors, investment dealers and actuaries.
In June 2012, the Caisse also attended the Canadian Responsible Investment Conference, held in Montréal and organized by the Social Investment Organization. Three Caisse employees took part in the event as speakers, explaining the Caisse’s approach to social investment.
Finally, the Caisse conducted a review of certain international agreements to assess legal risks that may affect its investments.
Internal expertiseIn 2012, the Caisse hired interns from Québec universities to work on projects to integrate ESG criteria. For example, one of the interns produced a study on the link between ESG criteria and the extremely low returns of some companies.
The Caisse also recruited three analysts specialized in geology, mechanical engineering and petroleum engineering. The analysts bring state-of-the-art expertise to its analysis and provide a deeper understanding of industry-specific issues.
Finally, five employees successfully completed Concordia university’s Sustainable Investment Professional Certification Program.
2. Shareholder engagement The Caisse considers shareholder engagement an important activity and therefore takes various initiatives: it may approach a company on its own or it may do so in concert with other investors or groups. It also exercises its voting rights at share-holder meetings.
The Caisse positions itself as a partner and therefore works with companies in an active and constructive way. It routinely comments on legislation and directives issued by Canadian securities authorities on governance issues and investment activities.
In applying its responsible investment approach, the Caisse contacts companies to obtain information that can benefit all shareholders or to discuss specific issues and ways to improve practices. Such communications with companies are generally private. barring exceptional circumstances, the Caisse does not disclose the names of companies it contacts in this way.
Some of the investment sectors in which the Caisse has substantial holdings present significant shareholder-engagement challenges. However, even in such circumstances, the Caisse maintains its engagement approach as a way of influencing the behaviour of these companies. In such cases, its influence can be measured only over long periods.
Responsible Investment Responsible Investment ReportReport

CAISSE DE DÉPÔT ET PLACEMENT DU QUÉBEC AR 2012 79
At the beginning of each year, the Caisse establishes a work plan and the engagement themes on which it plans to take action or initiate dialogue with executives of Canadian companies. In 2012, shareholder engagement focused mainly on compen-sation programs, environmental and social issues, especially those associated with natural resource operations, and gover-nance in general.
Shareholder engagement with Canadian companies
Shareholder engagement – Compensation programs
Objectives under this theme:
The Caisse believes executive compensation should be tied to corporate results, so it reviews compensation programs, paying special attention to the link between compensation and corporate performance.
Examples of action taken by the Caisse:
• In 2012, in co-operation with the Canadian Coalition for Good Governance, the Caisse took part in several meetings with board members of various Canadian companies.
• The Caisse organized several meetings with officers and directors to discuss compensation programs, comparison of such programs with those of peers in the same industry, advisory votes and special bonuses.
• The Caisse voted against management proposals on compen-sation programs and incentive compensation programs when it found dilution was too high or that some aspects were not conducive to a link between executive compensation, corporate results and shareholder gains, or when it consi-dered the incentive awards.
• In one instance, the Caisse supported an advisory vote on the compensation program but shared with the board’s chairman its concerns over allegations about the company’s operations.
• The Caisse also met with directors and officers of a company concerning a proposal to grant special bonuses to certain persons employed by the company. Eventually the company withdrew the proposal.
Shareholder engagement – Environmental and social issues
Objectives under this theme:
Environmental and social issues are important because they may have financial consequences for the company and its shareholders and may also have an impact on its reputation. Furthermore, such issues routinely engender social accep-tability risks among the company’s stakeholders, including employees, shareholders, local citizens and NGOs. businesses in the natural resources sector are especially vulnerable to this kind of risk, given the nature of their operations and their environmental impacts. In taking this approach, the Caisse seeks to address these risks proactively.
Examples of action taken by the Caisse:
• In 2012, the Caisse’s portfolio managers visited more than 30 businesses. On these field visits, the Caisse met with various stakeholders, observed and verified the status of certain projects, reviewed various operating activities and discussed specific issues.
• The Caisse continued to support the Carbon Disclosure Project (CDP), which sends companies a yearly question-naire to assess how they are disclosing their approach to managing climate change and greenhouse gas emissions. The 2012 questionnaire was sent to 200 Canadian companies, of which 75 are represented in the Caisse’s portfolio; 77% of the companies in the portfolio returned completed question-naires. The Caisse’s support for the CDP includes having a representative on its advisory board.
• For a second year, the Caisse participated in the CDP Water Disclosure Project. This initiative underscores the impor-tance of water and addresses the issue through dialogue with companies. In 2012, this group of 470 investors asked 318 large-cap companies around the world to complete a questionnaire on their management of water issues. About 60% of them returned completed questionnaires.
• The Caisse voted in favour of several proposals designed to obtain more information on environmental risks and the measures that companies have taken to address them.

CAISSE DE DÉPÔT ET PLACEMENT DU QUÉBEC AR 2012 80
• In one case, the Caisse visited the company’s facilities and met with all stakeholders concerned by the project: senior management, employees, the group, the municipality and the associations.
• Internationally, the Caisse supports the efforts of the Extractive Industries Transparency Initiative (EITI). This organization fights corruption by inviting countries at risk to implement stronger measures on the transparency involved in disclosing natural resource revenues.
Shareholder engagement – Governance
Objectives under this theme:
The Caisse carefully examines governance issues to take action when companies have not adopted best governance practices, whether such practices involve membership on the board of directors and its committees, diversity, individual elections of directors, annual elections of directors or the share-capital structure. The Caisse is also working to improve Canada’s proxy voting system.
Examples of action taken by the Caisse:
• The Caisse became involved in one case after a shareholder proposal to appoint an independent director as chairman of the board. The resulting dialogue concerned the appointment of a senior independent director to ensure the board remains independent of management.
• The Caisse submitted comments to the regulatory autho-rities to underscore the importance of individual elections and majority votes.
• The Caisse joined other Canadian institutional investors to propose ways to improve Canada’s proxy voting system. At meetings with the regulatory agencies, the Caisse recom-mended that they consider ways to improve the system’s transparency. The Ontario Securities Commission has made proxy-voting reform one of its priorities.
• A representative of the Caisse sits on the governance committee of the Pension Investment Association of Canada (PIAC), which examines governance issues of interest to these investors.
Shareholder engagement – Emerging marketsShareholder engagement in emerging markets has its challenges, especially because of geography and cultural differences. The Caisse has therefore given a mandate to a specialized firm to help it carry out shareholder engagement activities. In 2012, dialogue was established with more than 80 companies in emerging markets. Even though environmental and social issues were regularly raised with the companies, governance matters stood out as the most important, given the noticeable discrepancy with internationally recognized best governance practices.
The dialogue on environmental issues concerned improved management of greenhouse gas emissions and more efficient ways to use water for operations. As for social issues, in most of the discussions the Caisse addressed labour relations and encouraged companies to provide employees with adequate working conditions and improved occupational health and safety. Discussions of governance issues included director independence and aligning the interests of the board with the interests of shareholders.
The Caisse’s approach to dialogue in these markets goes hand in hand with its approach to engagement with regulatory autho-rities. The Caisse participated in several public consultations organized by such authorities on the following subjects in particular:
• Stock exchange regulations on disclosure of director and auditor independence.
• ESG accountability guide for publicly traded companies.
• Amendments to a code of governance and audit standards.
Figure 48 presents an overview of the engagement themes addressed in 2012 concerning emerging markets.
Responsible Investment Responsible Investment ReportReport
ENGAGEMENT THEMES ADDRESSED IN 2012 RELATED TO EMERGING MARkETS
FIGuRE 48
n 30% Governance
n 24% Social and ethical
n 20% Environmental
n 11% business strategy
n 8% Risk management
n 5% Compensation
n 2% Communication with shareholders

CAISSE DE DÉPÔT ET PLACEMENT DU QUÉBEC AR 2012 81
Proxy votingThe exercise of voting rights at shareholder meetings of companies in the Caisse’s portfolio is an important activity. The Caisse exercises this right in respect of all investee companies, whether they are managed actively or passively.
An internal team exercises voting rights at the shareholder meetings of Canadian and u.S. companies. For companies outside North America, voting rights are exercised with assis-tance from an external firm, according to Caisse policies and directives. In such cases, the Caisse reviews the firm’s voting recommendations and takes any action deemed necessary.
Votes on management proposals Most proposals put to a shareholder vote are presented by the company’s management. Such proposals generally concern the election of directors, the appointment of auditors and other issues examined by boards of directors, including compen-sation programs.
The Caisse usually supports management proposals but may oppose proposals for specific reasons. Table 49 gives examples of proposals that the Caisse voted against.
Votes on shareholder proposals Shareholder proposals are reviewed and analyzed on a case-by-case basis. In 2012, the Caisse voted on 483 shareholder proposals at meetings of Canadian and u.S. companies. It supported 331 of the proposals.
Table 50 (p. 82) presents examples of shareholder proposals reviewed by the Caisse in 2012.
Other engagement activitiesThe Caisse also conducts engagement activities of greater scope than those involving specific themes or dialogue with companies. It collaborates on responsible-investment matters with various stakeholders and, in this way, creates awareness of and advances responsible investment.
For example:
• The Caisse regularly takes part in work performed by investors involved in the uN Principles for Responsible Investment (PRI), to which the Caisse has been a signatory since its inception in 2006. More specifically, in 2012 the Caisse was involved with the working group on application of these principles to corporate fixed income.
• The Caisse joined other institutional investors in seeking more disclosure of ESG factors by managers of private investment funds. An accountability questionnaire was developed.
• The Caisse is also a member of a group of Québec PRI signatories. The group meets on a regular basis to discuss responsible investment issues and PRI implementation at various organizations.
In 2012, the Caisse voted on 45,059 proposals in connection with 4,807 shareholder meetings:
Canada: 186 meetingsunited States: 724 meetingsInternational: 3,897 meetings
Out of all votes, 11.37% were against management proposals.
Canada: 8.9%united States: 12.4%International: 12.81%
TAblE 49
CAISSE OPPOSITION TO MANAGEMENT PROPOSALS – SOME ExAMPLES
Management proposals Reasons for voting against
Election of directors
The board of directors is not composed of a majority of independent directors or the candidate sits on a committee even though he is not independent (380 votes out of 6,769).
Compensation
Some elements are not conducive to a link between executive compensation and corporate results (153 votes out of 693).

CAISSE DE DÉPÔT ET PLACEMENT DU QUÉBEC AR 2012 82
Furthermore, the Caisse held many meetings during the year with various stakeholders, including market participants, academics and university students, who wanted to learn about its approach to responsible development. The Caisse firmly believes in its approach and is convinced that such meetings help educate the community on responsible investment principles.
3. Exclusion Excluding securities from its portfolio is an exceptional measure that the Caisse takes in certain circumstances. If the circumstances so justify, it may exclude the actively managed securities of companies in violation of local or international law. An internal committee composed of employees from various units, including the investment teams, reviews such matters.
The Caisse excludes from its portfolio companies that manufacture weapons banned by the Ottawa Convention banning landmines and the Oslo Convention on Cluster Munitions. Such securities could be reinstated in the portfolio if the companies in question stopped manufacturing such weapons.
RESPONSIBLE INVESTMENT COMMITTEE
The role of the Responsible Investment Committee is to examine key issues associated with this subject, in particular to target shareholder-engagement issues to determine whether specific securities should be excluded from or brought back into the portfolio. The committee met four times in 2012.
Responsible Investment Responsible Investment ReportReport
CAISSE SuPPORT fOR SHAREHOLDER PROPOSALS – SOME ExAMPLES
Shareholder proposals Reasons for voting in favour Companies1
Annual election of directors
The board, the board’s committees and each director should be assessed annually.
Johnson Controls Inc. Emerson Electric Co. Kellogg Co.best buy Co Inc.
Election of directors by majority vote
A majority vote gives shareholders a stronger voice.
Exxon Mobil Corp.
Retention of a significant portion of shares acquired under stock-based plans
Executive share ownership further aligns executive interests with shareholders’ interests over the long term by fostering an increase in share value.
Oracle Corp.Comcast Corp.Dean Foods Co.JPMorgan Chase & Co.
Special meetings called by shareholders The proposal gives shareholders a stronger voice.
Archer-Daniels-Midland Co.Netflix Inc.Nasdaq OMX Group Inc.
Sustainable development report The company does not disclose sufficient information on environmental or social issues.
Cabot Oil & Gas Corp. Equity ResidentialAvalonbay Communities Inc.
1. Examples of companies for which the Caisse voted in favour of a shareholder proposal.
TAblE 50

CAISSE DE DÉPÔT ET PLACEMENT DU QUÉBEC AR 2012 83
Sustainable Development Report
RESULTS FROM 2009-2011
MAIN INITIATIVES IN 2012
GOALS FOR 2013
• Meetings are held each year with depositors’ sustainable development officers.
• The cultural diversity of the Caisse’s teams is underscored each year through awareness activities for employees.
• The Caisse minimizes its environmental footprint through environmental management of Ivanhoé Cambridge’s buildings.
• The Centre CDP Capital building received lEED-Eb Gold certification from the u.S. Green building Council.
• Works of art from the Caisse’s collection are exhibited once a year so that the public can become better acquainted with contemporary Québec artists.
• An interactive online training course on sustainable development was developed for employees.
• A program was implemented to foster community action.
• To showcase Québec’s architectural heritage, activities were held to mark the anniversaries of four major Montréal buildings managed by Ivanhoé Cambridge, including the 50th anniversary of Place Ville Marie.
• Initiatives were undertaken to develop a new generation of finance professionals and to foster greater representation of women in investment and management positions at the Caisse.
• The Caisse will take part in a pilot project to develop finance internships in Montréal.
• The modes of transport used by employees will be analyzed to encourage environmentally friendly choices.
• Ivanhoé Cambridge will develop a program to measure and monitor greenhouse-gas emissions as a way of reducing the ecological footprint of the buildings it manages.
• More than 200 Caisse employees will take an interactive training course on sustainable development.
HIGHLIGHTS FROM THE CAISSE’S SUSTAINABLE DEVELOPMENT ACTION PLANHIGHLIGHTS FROM THE CAISSE’S SUSTAINABLE DEVELOPMENT ACTION PLAN
The Sustainable Development Action Plan presented in this section reflects the emphasis that the Caisse places on the sustainability and continuity of its operations and its commitment to the strategy implemented by the Québec government since the Sustainable Development Act came into force. The Caisse adopted a Sustainable Development Action Plan in 2009. Since then, it has undertaken many concrete activities and initiatives to reduce its ecological footprint, raise awareness of sustainable development, showcase Québec’s cultural heritage and share its knowledge of sustainable development with peers and depositors alike.

CAISSE DE DÉPÔT ET PLACEMENT DU QUÉBEC AR 2012 84
Sustainable Sustainable Development ReportDevelopment Report
NEW ACTION PLAN FOR 2012-2015NEW ACTION PLAN FOR 2012-2015
In 2012, the Caisse reviewed its action plan so as to position and pursue its initiatives more effectively. For the period from 2012 to March 2015, the plan comprises 11 actions. This section serves as a progress report and a formal accountability statement.
OBJECTIVE
RAISE AWARENESS Of THE SuSTAINABLE DEVELOPMENT CONCEPT AND RELATED PRINCIPLES
Action 1:Provide Caisse employees with information on and training in sustainable development
Interactive online trainingIn 2012, the Caisse developed an online interactive course on sustainable development principles for its employees. The course will be deployed in 2013.
FollowupAt least 200 employees will take the interactive course in 2013.
AwarenessDuring the year, the Caisse raised employee awareness of various aspects of sustainable development by publishing a series of articles in its electronic employee newsletter. Various means of communication were also used to encourage employees to adopt responsible practices at work and at home. Such practices include consuming responsibly, recycling computer hardware, batteries and cellular phones, and using electronic documents instead of paper copies. At the office, this approach means less paper is used, paper towels are composted and water coolers replace water bottles.
FollowupThe awareness activities of 2012 will be followed by more initiatives in 2013, such as a monthly column in the electronic employee newsletter and two conferences on sustainable development.
Employee involvementIn 2012, the Caisse formed a working committee, whose members are employees from various units, to identify ways to improve the work environment, such as telecommuting, the promotion of community action, access to social media, methods that facilitate adoption of new technologies, an upgrade of the service request system and guided tours of the Caisse’s art collection.
Followupbetween now and the end of 2014, the Caisse will carry out eight activities directly aligned with the objectives of the govern-ment’s Sustainable Development Strategy.
OBJECTIVE
DEVELOP A PREVENTION CuLTuRE AND CONDITIONS CONDuCIVE TO HEALTH, SAfETY AND THE ENVIRONMENT
Action 2:Continue to improve working conditions to foster employee health and safety
Safety during business travelVarious measures were implemented in 2012 to make employees aware of precautions to take when they travel on business. For example, a register is kept up-to-date with useful information for employees who travel. The Caisse also ensures that all relevant information is provided to them. In case of an emergency, the Caisse has also developed a way to inform them quickly of any measures they should take.
Followupbetween now and 2014, the Caisse will be developing an emergency geotracking plan for employees who travel on business.

CAISSE DE DÉPÔT ET PLACEMENT DU QUÉBEC AR 2012 85
Action 3:Implement measures that encourage employees to use green transport
A study was prepared in 2012 to determine how employees commute to work. The objective is to measure the extent to which employees use green modes of transport. The findings will help the Caisse implement measures to encourage employees to choose environmentally friendly options.
FollowupThe study on the main modes of transport used by employees will be completed in 2013. Once the results have been analyzed, solutions will be proposed to foster greater use of green transport.
OBJECTIVE
ENCOuRAGE RESPONSIBLE PROCuREMENT AND SOuND ENVIRONMENTAL MANAGEMENT
Action 4:Strengthen practices and activities designed to encourage responsible consumption
Procurement of goods and servicesThe Caisse is concerned about responsible consumption. It requires suppliers to provide information on their sustainable development practices and takes this information into account when evaluating suppliers for the award of contracts.
In 2013, the Caisse will examine whether requirements other than those in place for sustainable development are needed. In addition, its subsidiary Ivanhoé Cambridge will develop a green procurement policy for building maintenance, landscaping and snow removal.
FollowupThe new requirements determined by the Caisse and Ivanhoé Cambridge will be adopted and implemented in 2013.
Action 5:Continue environmentally friendly building management
Installation of charging stationsIn 2012, Ivanhoé Cambridge installed 62 charging stations for electric cars at its 16 office buildings and shopping centres in Québec. The new stations represent almost one-third of the province’s network of public charging stations for electric vehicles.
FollowupThe objective for 2012 was attained. The 62 stations represent a tangible contribution by Ivanhoé Cambridge to sound environ-mental management of its buildings.
Program to measure and monitor greenhouse-gas emissionsA program to measure and monitor greenhouse-gas emissions is being developed for the Canadian buildings managed by Ivanhoé Cambridge. This project will establish measurement parameters, determine the aspects to be measured and develop a centralized method for collecting data. Greenhouse-gas objectives will then be determined.
Followupbetween now and 2014, Ivanhoé Cambridge will develop the capacity to measure greenhouse-gas emissions for all the buildings it manages in Canada.
CompostingIvanhoé Cambridge has introduced composting programs at twelve of its buildings. For example, in 2012 composting bins were installed on two terraces and in the dining area at the Centre CDP Capital. In 2013, composting bins will be installed in the kitchen areas on all floors of the building.
Followupbetween now and the end of 2014, Ivanhoé Cambridge plans to introduce a composting program in a greater number of buildings.

CAISSE DE DÉPÔT ET PLACEMENT DU QUÉBEC AR 2012 86
Sustainable Sustainable Development ReportDevelopment Report
Maintaining BOMA BESt certificationsIn recent years, Ivanhoé Cambridge has obtained bOMA bESt certification for 26 of the 27 buildings it manages in Québec. This certification is awarded to buildings that meet rigorous sustainable development criteria. In 2012, as part of its program to maintain these environmental certifications, the Mail Champlain shopping centre certification was renewed.
FollowupIn the years to come, Ivanhoé Cambridge plans to maintain or to improve the target rate for bOMA bESt certification, which is currently 83%. The target was exceeded significantly in 2012, with 96% of its buildings, or 26 out of 27, having been certified.
OBJECTIVE
CONSERVE AND SHOWCASE QuÉBEC’S HERITAGE
Action 6:Continue showcasing our cultural heritage
Exhibitions and tours of the art collectionThe Caisse helps support Québec culture by acquiring works by Québec artists known for their talent and influence in the art milieu. In 2012, works from the Caisse’s collection were showcased through eight activities: an exhibition for the public was organized at the Centre CDP Capital and seven guided tours were offered, including one for volunteers of the Montreal Museum of Fine Arts.
The collection’s reach also extends beyond the walls of the Caisse. One work was exhibited at the National Gallery of Canada in Ottawa, and another was part of a travelling exhibition organized by the Musée d’art contemporain de Montréal.
FollowupIn 2012, the Caisse exceeded its target of six activities a year to promote its art collection.
Action 7:Showcase our architectural heritage
Showcasing Québec’s historical buildingsIvanhoé Cambridge began renovating the Château Frontenac hotel, a project that will continue into 2014. The work includes modernizing guest rooms, the main lobby and many other distinctive features of this Québec City landmark, while conserving its historical value.
More than one-quarter of the copper recovered in 2011 and 2012, when the roof of the main tower of Château Frontenac was rebuilt, was given to artists in 2012. They incorporated the material into around 150 original works that were displayed in an exhibition open to the public.
To mark the 50th anniversary of Place Ville Marie, a book was published on the history of the iconic Montréal building. The book has given the public a better understanding of the origins of the building, its architectural features and the changes made to it over the years. In addition, through a partnership with Royal bank of Canada a commemorative work of art was created by Montréal artist Nicolas baier and inaugurated on the building’s plaza.
Followupbetween now and the end of 2014, Ivanhoé Cambridge plans to launch further initiatives to showcase approximately 10 buildings in Québec.

CAISSE DE DÉPÔT ET PLACEMENT DU QUÉBEC AR 2012 87
OBJECTIVE
fIGHT SOCIAL INEQuALITY
Action 8:Encourage employees to support philanthropic causes
Community action programIn the fall of 2012, the Caisse began deploying a program to encourage employees to participate actively in non-profit organizations as volunteers. under the program, once the employee has been involved for at least two years in an organization that meets the program criteria, the Caisse may contribute $250 directly to the organization.
In September 2012, at the initiative of an employee, more than 200 Caisse employees took part in the Ride for Diabetes Research, to raise funds for the Juvenile Diabetes Research Foundation. Of all the corporate participants, the Caisse and its employees collected the most funds with a total of $174,000.
Many employees at the Caisse and its subsidiaries, Ivanhoé Cambridge and Otéra Capital, also contributed to the Centraide campaign.
FollowupVarious initiatives will be taken over the next three years to encourage employees to volunteer in the community.
OBJECTIVE
ADDRESS CHANGING DEMOGRAPHICS AND fOSTER WORk-LIfE BALANCE
Action 9:Optimize the work environment
Encourage productivity gainsA committee made up of several employees proposed measures to enhance the work environment. In 2011, a series of techno-logical initiatives was undertaken to improve the efficiency and quality of life at work. Deployment of these initiatives continued in 2012. With tools in place for greater flexibility, the committee examined the advisability of offering telecommuting where appropriate, an option that would benefit the Caisse and its employees alike. In 2012, a structured framework was developed for telecommuting that would meet the Caisse’s business needs.
FollowupA framework for managing telecommuting will be implemented in 2013.

CAISSE DE DÉPÔT ET PLACEMENT DU QUÉBEC AR 2012 88
OBJECTIVE
NuRTuRE A NEW GENERATION Of QuÉBEC fINANCE PROfESSIONALS
Action 10:Develop new talent in finance
Structured market for finance internships in MontréalHuman resources are essential to the growth of the financial industry. Working with Québec’s universities and other actors in the financial community, the Caisse is organizing a pilot project to create a structured market for internships in Montréal.
The purpose of the project is to train qualified people by offering practical training through structured, supervised internships.
FollowupThe objective for 2012, to develop and implement the project’s structure, was attained. The pilot project will be implemented in 2013.
financial succession committeeA working group on the development of finance talent was formed to establish priority actions to attract the best talent to the Caisse and to promote the organization to students, professors and other actors in the academic community, with emphasis on its role in Québec’s economy and the wide variety of occupations practiced at the Caisse.
The action plan was two-pronged in 2012. Its goals were to promote the Caisse’s internship and hiring programs and to provide expertise to Québec’s universities. In particular, the Caisse’s specialists:
• give courses in various fields, mainly at six Québec univer-sities (université de Sherbrooke, Concordia university, HEC Montréal, uQAM, McGill university and université laval); and
• present the Caisse and its contribution to Québec’s economy and explain the investment profession to students during meetings or classes.
FollowupThe Caisse will maintain contact with students in finance and management programs at Québec’s major universities, mainly by holding meetings with them.
Action 11Promote the visibility and representation of women in finance
Committee on the representation of womenThe Caisse has established a committee to address the representation of women in finance. The committee has a mandate to propose initiatives for attracting and retaining more women in investment and management positions at the Caisse. Several actions were begun in 2012: discussion groups made up of Caisse professionals were formed to identify how they can increase their outreach to the business community and use their professional networks to attract more high-level candidates when positions are posted; conferences were held on the importance of diversity at all levels of management; the finance professions practiced at the Caisse were promoted at six Québec universities; and recruiting firms were required to seek and propose women candidates for investment positions.
FollowupIn 2013, the Caisse intends to pursue its initiatives and continue to use its professional network to strengthen its ability to attract talented women who are finance specialists.
Sustainable Sustainable Development ReportDevelopment Report

CAISSE DE DÉPÔT ET PLACEMENT DU QUÉBEC AR 2012 89
Reports of the Board of Directors and Board Committees

CAISSE DE DÉPÔT ET PLACEMENT DU QUÉBEC AR 2012 90
THE BOARD OF DIRECTORSTHE BOARD OF DIRECTORS
Mandate
The mandate of the Board of Directors includes ensuring that the Caisse is managed in compliance with the provisions of its incorporating Act and regulations and that it takes the necessary steps to attain the objectives stated in its mission, namely to receive moneys on deposit as provided by law and manage them with a view to achieving an optimal return on capital within the framework of depositors’ investment policies while contributing to Québec’s economic development.
For a full description of the Board of Directors’ mandate, please consult the Governance section of the Caisse website (www.lacaisse.com).
COMPOSItIOn
As at December 31, 2012, the Board consisted of 11 members out of a maximum of 15. The Board members include the Chairman, the President and Chief Executive Officer, and independent and non-independent directors. The Act respecting the Caisse stipulates that at least two-thirds of the directors, including the Chairman, must be independent.
In 2012, after consulting with the Board, the Government of Québec renewed the mandates of Elisabetta Bigsby and Louise Charette. Claudette Carbonneau and Pierre Fitzgibbon stepped down as members of the Caisse’s Board and thereby from their positions on the Board’s committees.
At the beginning of 2013, after consulting with the Board, the Government of Québec appointed four directors. Rita Dionne-Marsolais, Jean La Couture and Gilles Godbout were appointed as independent members, while André Legault, President and Chief Executive Officer of the Commission administrative des régimes de retraite et d’assurances (CARRA), was appointed as a non-independent member. Mr. Legault succeeded Jocelyne Dagenais, who stepped down as a director of the Caisse and as President and Chief Executive Officer of CARRA during the year.
Table 51 (p. 91) provides information on the directors’ atten-dance at Board and Committee meetings in 2012.
COMPenSatIOn OF dIReCtORS
The compensation of the Caisse’s directors is determined by an order-in-council of the Government of Québec. Under this order, the compensation mentioned in Table 52 was paid to directors, with the exception of the Chairman (see p. 91). The Board members are also entitled to be reimbursed for their travel and living expenses, where applicable.
COMPenSatIOn OF tHe CHaIRMan OF tHe BOaRd
The annual compensation of the Chairman of the Board is set at $195,000 by the Government of Québec. The Chairman is also entitled to be reimbursed for representation expenses related to the duties of his position, to a maximum of $15,000 a year.
Board of Directors’ Report
HIGHLIGHTSHIGHLIGHTS
01 01 AppApproved strategies to roved strategies to implement the Caisse’s implement the Caisse’s
priorities with a view to achieving priorities with a view to achieving greater stability, less volatility greater stability, less volatility and continued achievement of the and continued achievement of the organization’s mission.organization’s mission.
02 02 AppApproved changes to the roved changes to the Caisse’s portfolio offering.Caisse’s portfolio offering. 03 03 AdoAdopted and monitored pted and monitored
the annual business plan, the annual business plan, including goals associated with including goals associated with strategic orientations and day-to-day strategic orientations and day-to-day management, as well as initiatives management, as well as initiatives designed to promote optimal use designed to promote optimal use of resourcesof resources..

CAISSE DE DÉPÔT ET PLACEMENT DU QUÉBEC AR 2012 91
dIReCtOR attendanCe at BOaRd and COMMIttee MeetIngS In 20121
Directors Board of Directors Audit CommitteeRisk Management
CommitteeHuman Resources
CommitteeGovernance and
Ethics Committee
6 reg. 6 spec. 6 reg. 6 reg. 5 spec. 7 reg. 1 spec. 6 reg.
Elisabetta Bigsby 6 5 – – – 7 1 –
Claudette Carbonneau 4/4 4/4 – – – – – 4/4
Louise Charette 6 5 6 – – – – 6
Jocelyne Dagenais 5/5 4 – – – – – –
Michèle Desjardins 5 6 – – – – – 5
Pierre Fitzgibbon 5/5 4 5/5 5/5 4 – – –
Denys Jean 5 3 – – – – – –
A. Michel Lavigne 6 5 6 6 4 – – –
Jean Pierre Ouellet 6 5 – – – – – –
Réal Raymond 5 6 – 5 5 – – –
François R. Roy 6 6 6 6 5 – – –
Michael Sabia 6 6 – – – – – –
Ouma Sananikone 6 6 – 6 5 7 1 –
Robert Tessier 6 6 – – – 7 1 6
1. Directors justify their absences from regular meetings of a Committee or the Board to the Caisse’s Secretariat. During 2012, directors were not able to attend certain meetings, in part or in whole, due mainly to identified conflicts of interest or family or work commitments.
TABLE 51
COMPenSatIOn PaId tO IndePendent dIReCtORS undeR ORdeR-In-COunCIl1
Directors
Annual compensation
($)
Compensation as Committee Chair
($)
Attendance fees
($)
Total compensation
($)
Elisabetta Bigsby 17,385 5,433 13,455 36,273
Claudette Carbonneau 13,023 – 8,156 21,179
Louise Charette3 17,385 – 17,948 35,333
Michèle Desjardins 17,385 – 11,019 28,404
Pierre Fitzgibbon 15,208 – 15,903 31,111
A. Michel Lavigne3 17,385 5,433 21,196 44,014
Jean Pierre Ouellet 17,385 – 7,350 24,735
Réal Raymond 17,385 5,433 13,064 35,882
François R. Roy3 17,385 – 19,584 36,969
Ouma Sananikone 17,385 – 20,805 38,190
total 332,090
1. In accordance with the terms of the Order-in-Council, a 1.5% increase was applied on April 1, 2012, to the annual compensation, the Committee Chairs’ compensation and the attendance fees.
2. The attendance fee for each special or short Board or Committee meeting, held by conference call, is half of the attendance fee allowed for a regular meeting.3. These directors received attendance fees for attending an Audit Committee meeting of the Caisse’s real estate subsidiaries.
2
TABLE 52

CAISSE DE DÉPÔT ET PLACEMENT DU QUÉBEC AR 2012 92
aCtIVItY RePORt
Compliance with the Act respecting the CaisseThroughout the year, the Board ensured that the Caisse’s activities complied with the Act and relevant regulations.
Strategic planIn 2012, the markets experienced new periods of turbulence stemming from the financial, economic and political situation in eurozone countries. In this context, the Board noted the validity of the 2011 assessment as well as strategic orientations in response to major structural changes caused by the rise of emerging markets and the challenges facing depositors.
Accordingly, the Board approved strategies to implement the Caisse’s orientations with a view to achieving greater stability, less volatility and continued achievement of the Caisse’s mission. It also approved the changes required for the Caisse’s portfolio offering and operational framework to focus on long-term returns and the real economy; the Caisse emphasizes fundamental analysis of companies, sectors and markets to act on investment opportunities more effectively. The approved changes also resulted in more emphasis on absolute returns in the Caisse’s portfolio management, parti-cularly in equity markets – hence the creation of the Global Quality Equity portfolio.
To carry out this strategy successfully, managers require a deep understanding of the operational details that set well-managed companies apart. The Board and senior management therefore approved the addition of operational specialists to complement the Caisse’s financial expertise. They also approved enhance-ments to the research team to ensure a better understanding of macroeconomic and geopolitical trends and to accelerate the Caisse’s exposure to emerging markets.
The investment opportunities arising from these changes must meet the needs of depositors and the challenges facing Québec’s economy and companies. The Board ensured that the implementation of these priorities was discussed with the depositors to secure their approval. In addition, the Board ensured that senior management continued to implement activities that bode well for Québec’s economic development, notably by investing in promising Québec companies and in the next generation of entrepreneurial and financial leadership.
Business planThe Caisse’s various units each made a presentation to the Board on their annual business plan, including goals associated with strategic priorities and day-to-day management, as well as initiatives designed to promote optimal use of resources. The Board adopted the Caisse’s business plan and the annual budget and received regular progress reports on the Caisse’s operations from senior management.
On a regular basis, the Board oversaw and contributed constructively to the development of strategic priorities, for example, through detailed presentations by each investment group on its investment strategies, in particular for Québec.
Financial results, internal controls and management systemsWith the assistance of the Audit Committee, the Board fulfilled its responsibilities with respect to financial results and internal controls, in particular by reviewing the quarterly financial state-ments, approving the interim and annual combined financial statements, evaluating the integrity of the controls applied to the various data used to prepare the financial statements and the related notes, and monitoring internal audits.
In addition, the Board received reports analyzing the returns of the Caisse’s various investment sectors. It approved the press releases announcing the Caisse’s annual and interim financial results, as well as the Annual Report. The Board was also kept apprised of the work carried out to restructure the financial certification program so as to improve the effectiveness of the Caisse’s control and oversight functions, among other things.
See the Report of the Audit Committee on page 94 for more information on the responsibilities of this Committee and the Board.
Board of Board of Directors’ ReportDirectors’ Report
CAISSE DE DÉPÔT ET PLACEMENT DU QUÉBEC AR 2012 93
Risk management With assistance from the Risk Management Committee, the Board ensured throughout 2012 that risk-return integration continued on a daily basis and that the risk management processes and framework were adapted to the changes stemming from the strategic priorities, particularly with respect to management of liquidity risk and market risk.
Accordingly, the Board approved the investment policy of the new specialized Global Quality Equity portfolio and authorized the review of several other investment policies and risk oversight measures. The Board also monitored major investments.
Furthermore, the Board reviewed the risk strategy and management associated with information technology at the Caisse, notably to ensure optimal management of information resources.
For more information on the activities of the Board and the Risk Management Committee, see the Report of the Risk Management Committee on page 114.
Supervision of senior managementThe Board, assisted by the Human Resources Committee, adopted the detailed objectives of the President and Chief Executive Officer for 2012. The Board also reviewed his perfor-mance on the basis of the objectives set at the beginning of the year and concluded that his contribution had once again largely exceeded the targets.
The Board also reviewed his evaluation of the performance of the senior executives. It also reviewed the succession plans for them and for the President and Chief Executive Officer. On the Human Resources Committee’s recommendation, the Board approved the 2012 salary conditions and the level of incentive compensation to be paid to senior management. It also autho-rized the appointment and compensation of a new member of the Executive Committee. Michèle Boisvert, Executive Vice-President, Public Affairs, assumed responsibility for external and internal communications, government relations and public relations.
Moreover, the Board approved the appointment of Bernard Morency to the position of Chief Operations Officer, in addition to his existing duties as Executive Vice-President, Depositors and Strategy. As Executive Vice-President, Depositors, Strategy and Chief Operations Officer, he leads the teams responsible for operations, information technology, depositors’ accounts and strategic planning.
Furthermore, through its Human Resources Committee, the Board monitored the initiatives designed to strengthen the leadership skills of team leaders, to develop employees’ strengths and to create a work environment that stimulates creativity and promotes talent retention.
For more information on the responsibilities of this Committee and the Board, see the Report of the Human Resources Committee on page 99.
Corporate governance Assisted by the Governance and Ethics Committee, the Board reviewed the expertise and experience profile of the Board members.
The Board also ensured that high standards of governance were upheld. For example, it held discussions with the President and Chief Executive Officer without the presence of other members of senior management as well as discussions in camera. Through the Governance and Ethics Committee, the Board also reviewed the Policy on the Principles Governing the Exercise of Voting Rights of Public Companies, reviewed certain provisions of the Code of Ethics and Professional Conduct for Directors with respect to personal transactions and examined the decla-rations of interests submitted by each director.
The relationship between the Board and senior management, which is intended to be constructive and based on trust, was also developed through presentations by senior management at meetings held the day before the Board convened. Furthermore, through presentations given at Board meetings, the directors were able to improve their knowledge of such topics as asset allocation and overlay operations.
For more information on the responsibilities of this Committee and the Board, see the Report of the Governance and Ethics Committee on page 97.
CAISSE DE DÉPÔT ET PLACEMENT DU QUÉBEC AR 2012 94
AUDIT COMMITTEE AUDIT COMMITTEE
Mandate
The Audit Committee plays an essential role in ensuring good financial governance at the Caisse. It sees that the financial statements accurately reflect the organization’s financial position and that adequate and effective internal control mechanisms and a risk management process are in place.
For a full description of the Audit Committee’s mandate, please refer to the Governance section of the Caisse’s website (www.lacaisse.com).
COMPOSItIOn (as at december 31, 2012)
The Committee comprised three independent members, including professionals with accounting or finance expertise, as well as the experience and knowledge required to read and understand financial statements and properly fulfill their roles. The Chairman of the Board attends the meetings.
• Chair: A. Michel Lavigne (guest member at meetings of the Risk Management Committee)
• Members: Louise Charette and François R. Roy.
aCtIVItY RePORt
Number of meetings held in 2012: 6
The Committee provided oral and written reports on its activities to the Board of Directors after each meeting. During Committee meetings, the members also met without the presence of senior management. The following report, which was approved by the members of the Committee, describes the main subjects they discussed or decided during the year.
Report of the Audit Committee
HIGHLIGHTSHIGHLIGHTS
01 01 RevReview of the process used iew of the process used to prepare financial to prepare financial
statements and commencement statements and commencement of migration to IFRS. of migration to IFRS.
02 02 MonMonitoring of the restructuring itoring of the restructuring of the financial certification of the financial certification
program, aimed in part at improving program, aimed in part at improving the efficiency of the Caisse’s various the efficiency of the Caisse’s various oversight functions. oversight functions.
03 03 RevReview of the Internal Audit iew of the Internal Audit Charter and adoption of Charter and adoption of
Internal Audit’s strategic plan Internal Audit’s strategic plan for 2012-2015.for 2012-2015.

CAISSE DE DÉPÔT ET PLACEMENT DU QUÉBEC AR 2012 95
Financial reporting In 2012, the Committee fulfilled its financial reporting responsi-bilities as follows:
• Reviewed the 2011 combined financial statements with the Finance group and the co-auditors, namely the Auditor General of Québec and Ernst & Young, and reviewed such matters as:
– the process used to prepare the financial statements; – the valuation of over-the-counter liquid investments,
less-liquid investments and ABTNs; – the validation of the notional amount of derivative
financial instruments by an external firm; and – the audit of returns by an external firm to ensure their
calculation and presentation comply with industry standards.
• Verified that an independent valuation of the fair value of the Caisse’s over-the-counter liquid investments, private equity, infrastructure, ABTNs and real estate was carried out, including:
– an independent external valuation of certain private equity, infrastructure investments and ABTNs;
– valuations, by independent external appraisers, of all properties held in the portfolio for 12 months or more;
– an independent external valuation of the fair value of certain liquid securities, real estate debt securities and corporate debt securities; and
– a discussion of the review of the valuation process.
• Reviewed the report on the financial certification process that enables the President and Chief Executive Officer and the Chief Financial Officer to certify publicly that disclosure controls and procedures and internal financial reporting controls are adequate and effective.
• Arranged for members of the Audit Committee to attend meetings of the real estate subsidiaries’ audit committees and reviewed the committees’ annual activity reports.
• Recommended the adoption of the annual financial state-ments to the Board.
• Received the co-auditors’ report submitted to the Caisse’s senior management after their year-end audit.
• Reviewed press releases announcing the Caisse’s results.
• Reviewed the quarterly financial statements, budget monitoring reports, operating expenses and year-end budget estimates.
• Discussed with the co-auditors their plan for auditing the Caisse’s financial results.
• Discussed with Ernst & Young their internal quality-control procedures.
• Monitored the External Auditor Independence Policy and submitted a recommendation to the Board regarding Ernst & Young’s audit fees.
• Reviewed and monitored decisions by Canadian and interna-tional authorities on the application of International Financial Reporting Standards (IFRS) and monitored the preparatory work for implementing the standards.
– Reviewed early adoption of IFRS for the Real Estate portfolio, to give effect to the reorganization of the shareholding structure of the subsidiary, Ivanhoé Cambridge.
• Held regular discussions with Finance personnel without the presence of senior management.
• Met regularly with the co-auditors to discuss various aspects of their mandate without the presence of senior management.
Internal Audit Reporting to the Audit Committee, Internal Audit helps the Caisse achieve its objectives by providing an independent, objective evaluation of the processes used for risk management, control and corporate governance, and by making proposals to enhance their effectiveness.
Accordingly, in 2012, the Committee carried out the following activities with the Internal Audit group:
• Revised the Internal Audit Charter and adopted the Internal Audit Strategic Plan for 2012-2015.
• Adopted the 2012 internal audit plan and revised the 2012 business plan of the Internal Audit group.
• Reviewed the coverage of Internal Audit’s work on the internal audit universe over the past four years.
• Reviewed Internal Audit’s progress reports prepared under the internal audit plan to address such matters as internal control mechanisms, risk management processes and optimal use of resources.

CAISSE DE DÉPÔT ET PLACEMENT DU QUÉBEC AR 2012 96
• Monitored the implementation of Internal Audit’s recommen-dations by the Caisse’s senior management.
• Reviewed status reports on the working relationship between the Caisse’s Internal Audit group and the internal audit departments of the real estate subsidiaries.
• Reviewed reports under the Caisse’s continuous audit program.
• Discussed the external valuation process and the quality of internal audit services.
• Evaluated the performance of the Vice-President, Internal Audit.
• Ensured that the Internal Audit team was able to act independently from the Caisse’s senior management.
• Held regular discussions with the Vice-President, Internal Audit, without the presence of senior management.
Internal controls and plan for the optimal use of resources During the year, the Committee welcomed the new Vice-President of Financial Governance and Optimization. The Committee reviewed many aspects of internal controls and optimal use of resources in 2012. Its activities included the following:
• Discussed the overall evaluation by senior management and by internal audit of the design and effectiveness of the general control environment, an evaluation based in part on work performed by Internal Audit.
• Reviewed Internal Audit’s findings on processes and controls related to the general control environment and information technology, and regularly followed up on implementation of the controls by the outsourcer.
• Tracked progress made with the restructuring of the financial certification program, aimed in part at improving the efficiency of the Caisse’s various control and oversight functions.
• Monitored and analyzed the outcomes of activities imple-mented to promote optimal use of resources, such as initiatives focusing on efficiency, effectiveness and economy.
• Reviewed quarterly reports on compliance with the investment limits set out in the Act respecting the Caisse and the limits set out in the specialized portfolios’ investment policies.
• Monitored the investments made under the last paragraph of Section 37.1 of the Act respecting the Caisse.
• Reviewed the delegations of authority and submitted a number of changes to the Board for approval.
• Reviewed the effectiveness of controls over publication of the press releases announcing the results and of the Annual Report.
Risk management The Risk Management Committee assists the Audit Committee in fulfilling its responsibility. The Audit Committee therefore carried out the following activities to monitor all risk management efforts:
• It received copies of the minutes of Risk Management Committee meetings.
• It received a copy of the certificates of compliance with the depositors’ investment policies and the specialized portfolios’ investment policies.
• The Chair of the Audit Committee attended the meetings of the Risk Management Committee.
uSe OF eXteRnal eXPeRtS
The Audit Committee did not use the services of external experts in 2012. However, it endorsed senior management’s use of external firms for an independent review of the fair value of private equity, certain liquid securities, real estate, real estate debt and ABTNs.
Report of the Report of the Audit CommitteeAudit Committee

CAISSE DE DÉPÔT ET PLACEMENT DU QUÉBEC AR 2012 97
GOVERNANCE AND ETHICS COMMITTEEGOVERNANCE AND ETHICS COMMITTEE
Mandate
The Governance and Ethics Committee ensures that the Caisse adheres to the highest standards of governance and ethics. The Committee’s responsibilities include reviewing the structure, composition, performance and operations of the Board and its committees.
For a full description of the Governance and Ethics Committee’s mandate, please consult the Governance section of the Caisse website (www.lacaisse.com).
COMPOSItIOn (as at december 31, 2012)
Three independent members:
• Chair: Robert Tessier• Members: Louise Charette and Michèle Desjardins
aCtIVItY RePORt
Number of meetings in 2012: 6
The Committee provided oral and written reports on its activities to the Board of Directors after each meeting. During Committee meetings, the members also met without the presence of senior management.
The following report, which was approved by the Committee members, describes the main subjects they discussed or decided during the year.
The Committee ensured high-level compliance with gover-nance practices in 2012. To that end, it carried out the following activities:
The Board and its committees• Discussed governance practices affecting evaluations of the
Board and senior management.
• Ensured that key individuals – whether members of Caisse management or external specialists – were available to explain various items on the agendas of Board meetings, and that there was enough time for a full discussion.
• Ensured that the Board had all the information and time required to analyze issues faced by the Caisse.
• Verified throughout the year that discussions were held without the presence of senior management and ensured that there was adequate time for full discussion by the directors.
• Discussed a training program for directors, including presen-tations at Board meetings as well as outside this formal framework, to allow directors to discuss issues related to the performance of their role.
Report of the Governance and Ethics Committee
HIGHLIGHTSHIGHLIGHTS
01 01 Recommended changes to Recommended changes to the Policy on the Principles the Policy on the Principles
Governing the Exercise of Voting Governing the Exercise of Voting Rights of Public CompaniesRights of Public Companies..
02 02 RevReviewed the expertise iewed the expertise and experience profile and experience profile
of independent directors, in of independent directors, in co-operation with the Human co-operation with the Human Resources Committee, and Resources Committee, and recommended appointments recommended appointments to the Board. to the Board.
03 03 EnsEnsured that the Board had ured that the Board had all the information and time all the information and time
required to have a full discussion on required to have a full discussion on the issues faced by the Caisse.the issues faced by the Caisse.

CAISSE DE DÉPÔT ET PLACEMENT DU QUÉBEC AR 2012 98
Composition of the Board and its committeesThe Committee reviews the composition of the committees and of the Board each year to ensure the members have the experience and skills required to contribute fully to the work of these bodies. To that end:
• The Committee reviewed the expertise and experience profile of independent directors in co-operation with the Human Resources Committee.
• The Chair of the Committee analyzed the Board’s compo-sition, each director’s term of office and the Board’s skills and expertise as a whole.
• The Committee recommended to the Board the composition and chairmanship of the committees.
• The Committee recommended the appointment of independent directors and a non-independent director to the Board.
• The Committee reviewed the integration program for new Board members.
Evaluation of committee and Board operationsThe annual program to evaluate the Board, its committees and the directors of the Caisse contributes to the quality of its governance by establishing the areas requiring improvement. Accordingly, the Committee:
• Reviewed the process for evaluating the performance of the Board, its Chair and its committees, including directors’ self-assessments.
• Analyzed the Board and committee evaluation results and recommended improvements to processes, as required.
• Discussed the effectiveness of the directors’ self-assessment process.
Code of Ethics and Professional ConductIn connection with the Code of Ethics and Professional Conduct, the Committee:
• Reviewed the statements of interests, examined, on behalf of the Board, the statements of interests submitted by the directors in accordance with the provisions in effect and transmitted these statements to the authorities designated by the Act respecting the Caisse.
• Reviewed the provisions of the Code of Ethics and Professional Conduct for Directors that pertain to personal transactions and submitted a report to the Board.
• Reviewed transactions involving securities of companies having ties with Caisse directors.
• Reviewed the report on the implementation of the Caisse’s Code of Ethics and Professional Conduct for Officers and Employees.
Policy on Responsible Investment The Caisse has a Policy on Responsible Investment. In this regard, the Committee:
• Submitted to the Board recommended changes to the Policy on the Principles Governing the Exercise of Voting Rights of Public Companies.
• Reviewed the report on the exercise of the Caisse’s voting rights with respect to its portfolio companies.
• Reviewed and discussed the measurement of the effects of the Caisse’s shareholder engagement, namely its exercise of voting rights and its dialogue with portfolio companies.
• Received a report on a conference jointly organized by the Caisse and a partner to enable academics to present research conducted in Québec in the field of responsible investment.
Caisse• Discussed a candidate for the position of director at a real
estate subsidiary of the Caisse.
• Reviewed the Caisse’s Language Policy establishing standards relating to the use and quality of the French language in the organization’s oral and written communications.
• Reviewed the report on donations and sponsorships provided by the Caisse during the year and reviewed its annual budget for such activities.
uSe OF eXteRnal eXPeRtS
The Governance and Ethics Committee did not use the services of external experts in 2012.
Report of the Governance Report of the Governance and Ethics Committeeand Ethics Committee

CAISSE DE DÉPÔT ET PLACEMENT DU QUÉBEC AR 2012 99
Report of the Human Resources Committee
HUMAN RESOURCES COMMITTEE HUMAN RESOURCES COMMITTEE
Mandate
The mandate of the Human Resources Committee is to review the orientations and strategies used by the Caisse to manage its human resources, including performance evaluation, succession planning and executive compensation as well as its general human resources practices.
For a full description of the mandate of the Human Resources Committee, please consult the Governance section of the Caisse’s website (www.lacaisse.com).
COMPOSItIOn (as at december 31, 2012)
The Committee is composed of three independent members:
• Chair: Elisabetta Bigsby • Members: Ouma Sananikone and Robert Tessier
aCtIVItY RePORt
Number of meetings held in 2012: 8
During the year, the Committee paid special attention to integrated talent management, focusing on:
• Talent management programs and measures of success; • Succession planning; and• The incentive compensation policy.
The Committee provided oral and written reports on its activities to the Board of Directors after each meeting. In addition, at each meeting, the Committee members met without the presence of senior management. This report, which was approved by the Committee members, discusses the highlights of their work.
Senior management The Committee considered Mr. Sabia’s objectives for 2012 as President and Chief Executive Officer and recommended that the Board of Directors approve them. It also reviewed the results of the evaluation of members of the senior management and the President and Chief Executive Officer, achieved in 2011.
The Committee also examined and recommended the following items to the Board for approval:
• Performance evaluations of members of senior management and determination of their total compensation (base salary, incentive compensation, pension plan and benefits);
• The appointment of Michèle Boisvert as Executive Vice- President, Public Affairs;
• The transfer of the functions of the Chief Operations Officer to Bernard Morency, Executive Vice-President, Depositors, Strategy and Chief Operations Officer;
• The performance evaluation and total compensation condi-tions of the President and Chief Executive Officer;
• The succession plan for senior management and the position of President and Chief Executive Officer.
01 01 ValValidation of activities idation of activities carried out to implement carried out to implement
the integrated talent management the integrated talent management strategy. strategy.
02 02 FolFollow-up on compensation low-up on compensation practices in the market and practices in the market and
review of the Compensation Policy. review of the Compensation Policy. 03 03 RevReview of the management iew of the management
succession plan.succession plan.
HIGHLIGHTSHIGHLIGHTS

CAISSE DE DÉPÔT ET PLACEMENT DU QUÉBEC AR 2012 100
Key strategies and policies for integrated talent managementDuring the year, the Committee discussed several key strategies and policies for integrated talent management. To that end, the Committee:
• Reviewed and discussed initiatives taken regarding employee engagement;
• Analyzed various management indicators, including indicators of operational risks related to human resources management and those affecting the representation of women in investment positions, as team leaders and in succession plans;
• Reviewed the impacts of professional development and leadership development initiatives;
• Reviewed the performance management strategy;
• Reviewed the entire employee compensation structure and recommended it to the Board of Directors for approval.
Independent members of the Board of Directors The Committee reviewed the expertise and experience profile of the independent members of the Board of Directors in co-operation with the Governance and Ethics Committee.
Use of external experts In exercising their functions, the Board of Directors and its committees may use external experts. As part of monitoring the incentive compensation program, the Committee and the Board used the services of Hugessen Consulting, an independent consulting firm recognized for its expertise in the compen-sation of personnel working in the pension fund sector. The Committee considers Hugessen’s recommendations, but makes its own decisions, which may be based on information other than Hugessen’s recommendations.
COMPenSatIOn POlICY
Committee’s work on compensation During 2012, the Committee, with advice from Hugessen Consulting, ensured that the Compensation Policy adopted in 2010 would meet its strategic objectives of paying for long-term performance, offering competitive compensation and linking the interests of officers and depositors. The Committee reviewed how the Caisse’s Compensation Policy had been applied; it analyzed the proposed incentive compen-sation and proposals for implementation of the co-investment program and ensured that the proposals were aligned with the Compensation Policy and market practices.
Accordingly, the Committee analyzed and recommended to the Board for approval the amount of incentive compensation to be paid under the incentive compensation program.
Moreover, the Committee received an update on compensation market trends with regard to salary reviews. It also discussed the salary conditions of the Caisse’s employees in 2012, recom-mending them to the Board for approval.
FrameworkThe Caisse’s Compensation Policy was adopted in accor-dance with Appendix A of the regulation governing the internal management of the Caisse (the Internal Bylaw). This schedule was revised by government decree in 1996 and:
• Defines the maximum levels of total employee compensation and the reference markets;
• States that the data reflecting the reference-market profile must be compiled by a recognized independent firm through an annual survey and must be administered and analyzed according to a methodology and rules generally accepted in the field; and
• Stipulates that the Caisse’s payroll must not exceed 100% of the salary-scale midpoint.
Report of the Human Report of the Human Resources CommitteeResources Committee

CAISSE DE DÉPÔT ET PLACEMENT DU QUÉBEC AR 2012 101
Reference markets and compensation levels1
For the position of President and Chief Executive Officer, the reference market consists of a sample of eight large Canadian pension funds as listed in Table 59 (p. 109). For this position, total compensation must be between the median and third quartile (75th percentile) of the reference market, depending on whether the Caisse’s performance is average or superior.
For investment-related positions, the Canadian institutional investment market serves as the reference. A representative sample must include institutions, insurance companies, trust companies, pension funds, investment advisors, brokerage firms and fund managers or their counterparts in similar indus-tries. The current sample comprises the 52 organizations listed in Table 57 (p. 108). For these positions, total compensation must be below the top decile (90th percentile) of the reference market.
For non-investment positions, the Québec market serves as the reference, which must include public-sector jobs. It therefore contains a representative sample of large public- and private-sector Québec firms and financial-sector companies. The current sample comprises the 51 organizations listed in Table 58 (p. 109). For these positions, total compensation must be at the third quartile (75th percentile) of the reference market.
In 2012, the Caisse retained the services of Towers Watson for benchmarking of its reference markets. The selection criteria used to determine the companies in the reference markets include size, industry and companies that recruit talent similar to the profiles sought by the Caisse, offering innovative and diverse investment products, that are recognized for best practices in human resources, that have a performance-driven culture and that are included in the Towers Watson database.
Strategic objectives of the Compensation Policy The Caisse must rely on highly skilled employees to fulfill its mission, which is to receive moneys on deposit as provided by law and manage them with a view to achieving an optimal return on capital within the framework of depositors’ investment policies while at the same time contributing to Québec’s economic development.
The total compensation policy therefore has the following three objectives:
1. Pay for performance: Incentive compensation should be proportional to the returns delivered to depositors. This goal has four key components:
• long-term focus: compensate consistent performance over many years;
• Risk-return balance: encourage measured risk-taking conducive to sustainable, long-term returns for depositors, taking into account their risk tolerance;
• Overall evaluation: strike a balance between individual contribution, portfolio and Caisse performance;
• emphasis on the Caisse’s overall perspective: greater emphasis on employees’ contributions to the Caisse’s strategic priorities and overall performance, with more focus on leadership and desired behaviours.
2. Offer competitive compensation: Attract, motivate and retain employees with experience and expertise that allow the Caisse to attain its strategic objectives, within the guidelines in the Internal Bylaw, as described above.
3. link the interests of officers and depositors: Ensure that their individual and team efforts are conducive to the Caisse’s long-term, sustainable success.
This objective is supported by an incentive compensation program, introduced in 2010 and discussed on page 102 of this Annual Report. It recognizes consistent performance over a four-year period with incentive compensation and deferral of a portion of this incentive compensation in a co-investment portfolio over a three-year period (see page 104). This mechanism links the interests of officers and depositors by varying these amounts along with the absolute return generated for depositors.
Finally, the Caisse’s incentive compensation policies comply with the Principles for Sound Compensation Practices issued by the Financial Stability Forum (FSF) and endorsed by the G20 nations: effective compensation governance; alignment of compensation with long-term, measured risk taking; and regular review of compensation practices.
1. For compensation purposes, the first quartile ranges from the 1st to 25th percentile, the second quartile from the 26th to 50th percentile, the third quartile from the 51st to the 75th percentile and the fourth quartile from the 76th to 100th percentile.
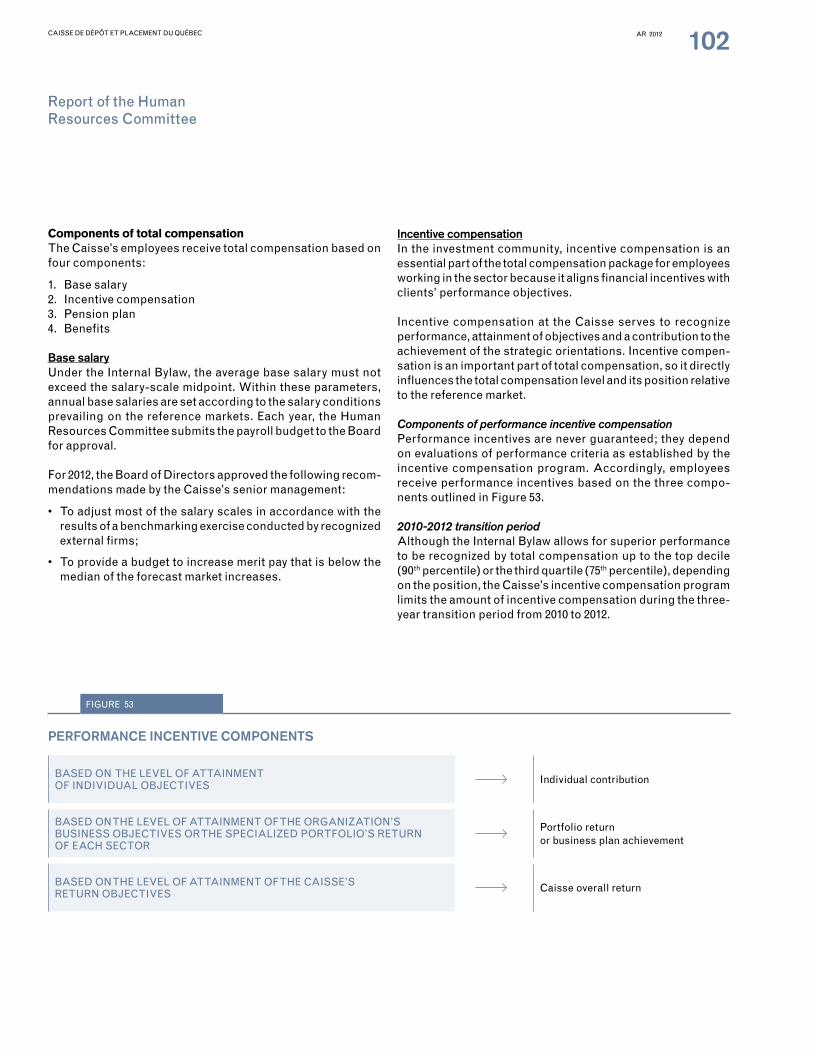
CAISSE DE DÉPÔT ET PLACEMENT DU QUÉBEC AR 2012 102
Components of total compensation The Caisse’s employees receive total compensation based on four components:
1. Base salary 2. Incentive compensation 3. Pension plan 4. Benefits
Base salaryUnder the Internal Bylaw, the average base salary must not exceed the salary-scale midpoint. Within these parameters, annual base salaries are set according to the salary conditions prevailing on the reference markets. Each year, the Human Resources Committee submits the payroll budget to the Board for approval.
For 2012, the Board of Directors approved the following recom-mendations made by the Caisse’s senior management:
• To adjust most of the salary scales in accordance with the results of a benchmarking exercise conducted by recognized external firms;
• To provide a budget to increase merit pay that is below the median of the forecast market increases.
Incentive compensationIn the investment community, incentive compensation is an essential part of the total compensation package for employees working in the sector because it aligns financial incentives with clients’ performance objectives.
Incentive compensation at the Caisse serves to recognize performance, attainment of objectives and a contribution to the achievement of the strategic orientations. Incentive compen-sation is an important part of total compensation, so it directly influences the total compensation level and its position relative to the reference market.
Components of performance incentive compensation Performance incentives are never guaranteed; they depend on evaluations of performance criteria as established by the incentive compensation program. Accordingly, employees receive performance incentives based on the three compo-nents outlined in Figure 53.
2010-2012 transition period Although the Internal Bylaw allows for superior performance to be recognized by total compensation up to the top decile (90th percentile) or the third quartile (75th percentile), depending on the position, the Caisse’s incentive compensation program limits the amount of incentive compensation during the three-year transition period from 2010 to 2012.
Report of the Human Report of the Human Resources CommitteeResources Committee
FIGURE 53
BASED ON THE LEVEL OF ATTAINMENT OF INDIVIDUAL OBJECTIVES Individual contribution
BASED ON THE LEVEL OF ATTAINMENT OF THE ORGANIzATION’S BUSINESS OBJECTIVES OR THE SPECIALIzED PORTFOLIO’S RETURN OF EACH SECTOR
Portfolio return or business plan achievement
BASED ON THE LEVEL OF ATTAINMENT OF THE CAISSE’S RETURN OBJECTIVES Caisse overall return
PeRFORManCe InCentIVe COMPOnentS

CAISSE DE DÉPÔT ET PLACEMENT DU QUÉBEC AR 2012 103
Given that this is the third year of the new incentive compen-sation program, which is structured to cover four years of returns, the Caisse introduced limits on the payments possible under the incentive compensation program, which came into effect in 2010. The purpose of this interim measure is to ensure compliance with the first objective of the program, which is to reward sustained performance over several years.
2012 achievements In 2012, the Caisse generated a return of 9.6% representing $14.9 billion of net investment results:
• This return is higher than that of its benchmark portfolio, which is 9.3%;
• Fifteen of the 16 portfolios posted positive results;
• Since the Caisse restructured its portfolios in the summer of 2009, its annualized return has been 10.7%, despite an uncertain and volatile economic environment.
The Caisse continued to implement the key strategic objectives of its business plan, including:
• Increased presence of the Caisse in Québec
– Strong growth in the Caisse’s new investments and commitments in Québec, which reached $2.9 billion in 2012 and total $8.3 billion since 2009.
– A substantial $5.9-billion increase in the Caisse’s assets in Québec in 2012, bringing them to $47.1 billion as at December 31.
– A three-pronged development strategy for Québec:
1. Seek out and seize the best business and investment opportunities;
2. Serve as a bridge between Québec companies and global markets; and
3. Strengthen the next generation of entrepreneurial and financial leadership.
• Implementation of the new components of its investment strategy
– Creation of the Global Quality Equity portfolio managed on an absolute-return basis and focused on high-quality securities with more stable long-term returns.
– Bolstering research capacity: recruitment of experts in specific operations and industries (geology, health care, mechanical engineering, etc.) and creation of a strategic research program to develop world-class expertise and enhance decision making in investments.
– Increased direct exposure to emerging markets: from $9.6 billion at the end of 2011 to $12.1 billion at the end of 2012 as well as real estate investments of close to $600 million in Brazil.
– Consolidation and strengthening of the Caisse’s presence in the real estate market in the United States: more than $1.4 billion of investments in New York, Chicago and California.
– Better sector diversification of the Infrastructure and Private Equity portfolios and less concentration risk with the sale of interests in Heathrow Airport Holdings (HAH, formerly BAA) and Quebecor Media.
2010 and 2011 achievementsIn addition to generating returns of 13.6% in 2010 and 4.0% in 2011, the Caisse achieved all the strategic objectives in its business plan during those two years. In particular, it:
• Refocused its investment strategies on core sectors and made extensive changes to the portfolio offering so that it is more flexible and better adapted to depositors’ needs.
• Implemented a new operational business model focused on clients and efficiency.
• Maintained a fine balance between return and risk, particu-larly by:
– reducing the overall portfolio’s absolute risk and active risk;
– maintaining a robust level of liquidity; and
– reducing the overall leverage ratio (liabilities over total assets).
• Carried out a refinancing program allowing short-term debt to be repaid while improving the matching of financing sources with financed real estate assets.
• Reduced the ratio of expenses to average net assets.
• Significantly increased its assets in Québec through new investments and commitments, as well as initiatives to strengthen the Caisse’s presence among entrepreneurs.
• Merged and reorganized the real estate subsidiaries, and introduced a new strategy focused on operational expertise and assets in countries where the Caisse has a strategic advantage.
• Improved its ability to research and analyze economic and financial trends.

CAISSE DE DÉPÔT ET PLACEMENT DU QUÉBEC AR 2012 104
2012 performance incentives Taking into account the incentive compensation paid, the total compensation of the Caisse’s employees in 2012 was below the median of the reference markets for a three-year (2010, 2011 and 2012) annualized return of 9.0%. This return is $5.2 billion more than the benchmark portfolio, and is equivalent to a superior performance, meaning the 1st quartile. More specifically, a study by Towers Watson showed that the employees’ total compen-sation ranked between the 19th and the 66th percentiles (where the 100th percentile represents the highest compensation in the market) in the reference markets, depending on the position type, the specific performance of the portfolios and the compensation paid for these positions (see Table 54).
The opinion presented by Hugessen Consulting to the Caisse’s Board of Directors stated:
“We reviewed the Caisse’s returns and benchmark indexes for 2012, as well as the factors that contributed to its return, and we are satisfied with them. We can confirm, among other things, that the value-added calculations, the 2012 return multiples, the 2010-2012 average return multiples and the 2012 incentive compensation multiples are consistent with the Caisse’s incentive compensation program. In our opinion, the total amount of incentive compensation awarded under the program in 2012 is reasonable in the prevailing market condi-tions and given the Caisse’s performance in 2010, 2011 and 2012.”
Co-investment: deferred performance incentives To strike a balance between short- and long-term incentive compensation, on the basis of financial sector practices in this area, the program makes it mandatory to defer a minimum of 40% of total incentive compensation for members of senior management and 25% of that for managers and high-level professionals, in a co-investment portfolio.
Since 2011, the Caisse has offered managers and high-level professionals the option of deferring and co-investing an additional portion of their incentive compensation in a co-investment portfolio. This voluntary participation increased the amounts deferred and co-invested by more than 20% in 2012.
The purpose of the co-investment portfolio is to better align the interests of those employees with the most influence on the Caisse’s organizational and financial performance with the interests of depositors over the long term. The value of the deferred and co-invested performance incentive amounts vary – upward or downward – along with the Caisse’s average absolute overall return during the incentive deferral period.
At the end of each three-year period, the deferred amount, plus or minus the average return credited for the period, will be paid to each participant as a deferred incentive payment with restric-tions. Figure 55, p. 105, illustrates this mechanism.
Members of senior management have three years to contribute at least the equivalent of their base salary to the co-investment portfolio.
Report of the Human Report of the Human Resources CommitteeResources Committee
TABLE 54
POSItIOnIng OF tOtal COMPenSatIOn BY POSItIOn tYPe
Position typeMaximum total compensation under the Bylaw1
Positioning of the total compensation paid in 2012 relative to reference markets for a superior performance over three years
Investment positions 90th percentile Between 19th and 66th percentileOn average, 35th percentileNon-investment positions 75th percentile
1. Maximum total compensation refers to percentile positions found in Schedule A of the Internal Bylaw, revised by government decree in 1996.

CAISSE DE DÉPÔT ET PLACEMENT DU QUÉBEC AR 2012 105
Pension planAll employees are members of and contribute to one of two defined benefit pension plans – either the Government and Public Employees Retirement Plan (RREGOP) or the Pension Plan of Management Personnel (PPMP), depending on their position. In addition, members of senior management parti-cipate in the Supplemental Pension Plan for Designated Officers (RSRCD). Under both plans, these executives are entitled, after the normal age of retirement, to receive a total annual pension equal to 2% of their eligible earnings for each year or fractional year of plan membership, taking into account the annual tax limits imposed by the Canada Revenue Agency for each year they were not RSRCD members.
Some executives will have additional years of service recognized under the RSRCD, depending on the circumstances of their hiring or promotion.
BenefitsEmployees enjoy a range of competitive benefits, including group insurance (such as medical, dental and life insurance, etc.). Moreover senior executives benefit from perquisites that mainly cover the costs associated with car allowances. The Caisse also requires its members of senior management to undergo yearly health checkups.
Review of the President and CEO’s performance and total compensation Performance reviewIn early 2012, the Committee recommended to the Board for review and approval a series of non-financial individual objec-tives proposed by the President and Chief Executive Officer. A series of major business objectives aimed to achieve targets aligned with the Caisse’s strategy and business plan.
The Human Resources Committee also evaluated the following matters: intensification of the Caisse’s activities in Québec, implementation of investment strategies, operational impro-vements, and sound risk management.
1st deferred amount
2nd deferred amount
3rd deferred amount
1st payment+/- performance
average
2nd payment+/- performance
average
3rd payment+/- performance
average
Jan. 2011 Jan. 2012 Jan. 2013 Jan. 2014 Jan. 2015 Jan. 2016
FIGURE 55
deFeRRed and CO-InVeSted PeRFORManCe InCentIVeS
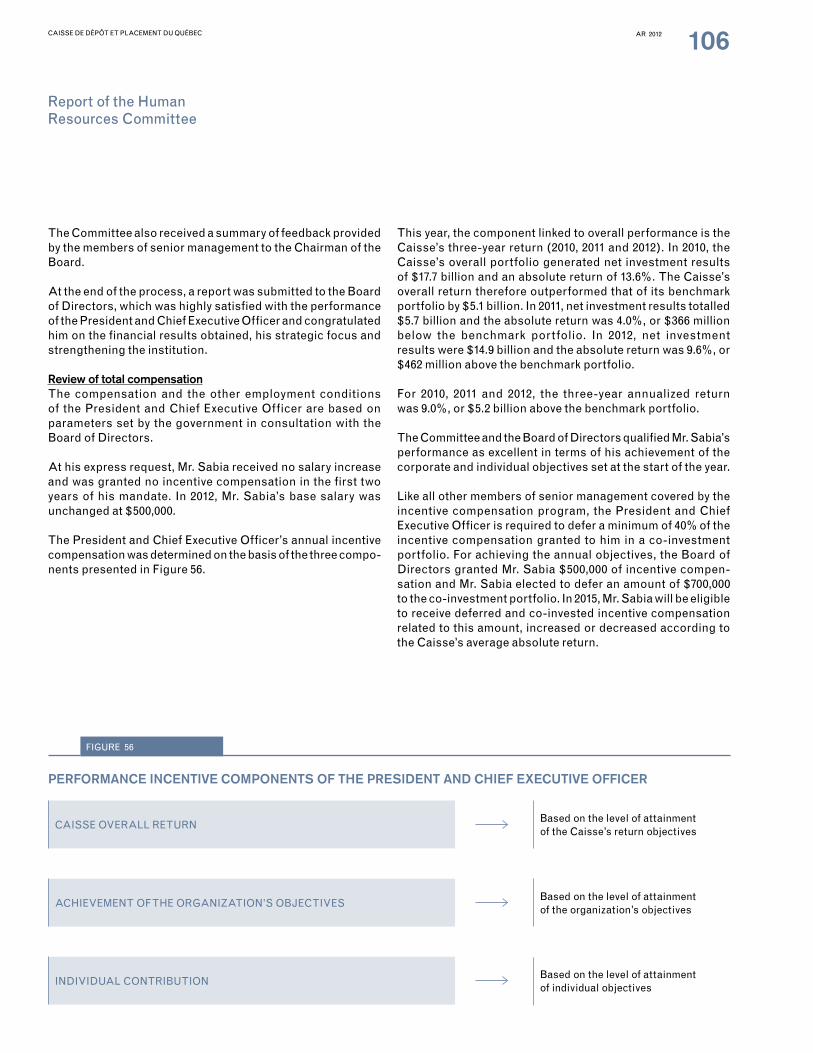
CAISSE DE DÉPÔT ET PLACEMENT DU QUÉBEC AR 2012 106
The Committee also received a summary of feedback provided by the members of senior management to the Chairman of the Board.
At the end of the process, a report was submitted to the Board of Directors, which was highly satisfied with the performance of the President and Chief Executive Officer and congratulated him on the financial results obtained, his strategic focus and strengthening the institution.
Review of total compensationThe compensation and the other employment conditions of the President and Chief Executive Officer are based on parameters set by the government in consultation with the Board of Directors.
At his express request, Mr. Sabia received no salary increase and was granted no incentive compensation in the first two years of his mandate. In 2012, Mr. Sabia’s base salary was unchanged at $500,000.
The President and Chief Executive Officer’s annual incentive compensation was determined on the basis of the three compo-nents presented in Figure 56.
This year, the component linked to overall performance is the Caisse’s three-year return (2010, 2011 and 2012). In 2010, the Caisse’s overall portfolio generated net investment results of $17.7 billion and an absolute return of 13.6%. The Caisse’s overall return therefore outperformed that of its benchmark portfolio by $5.1 billion. In 2011, net investment results totalled $5.7 billion and the absolute return was 4.0%, or $366 million below the benchmark portfolio. In 2012, net investment results were $14.9 billion and the absolute return was 9.6%, or $462 million above the benchmark portfolio.
For 2010, 2011 and 2012, the three-year annualized return was 9.0%, or $5.2 billion above the benchmark portfolio.
The Committee and the Board of Directors qualified Mr. Sabia’s performance as excellent in terms of his achievement of the corporate and individual objectives set at the start of the year.
Like all other members of senior management covered by the incentive compensation program, the President and Chief Executive Officer is required to defer a minimum of 40% of the incentive compensation granted to him in a co-investment portfolio. For achieving the annual objectives, the Board of Directors granted Mr. Sabia $500,000 of incentive compen-sation and Mr. Sabia elected to defer an amount of $700,000 to the co-investment portfolio. In 2015, Mr. Sabia will be eligible to receive deferred and co-invested incentive compensation related to this amount, increased or decreased according to the Caisse’s average absolute return.
Report of the Human Report of the Human Resources CommitteeResources Committee
FIGURE 56
CAISSE OVERALL RETURNBased on the level of attainment of the Caisse’s return objectives
ACHIEVEMENT OF THE ORGANIzATION’S OBJECTIVESBased on the level of attainment of the organization’s objectives
INDIVIDUAL CONTRIBUTIONBased on the level of attainment of individual objectives
PeRFORManCe InCentIVe COMPOnentS OF tHe PReSIdent and CHIeF eXeCutIVe OFFICeR

CAISSE DE DÉPÔT ET PLACEMENT DU QUÉBEC AR 2012 107
The other employment conditions to which Mr. Sabia is entitled are aligned with the Caisse’s policies and comply with parameters set out in the Internal Bylaw. He receives $40,000 in annual perquisites and is a member of the Caisse’s Employee Group Insurance Plan.
For the duration of his mandate, Mr. Sabia has waived membership in any pension plan. He has also waived any severance pay, whatever the cause. However, given that membership in the Basic Pension Plan for Management is mandatory under the provisions of the Pension Plan of Management Personnel (according to CARRA rules), Mr. Sabia must be a member despite his waiver. In 2012, contributions to the mandatory basic plan represented an annual cost of $16,277 to the Caisse.
In 2012, the total compensation of the President and Chief Executive Officer, including deferred and co-invested incentive compensation, for a superior performance, was 62% lower than the maximum direct compensation potential of the reference market, which is made up of his peers at eight large pension funds. For a superior performance, a gap of about $2.9 million exists between the total compensation of the President and Chief Executive Officer and the maximum direct compensation potential provided by the policies of the companies included in the reference market.
Compensation of the President and CEO and the five most highly compensated executives for 2010-2012 The Caisse’s Board of Directors recognizes the importance of qualified leadership and firmly believes that the policies and programs it has endorsed make it possible to:
• offer competitive compensation in a market where compe-tition for talent is intense and where the Caisse must compete globally to generate the expected returns; and• achieve the strategic objectives that help the Caisse fulfill
its mission.
In accordance with the Act respecting the Caisse de dépôt et placement du Québec, the Caisse discloses below, for itself and its wholly owned subsidiaries, the compensation of the President and Chief Executive Officer and that of the five most highly compensated executives reporting directly to him (see Table 60, p. 110).

CAISSE DE DÉPÔT ET PLACEMENT DU QUÉBEC AR 2012 108
Report of the Human Report of the Human Resources CommitteeResources Committee
ReFeRenCe MaRket – InVeStMent POSItIOnS
•• Addenda CapitalAddenda Capital•• AEGON Fund ManagementAEGON Fund Management•• Air CanadaAir Canada•• Alberta Investment Management Alberta Investment Management
CorporationCorporation•• Alberta Teacher’s Retirement Fund Alberta Teacher’s Retirement Fund
BoardBoard•• ATB FinancialATB Financial•• BIMCORBIMCOR•• British Columbia Investment British Columbia Investment
Management CorporationManagement Corporation•• Canada Post CorporationCanada Post Corporation•• Canadian Broadcasting Canadian Broadcasting
CorporationCorporation•• City of EdmontonCity of Edmonton•• CN Investment DivisionCN Investment Division•• CPP Investment BoardCPP Investment Board•• Desjardins Asset ManagementDesjardins Asset Management•• Economical Insurance GroupEconomical Insurance Group•• Greystone Managed InvestmentsGreystone Managed Investments•• Halifax Regional Municipality Halifax Regional Municipality
Pension PlanPension Plan•• Healthcare of Ontario Pension Healthcare of Ontario Pension
Plan (HOOPP)Plan (HOOPP)
•• Hydro-QuébecHydro-Québec•• HSBC Global Asset Management HSBC Global Asset Management
CanadaCanada•• Industrial Alliance Insurance and Industrial Alliance Insurance and
Financial ServicesFinancial Services•• Insurance Corporation of British Insurance Corporation of British
ColumbiaColumbia•• Intact Investment ManagementIntact Investment Management•• Leith Wheeler Investment CounselLeith Wheeler Investment Counsel•• Lucie and André Chagnon Lucie and André Chagnon
FoundationFoundation•• Mclean & PartnersMclean & Partners•• MD Physician ServicesMD Physician Services•• MFS Investment ManagementMFS Investment Management•• Montreal Police Benevolent & Montreal Police Benevolent &
Pension AssociationPension Association•• Montrusco Bolton InvestmentsMontrusco Bolton Investments•• New Brunswick Investment New Brunswick Investment
Management CorporationManagement Corporation•• Nexus Investment ManagementNexus Investment Management•• Nova Scotia, Department of Nova Scotia, Department of
Finance (LMTS)Finance (LMTS)•• Ontario Municipal Employees Ontario Municipal Employees
Retirement System (OMERS)Retirement System (OMERS)•• Ontario Teachers’ Pension Plan Ontario Teachers’ Pension Plan
(OTPP)(OTPP)
•• Ontario Pension BoardOntario Pension Board•• OPSEU Pension TrustOPSEU Pension Trust•• Palos ManagementPalos Management•• Pembroke ManagementPembroke Management•• RBC Global Asset ManagementRBC Global Asset Management•• Société de Transport de MontréalSociété de Transport de Montréal•• Sun Life FinancialSun Life Financial•• TD Asset ManagementTD Asset Management•• Telus CommunicationTelus Communication•• Tetrem Capital ManagementTetrem Capital Management•• The Canadian Medical Protective The Canadian Medical Protective
AssociationAssociation•• The Civil Service Superannuation The Civil Service Superannuation
BoardBoard•• The Great-West Life Assurance The Great-West Life Assurance
CompanyCompany•• The Public Sector Pension The Public Sector Pension
Investment Board (PSP Investment Board (PSP Investments)Investments)•• University of British Columbia University of British Columbia
Investment Management TrustInvestment Management Trust•• Worker’s Compensation Board of Worker’s Compensation Board of
AlbertaAlberta•• Workplace Safety and Insurance Workplace Safety and Insurance
Board (Ontario)Board (Ontario)
TABLE 57

CAISSE DE DÉPÔT ET PLACEMENT DU QUÉBEC AR 2012 109
ReFeRenCe MaRket – nOn-InVeStMent POSItIOnS
•• Agropur CooperativeAgropur Cooperative•• AimiaAimia•• Air CanadaAir Canada•• Alcoa CanadaAlcoa Canada•• Astrazeneca CanadaAstrazeneca Canada•• Bank of MontrealBank of Montreal•• Bell Aliant Regional Bell Aliant Regional
CommunicationsCommunications•• Bell CanadaBell Canada•• BombardierBombardier•• Bombardier AerospaceBombardier Aerospace•• BRPBRP•• Canadian Broadcasting Canadian Broadcasting
CorporationCorporation•• Canadian National Railway Canadian National Railway
CompanyCompany•• CN Investment DivisionCN Investment Division•• COGECOCOGECO•• Desjardins GroupDesjardins Group
•• DessauDessau•• DomtarDomtar•• Ericsson CanadaEricsson Canada•• Gaz MétroGaz Métro•• General Electric CanadaGeneral Electric Canada•• GescaGesca•• Hydro-QuébecHydro-Québec•• IBM CanadaIBM Canada•• Intact Financial Corporation Intact Financial Corporation •• Intact Investment ManagementIntact Investment Management•• KrugerKruger•• L’Oréal CanadaL’Oréal Canada•• Loto-QuébecLoto-Québec•• McKesson CanadaMcKesson Canada•• MetroMetro•• Microsoft CanadaMicrosoft Canada•• Molson Coors CanadaMolson Coors Canada•• Northbridge Financial CorporationNorthbridge Financial Corporation•• Novartis Pharmaceuticals CanadaNovartis Pharmaceuticals Canada
•• Power Corporation of CanadaPower Corporation of Canada•• QuebecorQuebecor•• Rio Tinto CanadaRio Tinto Canada•• SaputoSaputo•• SGI CanadaSGI Canada•• SNC-Lavalin GroupSNC-Lavalin Group•• Telus CommunicationTelus Communication•• TembecTembec•• The Cadillac Fairview CorporationThe Cadillac Fairview Corporation•• The Great-West Life Assurance The Great-West Life Assurance
CompanyCompany•• The Public Sector Pension The Public Sector Pension
Investment Board (PSP Investment Board (PSP Investments)Investments)•• TMX GroupTMX Group•• Transat A.T.Transat A.T.•• VIA Rail CanadaVIA Rail Canada•• VideotronVideotron•• Yellow MediaYellow Media
TABLE 58
ReFeRenCe MaRket – PReSIdent and CHIeF eXeCutIVe OFFICeR
•• Alberta Investment Management Alberta Investment Management CorporationCorporation
•• BIMCORBIMCOR•• British Columbia Investment British Columbia Investment
Management CorporationManagement Corporation
•• CPP Investment BoardCPP Investment Board•• Healthcare of Ontario Pension Plan Healthcare of Ontario Pension Plan
(HOOPP)(HOOPP)•• Ontario Municipal Employees Ontario Municipal Employees
Retirement System (OMERS)Retirement System (OMERS)
•• Ontario Teachers’ Pension Plan Ontario Teachers’ Pension Plan (OTPP)(OTPP)
•• The Public Sector Pension The Public Sector Pension Investment Board (PSP Investments)Investment Board (PSP Investments)
TABLE 59
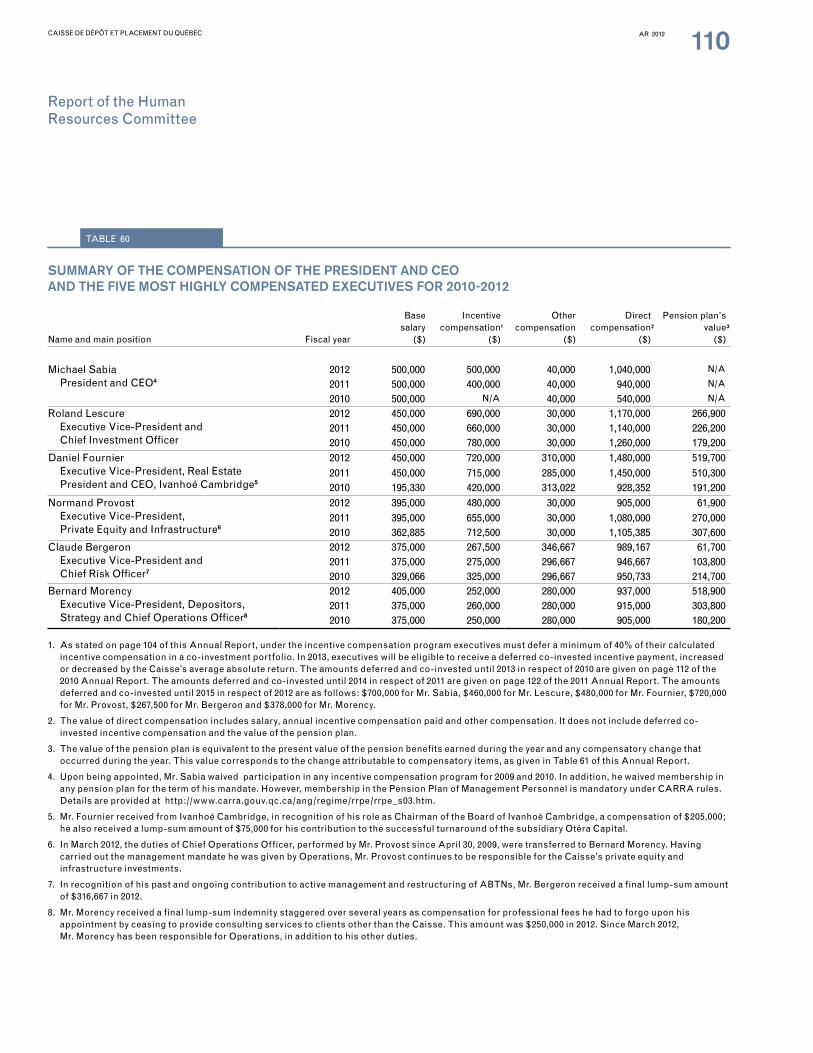
CAISSE DE DÉPÔT ET PLACEMENT DU QUÉBEC AR 2012 110
Report of the Human Report of the Human Resources CommitteeResources Committee
TABLEAU 108TABLE 60
SuMMaRY OF tHe COMPenSatIOn OF tHe PReSIdent and CeO and tHe FIVe MOSt HIgHlY COMPenSated eXeCutIVeS FOR 2010-2012
Name and main position Fiscal year
Base salary
($)
Incentive compensation
($)
Other compensation
($)
Direct compensation
($)
Pension plan’s value
($)
Michael Sabia President and CEO4
2012 500,000 500,000 40,000 1,040,000 N/A
2011 500,000 400,000 40,000 940,000 N/A
2010 500,000 N/A 40,000 540,000 N/A
Roland Lescure Executive Vice-President and
Chief Investment Officer
2012 450,000 690,000 30,000 1,170,000 266,9002011 450,000 660,000 30,000 1,140,000 226,2002010 450,000 780,000 30,000 1,260,000 179,200
Daniel Fournier Executive Vice-President, Real Estate President and CEO, Ivanhoé Cambridge5
2012 450,000 720,000 310,000 1,480,000 519,7002011 450,000 715,000 285,000 1,450,000 510,3002010 195,330 420,000 313,022 928,352 191,200
Normand Provost Executive Vice-President,
Private Equity and Infrastructure6
2012 395,000 480,000 30,000 905,000 61,9002011 395,000 655,000 30,000 1,080,000 270,0002010 362,885 712,500 30,000 1,105,385 307,600
Claude Bergeron Executive Vice-President and Chief Risk Officer7
2012 375,000 267,500 346,667 989,167 61,7002011 375,000 275,000 296,667 946,667 103,8002010 329,066 325,000 296,667 950,733 214,700
Bernard Morency Executive Vice-President, Depositors,
Strategy and Chief Operations Officer8
2012 405,000 252,000 280,000 937,000 518,9002011 375,000 260,000 280,000 915,000 303,8002010 375,000 250,000 280,000 905,000 180,200
1. As stated on page 104 of this Annual Report, under the incentive compensation program executives must defer a minimum of 40% of their calculated incentive compensation in a co-investment portfolio. In 2013, executives will be eligible to receive a deferred co-invested incentive payment, increased or decreased by the Caisse’s average absolute return. The amounts deferred and co-invested until 2013 in respect of 2010 are given on page 112 of the 2010 Annual Report. The amounts deferred and co-invested until 2014 in respect of 2011 are given on page 122 of the 2011 Annual Report. The amounts deferred and co-invested until 2015 in respect of 2012 are as follows: $700,000 for Mr. Sabia, $460,000 for Mr. Lescure, $480,000 for Mr. Fournier, $720,000 for Mr. Provost, $267,500 for Mr. Bergeron and $378,000 for Mr. Morency.
2. The value of direct compensation includes salary, annual incentive compensation paid and other compensation. It does not include deferred co-invested incentive compensation and the value of the pension plan.
3. The value of the pension plan is equivalent to the present value of the pension benefits earned during the year and any compensatory change that occurred during the year. This value corresponds to the change attributable to compensatory items, as given in Table 61 of this Annual Report.
4. Upon being appointed, Mr. Sabia waived participation in any incentive compensation program for 2009 and 2010. In addition, he waived membership in any pension plan for the term of his mandate. However, membership in the Pension Plan of Management Personnel is mandatory under CARRA rules. Details are provided at http://www.carra.gouv.qc.ca/ang/regime/rrpe/rrpe_s03.htm.
5. Mr. Fournier received from Ivanhoé Cambridge, in recognition of his role as Chairman of the Board of Ivanhoé Cambridge, a compensation of $205,000; he also received a lump-sum amount of $75,000 for his contribution to the successful turnaround of the subsidiary Otéra Capital.
6. In March 2012, the duties of Chief Operations Officer, performed by Mr. Provost since April 30, 2009, were transferred to Bernard Morency. Having carried out the management mandate he was given by Operations, Mr. Provost continues to be responsible for the Caisse’s private equity and infrastructure investments.
7. In recognition of his past and ongoing contribution to active management and restructuring of ABTNs, Mr. Bergeron received a final lump-sum amount of $316,667 in 2012.
8. Mr. Morency received a final lump-sum indemnity staggered over several years as compensation for professional fees he had to forgo upon his appointment by ceasing to provide consulting services to clients other than the Caisse. This amount was $250,000 in 2012. Since March 2012, Mr. Morency has been responsible for Operations, in addition to his other duties.
1 2 3

CAISSE DE DÉPÔT ET PLACEMENT DU QUÉBEC AR 2012 111
TABLE 61
PenSIOn SuMMaRY OF tHe PReSIdent and CeO and tHe FIVe MOSt HIgHlY COMPenSated eXeCutIVeS
Name and main position
Years ofcreditedservice
Annual benefits($)
Accruedobligation atstart of year
($)
Changedue to
compensatoryitems
($)
Change due to non-
compensatory items
($)
Accruedobligation at
year-end($)At year-end At age 65
Michael Sabia President and CEO6 3.8 10,100 25,300 0 0 0 0Roland Lescure Executive Vice-President and Chief Investment Officer 3.2 116,600 488,700 685,900 266,900 263,600 1,216,400Daniel Fournier Executive Vice-President, Real Estate President and CEO, Ivanhoé Cambridge 2.4 87,500 252,300 810,000 519,700 220,700 1,550,400Normand Provost Executive Vice-President,
Private Equity and Infrastructure 32.6 302,100 404,100 2,325,100 61,900 715,100 3,102,100Claude Bergeron Executive Vice-President and Chief Risk Officer 32.2 216,000 321,800 1,263,500 61,700 299,300 1,624,500Bernard Morency Executive Vice-President, Depositors,
Strategy and Chief Operations Officer 3.4 78,400 161,500 605,100 518,900 15,300 1,139,300
1. This is the number of years of credited service in the basic plan.
2. Annual benefits equal the amount of the pension payable under the basic and supplemental plans at year-end or at age 65.
3. The obligations do not include those of the basic plan because employer and employee contributions are remitted to CARRA, which assumes the liability for the benefits. The Caisse’s contribution was about $16,277 per executive in 2012.
4. The change due to compensatory items includes the annual cost of pension benefits, base salary changes according to the salary increase assumption used, plan changes and the award of additional years of service.
5. The change due to non-compensatory items includes the amounts attributable to interest accrued on the obligation at the beginning of the year, actuarial gains and losses associated with non-compensatory items and changes in actuarial assumptions.
6. Mr. Sabia waived membership in any pension plan. However, membership in the Pension Plan of Management Personnel is mandatory under CARRA rules. Details are provided at http://www.carra.gouv.qc.ca/ang/regime/rrpe/rrpe_s03.htm.
1
2
3 4 5 3

CAISSE DE DÉPÔT ET PLACEMENT DU QUÉBEC AR 2012 112
Report of the Human Report of the Human Resources CommitteeResources Committee
TABLE 62
SuMMaRY OF SeVeRanCe PaY FOR tHe PReSIdent and CeO and tHe FIVe MOSt HIgHlY COMPenSated eXeCutIVeS
Name and main position Precipitating eventTheorical amount payable
($)
Michael Sabia President and CEO1 Contract termination 0Roland Lescure Executive Vice-President and Chief Investment Officer2 Non-voluntary termination 900,000Daniel Fournier Executive Vice-President, Real Estate President and CEO, Ivanhoé Cambridge2 Non-voluntary termination 900,000Normand Provost Executive Vice-President, Private Equity and Infrastructure3 Non-voluntary termination 790,000Claude Bergeron Executive Vice-President and Chief Risk Officer4 Non-voluntary termination 750,000Bernard Morency Executive Vice-President, Depositors, Strategy and
Chief Operations Officer4 Non-voluntary termination 830,000
1. No severance pay is payable even if the departure is involuntary.
2. In the event of dismissal without just and sufficient cause, this executive’s employment contract provides severance pay equal to twice his annual base salary.
3. This executive’s employment contract does not include a specific condition related to termination of his employment. His severance pay is therefore based on the Caisse’s guidelines on this matter, which provide one month of base salary for each year of service, to a maximum of 24 months.
4. In the event of dismissal without just and sufficient cause, this executive’s employment contract provides severance pay equal to his annual base salary, plus an amount equal to his annual target incentive compensation.
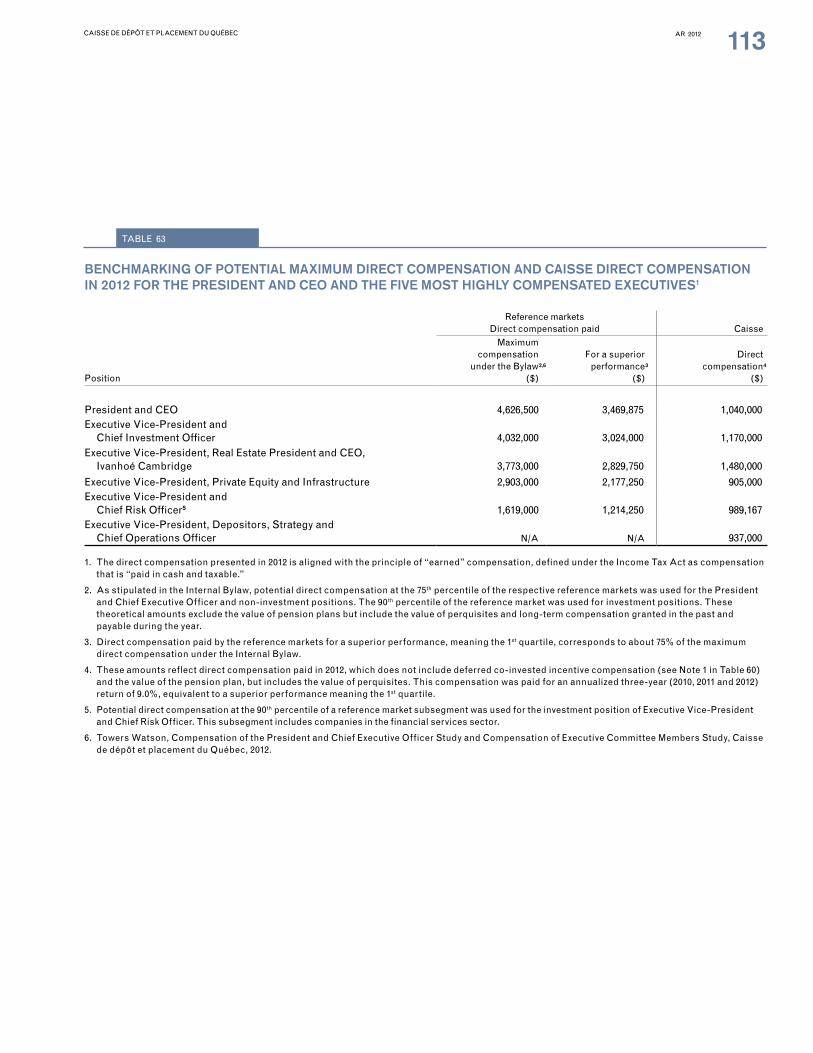
CAISSE DE DÉPÔT ET PLACEMENT DU QUÉBEC AR 2012 113
BenCHMaRkIng OF POtentIal MaXIMuM dIReCt COMPenSatIOn and CaISSe dIReCt COMPenSatIOn In 2012 FOR tHe PReSIdent and CeO and tHe FIVe MOSt HIgHlY COMPenSated eXeCutIVeS1
Reference marketsDirect compensation paid Caisse
Position
Maximum compensation
under the Bylaw ($)
For a superior performance
($)
Direct compensation
($)
President and CEO 4,626,500 3,469,875 1,040,000Executive Vice-President and
Chief Investment Officer 4,032,000 3,024,000 1,170,000Executive Vice-President, Real Estate President and CEO,
Ivanhoé Cambridge 3,773,000 2,829,750 1,480,000
Executive Vice-President, Private Equity and Infrastructure 2,903,000 2,177,250 905,000Executive Vice-President and
Chief Risk Officer5 1,619,000 1,214,250 989,167Executive Vice-President, Depositors, Strategy and
Chief Operations Officer N/A N/A 937,000
1. The direct compensation presented in 2012 is aligned with the principle of “earned” compensation, defined under the Income Tax Act as compensation that is “paid in cash and taxable.”
2. As stipulated in the Internal Bylaw, potential direct compensation at the 75th percentile of the respective reference markets was used for the President and Chief Executive Officer and non-investment positions. The 90th percentile of the reference market was used for investment positions. These theoretical amounts exclude the value of pension plans but include the value of perquisites and long-term compensation granted in the past and payable during the year.
3. Direct compensation paid by the reference markets for a superior performance, meaning the 1st quartile, corresponds to about 75% of the maximum direct compensation under the Internal Bylaw.
4. These amounts reflect direct compensation paid in 2012, which does not include deferred co-invested incentive compensation (see Note 1 in Table 60) and the value of the pension plan, but includes the value of perquisites. This compensation was paid for an annualized three-year (2010, 2011 and 2012) return of 9.0%, equivalent to a superior performance meaning the 1st quartile.
5. Potential direct compensation at the 90th percentile of a reference market subsegment was used for the investment position of Executive Vice-President and Chief Risk Officer. This subsegment includes companies in the financial services sector.
6. Towers Watson, Compensation of the President and Chief Executive Officer Study and Compensation of Executive Committee Members Study, Caisse de dépôt et placement du Québec, 2012.
2,6 3 4
TABLE 63

CAISSE DE DÉPÔT ET PLACEMENT DU QUÉBEC AR 2012 114
Report of the Risk Management Committee
THE RISK MANAGEMENT COMMITTEE THE RISK MANAGEMENT COMMITTEE
The Board of Directors established the Risk Management Committee to assist the Audit Committee with its responsi-bility of implementing a risk management process.
Mandate
The Committee’s mandate is to establish guidelines and policies for risk management. In this way, it seeks to ensure that the Caisse’s business, financial and operational risks are kept at appropriate levels.
A full description of the Risk Management Committee’s mandate can be found in the Governance section of the Caisse’s website (www.lacaisse.com).
COMPOSItIOn (as at december 31, 2012)
• Chair: Réal Raymond• Members: François R. Roy and Ouma Sananikone • Guest member: A. Michel Lavigne, Chair of the Audit
Committee
The Chairman of the Board attends the Committee’s meetings.
aCtIVItY RePORt
Number of meetings held in 2012: 11
The Committee has various mechanisms to provide the Audit Committee and the Board with the necessary assurance regarding implementation of a risk management process. The Committee:
• provided oral and written reports on its activities to the Board of Directors after each meeting;
• made copies of its minutes available to the Audit Committee and the Board; and
• invited the Chair of the Audit Committee to each meeting.
The Committee held meetings regularly without the presence of senior management.
The following report, which was approved by the members of the Committee, describes the main subjects they discussed or decided during the year.
HIGHLIGHTSHIGHLIGHTS
01 01 RecRecommended the investment ommended the investment policy for the new Global policy for the new Global
Quality Equity portfolio and reviewed Quality Equity portfolio and reviewed specialized portfolios’ investment specialized portfolios’ investment policies to ensure optimal investment policies to ensure optimal investment and risk management.and risk management.
02 02 ExaExamined risk-return ratios mined risk-return ratios for the specialized portfolios for the specialized portfolios
of an investment sector and for the of an investment sector and for the Caisse as a whole. Caisse as a whole.
03 03 RevReviewed the decision-iewed the decision-making process used to making process used to
hedge the currency risk of some hedge the currency risk of some emerging markets.emerging markets.

CAISSE DE DÉPÔT ET PLACEMENT DU QUÉBEC AR 2012 115
Risk management guidelines and policies The markets again experienced periods of turbulence in 2012 owing to financial, economic and political events in the eurozone and the United States. To navigate these uncertain and volatile markets, the Caisse adjusted its over- and underweight positions according to its reading of the situation. See the Risk Management section on page 43 of this report for a detailed account of the actions taken by management to achieve optimal risk management.
As for the Committee, in 2012 it monitored all risk management work, including further risk-return integration into routine operations and adaptation of the risk management framework and processes to changes arising from strategic priorities, including management of liquidity risk and market risk.
The Committee fulfilled its responsibilities in ways that include the following:
• Examined, at each Committee meeting, risk-return reports for the specialized portfolios of an investment sector or for the Caisse as a whole;
• Analyzed, and recommended to the Board for approval, the investment policy for the new Global Quality Equity portfolio;
• Reviewed the specialized portfolios’ investment policies to ensure optimal investment and risk management, including management of emerging market currencies, and recom-mended changes to the Board of Directors;
• Reviewed the decision-making process used to hedge the currency risks of some emerging countries;
• Analyzed, and recommended to the Board for approval, amendments to the Integrated Risk Management Policy concerning approval limits for publicly traded securities and securities managed on an absolute basis;
• Reviewed and recommended to the Board, for approval, the market-risk tolerance threshold for the Caisse’s specialized portfolios and its overall portfolio, as well as the risk limit for financial instruments or contracts;
• Monitored the introduction of an issuer’s credit-risk framework that requires, among other things, detailed credit analyses of the debt securities held by the Caisse;
• Discussed the process used to manage market-liquidity risk;
• Discussed the role of the new Investment-Risk Committee, intended to foster strategic discussion of portfolio orienta-tions, as well as dialogue on and a cross-sectional view of the Caisse’s positions and orientations;
• Reviewed and monitored the business plan of the Risk group;
• Received accountability reports on compliance and internal control.
Investment proposals • Reviewed and recommended investment proposals under
the Board’s authority, considering the analysis of the team responsible for the transaction, the project’s risk analysis and, more specifically, its impact on the risk level and concen-tration of the specialized portfolio and the Caisse’s overall portfolio, as well as the investment’s compliance with risk oversight policies and guidelines;
• Discussed the risk-return relationship for each investment proposal submitted to the Committee;
• Received follow-up reports on the investment proposals authorized by the Board as well as investments authorized by senior management but not falling under the Board’s purview;
• Regularly monitored major investments with a particular impact on the risk level and concentration of the specialized portfolio and the Caisse’s overall portfolio.
Depositors • Discussed depositors’ endorsement of the Caisse’s priorities
and its strategies for implementing them;
• Analyzed the certificates of compliance with the depositors’ investment policies and the specialized portfolios’ investment policies.
uSe OF eXteRnal eXPeRtS
The Risk Management Committee did not use the services of external experts in 2012.

CAISSE DE DÉPÔT ET PLACEMENT DU QUÉBEC AR 2012 116

CAISSE DE DÉPÔT ET PLACEMENT DU QUÉBEC AR 2012 117
Board of Directors and Executive Committee

CAISSE DE DÉPÔT ET PLACEMENT DU QUÉBEC AR 2012 118
Organizational Structure
The Caisse’s Board of Directors consists of the Chairman, President and Chief Executive Officer, depositors’ representa-tives and independent members. The Act respecting the Caisse stipulates that at least two-thirds of the directors, including the Chairman, must be independent.
The Executive Committee is composed of the President and Chief Executive Officer and executives from the Caisse’s various sectors. As at December 31, 2012, the Caisse had a total of 813 employees. At this same time, the Real Estate group had a total of 1,865 employees.
Risk Management Committee
Audit Committee
Governance and Ethics Committee
Human Resources Committee
ORGANIZATIONAL STRUCTURE – CAISSE(as at December 31, 2012)
FiGuRE 64
internal Audit
Executive Committee
Depositors and Strategic Initiatives
Risk
Finance
Operations and Information Technology
Talent Management and Organizational Development
Legal Affairs and Secretariat
Public Affairs
Private Equity and Infrastructure
CHAiRMAN
BOARD OF DiRECTORS
PRESiDENT AND CHiEF EXECuTiVE OFFiCER
Fixed income
Equity Markets
Overlay Strategies
Economic Analysis and Asset Allocation Strategies
Hedge Fund of Funds
Investment Management Real Estate
Otéra Capital
ivanhoé Cambridge

CAISSE DE DÉPÔT ET PLACEMENT DU QUÉBEC AR 2012 119
REAL ESTATE GROUP
The Real Estate group makes equity and debt investments in the office, retail and residential sectors in the Americas, Europe and Asia. its holdings comprise two specialized portfolios: Real Estate and Real Estate Debt.
The Real Estate portfolio consists of the assets of ivanhoé Cambridge, one of the 10 largest real estate companies in the world. ivanhoé Cambridge is a world-class owner, manager, developer and investor. it has high-level expertise in shopping centres, office buildings and multiresidential properties.
A harmonization of the equity interests held by the share-holders of the underlying entities of the subsidiary ivanhoé Cambridge was carried out. in light of the share ownership reorganization, the Caisse’s stake in ivanhoé Cambridge now stands at close to 93%.
The Real Estate Debt portfolio consists of the holdings of Otéra Capital, which offers a full range of commercial real estate financing services in Canada (see page 31). in 2012, Otéra Capital acquired from ivanhoé Cambridge a real estate financing subsidiary, namely MCAP.
For more information on the Caisse’s real estate investments, visit our website at www.lacaisse.com.
1. Daniel Fournier, Chairman and Chief Executive Officer, ivanhoé Cambridge2. Alfonso Graceffa, President and Chief Executive Officer, Otéra Capital
Raymond McManus, Chairman, Otéra Capital
ORGANIZATIONAL STRUCTURE – REAL ESTATE(as at December 31, 2012)
FiGuRE 65
ANCAR iVANHOE MCAP
iVANHOÉ CAMBRiDGE1
(subsidiary – 93.0%)OTÉRA CAPiTAL2
(subsidiary – 97.5%)
REAL ESTATE
BOARD OF DiRECTORSivanhoé Cambridge
BOARD OF DiRECTORSOtéra Capital

CAISSE DE DÉPÔT ET PLACEMENT DU QUÉBEC AR 2012 120
Board of Directors (as at December 31, 2012)
ELiSABETTA BiGSBYCorporate Director
Chair of the Human Resources Committee Board member since November 4, 2009
Elisabetta Bigsby pursued her career at the Royal Bank of Canada from 1977 to 2007, where she was notably a member of the Executive Committee and the Chief Human Resources Officer. She also sat on the Bank’s Pension Plan Committee from 1989 to 2007. in addition to her duties as a corporate director, she advises companies on leadership development in cooperation with the international Consortium for Executive Development Research, in Massachusetts and sits on Cogeco Board of Directors. She is also a past director of a number of organizations.
LOuiSE CHARETTECorporate Director
Member of the Governance and Ethics Committee and Audit Committee Board member since April 27, 2005
Louise Charette is completing a doctorate in mathematics and holds a master’s degree in business administration. From 1981 to 2007, she held various management positions at the Commission de la construction du Québec, including Assistant Director General, Administration and Finance. in addition to her duties as Assistant Director General, she headed the investment Committee for more than ten years. Ms. Charette has also devoted her talents to a number of organizations. She was a founding member of the Regroupement des femmes cadres du Québec and was Vice-Chair of the Société d’habitation du Québec. Ms. Charette has been active with non-profit organizations for several years and sits on the Advisory Board of the Autorité des marchés financiers.
MiCHÈLE DESJARDiNSPresident, Koby Consulting Senior Associate, Lansberg Gersick & Associates LLC
Member of the Governance and Ethics Committee Board member since December 21, 2009
After pursuing a career in the pulp and paper industry with Abitibi-Price and inter City Papers, Michèle Desjardins held various positions with Price Waterhouse and the Commission des valeurs mobilières du Québec. She subsequently headed the Family Business institute. For more than 15 years, she has served as Senior Associate at Lansberg Gersick & Associates LLC and President of Koby Consulting. Ms. Desjardins is a Certified Management Consultant, a member of the Ordre des administrateurs agréés du Québec and a Certified Corporate Director. She also sits on the Boards of the Société du Palais des congrès de Montréal and Mount Sinai Hospital Montreal.
DENYS JEANPresident and Chief Executive Officer, Régie des rentes du Québec
Board member since September 14, 2011
Denys Jean has been the President and Chief Executive Officer of the Régie des rentes du Québec and a member of its Board of Directors since August 29, 2011. Mr. Jean has a Bachelor of Economics. He has held several high-level positions in the Québec public service since 1991. At the time of his appointment to the Régie des rentes du Québec, he was Secretary of the Secrétariat du Conseil du trésor, Deputy Minister at the Ministère des Services gouvernementaux and Chief information Officer. Mr Jean also served as Deputy Minister at the Ministère des Transports (2006-2009) and held the same position at the Ministère des Affaires munici-pales et des Régions (2003-2006). Prior to those appointments, he was Assistant Deputy Minister at the Ministère des Affaires munici-pales et de la Métropole (1999-2003) and at the Ministère de l’Environnement (1991- 1999). He is a member of the Boards of Directors of the Centre des services partagés du Québec and the Réseau international d’implantation d’entreprises. Mr. Jean is also a member of the Audit Committee of the Ministère de la justice and a member of the Forum des dirigeants des grands organismes.
A. MiCHEL LAViGNECorporate Director
Chair of the Audit Committee Guest Member of the Risk Management Committee Board member since April 27, 2005
A. Michel Lavigne was President and Chief Executive Officer of Raymond Chabot Grant Thornton until 2005. He was also Chairman of Grant Thornton Canada and a member of the Board of Directors of Grant Thornton international. He is Chairman of Teraxion and Primary Energy Recycling and sits on various boards of directors, including that of Quebecor Media, TVA and Canada Post. Mr. Lavigne has received many distinctions, most notably, the designation of Fellow of the Ordre des comptables professionnels agréés du Québec.
JEAN PiERRE OuELLETCorporate Director Advisor, Capital Saint-Laurent
Board member since March 6, 2009
Jean Pierre Ouellet has been an advisor to Capital Saint-Laurent since 2008. His past positions include Senior Partner at Montréal law firm, Stikeman Elliott, and Senior Vice-President, Chief Legal Officer and Corporate Secretary at Canadian National Railway. More recently, he served as Vice-Chairman of the Board of RBC Capital Markets, responsible for Québec. He is a member of the Board of the Noranda income Fund, where is the Chairman of the Governance and Human Resources Committee. Mr. Ouellet is also a member of the Québec Advisory Board of Talisman Energy. He was a board member of a number of Canadian companies in the past, including Bionair, Hartco Enterprises, C-Mac and Crédit commercial de France (Canada), as well as several non-profit organizations.

CAISSE DE DÉPÔT ET PLACEMENT DU QUÉBEC AR 2012 121
RÉAL RAYMONDCorporate Director
Chair of the Risk Management Committee Board member since March 13, 2009
During his 37-year career with National Bank of Canada, Réal Raymond held a variety of positions including President – Personal and Commercial Banking, President and Chief Operating Officer and, finally, President and Chief Executive Officer. He currently sits on the boards of directors of Metro inc., Héroux- Devtek inc., Aéroports de Montréal and the institute for Research in immunology and Cancer of université de Montréal. Mr. Raymond has an MBA from université du Québec à Montréal (uQAM) where he currently serves as Chancellor. He holds an honorary doctorate from the uQAM School of Management (ESG uQAM).
FRANÇOiS R. ROYCorporate Director
Member of the Risk Management Committee and Audit Committee Board member since December 21, 2009
François R. Roy began his career at The Bank of Nova Scotia, where he held several positions in Canada and the united States. He later worked for Société générale de financement du Québec, prior to becoming the Chief Financial Officer at Quebecor, Avenor and Telemedia Corporation. He was Chief Financial Officer at McGill university from 2007 to 2010. He has been a corporate director since 1998 and sits on the boards of directors of Transcontinental, Noranda income Fund and Capstone infrastructure Corporation. For the past 25 years, Mr. Roy has been and continues to be active with many non-profit organizations.
MiCHAEL SABiAPresident and Chief Executive Officer, Caisse de dépôt et placement du Québec
Board member since March 14, 2009
Michael Sabia has been the President and Chief Executive Officer of the Caisse since March 2009. Before joining the Caisse, Mr. Sabia was President and Chief Executive Officer of BCE and Chief Financial Officer of Canadian National Railway. Earlier in his career, he was a senior official in the Government of Canada. Mr. Sabia is a member of the Governing Council of Finance Montréal. He was also a member of the North American Competitiveness Council from 2005 to 2008. He contributes actively to the vitality of the community. He serves as co-chair of the Campus Montréal fundraising campaign (HEC, Polytechnique and université de Montréal) and of the Daffodil Ball benefiting the Canadian Cancer Society. in recent years, Mr. Sabia has served as chair or co-chair of the fundraising campaigns of various organiza-tions, including Centraide of Greater Montreal, the Montreal Heart institute Foundation, Maison Saint Gabriel and Héritage Montréal.
OuMA SANANiKONECorporate Director
Member of the Risk Management Committee and Human Resources Committee Board member since August 28, 2007
Ouma Sananikone is a corporate director with extensive experience in the European and Asian financial markets. She has worked for 25 years in banking, financial services and investment management. in particular, she held management positions at Aberdeen Asset Management (Australia), EquitiLink Group and Westpac Banking Group. She is an external director of icon Systems and Air-Serv. Ms. Sananikone has been a board member of numerous public and private companies and of charitable organizations, in Australia and elsewhere in the world. Her main areas of interest are governance, ethics, community issues and leadership.
ROBERT TESSiERChairman of the Board of Directors Caisse de dépôt et placement du Québec
Chair of the Governance and Ethics Committee Member of the Human Resources Committee Board member since March 5, 2009
Robert Tessier has an extensive background as a corporate director and senior executive in both the public and the private sectors. He has served as President and Chief Executive Officer as well as Chairman of the Board of Directors of Gaz Métro and as the head of Marine industries Limited and Alstom Canada. He has also been Secretary of the Conseil du trésor du Québec, Québec’s Deputy Minister of Energy and Natural Resources and Executive Vice-President of the Société générale de financement du Québec. Mr. Tessier is currently Chairman of the iG Funds independent Review Committee and is the Chairman of the Board of Directors of Green Mountain Power. He also sits on the Boards of Directors of the institute for Research in immunology and Cancer (iRiC) of the université de Montréal, and of the institute of Corporate Directors.

CAISSE DE DÉPÔT ET PLACEMENT DU QUÉBEC AR 2012 122
Executive Committee
CLAuDE BERGERON
Executive Vice-President and Chief Risk Officer
Claude Bergeron oversees the teams responsible for monitoring, measuring and analyzing risk. Mr. Bergeron has more than 25 years of experience with the Caisse where he has played a leading role in a number of major domestic and international files and investments. in August 2009, he became Acting Chief Risk Officer and was appointed to the position of Chief Risk Officer on November 1, 2010. under his leadership, the Caisse completed the implementation of an accelerated program to strengthen its risk management practices. Mr. Bergeron is a member of the Barreau du Québec and the Canadian Bar Association. He completed an international MBA program, specializing in financial services and insurance. He has received many awards during his career, including the Commerce-ZSA award (2007) in recognition of his law career in Québec.
MiCHÈLE BOiSVERT
Executive Vice-President, Public Affairs
Michèle Boisvert oversees external and internal communications, government relations and public relations for the Caisse. Ms. Boisvert is an economist by training and pursued a career in journalism for more than 25 years. After working at Radio-Canada, she joined La Presse in 2002, where she covered business news as a reporter, then as an editorialist and a columnist. in January 2007, Ms. Boisvert was named Editor of La Presse Affaires. in addition to her role at La Presse, she had a daily business column for seven years on the Radio-Canada show, C’est bien meilleur le matin. Ms. Boisvert is a member of the international Women’s Forum. She has received many awards throughout her career, including the YMCA’s Woman of Distinction in Communications award in 2009.
FRÉDÉRiCK CHARETTE
Executive Vice-President, Talent Management and Organizational Development
Frédérick Charette oversees the recruitment, compensation, professional development, payroll, management information and human resources advisory teams. During his career, Mr. Charette has worked both abroad and in Montréal with firms comprising high-level professionals. He was instrumental in expanding McKinsey’s organizational development practice in the Asia-Pacific region. Before joining the Caisse, he served as Head of People for KPMG Australia. Mr. Charette is a member of the international Positive Psychology Association, a member of the Neuro-Leadership institute and a board member of the Healthy Enterprises Group.
MARC CORMiER
Executive Vice-President, Fixed Income Investment Management
Marc Cormier oversees the Caisse’s fixed income teams and portfolios. He has close to 20 years of experience in the banking and investment industries. Since joining the Caisse in 1997, he has held various positions with the fixed-income investments team. Mr. Cormier has worked for several French financial institutions, including Crédit Lyonnais, in Montréal, where he served as Treasurer, and Crédit Commercial de France, in Paris.
Mr. Cormier has been a member of the Board of Directors of the Montreal institute of Structured Products and Derivatives since 2012.

CAISSE DE DÉPÔT ET PLACEMENT DU QUÉBEC AR 2012 123
DANiEL FOuRNiER
Executive Vice-President, Real Estate Chairman and Chief Executive Officer, Ivanhoé Cambridge
Daniel Fournier oversees the investments, strategies, management and development of the Caisse’s real estate portfolios. in addition, Mr. Fournier is the Chairman and Chief Executive Officer of ivanhoé Cambridge, one of the 10 largest real estate companies in the world. He has more than 30 years of experience in the business community and has solid expertise in real estate. He holds a Bachelor of History from Princeton university and a Bachelor of Arts in Jurisprudence from Oxford university, where he received a Rhodes Scholarship. Over the years, Mr. Fournier sat on the boards of directors of several leading Canadian companies. He is also very involved in his community and, among other things, is a past Chairman of the Board of the McCord Museum and a board member of the Sainte-Justine university Health Center Foundation.
MARiE GiGuÈRE, AD. E.
Executive Vice-President, Legal Affairs and Secretariat
Marie Giguère has overseen the Legal Affairs, Corporate Secretariat and Policies and Compliance teams since November 1, 2010. She has extensive experience in commercial and corporate law, as well as in mergers and acquisitions. She was a partner at Fasken Martineau for many years and held management positions at the Montréal Exchange, Molson inc. and the Caisse real estate subsidiary Otéra Capital. Ms. Giguère has a Bachelor of Civil Law from McGill university and is a member of the Barreau du Québec. She is a member of the Board of the McGill university Health Centre and is Chair of the Douglas Mental Health university institute Foundation. She is also a member of the boards of TMX Group Limited and of ivanhoé Cambridge. in 2005, she received the Commerce-ZSA award in recognition of her outstanding law career.
JEAN-LuC GRAVEL
Executive Vice-President, Equity Markets Investment Management
Jean-Luc Gravel oversees the investment teams covering equity markets. He develops strategies and explores new opportunities for all the Caisse’s equity market operations. He joined the Caisse’s Canadian Equity team in 2004, after working in securities at Gendron Norris, Nesbitt Burns, Newcrest Capital and TD Newcrest Securities. He is a Chartered Financial Analyst (CFA) and a Fellow of the Canadian Securities institute. He is currently a member of the Board of Directors of the international Financial Centre of Montréal and a member of the SMB Advisory Committee of the Autorité des marchés financiers (AMF).
ROLAND LESCuRE
Executive Vice-President and Chief Investment Officer
Roland Lescure oversees investment strategy, asset allocation and investment-related research. He directs investments in equities, fixed income and hedge funds, as well as overlay strategies. He also plays a key advisory role in private equity and real estate investments. Mr. Lescure has many years of experience in the investment field. in particular, he worked at Groupama Asset Management, Natexis and the asset management subsidiary of the Caisse des Dépôts et Consignations, as well as at the French Ministry of Finance and the institut national de la statistique et des études écono-miques (iNSEE). Mr. Lescure has also taught and has participated in many projects led by the Conseil d’analyse économique de France. He is a graduate of the École Polytechnique and the École nationale de la statistique et de l’administration économique (ENSAE) in Paris. He also earned an M.Sc. in Economics from the London School of Economics and Political Science. Mr. Lescure is a member of the Board of Directors and the Strategic Committee of the McCord Museum, and of the Board of Directors and the investment Committee of the Foundation of Greater Montreal.
PiERRE MiRON
Executive Vice-President, Operations and Information Technology
Pierre Miron’s mandate includes further repositioning of the Operations and information Technology teams to enhance their agility and effectiveness and to ensure they are well aligned with the needs of the sectors they serve. Mr. Miron has more than 28 years of experience in information technology management, of which the last 17 years have been in the financial sector. Before joining the Caisse in 2010 as Senior Vice-President, information Technology, he held various management positions at CGi, National Bank Financial and National Bank of Canada. Mr. Miron holds a bachelor’s degree in management information systems from the université du Québec à Montréal. He is a member of Réseau TiQ, an organization that brings together some 25 iT executives from large companies and organizations in Québec. Mr. Miron also serves as a corporate director with various organizations and companies.
BERNARD MORENCY
Executive Vice-President, Depositors, Strategy and Chief Operations Officer
Bernard Morency oversees the teams responsible for depositors’ accounts, strategic planning, operations and infor-mation technology. Mr. Morency joined the Caisse in December 2007 and was promoted to Executive Vice-President, Depositors and Strategic initiatives in April 2009. in March 2012, in connection with the imple-mentation of the Caisse’s strategic plan, he also became Chief Operations Officer. Before joining the Caisse, Mr. Morency worked for Mercer for more than 30 years. He was a member of Mercer’s global executive team and held a variety of leadership and senior management positions. Mr. Morency is a Fellow of the Canadian institute of Actuaries and the u.S. Society of Actuaries (SOA) and is a member of the Conference Board of Canada and of the Boards of Directors of CiRANO and of Finance Montréal.
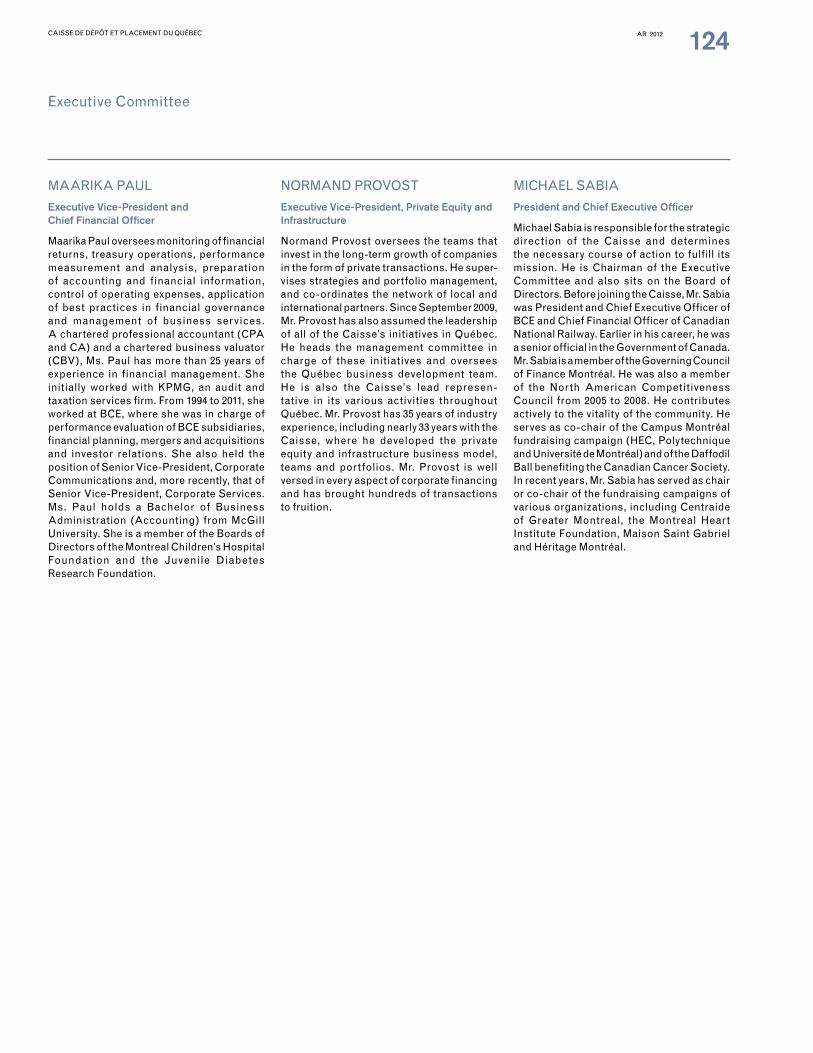
CAISSE DE DÉPÔT ET PLACEMENT DU QUÉBEC AR 2012 124
MAARiKA PAuL
Executive Vice-President and Chief Financial Officer
Maarika Paul oversees monitoring of financial returns, treasury operations, performance measurement and analysis, preparation of accounting and financial information, control of operating expenses, application of best practices in financial governance and management of business services. A chartered professional accountant (CPA and CA) and a chartered business valuator (CBV), Ms. Paul has more than 25 years of experience in financial management. She initially worked with KPMG, an audit and taxation services firm. From 1994 to 2011, she worked at BCE, where she was in charge of performance evaluation of BCE subsidiaries, financial planning, mergers and acquisitions and investor relations. She also held the position of Senior Vice-President, Corporate Communications and, more recently, that of Senior Vice-President, Corporate Services. Ms. Paul holds a Bachelor of Business Administration (Accounting) from McGill university. She is a member of the Boards of Directors of the Montreal Children’s Hospital Foundation and the Juvenile Diabetes Research Foundation.
NORMAND PROVOST
Executive Vice-President, Private Equity and Infrastructure
Normand Provost oversees the teams that invest in the long-term growth of companies in the form of private transactions. He super-vises strategies and portfolio management, and co-ordinates the network of local and international partners. Since September 2009, Mr. Provost has also assumed the leadership of all of the Caisse’s initiatives in Québec. He heads the management committee in charge of these initiatives and oversees the Québec business development team. He is also the Caisse’s lead represen-tative in its various activities throughout Québec. Mr. Provost has 35 years of industry experience, including nearly 33 years with the Caisse, where he developed the private equity and infrastructure business model, teams and portfolios. Mr. Provost is well versed in every aspect of corporate financing and has brought hundreds of transactions to fruition.
MiCHAEL SABiA
President and Chief Executive Officer
Michael Sabia is responsible for the strategic direction of the Caisse and determines the necessary course of action to fulfill its mission. He is Chairman of the Executive Committee and also sits on the Board of Directors. Before joining the Caisse, Mr. Sabia was President and Chief Executive Officer of BCE and Chief Financial Officer of Canadian National Railway. Earlier in his career, he was a senior official in the Government of Canada. Mr. Sabia is a member of the Governing Council of Finance Montréal. He was also a member of the North American Competitiveness Council from 2005 to 2008. He contributes actively to the vitality of the community. He serves as co-chair of the Campus Montréal fundraising campaign (HEC, Polytechnique and université de Montréal) and of the Daffodil Ball benefiting the Canadian Cancer Society. in recent years, Mr. Sabia has served as chair or co-chair of the fundraising campaigns of various organizations, including Centraide of Greater Montreal, the Montreal Heart institute Foundation, Maison Saint Gabriel and Héritage Montréal.
Executive Committee

CAISSE DE DÉPÔT ET PLACEMENT DU QUÉBEC AR 2012 125
Financial Report

AR 2012 126CAISSE DE DÉPÔT ET PLACEMENT DU QUÉBEC
Operating expenses represent the Caisse’s total portfolio management and administration costs. External management fees are amounts paid to external financial institutions to manage funds on the Caisse’s behalf. Operating expenses include expenditures for the management of the Real Estate and Real Estate Debt portfolios. Operating expenses related to the management and administration of real estate assets and mortgages are deducted from real estate investment income and mortgage income, respectively.
For fiscal year 2012, operating expenses totalled $284 million, a $15 million increase over 2011, primarily as a result of the annualized effect of recruiting resources in 2011 in the investment, research, fundamental analysis and information technology sectors.
External management fees totalled $11 million, an increase over the $9 million recorded in 2011, as a result of the increase in the amount of assets under management. In the combined financial statements, external management fees are netted from investment income.
Operating expenses and external management fees amounted to $295 million in 2012, compared to $278 million in 2011. This amount represents 17.9 cents per $100 of average net assets, placing the Caisse among the leaders in its management category (see Figure 66).
OPERATIONAL EFFICIENCY
The Caisse periodically reviews its procedures to maintain strict control over its operating expenses. It aims to keep operating expenses at a level that, given the composition of its investments, is favourably comparable to that of same-size institutional fund managers with similar operations. For many years, the Caisse has been benchmarking its costs by asset class.
Analysis of Operating Expensesand External Management Fees
OPERATINg ExPENsEs ANd ExTERNAL mANAgEmENT FEEs ExPREssEd IN CENTs PER $100 OF dEPOsITORs’ AvERAgE NET AssETs (for periods ended December 31 – in cents)
FIguRE 66
18.0 17.9
22.0
19.420
09
2010
2011
2012

AR 2012 127CAISSE DE DÉPÔT ET PLACEMENT DU QUÉBEC
CREdIT RATINg AgENCIEs AFFIRm THE CAIssE’s FINANCIAL sTRENgTH
Dominion Bond Rating Services (DBRS), Moody’s Investors Service (Moody’s) and Standard & Poor’s (S&P) maintained their investment-grade credit ratings with a stable outlook. The credit ratings are the highest issued by these agencies (see Table 67):
• On September 5, 2012, Moody’s issued an update affirming CDP Financial’s short- and long-term credit ratings with a stable outlook.
• On November 9, 2012, S&P affirmed the Caisse’s short- and long-term credit ratings with a stable outlook.
• On November 9, 2012, DBRS issued an update affirming the short- and long-term credit ratings of the Caisse and its subsidiary CDP Financial, also with a stable outlook.
sHORT-TERm BORROWINg
The fair value of short-term financing transactions in the Canadian market stood at $1.0 billion as at December 31, 2012, and was equivalent to the year-earlier level (see Figure 68). In 2012, the average maturity of the borrowings was 72 days, and transactions totalled $5 billion.
TERm BORROWINg
As at December 31, 2012, CDP Financial’s outstanding term notes totalled $8.9 billion, versus $8.8 billion at the end of 2011 (see Figure 68). The $100-million increase over 2011 is due to the impact of lower interest rates on fair value. In 2012, the Caisse did not require additional financing for its operations; as a result, CDP Financial did not issue any term notes.
The geographic breakdown of the financing remained stable in 2012, with 57% of the outstanding debt securities in the u.S. market, 32% in the Canadian market and 11% in the European market.
CDP Financial is a wholly owned subsidiary of the Caisse. Its transactions are designed to optimize the cost of financing the operations of the Caisse and its subsidiaries while diversifying their sources of financing. Its operations were stable in 2012; the short-term financing program was maintained and no term notes were issued.
CDP Financial
CREdIT RATINgs
Short-term Long-term
DBRS R-1 HIgH AAAMoody’s PRIME-1 (Aaa) AaaS&P A-1 + AAA
A-1 HIgH
TABLE 67
BREAKdOWN OF LIABILITIEs – CdP FINANCIAL(fair value as at December 31 – in billions of dollars)
Commercial paper
Term notes
2009
2010
2011
2012
1.3
5.1
1.0
8.18.8 8.9
1.0 1.0
FIguRE 68

AR 2012 128CAISSE DE DÉPÔT ET PLACEMENT DU QUÉBEC
The financial statements of the Caisse de dépôt et placement du Québec are combined: they comprise the accounts of the Caisse’s subsidiaries, the general Fund, the individual funds and the specialized portfolios. Depositors’ holdings presented in the Combined statement of net assets include the net account value of each Caisse depositor.
Note 2 to the audited combined financial statements as at December 31, 2012, describes the significant accounting policies used by the Caisse. Preparation of the financial state-ments requires the use of subjective and complex judgments and estimates. Any changes to these judgments and estimates could have a material impact on the Caisse’s combined financial statements.
CHANgEOvER TO INTERNATIONAL FINANCIAL REPORTINg sTANdARds (IFRs)
In 2008, the Accounting Standards Board (AcSB) confirmed that Canadian generally accepted accounting principles (gAAP) would be replaced by International Financial Reporting Standards (IFRS) for all publicly accountable entities, effective January 1, 2011. The Caisse is defined as a publicly accoun-table entity. In December 2011, the AcSB decided to defer the adoption of IFRS for investment companies that apply Accounting guideline Acg-18, “Investment Companies,” of Part V of the Canadian Institute of Chartered Accountants (CICA) Handbook, owing to delayed publication by the International Accounting Standards Board (IASB) of an IFRS standard on investment entities.
It was only in October 2012 that the IASB published the document Investment Entities (Amendments to IFRS 10 Consolidated Financial Statements, IFRS 12 Disclosure of Interests in Other Entities and IAS 27 Separate Financial Statements) requiring that a company considered an investment entity measure each of its controlled entities at fair value rather than consolidating them. In December 2012, Part I of the CICA Handbook was updated to reflect the recent amendments, whose effective date for investment entities is January 1, 2014, with early adoption permitted. Accordingly, the expected date for the Caisse’s first combined financial statements prepared according to IFRS is December 31, 2014.
Main impacts of the Caisse’s changeover to IFRSThe main impact identified in connection with the Caisse’s changeover to IFRS is the non-consolidation of entities controlled by an investment entity. under Canadian gAAP, the Caisse consolidates its subsidiaries under Acg-18 whereas, according to IFRS, controlled entities must be presented and measured at fair value as investments. Considering this significant change, the fair value of the assets and liabilities of subsidiaries that are consolidated according to Canadian gAAP could differ materially from the measurement of an investment based on an enterprise value method according to IFRS.
Implementation of IFRSIn 2012, IFRS was early adopted for the Real Estate portfolio, as described on page 41.
In addition, while working closely with its co-auditors, the Caisse continues to analyze other consequences of the adoption of IFRS on its combined financial statements, the individual funds and the other specialized portfolios. This planning and imple-mentation work involves adjusting the accounting and business processes, operational systems, internal controls and financial and management reports.
ExTERNAL AUdIT
The Caisse’s financial statements are prepared in accordance with Canadian generally accepted accounting principles, as stipulated in the Act respecting the Caisse de dépôt et placement du Québec.
In accordance with the Act, the Caisse’s co-auditors audited the institution’s accounting records for fiscal 2012, and their reports accompany the financial statements. Over all, the co-auditors reported on 57 financial statements, namely the Caisse’s combined financial statements and those of the general Fund, the depositors’ 38 individual funds and the 17 specialized portfolios. They issued an unqualified auditors’ report for each of these financial statements.
Significant Accounting Policies
AR 2012 129CAISSE DE DÉPÔT ET PLACEMENT DU QUÉBEC
Investment valuation is a process whereby a fair value is assigned to each of the Caisse’s investments with a view to preparation of its financial statements. Measurement of investments at fair value is performed periodically according to policies and procedures specific to each type of investment. These procedures comply with the standards and practices of Canadian and international organizations and involve the use of stock market prices as well as reports of independent valuators, appraisers and experts. The co-auditors have access to all major valuation files in performing their audit of the year-end financial statements.
CONCEPTUAL FRAmEWORK
According to the provisions of CICA Handbook Accounting guideline Acg-18, the Caisse must measure its investments at fair value. Fair value is the amount of consideration that would be agreed upon in an arm’s-length transaction between knowledgeable, willing parties who are under no compulsion to act. Fair value must be established on the assumption that the investments are available for sale on the preparation date of the financial statements. The purpose of the accounting standards is to define a conceptual framework for all situations that require fair value measurement.
ImPACT ON THE CAIssE’s INvEsTmENTs
The Caisse believes that these fair value standards provide a coherent framework, but that they must be applied with discernment. These highly restrictive standards ignore the fact that, given the very long investment horizon of its major depositors, the Caisse has the resources and the intention to hold certain investments until their optimal value is reached.
As a result, the fair value determined as at December 31, 2012, for less liquid investments, such as real estate, private equity, infrastructure, commercial debt and commercial mortgages, reflects the overall volatility of the financial markets and therefore may differ from the economic value of such invest-ments over the long term.
EsTABLIsHINg FAIR vALUE AT THE CAIssE
The fair value of investments is established first as a function of real transactions involving identical or comparable assets in active markets. But if there are no observable data or the markets are inactive, that is, no purchases or sales are taking place, the Caisse must establish fair value using valuation methods. The main valuation methods currently used are discounting of cash flows and the earnings multiples of comparable companies. The main variables used by these methods are cash flows, discount rates, financing and illiquidity premiums, EBITDA multiples and price-earnings multiples. These variables involve a degree of subjectivity that may differ from one valuator to another.
Liquid investmentsThe fair value of liquid investments is established from prices quoted on major stock exchanges and prices or data provided by securities dealers or other recognized specialized organizations, and from valuation methods used on capital markets, such as discounting of cash flows, which is based on directly or indirectly observable data. Twice a year, the fair value of all portfolios of unlisted liquid products is reviewed by independent external firms. Valuation of these products, which include bonds and over-the-counter derivative financial instruments, is based on valuation models and input data.
Less liquid investmentsPrivate equity and infrastructureThe fair value of private equity and infrastructure investments is determined semi-annually, at June 30 and December 31, unless significant circumstances require a change in the value of an investment at another time during the year.
Fair value is established by an internal valuation team, independent of the investment units. Investments whose fair value exceeds a predetermined materiality threshold must be submitted to an independent valuation committee or an external valuator. The committee, which reports to the Caisse’s Audit Committee, is composed of independent valuation profes-sionals. The co-auditors attend the committee’s meetings as observers. The process is complemented internally by regular and one-time valuations, as events occur.
Fair Value Measurement
AR 2012 130CAISSE DE DÉPÔT ET PLACEMENT DU QUÉBEC
Real estate investmentsFor the preparation of the combined financial statements, the fair value of real estate investments is determined semi-annually, at June 30 and December 31, unless significant known circumstances require a one-time investment valuation adjustment. External chartered appraisers certify the fair value of the Real Estate portfolio’s assets. In addition, the real estate subsidiaries’ external auditors audit fair values during prepa-ration of audited financial statements.
Furthermore, IFRS were early adopted in 2012 for the Real Estate portfolio. According to IFRS, this portfolio is consi-dered an investment entity and the new accounting standard requires that the subsidiary Ivanhoé Cambridge be valued and presented as an investment that reflects the fair value of the business. This value was determined by independent external appraisers and reflects, among other things, the fair value of the real estate assets, the quality of the portfolio and the integrated management of the platform.
The fair value of mortgage loans and securities is established monthly from the discounted value of future contractual cash flows at the market interest rate. The rate is that which could be obtained for loans or securities with similar terms and maturities. In cases where the timing of cash flows cannot be estimated with reasonable reliability, fair value is either the fair value of any asset given as collateral, net of expected costs of realization and any amount legally owed to borrowers, or the mortgages’ observable market price. The fair value of these investments is reviewed semi-annually by independent external firms.
ABTNsAsset-backed term notes (ABTNs) are financial instruments with an average maturity of four years. To provide an economic hedge so as to reduce the risk of loss inherent in changes in the ABTNs’ fair value and of possible collateral calls, the Caisse uses derivative financial instruments, such as credit default swaps and interest rate swaps.
The MAV 1 ABTNs and some ABTNs excluded from the restructuring agreement are essentially composed of credit default swaps and pledged assets. The fair value of the credit default swaps is established with valuation techniques that are based as much as possible on observable market data, such as credit spreads, correlation factors and an illiquidity premium, which is calculated from the spread between the bid and ask prices of similar financial instruments traded on the market. For the other ABTNs, the Caisse established fair values using a valuation technique based on a financial model whose assump-tions use observable market data, such as interest rates and credit quality, as much as possible.
All the data and methodologies used to establish the fair value of the ABTNs as at December 31, 2012, were reviewed by an independent external firm.
Fair Value Fair Value MeasurementMeasurement

CAISSE DE DÉPÔT ET PLACEMENT DU QUÉBEC AR 2012 131
Combined Financial Statements

Preparation and presentation of the combined financial statements of the Caisse de dépôt et placement du Québec (the “Caisse”) are the responsibility of management. The combined financial statements were prepared in accordance with Canadian generally accepted accounting principles (GAAP). We ensure that the financial data in the Annual Report are consistent with those in the combined financial statements.
The combined financial statements include amounts based on management’s best estimates and judgment, with due regard for their relative importance. Moreover, in the preparation of the financial data, management has made decisions regarding the information to be presented, has made estimates and has made assumptions that affect the information presented. Future results may differ considerably from our current estimates, because of changes in the financial markets or other events that may have an impact on the fair value of the investments established as at December 31, 2012.
In our responsibility for the reliability of financial information, we use a sophisticated internal control mechanism applied systematically on all levels of the organization. This mechanism consists of organizational and operational controls, financial information disclosure controls and procedures, and internal control over financial information. The Caisse’s internal control mechanism is based, among other things, on a clear definition of responsibilities, effective allocation of duties, delegation of powers, competent resources, appropriate procedures, information systems, tools and practices, relevant and reliable information whose adequacy enables all employees to fulfill their responsibilities, control, compliance and integrated risk management measures that are proportional to the issues specific to each process and designed to reduce risks likely to affect achievement of the Caisse’s objects, and oversight of compliance with an extensive body of internal policies.
This control mechanism makes it possible to ensure that appropriate internal controls are in place with regards to operations, assets and records. Moreover, the Caisse’s internal audit group reviews the internal controls on a regular basis. These controls and audits are designed to provide reasonable assurance regarding the reliability of the accounting records used to prepare the combined financial statements and to ensure that assets are not used or disposed of in any unauthorized manner, that liabilities are recorded, and that we meet all the legal requirements to which the Caisse is subject, including the Act respecting the Caisse de dépôt et placement du Québec.
Each year, we certify that the design of the internal control regarding financial information is sufficient and that the design and functioning of the financial information disclosure controls and procedures are effective. We report any significant irregularity to the Audit Committee of the Board of Directors of the Caisse, as necessary.
The Auditor General of Québec and Ernst & Young LLP (the “co-auditors”) have audited the combined financial statements of the Caisse, and their report covers the nature and scope of the audit and expresses their opinion. The co-auditors have unrestricted access to the Audit Committee to discuss any matter relating to their audit.
The Board of Directors and its committees supervise the manner in which management fulfills its responsibility for the establishment and presentation of financial information, maintenance of appropriate internal controls, compliance with the requirements of laws and regulations, management of and control over the main risks and evaluation of major transactions. Moreover, it approves the combined financial statements and the Annual Report.
The Board of Directors has approved the combined financial statements as at December 31, 2012. It is assisted in its responsibilities by the Audit Committee, of which all members are outside directors. This Committee meets with management and the co-auditors, examines the combined financial statements and recommends their approval to the Board of Directors.
Management’s responsibility Management’s responsibility for combined financial reportingfor combined financial reporting
Michael SabiaPresident and Chief Executive Officer
Montréal, February 26, 2013
Maarika Paul, cPa, ca, cbVExecutive Vice-President andChief Financial Officer
CAISSE DE DÉPÔT ET PLACEMENT DU QUÉBEC AR 2012 132

To the National Assembly
report on the combined financial statements
We have audited the accompanying combined financial statements of the Caisse de dépôt et placement du Québec, which comprise the combined statement of net assets as at December 31, 2012, and the combined statement of income and changes in net assets for the year then ended, and a summary of significant accounting policies and other explanatory information included in the notes to the combined financial statements.
Management’s responsibility for the combined financial statements Management is responsible for the preparation and fair presentation of these combined financial statements in accordance with Canadian generally accepted accounting principles (GAAP) and for such internal control as management determines is necessary to enable the preparation of combined financial statements that are free from material misstatement, whether due to fraud or error.
Auditors’ responsibility Our responsibility is to express an opinion on the combined financial statements based on our audit. We conducted our audit in accordance with Canadian generally accepted auditing standards. Those standards require that we comply with ethical requirements and plan and perform the audit to obtain reasonable assurance about whether the combined financial statements are free from material misstatement.
An audit involves performing procedures to obtain audit evidence about the amounts and disclosures in the combined financial statements. The procedures selected depend on the auditor’s judgment, including the assessment of the risks of material misstatement of the combined financial statements, whether due to fraud or error. In making those risk assessments, the auditor considers internal control relevant to the entity’s preparation and fair presentation of the combined financial statements in order to design audit procedures that are appropriate to the circumstances, but not for the purpose of expressing an opinion on the effectiveness of the entity’s internal control. An audit also includes evaluating the appropriateness of accounting policies used and the reasonableness of accounting estimates made by management, as well as evaluating the overall presentation of the combined financial statements.
We believe that the audit evidence we have obtained is sufficient and appropriate to provide a basis for our audit opinion.
OpinionIn our opinion, the combined financial statements present fairly, in all material respects, the financial position of the Caisse de dépôt et placement du Québec as at December 31, 2012, and the results of its operations and its cash flows for the year then ended in accordance with Canadian generally accepted accounting principles.
report on other legal and regulatory requirements
As required by the Auditor General Act (R.S.Q., chapter V-5.01), we report that, in our opinion these principles have been applied on a basis consistent with that of the preceding year.
Independent auditors’ reportIndependent auditors’ report
Michel Samson, CPA auditor, CA
Montréal, February 26, 2013
Acting Auditor General of Québec
CPA auditor, CA, permit no. A112431
Montréal, February 26, 2013
Ernst & Young LLP
CAISSE DE DÉPÔT ET PLACEMENT DU QUÉBEC AR 2012 133

Combined statement of net assetsCombined statement of net assetsAs at December 31
(in millions of dollars) 2012 2011
assetsInvestments (note 3A) 210,460 185,606
Advances to depositors 797 761
Investment income, accrued and receivable 751 854
Transactions being settled 153 774
Other assets (note 4) 1,002 3,293
213,163 191,288
liabilitiesLiabilities related to investments (note 3B) 34,129 28,554
Transactions being settled 155 110
Other liabilities (note 5) 1,300 1,162
35,584 29,826
combined net assets 177,579 161,462
Less:
Non-controlling interests (note 6C) 2,006 2,497
Depositors’ net holdings in accordance with canadian gaaP (note 6A) 175,573 158,965
commitments and contingencies (note 12)
The accompanying notes are an integral part of the combined financial statements
Supplemental information (note 6B)
Depositors’ net holdings in accordance with canadian gaaP 175,573 158,965
Consolidation adjustment arising from early adoption of IFRS by a specialized portfolio 637 –
Depositors’ net holdings before consolidation adjustment 176,210 158,965
For the Board of Directors,
Michael Sabia a. Michel laVigne
CAISSE DE DÉPÔT ET PLACEMENT DU QUÉBEC AR 2012 134

Combined statement of income Combined statement of income and changes in net assetsand changes in net assetsFor years ended December 31
(in millions of dollars) 2012 2011
Investment income (note 7A) 5,904 5,232
Less:
Operating expenses (note 8) 284 269
Net investment income 5,620 4,963
Gains (losses) on the sale of investments (note 7C) 2,127 (482)
Total realized income 7,747 4,481
Unrealized increases in value of investments and liabilities related to investments (note 7D) 6,644 1,764
net investment results 14,391 6,245
Depositors’ net deposits 2,308 1,477
Other changes in non-controlling interests (note 6C) (582) 223
increase in combined net assets 16,117 7,945
combined net assets, beginning of year 161,462 153,517
combined net assets, end of year 177,579 161,462
attributable to depositors
net investment results (note 7E) 14,391 6,245
Less:
Net investment results attributable to non-controlling interests (note 7E) 91 499
Net investment results attributable to depositors (note 7E) 14,300 5,746
Depositors’ net deposits 2,308 1,477
increase in depositors’ net holdings 16,608 7,223
Depositors’ net holdings, beginning of year 158,965 151,742
Depositors’ net holdings in accordance with canadian gaaP 175,573 158,965
The accompanying notes are an integral part of the combined financial statements
CAISSE DE DÉPÔT ET PLACEMENT DU QUÉBEC AR 2012 135

Combined fundsCombined funds complementary notescomplementary notesAs at December 31, 2012
01Constitution and operationsConstitution and operations
The Caisse de dépôt et placement du Québec (the “Caisse”), a legal person established in the public interest within the meaning of the Civil Code, is governed by the Act respecting the Caisse de dépôt et placement du Québec (R.S.Q., chapter C-2) (the “Act”). It receives all funds whose deposit is provided under the Act. Pursuant to the federal and provincial income tax acts, the Caisse is not subject to income taxes.
Combined finanCial statements
The combined financial statements comprise the accounts of the subsidiaries controlled by the Caisse, the General Fund, the individual funds and the specialized portfolios.
General fund (Consolidated statements)
The General Fund comprises all treasury operations (management of demand and term deposits, and corporate financing of the Caisse).
individual funds
The individual funds are comprised of diversified investments, and each fund has only one depositor that exclusively makes participation deposits therein. The individual funds are for the use of the following depositors:
Fund 300: Québec Pension Plan Fund, administered by the Régie des rentes du Québec;
Fund 301: Government and Public Employees Retirement Plan, administered by the Commission administrative des régimes de retraite et d’assurances;
Fund 302: Pension Plan of Management Personnel, administered by the Commission administrative des régimes de retraite et d’assurances;
Fund 303: Special Plans Fund, administered by the Commission administrative des régimes de retraite et d’assurances;
Fund 305: Pension Plan of Elected Municipal Officers, administered by the Commission administrative des régimes de retraite et d’assurances;
Fund 306: Régime complémentaire de rentes des techniciens ambulanciers/paramédics et des services préhospitaliers d’urgence, administered by Aon Conseil;
Fund 307: Fonds de l’assurance automobile du Québec, administered by the Société de l’assurance automobile du Québec;
Fund 311: Supplemental Pension Plan for Employees in the Québec Construction Industry – General Account, administered by the Commission de la construction du Québec;
Fund 312: Supplemental Pension Plan for Employees in the Québec Construction Industry – Retirees Account, administered by the Commission de la construction du Québec;
Fund 313: Supplemental Pension Plan for Employees in the Québec Construction Industry – Supplementary Account, administered by the Commission de la construction du Québec;
Fund 314: Deposit Insurance Fund, administered by the Autorité des marchés financiers;
Fund 315: Compte dédié, administered by La Financière agricole du Québec;
Fund 316: Retirement Plans Sinking Fund – RREGOP, administered by the ministère des Finances et de l’Économie, Government of Québec;
Fund 317: Retirement Plans Sinking Fund – PPMP, administered by the ministère des Finances et de l’Économie, Government of Québec;
Fund 318: Retirement Plans Sinking Fund, administered by the ministère des Finances et de l’Économie, Government of Québec;
Fund 326: Crop Insurance Fund, administered by La Financière agricole du Québec;
Fund 328: Survivor’s Pension Plan, administered by the Secrétariat du Conseil du trésor, Government of Québec;
Fund 329: Fonds d’assurance-garantie, administered by the Régie des marchés agricoles et alimentaires du Québec;
Fund 330: Fonds de la santé et de la sécurité du travail, administered by the Commission de la santé et de la sécurité du travail;
CAISSE DE DÉPÔT ET PLACEMENT DU QUÉBEC AR 2012 136
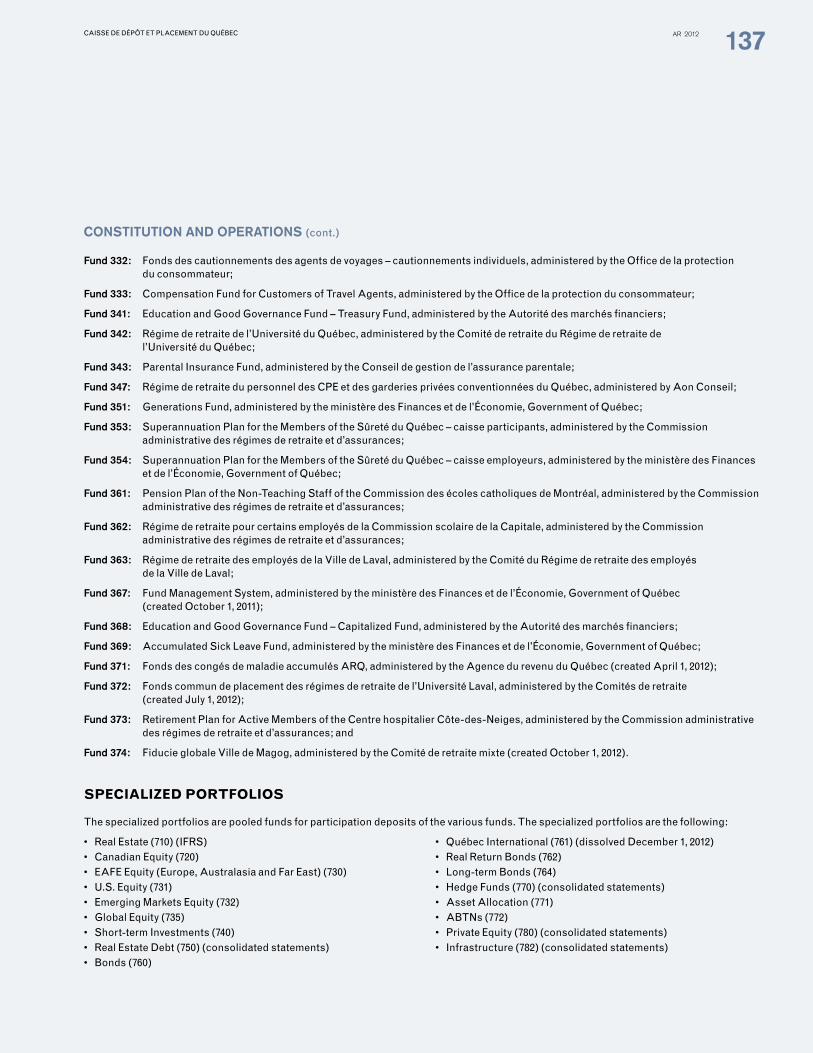
Fund 332: Fonds des cautionnements des agents de voyages – cautionnements individuels, administered by the Office de la protection du consommateur;
Fund 333: Compensation Fund for Customers of Travel Agents, administered by the Office de la protection du consommateur;
Fund 341: Education and Good Governance Fund – Treasury Fund, administered by the Autorité des marchés financiers;
Fund 342: Régime de retraite de l’Université du Québec, administered by the Comité de retraite du Régime de retraite de l’Université du Québec;
Fund 343: Parental Insurance Fund, administered by the Conseil de gestion de l’assurance parentale;
Fund 347: Régime de retraite du personnel des CPE et des garderies privées conventionnées du Québec, administered by Aon Conseil;
Fund 351: Generations Fund, administered by the ministère des Finances et de l’Économie, Government of Québec;
Fund 353: Superannuation Plan for the Members of the Sûreté du Québec – caisse participants, administered by the Commission administrative des régimes de retraite et d’assurances;
Fund 354: Superannuation Plan for the Members of the Sûreté du Québec – caisse employeurs, administered by the ministère des Finances et de l’Économie, Government of Québec;
Fund 361: Pension Plan of the Non-Teaching Staff of the Commission des écoles catholiques de Montréal, administered by the Commission administrative des régimes de retraite et d’assurances;
Fund 362: Régime de retraite pour certains employés de la Commission scolaire de la Capitale, administered by the Commission administrative des régimes de retraite et d’assurances;
Fund 363: Régime de retraite des employés de la Ville de Laval, administered by the Comité du Régime de retraite des employés de la Ville de Laval;
Fund 367: Fund Management System, administered by the ministère des Finances et de l’Économie, Government of Québec (created October 1, 2011);
Fund 368: Education and Good Governance Fund – Capitalized Fund, administered by the Autorité des marchés financiers;
Fund 369: Accumulated Sick Leave Fund, administered by the ministère des Finances et de l’Économie, Government of Québec;
Fund 371: Fonds des congés de maladie accumulés ARQ, administered by the Agence du revenu du Québec (created April 1, 2012);
Fund 372: Fonds commun de placement des régimes de retraite de l’Université Laval, administered by the Comités de retraite (created July 1, 2012);
Fund 373: Retirement Plan for Active Members of the Centre hospitalier Côte-des-Neiges, administered by the Commission administrative des régimes de retraite et d’assurances; and
Fund 374: Fiducie globale Ville de Magog, administered by the Comité de retraite mixte (created October 1, 2012).
speCialized portfolios
The specialized portfolios are pooled funds for participation deposits of the various funds. The specialized portfolios are the following:
• RealEstate(710)(IFRS) • QuébecInternational(761)(dissolvedDecember1,2012)• CanadianEquity(720) • RealReturnBonds(762)• EAFEEquity(Europe,AustralasiaandFarEast)(730) • Long-termBonds(764)• U.S.Equity(731) • HedgeFunds(770)(consolidatedstatements)• EmergingMarketsEquity(732) • AssetAllocation(771)• GlobalEquity(735) • ABTNs(772)• Short-termInvestments(740) • PrivateEquity(780)(consolidatedstatements)• RealEstateDebt(750)(consolidatedstatements) • Infrastructure(782)(consolidatedstatements)• Bonds(760)
conSTiTuTion anD oPeraTionS conSTiTuTion anD oPeraTionS (cont.)(cont.)
CAISSE DE DÉPÔT ET PLACEMENT DU QUÉBEC AR 2012 137

a) presentation
The combined financial statements of the Caisse are prepared in accordance with Canadian generally accepted accounting principles (GAAP). The Caisse is considered an investment company pursuant to Accounting Guideline AcG-18, “Investment Companies,” of Part V of theHandbookoftheCanadianInstituteofCharteredAccountants(CICA).Accordingly,alltheinvestmentsoftheCaisseaswellasliabilitiesrelated to investments are presented at fair value with all fair value variations recognized in the net investment results.
The Caisse consolidates its subsidiaries when they do not meet some of the conditions provided in AcG-18. All transactions and balances between related parties have been eliminated. The summary financial statements for the specialized portfolios are found in the section “Supplementary information.”
The preparation of the financial statements requires that management make estimates and assumptions, which have an impact on determination of the fair value of assets and liabilities as well as revenues and expenses during the financial year covered by the combined financial statements. Actual results may differ from such estimates.
A statement of cash flows is not presented, as it would provide no further useful information for the comprehension of cash flows during the year.
b) investments and related operations
Investments and related assets and liabilities are accounted for at fair value, which is the estimated exchange value that would be agreed upon in an arm’s-length transaction between knowledgeable, willing parties who are under no compulsion to act, established at year-end.
Transaction costs that are directly attributable to the acquisition and sale of investments are included in income and applied against Gains (losses) on the sale of investments. Transaction costs include commissions, stock exchange fees and professional and legal fees related to investment operations.
Other financial assets and liabilities, including advances to depositors, investment income accrued and receivable, accounts receivable, interest payable on derivative financial instruments and investment income accrued and payable are initially recorded at fair value and subsequently recorded at the cost that approximates fair value given their short-term maturity. Other financial assets are classified in the receivables category and other financial liabilities are classified in the other financial liabilities category.
Cash is designated at fair value and is measured initially and subsequently at fair value.
FIxED-INCOME SECURITIES
Fixed-income securities comprise short-term investments, bonds, asset-backed term notes (ABTNs), mortgages, commercial paper payable, term notes, mortgage loans payable and other loans payable. Acquisitions and sales of fixed-income securities are recorded at the transaction date, except for mortgages, which are recorded at the settlement date.
i) valuation methodThe fair value of fixed-income securities with the exception of mortgages is determined by the market price, when such a value is available. When a market price is not available, the fair value of the securities is established according to valuation methods used in capital markets, such as discounting of future cash flows, or according to similar transactions on an arm’s-length basis. These valuations are supported by observable or non-observable input data, such as interest rate yield curves, credit spreads or discount rates. The valuation method for ABTNs is discussed in note 3E.
The fair value of mortgages is determined from the present value of future contractual cash flows at the market interest rate. The rate is that which could be obtained for loans or securities with similar conditions and maturities. Where the timing of future cash flows cannot be estimated in a reasonably reliable manner, the fair value corresponds either to the fair value of any collateral, less expected realization costs and any amount legally owed to borrowers, or to the observable market price for the mortgages.
The fair value of most fixed-income securities is reviewed biannually by independent external firms.
The valuation methods are applied on a consistent basis.
aCCountinG poliCiesaCCountinG poliCies02
CAISSE DE DÉPÔT ET PLACEMENT DU QUÉBEC AR 2012 138

ii) investment inCome and Gains (losses) on the sale of investmentsInvestment income from fixed-income securities includes amortization of the premium or the discount, which makes it possible to maintain a constant effective yield until maturity. Income from mortgages is reduced by operation expenses and financial costs of commercial mortgage-backed securities (CMBS) and is recorded under the item Investment income – Fixed-income securities.
Gains (losses) on the sale of investments represent the difference between the amortized cost and the net realizable value on the sale of investments. The amortized cost corresponds to the acquisition cost adjusted to reflect amortization of the premium or the discount.
VARIABLE-INCOME SECURITIES
Variable-income securities comprise equities and convertible securities, investment funds as well as real estate holdings. Acquisitions and sales of equities and convertible securities are recorded at the transaction date, whereas acquisitions and sales of real estate holdings and investment funds are recorded at the settlement date.
i) valuation methodThe fair value of listed equities and convertible securities is determined from prices on major stock exchanges. For unlisted equities and convertible securities, prices are provided by recognized financial institutions or valuations are made according to commonly used valuation methods, such as the earnings multiples of comparable listed companies or discounting of cash flows, or on the basis of similar transactions on an arm’s-length basis. These valuations are supported by observable or non-observable input data, such as EBITDA multiples, price/earnings ratios, price/book value ratios, discount rates and future cash flows. The valuations of unlisted equities and convertible securities are reviewed biannually by a valuation committee made up of independent experts or by independent external firms.
The fair value of investment funds recorded under the item Equities and convertible securities is determined from the fair value provided by the general partner or the administrator, in accordance with commonly used valuation methods.
Real estate holdings include partial or full ownership of income properties through interests in a company or a partnership. The fair value of income properties included in real estate holdings is determined and certified biannually by external, recognized and independent chartered real estate appraisers. The valuation techniques used for income properties are based mainly on three recognized methodologies: discounting of cash flows at the market rate, comparison with recent similar market transactions and capitalization of earnings. These valuations are supported by observable or non-observable input data, such as leases, operating expenses, rates of return and discount rates. The valuations are established in accordance with commonly used professional valuation standards.
The valuation methods are applied on a consistent basis.
ii) investment inCome and Gains (losses) on the sale of investments Dividend income is recognized when the Caisse obtains the right to the dividend, generally on the ex-dividend date. Income from real estate holdings is reduced by operating expenses, operation expenses and loan financial expenses, and is recorded under the item Investment income – Variable-income securities.
Gains (losses) on the sale of investments represent the difference between the cost and the net realizable value on the sale of investments. The cost of investments corresponds to the acquisition cost, with the exception of the cost of investments in joint ventures, which are recorded on the basis of the equity mehod.
DERIVATIVE FINANCIAL INSTRUMENTS
In managing its investments, the Caisse conducts transactions involving various derivative financial instruments to manage the risks associated with exchange rate, interest rate and market fluctuations.
Derivative financial instruments whose fair value is favourable are recorded under the item Investments, whereas those whose fair value is unfavourable are recorded under the item Liabilities related to investments.
i) valuation methodFor over-the-counter derivative financial instruments, prices are provided by recognized financial institutions or valuations are made from similar transactions on an arm’s-length basis or with recognized, commonly used models. The models used include discounting of future cash flows at the current rate of return and the Black-Scholes model. These models require the use of assumptions regarding the amount and timing of future cash flows and the current rate of return. The assumptions are prepared with observable and non-observable input data, such as interest rate yield curves, credit spreads and foreign exchange rates as well as the volatility and correlation of equity prices, commodity prices and interest rates. The fair value estimates of most over-the-counter derivative financial instruments are reviewed biannually by independent external firms. The fair value of listed derivative financial instruments, if any, is determined from prices on major stock exchanges.
The valuation methods are applied on a consistent basis.
accounTing PolicieS accounTing PolicieS (cont.)(cont.)
CAISSE DE DÉPÔT ET PLACEMENT DU QUÉBEC AR 2012 139

ii) investment inCome and Gains (losses) on the sale of investments Investment income as well as gains (losses) on the sale of investments on derivative financial instruments is included with investment income and gains (losses) on the sale of investments, depending on the underlying investments.
SECURITIESACQUIREDUNDERREvERSEREPURCHASEAGREEMENTS
The Caisse conducts securities-borrowing operations involving short-term investments and bonds to cover short sales or to generate additional income. These securities-borrowing operations are recorded in Securities acquired under reverse repurchase agreements under the item Investments. Interest earned on reverse repurchase agreements is recorded as interest income under the item Investment income – Fixed-income securities.
SECURITIESSoLDUNDERREPURCHASEAGREEMENTS
The Caisse conducts securities-lending operations involving short-term investments and bonds to generate cash flow liquidity or additional income. These securities-lending operations are recorded in Securities sold under repurchase agreements under the item Liabilities related to investments. Interest paid on repurchase agreements is applied against Investment income – Fixed-income securities.
SHoRTSELLINGoFSECURITIES
Short selling of securities represents the commitment by the Caisse to purchase securities from third parties to cover its positions. Interest expenses related to commitments involving short selling of short-term investments and bonds are recorded under Investment income – Fixed-income securities, whereas expenses related to commitments involving short selling of equities are recorded under Investment income – Variable-income securities.
Gains (losses) on commitments related to short selling of short-term investments and bonds are recorded under the item Gains (losses) on the sale of investments – Fixed-income securities, whereas those related to short selling of equities are recorded under the item Gains (losses) on the sale investments – Variable-income securities.
LENDING AND BORROWING OF SECURITIES
The Caisse conducts securities-lending and -borrowing operations involving equities to cover short selling or to generate additional income. Such transactions are not derecognized or recorded in net assets because the assigner retains a right to the transferred shares. Investment income from lending of securities is included under the item Investment income – Variable-income securities.
HIERARCHyoFFAIRvALUE
The Caisse’s financial instruments are classified according to the following hierarchy:
• Level 1: Calculation of the fair value of the instrument is based on prices (not adjusted) quoted on active markets for identical assets or liabilities.
• Level 2: Calculation of the fair value of the instrument is based on data other than the quoted prices contemplated in level 1, which are observable directly (in the form of prices) or indirectly (determined from prices). This level includes instruments whose valuation is based on prices quoted on markets that are not active for identical instruments and instruments whose valuation is based on prices observed for similar instruments as well as valuation techniques based on assumptions that take into account observable market data.
• Level 3: Calculation of the fair value of the instrument uses data that are not based on observable market data (non-observable data). This level includes instruments whose valuation is based on prices observed for similar instruments, adjusted to reflect the differences between the instruments being valued and the available market data. This level also includes instruments whose valuation is based on valuation techniques using assumptions that take into account market data that are observable but are adjusted significantly to reflect the specific characteristics of the instrument being valued.
The classification of financial instruments in the levels of the hierarchy is established at the time of the initial valuation of the instrument and reviewed on each subsequent valuation date. Transfers between the hierarchical levels are measured at fair value at the start of each year.
Quantitative information on the hierarchy of fair value is given in note 3F.
accounTing PolicieSaccounTing PolicieS (cont.)(cont.)
CAISSE DE DÉPÔT ET PLACEMENT DU QUÉBEC AR 2012 140
accounTing PolicieSaccounTing PolicieS (cont.)(cont.)
C) administered assets and assets under manaGement
The Caisse and its subsidiaries administer and manage assets entrusted to them by clients and on their behalf. These assets are not included in the Combined statement of net assets of the Caisse. The Caisse and its subsidiaries receive fees in return for such portfolio management services and administrative services, which include the administration of real estate properties and transferred mortgages.
d) foreiGn CurrenCy translation
The fair value of investments, liabilities related to investments as well as any other assets and liabilities denominated in foreign currencies is translated into Canadian dollars at the rate of exchange prevailing at year-end.
To present in the Combined statement of income and changes in net assets the amount of gains (losses) on the sale of investments or unrealized gains (losses), the cost of investments in equities and that of real estate holdings from integrated foreign operations and the amortized cost of investments in short-term investments, bonds, mortgages and liabilities related to investments are translated at the rate of exchange prevailing on the acquisition date. The cost of investments from self-sustaining foreign operations is translated at the rate prevailing at year-end.
Income is translated at the rate of exchange prevailing on the transaction date, with the exception of income from the specialized Real Estate portfolio, which is translated at the average rate for the year.
e) transfers of reCeivables
The Caisse occasionally securitizes or transfers mortgages by selling them directly to companies or through a conduit, which subsequently issues securities to investors.
Such transactions are recorded as sales where the Caisse is deemed to have surrendered control over such assets and to have received consideration other than beneficial interests in the transferred assets, in accordance with Accounting Guideline AcG-12 “Transfers of Receivables.” At the time of securitization or transfer, no beneficial interest in the mortgages is retained. Any gains or losses deriving from such transactions are recorded under Gains (losses) on the sale of investments – Mortgages and Bonds.
Companies under common control usually continue to service transferred loans. Since servicing fees are market-based, no servicing assets or liabilities are recorded at the date of transfer.
f) operatinG expenses
Operating expenses represent all expenses related to portfolio management and administration, with the exception of those related to external management. Operating expenses are recorded under a separate line item in the Combined statement of income and changes in net assets. Expenses related to management of the specialized Real Estate and Real Estate Debt portfolios are included in operating expenses. Expenses related to the real estate and real estate debt subsidiaries are deducted from real estate holdings investment income and mortgages investment income, respectively.
G) external manaGement fees
External management fees represent amounts paid to external financial institutions, principally institutional fund managers active on international stock markets, for the management of Caisse funds on behalf of the Caisse. Basic external management fees and management fees related to the performance of external managers are deducted from Investment income and Gains (losses) on the sale of investments, respectively.
h) future ChanGes to aCCountinG framework
In February 2008, the Accounting Standards Board of Canada (AcSB) confirmed that publicly accountable enterprises would be required to apply International Financial Reporting Standards (IFRS) to fiscal years beginning on or after January 1, 2011. For companies applying AcG-18, however, the AcSB authorized a postponement of the adoption of IFRS to fiscal years beginning on or after January 1, 2014, pending finalization by the International Accounting Standards Board (IASB) of its proposals for investment entities. In October 2012, the IASB issued Investment Entities (amendments to IFRS 10 Consolidated Financial Statements, IFRS 12 Disclosure of Interests in Other Entities and IAS 27 Separate Financial Statements) requiring a company considered an investment entity to measure each of its controlled entities at fair value, rather than consolidating them. Accordingly, the Caisse will prepare its first annual combined financial statements in accordance with IFRS as of December 31, 2014.
CAISSE DE DÉPÔT ET PLACEMENT DU QUÉBEC AR 2012 141

investments and liabilities related to investments investments and liabilities related to investments 03
a) investments
(in millions of dollars) 2012 2011Fair
value costFair
value Cost
Fixed-income securities Short-term investments Canadian 391 407 515 549
Foreign 941 1,178 1,083 1,446
1,332 1,585 1,598 1,995
bonds Issued or guaranteed by:
Government of Canada 16,212 15,816 16,165 15,276
Province of Québec 10,419 9,797 9,507 8,448
Other Canadian provinces 1,090 1,021 1,499 1,337
Municipalities and other Canadian agencies 1,374 1,303 1,481 1,416
Canadian government corporations 13,222 12,624 13,056 12,104
U.S. government 924 945 1,174 1,172
Other foreign governments – – 308 300
Mortgage securities
Canadian 122 117 187 178
Foreign – 109 – 116
Canadian corporations 11,411 10,747 10,605 10,178
Foreign corporations 2,313 2,586 1,978 2,216
Inflation-indexed securities
Canadian 1,252 1,123 1,318 1,139
Foreign 65 59 100 105
58,404 56,247 57,378 53,985
abTns (note 3E) 9,894 11,203 7,901 11,785
Mortgages Canadian 7,411 7,126 6,754 6,417
Foreign 1,647 1,733 748 858
9,058 8,859 7,502 7,275
Total fixed-income securities 78,688 77,894 74,379 75,040
Variable-income securities equities and convertible securities Canadian 22,650 21,023 17,082 16,227
U.S. 31,509 30,235 27,281 28,334
Foreign and emerging markets 34,648 33,815 29,290 31,721
Hedgefunds 3,228 3,252 3,088 3,141
92,035 88,325 76,741 79,423
real estate holdings Canadian 15,857 11,041 13,501 9,688
Foreign 9,904 11,115 8,532 9,344
25,761 22,156 22,033 19,032
Total variable-income securities 117,796 110,481 98,774 98,455
CAISSE DE DÉPÔT ET PLACEMENT DU QUÉBEC AR 2012 142

inVeSTMenTS anD liabiliTieS relaTeD To inVeSTMenTSinVeSTMenTS anD liabiliTieS relaTeD To inVeSTMenTS (cont.)(cont.)
(in millions of dollars) 2012 2011Fair
value costFair
value Cost
amounts receivable with respect to investments Securities acquired under reverse repurchase agreements
Canadian 8,629 8,629 6,056 6,056
Foreign 2,754 2,737 1,919 1,926
Amount pertaining to derivative financial instruments (note 10)
Canadian 1,905 1,160 2,957 1,171
Foreign 688 101 1,521 117
13,976 12,627 12,453 9,270
Total investments 210,460 201,002 185,606 182,765
b) liabilities related to investments
(in millions of dollars) 2012 2011Fair
value costFair
value Cost
Securities sold under repurchase agreements
Canadian 3,762 3,762 670 670
Foreign 862 861 – –
Commercial paper payable
Canadian 1,017 1,018 1,017 1,017
Term notes
Canadian 2,136 1,998 2,110 1,998
Foreign 6,743 6,289 6,662 6,288
Short selling of securities
Canadian 7,792 7,020 6,187 5,842
Foreign 4,427 4,270 3,648 3,575
Mortgage loans payable
Canadian 502 478 497 458
Foreign 1,722 1,750 1,720 1,758
Other loans payable
Canadian 2,613 2,641 1,978 2,003
Foreign 398 398 1,260 1,264
Amount pertaining to derivative financial instruments (note 10)
Canadian 915 – 1,215 5
Foreign 1,240 88 1,590 93
Total liabilities related to investments 34,129 30,573 28,554 24,971
Term notes are redeemable at maturity, have an optional prepayment clause at the option of the issuer and are guaranteed by the assets of the Caisse.
Mortgage loans are repayable half-yearly, monthly or at maturity and are guaranteed by real estate holdings. Some mortgage loans may also be guaranteed by cash.
Most of the other loans payable are repayable at maturity. Those related to investments in ABTNs have a prepayment clause prorated to net cash flows received on investments in ABTNs and are guaranteed by them.
The fair value of the real estate holdings that guarantee the mortgage loans and some other loans payable is $6,661 million ($5,851 million in 2011).
CAISSE DE DÉPÔT ET PLACEMENT DU QUÉBEC AR 2012 143
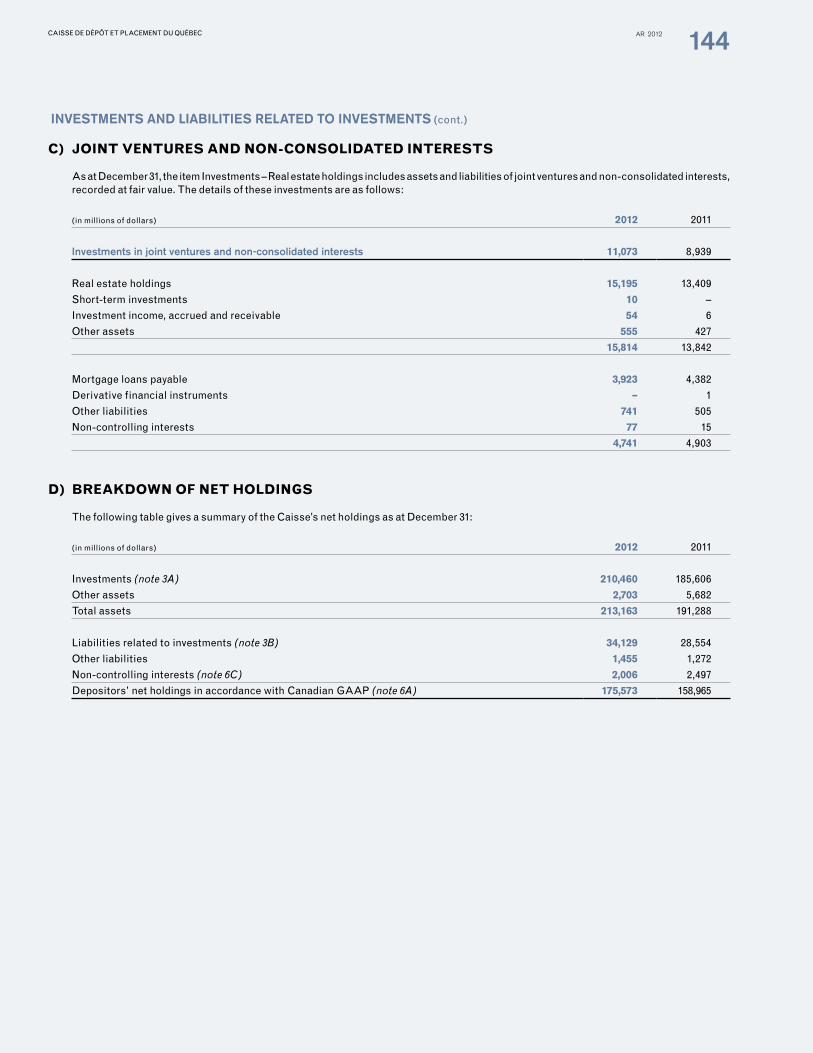
inVeSTMenTS anD liabiliTieS relaTeD To inVeSTMenTSinVeSTMenTS anD liabiliTieS relaTeD To inVeSTMenTS (cont.)(cont.)
C) Joint ventures and non-Consolidated interests
As at December 31, the item Investments – Real estate holdings includes assets and liabilities of joint ventures and non-consolidated interests, recorded at fair value. The details of these investments are as follows:
(in millions of dollars) 2012 2011
investments in joint ventures and non-consolidated interests 11,073 8,939
Real estate holdings 15,195 13,409
Short-term investments 10 –
Investment income, accrued and receivable 54 6
Other assets 555 427
15,814 13,842
Mortgage loans payable 3,923 4,382
Derivative financial instruments – 1
Other liabilities 741 505
Non-controlling interests 77 15
4,741 4,903
d) breakdown of net holdinGs
The following table gives a summary of the Caisse’s net holdings as at December 31:
(in millions of dollars) 2012 2011
Investments (note 3A) 210,460 185,606
Other assets 2,703 5,682
Total assets 213,163 191,288
Liabilities related to investments (note 3B) 34,129 28,554
Other liabilities 1,455 1,272
Non-controlling interests (note 6C) 2,006 2,497
Depositors’ net holdings in accordance with Canadian GAAP (note 6A) 175,573 158,965
CAISSE DE DÉPÔT ET PLACEMENT DU QUÉBEC AR 2012 144

inVeSTMenTS anD liabiliTieS relaTeD To inVeSTMenTSinVeSTMenTS anD liabiliTieS relaTeD To inVeSTMenTS (cont.)(cont.)
The following table gives the breakdown of net holdings at fair value according to the specialized portfolios available to depositors as at December 31:
(in millions of dollars) 2012 2011
Fixed income Short-term Investments 8,916 6,762
Bonds 43,790 41,600
Long-term Bonds 3,679 3,758
Real Estate Debt 7,574 6,680
63,959 58,800
inflation-sensitive investments Real Return Bonds 1,228 1,288
Infrastructure 6,307 5,751
Real Estate 17,337 18,205
24,872 25,244
equities Canadian Equity 22,024 18,564
Global Equity 13,753 10,855
Québec International – 4,547
U.S. Equity 10,175 8,120
EAFE Equity 9,828 9,102
Emerging Markets Equity 8,718 5,886
Private Equity 17,796 15,746
82,294 72,820
other investments HedgeFunds 3,185 3,270
Asset Allocation 1,103 1,221
ABTNs (834) (2,520)
3,454 1,971
overlay strategies and treasury operations 994 130
Depositors’ net holdings in accordance with canadian gaaP 175,573 158,965
CAISSE DE DÉPÔT ET PLACEMENT DU QUÉBEC AR 2012 145

inVeSTMenTS anD liabiliTieS relaTeD To inVeSTMenTSinVeSTMenTS anD liabiliTieS relaTeD To inVeSTMenTS (cont.)(cont.)
e) abtns and related finanCial instruments
ABTNs represent debt backed by a variety of financial instruments. The underlying instruments are essentially credit default swaps as well as assets given as collateral for MAV 1 and MAV 2, whereas MAV 3 contains traditional assets, such as residential and commercial mortgage debt. In addition, the Caisse uses derivative financial instruments, such as interest rate swaps and credit default swaps, to obtain an economic hedge in order to reduce the risk of loss inherent in a fluctuation of the fair value of the ABTNs as well as eventual collateral calls.
The ABTNs as well as other related financial instruments consist of the following as at December 31:
(in millions of dollars) 2012 2011
Fair value
unrealized increases
(decreases) in value cost Fair value
Unrealized increases
(decreases) in value Cost
investments
MAV 11 8,684 (705) 9,389 7,185 (2,689) 9,874
MAV 21 143 24 119 116 (3) 119
MAV 31 134 (144) 278 195 (180) 375
Funding facility (210) (210) – (522) (522) –
Subtotal 8,751 (1,035) 9,786 6,974 (3,394) 10,368
ABTNs excluded from the restructuring agreement 1,143 (274) 1,417 927 (490) 1,417
Total ABTNs 9,894 (1,309) 11,203 7,901 (3,884) 11,785
Amount pertaining to derivative financial instruments2 259 (881) 1,140 1,031 (109) 1,140
Total investments 10,153 (2,190) 12,343 8,932 (3,993) 12,925
liabilities related to investments2 1,411 (1) 1,412 1,778 11 1,767
8,742 (2,189) 10,931 7,154 (4,004) 11,158
1. “Master Asset Vehicles,” or “MAV.”2. Included under the items in notes 3A and B.
MAV 1 ABTNs and certain ABTNs excluded from the restructuring agreement consist essentially of credit default swaps. The fair value of the credit default swaps is established with valuation techniques based as much as possible on observable market data, such as credit spreads, correlation factors and an illiquidity premium, which is calculated from the spread between the bid and ask prices for similar financial instruments in the market. For the other ABTNs, the Caisse has established fair values using a valuation technique based on a financial model whose assumptions use as much as possible observable market data, such as interest rates and credit quality. Moreover, a favourable court judgment was rendered in the fall of 2011 in respect of litigation involving an ABTN excluded from the restructuring agreement. After an analysis of the conclusions of the judgment, the Caisse considered this development favourable in determining the fair value of the related investment.
As at December 31, 2012, the funding facility, which represents commitments in respect of MAV 1, totals $6,167 million ($6,167 million in 2011) and matures in July 2017. The Caisse establishes the fair value of this funding facility by applying a valuation technique based on CDx.IG index tranches plus a financing premium.
A 1% downward variation of credit spreads would involve an increase in the fair value of the ABTNs net of the economic hedge of approximately $6 million ($12 million in 2011). A 1% upward variation, however, would result in a decrease of approximately $5 million in the fair value ($13 million in 2011).
CAISSE DE DÉPÔT ET PLACEMENT DU QUÉBEC AR 2012 146

inVeSTMenTS anD liabiliTieS relaTeD To inVeSTMenTSinVeSTMenTS anD liabiliTieS relaTeD To inVeSTMenTS (cont.)(cont.)
f) hierarChy of fair value
The following tables summarize the allocation of the fair value of the investments and the liabilities related to investments among the three levels of the hierarchy as at December 31:
(in millions of dollars) 2012
level 1 level 2 level 3 Total
investments
Fixed-income securities Short-term investments – 1,182 150 1,332
Bonds – 54,948 3,456 58,404
ABTNs – – 9,894 9,894
Mortgages – 7,395 1,663 9,058
Total fixed-income securities – 63,525 15,163 78,688
Variable-income securities Equities and convertible securities 64,080 3,904 24,051 92,035
Real estate holdings1 – – 25,761 25,761
Total variable-income securities 64,080 3,904 49,812 117,796
amounts receivable with respect to investments Securities acquired under reverse repurchase agreements – 11,383 – 11,383
Amount pertaining to derivative financial instruments 23 2,290 280 2,593
64,103 81,102 65,255 210,460
liabilities related to investments Securities sold under repurchase agreements – 4,624 – 4,624
Commercial paper payable – 1,017 – 1,017
Term notes – 8,879 – 8,879
Short selling of securities 8,231 3,938 50 12,219
Mortgage loans payable – 503 1,721 2,224
Other loans payable – 3,011 – 3,011
Amount pertaining to derivative financial instruments 14 2,043 98 2,155
8,245 24,015 1,869 34,129
1. Investments in real estate holdings include partial or full ownership of income properties through interests in a company or a partnership.
CAISSE DE DÉPÔT ET PLACEMENT DU QUÉBEC AR 2012 147

(in millions of dollars) 2011
Level 1 Level 2 Level 3 Total
investments
Fixed-income securities Short-term investments – 1,387 211 1,598
Bonds – 54,169 3,209 57,378
ABTNs – – 7,901 7,901
Mortgages – 6,139 1,363 7,502
Total fixed-income securities – 61,695 12,684 74,379
Variable-income securities Equities and convertible securities 49,096 2,118 25,527 76,741
Real estate holdings1 – – 22,033 22,033
Total variable-income securities 49,096 2,118 47,560 98,774
amounts receivable with respect to investments Securities acquired under reverse repurchase agreements – 7,975 – 7,975
Amount pertaining to derivative financial instruments 38 3,378 1,062 4,478
49,134 75,166 61,306 185,606
liabilities related to investments Securities sold under repurchase agreements – 670 – 670
Commercial paper payable – 1,017 – 1,017
Term notes – 8,772 – 8,772
Short selling of securities 7,226 2,549 60 9,835
Mortgage loans payable – 497 1,720 2,217
Other loans payable – 3,229 9 3,238
Amount pertaining to derivative financial instruments 37 2,680 88 2,805
7,263 19,414 1,877 28,554
1. Investments in real estate holdings include partial or full ownership of income properties through interests in a company or a partnership.
inVeSTMenTS anD liabiliTieS relaTeD To inVeSTMenTSinVeSTMenTS anD liabiliTieS relaTeD To inVeSTMenTS (cont.)(cont.)
CAISSE DE DÉPÔT ET PLACEMENT DU QUÉBEC AR 2012 148

LEVEL 3: RECONCILIATION BETWEEN OPENING AND CLOSING BALANCES
For the financial instruments classified in level 3 of the hierarchy, the details of the reconciliation between the opening and closing balances are as follows:
(in millions of dollars) 2012
opening balance
Total gains (losses)
recorded in results Purchases Sales issuance Settlement
net transfers
to and from
level 3closing balance
Total gains (losses)
attributable to investments held at year-
end, recorded in results
Short-term investments 211 (44) 1,504 (70) 3 (1,454) – 150 (42)
Bonds 3,209 (36) – (97) 852 (457) (15) 3,456 (32)
ABTNs 7,901 2,424 – (310) – (121) – 9,894 2,575
Mortgages 1,363 28 – – 979 (633) (74) 1,663 35 Equities and
convertible securities 25,527 1,439 3,400 (6,291) – (23) (1) 24,051 660
Real estate holdings 22,033 652 3,742 (666) – – – 25,761 648
Net amount pertaining to derivative
financial instruments3 974 (801) – – – 9 – 182 (796)
Short selling of securities (60) (17) 27 – – – – (50) (16)
Mortgage loans payable (1,720) (10) – – 9 – – (1,721) (10)
Other loans payable (9) – – – – 9 – – –
1. Recorded under the items Gains (losses) on the sale of investments and Unrealized increases (decreases) in value of investments.2. Recorded under the item Unrealized increases (decreases) in value of investments.3. Derivative assets and derivative liabilities are recorded on a net basis in the reconciliation between opening and closing balances.
TRANSFERSBETwEENLEvELS2AND3oFTHEHIERARCHyoFFAIRvALUE
During fiscal 2012, financial instruments were transferred out of level 3 and added to the level 2 financial instruments as a result of additional observable data taken into account in the valuation method.
1 2
inVeSTMenTS anD liabiliTieS relaTeD To inVeSTMenTSinVeSTMenTS anD liabiliTieS relaTeD To inVeSTMenTS (cont.)(cont.)
CAISSE DE DÉPÔT ET PLACEMENT DU QUÉBEC AR 2012 149

(in millions of dollars) 2011
Opening balance
Total gains (losses)
recorded in results Purchases Sales Issuance Settlement
Net transfers
to and from
level 3Closing balance
Total gains (losses)
attributable to investments held at year-
end, recorded in results
Short-term investments 257 40 2,261 (326) – (2,115) 94 211 (149)
Bonds 2,514 137 101 (166) 906 (166) (117) 3,209 172
ABTNs 7,850 151 – – – (100) – 7,901 175
Mortgages 3,010 160 – (1,037) 601 (992) (379) 1,363 53 Equities and
convertible securities 24,641 2,500 3,269 (4,794) – – (89) 25,527 2,144
Real estate holdings 21,490 1,660 1,076 (2,193) – – – 22,033 1,592
Net amount pertaining to derivative
financial instruments3 1,024 (84) 14 33 – 1 (14) 974 (140)
Short selling of securities (92) (6) 53 – – – (15) (60) (8)
Mortgage loans payable (2,155) (4) – – (6) 445 – (1,720) 24
Other loans payable (13) – – – – 4 – (9) –
1. Recorded under the items Gains (losses) on the sale of investments and Unrealized increases (decreases) in value of investments.2. Recorded under the item Unrealized increases (decreases) in value of investments.3. Derivative assets and derivative liabilities are recorded on a net basis in the reconciliation between opening and closing balances.
TRANSFERSBETwEENLEvELS2AND3oFTHEHIERARCHyoFFAIRvALUE
During fiscal 2011, financial instruments were transferred out of level 3 and added to the level 2 financial instruments as a result of additional observable data taken into account in the valuation method. Moreover, financial instruments were transferred to level 3 as a result of additional non-observable data taken into account in the valuation method.
LEVEL 3: FAIR VALUE MEASUREMENT BASED ON REASONABLE ALTERNATIVE ASSUMPTIONS
In certain cases, the assumptions used in the valuation techniques are based on non-observable data or observable market data adjusted significantly to reflect the specific characteristics of the instrument being valued. Although the Caisse believes that its fair value measurements are appropriate, the use of reasonably possible alternative assumptions could result in different fair values. It is possible that different entities will arrive at different valuations of the fair value of the same financial instrument on the same measurement date. Even so, the valuation techniques and input data used by such entities can meet the objective of fair value measurement. The fact that different valuations of fair value exist reflects the judgment and assumptions applied, as well as the uncertainty surrounding fair value measurement of instruments.
1 2
inVeSTMenTS anD liabiliTieS relaTeD To inVeSTMenTSinVeSTMenTS anD liabiliTieS relaTeD To inVeSTMenTS (cont.)(cont.)
CAISSE DE DÉPÔT ET PLACEMENT DU QUÉBEC AR 2012 150

The analysis that follows shows the sensitivity of the valuations to reasonable alternative assumptions of the non-observable data. Equities and convertible securities are sensitive mainly to the EBITDA multiple and the discount rate used in the valuation, which may reasonably range from 5.5 to 11.0 and from 8.0% to 12.0%, respectively, in 2012 (from 6.0 to 10.0 and from 8.0% to 14.0%, respectively, in 2011). Mortgage loans payable are sensitive mainly to the credit spread, which may reasonably vary by about 1.0% in 2012 (1.0% in 2011). The fair value of real estate holdings is sensitive mainly to the capitalization rate or the discount rate used in the valuation of the property, which may reasonably vary by about 0.3% in 2012 (0.3% in 2011). The fair value of the investment funds for which the Caisse does not have access to information on the underlying investments is based on the fair value provided by the general partner or the external manager. Accordingly, given that no additional information indicates that it is necessary to adjust such fair value, no other reasonably possible assumptions can be used.
Substitution of reasonable alternative assumptions for the main assumptions would result in an increase of approximately $881 million ($776 million in 2011) or a decrease of approximately $966 million ($1,306 million in 2011) in the total fair value of the level 3 instruments, excluding ABTNs, real estate investments and investment funds. The impact of such substitution on the fair value of the ABTNs is described in note 3E.
04other assetsother assets
(in millions of dollars) 2012 2011
Cash 646 2,999
Accounts receivable 213 161
Fixed assets 143 133 1,002 3,293
05other liabilitiesother liabilities
(in millions of dollars) 2012 2011
Interest payable on derivative financial instruments 84 89
Investment income, accrued and payable 165 156
Income tax liabilities, payable and future 390 242
Other liabilities 661 675
1,300 1,162
06depositors’ net holdinGs and non-ControllinG interestsdepositors’ net holdinGs and non-ControllinG interests
a) depositors’ net holdinGs
Demand and term deposits bear interest at variable and fixed rates, respectively, and constitute indebtedness on the part of the Caisse toward the depositors. The average annual rates paid on demand and term deposits are 1.0% and 1.5%, respectively (1.0% and 1.7% in 2011).
During the year, the Caisse paid $5 million ($3 million in 2011) of interest on both demand and term deposits.
Participation deposits are expressed in units. Each unit gives its holder a proportionate share in the net holdings and the net income of a particular fund. At the end of each monthly period for the General Fund and the individual funds, the net investment income and the gains (losses) on the sale of investments are allocated to participation deposit holders. At the opening of the following period, the amounts allocated are paid out to the depositors’ demand deposit accounts. Generally, the balance of demand deposits is reinvested in participation deposits at the opening of each monthly period as a function of the depositors’ investment policies. The number of issued units of participation deposits depends on the fair value determined at the end of the previous monthly period.
During the year, the Caisse paid $7,552 million ($5,966 million in 2011) in net income to participation deposit holders.
inVeSTMenTS anD liabiliTieS relaTeD To inVeSTMenTSinVeSTMenTS anD liabiliTieS relaTeD To inVeSTMenTS (cont.)(cont.)
CAISSE DE DÉPÔT ET PLACEMENT DU QUÉBEC AR 2012 151

DePoSiTorS’ neT holDingS anD non-conTrolling inTereSTS DePoSiTorS’ neT holDingS anD non-conTrolling inTereSTS (cont.)(cont.)
(in millions of dollars) 2012 2011
Caisse’s indebtedness toward depositors
Demand deposits 887 121
Term deposits 134 141
Net income to be paid out to participation deposit holders 1,612 272
2,633 534
Participation deposit holders’ holdings
Participation deposits
Balance, beginning of year 149,861 142,284
Units issued 9,725 8,072
Units cancelled (569) (495)
Balance, end of year 159,017 149,861
Gains not allocated on the sale of investments and other 8,898 9,448
Unrealized increases (decreases) in value of investments and
liabilities related to investments net of non-controlling interests 5,662 (878)
Consolidation adjustment arising from early adoption of IFRS by a specialized portfolio (note 6B) (637) –
172,940 158,431
Depositors’ net holdings in accordance with Canadian GAAP 175,573 158,965
The Caisse defines its capital as the net holdings of the holders of participation deposits, demand deposits and term deposits. The Caisse is not subject to external capital requirements.
The mission of the Caisse is to receive moneys on deposit as provided by law and to manage them with a view to achieving an optimal return on depositors’ capital within the framework of their investment policies. Through its wholly owned subsidiary CDP Financial Inc., the Caisse issues capital securities to optimize financing costs and to fund certain investments.
b) Consolidation adJustment arisinG from early adoption of ifrs by a speCialized portfolio
The document Investment Entities, published in October 2012 by the IASB, requires that a company considered an investment entity value each of its controlled entities at fair value instead of consolidating them. The AcSB has incorporated this document into Part I of the CICA Handbook.ThestandardforinvestmententitiesisapplicabletofiscalyearsbeginningonorafterJanuary1,2014,butearlyapplicationisallowed. The Caisse has elected to early adopt IFRS for the financial statements of the specialized Real Estate portfolio for the year ended December 31, 2012.
IFRS for investment entities differ from the provisions of AcG-18 mainly in their accounting treatment of certain subsidiaries. In accordance with Canadian GAAP, the specialized Real Estate portfolio consolidated its subsidiaries whereas, according to IFRS, an investment entity must not consolidate its subsidiaries but instead measure and present them at fair value, as an investment. Measurement of the fair value of the investments held by the specialized Real Estate portfolio is henceforth based on an enterprise value technique. As a result of this change in the valuation method, the fair value of the investments in the specialized Real Estate portfolio increased by $637 million as at December 31, 2012.
The combined financial statements of the Caisse for the year ended December 31, 2012, have been prepared in accordance with Canadian GAAP, and persuant to AcG-18, the subsidiaries of the specialized Real Estate portfolio have been consolidated. Accordingly, a consolidation adjustment was required to exclude from depositors’ net holdings in accordance with Canadian GAAP the $637 million adjustment arising from early adoption of IFRS by the specialized Real Estate portfolio. As supplemental information, this adjustment is presented separately from depositors’ net holdings as a consolidation adjustment arising from early adoption of IFRS by a specialized portfolio in the Combined statement of net assets as well as in note 6A. As at January 1, 2013, date of transition to IFRS of the Caisse’s combined financial statements, this adjustment will be recorded in depositors’ net holdings.
CAISSE DE DÉPÔT ET PLACEMENT DU QUÉBEC AR 2012 152

In addition to the adjustment arising from non-consolidation of the subsidiaries of the specialized Real Estate portfolio, the Caisse is continuing its analysis of the other impacts of adopting IFRS on the combined financial statements, the individual funds, the General Fund and the other specialized portfolios. The Caisse is therefore not yet in a position to determine the complete impact of the transition on its first combined financial statements that will be prepared in accordance with IFRS as of December 31, 2014.
C) non-ControllinG interests
Non-controlling interests represent interests of non-controlling shareholders in consolidated subsidiaries that are not directly or indirectly attributable to the Caisse. Non-controlling interests are recorded at their share of the fair value of the investment and are allocated a proportional share of combined net assets and net investment results. Changes in the Caisse’s interest in a subsidiary that do not affect control thereof are recorded as transactions on combined net assets.
As at December 31, the details of non-controlling interests are as follows:
(in millions of dollars) 2012 2011
Balance, beginning of year 2,497 1,775
Net investment results attributable to non-controlling interests (note 7E) 91 499
Other changes in non-controlling interests1 (582) 223
Balance, end of year 2,006 2,497
1. In 2012, the other changes are due mainly to the dissolution of a subsidiary, distributions and the buyback by the Caisse of non-controlling interests in consolidated subsidiaries. In 2011, the other changes are due mainly to the sale of the Caisse’s interest in consolidated subsidiaries, an increase in the non-controlling interest in a consolidated subsidiary and a consolidated subsidiary’s buyback of its own shares.
As at December 31, the details of the cost and the fair value of non-controlling interests are as follows:
(in millions of dollars) 2012 2011Fair
value costFair
value Cost
Canadian 1,901 1,654 1,998 1,656
Foreign 105 112 499 705
2,006 1,766 2,497 2,361
DePoSiTorS’ neT holDingS anD non-conTrolling inTereSTS DePoSiTorS’ neT holDingS anD non-conTrolling inTereSTS (cont.)(cont.)
CAISSE DE DÉPÔT ET PLACEMENT DU QUÉBEC AR 2012 153
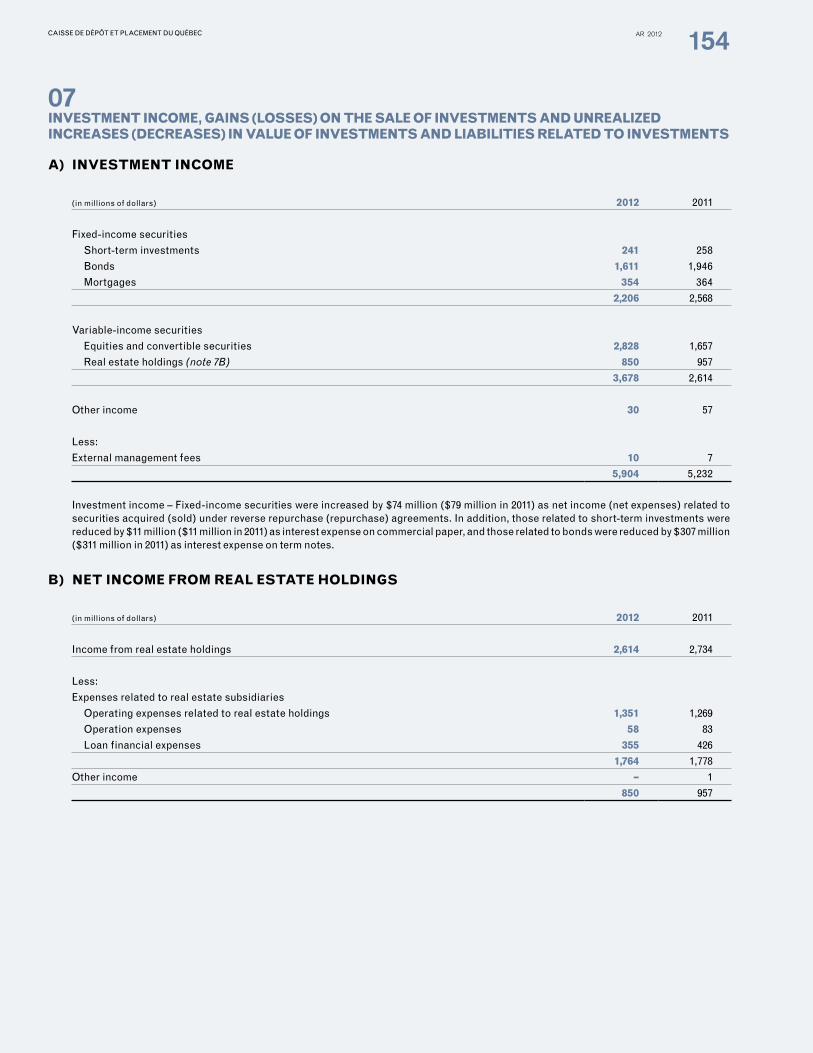
07investment inCome, Gains (losses) on the sale of investments and unrealized investment inCome, Gains (losses) on the sale of investments and unrealized inCreases (deCreases) in value of investments and liabilities related to investmentsinCreases (deCreases) in value of investments and liabilities related to investments
a) investment inCome
(in millions of dollars) 2012 2011
Fixed-income securities
Short-term investments 241 258
Bonds 1,611 1,946
Mortgages 354 364
2,206 2,568
Variable-income securities
Equities and convertible securities 2,828 1,657
Real estate holdings (note 7B) 850 957
3,678 2,614
Other income 30 57
Less:
External management fees 10 7
5,904 5,232
Investment income – Fixed-income securities were increased by $74 million ($79 million in 2011) as net income (net expenses) related to securities acquired (sold) under reverse repurchase (repurchase) agreements. In addition, those related to short-term investments were reduced by $11 million ($11 million in 2011) as interest expense on commercial paper, and those related to bonds were reduced by $307 million ($311 million in 2011) as interest expense on term notes.
b) net inCome from real estate holdinGs
(in millions of dollars) 2012 2011
Income from real estate holdings 2,614 2,734
Less:
Expenses related to real estate subsidiaries
Operating expenses related to real estate holdings 1,351 1,269
Operation expenses 58 83
Loan financial expenses 355 426
1,764 1,778
Other income – 1
850 957
CAISSE DE DÉPÔT ET PLACEMENT DU QUÉBEC AR 2012 154
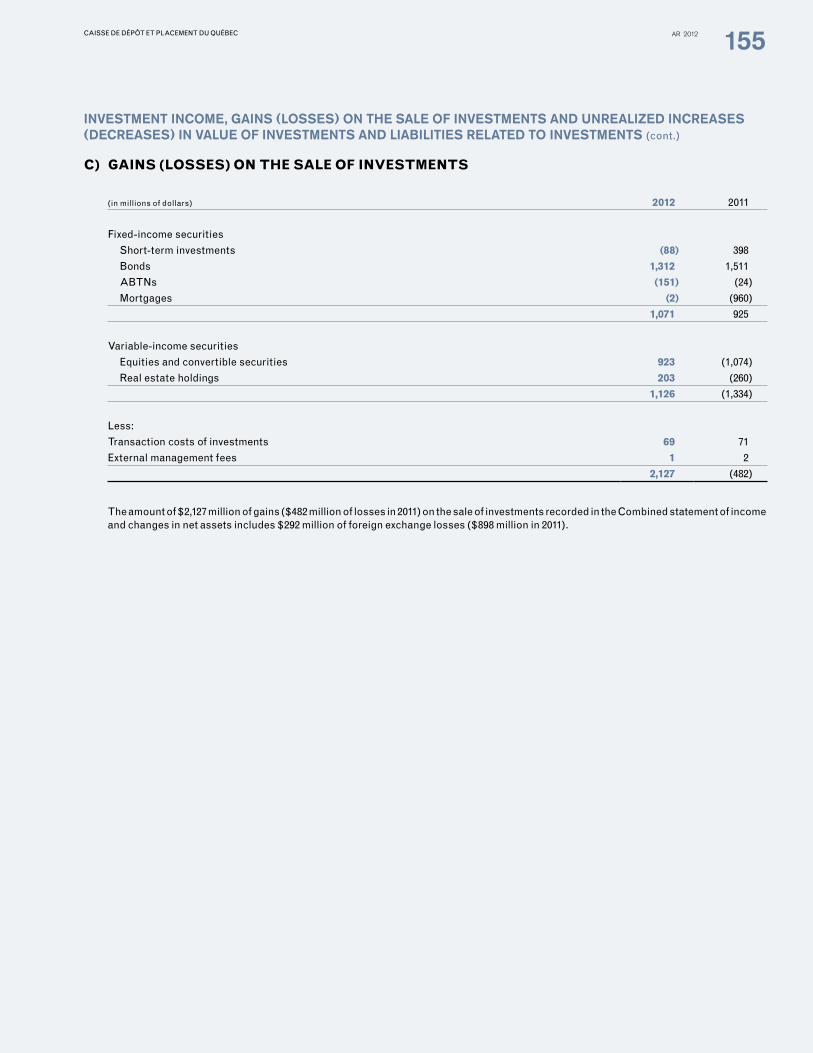
C) Gains (losses) on the sale of investments
(in millions of dollars) 2012 2011
Fixed-income securities
Short-term investments (88) 398
Bonds 1,312 1,511
ABTNs (151) (24)
Mortgages (2) (960)
1,071 925
Variable-income securities
Equities and convertible securities 923 (1,074)
Real estate holdings 203 (260)
1,126 (1,334)
Less:
Transaction costs of investments 69 71
External management fees 1 2
2,127 (482)
The amount of $2,127 million of gains ($482 million of losses in 2011) on the sale of investments recorded in the Combined statement of income and changes in net assets includes $292 million of foreign exchange losses ($898 million in 2011).
inVeSTMenT incoMe, gainS (loSSeS) on The Sale oF inVeSTMenTS anD unrealizeD increaSeS inVeSTMenT incoMe, gainS (loSSeS) on The Sale oF inVeSTMenTS anD unrealizeD increaSeS (DecreaSeS) in Value oF inVeSTMenTS anD liabiliTieS relaTeD To inVeSTMenTS (DecreaSeS) in Value oF inVeSTMenTS anD liabiliTieS relaTeD To inVeSTMenTS (cont.)(cont.)
CAISSE DE DÉPÔT ET PLACEMENT DU QUÉBEC AR 2012 155

d) unrealized inCreases (deCreases) in value of investments and liabilities related to investments
(in millions of dollars) 2012 2011
Fixed-income securities
Short-term investments (320) (301)
Bonds (1,639) 1,884
ABTNs 1,802 115
Mortgages (24) 1,250
Securities acquired under reverse repurchase agreements 24 4
(157) 2,952
Variable-income securities
Equities and convertible securities 6,235 (2,962)
Real estate holdings 539 1,800
6,774 (1,162)
6,617 1,790
Less:
Liabilities related to investments
Securities sold under repurchase agreements 1 3
Commercial paper payable (1) –
Term notes 106 676
Short selling of securities 511 (360)
Mortgage loans payable (5) 9
Other loans payable 1 16
Derivative financial instruments (640) (318)
(27) 26
6,644 1,764
The unrealized increases in value in the amount of $6,644 million ($1,764 million in 2011) recorded in the Combined statement of income and changes in net assets include unrealized decreases in value of $641 million related to foreign exchange (unrealized increases in value of $1,565 million related to foreign exchange in 2011).
inVeSTMenT incoMe, gainS (loSSeS) on The Sale oF inVeSTMenTS anD unrealizeD increaSeS inVeSTMenT incoMe, gainS (loSSeS) on The Sale oF inVeSTMenTS anD unrealizeD increaSeS (DecreaSeS) in Value oF inVeSTMenTS anD liabiliTieS relaTeD To inVeSTMenTS (DecreaSeS) in Value oF inVeSTMenTS anD liabiliTieS relaTeD To inVeSTMenTS (cont.)(cont.)
CAISSE DE DÉPÔT ET PLACEMENT DU QUÉBEC AR 2012 156

e) net investment results attributable to depositors and non-ControllinG interests
(in millions of dollars) 2012 2011
Depositors
non-controlling
interests Total Depositors
Non- controlling
interests Total
Investment income 5,590 314 5,904 5,142 90 5,232
Less:
Operating expenses 284 – 284 269 – 269
Net investment income 5,306 314 5,620 4,873 90 4,963
Gains (losses) on the sale of investments 2,454 (327) 2,127 (495) 13 (482)
Total realized income 7,760 (13) 7,747 4,378 103 4,481
Unrealized increases in value of
investments and liabilities related
to investments 6,540 104 6,644 1,368 396 1,764
Net investment results 14,300 91 14,391 5,746 499 6,245
08operatinG expensesoperatinG expenses
(in millions of dollars) 2012 2011
Salaries and employee benefits 149 139
Information technology and professional services 50 51
Data services and subscriptions 13 12
Premises and equipment 18 17
Depreciation of fixed assets 27 26
Other 15 13
272 258
Safekeeping of securities 12 11
284 269
inVeSTMenT incoMe, gainS (loSSeS) on The Sale oF inVeSTMenTS anD unrealizeD increaSeS inVeSTMenT incoMe, gainS (loSSeS) on The Sale oF inVeSTMenTS anD unrealizeD increaSeS (DecreaSeS) in Value oF inVeSTMenTS anD liabiliTieS relaTeD To inVeSTMenTS (DecreaSeS) in Value oF inVeSTMenTS anD liabiliTieS relaTeD To inVeSTMenTS (cont.)(cont.)
CAISSE DE DÉPÔT ET PLACEMENT DU QUÉBEC AR 2012 157

The Caisse has implemented a number of policies, guidelines and procedures to oversee its operations.
Risk management is based on an integrated risk management policy adopted by the Board of Directors. This policy, which is revised on a regular basis, is intended to promote a risk management culture and ensure stringent risk management practices to help the Caisse carry out its mission on behalf of its depositors. More specifically, the policy defines risk management governance, establishes the acceptable level of risk so as to avoid excessive loss, links the level of risk to the target value added and aims for an efficient allocation of risk.
Governance of risk management is based on three levels of control:
1. Portfolio managers, who are primarily responsible for managing the risks related to operations under their purview;2. The Risk Investment Committee (RIC), a subcommittee of the Executive Committee, with assistance from the Risk Department and the
Policies and Compliance Senior Vice-Presidency; and 3. The Board of Directors, its Audit Committee and its Risk Management Committee, as well as Internal Audit.
The policy includes reporting mechanisms for each of these levels. It also includes a framework for outsourcing management of investments, management of operational risks and management of derivative financial instruments.
To ensure the objectivity and rigour required to manage risks, teams that are independent of the portfolio managers are responsible for defining and monitoring the integrated risk management policy as well as the investment policies applying to the specialized portfolios.
The financial risks defined in the integrated risk management policy include the following:
a) Market risk;b) Credit risk;c) Counterparty risk related to derivative financial instruments; andd) Financing-liquidity risk.
Investment policies are designed to oversee the activities performed by the portfolio managers. For each specialized portfolio, an investment policy establishes the philosophy, management type, investment universe, benchmark index, value-added target and risk oversight, including concentration and risk limits. The managers must abide by the limits on their investment operations.
a) market risk
Market risk represents the risk of financial loss arising from changes in the value of financial instruments. Such value is affected by changes in certain market variables, such as interest rates, exchange rates, share prices and commodity prices. The risk derives from the volatility in the price of a financial instrument, which itself results from the volatility of such market variables.
The Caisse manages all market risks according to an integrated approach. The major factors contributing to risk, such as sectors, countries and issuers, are taken into account.
The Caisse may use derivative financial instruments traded on exchanges or negotiated directly with banks and securities dealers, to manage market risks.
The Caisse measures its market risk using the method known as Value at Risk (VaR), which is based on a statistical estimate of the volatility of the fair value of each position and its correlations. VaR is a statistical estimate of a portfolio’s potential loss according to a predetermined confidence level during a given exposure period. The VaR of the market is estimated with a 99% confidence level over an exposure period of one year. The VaR calculated by the Caisse therefore presents the level of loss that a portfolio should reach or exceed in 1% of cases. The Caisse estimates VaR for each instrument in its specialized portfolios and aggregates the information for the overall portfolio.
The Caisse uses the historical-simulation method to estimate VaR. This method is based essentially on the assumption that the future will be similar to the past. It requires that historical data series on all the risk factors needed to estimate the returns on instruments be available. In the absence of historical data, alternative methods are used. A history of 1,500 days of observation of risk factors, such as variations in exchange rates, interest rates and financial asset prices, is used to estimate the volatility of returns and the correlation between asset returns. As at December 31, 2012, the Caisse revised the source of observable interest rate data to obtain a more reliable and relevant risk measurement, although it did not change the basic method used to calculate VaR. The comparative VaR of December 31, 2011, was recalculated on that basis.
09identifiCation and manaGement of risks related identifiCation and manaGement of risks related to investment operationsto investment operations
CAISSE DE DÉPÔT ET PLACEMENT DU QUÉBEC AR 2012 158
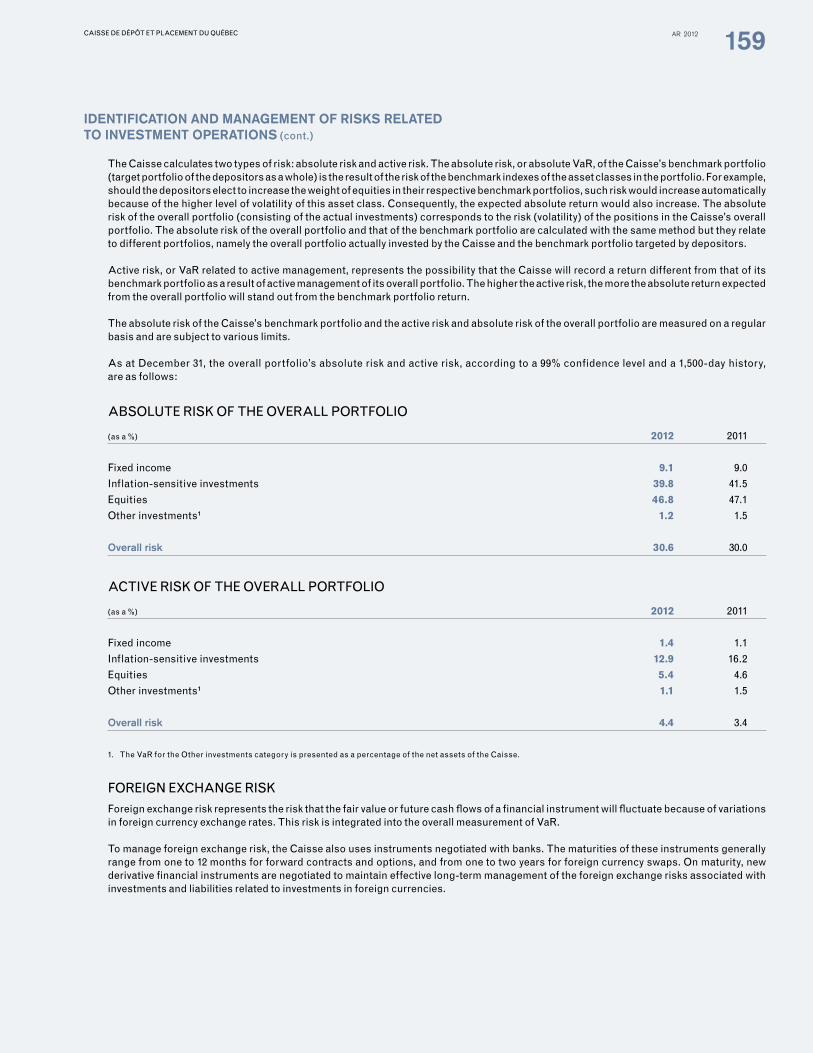
The Caisse calculates two types of risk: absolute risk and active risk. The absolute risk, or absolute VaR, of the Caisse’s benchmark portfolio (target portfolio of the depositors as a whole) is the result of the risk of the benchmark indexes of the asset classes in the portfolio. For example, should the depositors elect to increase the weight of equities in their respective benchmark portfolios, such risk would increase automatically because of the higher level of volatility of this asset class. Consequently, the expected absolute return would also increase. The absolute risk of the overall portfolio (consisting of the actual investments) corresponds to the risk (volatility) of the positions in the Caisse’s overall portfolio. The absolute risk of the overall portfolio and that of the benchmark portfolio are calculated with the same method but they relate to different portfolios, namely the overall portfolio actually invested by the Caisse and the benchmark portfolio targeted by depositors.
Active risk, or VaR related to active management, represents the possibility that the Caisse will record a return different from that of its benchmark portfolio as a result of active management of its overall portfolio. The higher the active risk, the more the absolute return expected from the overall portfolio will stand out from the benchmark portfolio return.
The absolute risk of the Caisse’s benchmark portfolio and the active risk and absolute risk of the overall portfolio are measured on a regular basis and are subject to various limits.
As at December 31, the overall portfolio’s absolute risk and active risk, according to a 99% confidence level and a 1,500-day history, are as follows:
ABSoLUTERISkoFTHEovERALLPoRTFoLIo
(as a %) 2012 2011
Fixed income 9.1 9.0
Inflation-sensitive investments 39.8 41.5
Equities 46.8 47.1
Other investments1 1.2 1.5
overall risk 30.6 30.0
ACTIvERISkoFTHEovERALLPoRTFoLIo
(as a %) 2012 2011
Fixed income 1.4 1.1
Inflation-sensitive investments 12.9 16.2
Equities 5.4 4.6
Other investments1 1.1 1.5
overall risk 4.4 3.4
1. The VaR for the Other investments category is presented as a percentage of the net assets of the Caisse.
FoREIGNExCHANGERISk
Foreign exchange risk represents the risk that the fair value or future cash flows of a financial instrument will fluctuate because of variations in foreign currency exchange rates. This risk is integrated into the overall measurement of VaR.
To manage foreign exchange risk, the Caisse also uses instruments negotiated with banks. The maturities of these instruments generally range from one to 12 months for forward contracts and options, and from one to two years for foreign currency swaps. On maturity, new derivative financial instruments are negotiated to maintain effective long-term management of the foreign exchange risks associated with investments and liabilities related to investments in foreign currencies.
iDenTiFicaTion anD ManageMenT oF riSkS relaTeD iDenTiFicaTion anD ManageMenT oF riSkS relaTeD To inVeSTMenT oPeraTionSTo inVeSTMenT oPeraTionS (cont.) (cont.)
CAISSE DE DÉPÔT ET PLACEMENT DU QUÉBEC AR 2012 159

The allocation of investments, liabilities related to investments and non-controlling interests denominated in currencies is as follows as at December 31:
(in millions of dollars) 2012
currency1
canadian dollar
u.S.dollar euro
Pound sterling other Subtotal Total
investments Fixed-income securities 72,711 3,400 1,045 498 1,034 5,977 78,688
Variable-income securities
Equities and convertible securities 22,364 37,910 8,984 5,277 17,500 69,671 92,035
Real estate holdings 15,857 4,114 3,846 613 1,331 9,904 25,761 Amounts receivable with
respect to investments Securities acquired under
reverse repurchase agreements 8,629 2,328 426 – – 2,754 11,383 Amount pertaining to
derivative financial instruments 1,905 433 86 29 140 688 2,593
121,466 48,185 14,387 6,417 20,005 88,994 210,460
liabilities related to investments Conventional products2 17,822 10,553 3,240 188 171 14,152 31,974 Amount pertaining to derivative
financial instruments 915 826 115 177 122 1,240 2,155
18,737 11,379 3,355 365 293 15,392 34,129
non-controlling interests 1,901 9 14 82 – 105 2,006
100,828 36,797 11,018 5,970 19,712 73,497 174,325
(in millions of dollars) 2011
Currency1
Canadian dollar
U.S.dollar Euro
Pound sterling Other Subtotal Total
investments Fixed-income securities 68,905 3,327 882 294 971 5,474 74,379
Variable-income securities
Equities and convertible securities 16,905 31,594 7,812 6,044 14,386 59,836 76,741
Real estate holdings 13,501 3,292 3,658 646 936 8,532 22,033 Amounts receivable with
respect to investments Securities acquired under
reverse repurchase agreements 6,056 1,665 254 – – 1,919 7,975 Amount pertaining to
derivative financial instruments2,957 849 349 80 243 1,521 4,478
108,324 40,727 12,955 7,064 16,536 77,282 185,606
liabilities related to investments Conventional products2 12,459 9,821 2,955 186 328 13,290 25,749 Amount pertaining to derivative
financial instruments 1,215 999 295 49 247 1,590 2,805
13,674 10,820 3,250 235 575 14,880 28,554
non-controlling interests 1,998 4 14 481 – 499 2,497
92,652 29,903 9,691 6,348 15,961 61,903 154,555
1. Investments are recorded under the currency they are denominated in and are translated into Canadian dollars.2. Conventional products include liabilities related to investments with the exception of the amount pertaining to derivative financial instruments.
iDenTiFicaTion anD ManageMenT oF riSkS relaTeD iDenTiFicaTion anD ManageMenT oF riSkS relaTeD To inVeSTMenT oPeraTionSTo inVeSTMenT oPeraTionS (cont.) (cont.)
CAISSE DE DÉPÔT ET PLACEMENT DU QUÉBEC AR 2012 160
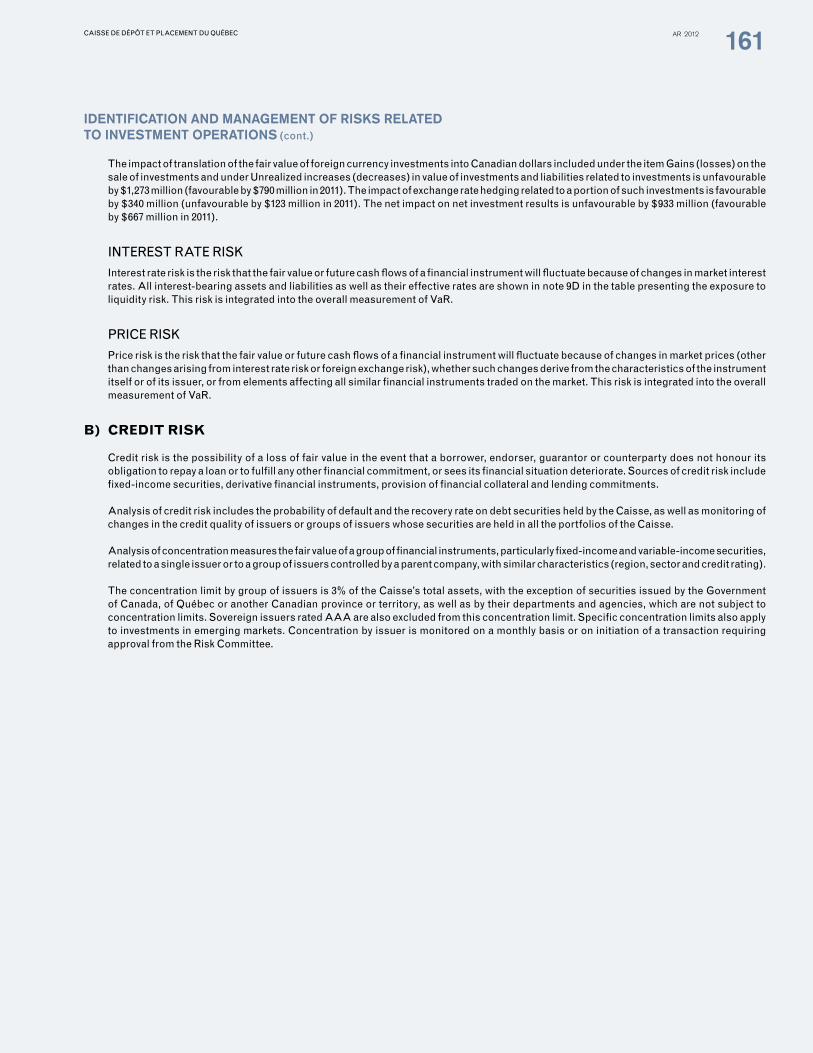
The impact of translation of the fair value of foreign currency investments into Canadian dollars included under the item Gains (losses) on the sale of investments and under Unrealized increases (decreases) in value of investments and liabilities related to investments is unfavourable by $1,273 million (favourable by $790 million in 2011). The impact of exchange rate hedging related to a portion of such investments is favourable by $340 million (unfavourable by $123 million in 2011). The net impact on net investment results is unfavourable by $933 million (favourable by $667 million in 2011).
INTEREST RATE RISk
Interest rate risk is the risk that the fair value or future cash flows of a financial instrument will fluctuate because of changes in market interest rates. All interest-bearing assets and liabilities as well as their effective rates are shown in note 9D in the table presenting the exposure to liquidity risk. This risk is integrated into the overall measurement of VaR.
PRICE RISk
Price risk is the risk that the fair value or future cash flows of a financial instrument will fluctuate because of changes in market prices (other than changes arising from interest rate risk or foreign exchange risk), whether such changes derive from the characteristics of the instrument itself or of its issuer, or from elements affecting all similar financial instruments traded on the market. This risk is integrated into the overall measurement of VaR.
b) Credit risk
Credit risk is the possibility of a loss of fair value in the event that a borrower, endorser, guarantor or counterparty does not honour its obligation to repay a loan or to fulfill any other financial commitment, or sees its financial situation deteriorate. Sources of credit risk include fixed-income securities, derivative financial instruments, provision of financial collateral and lending commitments.
Analysis of credit risk includes the probability of default and the recovery rate on debt securities held by the Caisse, as well as monitoring of changes in the credit quality of issuers or groups of issuers whose securities are held in all the portfolios of the Caisse.
Analysis of concentration measures the fair value of a group of financial instruments, particularly fixed-income and variable-income securities, related to a single issuer or to a group of issuers controlled by a parent company, with similar characteristics (region, sector and credit rating).
The concentration limit by group of issuers is 3% of the Caisse’s total assets, with the exception of securities issued by the Government of Canada, of Québec or another Canadian province or territory, as well as by their departments and agencies, which are not subject to concentration limits. Sovereign issuers rated AAA are also excluded from this concentration limit. Specific concentration limits also apply to investments in emerging markets. Concentration by issuer is monitored on a monthly basis or on initiation of a transaction requiring approval from the Risk Committee.
iDenTiFicaTion anD ManageMenT oF riSkS relaTeD iDenTiFicaTion anD ManageMenT oF riSkS relaTeD To inVeSTMenT oPeraTionSTo inVeSTMenT oPeraTionS (cont.) (cont.)
CAISSE DE DÉPÔT ET PLACEMENT DU QUÉBEC AR 2012 161

The concentration by credit rating of the Caisse’s groups of issuers is as follows as at December 31:
2012 2011
Value as a % of investments1
credit rating:2
AAA – AA 17.8 19.2
A 23.4 25.4
BBB 13.4 12.1
BB or lower 3.4 2.9
no credit rating:Real estate assets 16.3 16.0
ABTNs 0.7 0.9
Private equity 5.4 5.1
Private investment funds and hedge funds 6.8 7.3
Mortgages and mortgage securities 5.1 4.6
Other 7.7 6.5
100.0 100.0
1. The percentage of investments represents net positions by group of issuers.2. Credit ratings are obtained from the main recognized credit rating agencies and are aggregated according to an algorithm developed in house. For the purposes of this
concentration, only long-term credit ratings from the main agencies are used.
In the table above, the groups of issuers for which no credit rating is available are categorized. For most of these groups, the absence of a credit rating from the main recognized credit rating agencies is due to the private nature of the investments, the absence of any debt, restructuring of the investments or a combination of these elements. Most of the issuers, however, are evaluated with an internal rating system that is used to closely monitor changes in the credit cycle. The system includes exposure limits by sector and country (or region) and by external credit rating (no limit for internal credit ratings).
In 2012, 44 groups of issuers (180 in 2011) whose securities are held by the Caisse received a credit upgrade from the main credit rating agencies, while 71 others received a downgrade (154 in 2011). The Caisse frequently monitors changes in credit ratings by the agencies and compares them with the internal credit ratings when they are available.
In the case of mortgages with no assigned credit rating, the analysis of credit risk is based in part on the loan-to-value ratio. In this ratio, the amount of the loan is divided by the fair value of any asset received as collateral on the subscription date or the date funds were granted, or at any other time during the term of the loan.
The table below shows the breakdown of mortgages as at December 31:
2012 2011
Value as a % of mortgages
loan-to-value ratio0 to 55% 31.7 40.0
55 to 65% 32.1 30.3
65 to 75% 35.8 27.2
75 to 85% 0.4 1.2
More than 85% 0.0 1.3
100.0 100.0
Credit risk is measured by the fair value of investments before collateral or other credit upgrades are taken into account. For off-balance-sheet items, the value taken into account to determine maximum exposure to credit risk corresponds to the amount guaranteed or incurred.
iDenTiFicaTion anD ManageMenT oF riSkS relaTeD iDenTiFicaTion anD ManageMenT oF riSkS relaTeD To inVeSTMenT oPeraTionSTo inVeSTMenT oPeraTionS (cont.) (cont.)
CAISSE DE DÉPÔT ET PLACEMENT DU QUÉBEC AR 2012 162

The maximum exposure to credit risk is as follows as at December 31:
(in millions of dollars) 2012 2011
Investments
Fixed-income securities 78,688 74,379
Amounts receivable with respect to investments 13,976 12,453
92,664 86,832
Off-balance-sheet
Collateral pledged (note 13) 11,894 8,474
Collaterals and loan guarantees (note 12) 906 789
Funding facility (note 12) 6,167 6,167
18,967 15,430
Total maximum exposure 111,631 102,262
In reality, this exposure is less because the Caisse takes various measures to mitigate credit risk, such as the taking of guarantees (refer to note 13).
C) Counterparty risk related to derivative finanCial instruments
Over-the-counter derivative financial instruments give rise to counterparty risk, because they are negotiated by private contract without being traded through a clearing house. Counterparty risk corresponds to the credit risk from current or potential exposure arising from transactions involving this type of instrument in the event that the counterparty becomes unable to respect the conditions in the contracts.
To limit its exposure to counterparty risk arising from transactions involving over-the-counter derivative financial instruments, the Caisse carries out transactions with financial institutions whose credit ratings are established by recognized credit rating agencies and according to operational limits set by management. Moreover, the Caisse concludes legal agreements based on the standards of the International Swaps and Derivatives Association (ISDA), which allows it to benefit from the offset between the amounts at risk and the exchange of collateral to limit its net exposure to this risk.
This risk is measured by counterparty, pursuant to the legal agreement in effect, from which it is possible to calculate the net exposure occasioned by all over-the-counter derivative financial instruments and by the collateral exchanged. Actual exposure to counterparty risk is measured on a daily basis, pursuant to the legal agreement in effect. Potential exposure to counterparty risk is measured on a monthly basis.
As at December 31, the legal agreements and the collateral received helped reduce exposure to the counterparty risk of over-the-counter derivative financial instruments. The maximum exposure to this risk is $58 million ($435 million in 2011), in respect of 59 active counterparties (61 in 2011).
d) finanCinG-liquidity risk
Financing-liquidity risk corresponds to the possibility that the Caisse may not always be able to fulfill the commitments related to its financial liabilities without having to obtain funds at abnormally high prices or having to sell assets. It also corresponds to the risk that the Caisse may not be able to sell investments quickly or to purchase investments without having a significant unfavourable effect on the price of the investment in question.
Analysis of compliance with established rules is monitored on a monthly basis, and the liquidity status is determined daily. The Caisse uses various scenario simulations to estimate the potential impact of various market events on its liquidity. Managers evaluate the liquidity of the markets on which the Caisse obtains financing for its operations. They also ensure that the Caisse is active on various financial markets and maintains relationships with the recognized credit rating agencies that rate the Caisse as well as with capital providers.
iDenTiFicaTion anD ManageMenT oF riSkS relaTeD iDenTiFicaTion anD ManageMenT oF riSkS relaTeD To inVeSTMenT oPeraTionSTo inVeSTMenT oPeraTionS (cont.) (cont.)
CAISSE DE DÉPÔT ET PLACEMENT DU QUÉBEC AR 2012 163

The summary of maturities at par value of investments and liabilities related to investments as at December 31 is as follows:
(in millions of dollars) 2012 2011
less than 1 year
1 year to5 years
More than 5 years Total
effectiveinterest
rate% Total
Effectiveinterest
rate%
Fixed-income securities Short-term investments Canadian 411 1 – 412 2.0 538 1.9
Foreign 1,119 3 – 1,122 2.9 1,331 2.6
1,530 4 – 1,534 2.7 1,869 2.4
bonds Issued or guaranteed by:
Government of Canada 64 10,047 4,598 14,709 1.5 14,469 1.8
Province of Québec 52 978 7,499 8,529 3.4 7,698 3.6
Other Canadian provinces 25 5 876 906 3.7 1,229 4.1 Municipalities and other
Canadian agencies 168 788 346 1,302 4.1 1,417 4.1 Canadian government
corporations 103 5,133 5,883 11,119 2.9 11,033 3.2
U.S. government – 1 720 721 3.8 965 3.0 Other foreign
governments – – – – – 268 4.2
Mortgage securities
Canadian 90 15 12 117 4.6 176 5.6
Foreign – 109 – 109 – 118 –
Canadian corporations 727 4,118 5,890 10,735 4.9 10,115 5.2
Foreign corporations 1,236 360 1,037 2,633 7.2 2,289 7.8 Inflation-indexed securities Canadian – – 679 679 0.9 714 1.1
Foreign – – 50 50 0.7 99 3.1
2,465 21,554 27,590 51,609 3.2 50,590 3.5
abTns 172 10,976 112 11,260 – 11,878 –
Mortgages Canadian 854 2,853 3,610 7,317 3.6 6,420 3.8
Foreign 901 317 514 1,732 2.5 858 4.9
1,755 3,170 4,124 9,049 3.4 7,278 3.9
5,922 35,704 31,826 73,452 3.3 71,615 3.5
amounts receivable with respect to investments
Securities acquired under reverse repurchase agreements
Canadian 8,632 – – 8,632 1.0 6,057 1.0
Foreign 2,754 – – 2,754 0.1 1,919 –
11,386 – – 11,386 0.8 7,976 0.8
iDenTiFicaTion anD ManageMenT oF riSkS relaTeD iDenTiFicaTion anD ManageMenT oF riSkS relaTeD To inVeSTMenT oPeraTionSTo inVeSTMenT oPeraTionS (cont.) (cont.)
CAISSE DE DÉPÔT ET PLACEMENT DU QUÉBEC AR 2012 164

(in millions of dollars) 2012 2011
less than 1 year
1 year to5 years
More than 5 years Total
effectiveinterest
rate% Total
Effectiveinterest
rate%
liabilities related to investments
Securities sold under
repurchase agreements 4,625 – – 4,625 0.8 670 0.7
Commercial paper payable 1,019 – – 1,019 1.1 1,019 1.1
Term notes – 2,991 4,972 7,963 3.8 8,082 3.8
Short selling of securities 494 33 3,016 3,543 1.9 2,191 2.3
Mortgage loans payable 552 1,869 – 2,421 4.1 2,216 4.6
Other loans payable 1,594 1,444 – 3,038 1.2 3,295 1.1
8,284 6,337 7,988 22,609 2.4 17,473 2.9
The Caisse is a party to various commitments and issues financial guarantees that can have an impact on its liquidity (refer to notes 3E, 12 and 13).
10derivative finanCial instrumentsderivative finanCial instruments
Derivative financial instruments are financial contracts whose value fluctuates as a function of the underlying asset, and which do not require holding or delivering the underlying asset itself. The underlying may be of a financial nature (interest rate, foreign currency or stock market security or index) or may be a commodity (precious metal, food or crude oil).
The notional amount of a derivative financial instrument represents the value of the notional principal to which a rate or a price applies to determine the exchange of future cash flows, and does not reflect the credit risk pertaining to the instrument.
The Caisse uses derivative financial instruments that include the following:
• Forward contracts and futures contracts are undertakings that enable the purchase or sale of an underlying, the quantity and price of which are determined in the contract, which includes a predetermined maturity date. A forward contract involves customized conditions negotiated directly between the parties on the over-the-counter market. A futures contract has terms and conditions determined by an organized market.
• A swap is a transaction whereby two parties agree to exchange financial flows on predetermined conditions that include a notional amount and a term.
• An option is a contract that is negotiated by mutual agreement or traded on an organized market and that gives the purchaser the right, but not the obligation, to buy or sell a given amount of an underlying security, index or commodity at a strike price stipulated in advance, either at a determined date or at any time before a specified maturity date.
• A warrant is a contract that enables the purchase of an underlying at a price established by the contract and according to the maturity stated therein.
Foreign exchange risk arises from investments and liabilities related to investments denominated in foreign currencies, as well as from related derivative financial instruments.
Derivative financial instruments that are traded on exchanges or negotiated with banks and securities dealers are used to manage the interest rate and market risks of the total investment portfolio.
iDenTiFicaTion anD ManageMenT oF riSkS relaTeD iDenTiFicaTion anD ManageMenT oF riSkS relaTeD To inVeSTMenT oPeraTionSTo inVeSTMenT oPeraTionS (cont.) (cont.)
CAISSE DE DÉPÔT ET PLACEMENT DU QUÉBEC AR 2012 165

a) summary of derivative finanCial instruments
(in millions of dollars) 2012 2011
Fair valuenotional amount assets liabilities
net amount
Net amount
Foreign exchange risk management1
Foreign currency swaps
Purchases 1,169 12 24 (12) 2
Forward contracts
Purchases 1,988 12 22 (10) 91
Sales 24,736 92 285 (193) 180
Over-the-counter options
Purchases – – – – 26
Sales – – – – (4)
27,893 116 331 (215) 295
interest rate and market risk management Interest rate and foreign currency swaps 52,307 1,679 1,586 93 19
Credit default swaps 32,829 267 11 256 1,003
Equity and convertible securities swaps 21,399 416 122 294 319
Commodity swaps 21 – – – 1
Futures contracts 6,737 13 12 1 (1)
Forward contracts 3,146 14 21 (7) (7)
Over-the-counter options
Purchases 3,035 63 – 63 77
Sales 3,005 – 69 (69) (86)
Exchange-traded options
Purchases 1,986 12 – 12 15
Sales 1,682 – 3 (3) (6)
Warrants 82 13 – 13 44
126,229 2,477 1,824 653 1,378
Total derivative financial instrument contracts 154,122 2,593 2,155 438 1,673
1. When foreign exchange risk management transactions involve simultaneous use of the U.S. dollar and other currencies, the notional amount used here represents only the final value denominated in Canadian dollars.
DeriVaTiVe Financial inSTruMenTSDeriVaTiVe Financial inSTruMenTS (cont.) (cont.)
CAISSE DE DÉPÔT ET PLACEMENT DU QUÉBEC AR 2012 166

b) summary of derivative finanCial instrument maturities
(in millions of dollars) 2012 2011
notional amount – Maturityless than
1 year1 year
5 yearsMore than
5 years TotalNotional amount
Foreign exchange risk management Foreign currency swaps
Purchases 946 92 131 1,169 4,246
Forward contracts
Purchases 1,988 – – 1,988 6,400
Sales 24,302 434 – 24,736 25,059
Over-the-counter options
Purchases – – – – 241
Sales – – – – 185
27,236 526 131 27,893 36,131
interest rate and market risk management Interest rate and foreign currency swaps 8,051 22,613 21,643 52,307 52,542
Credit default swaps 144 32,685 – 32,829 42,697
Equity and convertible securities swaps 20,749 650 – 21,399 20,896
Commodity swaps 21 – – 21 59
Futures contracts 6,730 7 – 6,737 7,993
Forward contracts 3,109 37 – 3,146 2,342
Over-the-counter options
Purchases 2,316 719 – 3,035 3,590
Sales 2,777 228 – 3,005 3,075
Exchange-traded options
Purchases 1,226 760 – 1,986 814
Sales 188 1,494 – 1,682 301
Warrants 7 75 – 82 101
45,318 59,268 21,643 126,229 134,410
Total derivative financial instrument contracts 72,554 59,794 21,774 154,122 170,541
(in millions of dollars) 2012 2011
Fair value – Maturityless than
1 year1 year
5 yearsMore than
5 years TotalFair
value
Derivative financial instruments Assets 604 681 1,308 2,593 4,478
Liabilities 562 728 865 2,155 2,805
net amount 42 (47) 443 438 1,673
11transfers of reCeivablestransfers of reCeivables
The Caisse has put in place a program to syndicate some of its mortgages. Pursuant to these transactions, the Caisse assumes the role of administrator of the mortgages sold and thus maintains a relationship with clients. During the year ended December 31, 2012, the Caisse did not carry out any syndication operations ($48 million in 2011). Syndication gains and losses are not recorded separately because the amounts involved are not significant.
No securitization activities were carried out in 2012 and 2011.
DeriVaTiVe Financial inSTruMenTSDeriVaTiVe Financial inSTruMenTS (cont.) (cont.)
CAISSE DE DÉPÔT ET PLACEMENT DU QUÉBEC AR 2012 167

Given the nature of its operations, the Caisse has a number of commitments.
Commitments to buy investments mean the Caisse is committed to buying investments that will be settled in the coming financial years, in accordance with the terms and conditions in each agreement.
For the Caisse, guarantees and loan guarantees consist in providing guarantees to financial institutions and corporations regarding future income deriving from the sale of investments and transactions on derivative financial instruments as well as repayment of borrowings by investee companies. Guarantees related to the repayment of loans have no specific maturity date, except in some cases where the terms range from one to seven years.
(in millions of dollars) 2012 2011
Commitments to buy investments 8,142 7,182
Guarantees and loan guarantees 906 789
ABTNs (funding facility)1 6,167 6,167
15,215 14,138
1. For a description of the commitments related to ABTNs, see note 3E.
13CollateralsCollaterals
In the normal course of business, the Caisse pledges financial assets as collateral for securities borrowed, securities sold under repurchase agreements and transactions involving derivative financial instruments. The counterparty is authorized to sell or pledge as collateral certain securities in the absence of default by the Caisse. On certain conditions, the Caisse may have to pledge additional collateral if collateral already pledged has lost value.
The following table presents the fair value of the collateral pledged by the Caisse as at December 31:
(in millions of dollars) 2012 2011
Collateral pledged for
Securities borrowed 6,781 7,138
Securities sold under repurchase agreements 4,648 671
Over-the-counter derivative financial instruments 306 220
Exchange-traded derivative financial instruments 159 445
11,894 8,474
The Caisse receives financial assets as collateral for securities lent, securities acquired under reverse repurchase agreements and transactions involving derivative financial instruments. The Caisse is authorized to sell or pledge certain securities in the absence of default by the counterparty. The Caisse is obliged to return such securities to the counterparties. If the value of the collateral received decreases, the Caisse may in certain cases request additional collateral.
The following table presents the fair value of the collateral received by the Caisse as at December 31:
(in millions of dollars) 2012 2011
Collateral received for
Securities lent 2,159 1,872
Securities acquired under reverse repurchase agreements 11,408 8,000
Over-the-counter derivative financial instruments 1,386 1,916
14,953 11,788
12Commitments and ContinGenCiesCommitments and ContinGenCies
CAISSE DE DÉPÔT ET PLACEMENT DU QUÉBEC AR 2012 168
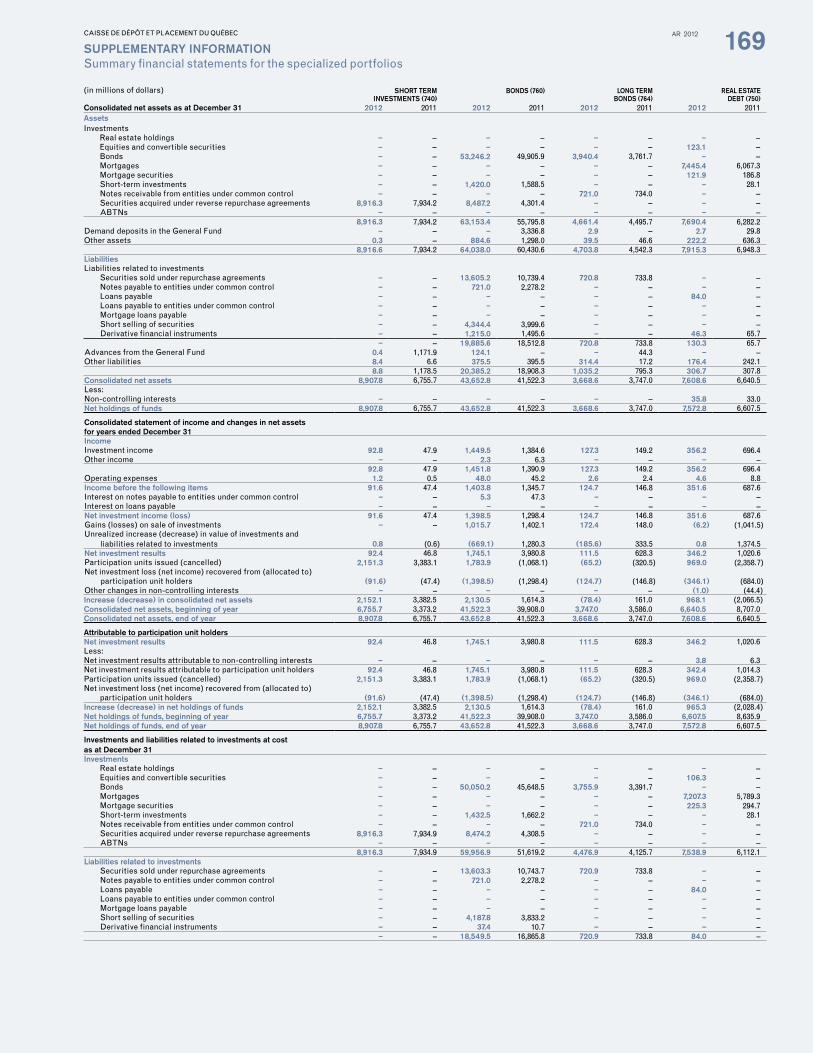
SuPPleMenTarY inForMaTionSummary financial statements for the specialized portfolios
(in millions of dollars) ShorT TerM inVeSTMenTS (740)
bonDS (760) long TerM bonDS (764)
real eSTaTe DebT (750)
consolidated net assets as at December 31 2012 2011 2012 2011 2012 2011 2012 2011 assetsInvestments Real estate holdings – – – – – – – – Equities and convertible securities – – – – – – 123.1 – Bonds – – 53,246.2 49,905.9 3,940.4 3,761.7 – – Mortgages – – – – – – 7,445.4 6,067.3 Mortgage securities – – – – – – 121.9 186.8 Short-term investments – – 1,420.0 1,588.5 – – – 28.1 Notes receivable from entities under common control – – – – 721.0 734.0 – – Securities acquired under reverse repurchase agreements 8,916.3 7,934.2 8,487.2 4,301.4 – – – – ABTNs – – – – – – – –
8,916.3 7,934.2 63,153.4 55,795.8 4,661.4 4,495.7 7,690.4 6,282.2 Demand deposits in the General Fund – – – 3,336.8 2.9 – 2.7 29.8 Other assets 0.3 – 884.6 1,298.0 39.5 46.6 222.2 636.3 8,916.6 7,934.2 64,038.0 60,430.6 4,703.8 4,542.3 7,915.3 6,948.3 liabilitiesLiabilities related to investments Securities sold under repurchase agreements – – 13,605.2 10,739.4 720.8 733.8 – – Notes payable to entities under common control – – 721.0 2,278.2 – – – – Loans payable – – – – – – 84.0 – Loans payable to entities under common control – – – – – – – – Mortgage loans payable – – – – – – – – Short selling of securities – – 4,344.4 3,999.6 – – – – Derivative financial instruments – – 1,215.0 1,495.6 – – 46.3 65.7
– – 19,885.6 18,512.8 720.8 733.8 130.3 65.7 Advances from the General Fund 0.4 1,171.9 124.1 – – 44.3 – – Other liabilities 8.4 6.6 375.5 395.5 314.4 17.2 176.4 242.1 8.8 1,178.5 20,385.2 18,908.3 1,035.2 795.3 306.7 307.8 consolidated net assets 8,907.8 6,755.7 43,652.8 41,522.3 3,668.6 3,747.0 7,608.6 6,640.5 Less:Non-controlling interests – – – – – – 35.8 33.0 net holdings of funds 8,907.8 6,755.7 43,652.8 41,522.3 3,668.6 3,747.0 7,572.8 6,607.5
consolidated statement of income and changes in net assetsfor years ended December 31 incomeInvestment income 92.8 47.9 1,449.5 1,384.6 127.3 149.2 356.2 696.4 Other income – – 2.3 6.3 – – – –
92.8 47.9 1,451.8 1,390.9 127.3 149.2 356.2 696.4 Operating expenses 1.2 0.5 48.0 45.2 2.6 2.4 4.6 8.8 income before the following items 91.6 47.4 1,403.8 1,345.7 124.7 146.8 351.6 687.6 Interest on notes payable to entities under common control – – 5.3 47.3 – – – – Interest on loans payable – – – – – – – – net investment income (loss) 91.6 47.4 1,398.5 1,298.4 124.7 146.8 351.6 687.6 Gains (losses) on sale of investments – – 1,015.7 1,402.1 172.4 148.0 (6.2) (1,041.5) Unrealized increase (decrease) in value of investments and liabilities related to investments 0.8 (0.6) (669.1) 1,280.3 (185.6) 333.5 0.8 1,374.5 net investment results 92.4 46.8 1,745.1 3,980.8 111.5 628.3 346.2 1,020.6 Participation units issued (cancelled) 2,151.3 3,383.1 1,783.9 (1,068.1) (65.2) (320.5) 969.0 (2,358.7) Net investment loss (net income) recovered from (allocated to) participation unit holders (91.6) (47.4) (1,398.5) (1,298.4) (124.7) (146.8) (346.1) (684.0) Other changes in non-controlling interests – – – – – – (1.0) (44.4) increase (decrease) in consolidated net assets 2,152.1 3,382.5 2,130.5 1,614.3 (78.4) 161.0 968.1 (2,066.5) consolidated net assets, beginning of year 6,755.7 3,373.2 41,522.3 39,908.0 3,747.0 3,586.0 6,640.5 8,707.0 consolidated net assets, end of year 8,907.8 6,755.7 43,652.8 41,522.3 3,668.6 3,747.0 7,608.6 6,640.5
attributable to participation unit holdersnet investment results 92.4 46.8 1,745.1 3,980.8 111.5 628.3 346.2 1,020.6 Less:Net investment results attributable to non-controlling interests – – – – – – 3.8 6.3 Net investment results attributable to participation unit holders 92.4 46.8 1,745.1 3,980.8 111.5 628.3 342.4 1,014.3 Participation units issued (cancelled) 2,151.3 3,383.1 1,783.9 (1,068.1) (65.2) (320.5) 969.0 (2,358.7) Net investment loss (net income) recovered from (allocated to) participation unit holders (91.6) (47.4) (1,398.5) (1,298.4) (124.7) (146.8) (346.1) (684.0) increase (decrease) in net holdings of funds 2,152.1 3,382.5 2,130.5 1,614.3 (78.4) 161.0 965.3 (2,028.4) net holdings of funds, beginning of year 6,755.7 3,373.2 41,522.3 39,908.0 3,747.0 3,586.0 6,607.5 8,635.9 net holdings of funds, end of year 8,907.8 6,755.7 43,652.8 41,522.3 3,668.6 3,747.0 7,572.8 6,607.5
investments and liabilities related to investments at cost as at December 31
investments Real estate holdings – – – – – – – – Equities and convertible securities – – – – – – 106.3 – Bonds – – 50,050.2 45,648.5 3,755.9 3,391.7 – – Mortgages – – – – – – 7,207.3 5,789.3 Mortgage securities – – – – – – 225.3 294.7 Short-term investments – – 1,432.5 1,662.2 – – – 28.1 Notes receivable from entities under common control – – – – 721.0 734.0 – – Securities acquired under reverse repurchase agreements 8,916.3 7,934.9 8,474.2 4,308.5 – – – – ABTNs – – – – – – – – 8,916.3 7,934.9 59,956.9 51,619.2 4,476.9 4,125.7 7,538.9 6,112.1 liabilities related to investments Securities sold under repurchase agreements – – 13,603.3 10,743.7 720.9 733.8 – – Notes payable to entities under common control – – 721.0 2,278.2 – – – – Loans payable – – – – – – 84.0 – Loans payable to entities under common control – – – – – – – – Mortgage loans payable – – – – – – – – Short selling of securities – – 4,187.8 3,833.2 – – – – Derivative financial instruments – – 37.4 10.7 – – – – – – 18,549.5 16,865.8 720.9 733.8 84.0 –
CAISSE DE DÉPÔT ET PLACEMENT DU QUÉBEC AR 2012 169

SuPPleMenTarY inForMaTionSummary financial statements for the specialized portfolios (cont.)
(in millions of dollars) real reTurn bonDS (762)
inFraSTrucTure (782) real eSTaTe (710)
canaDian eQuiTY (720)
consolidated net assets as at December 31 2012 2011 2012 2011 2012 2011 2012 2011 assetsInvestments Real estate holdings – – – – 25,835.8 22,186.3 – – Equities and convertible securities – – 5,436.4 6,520.8 3,449.5 4,065.1 15,097.6 11,594.4 Bonds 1,233.4 1,303.5 1,210.7 1,344.5 – – – – Mortgages – – – – 1,867.4 1,480.0 – – Mortgage securities – – – – – – – – Short-term investments – – – – 52.7 988.9 – – Notes receivable from entities under common control – – – – – – 13,412.2 12,325.8 Securities acquired under reverse repurchase agreements – – 495.6 – – – – – ABTNs – – – – – – – –
1,233.4 1,303.5 7,142.7 7,865.3 31,205.4 28,720.3 28,509.8 23,920.2 Demand deposits in the General Fund 125.7 146.1 451.3 – 8.8 177.7 51.4 211.3 Other assets 2.5 2.7 24.2 39.0 522.4 2,689.5 45.8 44.6 1,361.6 1,452.3 7,618.2 7,904.3 31,736.6 31,587.5 28,607.0 24,176.1 liabilitiesLiabilities related to investments Securities sold under repurchase agreements 133.8 148.6 – – – – – – Notes payable to entities under common control – – – – – – – – Loans payable – – – 9.3 330.0 146.2 – – Loans payable to entities under common control – – – – 9,316.0 8,756.2 – – Mortgage loans payable – – – – 2,427.5 2,217.1 – – Short selling of securities – – 494.9 – – – 6,549.1 5,557.7 Derivative financial instruments – – 162.6 108.8 316.7 349.2 3.5 43.4
133.8 148.6 657.5 118.1 12,390.2 11,468.7 6,552.6 5,601.1 Advances from the General Fund – – – 866.7 – – – – Other liabilities 2.6 18.0 50.6 33.2 1,799.3 817.1 108.9 83.6 136.4 166.6 708.1 1,018.0 14,189.5 12,285.8 6,661.5 5,684.7 consolidated net assets 1,225.2 1,285.7 6,910.1 6,886.3 17,547.1 19,301.7 21,945.5 18,491.4 Less:Non-controlling interests – – 644.6 1,160.8 1,325.4 1,303.7 – – net holdings of funds 1,225.2 1,285.7 6,265.5 5,725.5 16,221.7 17,998.0 21,945.5 18,491.4
consolidated statement of income and changes in net assetsfor years ended December 31 incomeInvestment income 25.5 37.8 862.3 216.7 605.4 760.1 671.2 570.7 Other income – – 3.2 2.4 – – 3.8 3.7
25.5 37.8 865.5 219.1 605.4 760.1 675.0 574.4 Operating expenses 2.1 0.8 22.1 17.0 9.6 17.4 47.8 43.9 income before the following items 23.4 37.0 843.4 202.1 595.8 742.7 627.2 530.5 Interest on notes payable to entities under common control – – – – – – – – Interest on loans payable – – – – – – – – net investment income (loss) 23.4 37.0 843.4 202.1 595.8 742.7 627.2 530.5 Gains (losses) on sale of investments 51.2 98.8 466.7 (57.9) 515.4 141.0 824.7 (1,468.3) Unrealized increase (decrease) in value of investments and liabilities related to investments (40.5) 66.6 (837.0) 1,234.2 345.4 1,108.2 (173.0) (1,195.6) net investment results 34.1 202.4 473.1 1,378.4 1,456.6 1,991.9 1,278.9 (2,133.4) Participation units issued (cancelled) (71.2) 184.6 621.1 530.8 (1,595.8) 380.5 2,802.4 1,892.8 Net investment loss (net income) recovered from (allocated to) participation unit holders (23.4) (37.0) (591.9) (168.0) (1,512.6) (690.6) (627.2) (530.5) Other changes in non-controlling interests – – (478.5) 116.0 (102.8) 151.3 – – increase (decrease) in consolidated net assets (60.5) 350.0 23.8 1,857.2 (1,754.6) 1,833.1 3,454.1 (771.1) consolidated net assets, beginning of year 1,285.7 935.7 6,886.3 5,029.1 19,301.7 17,468.6 18,491.4 19,262.5 consolidated net assets, end of year 1,225.2 1,285.7 6,910.1 6,886.3 17,547.1 19,301.7 21,945.5 18,491.4
attributable to participation unit holdersnet investment results 34.1 202.4 473.1 1,378.4 1,456.6 1,991.9 1,278.9 (2,133.4) Less:Net investment results attributable to non-controlling interests – – (37.7) 334.9 124.5 157.8 – – Net investment results attributable to participation unit holders 34.1 202.4 510.8 1,043.5 1,332.1 1,834.1 1,278.9 (2,133.4) Participation units issued (cancelled) (71.2) 184.6 621.1 530.8 (1,595.8) 380.5 2,802.4 1,892.8 Net investment loss (net income) recovered from (allocated to) participation unit holders (23.4) (37.0) (591.9) (168.0) (1,512.6) (690.6) (627.2) (530.5) increase (decrease) in net holdings of funds (60.5) 350.0 540.0 1,406.3 (1,776.3) 1,524.0 3,454.1 (771.1) net holdings of funds, beginning of year 1,285.7 935.7 5,725.5 4,319.2 17,998.0 16,474.0 18,491.4 19,262.5 net holdings of funds, end of year 1,225.2 1,285.7 6,265.5 5,725.5 16,221.7 17,998.0 21,945.5 18,491.4
investments and liabilities related to investments at cost as at December 31investments Real estate holdings – – – – 22,010.9 18,899.0 – – Equities and convertible securities – – 4,508.4 4,887.5 3,473.1 3,945.0 13,455.7 10,171.9 Bonds 1,127.8 1,157.4 1,203.5 1,269.9 – – – – Mortgages – – – – 1,844.1 1,485.5 – – Mortgage securities – – – – – – – – Short-term investments – – – – 53.1 988.8 – – Notes receivable from entities under common control – – – – – – 13,412.2 12,325.8 Securities acquired under reverse repurchase agreements – – 492.1 – – – – – ABTNs – – – – – – – – 1,127.8 1,157.4 6,204.0 6,157.4 27,381.2 25,318.3 26,867.9 22,497.7 liabilities related to investments Securities sold under repurchase agreements 133.8 148.6 – – – – – – Notes payable to entities under common control – – – – – – – – Loans payable – – – 9.4 331.3 147.2 – – Loans payable to entities under common control – – – – 8,761.6 8,303.6 – – Mortgage loans payable – – – – 2,420.6 2,215.6 – – Short selling of securities – – 491.8 – – – 5,780.1 5,221.0 Derivative financial instruments – – 41.9 52.7 20.3 22.7 – – 133.8 148.6 533.7 62.1 11,553.8 10,689.1 5,780.1 5,221.0
1. The financial statements of the specialized Real Estate portfolio have been prepared in accordance with IFRS, and a separate report has been produced for them by the independent auditors.
1
CAISSE DE DÉPÔT ET PLACEMENT DU QUÉBEC AR 2012 170

SuPPleMenTarY inForMaTionSummary financial statements for the specialized portfolios (cont.)
(in millions of dollars) global eQuiTY (735) u.S. eQuiTY (731) eaFe eQuiTY (730)
eMerging MarkeTS eQuiTY (732)
consolidated net assets as at December 31 2012 2011 2012 2011 2012 2011 2012 2011 assetsInvestments Real estate holdings – – – – – – – – Equities and convertible securities 19,148.7 14,109.4 10,159.9 8,112.2 9,825.9 9,105.3 8,723.6 5,890.2 Bonds – – – – – – – – Mortgages – – – – – – – – Mortgage securities – – – – – – – – Short-term investments 1.0 8.6 – – – – – 0.2 Notes receivable from entities under common control – – – – – – – – Securities acquired under reverse repurchase agreements – – – – – – – – ABTNs – – – – – – – –
19,149.7 14,118.0 10,159.9 8,112.2 9,825.9 9,105.3 8,723.6 5,890.4 Demand deposits in the General Fund – – 3.4 – – – – – Other assets 116.0 44.6 12.3 13.6 22.1 24.3 9.9 9.7 19,265.7 14,162.6 10,175.6 8,125.8 9,848.0 9,129.6 8,733.5 5,900.1 liabilitiesLiabilities related to investments Securities sold under repurchase agreements – – – – – – – – Notes payable to entities under common control 2,529.0 770.0 – – – – – – Loans payable – – – – – – – – Loans payable to entities under common control – – – – – – – – Mortgage loans payable – – – – – – – – Short selling of securities 2,447.6 2,030.3 – – – – 5.4 0.7 Derivative financial instruments 140.3 147.3 – – – – 0.1 –
5,116.9 2,947.6 – – – – 5.5 0.7 Advances from the General Fund 299.3 298.8 – 5.5 19.4 25.4 7.9 2.7 Other liabilities 116.6 74.0 25.9 14.4 9.0 10.0 9.4 15.6 5,532.8 3,320.4 25.9 19.9 28.4 35.4 22.8 19.0 consolidated net assets 13,732.9 10,842.2 10,149.7 8,105.9 9,819.6 9,094.2 8,710.7 5,881.1 Less:Non-controlling interests – – – – – – – – net holdings of funds 13,732.9 10,842.2 10,149.7 8,105.9 9,819.6 9,094.2 8,710.7 5,881.1
consolidated statement of income and changes in net assetsfor years ended December 31 incomeInvestment income 354.1 224.0 216.0 109.6 336.2 326.8 205.1 143.9 Other income – – – – – – – –
354.1 224.0 216.0 109.6 336.2 326.8 205.1 143.9 Operating expenses 40.5 27.8 7.2 4.4 9.9 8.6 13.1 9.5 income before the following items 313.6 196.2 208.8 105.2 326.3 318.2 192.0 134.4 Interest on notes payable to entities under common control 17.6 13.1 – – – – – – Interest on loans payable – – – – – – – – net investment income (loss) 296.0 183.1 208.8 105.2 326.3 318.2 192.0 134.4 Gains (losses) on sale of investments 15.1 187.8 166.1 141.7 (380.2) 47.2 (89.6) 35.9 Unrealized increase (decrease) in value of investments and liabilities related to investments 1,264.2 (1,053.5) 699.9 72.1 1,300.0 (1,327.5) 921.2 (1,210.2) net investment results 1,575.3 (682.6) 1,074.8 319.0 1,246.1 (962.1) 1,023.6 (1,039.9) Participation units issued (cancelled) 1,611.4 5,841.5 1,177.8 2,131.5 (194.4) 645.5 1,998.0 1,256.3 Net investment loss (net income) recovered from (allocated to) participation unit holders (296.0) (183.1) (208.8) (105.2) (326.3) (318.2) (192.0) (134.4) Other changes in non-controlling interests – – – – – – – – increase (decrease) in consolidated net assets 2,890.7 4,975.8 2,043.8 2,345.3 725.4 (634.8) 2,829.6 82.0 consolidated net assets, beginning of year 10,842.2 5,866.4 8,105.9 5,760.6 9,094.2 9,729.0 5,881.1 5,799.1 consolidated net assets, end of year 13,732.9 10,842.2 10,149.7 8,105.9 9,819.6 9,094.2 8,710.7 5,881.1
attributable to participation unit holdersnet investment results 1,575.3 (682.6) 1,074.8 319.0 1,246.1 (962.1) 1,023.6 (1,039.9) Less:Net investment results attributable to non-controlling interests – – – – – – – – Net investment results attributable to participation unit holders 1,575.3 (682.6) 1,074.8 319.0 1,246.1 (962.1) 1,023.6 (1,039.9) Participation units issued (cancelled) 1,611.4 5,841.5 1,177.8 2,131.5 (194.4) 645.5 1,998.0 1,256.3 Net investment loss (net income) recovered from (allocated to) participation unit holders (296.0) (183.1) (208.8) (105.2) (326.3) (318.2) (192.0) (134.4) increase (decrease) in net holdings of funds 2,890.7 4,975.8 2,043.8 2,345.3 725.4 (634.8) 2,829.6 82.0 net holdings of funds, beginning of year 10,842.2 5,866.4 8,105.9 5,760.6 9,094.2 9,729.0 5,881.1 5,799.1 net holdings of funds, end of year 13,732.9 10,842.2 10,149.7 8,105.9 9,819.6 9,094.2 8,710.7 5,881.1
investments and liabilities related to investments at cost as at December 31investments Real estate holdings – – – – – – – – Equities and convertible securities 18,261.3 14,634.0 9,367.5 8,019.8 9,356.4 9,935.8 7,841.2 5,929.4 Bonds 0.2 – – – – – – – Mortgages – – – – – – – – Mortgage securities – – – – – – – – Short-term investments – – – – – – – – Notes receivable from entities under common control – – – – – – – – Securities acquired under reverse repurchase agreements – – – – – – – – ABTNs – – – – – – – – 18,261.5 14,634.0 9,367.5 8,019.8 9,356.4 9,935.8 7,841.2 5,929.4 liabilities related to investments Securities sold under repurchase agreements – – – – – – – – Notes payable to entities under common control 2,529.0 770.0 – – – – – – Loans payable – – – – – – – – Loans payable to entities under common control – – – – – – – – Mortgage loans payable – – – – – – – – Short selling of securities 2,441.6 2,168.2 – – – – 5.3 0.7 Derivative financial instruments 3.0 6.0 – – – – – – 4,973.6 2,944.2 – – – – 5.3 0.7
CAISSE DE DÉPÔT ET PLACEMENT DU QUÉBEC AR 2012 171

(in millions of dollars) PriVaTe eQuiTY (780) heDge FunDS (770) aSSeT allocaTion (771) abTns (772)
consolidated net assets as at December 31 2012 2011 2012 2011 2012 2011 2012 2011 assetsInvestments Real estate holdings – – – – – – – – Equities and convertible securities 17,087.1 15,380.9 3,283.0 3,179.4 1,020.4 86.2 – – Bonds 999.4 517.5 – – 97.3 194.7 – – Mortgages – – – – – – – – Mortgage securities – – – – – – – – Short-term investments – 8.7 – – 269.5 686.7 – – Notes receivable from entities under common control – – – – – – – – Securities acquired under reverse repurchase agreements – – – – – – – – ABTNs – – – – – – 10,152.3 8,931.8
18,086.5 15,907.1 3,283.0 3,179.4 1,387.2 967.6 10,152.3 8,931.8 Demand deposits in the General Fund – – – 95.8 197.9 1,205.5 – 2.6 Other assets 36.0 32.7 9.3 4.4 2.6 1.4 34.8 37.3 18,122.5 15,939.8 3,292.3 3,279.6 1,587.7 2,174.5 10,187.1 8,971.7 liabilitiesLiabilities related to investments Securities sold under repurchase agreements – – – – – – – – Notes payable to entities under common control – – – – – – 9,556.5 9,652.6 Loans payable – – – – – – 1,385.8 1,744.7 Loans payable to entities under common control – – – – – – – – Mortgage loans payable – – – – – – – – Short selling of securities 49.6 60.4 – – 41.2 – – – Derivative financial instruments 96.3 123.5 5.1 0.4 442.9 949.1 25.0 32.9
145.9 183.9 5.1 0.4 484.1 949.1 10,967.3 11,430.2 Advances from the General Fund 179.7 9.9 94.4 – – – 8.0 – Other liabilities 105.1 21.5 5.7 7.5 4.5 3.7 46.2 61.3 430.7 215.3 105.2 7.9 488.6 952.8 11,021.5 11,491.5 consolidated net assets 17,691.8 15,724.5 3,187.1 3,271.7 1,099.1 1,221.7 (834.4) (2,519.8) Less:Non-controlling interests – – – – – – – – net holdings of funds 17,691.8 15,724.5 3,187.1 3,271.7 1,099.1 1,221.7 (834.4) (2,519.8)
consolidated statement of income and changes in net assetsfor years ended December 31 incomeInvestment income 458.4 289.2 0.4 12.4 24.5 7.2 146.6 153.6 Other income 19.0 43.6 – – – – – –
477.4 332.8 0.4 12.4 24.5 7.2 146.6 153.6 Operating expenses 39.3 34.7 13.0 11.0 15.1 14.0 5.5 10.0 income before the following items 438.1 298.1 (12.6) 1.4 9.4 (6.8) 141.1 143.6 Interest on notes payable to entities under common control – – – – – – 119.9 127.2 Interest on loans payable – – – – – – 16.3 18.4 net investment income (loss) 438.1 298.1 (12.6) 1.4 9.4 (6.8) 4.9 (2.0) Gains (losses) on sale of investments 449.3 212.6 134.6 107.2 (417.4) 94.0 (134.3) (23.5) Unrealized increase (decrease) in value of investments and liabilities related to investments 1,245.8 602.5 8.0 (104.2) (14.5) 34.0 1,815.5 118.1 net investment results 2,133.2 1,113.2 130.0 4.4 (422.5) 121.2 1,686.1 92.6 Participation units issued (cancelled) 272.2 (2,538.1) (227.2) (37.1) 309.3 459.0 4.2 (3.6) Net investment loss (net income) recovered from (allocated to) participation unit holders (438.1) (298.1) 12.6 (1.4) (9.4) 6.8 (4.9) 2.0 Other changes in non-controlling interests – – – – – – – – increase (decrease) in consolidated net assets 1,967.3 (1,723.0) (84.6) (34.1) (122.6) 587.0 1,685.4 91.0 consolidated net assets, beginning of year 15,724.5 17,447.5 3,271.7 3,305.8 1,221.7 634.7 (2,519.8) (2,610.8) consolidated net assets, end of year 17,691.8 15,724.5 3,187.1 3,271.7 1,099.1 1,221.7 (834.4) (2,519.8)
attributable to participation unit holdersnet investment results 2,133.2 1,113.2 130.0 4.4 (422.5) 121.2 1,686.1 92.6 Less:Net investment results attributable to non-controlling interests – – – – – – – – Net investment results attributable to participation unit holders 2,133.2 1,113.2 130.0 4.4 (422.5) 121.2 1,686.1 92.6 Participation units issued (cancelled) 272.2 (2,538.1) (227.2) (37.1) 309.3 459.0 4.2 (3.6) Net investment loss (net income) recovered from (allocated to) participation unit holders (438.1) (298.1) 12.6 (1.4) (9.4) 6.8 (4.9) 2.0 increase (decrease) in net holdings of funds 1,967.3 (1,723.0) (84.6) (34.1) (122.6) 587.0 1,685.4 91.0 net holdings of funds, beginning of year 15,724.5 17,447.5 3,271.7 3,305.8 1,221.7 634.7 (2,519.8) (2,610.8) net holdings of funds, end of year 17,691.8 15,724.5 3,187.1 3,271.7 1,099.1 1,221.7 (834.4) (2,519.8)
investments and liabilities related to investments at cost as at December 31investments Real estate holdings – – – – – – – – Equities and convertible securities 17,672.4 17,203.9 3,300.7 3,210.0 983.6 49.6 – – Bonds 1,171.0 694.8 – – – 0.4 – – Mortgages – – – – – – – – Mortgage securities – – – – – – – – Short-term investments 65.0 65.6 – – 26.7 53.5 – – Notes receivable from entities under common control – – – – – – – – Securities acquired under reverse repurchase agreements – – – – – – – – ABTNs – – – – – – 12,342.8 12,925.1 18,908.4 17,964.3 3,300.7 3,210.0 1,010.3 103.5 12,342.8 12,925.1 liabilities related to investments Securities sold under repurchase agreements – – – – – – – – Notes payable to entities under common control – – – – – – 9,556.9 9,652.6 Loans payable – – – – – – 1,412.0 1,766.6 Loans payable to entities under common control – – – – – – – – Mortgage loans payable – – – – – – – – Short selling of securities 23.9 51.4 – – 40.1 – – – Derivative financial instruments – – – – 26.9 59.4 – – 23.9 51.4 – – 67.0 59.4 10,968.9 11,419.2
SuPPleMenTarY inForMaTionSummary financial statements for the specialized portfolios (cont.)
CAISSE DE DÉPÔT ET PLACEMENT DU QUÉBEC AR 2012 172
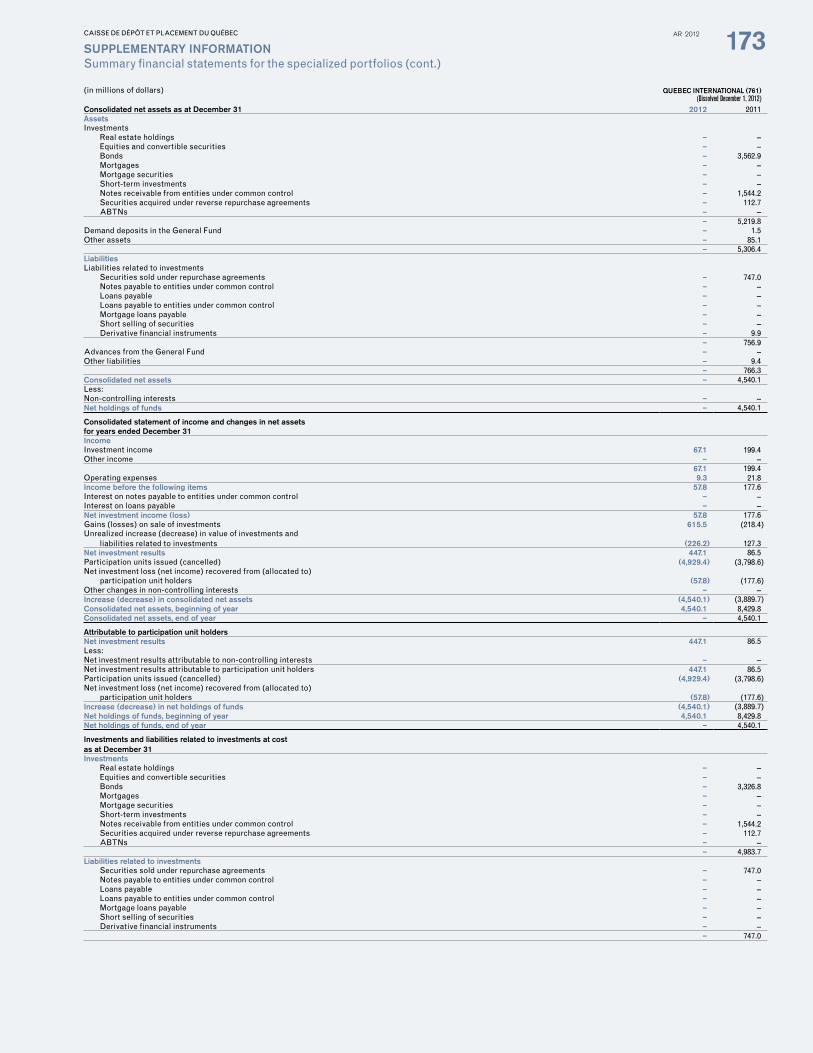
(in millions of dollars) Quebec inTernaTional (761) (Dissolved December 1, 2012)
consolidated net assets as at December 31 2012 2011 assetsInvestments Real estate holdings – – Equities and convertible securities – – Bonds – 3,562.9 Mortgages – – Mortgage securities – – Short-term investments – – Notes receivable from entities under common control – 1,544.2 Securities acquired under reverse repurchase agreements – 112.7 ABTNs – –
– 5,219.8 Demand deposits in the General Fund – 1.5 Other assets – 85.1 – 5,306.4 liabilitiesLiabilities related to investments Securities sold under repurchase agreements – 747.0 Notes payable to entities under common control – – Loans payable – – Loans payable to entities under common control – – Mortgage loans payable – – Short selling of securities – – Derivative financial instruments – 9.9
– 756.9 Advances from the General Fund – – Other liabilities – 9.4 – 766.3 consolidated net assets – 4,540.1 Less:Non-controlling interests – – net holdings of funds – 4,540.1
consolidated statement of income and changes in net assetsfor years ended December 31 incomeInvestment income 67.1 199.4 Other income – –
67.1 199.4 Operating expenses 9.3 21.8 income before the following items 57.8 177.6 Interest on notes payable to entities under common control – – Interest on loans payable – – net investment income (loss) 57.8 177.6 Gains (losses) on sale of investments 615.5 (218.4) Unrealized increase (decrease) in value of investments and liabilities related to investments (226.2) 127.3 net investment results 447.1 86.5 Participation units issued (cancelled) (4,929.4) (3,798.6) Net investment loss (net income) recovered from (allocated to) participation unit holders (57.8) (177.6) Other changes in non-controlling interests – – increase (decrease) in consolidated net assets (4,540.1) (3,889.7) consolidated net assets, beginning of year 4,540.1 8,429.8 consolidated net assets, end of year – 4,540.1
attributable to participation unit holdersnet investment results 447.1 86.5 Less:Net investment results attributable to non-controlling interests – – Net investment results attributable to participation unit holders 447.1 86.5 Participation units issued (cancelled) (4,929.4) (3,798.6) Net investment loss (net income) recovered from (allocated to) participation unit holders (57.8) (177.6) increase (decrease) in net holdings of funds (4,540.1) (3,889.7) net holdings of funds, beginning of year 4,540.1 8,429.8 net holdings of funds, end of year – 4,540.1
investments and liabilities related to investments at cost as at December 31investments Real estate holdings – – Equities and convertible securities – – Bonds – 3,326.8 Mortgages – – Mortgage securities – – Short-term investments – – Notes receivable from entities under common control – 1,544.2 Securities acquired under reverse repurchase agreements – 112.7 ABTNs – – – 4,983.7 liabilities related to investments Securities sold under repurchase agreements – 747.0 Notes payable to entities under common control – – Loans payable – – Loans payable to entities under common control – – Mortgage loans payable – – Short selling of securities – – Derivative financial instruments – – – 747.0
SuPPleMenTarY inForMaTionSummary financial statements for the specialized portfolios (cont.)
CAISSE DE DÉPÔT ET PLACEMENT DU QUÉBEC AR 2012 173

FINANCIALCERTIFICATEoFTHEPRESIDENT ANDCHIEFExECUTIvEoFFICER
I, Michael Sabia, President and Chief Executive Officer of the Caisse de dépôt et placement du Québec, certify that:
1. review: I have reviewed the Combined financial state-ments, the tables of returns, the press release announcing the annual results and the Annual Report (hereafter referred to as the “Annual Filings”) of the Caisse de dépôt et placement du Québec (the “Caisse”) for the year ended December 31, 2012.
2. no false or misleading information: To the best of my knowledge, having exercised reasonable diligence, the Annual Filings do not contain any untrue statement of a material fact or omit to state any material fact that is required to be stated or necessary to make a statement that is not misleading in light of the circumstances in which it was made, with respect to the period covered by the Annual Filings.
3. Fair presentation: To the best of my knowledge, having exercised reasonable diligence, the Combined financial statements and the other financial information included in the Annual Filings present fairly, in all material respects, the financial position of the Caisse as at the closing dates of the periods presented in the Annual Filings, as well as the results of its operations for those years.
4. responsibility: I am responsible for the establishment and maintenance of disclosure controls and procedures (DC&P) and internal control over financial reporting (ICFR) for the Caisse, in accordance with the responsibili-ties entrusted to me under section 5.12 of the Act respec-ting the Caisse.
5. Design: Subject to the limitations, if any, described in paragraphs 5.2 and 5.3, as at fiscal year-end, I have:
a) Designed, or caused to be designed under my supervi-sion, DC&P to provide reasonable assurance that:
i) Material information relating to the Caisse is made known to me by others, particularly during the period in which the Annual Filings are prepared.
ii) Information required to be disclosed by the Caisse in its Annual Filings filed or submitted by it under the legislation is recorded, processed, summarized and reported within the time periods prescribed by the legislation.
b) Designed, or caused to be designed under my super-vision, ICFR to provide reasonable assurance that financial information is reliable and that the Combined financial statements have been prepared, with a view to publication of financial information, in accordance with Canadian generally accepted accounting principles.
5.1. control framework: The control framework that I have used to design the ICFR is that proposed by the Committee of Sponsoring Organizations of the Treadway Commission (COSO).
5.2. icFr material weakness relating to design: Not applicable.
5.3. limitation of scope of design: Not applicable.
6. evaluation: I have:
a) Evaluated or caused to be evaluated under my super-vision, the effectiveness of the DC&P of the Caisse at fiscal year-end and the Caisse disclosed in its Annual Report my conclusions based on this evaluation.
b) Evaluated or caused to be evaluated under my super-vision, the effectiveness of the ICFR of the Caisse at fiscal year-end and the Caisse disclosed in its Annual Report the following information:
i) My conclusions about the effectiveness of the ICFR at fiscal year-end based on that evaluation.
ii) Description of any material weakness relating to current operation at fiscal year-end: Not applicable.
7. reporting changes in icFr: The Caisse disclosed in its Annual Report any change made to the ICFR that occurred during the accounting period beginning on January 1, 2012 and ending on December 31, 2012 that has had, or is likely to have, a material impact on the ICFR.
8. reporting to co-auditors and the board of Directors or audit committee: I have disclosed, based on our most recent valuation of the ICFR, to the co-auditors and the Board of Directors of the Caisse or its Audit Committee any fraud that involves management or other employees who have a significant role in the ICFR.
President and Chief Executive Officer
Michael SabiaApril 5, 2012
CAISSE DE DÉPÔT ET PLACEMENT DU QUÉBEC AR 2012 174

FINANCIALCERTIFICATEoFTHEExECUTIvE vICE-PRESIDENTANDCHIEFFINANCIALoFFICER
I, Maarika Paul, Executive Vice-President and Chief Financial Officer of the Caisse de dépôt et placement du Québec, certify that:
1. review: I have reviewed the Combined financial state-ments, the tables of returns, the press release announcing the annual results and the Annual Report (hereafter referred to as the (“Annual Filings”) of the Caisse de dépôt et placement du Québec (the “Caisse”) for the year ended December 31, 2012.
2. no false or misleading information: To the best of my knowledge, having exercised reasonable diligence, the Annual Filings do not contain any untrue statement of a material fact or omit to state any material fact that is required to be stated or necessary to make a statement that is not misleading in light of the circumstances in which it was made, with respect to the period covered by the Annual Filings.
3. Fair presentation: To the best of my knowledge, having exercised reasonable diligence, the Combined financial statements and the other financial information included in the Annual Filings present fairly, in all material respects, the financial position of the Caisse as at the closing dates of the periods presented in the Annual Filings, as well as the results of its operations for those years.
4. responsibility: I am responsible for the establishment and maintenance of disclosure controls and procedures (DC&P) and internal control over financial reporting (ICFR) for the Caisse, in accordance with the responsibili-ties entrusted to me under section 5.12 of the Act respec-ting the Caisse.
5. Design: Subject to the limitations, if any, described in paragraphs 5.2 and 5.3, as at fiscal year-end, I have:
a) Designed, or caused to be designed under my supervi-sion, DC&P to provide reasonable assurance that:
i) Material information relating to the Caisse is made known to me by others, particularly during the period in which the Annual Filings are prepared.
ii) Information required to be disclosed by the Caisse in its Annual Filings filed or submitted by it under the legislation is recorded, processed, summarized and reported within the time periods prescribed by the legislation.
b) Designed, or caused to be designed under my super-vision, ICFR to provide reasonable assurance that financial information is reliable and that the Combined financial statements have been prepared, with a view to publication of financial information, in accordance with Canadian generally accepted accounting principles.
5.1. control framework: The control framework that I have used to design the ICFR is that proposed by the Committee of Sponsoring Organizations of the Treadway Commission (COSO).
5.2. icFr material weakness relating to design: Not applicable.
5.3. limitation of scope of design: Not applicable.
6. evaluation: I have:
a) Evaluated or caused to be evaluated under my super-vision, the effectiveness of the DC&P of the Caisse at fiscal year-end and the Caisse disclosed in its Annual Report my conclusions based on this evaluation.
b) Evaluated or caused to be evaluated under my super-vision, the effectiveness of the ICFR of the Caisse at fiscal year-end and the Caisse disclosed in its Annual Report the following information:
i) My conclusions about the effectiveness of the ICFR at fiscal year-end based on that evaluation.
ii) Description of any material weakness relating to current operation at fiscal year-end: Not applicable.
7. reporting changes in icFr: The Caisse disclosed in its Annual Report any change made to the ICFR that occurred during the accounting period beginning on January 1, 2012 and ending on December 31, 2012 that has had, or is likely to have, a material impact on the ICFR.
8. reporting to co-auditors and the board of Directors or audit committee: I have disclosed, based on our most recent valuation of the ICFR, to the co-auditors and the Board of Directors of the Caisse or its Audit Committee any fraud that involves management or other employees who have a significant role in the ICFR.
Executive Vice-President and Chief Financial Officer
Maarika PaulApril 5, 2012
CAISSE DE DÉPÔT ET PLACEMENT DU QUÉBEC AR 2012 175

CoNCLUSIoNSABoUTTHEDESIGNANDEFFECTIVENESS OF INTERNAL CONTROL OVER FINANCIAL REPORTING
In 2012, the Chief Financial Officer oversaw work to update documentation and to evaluate the design and effectiveness of internal control over financial reporting, and the Execu-tive Committee approved the methodology for evaluating key controls. The purpose of this evaluation of internal control over the main financial processes was to ensure that the Caisse could meet its quality objectives related to financial reporting, in all material respects.
The evaluation of the design and effectiveness of internal control over financial reporting was carried out with the fra-mework usually adopted by North American companies, na-mely that of the Committee of Sponsoring Organizations of the Treadway Commission (COSO). This work enabled the Disclosure Committee to conclude that the design of control over financial reporting is adequate and effective, and that it provides reasonable assurance that the financial information presented in the Annual Filings, as defined in the Caisse’s Financial Certification Policy, is reliable, and that the Caisse’s combined financial statements were prepared in accordance with Canadian generally accepted accounting principles.
CoNCLUSIoNSABoUTTHEDESIGNANDEFFECTIVENESS OF FINANCIAL REPORTING CONTROLS AND PROCEDURES
Under the Caisse’s Financial Certification Policy, the design and effectiveness of disclosure controls and procedures pertaining to the Annual Filings, namely the combined finan-cial statements, the tables of returns, the press release an-nouncing the annual results and the Annual Report, must be evaluated.
As with the evaluation of internal control over financial repor-ting, the Chief Financial Officer also oversaw efforts to update documentation and to evaluate the design and effectiveness of disclosure controls and procedures, and the Executive Committee also approved the methodology for evaluating key controls.
As at December 31, 2012, the evaluation confirmed that the disclosure controls and procedures are adequate and ef-fective, and provide reasonable assurance that all relevant information is gathered and submitted in a timely fashion to senior management, in particular to the President and Chief Executive Officer and to the Chief Financial Officer, so as to ensure that appropriate decisions concerning disclosure can be made.
The Board of Directors also approved the 2012 Annual Filings before their public disclosure.
CAISSE DE DÉPÔT ET PLACEMENT DU QUÉBEC AR 2012 176

CAISSE DE DÉPÔT ET PLACEMENT DU QUÉBEC RA 2010 3
• The2012AnnualReportandthe2012AnnualReportAdditionalInformationareavailableonourwebsiteatwww.lacaisse.com.
• Information:514842-3261,[email protected]
• LeRapportannuel2012etledocumentRenseignementsadditionnelsaurapportannuel2012sontaccessiblesenlignesurnotresiteWeb:www.lacaisse.com.
• LegalDeposit–BibliothèqueetArchivesnationalesduQuébec,2012
• ISSN1705-6446
• ISSNonline1705-6454
1. TheCaisse’soperationscomplywiththerequirementsoftheActrespectingtheCaissededépôtetplacementduQuébec1andinvestmentindustrypractices.Itsfinancialstatementsareprepared inaccordancewithCanadiangenerallyacceptedaccountingprinciples.Eachyear,theCaisse’sco-auditors–theAuditorGeneralandErnst&YoungLLP–audititsfinancialstatements,aswellasthecomplianceofitsoperationswithlaws,regulations,policiesandguidelines,totheextenttheydeemappropriate.
2. The 2012AnnualReportAdditional Information is anintegralpartofthe2012AnnualReportandpresents,inthefirstsection,thetablesofreturnsasatDecember31,2012,forthecompositesoftheCaissedepositors’accounts.ThetablesandcalculationshavebeenauditedasatDecember31,2012,bySamsonBélair/Deloitte&Touches.e.n.c.r.l.forcompliancewiththeGlobalInvestmentPerformanceStandards(GIPS®).
3. InthisAnnualReport,depositors’netassetsaredefinedasdepositors’netholdings.Depositors’netassetsandnetinvestmentresultsarepresentedbeforetheconsolidationadjustmentinthecombinedfinancialstatementsoftheCaissededépôtetplacementduQuébec.
4. Thereturnsonthespecializedportfoliosrepresentthetime-weightedrateofreturn.
5. Thebenchmark indexes for the asset classes and theoverallportfolioarebasedon theweightedaverageofthebenchmarkindexesofthespecializedportfoliosthatcomprisethem.
6. Unlessotherwisestated,returns,whichareexpressedasapercentage,arepresentedbeforeoperatingexpensesandotherfees,butnetoftransactionfees,externalmanagementfeesofinvestmentfundsandexpensesoftherealestatesubsidiaries,andareannualizedforperiodsofmorethanoneyear.Theyincludethereturnoncashandcashequiva-lentsand they take intoaccountany foreignexchangehedging.Thereturnspreadsrelatedtooperatingexpensesofeachspecializedportfolioarepresentedinthetablesofreturnsinthe2012AnnualReportAdditionalInformation.
7. Unlessotherwisestated,netinvestmentresultsandnetassetsarepresentednetofoperatingexpensesandotherfees.
8. Somereturnsareexpressedinbasispoints(b.p.).Onehundredbasispointsequal1.00%andonebasispointequals0.01%.
9. Unlessotherwisestated,allfiguresareinCanadiandollars.ThelettersMandBusedwithdollaramountsdesignatemillionsandbillions,respectively.
10.Totals (figures or percentages)may vary because ofroundingoffigures.
11.Unlessotherwisestated,alldatainthetablesandfiguresarefromstudiesmadebytheCaisse.
12.Thetableslistingthetop10investmentspresent,inalpha-beticalorder,themaincashpositionsbasedoninformationinTables8,9,10and11ofthe2012AnnualReportAdditionalInformation.
13.TodeterminewhetheranassetisclassifiedasaQuébecinvestment,theCaisseusesthelocationoftheheadofficeofthecompanyoroftheissueror,inthecaseofrealestate,thelocationoftheproperty.
Thisclassificationiswidelyusedinthefundmanagementindustrybutinvolvesbiases.SomecompaniesareincludedeventhoughtheircoreoperationsareoutsideQuébec.Similarly,companieswithextensiveoperationsinQuébecareexcludediftheirheadofficeisoutsidetheprovince.
General Notes
1. TheActrespectingtheCaissededépôtetplacementduQuébecisavailableonourwebsite.
50 %

Business office
Centre CDP Capital 1000, place Jean-Paul-Riopelle Montréal (Québec) H2Z 2B3 Tel: 514 842-3261 Fax: 514 842-4833
head office
Édifice Price 65, rue Sainte-Anne, 14e étage Québec (Québec) G1R 3X5 Tel: 418 684-2334 Fax: 418 684-2335
cdP caPiTaL us
1540 Broadway, Suite 1600 New York, NY 10036 United States Tel: 212 596-6300 Fax: 212 730-2356
www.lacaisse.com
Hearing impaired514 847-2190