Embed Size (px)
Citation preview
IEEE TRANSACTIONS ON GEOSCIENCE AND REMOTE SENSING, VOL. 48, NO. 3, MARCH 2010 1487
Building Height Retrieval From VHR SAR ImageryBased on an Iterative Simulation and
Matching TechniqueDominik Brunner, Student Member, IEEE, Guido Lemoine, Senior Member, IEEE,
Lorenzo Bruzzone, Senior Member, IEEE, and Harm Greidanus
Abstract—Experimental airborne synthetic aperture radar(SAR) systems achieve spatial resolutions of approximately 10 cm,whereas the new spaceborne very high spatial resolution (VHR)SAR sensors onboard the TerraSAR-X and COSMO-SkyMedsatellites achieve spatial resolutions down to 1 m. In VHR SARdata, features from individual urban structures (i.e., buildings) canbe identified by their characteristic settings in urban settlementpatterns. In this paper, we present a novel concept for the heightestimation of generic man-made structures from single detectedSAR data. The proposed approach is based on the definition of ahypothesis on the height of the building and on the simulation ofa SAR image for testing that hypothesis. A matching procedureis applied between the estimated and the actual SAR image inorder to test the height hypothesis. The process is iterated fordifferent height assumptions until the matching function is opti-mized, and thus, the building height is estimated. The efficiencyof the proposed method is demonstrated on a set of 40 flat- andgable-roof buildings using two submeter VHR airborne and two1-m resolution TerraSAR-X SAR scenes all acquired from thesame residential area in Dorsten, Germany. The results show that,in the absence of string disturbing effects, the method is ableto estimate the height of flat- and gable-roof buildings in thesubmeter data to the order of a meter, while the accuracy forthe meter resolution spaceborne data is lower but still sufficientto estimate the number of floors of a building.
Index Terms—Building detection, damage assessment, heightextraction, remote sensing, synthetic aperture radar (SAR), urbanareas, very high geometrical resolution images, very high spatialresolution (VHR) SAR, 3-D reconstruction.
I. INTRODUCTION
RAPID situation assessment after natural disasters (e.g.,earthquakes and tsunamis) and violent conflict events
(e.g., war-related destruction) is crucial for initiating effec-tive emergency response actions. Remote sensing satellitesequipped with optical and synthetic aperture radar (SAR) imag-ing sensors can provide important information due to their abil-
Manuscript received December 22, 2008; revised May 28, 2009. Firstpublished November 17, 2009; current version published February 24, 2010.
D. Brunner is with the European Commission Joint Research Centre, 21027Ispra, Italy, and also with the Department of Information Engineering andComputer Science, University of Trento, 38123 Trento, Italy (e-mail: [email protected]).
G. Lemoine and H. Greidanus are with the European Commission JointResearch Centre, 21027 Ispra, Italy (e-mail: [email protected];[email protected]).
L. Bruzzone is with the Department of Information Engineering andComputer Science, University of Trento, 38123 Trento, Italy (e-mail: [email protected]).
Digital Object Identifier 10.1109/TGRS.2009.2031910
ity to map affected areas of interest quickly and in a censorship-free manner.
Current spaceborne optical sensors, such as Ikonos, Quick-bird, and WorldView, have meter and submeter spatial resolu-tions. These sensors fall into the passive optical system categoryand depend on sun illumination and cloud-free weather condi-tions to acquire useful imagery. In contrast, active SAR sensorscan acquire imagery independently of illumination conditionsand with a relative insensitivity to weather conditions. Untilrecently, spaceborne commercial SAR sensors were only ca-pable of imaging the Earth surface with a spatial resolution nobetter than 9 m. This changed after the new very high spatialresolution (VHR) SAR sensors onboard the TerraSAR-X [1]and COSMO-SkyMed [2] satellites were launched in 2007,providing SAR imagery with spatial resolutions down to 1 m. Insuch imagery, features from individual urban structures, such asbuildings, can be identified in their characteristic settings in ur-ban settlement patterns (e.g., residential areas, city centers, andindustrial parks). Current experimental airborne SAR systemseven reach spatial resolutions of about 0.1 m [3].
Urban building detection provides an indirect measure forpopulation density, which is an essential parameter in impactassessment that drives emergency response actions. Both thespatial extent of urbanized areas and the spatial characterizationof building volume are crucial parameters to estimate affectedpopulation, estimate infrastructural damage, and enumerateeconomic losses resulting from the emergency event. Buildingvolume is the product of spatial extent of a built-up structureand its height. Furthermore, the height of a building is astructural indicator about the status of a building after theevent, e.g., whether it is still structurally intact. Hence, heightdetermination of buildings is a key issue in postemergencyevent information retrieval in urban areas. Successful heightcharacterization of buildings in VHR SAR data, therefore, willadd substantial value to operational remote sensing applicationsin emergency response.
Several building height retrieval techniques have alreadybeen proposed for VHR SAR imagery in the literature. Semi-automatic methods for the height estimation in detected VHRSAR imagery by means of shadow or layover analysis areproposed in [4]–[6], while methods in [7]–[9] make use ofinterferometric SAR (InSAR). The use of stereoscopic SAR(radargrammetry) is proposed in [10] and [11]. Recently, meth-ods based on multiaspect SAR data, in which the same area
0196-2892/$26.00 © 2009 IEEE
Authorized licensed use limited to: UNIVERSITA TRENTO. Downloaded on April 28,2010 at 07:24:39 UTC from IEEE Xplore. Restrictions apply.
1488 IEEE TRANSACTIONS ON GEOSCIENCE AND REMOTE SENSING, VOL. 48, NO. 3, MARCH 2010
is imaged from different flight paths, have been proposed in[12] and [13]. A method based on multiaspect InSAR data ispresented in [14]. In [15], the use of multiaspect polarimetricInSAR data is investigated. First results with circular SAR areshown in [16]. The presented methods have in common that theachieved accuracy improves with the use of multidimensionaldata. However, the performance of a proposed methodology istypically presented for a small set of test data, usually compris-ing only single or few buildings, leaving a general applicabilityof the method in doubt.
The height extraction by radiometric analysis of the typi-cal double-bounce reflection of a building (see Section II fordetails) using an electromagnetic scattering model [17] basedon the geometrical optics (GO) and the Kirchhoff physicaloptics (PO) approximations [18, pp. 922–1033] for a simplifiedrectangular flat-roofed building is demonstrated in [19]. Thismethod has the potential to extract the height of the buildingaccurately from a single image but needs extensive a prioriknowledge of the material and surface roughness properties(i.e., dielectric constant, rms height, and correlation length) ofthe building and its surrounding, which may not always beavailable.
SAR simulators [20]–[22] are suitable not only for the analy-sis of scattering phenomena but also as part of informationextraction methodologies for actual SAR imagery. In [23], forinstance, the polarimetric GrecoSAR simulator is deployed todetect vessel scattering hotspots, which are then used to classifyships in actual SAR imagery. As an extension, GrecoSAR wastested in [24] for the simulation of urban structures. In thecase of building reconstruction from multiaspect InSAR data,Soergel et al. [25] propose an iterative procedure based onthe predictions of height maps compared to the actual digitalelevation model (DEM).
In this paper, which generalizes and extends the work pre-sented in [26] and [27], we propose a novel automatic 3-Dreconstruction concept for the extraction of the height of man-made structures from single detected SAR (power) imageryunder the following assumptions: 1) A map with the location ofthe building is available and 2) the width, length, and roof typeof the investigated building are known. The approach is basedon a “hypothesis generation–rendering–matching” procedure.A series of hypotheses is generated and rendered by a SARimaging simulator, taking into account the acquisition parame-ters of the actual VHR SAR data. The simulations are comparedto the actual VHR SAR data; the estimated height correspondsto the hypothesis for which the simulated image best matcheswith the actual scene. The novelty of the presented conceptconsists in the use of single detected VHR SAR images insteadof multidimensional data (e.g., interferometric, polarimetric,and multiaspect). It is worth noting that the use of a singledetected VHR SAR image for height estimation can supporta wide range of current applications, including the use of newspaceborne SAR sensors such as TerraSAR-X and COSMO-SkyMed. Furthermore, the potential use of single detected SARdata can provide significant economic efficiencies in emergencyresponse (e.g., speed and cost).
The proposed height estimation process is applicable todifferent building shapes under the full range of aspect angles,
i.e., the angle between the front wall of the object and the SARsensor azimuth direction. One of the key characteristics of theproposed procedure is the simultaneous consideration of themajor scattering characteristics of the man-made structure inSAR (i.e., layover and shadow areas and multibounce contri-butions) for estimating the height. We demonstrate the perfor-mance and the properties of our approach by analyzing a setof 40 flat- and gable-roof buildings in submeter VHR airborneSAR images and in 1-m resolution TerraSAR-X images for anurban area in Dorsten, Germany.
The remainder of this paper is structured as follows. InSection II, we review the fundamentals of microwave backscat-tering of an idealized building. In Section III, we describethe proposed approach in detail. We introduce the test data inSection IV. Section V discusses the results of the method beforewe finish with some conclusions and an outline of future workin Section VI.
II. PROPERTIES OF IDEALIZED BUILDINGS IN SAR IMAGES
In SAR imagery, typical urban structures are affected bylayover, double-bounce, and shadowing effects, which relateto the ranging geometry of radar sensors. To highlight theseeffects, Fig. 1 shows examples of the backscattering rangeprofiles of a simple flat-roof building model, which is a rec-tangular box with uniformed surfaces and flat surroundings,with common width w and different heights h viewed by aSAR sensor with incidence angle θ: a shows the return from theground, b highlights the double bounce caused by the dihedralcorner reflector that arises from the intersection of the buildingvertical wall and the surrounding ground, c indicates singlebackscattering from the front wall, d depicts the returns fromthe building roof, and e represents the shadow area from whichthere is no return from the building or the ground. The symbolsl [l = h · cot(θ)] and s [s = h · tan(θ)] denote the lengthsof the areas affected by layover and shadow in the ground-projected image space, respectively. For the backscattering offlat-roof buildings, three different situations can be observedaccording to the boundary condition h < w · tan(θ) [4], [25].If this condition is fulfilled [Fig. 1(a)], part of the roof scatteringd is superimposed on the scattering from the ground a and thefront wall c in the region a + c + d, while there is a region dwhich is only characterized by returns from the roof. In thecase of h = w · tan(θ) [Fig. 1(b)], all of the roof contributiond is sensed before the double-bounce area in such a way thatthere is a homogeneous layover area a + c + d, which hascontributions from the ground, the building front wall, and theroof. If h > w · tan(θ) [Fig. 1(c)], all roof contributions aresensed before the double-bounce area again, with the differencethat the layover area is split in an area a + c + d, which hascontributions from the ground, the front wall, and the roof, andan area a + c, which only has backscatter from the ground andthe front wall of the building.
The scattering effects of a gable-roof building are differentfrom what is observed for a flat-roof building [4], [28]. Fig. 2shows three examples of backscattering profiles from a gable-roof building with roof inclination angle α for different inci-dence angles. The major difference with respect to flat-roof
Authorized licensed use limited to: UNIVERSITA TRENTO. Downloaded on April 28,2010 at 07:24:39 UTC from IEEE Xplore. Restrictions apply.

BRUNNER et al.: BUILDING HEIGHT RETRIEVAL FROM VHR SAR IMAGERY 1489
Fig. 1. Scattering from a simple flat-roof building model with width wand different heights h: Ground scattering a, double bounce b, scatteringfrom vertical wall c, backscattering from roof d, shadow area e, length oflayover area in ground-projected image space l, and length of shadow area inground-projected image space s. The gray values in the backscattering profilescorrespond to the relative amplitudes. (a) h < w · tan(θ). (b) h = w · tan(θ).(c) h > w · tan(θ).
Fig. 2. Examples of backscattering profiles from a gable-roof building withroof inclination angle α at various incidence angles. The legend is similar to theone for flat-roof buildings in Fig. 1. d1 denotes the scattering from the side ofthe roof which is oriented toward the sensor, while d2 represents the scatteringfrom the part of the roof which faces away from the sensor. The gray valuesin the backscattering profiles correspond to the relative amplitudes. (a) θ < α.(b) θ = α. (c) θ > α.
buildings is the presence of a second bright scattering feature,which is closer to the sensor than the double bounce, resultingfrom direct backscattering d1 from the part of the roof whichis oriented toward the sensor. For incidence angles which arenot equal to the inclination angle of the roof [Fig. 2(a) and (c)],
Authorized licensed use limited to: UNIVERSITA TRENTO. Downloaded on April 28,2010 at 07:24:39 UTC from IEEE Xplore. Restrictions apply.

1490 IEEE TRANSACTIONS ON GEOSCIENCE AND REMOTE SENSING, VOL. 48, NO. 3, MARCH 2010
Fig. 3. Definition of width w, length l, and aspect angle φ of a building. Thebuildings in gray are oriented parallel to the azimuth direction with φ = 0◦,while the buildings with the solid black lines were rotated counterclockwise byφ with respect to the azimuth direction.
this feature is extended to an area, while in the case of θ = α[Fig. 2(b)], these contributions return to the sensor at the sameinstance of time and are therefore integrated into a bright linethat is similar to the double bounce of a building. In the case thatθ > α, there is no backscattering d2 from the part of the roofwhich faces away from the sensor, since this part is occludedby the front side of the building.
The viewing configuration of a sensor with respect to thebuilding is defined not only by the incidence angle of the sensorbut also by the orientation of the building with reference tothe azimuth direction, known as aspect angle. In Fig. 3, whichalso highlights the definition of the dimensions of a building,we describe this orientation in terms of the planar dimensions(width and length) of the building and the aspect angle φ.Assuming a building having the wall oriented toward the sensorthat is parallel to the azimuth direction (φ = 0◦), the lengthl of a building is given by the dimension of the building inthe azimuth direction, while its width w is the correspondingdimension in the range direction. The angle φ (0◦ ≤ φ < 90◦)is defined as the angle between the wall with length l and theazimuth direction, considering a counterclockwise rotation ofthe building. Hence, the planar geometry of a building is givenwith respect to the azimuth direction of the sensor by the triplet(w, l, φ). For spaceborne acquisitions, the possible aspect an-gles of a building are fixed by descending and ascending passes,while for airborne measurements, the aspect angle is definedby the flight track of the airplane and the squint angle of theantenna. Hence, airborne acquisitions permit more flexibilityfor varying φ than spaceborne measurements, which can be anadvantage for missions where buildings need to be investigatedfrom a predefined viewing configuration.
As shown in Figs. 1 and 2, the double-bounce effect isa significant characteristic of buildings in VHR SAR signals[17]. It indicates the presence of a building and appears incorrespondence with its front wall, so that it can be used asa feature for the automatic detection and reconstruction ofbuildings from SAR data [19]. However, the strength of thedouble-bounce effect depends on both the height of the building(i.e., the higher the building, the stronger the double bounce)and the aspect angle. Theoretical models for the double bounceof a building show a quadratic dependence of its radar crosssection on the building height [17], [29]. An empirical studyon the relationship between the strength of the double bounceand the aspect angle is presented in [30], highlighting that thedouble-bounce contribution drops off significantly if the aspectangle is increased in the lower aspect angle range (up to 10◦),while it decays moderately for higher angles.
Fig. 4. Simulations (without speckle) of a flat-roof building model [corre-sponding to Fig. 1(a)] with dimensions w = 50 m, l = 100 m, and h = 30 mwith θ = 50◦ and 1.0-m azimuth and slant-range resolutions. The images inthe left column show the simulations with viewing direction from the bottom,while the images in the right column show the corresponding 3-D models asthey would appear visually. (a) φ = 0◦. (b) φ = 22.5◦. (c) φ = 45◦.
The aspect angle mainly influences the appearance of the lay-over and shadow areas. In Fig. 4, we present the results of sim-ulations (for more details on the simulator, see Section III-B)of a flat-roof building model with dimensions w = 50 m, l =100 m, and h = 30 m at (a) φ = 0◦, (b) φ = 22.5◦, and (c)φ = 45◦, which reflects the situation shown in the right partof Fig. 3. The simulations were performed with θ = 50◦ and1.0-m azimuth resolution δa and slant-range resolution δr cor-responding to a configuration supported by current spacebornesensors like TerraSAR-X or COSMO-SkyMed. The images onthe left side show the simulation results with viewing directionfrom the bottom, while the images in the right column displaythe corresponding 3-D views of the building, as it would appearvisually. Since we want to highlight the major scattering effectsof buildings in SAR, we suppressed the calculation of speckle.In the situation of φ=0◦, the shadow and layover areas have arectangular shape, which changes with increasing aspect angleto L-shape. The area at which there is only backscattering fromthe roof also has a rectangular shape at φ=0◦, but it changesfor φ>0◦ to a parallelogram. Note that, in these simulations, therelative strength of the double bounce may be overestimated forthe cases of larger aspect angles (φ=22.5◦ and φ=45.0◦) [30].
Authorized licensed use limited to: UNIVERSITA TRENTO. Downloaded on April 28,2010 at 07:24:39 UTC from IEEE Xplore. Restrictions apply.
BRUNNER et al.: BUILDING HEIGHT RETRIEVAL FROM VHR SAR IMAGERY 1491
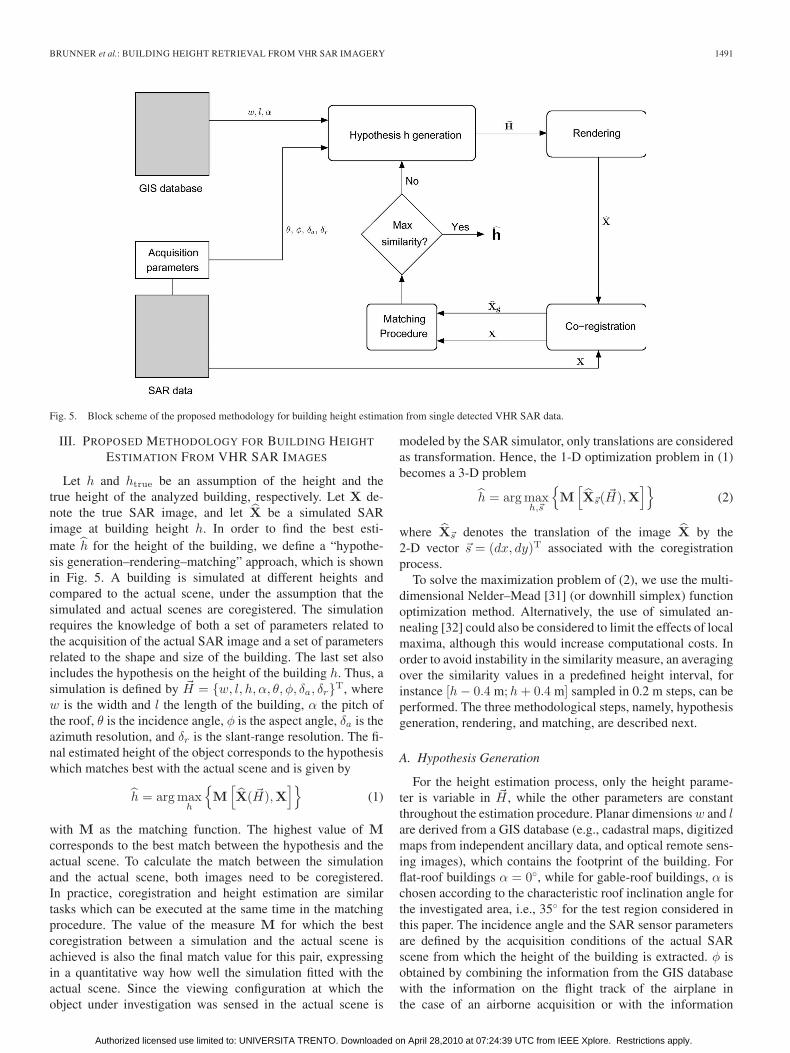
Fig. 5. Block scheme of the proposed methodology for building height estimation from single detected VHR SAR data.
III. PROPOSED METHODOLOGY FOR BUILDING HEIGHT
ESTIMATION FROM VHR SAR IMAGES
Let h and htrue be an assumption of the height and thetrue height of the analyzed building, respectively. Let X de-note the true SAR image, and let X be a simulated SARimage at building height h. In order to find the best esti-mate h for the height of the building, we define a “hypothe-sis generation–rendering–matching” approach, which is shownin Fig. 5. A building is simulated at different heights andcompared to the actual scene, under the assumption that thesimulated and actual scenes are coregistered. The simulationrequires the knowledge of both a set of parameters related tothe acquisition of the actual SAR image and a set of parametersrelated to the shape and size of the building. The last set alsoincludes the hypothesis on the height of the building h. Thus, asimulation is defined by �H = {w, l, h, α, θ, φ, δa, δr}T, wherew is the width and l the length of the building, α the pitch ofthe roof, θ is the incidence angle, φ is the aspect angle, δa is theazimuth resolution, and δr is the slant-range resolution. The fi-nal estimated height of the object corresponds to the hypothesiswhich matches best with the actual scene and is given by
h = arg maxh
{M
[X( �H),X
]}(1)
with M as the matching function. The highest value of Mcorresponds to the best match between the hypothesis and theactual scene. To calculate the match between the simulationand the actual scene, both images need to be coregistered.In practice, coregistration and height estimation are similartasks which can be executed at the same time in the matchingprocedure. The value of the measure M for which the bestcoregistration between a simulation and the actual scene isachieved is also the final match value for this pair, expressingin a quantitative way how well the simulation fitted with theactual scene. Since the viewing configuration at which theobject under investigation was sensed in the actual scene is
modeled by the SAR simulator, only translations are consideredas transformation. Hence, the 1-D optimization problem in (1)becomes a 3-D problem
h = arg maxh,�s
{M
[X�s( �H),X
]}(2)
where X�s denotes the translation of the image X by the2-D vector �s = (dx, dy)T associated with the coregistrationprocess.
To solve the maximization problem of (2), we use the multi-dimensional Nelder–Mead [31] (or downhill simplex) functionoptimization method. Alternatively, the use of simulated an-nealing [32] could also be considered to limit the effects of localmaxima, although this would increase computational costs. Inorder to avoid instability in the similarity measure, an averagingover the similarity values in a predefined height interval, forinstance [h − 0.4 m;h + 0.4 m] sampled in 0.2 m steps, can beperformed. The three methodological steps, namely, hypothesisgeneration, rendering, and matching, are described next.
A. Hypothesis Generation
For the height estimation process, only the height parame-ter is variable in �H , while the other parameters are constantthroughout the estimation procedure. Planar dimensions w and lare derived from a GIS database (e.g., cadastral maps, digitizedmaps from independent ancillary data, and optical remote sens-ing images), which contains the footprint of the building. Forflat-roof buildings α = 0◦, while for gable-roof buildings, α ischosen according to the characteristic roof inclination angle forthe investigated area, i.e., 35◦ for the test region considered inthis paper. The incidence angle and the SAR sensor parametersare defined by the acquisition conditions of the actual SARscene from which the height of the building is extracted. φ isobtained by combining the information from the GIS databasewith the information on the flight track of the airplane inthe case of an airborne acquisition or with the information
Authorized licensed use limited to: UNIVERSITA TRENTO. Downloaded on April 28,2010 at 07:24:39 UTC from IEEE Xplore. Restrictions apply.

1492 IEEE TRANSACTIONS ON GEOSCIENCE AND REMOTE SENSING, VOL. 48, NO. 3, MARCH 2010
about the orbit of the satellite in the case that the actualscene was acquired by a spaceborne sensor. A number ofhypotheses are generated for the same building during the max-imization of (2). This can be achieved implicitly by the functionoptimization method which jointly maximizes for h and �s. Fora better performance, an explicit hypothesis generation can beperformed by iterating h in a predefined range of expectedbuilding heights with a given step size. Thus, the functionoptimizer has only the task to coregister a rendered hypothesiswith the actual scene by varying �s.
B. Rendering
For evaluating which hypothesis matches best with the actualscene, a SAR simulator is employed, which renders the hypoth-esis into the geometry of a SAR image. First, a 3-D model isgenerated from the information in �H , taking into account thebuilding parameters w, l, h, and α. Second, the 3-D model istriangulated so that, in the third step, its backscattering can besimulated considering the parameters θ, φ, δa, and δr specifiedin �H .
Our application scenario aims at extracting building infor-mation from SAR scenes over areas where surface roughnessparameters and the dielectric properties of the materials in thescene are generally unknown a priori. Thus, electromagneticmodels such as GO, PO, integral equation method [33], or thefinite-difference time-domain method [34] cannot be adoptedto calculate the backscattering. Hence, an adjustable mixturemodel of Lambertian and specular reflection is used to calculatethe backscattering from the surface and building model. Ratherthan calculating the absolute radiometric effects related tomaterial properties and surface roughness parameters, this sim-plified scattering model approximates the relative differences inbackscatter while retaining the dominant geometrical effects ofsurface and dihedral scattering. Note that any simulator, whichcan calculate the effects related to the SAR geometry, can beemployed, irrespective of its exact radiometric model.
Our SAR simulator uses ray tracing in order to determinewhich surfaces of a generic object are visible. It can handleany complex object composed of spheres, planes, and trianglesor any arbitrary combination of these objects. The simulatoroptionally includes multiple bounce scattering and can there-fore distinguish between single- and dual-bounce reflections.Speckling effects are neglected in our approach.
The output of the simulator is a 2-D rectangular image,whose dimension is determined such that it includes the scatter-ing effects of the simulated object (i.e., single-bounce contribu-tions, shadow, layover, and double bounce) plus a border area,which contains backscattering from the ground. Note that theratio r between the number of pixels belonging to the scatteringeffects from the object (foreground pixels) and the number ofpixels belonging to the ground scattering of the surrounding(background pixels) varies for different buildings or for thesame building measured with different viewing configurations.This can be observed, for instance, in Fig. 4 for three simula-tions of the same building, which differ only in φ: r of Fig. 4(a)is larger than r of Fig. 4(b), which is larger than r of Fig. 4(c).We will highlight the consequence of this effect and propose asolution to compensate for it in the next section.
C. Matching
In order to estimate the height of a building according to (2),we need to optimize the match between the simulated imageand the actual scene with respect to h and �s. Image matchingand registration are two operations which are closely linkedto each other. A slave image, which must be coregistered toa master image, is translated so that the match between thesetwo images reaches a maximum similarity based on a chosensimilarity measure. Hence, the matching between two imagesis an integral part of a coregistration method, so that we canjointly optimize for h and �s.
For image matching, two types of methods exist: area- andfeature-based methods [35]. Area-based methods calculate di-rectly the correlation between all (or a subset of) samples inthe two corresponding images. For instance, Barat et al. [36]propose a method for pattern matching based on a profilingapproach using morphological transforms. Feature-based meth-ods, instead, first extract structural information such as linesand edges from the images to be compared and then, in thesecond step, match them in the feature space. Depending on theunderlying data, various features are in use, such as tie points[37], gradients computed from gray-scale intensity images[38], fractal features based on fractal theory [39], and higherlevel features such as the shape of objects derived from theiredge information [40]. The use of the scale-invariant featuretransform method, which extracts features that are invariant toimage scale and rotation and are robust with respect to affinedistortions, change in 3-D viewpoint, addition of noise, andchange in illumination, is proposed in [41]. This method showsgood performance for optical images, while it has a decreasedaccuracy for SAR images, depending on the content of the SARscene [42].
Our matching task is faced with two challenges: 1) com-paring the actual SAR data with speckle to synthetic imageswithout speckle, i.e., the geometries of the images are similar,but the local statistics in the comparison are different, and2) the radiometry of the simulated image does not match withthat of the actual scene.
We proposed a feature-based method in [43], which is basedon the extraction of shadow areas and edges. As match criterion,we used the normalized cross-correlation coefficient [44]. Thedrawback of feature-based methods is the dependence of theeffectiveness and stability of the feature extraction procedureson parameter settings, which is particularly critical for SARimages. Therefore, we propose in this paper an area-basedmethod based on mutual information (MI) for M in (2). MIis a measure derived from information theory, which is suitablefor multimodality image matching/registration tasks, which wasindependently proposed in [45] and [46] for the registration ofmultimodality medical images and studied by Xie et al. [47] forits application in the SAR domain. The MI MI(X,X) betweenX and X is given by
MI(X,X) = H(X) + H(X) − H(X,X) (3)
where H(X) and H(X) are the entropies of X and X, respec-tively, and H(X,X) is their joint entropy. By using x and x to
Authorized licensed use limited to: UNIVERSITA TRENTO. Downloaded on April 28,2010 at 07:24:39 UTC from IEEE Xplore. Restrictions apply.

BRUNNER et al.: BUILDING HEIGHT RETRIEVAL FROM VHR SAR IMAGERY 1493
denote the pixel values in the measured and simulated images,respectively, the entropies can be computed by
H(X) = −∑
x
pX
(x) log pX
(x) (4)
H(X) = −∑
x
pX(x) log pX(x) (5)
H(X,X) = −∑x,x
pX,X
(x, x) log pX,X
(x, x) (6)
where pX
(x) and pX(x) are the marginal probability massfunctions and p
X,X(x, x) is the joint probability mass function.
They can be calculated by
pX,X
(x, x) =hist(x, x)
/ ∑x,x
hist(x, x) (7)
pX
(x) =∑
x
pX,X
(x, x) (8)
pX(x) =∑
x
pX,X
(x, x) (9)
where hist denotes the joint histogram of the two images. Thereason for the independence of this similarity measure to theabsolute intensity values of the two images is that the MI isonly sensitive to the occurrence of the same pairs of intensityvalues in X and X.
Depending on the speckle filtering of the SAR images, thenumber of bins for the joint histogram is a noncritical param-eter. It should be chosen so that the joint histogram has, onaverage, at least one entry per bin [47]. Since the loweringof the number of bins has a comparable effect to a low-passfilter, the number of bins should decrease the more the data areaffected by speckle. The simulations are without speckle, sothat we choose 256 bins for X. Since we apply a speckle filterin the preprocessing step to the actual SAR data (Section IV),we only decrease the number of bins for X to 128. A test with64 bins did not yield an increased matching accuracy.
For the coregistration of Xs and X, we allow subpixelaccuracy, which means that we allow shifts in the x- andy-directions, which do not match the grid spacing of the image.Therefore, it is necessary to interpolate the values for the pixelsthat do not coincide with a grid point of the original raster.With respect to the coregistration of two images with MI, thepartial volume (PV) interpolation method was proposed in [48],where, instead of interpolating new intensity values, the jointhistogram is updated directly. A series of empirical tests showedthat PV outperforms in accuracy other methods such as bilinearinterpolation.
In Section III-B, we highlighted that the ratio r betweenforeground and background pixels is not constant for differentbuildings and viewing configurations. In the case of a buildingwith φ = 0◦ [Fig. 4(a)], r has a relative high value, whichmeans that the matching (and, hence, the height estimation)is dominated by the scattering of the object itself. Instead, for
Fig. 6. Object masks of the corresponding simulations in Fig. 4. (a) φ = 0◦.(b) φ = 22.5◦. (c) φ = 45◦.
Fig. 7. Minimum distance Δmin required between two buildings in order thattheir scattering effects do not interfere.
φ = 45◦ [Fig. 4(c)], the value of r is relatively low, implyingthat the estimation procedure is influenced more significantlyby the background than by the foreground pixels. Since anoptimal height estimation accuracy is only achieved for acertain tradeoff between fore- and background pixels, we haveto ensure that the matching procedure always uses the same r.To fix r, we defined a binary object mask, where all foregroundpixels have the value one and all background pixels have thevalue zero. This object mask is generated by the simulatoras a secondary result of the simulation run. Fig. 6 shows thecorresponding object masks for the simulations of Fig. 4. Byexpanding the object masks using the morphological dilationoperator [49] and by only considering, for the calculation of theMI value, those pixels which have the value one in the expandedobject mask, r can be fixed for the matching procedure fordifferent buildings and viewing configurations. As a structuringelement for the dilation operator, we use a disk whose size isdetermined separately for each simulation to fulfill the desiredr value. A series of tests showed that the best accuracy forthe height estimation is achieved for r = 1, which means thatthe number of foreground pixels is equal to the number of thebackground pixels.
D. Constraint for Obtaining Reliable Estimations
The proposed method estimates the height of an individualbuilding by simulating the expected SAR signature of a sim-plified building model and evaluating the match with the actualscene. However, the simulation process does not consider theeffects of other man-made or natural structures in the surround-ing of a building under investigation, which might have an im-pact on its actual backscattering. The minimum distance Δmin
Authorized licensed use limited to: UNIVERSITA TRENTO. Downloaded on April 28,2010 at 07:24:39 UTC from IEEE Xplore. Restrictions apply.

1494 IEEE TRANSACTIONS ON GEOSCIENCE AND REMOTE SENSING, VOL. 48, NO. 3, MARCH 2010
Fig. 8. Overview of data set from Dorsten. Note that, for the spaceborne data, the azimuth dimension of the images is smaller than the range dimension, whilefor the airborne data, the azimuth dimension is larger compared to the range dimension.
required between two buildings in order that their scatteringeffects do not interfere with each other is given by [25]
Δmin = h1 · tan(θ) + h2 · cot(θ) (10)
where h1 is the height of the building at the sensor close sideand h2 denotes the height of the building, which is behindthe first building (see Fig. 7). Hence, optimal accuracy for theheight estimation process for a building can only be achievedif the condition
Δact > Δmin (11)
is fulfilled, where Δact denotes the actual distance between thebuildings.
IV. DATA SET DESCRIPTION
The test area chosen was a subset of the city of Dorsten(51◦40′18′′ N, 6◦59′34′′ E), Germany, for which we consideredboth dual-aspect airborne and a pair of ascending and descend-ing spaceborne VHR SAR data. Ancillary data, which wereused to retrieve the building footprint parameters for initializingthe simulator, were provided by an orthophoto acquired onJune 9, 2006 with a 30-cm resolution. Furthermore, ground datawere manually collected in combination with a Lidar digitalsurface model (DSM) with approximately 10-cm vertical reso-lution. An overview of the composed data set is shown in Fig. 8.
We consider two types of building structures for which weestimate the heights: flat- and gable-roof buildings. All build-ings are assumed to be individual buildings with rectangularfootprints. To evaluate the performance of the method under avariety of conditions, we choose 40 individual industrial andapartment buildings with different shapes at various aspectand incidence angles, which we categorized in three groups.Category A contains flat-roof buildings, and category B con-tains gable-roof buildings. Category C contains the buildingswhich do not fit the structural assumptions of our buildingmodels completely. This category includes buildings which
have a nonrectangular footprint (such as buildings with a towerattached to it) or buildings which have nonuniform heights.The majority of the selected buildings are gable-roof buildings,which is the prevailing type of structure for residential housesin this area. Only few flat-roof buildings could be identified,some of which are apartment buildings (flats) and some are in-dustrial or commercial structures (e.g., factories and stores). Sixbuildings belong to category A, 27 buildings belong to B, andseven buildings were classified as C. To distinguish betweenthe different buildings in the various categories, we use thenaming scheme 〈Category〉-〈Number of building in category〉,e.g., A-3 denotes the third building in the category for flat-roofbuildings.
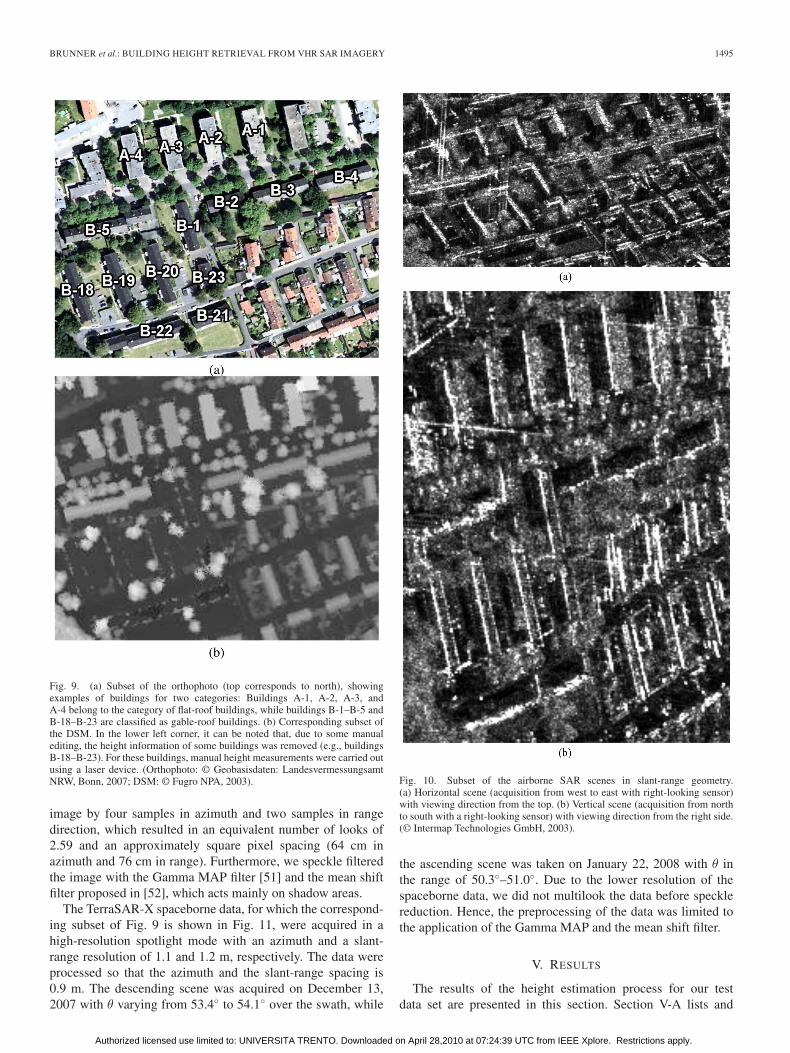
Fig. 9 shows a subset of the orthophoto and the correspond-ing DSM with some example buildings for two of the threecategories: buildings denoted by A-1, A-2, A-3, and A-4 areflat-roof buildings, while buildings B-1–B-5 and B-18–B-23belong to the class of gable-roof buildings. An example ofa building belonging to category C is shown in Fig. 14 inSection V-A3.
The two airborne SAR scenes taken by the AeS-1 sensorfrom Intermap Technologies [50], for which the correspondingsubset of Fig. 9 is shown in Fig. 10 (in slant-range geometry),were acquired in X-band on March 13, 2003 with 16-cmazimuth and 38-cm slant-range resolutions in HH polarization.The incidence angle ranges over the swath from 28◦ (nearrange) to 52◦ (far range). The dual-aspect data were measuredin almost perpendicular flight paths with a right-pointing an-tenna so that the flight path for the “horizontal” scene wasapproximately from west to east, while the “vertical” scene wasmeasured from north to south. The overlapping area in the twoscenes, where we focus on in this paper, is about 2.3 × 2.3 km2
and includes a medium-dense residential urban area and severalsmaller industrial zones.
In order to use the MI as similarity measure for SAR im-age registration/matching, speckle reduction is essential [47].Hence, we preprocessed the airborne data by multilooking the
Authorized licensed use limited to: UNIVERSITA TRENTO. Downloaded on April 28,2010 at 07:24:39 UTC from IEEE Xplore. Restrictions apply.
BRUNNER et al.: BUILDING HEIGHT RETRIEVAL FROM VHR SAR IMAGERY 1495
Fig. 9. (a) Subset of the orthophoto (top corresponds to north), showingexamples of buildings for two categories: Buildings A-1, A-2, A-3, andA-4 belong to the category of flat-roof buildings, while buildings B-1–B-5 andB-18–B-23 are classified as gable-roof buildings. (b) Corresponding subset ofthe DSM. In the lower left corner, it can be noted that, due to some manualediting, the height information of some buildings was removed (e.g., buildingsB-18–B-23). For these buildings, manual height measurements were carried outusing a laser device. (Orthophoto: © Geobasisdaten: LandesvermessungsamtNRW, Bonn, 2007; DSM: © Fugro NPA, 2003).
image by four samples in azimuth and two samples in rangedirection, which resulted in an equivalent number of looks of2.59 and an approximately square pixel spacing (64 cm inazimuth and 76 cm in range). Furthermore, we speckle filteredthe image with the Gamma MAP filter [51] and the mean shiftfilter proposed in [52], which acts mainly on shadow areas.
The TerraSAR-X spaceborne data, for which the correspond-ing subset of Fig. 9 is shown in Fig. 11, were acquired in ahigh-resolution spotlight mode with an azimuth and a slant-range resolution of 1.1 and 1.2 m, respectively. The data wereprocessed so that the azimuth and the slant-range spacing is0.9 m. The descending scene was acquired on December 13,2007 with θ varying from 53.4◦ to 54.1◦ over the swath, while
Fig. 10. Subset of the airborne SAR scenes in slant-range geometry.(a) Horizontal scene (acquisition from west to east with right-looking sensor)with viewing direction from the top. (b) Vertical scene (acquisition from northto south with a right-looking sensor) with viewing direction from the right side.(© Intermap Technologies GmbH, 2003).
the ascending scene was taken on January 22, 2008 with θ inthe range of 50.3◦–51.0◦. Due to the lower resolution of thespaceborne data, we did not multilook the data before specklereduction. Hence, the preprocessing of the data was limited tothe application of the Gamma MAP and the mean shift filter.
V. RESULTS
The results of the height estimation process for our testdata set are presented in this section. Section V-A lists and
Authorized licensed use limited to: UNIVERSITA TRENTO. Downloaded on April 28,2010 at 07:24:39 UTC from IEEE Xplore. Restrictions apply.
1496 IEEE TRANSACTIONS ON GEOSCIENCE AND REMOTE SENSING, VOL. 48, NO. 3, MARCH 2010
Fig. 11. Subset of TerraSAR-X scenes in slant-range geometry, which cor-responds to the subsets shown in Fig. 9. (a) Ascending (viewing directionfrom left). (b) Descending (viewing direction from right). (TerraSAR-X image:© Infoterra GmbH/DLR, 2007–2008).
discusses the results of the three groups of buildings for thehorizontal airborne scene in greater detail. In Section V-B, wehighlight the results for the vertical airborne scene, particularlywith respect to the differences compared to the results fromthe horizontal scene. To investigate the impact of the lowerresolution of the TerraSAR-X data with respect to the airbornedata on the accuracy of the height estimation, we summarize
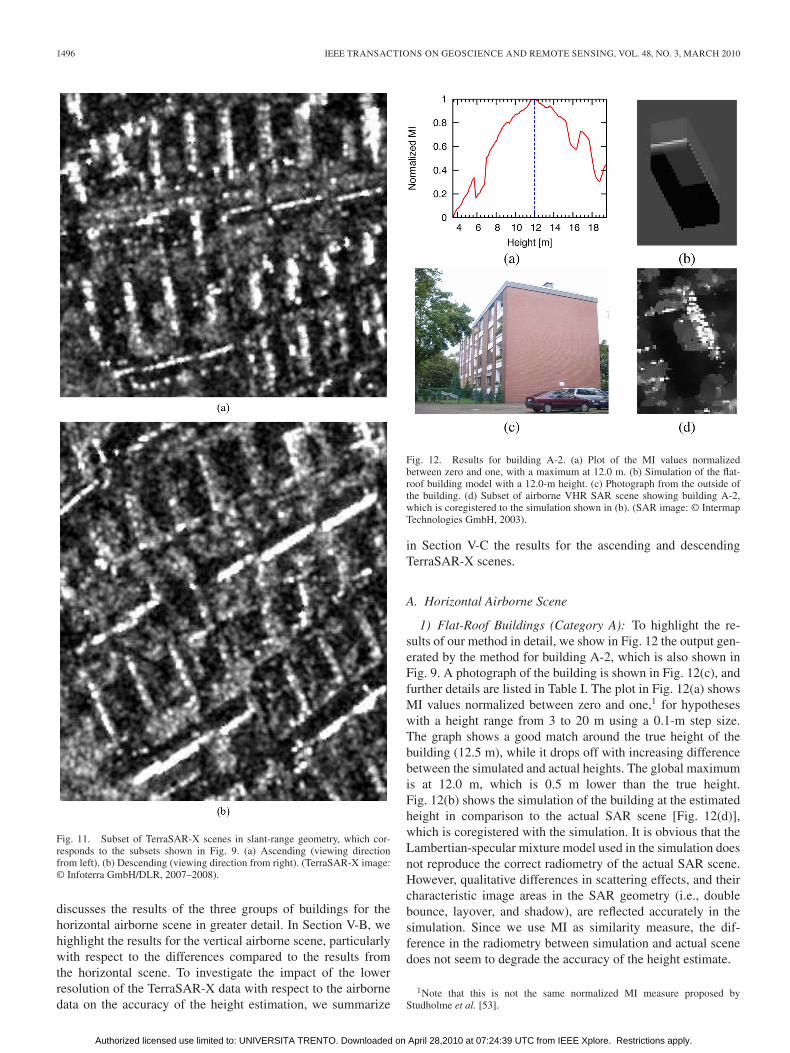
Fig. 12. Results for building A-2. (a) Plot of the MI values normalizedbetween zero and one, with a maximum at 12.0 m. (b) Simulation of the flat-roof building model with a 12.0-m height. (c) Photograph from the outside ofthe building. (d) Subset of airborne VHR SAR scene showing building A-2,which is coregistered to the simulation shown in (b). (SAR image: © IntermapTechnologies GmbH, 2003).
in Section V-C the results for the ascending and descendingTerraSAR-X scenes.
A. Horizontal Airborne Scene
1) Flat-Roof Buildings (Category A): To highlight the re-sults of our method in detail, we show in Fig. 12 the output gen-erated by the method for building A-2, which is also shown inFig. 9. A photograph of the building is shown in Fig. 12(c), andfurther details are listed in Table I. The plot in Fig. 12(a) showsMI values normalized between zero and one,1 for hypotheseswith a height range from 3 to 20 m using a 0.1-m step size.The graph shows a good match around the true height of thebuilding (12.5 m), while it drops off with increasing differencebetween the simulated and actual heights. The global maximumis at 12.0 m, which is 0.5 m lower than the true height.Fig. 12(b) shows the simulation of the building at the estimatedheight in comparison to the actual SAR scene [Fig. 12(d)],which is coregistered with the simulation. It is obvious that theLambertian-specular mixture model used in the simulation doesnot reproduce the correct radiometry of the actual SAR scene.However, qualitative differences in scattering effects, and theircharacteristic image areas in the SAR geometry (i.e., doublebounce, layover, and shadow), are reflected accurately in thesimulation. Since we use MI as similarity measure, the dif-ference in the radiometry between simulation and actual scenedoes not seem to degrade the accuracy of the height estimate.
1Note that this is not the same normalized MI measure proposed byStudholme et al. [53].
Authorized licensed use limited to: UNIVERSITA TRENTO. Downloaded on April 28,2010 at 07:24:39 UTC from IEEE Xplore. Restrictions apply.

BRUNNER et al.: BUILDING HEIGHT RETRIEVAL FROM VHR SAR IMAGERY 1497
TABLE IRESULTS FOR FLAT-ROOF BUILDINGS (CATEGORY A) FOR HORIZONTAL AIRBORNE SCENE
Fig. 13. Results for building B-18. (a) Plot of the normalized MI values witha maximum at 10.2 m. (b) Simulation of the flat-roof building model with a10.2-m height. (c) Photograph from the outside of the building. (d) Subset ofairborne VHR SAR scene showing building B-18, which is coregistered to thesimulation shown in (b). (SAR image: © Intermap Technologies GmbH, 2003).
A summary of the results of the proposed height estimationprocedure for the buildings in category A is given in Table I,together with the details (dimensions and the correspondingviewing configuration of the sensor) of the buildings.
2) Gable-Roof Buildings (Category B): The categoryof gable-roof buildings contains the largest distinct set ofbuildings in the test data set. Fig. 13 shows, in detail, the resultsfor building B-18, which is also shown in Fig. 9. A photographof the building is shown in Fig. 13(c), and further characteristicsare listed in Table II. The plot in Fig. 13(a) shows the matchvalue for the same height hypotheses as in Section V-A1.Similar to the plot in Fig. 12(a), the maximum value at 10.2 mis close to the true height of the actual building (9.5 m).Comparing the simulation in Fig. 13(b) to the actual buildingshown in Fig. 13(d), it can be noticed again that the SARimage geometries of the two images match well, while there isa significant difference in the radiometries of the two images,which justifies the use of MI as a measure for the matchingprocedure.
The results of the height estimation for the 27 gable-roofbuildings are summarized in Table II. The mean difference is
0.9 m, which indicates that the method has a small tendency tooverestimate heights. The standard deviation is 1.5 m, whichis slightly better than what was achieved for the flat-roofbuildings.
The method provides consistent results when matching build-ings at different aspect angles. Let us consider, for example,buildings B-1 and B-4 in Fig. 9, which have approximately thesame size and structure. Local incidence angles are more orless the same, whereas B-1 is turned about 96◦ clockwise withrespect to B-4. The results for the height estimation, with anestimation difference of 1.5 m for B-1 and 1.0 m for B-4, aregood matches for both buildings, demonstrating the robustnessof the method with respect to varying aspect angle.
3) Buildings for Which the Structural Type Does Not Fit theModels (Category C): In this paper, we assume that buildingshave a rectangular footprint and have either a flat or a gableroof. However, these simplifying assumptions do not match allactual buildings. To investigate the performance of the proposedheight estimation procedure for buildings that have a differentstructure than our assumptions, but are approximated in thesimulation step by rectangular flat- or gable-roof buildings, wesummarize in Table III the results for seven buildings.
Building C-1 is a gable-roof building, but with a very lowroof inclination angle. It is approximated by a flat-roof building.In this case, the height is underestimated by 1.3 m, which isin the range of the standard deviations for flat- or gable-roofbuildings.
Building C-2 has a rectangular footprint, but with a towerattached to it, which is oriented toward the SAR sensor. Further-more, the roof structure is not a classical gable-roof structure,where two sides of the roof are inclined, but a hipped roofwhere all four sides of the roof are inclined. We approximatethis structure with a gable-roof building, neglecting the tower,which results in an underestimation of 1.6 m.
Building C-3 [Fig. 14(a) and (b)] is a flat-roof building,which has three different heights. The major part (middle part)of the building is 7.0 m high, while the left and right parts areapproximately 3.2 and 0.5 m lower than the main part. Weapproximate this building with a standard flat-roof building,which is, given the complex signature in the actual scene, asignificant simplification. This is reflected in the estimationresult, which overestimates the height by 2.9 m.
The main part of C-4 is an industrial rectangular flat-roofbuilding, which has several lower building parts attached to it.For the estimation of the height of the main part, we neglectedthe structures in the surrounding and assumed the building tobe a standalone rectangular flat-roof building, which resulted inan underestimation of 2.1 m.
Authorized licensed use limited to: UNIVERSITA TRENTO. Downloaded on April 28,2010 at 07:24:39 UTC from IEEE Xplore. Restrictions apply.
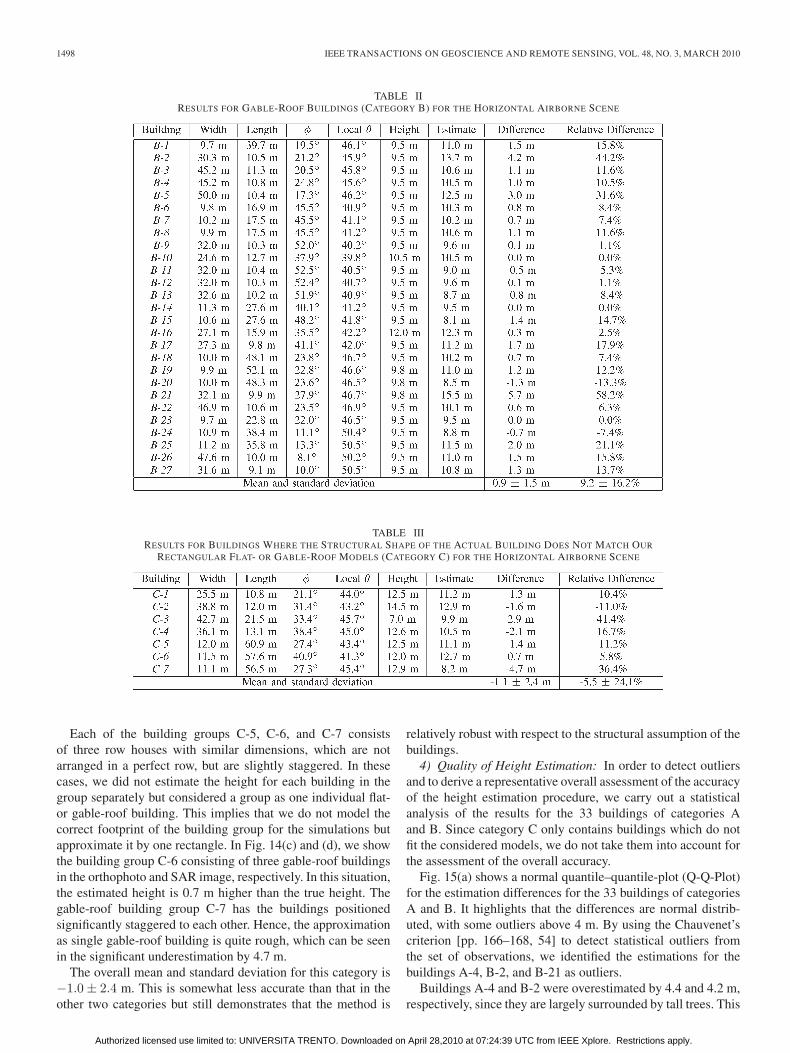
1498 IEEE TRANSACTIONS ON GEOSCIENCE AND REMOTE SENSING, VOL. 48, NO. 3, MARCH 2010
TABLE IIRESULTS FOR GABLE-ROOF BUILDINGS (CATEGORY B) FOR THE HORIZONTAL AIRBORNE SCENE
TABLE IIIRESULTS FOR BUILDINGS WHERE THE STRUCTURAL SHAPE OF THE ACTUAL BUILDING DOES NOT MATCH OUR
RECTANGULAR FLAT- OR GABLE-ROOF MODELS (CATEGORY C) FOR THE HORIZONTAL AIRBORNE SCENE
Each of the building groups C-5, C-6, and C-7 consistsof three row houses with similar dimensions, which are notarranged in a perfect row, but are slightly staggered. In thesecases, we did not estimate the height for each building in thegroup separately but considered a group as one individual flat-or gable-roof building. This implies that we do not model thecorrect footprint of the building group for the simulations butapproximate it by one rectangle. In Fig. 14(c) and (d), we showthe building group C-6 consisting of three gable-roof buildingsin the orthophoto and SAR image, respectively. In this situation,the estimated height is 0.7 m higher than the true height. Thegable-roof building group C-7 has the buildings positionedsignificantly staggered to each other. Hence, the approximationas single gable-roof building is quite rough, which can be seenin the significant underestimation by 4.7 m.
The overall mean and standard deviation for this category is−1.0 ± 2.4 m. This is somewhat less accurate than that in theother two categories but still demonstrates that the method is
relatively robust with respect to the structural assumption of thebuildings.
4) Quality of Height Estimation: In order to detect outliersand to derive a representative overall assessment of the accuracyof the height estimation procedure, we carry out a statisticalanalysis of the results for the 33 buildings of categories Aand B. Since category C only contains buildings which do notfit the considered models, we do not take them into account forthe assessment of the overall accuracy.
Fig. 15(a) shows a normal quantile–quantile-plot (Q-Q-Plot)for the estimation differences for the 33 buildings of categoriesA and B. It highlights that the differences are normal distrib-uted, with some outliers above 4 m. By using the Chauvenet’scriterion [pp. 166–168, 54] to detect statistical outliers fromthe set of observations, we identified the estimations for thebuildings A-4, B-2, and B-21 as outliers.
Buildings A-4 and B-2 were overestimated by 4.4 and 4.2 m,respectively, since they are largely surrounded by tall trees. This
Authorized licensed use limited to: UNIVERSITA TRENTO. Downloaded on April 28,2010 at 07:24:39 UTC from IEEE Xplore. Restrictions apply.

BRUNNER et al.: BUILDING HEIGHT RETRIEVAL FROM VHR SAR IMAGERY 1499
Fig. 14. (a) Building C-3 in orthophoto. (b) Building C-3 in SAR image (view-ing direction from top). (c) Building C-6 in orthophoto. (d) Building C-6 in SARimage (viewing direction from top). (Orthophoto: © Geobasisdaten: Landesver-messungsamt NRW, Bonn, 2007; SAR image: © Intermap TechnologiesGmbH, 2003).
leads to a SAR signature which is different from the signatureof a building not affected by objects in the surrounding (whichcan be observed in Fig. 10(a) by comparing the signature ofB-2, for example, to the signature of building B-4). Since wedo not model trees in the simulation procedure, they have animpact on the accuracy of the height estimation.
Building B-21 was overestimated by 5.7 m since it issurrounded by a relatively smooth surface, giving it a lowbackscatter, similar to the shadow. Hence, the matching func-tion does not capture well the edge of the shadow region ofthe building signature in the actual SAR image, leading to theoverestimate in height. Hence, the shadow region of a buildingseems to be important for the method to estimate the correctheight.
Fig. 15(b) shows the Q-Q-Plot of the estimation differenceswhere the three outliers were removed, which shows a goodcorrespondence of the set with the normal distribution. Themean of the reduced set is 0.4 m, which demonstrates that themethod has no significant preference for over- or undersegmen-tation, while the standard deviation of 1.0 m highlights the goodestimation performance of the proposed approach.
5) Effects of Trees: Backscattering from trees positionednear a building tends to superimpose on the backscatteringsignature of the buildings and therefore affect the accuracyof the height estimation. We analyze buildings A-3 and A-4,which are very similar and have identical viewing configu-rations. The amount and the density of trees are similar forboth buildings, whereas the relative locations of the trees aredifferent [see Fig. 9(a) and (b)]. Since the sensor images thebuildings from the top of the image, the majority of trees, whichare in the immediate surrounding of building A-3, are locatedin its layover area. For building A-4, instead, the majority ofthe trees which are close to the building are located behind
Fig. 15. (a) Q-Q-Plot for the 33 buildings of categories A and B. (b) Q-Q-Plotfor the buildings of categories A and B, where three outliers were removed.
the building, affecting its shadow area. The estimation errorsof −0.5 m (A-3) and 4.4 m (A-4) confirm that the shadowarea of the building plays an important role in the heightestimation.
The density of trees surrounding the building weighs on theaccuracy of the height estimation as well. Consider the build-ings B-2, B-4, and B-5, which are three gable-roof buildingswith equal heights, located close to each other and with thesame orientation toward the sensor. Building B-4 has only sometrees in the front, while building B-5 has a higher densityof trees in the front and some additional trees in the back,which are not as close and dense as for building B-2, whichis completely surrounded by trees. The height estimation forB-4 shows a difference to the actual height of 1.0 m, a differ-ence of 3.0 m for building B-5, and 4.2 m for building B-2,
Authorized licensed use limited to: UNIVERSITA TRENTO. Downloaded on April 28,2010 at 07:24:39 UTC from IEEE Xplore. Restrictions apply.

1500 IEEE TRANSACTIONS ON GEOSCIENCE AND REMOTE SENSING, VOL. 48, NO. 3, MARCH 2010
TABLE IVACTUAL AND MINIMUM DISTANCES BETWEEN BUILDINGS
A-1 AND A-4 FOR THE VERTICAL AIRBORNE SCENE
demonstrating the limitation of the height estimation method insituations that do not conform with the model assumptions.
B. Vertical Airborne Scene
The vertical scene of the dual-aspect data set was acquiredsuch that the angle between the flight paths of the horizontal andvertical scenes is 84.5◦. Hence, if the aspect angle of a buildingwas defined in the horizontal scene by the angle between theazimuth direction and the short wall of the building, it will begiven in the vertical scene by the angle between the azimuthdirection and the long wall of the building (see also Fig. 3). Thelocal incidence angle of a building might change significantlybetween the horizontal and vertical scenes depending on thelocation of the building. In the extreme case, the same buildingmight be measured in one scene with 28◦ incidence angle, whileit is measured in the other scene with 52◦.
For category A, the height estimation procedure resulted in amean error of 0.8 m with a large standard deviation of 5.4 m.The reason for the low accuracy is buildings A-1, A-2, A-3,and A-4 which have estimation errors ranging from −7.5 to7.5 m. This is caused by the fact that these buildings are tooclose to each other, so that condition (11) is not fulfilled. Apart of the shadow area of building A-1 is superimposed bythe layover area of building A-2. The actual and minimumdistances between the buildings A-1 and A-4 are reportedin Table IV.
The height estimation for the 27 buildings in category Bresulted in a mean error of −0.4 m with a standard deviationof 1.89 m. These values are in the same order of magnitude asthe ones from the horizontal scene.
For category C, the mean value of the error is 0.0 m with astandard deviation of 3.2 m. The reason for the higher standarddeviations for categories B and C with respect to the horizontalscene is the incidence angle, which is, on average, 44.5◦ for thehorizontal scene and 37.8◦ for the vertical scene (consideringbuildings in categories B and C). The lower mean incidenceangle for the vertical scene causes that the shadow areas aresmaller with respect to the ones in the horizontal scene, con-firming again the relative importance of the shadow feature forthe height estimation.
C. Results for TerraSAR-X Scenes
The goal of the analysis of the TerraSAR-X scenes is mainlyto investigate the effect of using a lower resolution space-borne image compared to an airborne image. The ascendingand descending scenes were acquired approximately from anorth–south and a south–north orbit, respectively, which are,from an orientation point of view, quite similar to the flightpath from which the vertical airborne scene was measured
TABLE VACTUAL AND MINIMUM DISTANCES BETWEEN BUILDINGS A-1 AND A-4
FOR THE ASCENDING AND DESCENDING TERRASAR-X SCENES
(see Fig. 8). In fact, the vertical airborne and the descendingTerraSAR-X scenes were both acquired with a right-lookingsensor from a similar north-to-south path. The ascendingTerraSAR-X scene was also acquired with a right-lookingsensor but from a south–north track, so that the buildings weremeasured from nearly the opposite side with respect to thedescending TerraSAR-X and the vertical airborne scene. Thisimplies that a building was measured with similar aspect anglesthroughout the ascending and descending TerraSAR-X and thevertical airborne scenes. The incidence angle varies withineach of the TerraSAR-X scenes by only 1◦ over the swath,while there is a difference of 3◦ between the ascending anddescending TerraSAR-X scenes (see Section IV).
In the ascending TerraSAR-X scene, the mean and thestandard deviation of the difference in height estimation forcategory A are −3.3 and 5.8 m, respectively. The results for thedescending TerraSAR-X scene show a similar mean of −3.4 mwith a standard deviation of 4.3 m. The low accuracy for thiscategory has the same reason as for the buildings in categoryA in the vertical airborne scene. The buildings A-1–A-4 arelocated too close to each other so that the scattering effects ofdifferent buildings overlap with each other (see Section V-B).In Table V, we summarize the minimum distances requiredaccording to (11) and compared these to the actual values.Even though Δmin between buildings A-3 and A-4 is quitesimilar to Δact, the height estimate of A-4 is imprecise due toa high density of trees in the immediate surrounding of the twobuildings.
The mean values for category B for the ascending and de-scending scenes are 1.9 and −0.5 m, respectively. The standarddeviations are 3.1 and 3.4 m, respectively. The fact that theyare very similar in both scenes points out a constant heightestimation accuracy.
For the ascending scene, the estimation procedure for cate-gory C resulted in a mean value of −2.2 m and a standard devi-ation of 4.6 m. Those figures are −0.8 and 1.3 m, respectively,for the descending scene. Since they are in the same order ofmagnitude as for categories A and B, the structural differencesfrom the basic building assumptions are maybe less critical inlower resolution VHR spaceborne data.
The results for the TerraSAR-X data show that meter resolu-tion VHR SAR data are not sufficient to get an accurate heightestimate for the building dimensions that were investigated inthis paper. Nevertheless, if the height of a single floor of a build-ing is approximately known, the method permits the estimationof the number of floors of the building. This information canbe of use, for instance, to distinguish between different typesof buildings, such as residential housing, apartment buildings,industrial buildings, or skyscrapers.
Authorized licensed use limited to: UNIVERSITA TRENTO. Downloaded on April 28,2010 at 07:24:39 UTC from IEEE Xplore. Restrictions apply.
BRUNNER et al.: BUILDING HEIGHT RETRIEVAL FROM VHR SAR IMAGERY 1501
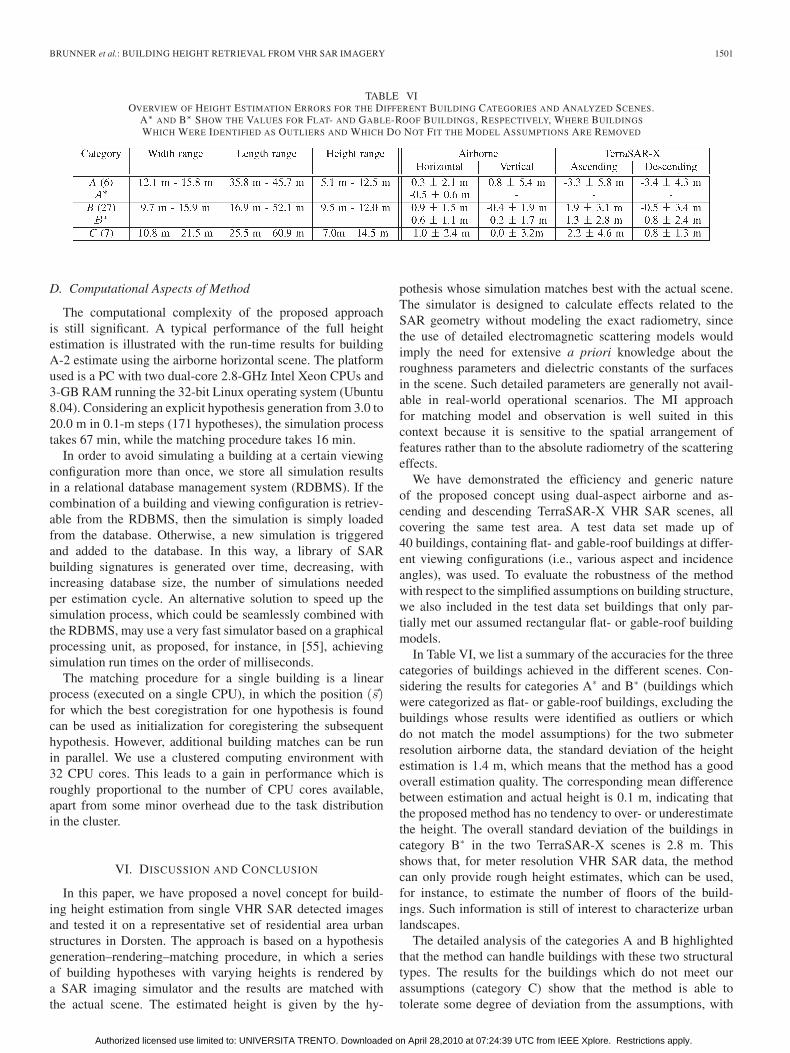
TABLE VIOVERVIEW OF HEIGHT ESTIMATION ERRORS FOR THE DIFFERENT BUILDING CATEGORIES AND ANALYZED SCENES.
A∗ AND B∗ SHOW THE VALUES FOR FLAT- AND GABLE-ROOF BUILDINGS, RESPECTIVELY, WHERE BUILDINGS
WHICH WERE IDENTIFIED AS OUTLIERS AND WHICH DO NOT FIT THE MODEL ASSUMPTIONS ARE REMOVED
D. Computational Aspects of Method
The computational complexity of the proposed approachis still significant. A typical performance of the full heightestimation is illustrated with the run-time results for buildingA-2 estimate using the airborne horizontal scene. The platformused is a PC with two dual-core 2.8-GHz Intel Xeon CPUs and3-GB RAM running the 32-bit Linux operating system (Ubuntu8.04). Considering an explicit hypothesis generation from 3.0 to20.0 m in 0.1-m steps (171 hypotheses), the simulation processtakes 67 min, while the matching procedure takes 16 min.
In order to avoid simulating a building at a certain viewingconfiguration more than once, we store all simulation resultsin a relational database management system (RDBMS). If thecombination of a building and viewing configuration is retriev-able from the RDBMS, then the simulation is simply loadedfrom the database. Otherwise, a new simulation is triggeredand added to the database. In this way, a library of SARbuilding signatures is generated over time, decreasing, withincreasing database size, the number of simulations neededper estimation cycle. An alternative solution to speed up thesimulation process, which could be seamlessly combined withthe RDBMS, may use a very fast simulator based on a graphicalprocessing unit, as proposed, for instance, in [55], achievingsimulation run times on the order of milliseconds.
The matching procedure for a single building is a linearprocess (executed on a single CPU), in which the position (�s)for which the best coregistration for one hypothesis is foundcan be used as initialization for coregistering the subsequenthypothesis. However, additional building matches can be runin parallel. We use a clustered computing environment with32 CPU cores. This leads to a gain in performance which isroughly proportional to the number of CPU cores available,apart from some minor overhead due to the task distributionin the cluster.
VI. DISCUSSION AND CONCLUSION
In this paper, we have proposed a novel concept for build-ing height estimation from single VHR SAR detected imagesand tested it on a representative set of residential area urbanstructures in Dorsten. The approach is based on a hypothesisgeneration–rendering–matching procedure, in which a seriesof building hypotheses with varying heights is rendered bya SAR imaging simulator and the results are matched withthe actual scene. The estimated height is given by the hy-
pothesis whose simulation matches best with the actual scene.The simulator is designed to calculate effects related to theSAR geometry without modeling the exact radiometry, sincethe use of detailed electromagnetic scattering models wouldimply the need for extensive a priori knowledge about theroughness parameters and dielectric constants of the surfacesin the scene. Such detailed parameters are generally not avail-able in real-world operational scenarios. The MI approachfor matching model and observation is well suited in thiscontext because it is sensitive to the spatial arrangement offeatures rather than to the absolute radiometry of the scatteringeffects.
We have demonstrated the efficiency and generic natureof the proposed concept using dual-aspect airborne and as-cending and descending TerraSAR-X VHR SAR scenes, allcovering the same test area. A test data set made up of40 buildings, containing flat- and gable-roof buildings at differ-ent viewing configurations (i.e., various aspect and incidenceangles), was used. To evaluate the robustness of the methodwith respect to the simplified assumptions on building structure,we also included in the test data set buildings that only par-tially met our assumed rectangular flat- or gable-roof buildingmodels.
In Table VI, we list a summary of the accuracies for the threecategories of buildings achieved in the different scenes. Con-sidering the results for categories A∗ and B∗ (buildings whichwere categorized as flat- or gable-roof buildings, excluding thebuildings whose results were identified as outliers or whichdo not match the model assumptions) for the two submeterresolution airborne data, the standard deviation of the heightestimation is 1.4 m, which means that the method has a goodoverall estimation quality. The corresponding mean differencebetween estimation and actual height is 0.1 m, indicating thatthe proposed method has no tendency to over- or underestimatethe height. The overall standard deviation of the buildings incategory B∗ in the two TerraSAR-X scenes is 2.8 m. Thisshows that, for meter resolution VHR SAR data, the methodcan only provide rough height estimates, which can be used,for instance, to estimate the number of floors of the build-ings. Such information is still of interest to characterize urbanlandscapes.
The detailed analysis of the categories A and B highlightedthat the method can handle buildings with these two structuraltypes. The results for the buildings which do not meet ourassumptions (category C) show that the method is able totolerate some degree of deviation from the assumptions, with
Authorized licensed use limited to: UNIVERSITA TRENTO. Downloaded on April 28,2010 at 07:24:39 UTC from IEEE Xplore. Restrictions apply.
1502 IEEE TRANSACTIONS ON GEOSCIENCE AND REMOTE SENSING, VOL. 48, NO. 3, MARCH 2010
the estimation results getting less accurate for higher degreesof simplification. This means that, with a reliable informationon the footprint and the type of building, an accurate estimateof the height can be achieved, while in the case of a limitedavailability of this information, the method can still provide arough estimate.
The approach is shown to be insensitive to the aspect angle ofa building. This is an important characteristic because buildingsin urban settings are typically not oriented in a systematic way.Airborne SAR has a higher flexibility to acquire imagery formultiple aspects, although this is usually costly. For satelliteSAR, aspect angles in imagery are limited by the ascending anddescending orbits of the satellite.
The analysis showed that the approach favors larger inci-dence angles. This is explained by the shadow areas, whichbecome larger with increasing (shallower) incidence angles,suggesting an important role of the shadow area for an accurateestimate of the height. Furthermore, the results demonstratedthat large trees, whose backscattering interferes with the SARshadow area of a building, decrease the accuracy of the method,which confirms the relatively important role of the shadowfeature. One of the reasons for this is the approximation ofthe layover area by a homogeneous area. However, in reality,it is rather heterogeneous due to windows, balconies, andother structures present at the front wall of a building havingdifferent materials and composing several smaller corner re-flectors. Hence, the similarity between the simulated and theactual layover area is lower compared to the similarity betweena simulated and an actual shadow area. The importance ofthe shadow areas could be relaxed by modeling the build-ing facade more accurately using facade grammar approaches[56]. The drawback of this would be the increased complexityof the building model and the need for additional a prioriinformation on the building facades. Regarding the presenceof trees or other disturbing objects in the neighborhood of abuilding, it would be relatively straightforward to log them atthe footprint-capturing stage, using VHR optical orthocorrectedimagery. That information would then be useful to filter heightestimation results.
The method assumes that buildings are isolated. The render-ing procedure does not consider interferences between differentbuildings, which arise if they are positioned close enoughso that, for example, their shadow and layover areas arenot separated any more but superimposed in a mixed area.This imposes the constraint that a building needs to have aminimum distance to a neighboring building (only if they arein the same azimuth position) so that no backscattering inter-ferences from the different buildings occur. If this constraint isnot fulfilled, the height estimation for the building is not ac-curate. The minimum distance between two buildings dependson the height of the neighboring buildings and on the localincidence angle: 1) The higher the buildings, the larger the min-imum distance, and 2) the more shallow the incidence angle,the larger the minimum distance and vice versa. Hence, wesuggest to acquire the VHR SAR imagery for rural and mediumdense urban areas with a shallow incidence angle. In denseurban areas with low buildings instead, the data should bemeasured with a steep incidence angle, which relaxes the min-
imum distance constraint at the cost of a decreased estimationaccuracy. The approach is not suitable for dense urban areaswith high buildings.
In order to generate the hypotheses, we require information(i.e., footprint and type of building) derived from ancillary data.This information can either be provided as cadastral maps orcan be directly extracted from the SAR image or other VHRoptical data. With the growing global availability of VHR datafrom urban areas, these requirements, while demanding, appearto be realistic.
We want to stress that we addressed in this paper an auto-matic information extraction scenario that is capable of dealingwith different types of buildings at various viewing configu-rations. The proposed method was designed with a minimumnumber of constraints and minimal requirements on the data.Taking into account the ambitious objective of this paper andthe fact that no a priori information on the height of buildingsis used, we believe that the achieved quality of the estimationresults is reasonable. Moreover, this paper has yielded firstquantitative evidence of what can be expected from the newmeter resolution spaceborne SAR sensors in terms of automaticinformation extraction in urban settings.
We are currently extending the use of the method to mergethe different height estimates from the different aspects in themultiaspect data set. This aims at improving the accuracies forbuildings that are affected by neighboring objects in one, but notin another aspect. Furthermore, we plan to apply this methodin damage assessment scenarios to detect buildings which arestructurally damaged or completely destroyed.
ACKNOWLEDGMENT
The authors would like to thank their Canadian colleagueC. Bielski for his input and corrections to this paper. Theauthors would also like to thank R. Günzkofer, M. Schwäbisch,and H. MacKay from Intermap Technologies GmbH, Germany,for providing the VHR airborne SAR data and R. Chiles fromFugro NPA for providing the LIDAR DSM.
REFERENCES
[1] M. Eineder, H. Breit, T. Fritz, B. Schättler, and A. Roth, “TerraSAR-XSAR products and processing algorithms,” in Proc. IEEE IGARSS, Seoul,Korea, 2005, vol. 7, pp. 4870–4873.
[2] G. F. De Luca, G. Marano, M. Piemontese, B. Versini, F. Caltagirone,G. Casonato, A. Coletta, and M. De Carlo, “Interoperability, expandabilityand multi mission-sensor COSMO-SkyMed capabilities,” in Proc. IEEEIGARSS, Barcelona, Spain, Jul. 23–27, 2007.
[3] A. R. Brenner and L. Roessing, “Radar imaging of urban areasby means of very high-resolution SAR and interferometric SAR,”IEEE Trans. Geosci. Remote Sens., vol. 46, no. 10, pp. 2971–2982,Oct. 2008.
[4] A. J. Bennett and D. Blacknell, “Infrastructure analysis from high resolu-tion SAR and InSAR imagery,” in Proc. 2nd GRSS/ISPRS Joint Work-shop Remote Sens. Data Fusion Over Urban Areas, Berlin, Germany,May 22–23, 2003, pp. 230–235.
[5] T. Balz and N. Haala, “SAR-based 3D reconstruction of complex ur-ban environments,” Int. Arch. Photogramm. Remote Sens., vol. 34,pp. 181–185, 2003. [Online]. Available: http://www.ifp.uni-stuttgart.de/publications/2003/balz alsdd2003.pdf
[6] F. Tupin, “Extraction of 3D information using overlay detection onSAR images,” in Proc. 2nd GRSS/ISPRS Joint Workshop Remote Sens.Data Fusion Over Urban Areas, Berlin, Germany, May 22–23, 2003,pp. 72–76.
Authorized licensed use limited to: UNIVERSITA TRENTO. Downloaded on April 28,2010 at 07:24:39 UTC from IEEE Xplore. Restrictions apply.

BRUNNER et al.: BUILDING HEIGHT RETRIEVAL FROM VHR SAR IMAGERY 1503
[7] P. Gamba, B. Houshmand, and M. Saccani, “Detection and extraction ofbuildings from interferometric SAR data,” IEEE Trans. Geosci. RemoteSens., vol. 38, no. 1, pp. 611–618, Jul. 2000.
[8] P. Gamba and B. Houshmand, “Digital surface models and building ex-traction: A comparison of IFSAR and LIDAR data,” IEEE Trans. Geosci.Remote Sens., vol. 38, no. 4, pp. 1959–1968, Jul. 2000.
[9] C. Tison, F. Tupin, and H. Maître, “A fusion scheme for joint retrieval ofurban height map classification from high-resolution interferometric SARimages,” IEEE Trans. Geosci. Remote Sens., vol. 45, no. 2, pp. 496–505,Feb. 2007.
[10] E. Simonetto, H. Oriot, and R. Garello, “Rectangular building extractionfrom stereoscopic airborne radar images,” IEEE Trans. Geosci. RemoteSens., vol. 43, no. 10, pp. 2386–2395, Oct. 2005.
[11] U. Soergel, E. Michaelsen, A. Thiele, E. Cadario, andU. Thoennessen, “Stereo analysis of high-resolution SAR imagesfor building height estimation in cases of orthogonal aspect directions,”ISPRS J. Photogramm. Remote Sens., vol. 64, no. 5, pp. 490–500,Sep. 2009.
[12] R. Hill, C. Moate, and D. Blacknell, “Estimating building dimensionsfrom synthetic aperture radar image sequences,” IET Radar, Sonar Navig.,vol. 2, no. 3, pp. 189–199, Jun. 2008.
[13] F. Xu and Y.-Q. Jin, “Automatic reconstruction of building objects frommultiaspect meter-resolution SAR images,” IEEE Trans. Geosci. RemoteSens., vol. 45, no. 7, pp. 2336–2353, Jul. 2007.
[14] A. Thiele, E. Cadario, K. Schulz, U. Thoennessen, and U. Soergel, “Build-ing recognition from multi-aspect high-resolution InSAR data in urbanareas,” IEEE Trans. Geosci. Remote Sens., vol. 45, no. 11, pp. 3583–3593,Nov. 2007.
[15] S. Sauer, L. Ferro-Famil, A. Reigber, and E. Pottier, “Multi-aspectPOLInSAR 3D urban scene reconstruction at L-band,” in Proc. 7thEUSAR, Friedrichshafen, Germany, Jun. 2008, vol. 3.
[16] H. Oriot and H. Cantalloube, “Circular SAR imagery for urban remotesensing,” in Proc. 7th EUSAR, Friedrichshafen, Germany, Jun. 2008,vol. 3.
[17] G. Franceschetti, A. Iodice, and D. Riccio, “A canonical problem in elec-tromagnetic backscattering from buildings,” IEEE Trans. Geosci. RemoteSens., vol. 40, no. 8, pp. 1787–1801, Aug. 2002.
[18] F. T. Ulaby, R. K. Moore, and A. K. Fung, Microwave Remote Sensing:Active and Passive, vol. 2, Radar Remote Sensing and Surface Scatteringand Emission Theory. Norwood, MA: Artech House, 1982.
[19] G. Franceschetti, R. Guida, A. Iodice, D. Riccio, and G. Ruello, “Build-ing feature extraction via a deterministic approach: Application to realhigh resolution SAR images,” in Proc. IEEE IGARSS, Barcelona, Spain,Jul. 23–27, 2007, pp. 2681–2684.
[20] H. Hammer, T. Balz, E. Cadario, U. Soergel, U. Thoennessen, andU. Stilla, “Comparison of SAR simulation concepts for the analysis ofhigh resolution SAR data,” in Proc. 7th Eur. Conf. Synthetic ApertureRadar, 2008, pp. 213–216.
[21] H.-J. Mametsa, F. Rouas, A. Berges, and J. Latger, “Imaging radar simula-tion in realistic environment using shooting and bouncing rays technique,”in Proc. SPIE Conf. SAR Image Anal. Model. Tech. IV , F. Posa, Ed.,Feb. 2002, vol. 4543, pp. 34–40.
[22] G. Franceschetti, A. Iodice, D. Riccio, and G. Ruello, “SAR raw sig-nal simulation for urban structures,” IEEE Trans. Geosci. Remote Sens.,vol. 41, no. 9, pp. 1986–1995, Sep. 2003.
[23] G. Margarit, J.-J. Mallorqui, J. M. Rius, and J. Sanz-Marcos, “On theusage of GRECOSAR, an orbital polarimetric SAR simulator of complextargets, to vessel classification studies,” IEEE Trans. Geosci. RemoteSens., vol. 44, no. 12, pp. 3517–3526, Dec. 2006.
[24] G. Margarit, J. J. Mallorqui, and C. Lopez-Martinez, “GRECOSAR,a SAR simulator for complex targets: Application to urban environ-ments,” in Proc. IEEE IGARSS, Barcelona, Spain, Jul. 23–27, 2007,pp. 4160–4163.
[25] U. Soergel, U. Thoennessen, and U. Stilla, “Iterative building reconstruc-tion from multi-aspect InSAR data,” in Proc. ISPRS Working Group III/3Workshop—3-D Reconstruction From Airborne Laserscanner and InSARData, Dresden, Germany, Oct. 8–10, 2003, vol. XXXIV.
[26] D. Brunner, G. Lemoine, and L. Bruzzone, “Extraction of buildingheights from VHR SAR imagery using an iterative simulation andmatch procedure,” in Proc. IEEE IGARSS, Boston, MA, Jul. 7–11, 2008,pp. IV-141–IV-144.
[27] “Building height retrieval from airborne VHR SAR imagery based on aniterative simulation and matching procedure,” in Proc. SPIE Conf. RemoteSens. Environ. Monit. GIS Appl. Geology VIII, Cardiff, U.K., Sep. 15–18,2008, p. 711 00F.
[28] A. Thiele, E. Cadario, K. Schulz, and U. Thoennessen, “Featureextraction of gable-roofed buildings from multi-aspect high-resolution
InSAR data,” in Proc. IEEE IGARSS, Barcelona, Spain, Jul. 23–27, 2007,pp. 262–265.
[29] Y. Dong, B. Forster, and C. Ticehurst, “Radar backscatter analysis forurban environments,” Int. J. Remote Sens., vol. 18, no. 6, pp. 1351–1364,Apr. 1997.
[30] D. Brunner, L. Bruzzone, A. Ferro, J. Fortuny, and G. Lemoine,“Analysis of the double bounce scattering mechanism of buildings inVHR SAR data,” in Proc. SPIE Conf. Image Signal Process. RemoteSens. XIV , Cardiff, U.K., Sep. 15–18, 2008, vol. 7109, pp. 710 90Q-1–710 90Q-12.
[31] J. A. Nelder and R. Mead, “A simplex method for function minimization,”Comput. J., vol. 7, no. 4, pp. 308–313, Jan. 1965.
[32] S. Kirkpatrick, C. D. Gelatt, and M. P. Vecchi, “Optimization by simulatedannealing,” Science, vol. 220, no. 4598, pp. 671–680, May 13, 1983.
[33] A. K. Fung, Microwave Scattering and Emission Models and TheirApplications. Boston, MA: Artech House, 1994.
[34] K. Yee, “Numerical solution of initial boundary value problems involvingMaxwell’s equations in isotropic media,” IEEE Trans. Antennas Propag.,vol. 14, no. 3, pp. 302–307, May 1966.
[35] G. Oller, P. Marthon, and L. Rognant, “Correlation and similarity mea-sures for SAR image matching,” in Proc. 10th Int. Symp. Remote Sens.,Barcelona, Spain, Sep. 8–12, 2003.
[36] C. Barat, C. Ducottet, and M. Jourlin, “Pattern matching usingmorphological probing,” in Proc. 10th ICIP, Barcelona, Spain, 2003,pp. 369–372.
[37] J. S. De Bonet and A. Chao, “Structure-driven SAR image registration,”in Proc. SPIE Conf. Algorithms Synthetic Aperture Radar Imagery V ,E. Zelnio, Ed., Sep. 1998, vol. 3370, pp. 109–119.
[38] W. G. Eppler, S. M. Louie Marcus, J. Petersen, and D. W. Paglieroni, “Fastnormalized cross-correlation of complex gradients for autoregistration ofmulti-source imagery,” in Proc. Amer. Soc. Photogramm. Remote SensingAnnu. Meeting, Washington, DC, May 22–26, 2000.
[39] J. Zheng, X. Bai, and X. Zhao, “SAR image matching based on fractaltheory,” in Proc. 7th ICSP, Beijing, China, 2004, pp. 1965–1968.
[40] F. Chen, H. Zhang, and C. Wang, “A novel feature matching method inairborne SAR image registration,” in Proc. IEEE IGARSS, Seoul, Korea,Jul. 25–29, 2005, pp. 4722–4724.
[41] D. G. Lowe, “Distinctive image features from scale-invariant keypoints,”Int. J. Comput. Vis., vol. 60, no. 2, pp. 91–110, Nov. 2004.
[42] B. Wessel, M. Huber, and A. Roth, “Registration of near real-timeSAR images by image-to-image matching,” in Proc. Photogramm. ImageAnal., U. Stilla, Ed., Munich, Germany, Sep. 19–21, 2007, pp. 179.
[43] D. Brunner, G. Lemoine, and L. Bruzzone, “Height estimation ofman made structures using hybrid VHR optical and SAR imagery,” inProc. EARSeL Joint Workshop, Remote Sens.—New Challenges of HighResolution, C. Juergens, Ed., 2008, pp. 186–193.
[44] J. Lewis, “Fast normalized cross-correlation,” in Proc. Vision Interface,1995, pp. 120–123.
[45] A. Collignon, F. Maes, D. Delaere, D. Vandermeulen, P. Suetens,and G. Marchal, “Automated multi-modality image registration basedon information theory,” in Proc. Inf. Process. Med. Imag., 1995,pp. 263–274.
[46] P. Viola and W. Wells, “Alignment by maximization of mutual informa-tion,” in Proc. 5th ICCV , 1995, pp. 16–23.
[47] H. Xie, L. E. Pierce, and F. T. Ulaby, “Mutual information based reg-istration of SAR images,” in Proc. IEEE IGARSS, Toulouse, France,Jul. 21–25, 2003, pp. 4028–4031.
[48] F. Maes, A. Collignon, D. Vandeermeulen, G. Marchal, and P. Suetens,“Multimodality image registration by maximization of mutual informa-tion,” IEEE Trans. Med. Imag., vol. 16, no. 2, pp. 187–198, Apr. 1997.
[49] P. Soille, Morphological Image Analysis: Principles and Applications,2nd ed. Berlin, Germany: Springer-Verlag, 2003.
[50] M. Schwaebisch and J. Moreira, “The high resolution airborne interfero-metric SAR AeS-1,” in Proc. 4th Int. Airborne Remote Sens. Conf. Exhib.,Ottawa, ON, Canada, Jun. 21–24, 1999, p. 8.
[51] A. Lopes, E. Nezry, R. Touzi, and H. Laur, “Structure detection andstatistical adaptive speckle filtering in SAR images,” Int. J. Remote Sens.,vol. 14, no. 9, pp. 1735–1758, Jun. 1993.
[52] F. Cellier, H. Oriot, and J.-M. Nicolas, “Introduction of the mean shiftalgorithm in SAR imagery: Application to shadow extraction for build-ing reconstruction,” in Proc. Earsel Workshop 3D Remote Sens., Porto,Portugal, Jun. 10–11, 2005.
[53] C. Studholme, D. L. G. Hill, and D. J. Hawkes, “An overlap invariantentropy measure of 3D medical image alignment,” Pattern Recognit.,vol. 32, no. 1, pp. 71–86, Jan. 1999.
[54] J. R. Taylor, An Introduction to Error Analysis, 2nd ed. Sausalito, CA:Univ. Sci. Books, 1997.
Authorized licensed use limited to: UNIVERSITA TRENTO. Downloaded on April 28,2010 at 07:24:39 UTC from IEEE Xplore. Restrictions apply.
1504 IEEE TRANSACTIONS ON GEOSCIENCE AND REMOTE SENSING, VOL. 48, NO. 3, MARCH 2010
[55] T. Balz and U. Stilla, “Hybrid GPU based single- and double-bounce SARsimulation,” IEEE Trans. Geosci. Remote Sens., vol. 47, no. 10, pp. 3519–3529, Oct. 2009.
[56] N. Ripperda and C. Brenner, “Data driven rule proposal for gram-mar based facade reconstruction,” in Proc. PIA, Munich, Germany,Sep. 19–21, 2007, vol. 36.
Dominik Brunner (S’07) received the Diploma intechnical computer science from the University ofApplied Sciences Hof, Hof, Germany, in 2004.
From 2004 to 2006, he was a Software Engi-neer with SAP AG, Walldorf, Germany. Since 2006,he has been with the European Commission JointResearch Centre, Ispra, Italy, and also with the Re-mote Sensing Laboratory, Department of Informa-tion Engineering and Computer Science, Universityof Trento, Trento, Italy. His research interests includethe field of remote sensing, pattern recognition, and
image processing in support to damage assessment and emergency response, inparticular the analysis of very high spatial resolution SAR data of urban areas.
Guido Lemoine (S’92–M’95–SM’08) is an Agri-cultural Engineer by training (1987, Soil Sci-ence, Wageningen University, Wageningen, TheNetherlands). His main expertise is in applied re-mote sensing, first developed as a research topic(microwave backscattering of soils) and later as acommercial activity in a cofounded remote sensingand GIS consultancy. Since he joined the EuropeanCommission Joint Research Centre, Ispra, Italy, in1997, he has further developed his remote sensingand informatics expertise in agricultural statistics
and subsidy control applications, in fishery monitoring, and, since 2006, incivil security applications. His current work focuses on integration of very highresolution optical and SAR data in crisis response and collaborative geospatialanalysis and fast computing methods for near real time mapping of crisis eventimpact.
Lorenzo Bruzzone (S’95–M’98–SM’03) receivedthe M.S. degree (summa cum laude) in electronicengineering and the Ph.D. degree in telecommuni-cations from the University of Genoa, Genoa, Italy,in 1993 and 1998, respectively.
From 1998 to 2000, he was a Postdoctoral Re-searcher with the University of Genoa. In 2000, hejoined the University of Trento, Trento, Italy, wherehe is currently a Full Professor of telecommunica-tions. He teaches remote sensing, pattern recogni-tion, and electrical communications. He is the Head
of the Remote Sensing Laboratory, Department of Information Engineeringand Computer Science, University of Trento. His current research interests arein the area of remote-sensing image processing and recognition (analysis ofmultitemporal data, feature extraction and selection, classification, regressionand estimation, data fusion, and machine learning). He conducts and supervisesresearch on these topics within the frameworks of several national and inter-national projects. He is an Evaluator of project proposals for many differentgovernments and scientific organizations. He is the author (or coauthor) of73 scientific publications in referred international journals, more than130 papers in conference proceedings, and 7 book chapters. He is a Refereefor many international journals and has served on the Scientific Committees ofseveral international conferences.
Dr. Bruzzone is a member of the Managing Committee of the Italian Inter-University Consortium on Telecommunications and a member of the ScientificCommittee of the India–Italy Center for Advanced Research. Since 2009, hehas been a member of the Administration Committee of the IEEE Geoscienceand Remote Sensing Society. He is also a member of the International Associa-tion for Pattern Recognition and of the Italian Association for Remote Sensing(AIT). He was a Guest Editor of a Special Issue of the IEEE TRANSACTIONS
ON GEOSCIENCE AND REMOTE SENSING on the subject of the analysis ofmultitemporal remote-sensing images (November 2003). He was the GeneralChair and Cochair of the First and Second IEEE International Workshop onthe Analysis of Multi-temporal Remote-Sensing Images (MultiTemp) and iscurrently a member of the Permanent Steering Committee of this series ofworkshops. Since 2003, he has been the Chair of the SPIE Conference on Imageand Signal Processing for Remote Sensing. From 2004 to 2006, he servedas an Associate Editor for the IEEE GEOSCIENCE AND REMOTE SENSING
LETTERS. Currently, he is an Associate Editor for the IEEE TRANSACTIONS
ON GEOSCIENCE AND REMOTE SENSING. He ranked first place in the StudentPrize Paper Competition of the 1998 IEEE International Geoscience andRemote Sensing Symposium (Seattle, July 1998). He was a recipient of theRecognition of the IEEE TRANSACTIONS ON GEOSCIENCE AND REMOTE
SENSING Best Reviewers in 1999.
Harm Greidanus received the Ph.D. degreein astrophysics from Leiden University, Leiden,The Netherlands, in 1989, on the subject of kine-matics and multispectral observations of supernovaremnants.
After that, he worked in remote sensing researchat the TNO Physics and Electronics Laboratory,The Hague, The Netherlands, until 2003 and joinedthe European Commission Joint Research Centre,Ispra, Italy. He has worked mostly with imagingradar (ground based, airborne, and satellite) but also
with optical and infrared, mostly for maritime applications (vessel detection,bathymetry, surface waves, and currents) but also for land mapping.
Authorized licensed use limited to: UNIVERSITA TRENTO. Downloaded on April 28,2010 at 07:24:39 UTC from IEEE Xplore. Restrictions apply.