Embed Size (px)
Citation preview
Built by Access
Annual Report 2016/17ACCESS ENGINEERING PLC
PREAMBLE02 About Us04 Financial Highlights05 Operational Highlights06 A Message from the Chairman08 Joint Statement from the Managing Director and the Chief Operating Officer
BUSINESS MODEL
12 Our Business Portfolio at a Glance14 Operating Environment16 Our Strenghts and Values18 Stakeholder Engagement and Materiality
VALUE CREATION
26 Financial Capital34 Institutional Capital36 Investor Capital40 Customer Capital73 Employee Capital77 Business Partner Capital81 Social and Environmental Capital
STEWARDSHIP
92 Board of Directors96 Corporate Management Team100 Corporate Governance138 Audit Committee Report140 Related Party Transactions Review Committee Report142 Enterprise Risk Management
FINANCIAL REPORTS
152 Annual Report of the Board of Directors on the Affairs of the Company161 Statement of Directors’ Responsibility162 Directors’ Statement on Internal Control163 Independent Auditors’ Report164 Statement of Profit or Loss and Other Comprehensive Income165 Statement of Financial Position166 Statement of Changes in Equity167 Statement of Cash Flows169 Notes to the Financial Statements
ANNEXES
243 Seven Year Summary244 About this Report245 Operating Structure246 Awards and Accolades248 Milestones249 GRI Content Index252 Glossary254 Notice of Meeting
Form of Proxy EnclosedCorporate Information Inner Back Cover
PREAMBLE BUSINESS MODEL VALUE CREATION STEWARDSHIP FINANCIAL REPORTS ANNEXES
‘Built by Access’ – a hallmark phrase that has come to stand for premium quality, creativity, innovation, complete reliability of product and service and outstanding value. It is the ‘badge’ of a Company at the pinnacle of its profession. ‘Built by Access’ says it all to the discerning customer, who needs look no further for a prime solution. This report details the manner in which we have proliferated this feature – in strategy and action.
BUILT BY ACCESS
2 /
ACCESS ENGINEERING PLC // ANNUAL REPORT 2016/17
PREAMBLE BUSINESS MODEL VALUE CREATION STEWARDSHIP FINANCIAL REPORTS ANNEXES
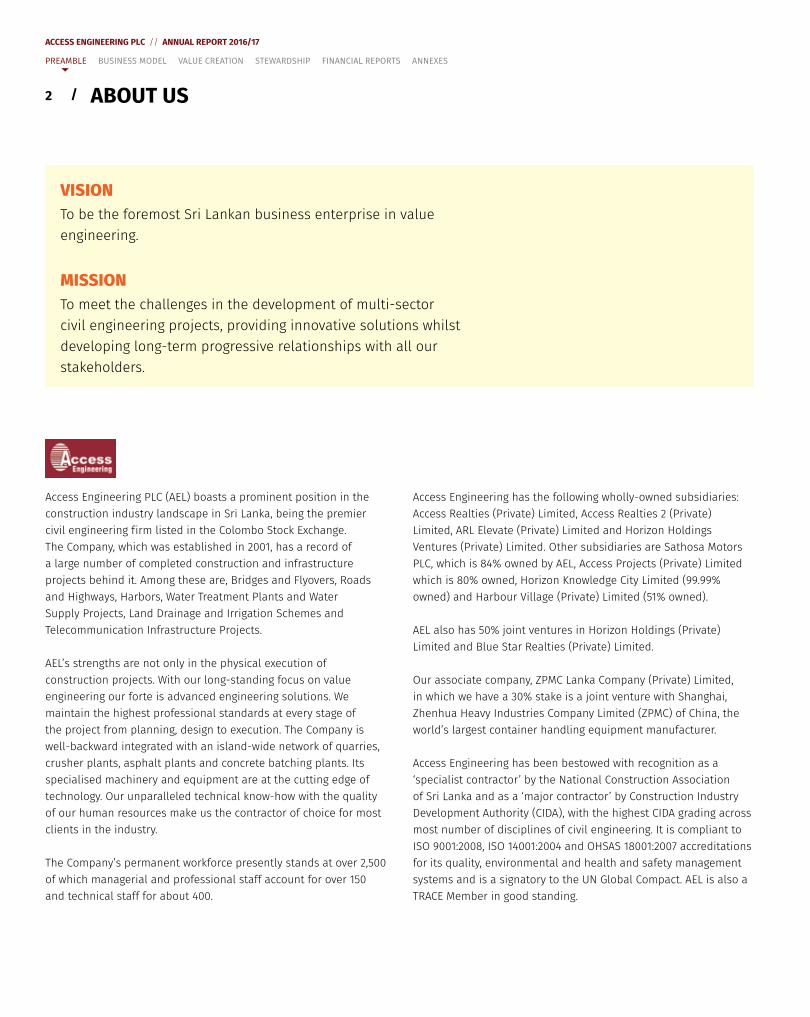
ABOUT US
VISIONTo be the foremost Sri Lankan business enterprise in value engineering.
MISSIONTo meet the challenges in the development of multi-sector civil engineering projects, providing innovative solutions whilst developing long-term progressive relationships with all our stakeholders.
Access Engineering PLC (AEL) boasts a prominent position in the construction industry landscape in Sri Lanka, being the premier civil engineering f irm listed in the Colombo Stock Exchange. The Company, which was established in 2001, has a record of a large number of completed construction and infrastructure projects behind it. Among these are, Bridges and Flyovers, Roads and Highways, Harbors, Water Treatment Plants and Water Supply Projects, Land Drainage and Irrigation Schemes and Telecommunication Infrastructure Projects.
AEL’s strengths are not only in the physical execution of construction projects. With our long-standing focus on value engineering our forte is advanced engineering solutions. We maintain the highest professional standards at every stage of the project from planning, design to execution. The Company is well-backward integrated with an island-wide network of quarries, crusher plants, asphalt plants and concrete batching plants. Its specialised machinery and equipment are at the cutting edge of technology. Our unparalleled technical know-how with the quality of our human resources make us the contractor of choice for most clients in the industry.
The Company’s permanent workforce presently stands at over 2,500 of which managerial and professional staff account for over 150 and technical staff for about 400.
Access Engineering has the following wholly-owned subsidiaries: Access Realties (Private) Limited, Access Realties 2 (Private) Limited, ARL Elevate (Private) Limited and Horizon Holdings Ventures (Private) Limited. Other subsidiaries are Sathosa Motors PLC, which is 84% owned by AEL, Access Projects (Private) Limited which is 80% owned, Horizon Knowledge City Limited (99.99% owned) and Harbour Village (Private) Limited (51% owned).
AEL also has 50% joint ventures in Horizon Holdings (Private) Limited and Blue Star Realties (Private) Limited.
Our associate company, ZPMC Lanka Company (Private) Limited, in which we have a 30% stake is a joint venture with Shanghai, Zhenhua Heavy Industries Company Limited (ZPMC) of China, the world’s largest container handling equipment manufacturer.
Access Engineering has been bestowed with recognition as a ‘specialist contractor’ by the National Construction Association of Sri Lanka and as a ‘major contractor’ by Construction Industry Development Authority (CIDA), with the highest CIDA grading across most number of disciplines of civil engineering. It is compliant to ISO 9001:2008, ISO 14001:2004 and OHSAS 18001:2007 accreditations for its quality, environmental and health and safety management systems and is a signatory to the UN Global Compact. AEL is also a TRACE Member in good standing.
3
ACCESS ENGINEERING PLC // ANNUAL REPORT 2016/17
/
PREAMBLE BUSINESS MODEL VALUE CREATION STEWARDSHIP FINANCIAL REPORTS ANNEXES
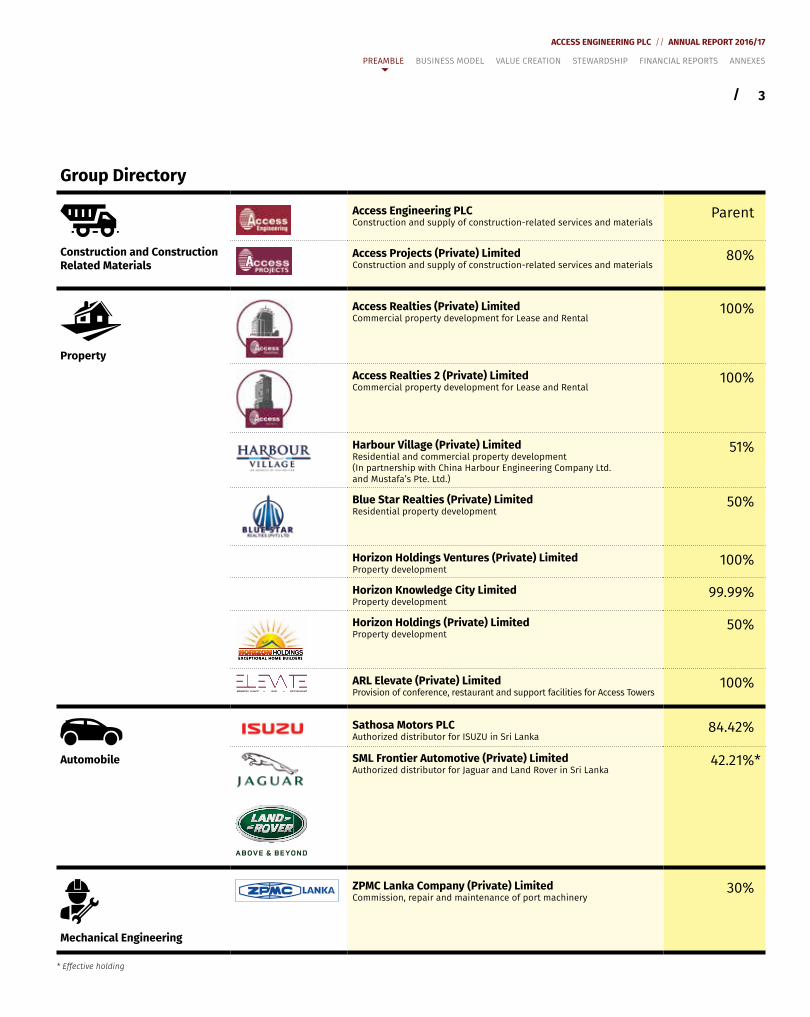
Group Directory
Construction and ConstructionRelated Materials
Access Engineering PLCConstruction and supply of construction-related services and materials
Parent
Access Projects (Private) LimitedConstruction and supply of construction-related services and materials
80%
Property
Access Realties (Private) LimitedCommercial property development for Lease and Rental
100%
Access Realties 2 (Private) LimitedCommercial property development for Lease and Rental
100%
Harbour Village (Private) LimitedResidential and commercial property development (In partnership with China Harbour Engineering Company Ltd. and Mustafa’s Pte. Ltd.)
51%
Blue Star Realties (Private) LimitedResidential property development
50%
Horizon Holdings Ventures (Private) LimitedProperty development
100%
Horizon Knowledge City LimitedProperty development
99.99%
Horizon Holdings (Private) LimitedProperty development
50%
RESTAURANTMEMBER LOUNGE BAR
ARL Elevate (Private) LimitedProvision of conference, restaurant and support facilities for Access Towers
100%
Automobile
Sathosa Motors PLCAuthorized distributor for ISUZU in Sri Lanka
84.42%
SML Frontier Automotive (Private) LimitedAuthorized distributor for Jaguar and Land Rover in Sri Lanka
42.21%*
Mechanical Engineering
ZPMC Lanka Company (Private) LimitedCommission, repair and maintenance of port machinery
30%
* Effective holding
4 /
ACCESS ENGINEERING PLC // ANNUAL REPORT 2016/17
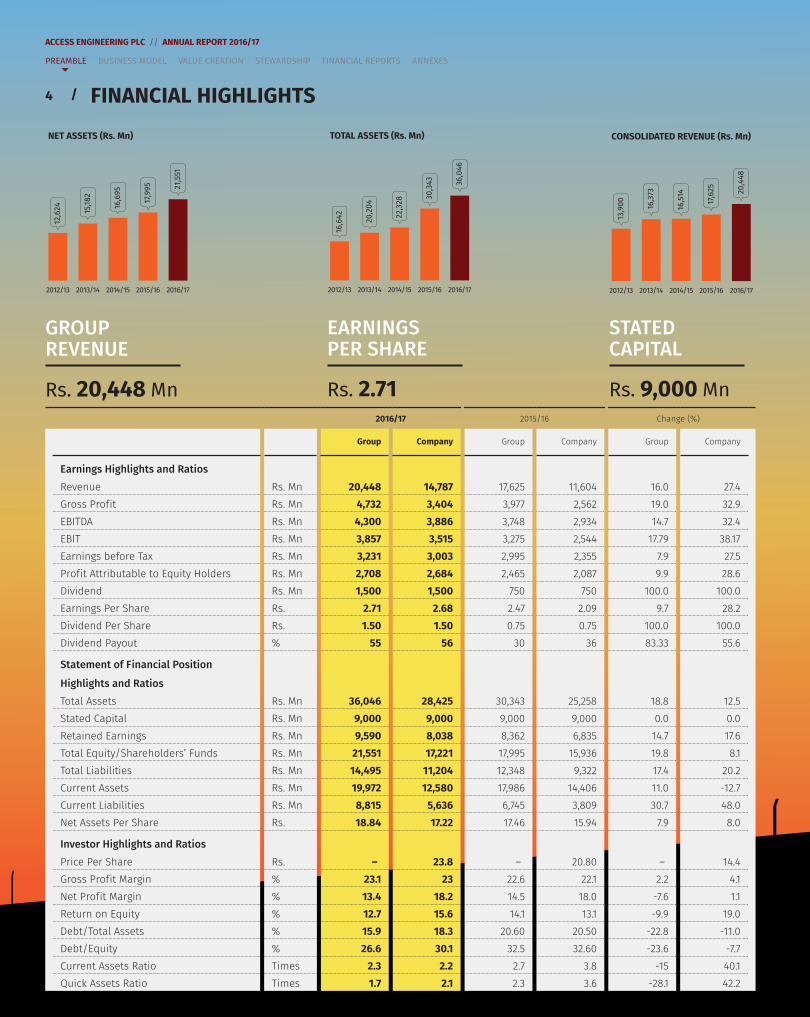
FINANCIAL HIGHLIGHTS
2016/17 2015/16 Change (%)
Group Company Group Company Group Company
Earnings Highlights and RatiosRevenue Rs. Mn 20,448 14,787 17,625 11,604 16.0 27.4Gross Prof it Rs. Mn 4,732 3,404 3,977 2,562 19.0 32.9EBITDA Rs. Mn 4,300 3,886 3,748 2,934 14.7 32.4EBIT Rs. Mn 3,857 3,515 3,275 2,544 17.79 38.17Earnings before Tax Rs. Mn 3,231 3,003 2,995 2,355 7.9 27.5Prof it Attributable to Equity Holders Rs. Mn 2,708 2,684 2,465 2,087 9.9 28.6Dividend Rs. Mn 1,500 1,500 750 750 100.0 100.0Earnings Per Share Rs. 2.71 2.68 2.47 2.09 9.7 28.2Dividend Per Share Rs. 1.50 1.50 0.75 0.75 100.0 100.0Dividend Payout % 55 56 30 36 83.33 55.6
Statement of Financial Position
Highlights and RatiosTotal Assets Rs. Mn 36,046 28,425 30,343 25,258 18.8 12.5Stated Capital Rs. Mn 9,000 9,000 9,000 9,000 0.0 0.0Retained Earnings Rs. Mn 9,590 8,038 8,362 6,835 14.7 17.6Total Equity/Shareholders’ Funds Rs. Mn 21,551 17,221 17,995 15,936 19.8 8.1Total Liabilities Rs. Mn 14,495 11,204 12,348 9,322 17.4 20.2Current Assets Rs. Mn 19,972 12,580 17,986 14,406 11.0 -12.7Current Liabilities Rs. Mn 8,815 5,636 6,745 3,809 30.7 48.0Net Assets Per Share Rs. 18.84 17.22 17.46 15.94 7.9 8.0
Investor Highlights and RatiosPrice Per Share Rs. – 23.8 – 20.80 – 14.4Gross Prof it Margin % 23.1 23 22.6 22.1 2.2 4.1Net Prof it Margin % 13.4 18.2 14.5 18.0 -7.6 1.1Return on Equity % 12.7 15.6 14.1 13.1 -9.9 19.0Debt/Total Assets % 15.9 18.3 20.60 20.50 -22.8 -11.0Debt/Equity % 26.6 30.1 32.5 32.60 -23.6 -7.7Current Assets Ratio Times 2.3 2.2 2.7 3.8 -15 40.1Quick Assets Ratio Times 1.7 2.1 2.3 3.6 -28.1 42.2
GROUPREVENUE
Rs. 20,448 Mn
NET ASSETS (Rs. Mn)
2012/13 2013/14 2014/15 2015/16 2016/17
12,6
24
15,1
82
16,6
95
17,9
95 21,
551
STATED CAPITAL
Rs. 9,000 Mn
CONSOLIDATED REVENUE (Rs. Mn)
2012/13 2013/14 2014/15 2015/16 2016/17
13,9
00
16,3
73
16,5
14
17,6
25
20
,44
8
EARNINGS PER SHARE
Rs. 2.71
TOTAL ASSETS (Rs. Mn)
2012/13 2013/14 2014/15 2015/16 2016/17
16,6
42
20
,20
4
22,3
28 3
0,3
43
36
,04
6
PREAMBLE BUSINESS MODEL VALUE CREATION STEWARDSHIP FINANCIAL REPORTS ANNEXES
PREAMBLE BUSINESS MODEL VALUE CREATION STEWARDSHIP FINANCIAL REPORTS ANNEXES
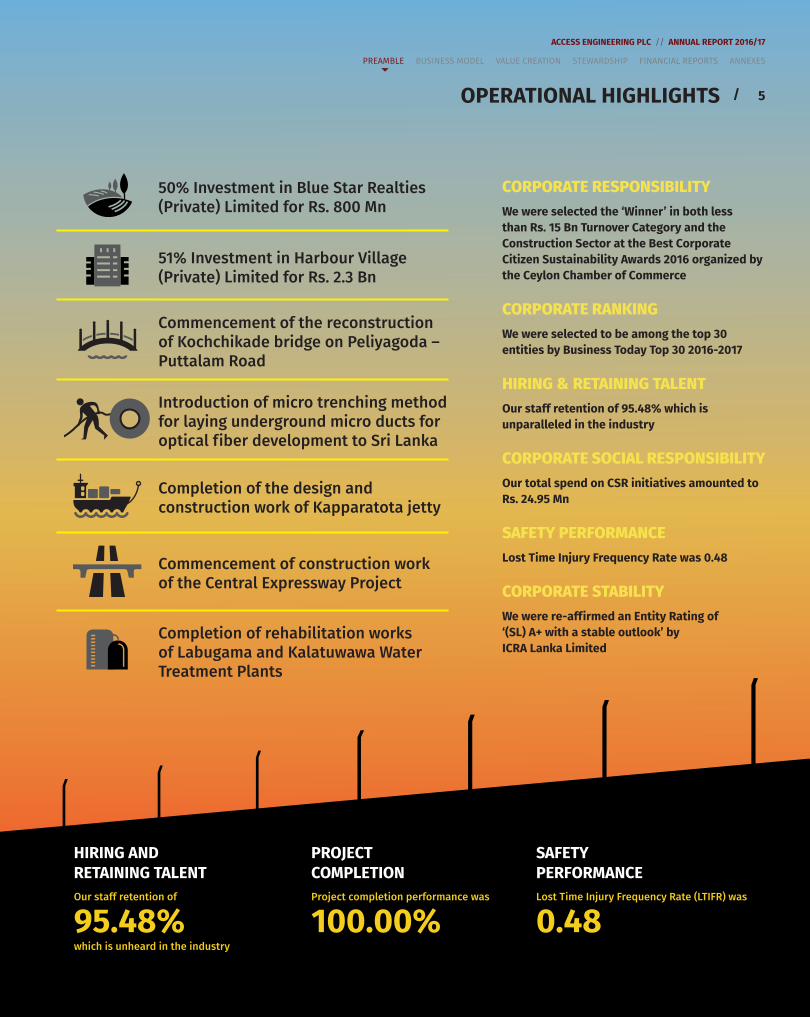
OPERATIONAL HIGHLIGHTS 5
ACCESS ENGINEERING PLC // ANNUAL REPORT 2016/17
/
PREAMBLE BUSINESS MODEL VALUE CREATION STEWARDSHIP FINANCIAL REPORTS ANNEXES
50% Investment in Blue Star Realties (Private) Limited for Rs. 800 Mn
51% Investment in Harbour Village (Private) Limited for Rs. 2.3 Bn
Commencement of the reconstruction of Kochchikade bridge on Peliyagoda – Puttalam Road
Introduction of micro trenching method for laying underground micro ducts for optical f iber development to Sri Lanka
Completion of the design and construction work of Kapparatota jetty
Commencement of construction work of the Central Expressway Project
Completion of rehabilitation works of Labugama and Kalatuwawa Water Treatment Plants
CORPORATE RESPONSIBILITYWe were selected the ‘Winner’ in both less than Rs. 15 Bn Turnover Category and the Construction Sector at the Best Corporate Citizen Sustainability Awards 2016 organized by the Ceylon Chamber of Commerce
CORPORATE RANKINGWe were selected to be among the top 30 entities by Business Today Top 30 2016-2017
HIRING & RETAINING TALENTOur staff retention of 95.48% which is unparalleled in the industry
CORPORATE SOCIAL RESPONSIBILITYOur total spend on CSR initiatives amounted to Rs. 24.95 Mn
SAFETY PERFORMANCELost Time Injury Frequency Rate was 0.48
CORPORATE STABILITYWe were re-aff irmed an Entity Rating of ‘(SL) A+ with a stable outlook’ by ICRA Lanka Limited
HIRING AND RETAINING TALENTOur staff retention of
95.48%which is unheard in the industry
PROJECT COMPLETIONProject completion performance was
100.00%
SAFETY PERFORMANCELost Time Injury Frequency Rate (LTIFR) was
0.48
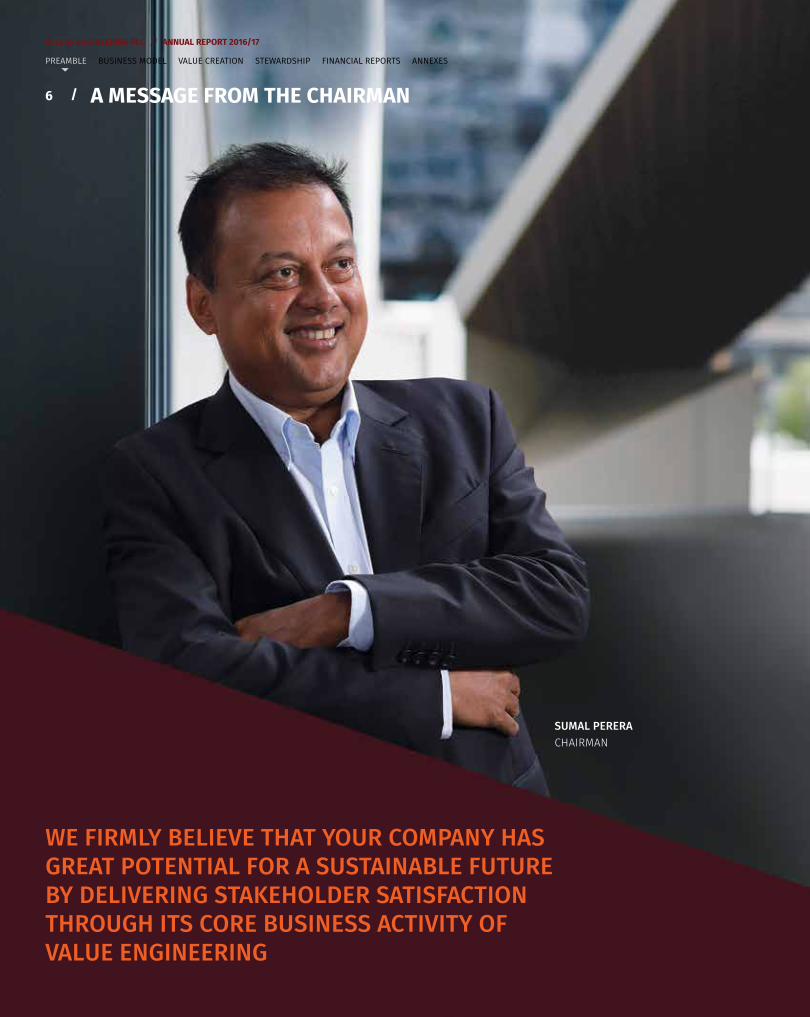
A MESSAGE FROM THE CHAIRMAN
WE FIRMLY BELIEVE THAT YOUR COMPANY HAS GREAT POTENTIAL FOR A SUSTAINABLE FUTURE BY DELIVERING STAKEHOLDER SATISFACTION THROUGH ITS CORE BUSINESS ACTIVITY OF VALUE ENGINEERING
ACCESS ENGINEERING PLC // ANNUAL REPORT 2016/17
6 /
PREAMBLE BUSINESS MODEL VALUE CREATION STEWARDSHIP FINANCIAL REPORTS ANNEXES
SUMAL PERERACHAIRMAN
7
ACCESS ENGINEERING PLC // ANNUAL REPORT 2016/17
/A MESSAGE FROM THE CHAIRMAN
I have the pleasure and privilege of reporting to you that your Company, Access Engineering PLC has completed yet another successful year, the details of which are elaborated in this Report. As the leader of a highly forward looking, dynamic and motivated team, we have continued during the year to create value; our focus on technology and innovation have positioned us to be always ahead of the competition and deliver our clientele products and services that surpass their expectations.
Our performance is all the more laudable as it was achieved despite the prevailing climate of global uncertainty and f inancial constraints of higher taxation on the part of the Government. While we have achieved a very satisfactory performance in terms of prof itably, keeping in mind our broader goal of sustainability, we have also implemented social and environmental programs. Our highly professional structure of corporate governance procedures, founded on a bedrock of ethics, values and policies also ensure the Company’s growth and sustainability.
As a Sri Lankan-owned and managed business enterprise we f irmly believe that your Company has great potential for a sustainable future by delivering stakeholder satisfaction through its core business activity of value engineering. In the Annual Report for 2015/16, we enunciated a clear policy direction to enter into the real estate sector as a diversif ication strategy, which we believe to be a natural extension of our core business. In this respect I’m happy to report that during the year under review we have commenced two major partnerships to build close to two million square feet in the Colombo urban landscape in the next three to f ive years. We have also secured for ourselves a land bank in the Greater Colombo areas for future development. We are happy to say that we were proactive in foreseeing the increasing interest and tax rates, and took mitigating measures by which we believe we will be able to reduce their adverse impact to the Company in the short to medium term.
Our investment in our own Access Tower II has been a prudent and timely one and we are conf ident of commencing commercial operations in the last quarter of 2017. We are also happy to report that we have contracted fully with reputed corporates to rent the premises even prior to the completion of the building. We strive for a healthy bottom line and continue to keep to our commitment to you of a 40%-50% dividend policy. Nevertheless, our focus in driving growth is a balance between return to our shareholders through prof its and a strong balance sheet through an ever increasing net asset value which will ensure the sustainability of the Company. It was this objective that drove the
strategic decision to go for the debenture issue in 2015. It is evident in the present context that it has come to fruition not only in helping us to grow but also by reducing the impact of high interest cost going forward.
I’m also happy to say that in pursuance of the triple bottom line we have carried out several social responsibility projects during the year. The notable ones have been the provision of vocational training to underprivileged children, e-waste program 2016, mentoring programs for university students, tree planting programs and the fabrication and donation of school chairs. We consider it a great honor as a f irst generation Sri Lankan Company to have been chosen to be included in the S&P SL 20. I wish to thank the members of the Board for their stewardship and guidance which has been invaluable. I also thank Mr. Christopher Joshua our Managing Director and Mr. Rohana Fernando our Chief Operating Off icer for the leadership they have provided and all our staff for the dedication they have shown and living up to our values.
Finally, I wish to thank all our stakeholders – shareholders, investors, customers, suppliers, bankers and the state for their continued support and the conf idence they have reposed in us.
Sumal PereraChairman
30th June 2017
PREAMBLE BUSINESS MODEL VALUE CREATION STEWARDSHIP FINANCIAL REPORTS ANNEXES
JOINT STATEMENT FROM THE MANAGING DIRECTOR AND THE CHIEF OPERATING OFFICER
At Access Engineering, we not only build physical infrastructure, also we build people, talents, communities and safeguard the environment.
THE ECONOMIC ENVIRONMENTOnce again, we are happy to report on a year we can look back on with pride as a company, both in f inancial and in operational terms. The external circumstances were generally, not very encouraging with the Sri Lankan economy recording a growth of only 4.4% during the year. Global factors contributed to this such as uncertainties caused by the Brexit vote in the United Kingdom.
Advanced economies such as the European Union and Japan experienced slow growth while the turbulent political situation in the Middle East was also a dampening factor.
Regarding the Sri Lankan economy, the industrial sector grew by 6.7%, services by 4.2% while agriculture suffered a drop of 4.2%. The construction, quarrying and mining industries, which contracted during 2015, grew signif icantly during the year. The construction sector made a very signif icant contribution of 29% to the industrial sector with a year-on-year growth of 12.5%. The implementation of some of the major infrastructure projects helped drive the construction sector, which also created opportunities for our business.
OUR FINANCIAL PERFORMANCE In the year under review we recorded the highest ever turnover and prof it. The turnover was Rs. 14.78 Bn while the prof it after tax was Rs. 2.68 Bn; the year-on-year growth was 27.4% and 28.6% respectively. At Group level too, the Company’s revenue was the highest ever amounting to Rs. 20.44 Bn. The total asset base notched Rs. 36.08 Bn and Rs. 28.42 Bn at Group level and Company level respectively. Our subsidiary company, Access Realties (Private) Limited increased its prof it before interest and tax over the previous year while Sathosa Motors PLC and Access Projects (Private) Limited recorded a decrease.
EXPANSION AND INNOVATIONThe Company retains its position as the most integrated and accredited civil engineering company in the country. During the year the Company continued to expand its production capacity both through acquisition of new assets as well as by upgrading its knowledge base in order to sustain our position in this industry. Investments were made in state-of-the-art construction equipment and production plants amounting to Rs. 1.12 Bn to
CHRISTOPHER JOSHUAMANAGING DIRECTOR
8 /
ACCESS ENGINEERING PLC // ANNUAL REPORT 2016/17
PREAMBLE BUSINESS MODEL VALUE CREATION STEWARDSHIP FINANCIAL REPORTS ANNEXES
JOINT STATEMENT FROM THE MANAGING DIRECTOR AND THE CHIEF OPERATING OFFICER
further strengthen our core business and enhance our product and service offerings to our clients. AEL also continues to be the preferred employer for the workforce of the industry. This is amply demonstrated by the fact that in 2016/17 we had a staff retention rate of over 95%.
Upgrading our technological capabilities is a continuous process at AEL. The investments made by the Company in new technologies and innovation contributed to the Company securing many projects for foundations and foundation retaining structures mostly from private sector clients. The quality and reliability of the material produced by the asphalt and ready mix concrete production plants resulted in the Company running at full capacity. During the year we also invested in a state-of-the-art Concrete Batching Plant from Germany and also further expanded our capabilities for diaphragm wall construction, micro trenching for cable laying, use of post tensioning and manufactured sand.
OUR PROJECTSThe infrastructure projects initiated by the Government have created and will continue to create opportunities for AEL. The Company is a member of the consortium to which contracts were awarded for the Central Expressway Stage Two on which work has already commenced. The commitment by the Government to continue the development of the balance stages of the Central Expressway (Stages I, III and IV), will provide the Company with further opportunities in construction work. Other projects
commenced during the year were design and construction of Rajagiriya, Polgahawela and Ganemulla Flyover projects and construction work at the Colombo Water Front Integrated Development. Work continued during the year on towns east of Colombo District Water Supply Project, design and construction of Access Tower II and the Colombo – Kandy Road section from Kadawatha to Nittambuwa among several other projects. The diaphragm wall and piling works at ITC Colombo One Development, were also completed successfully during the year under review.
IN THE YEAR UNDER REVIEW THE COMPANY RECORDED ITS HIGHEST EVER TURNOVER OF RS. 14.78 BN AND PROFIT AFTER TAX OF RS. 2.68 BN
ROHANA FERNANDOCHIEF OPERATING OFFICER
9/
ACCESS ENGINEERING PLC // ANNUAL REPORT 2016/17
PREAMBLE BUSINESS MODEL VALUE CREATION STEWARDSHIP FINANCIAL REPORTS ANNEXES
10 /
ACCESS ENGINEERING PLC // ANNUAL REPORT 2016/17
CHALLENGES FACEDIn common with the rest of the industry, the Company faced serious challenges due to the scarcity of skilled labor. Faced with the situation the Company has at times, resorted to engaging foreign labor in some of its large private sector projects. However, the Company is addressing this problem by initiating its own training and development program which is carried out at some of the vocational training centres including Don Bosco Technical Centre Facility in Negombo. Many persons have already been trained and absorbed into the permanent cadre under this program. Further training and skills development programs are also envisaged to be developed in association with the National Apprentice Board. Delays in transport of goods and personnel, due to road blocks as a result of public protests and rallies hindered smooth operations. So did changes to the regulations in the mining and borrowing of rock, sand and soil.
Moving forward, the proposed increase in the Company’s corporate tax rate to 28%, from the current preferential corporate tax rate of 12% is another challenge we need to deal with in the future.
OUR CONTRIBUTION TO SOCIETY AND THE ENVIRONMENT Given our goal of sustainable value creation, in all its aspects, we carried out many social and environmental related projects during the year under review. All such projects are crafted after careful consultations with the stakeholders and appropriate strategies are identif ied. The projects also go through an internal review process before being implemented.
Developing the human potential of our younger generation is an area we are very much concerned with. In partnership with the Technical College, we have initiated a program to turn school leavers and unskilled people into skilled carpenters, most of whom were later absorbed by us as permanent employees. Floods and landslides caused tremendous suffering to many Sri Lankans in 2016. We did our part to alleviate the suffering by helping out in the relief, rehabilitation and resettlement for victims of the floods in May 2016.
We have demonstrated our concern for the environment both by mitigating the environmental impact of our operations as well as our external projects. Regarding the former, some of the initiatives we have taken are treatment, recycling and reuse of waste materials. We have also done whatever possible to minimize cutting trees when executing projects. Several other steps taken have been minimizing energy usage and shifting to renewable energy sources whenever possible, in our projects.
Our environmental initiative, to preserve the ‘green-ness’ of our planet, which has been ongoing for the last 10 years, is the island-wide tree planting program. We note with great satisfaction that Access Engineering Project Off ices throughout the country have contributed to this program, and 7,000 trees were planted in 2016/17. We have also recognized that though the world is benef iting from digitalization e-waste, which is a source of a number of toxic substances, is becoming a major environmental hazard. In partnership with Ceylon Waste Management (Private) Limited, we are addressing this problem by collecting and recycling e-waste.
In 2016/17 a total of Rs. 25.43 Mn was spent on social and environmental projects.
AWARDS RECEIVED AEL continued to receive several accolades, both industry related and general, during the year. These included Winner of the Construction Sector at the Best Corporate Citizen Sustainability Awards, 2016 organized by the Ceylon Chamber of Commerce and the Overall Winner of the Category of Businesses with a turnover up to Rs. 15 Bn. We were the recipient of a National Award for Construction Performance for 2016 awarded by the Construction industry Development Authority and were one of the Business Today top 30 for 2015/16, receiving this accolade for the 3rd consecutive year.
LOOKING AHEAD Looking to the future, the opportunities for the industry looks promising with construction sector anticipating a growth phase. Demand for construction services and supply chain products will be boosted by mega projects such as the Colombo Port City, Hambantota Port Development Project, Bandaranaike International Airport Development Project, Central Expressway Project, etc. The Company can ride the wave of this growth phase of the Industry along with its own initiatives carried out to expand its opportunities. The demand witnessed at the public servants housing project being carried out in partnership with the UDA, would promote such public-private partnerships in the future. Major initiatives in the pipeline in the real estate sector also augur well in the medium term. AEL in partnership with Blue Star Realties (Private) Limited. have commenced development of over 240 Condominium Apartment Units in Rajagiriya. AEL has partnered China Harbour Engineering Company and Mustafa’s Singapore Pte Ltd for a mixed development project in uptown North Colombo comprising of over 1,000 Condominium Apartment Units and around 200,000 sq. ft. of commercial space. These projects are
JOINT STATEMENT FROM THE MANAGING DIRECTOR AND THE CHIEF OPERATING OFFICER
PREAMBLE BUSINESS MODEL VALUE CREATION STEWARDSHIP FINANCIAL REPORTS ANNEXES
11
ACCESS ENGINEERING PLC // ANNUAL REPORT 2016/17
/
expected to start generating revenue in 2020/21. Pre-bookings for Access Tower II have also been very encouraging with most of the tenant spaces being already booked. This ‘Grade A’ off ice building comprising approximately 200,000 sq. ft. of rentable space, is due to commence commercial operations by August 2017.
In conclusion, we wish to thank all our valued customers and business partners for their trust and conf idence placed in us. We thank our shareholders and the wider stakeholder community for the continued trust they have placed in us, and our Chairman and the Board of Directors for their leadership, support and guidance. We pay a very special tribute to our Corporate Management Team and employees, at all levels, for without their continuous passion, dedication and commitment, Access Engineering would not have been what it is today.
Christopher JoshuaManaging Director
Rohana FernandoChief Operating Off icer
30th June 2017
JOINT STATEMENT FROM THE MANAGING DIRECTOR AND THE CHIEF OPERATING OFFICER
PREAMBLE BUSINESS MODEL VALUE CREATION STEWARDSHIP FINANCIAL REPORTS ANNEXES
ENGINEERING SERVICES
ENGINEERING PROJECTS
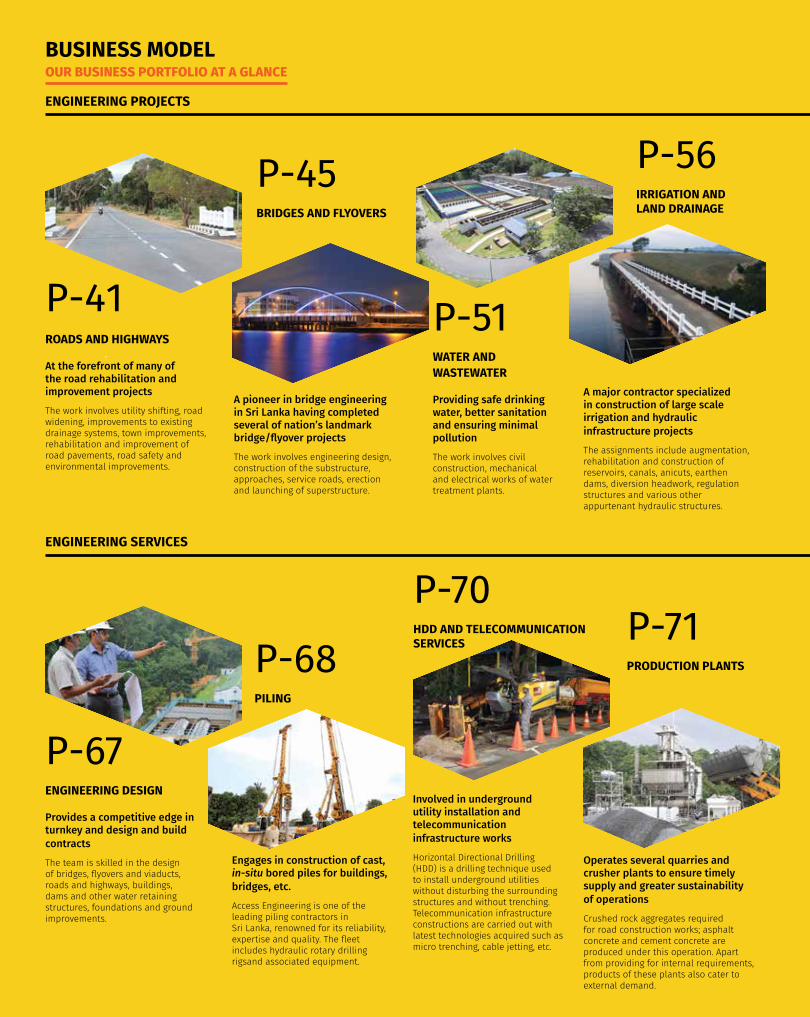
P-41ROADS AND HIGHWAYS
At the forefront of many of the road rehabilitation and improvement projects
The work involves utility shifting, road widening, improvements to existing drainage systems, town improvements, rehabilitation and improvement of road pavements, road safety and environmental improvements.
P-67ENGINEERING DESIGN
Provides a competitive edge in turnkey and design and build contracts
The team is skilled in the design of bridges, flyovers and viaducts, roads and highways, buildings, dams and other water retaining structures, foundations and ground improvements.
A major contractor specialized in construction of large scale irrigation and hydraulic infrastructure projects
The assignments include augmentation, rehabilitation and construction of reservoirs, canals, anicuts, earthen dams, diversion headwork, regulation structures and various other appurtenant hydraulic structures.
A pioneer in bridge engineering in Sri Lanka having completed several of nation’s landmark bridge/flyover projects
The work involves engineering design, construction of the substructure, approaches, service roads, erection and launching of superstructure.
Operates several quarries and crusher plants to ensure timely supply and greater sustainability of operations
Crushed rock aggregates requiredfor road construction works; asphalt concrete and cement concrete are produced under this operation. Apart from providing for internal requirements, products of these plants also cater to external demand.
P-51WATER AND WASTEWATER
Providing safe drinking water, better sanitation and ensuring minimal pollution
The work involves civil construction, mechanical and electrical works of water treatment plants.
P-45BRIDGES AND FLYOVERS
P-68PILING
P-56IRRIGATION AND LAND DRAINAGE
P-71PRODUCTION PLANTS
Engages in construction of cast, in-situ bored piles for buildings, bridges, etc.
Access Engineering is one of the leading piling contractors in Sri Lanka, renowned for its reliability, expertise and quality. The fleet includes hydraulic rotary drilling rigsand associated equipment.
BUSINESS MODELOUR BUSINESS PORTFOLIO AT A GLANCE
Involved in underground utility installation and telecommunication infrastructure works
Horizontal Directional Drilling (HDD) is a drilling technique used to install underground utilities without disturbing the surrounding structures and without trenching. Telecommunication infrastructure constructions are carried out with latest technologies acquired such as micro trenching, cable jetting, etc.
P-70HDD AND TELECOMMUNICATION SERVICES
ENGINEERING SERVICES
ENGINEERING PROJECTS
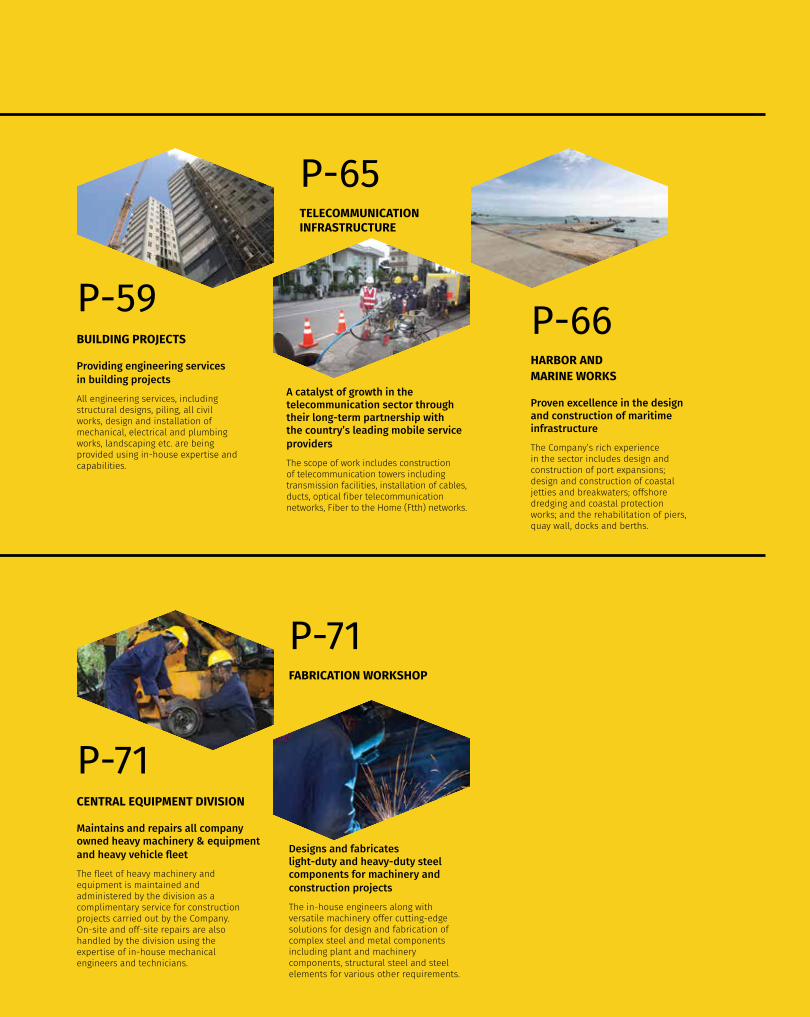
P-59BUILDING PROJECTS
Providing engineering services in building projects
All engineering services, including structural designs, piling, all civil works, design and installation of mechanical, electrical and plumbing works, landscaping etc. are being provided using in-house expertise and capabilities.
P-71CENTRAL EQUIPMENT DIVISION
Maintains and repairs all company owned heavy machinery & equipment and heavy vehicle fleet
The fleet of heavy machinery and equipment is maintained and administered by the division as a complimentary service for construction projects carried out by the Company. On-site and off-site repairs are also handled by the division using the expertise of in-house mechanical engineers and technicians.
P-66HARBOR AND MARINE WORKS
Proven excellence in the design and construction of maritime infrastructure
The Company’s rich experience in the sector includes design and construction of port expansions; design and construction of coastal jetties and breakwaters; offshore dredging and coastal protection works; and the rehabilitation of piers, quay wall, docks and berths.
Designs and fabricates light-duty and heavy-duty steel components for machinery and construction projects
The in-house engineers along with versatile machinery offer cutting-edge solutions for design and fabrication of complex steel and metal components including plant and machinery components, structural steel and steel elements for various other requirements.
P-65TELECOMMUNICATION INFRASTRUCTURE
P-71FABRICATION WORKSHOP
A catalyst of growth in the telecommunication sector through their long-term partnership with the country’s leading mobile service providers
The scope of work includes construction of telecommunication towers including transmission facilities, installation of cables, ducts, optical f iber telecommunication networks, Fiber to the Home (Ftth) networks.
14 /
ACCESS ENGINEERING PLC // ANNUAL REPORT 2016/17
OPERATING ENVIRONMENT
GLOBAL CONSTRUCTION INDUSTRY IN 2016The global economy faced many headwinds in 2016 which resulted in a decline in growth from 2015. The Brexit vote in June 2015 has dampened business conf idence in Europe. China is in the process of rebalancing towards a more service oriented and consumer driven economy. Terrorism and refugee problems also contributed to uncertainty. All these factors caused a weakness in global trade and manufacturing albeit with low levels of inflation.
In construction, Sri Lanka among other emerging Asian markets could, in the short-term, take advantage of the current slowdown in China.
The long-term outlook for the construction industry remains bright, however, with 70% industry-wide growth expected by 2025, according to a research conducted by PWC and KPMG. China, India and the US between them are expected to account for 60% of total growth. The current situation is that 52% of all global construction is in emerging markets. However, construction is faced with the challenge of becoming greener and more sustainable while continuing to improve the quality of life and reduce human and natural disasters.
LOCAL CONSTRUCTION INDUSTRYThe Government has continued to invest in major infrastructure projects which continue to drive the economy. The construction of the Southern Expressway Expansion, the Outer Circular Highway and the Central Expressway has continued. The last enhances the connectivity between Western, Southern, North Central and Central Provinces. The i-ROAD program, Priority Roads Project, Northern Road Connectivity Project and several bridge construction projects were also underway during the year funded by both local and foreign sources. In addition, investments have also been made in railroad construction, urban and town center development and irrigation systems.
During 2016, the Government launched the Western Region Megapolis Project. This macro level venture aims to transform the Western Province into a prosperous, urbanized, lively and cosmopolitan region. It is intended to mitigate current pressing problems such as traff ic congestion, poor housing conditions, waste disposal and access to basic utility services by improving essential services such as Information and Communication Technology (ICT), transport, power and energy.
The construction of the Second Terminal at the BIA is projected to come onstream and will continue till 2020 with an investment of Japanese Yen 45,428 Mn. Construction of the Colombo Financial City which had been suspended for some time, was recommenced in March 2016.
FINANCIAL IMPLICATIONSProf it margins are expected to come under pressure in the next f inancial year due to the proposed corporate tax rate on construction increasing to 28% from the current 12%.
Interest rates are tending to rise with diff iculties in borrowing both in debt markets and from f inancial institutions, which will also adversely affect margins. Tax concessions have also been withdrawn from investors of listed bonds and unit trusts. The result will be to render corporate bonds and unit trusts less attractive to investors which will in turn hamper our ability to borrow from debt markets.
PREAMBLE BUSINESS MODEL VALUE CREATION STEWARDSHIP FINANCIAL REPORTS ANNEXES
15
ACCESS ENGINEERING PLC // ANNUAL REPORT 2016/17
/
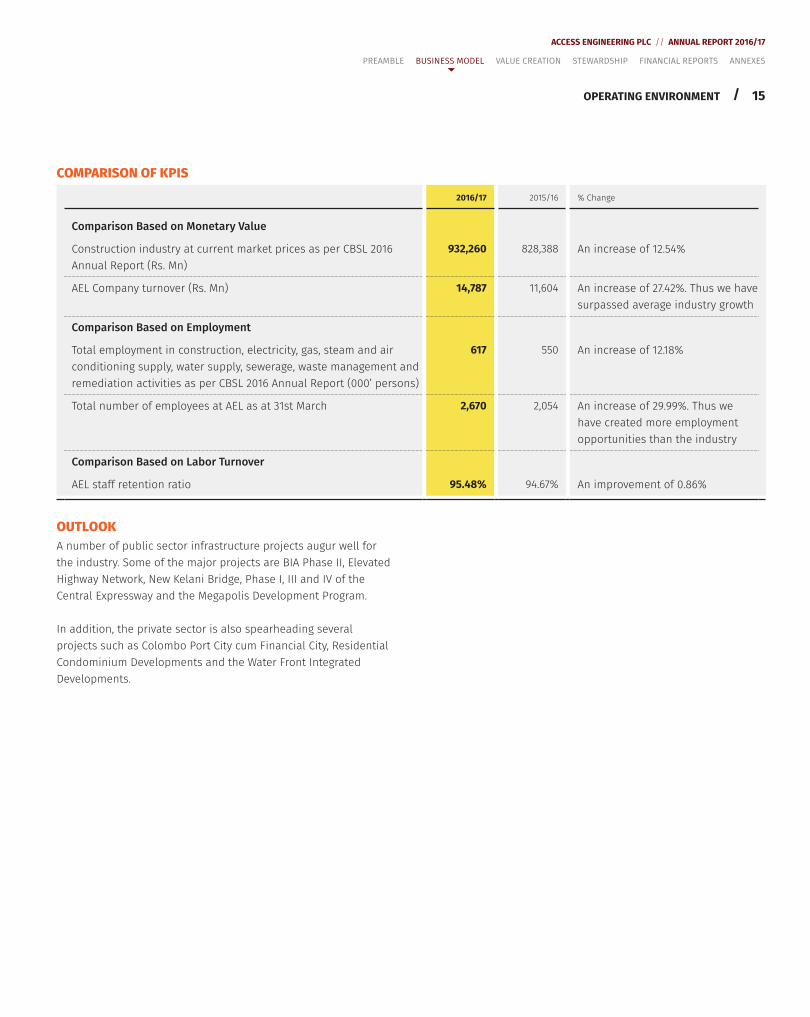
COMPARISON OF KPIS
2016/17 2015/16 % Change
Comparison Based on Monetary Value
Construction industry at current market prices as per CBSL 2016 Annual Report (Rs. Mn)
932,260 828,388 An increase of 12.54%
AEL Company turnover (Rs. Mn) 14,787 11,604 An increase of 27.42%. Thus we have surpassed average industry growth
Comparison Based on Employment
Total employment in construction, electricity, gas, steam and air conditioning supply, water supply, sewerage, waste management and remediation activities as per CBSL 2016 Annual Report (000’ persons)
617 550 An increase of 12.18%
Total number of employees at AEL as at 31st March 2,670 2,054 An increase of 29.99%. Thus we have created more employment opportunities than the industry
Comparison Based on Labor Turnover
AEL staff retention ratio 95.48% 94.67% An improvement of 0.86%
OUTLOOKA number of public sector infrastructure projects augur well for the industry. Some of the major projects are BIA Phase II, Elevated Highway Network, New Kelani Bridge, Phase I, III and IV of the Central Expressway and the Megapolis Development Program.
In addition, the private sector is also spearheading several projects such as Colombo Port City cum Financial City, Residential Condominium Developments and the Water Front Integrated Developments.
PREAMBLE BUSINESS MODEL VALUE CREATION STEWARDSHIP FINANCIAL REPORTS ANNEXES
OPERATING ENVIRONMENT
16 /
ACCESS ENGINEERING PLC // ANNUAL REPORT 2016/17
OUR STRENGTHS AND VALUES
Systems
Knowledge
ValueEngineering
Brand Values
StrategicPartnerships
Processes
VISION
MISSION
Perform
ance
Capital Formation
Stra
tegy
Formulatio
n
BusinessO
peration
s
Sustainability
Ris
kM
anag
ement Govern
ance
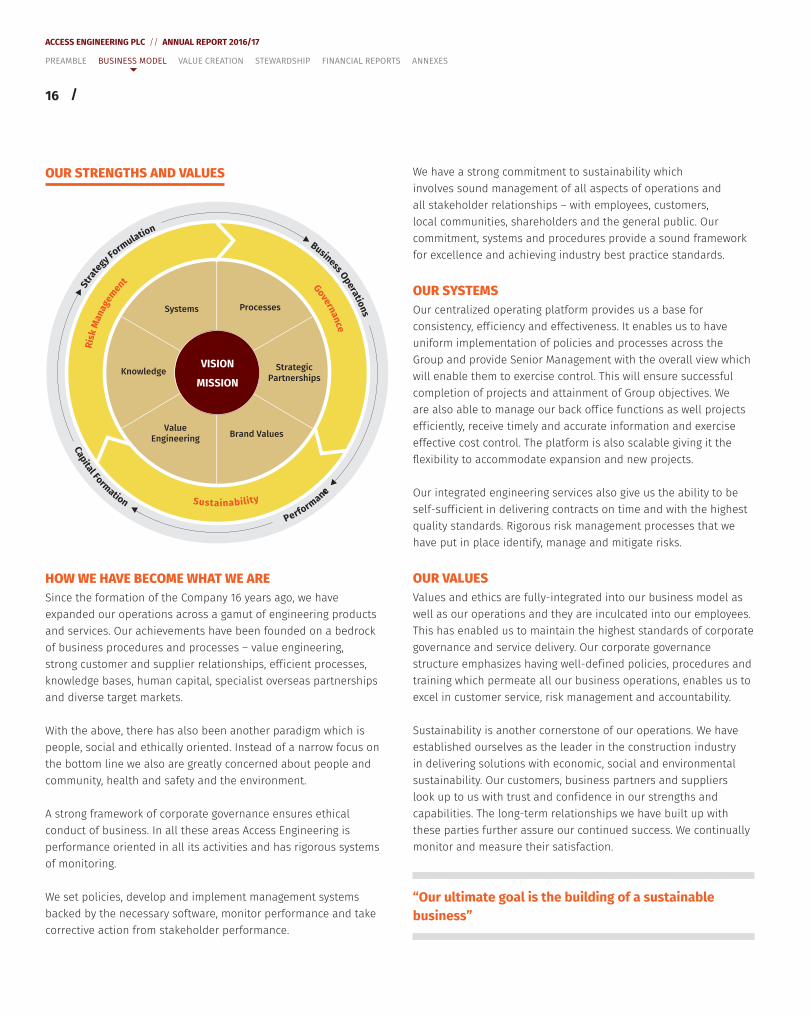
HOW WE HAVE BECOME WHAT WE ARE Since the formation of the Company 16 years ago, we have expanded our operations across a gamut of engineering products and services. Our achievements have been founded on a bedrock of business procedures and processes – value engineering, strong customer and supplier relationships, eff icient processes, knowledge bases, human capital, specialist overseas partnerships and diverse target markets.
With the above, there has also been another paradigm which is people, social and ethically oriented. Instead of a narrow focus on the bottom line we also are greatly concerned about people and community, health and safety and the environment.
A strong framework of corporate governance ensures ethical conduct of business. In all these areas Access Engineering is performance oriented in all its activities and has rigorous systems of monitoring.
We set policies, develop and implement management systems backed by the necessary software, monitor performance and take corrective action from stakeholder performance.
We have a strong commitment to sustainability which involves sound management of all aspects of operations and all stakeholder relationships – with employees, customers, local communities, shareholders and the general public. Our commitment, systems and procedures provide a sound framework for excellence and achieving industry best practice standards.
OUR SYSTEMS Our centralized operating platform provides us a base for consistency, eff iciency and effectiveness. It enables us to have uniform implementation of policies and processes across the Group and provide Senior Management with the overall view which will enable them to exercise control. This will ensure successful completion of projects and attainment of Group objectives. We are also able to manage our back off ice functions as well projects eff iciently, receive timely and accurate information and exercise effective cost control. The platform is also scalable giving it the flexibility to accommodate expansion and new projects.
Our integrated engineering services also give us the ability to be self-suff icient in delivering contracts on time and with the highest quality standards. Rigorous risk management processes that we have put in place identify, manage and mitigate risks.
OUR VALUES Values and ethics are fully-integrated into our business model as well as our operations and they are inculcated into our employees. This has enabled us to maintain the highest standards of corporate governance and service delivery. Our corporate governance structure emphasizes having well-def ined policies, procedures and training which permeate all our business operations, enables us to excel in customer service, risk management and accountability.
Sustainability is another cornerstone of our operations. We have established ourselves as the leader in the construction industry in delivering solutions with economic, social and environmental sustainability. Our customers, business partners and suppliers look up to us with trust and conf idence in our strengths and capabilities. The long-term relationships we have built up with these parties further assure our continued success. We continually monitor and measure their satisfaction.
“Our ultimate goal is the building of a sustainable business”
PREAMBLE BUSINESS MODEL VALUE CREATION STEWARDSHIP FINANCIAL REPORTS ANNEXES
17
ACCESS ENGINEERING PLC // ANNUAL REPORT 2016/17
/
KEY OUTPUTSTo guarantee our continued growth and stability we strive for healthy prof itability with a stable cash flow. While this enables us to provide an attractive return to our shareholders we can also invest for future growth. We can also maintain a strong capital structure and the conf idence of investors, both in debt and equity markets.
We are always conscious that our physical assets and past record will not alone bring results; it is imperative that we recruit, retain and develop skilled, competent, dedicated and motivated people. They need to be committed to giving the maximum satisfaction to our customers by way of sustainable, cost effective and high quality products and services.
We do not stint on necessary training and we seek to ensure that our staff across all business units are imparted the skills and knowledge they require. We also foster the sharing of knowledge, expertise and experience across organizational boundaries and build up repositories of knowledge. We also give the highest
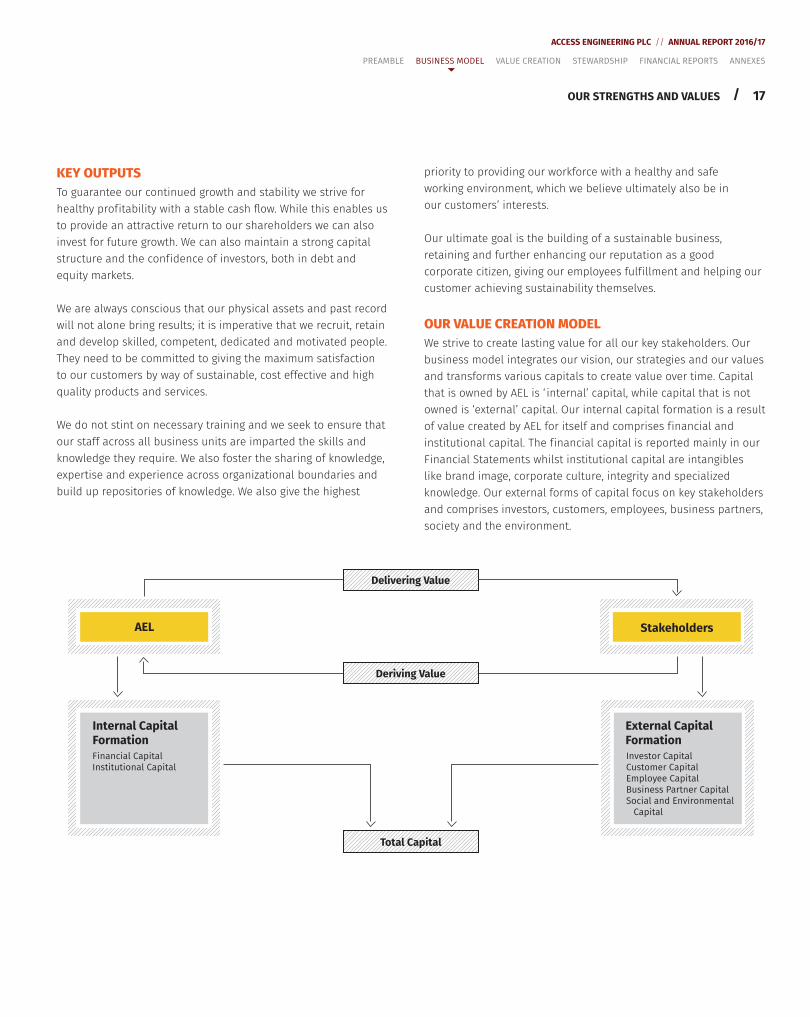
Delivering Value
AEL Stakeholders
Internal CapitalFormationFinancial CapitalInstitutional Capital
External CapitalFormationInvestor CapitalCustomer CapitalEmployee CapitalBusiness Partner CapitalSocial and Environmental
Capital
Deriving Value
Total Capital
priority to providing our workforce with a healthy and safe working environment, which we believe ultimately also be in our customers’ interests.
Our ultimate goal is the building of a sustainable business, retaining and further enhancing our reputation as a good corporate citizen, giving our employees fulf illment and helping our customer achieving sustainability themselves.
OUR VALUE CREATION MODELWe strive to create lasting value for all our key stakeholders. Our business model integrates our vision, our strategies and our values and transforms various capitals to create value over time. Capital that is owned by AEL is ‘ internal’ capital, while capital that is not owned is ‘external’ capital. Our internal capital formation is a result of value created by AEL for itself and comprises f inancial and institutional capital. The f inancial capital is reported mainly in our Financial Statements whilst institutional capital are intangibles like brand image, corporate culture, integrity and specialized knowledge. Our external forms of capital focus on key stakeholders and comprises investors, customers, employees, business partners, society and the environment.
OUR STRENGTHS AND VALUES
PREAMBLE BUSINESS MODEL VALUE CREATION STEWARDSHIP FINANCIAL REPORTS ANNEXES
18 /
ACCESS ENGINEERING PLC // ANNUAL REPORT 2016/17
STAKEHOLDER ENGAGEMENT AND MATERIALITY
STAKEHOLDER ENGAGEMENTBalancing the short and long-term is always a major management challenge. Taken in the context of sustainable development it is paramount that we need to engage with internal as well as external stakeholders. We need to proactively identify their needs and expectations to f ind out how best we could integrate their concerns into our decision-making process. For instance, we are always mindful of the fact that our operations can adversely impact local communities. We strive to adapt our policies and practices to their needs and concerns within the framework of our overall strategy.
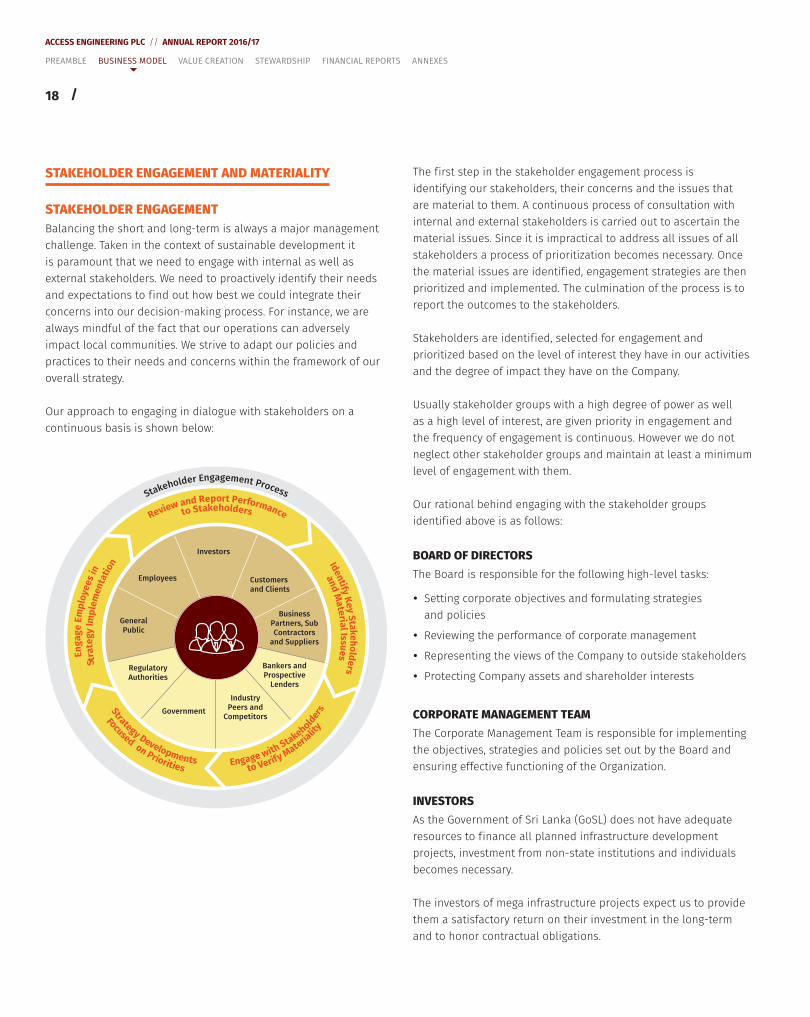
Our approach to engaging in dialogue with stakeholders on a continuous basis is shown below:
Stakeholder Engagement Process
to StakeholdersReview and Report Performance
and
Ma
teria
lI ssu
es
Iden
tifyK
ey
Sta
ke
ho
lde
rs
En
ga
ge
Em
plo
yee
sin
Investors
Employees
GeneralPublic
RegulatoryAuthorities
Government
IndustryPeers and
Competitors
Bankers andProspective
Lenders
BusinessPartners, SubContractors
and Suppliers
Customersand Clients
The f irst step in the stakeholder engagement process is identifying our stakeholders, their concerns and the issues that are material to them. A continuous process of consultation with internal and external stakeholders is carried out to ascertain the material issues. Since it is impractical to address all issues of all stakeholders a process of prioritization becomes necessary. Once the material issues are identif ied, engagement strategies are then prioritized and implemented. The culmination of the process is to report the outcomes to the stakeholders.
Stakeholders are identif ied, selected for engagement and prioritized based on the level of interest they have in our activities and the degree of impact they have on the Company.
Usually stakeholder groups with a high degree of power as well as a high level of interest, are given priority in engagement and the frequency of engagement is continuous. However we do not neglect other stakeholder groups and maintain at least a minimum level of engagement with them.
Our rational behind engaging with the stakeholder groups identif ied above is as follows:
BOARD OF DIRECTORSThe Board is responsible for the following high-level tasks:
y Setting corporate objectives and formulating strategies and policies
y Reviewing the performance of corporate management
y Representing the views of the Company to outside stakeholders
y Protecting Company assets and shareholder interests
CORPORATE MANAGEMENT TEAMThe Corporate Management Team is responsible for implementing the objectives, strategies and policies set out by the Board and ensuring effective functioning of the Organization.
INVESTORSAs the Government of Sri Lanka (GoSL) does not have adequate resources to f inance all planned infrastructure development projects, investment from non-state institutions and individuals becomes necessary.
The investors of mega infrastructure projects expect us to provide them a satisfactory return on their investment in the long-term and to honor contractual obligations.
PREAMBLE BUSINESS MODEL VALUE CREATION STEWARDSHIP FINANCIAL REPORTS ANNEXES
19
ACCESS ENGINEERING PLC // ANNUAL REPORT 2016/17
/
SHAREHOLDERSShareholders provide equity capital and approve/reject Company strategic decisions while expecting a reasonable return on their investment. They also expect us to keep them periodically informed about the development of our Company, our key f inancial f igures and our long-term business strategy/direction. The shareholders expect us, as the custodians of their wealth, to build a growing and sustainable business while being a good corporate citizen. The long-term strategy of AEL is to increase its market value to shareholders.
BANKERS AND PROSPECTIVE LENDERSBanks play a major role in the following areas:
y Financing infrastructure development projects of the country
y Processing day-to-day monetary transactions of the Company
y Providing funding arrangements enabling effective working capital management
y Providing investment opportunities through accepting deposits
EMPLOYEESThe industry we operate-in is highly labor intensive. Thus to remain competitive in the market we need to have the best talent pool and human capital in the industry. A fully-engaged workforce that is highly satisf ied will go an extra mile for the benef it of the Company to achieve its goals and objectives. We also need to provide the necessary training to ensure that our employees have the necessary skills and competencies.
In return for their commitment the employees expect us to provide them with a safe working environment, equal opportunities, individual career growth, opportunities for training and development, reward their performance and to promote work-life balance.
Similarly our vision towards sustainability is driven by our employees, who need the most up-to-date information to make a valuable and informed contribution. We need to have the transparency to achieve this end.
GOVERNMENT AND REGULATORY AUTHORITIESMaintaining cordial relationships with GoSL is very important to the Company since most infrastructure projects are initiated by the Government. Thus building conf idence and maintaining good relationships is paramount to business operations and our continuity.
STAKEHOLDER ENGAGEMENT AND MATERIALITY
PREAMBLE BUSINESS MODEL VALUE CREATION STEWARDSHIP FINANCIAL REPORTS ANNEXES
The Government expects us to create direct and indirect employment opportunities, engage in investment opportunities and drive economic growth while complying with all laws and regulations. We act as a source of revenue to the Government by paying direct taxes and channeling indirect taxes.
Regulatory authorities play a vital role in approving and reviewing completed, ongoing and future infrastructure development projects. They also expect us to fully comply with all rules and regulations and transparency in all our operations helps gain their conf idence.
CLIENTS AND CUSTOMERSWe need to gain the conf idence of clients and maintain cordial relationships with them to obtain repeat orders. Similarly client satisfaction through effective project implementation is important in securing future business. Hence effective client interaction is one of the most important factors of our success.
We also carry out a substantial amount of engineering projects and services at the client’s premises and need customers to continually subscribe to our engineering products and services in order to generate business.
SUPPLIERS INCLUDING SUBCONTRACTORSConstruction industry is heavily dependent on raw material and, therefore, suppliers play a key role in the achievement of business objectives and timely completion of projects. While enabling us to deliver innovative value engineering solutions to various clients they also help us to make our processes more eff icient and maintain quality standards. When we hire subcontractors, we require them to be capable of carrying out work in an uninterrupted manner, be trustworthy, competitive in terms of prices, quality of service offered in addition to being flexible, easy to communicate with, having a good past track record and adhering to ethical conduct.
In carrying out our projects and services they in turn expect us to build progressive long-term relationships while honoring all contractual obligations.
PRINCIPALS AND BUSINESS PARTNERSFor us to be a leader in knowledge-based value engineering, we need to liaise with companies specializing in particular areas enabling a valuable knowledge transfer process. They also collectively expect us to safeguard their interests honoring our obligation on time while building progressive sustainable relationships.
20 /
ACCESS ENGINEERING PLC // ANNUAL REPORT 2016/17
STAKEHOLDER ENGAGEMENT AND MATERIALITY
GENERAL PUBLICThe end user of almost all our products, i.e. construction projects, is the general public. Hence they expect us to build infrastructure and provide services that are of high quality and safe to use while being sustainable technically, economically, socially and environmentally. Being a responsible corporate citizen, conscious of our social, cultural and environmental responsibilities and maintaining a positive public image is very important to succeed in this industry. The general public also expects us to create direct and indirect employment generation.
PREAMBLE BUSINESS MODEL VALUE CREATION STEWARDSHIP FINANCIAL REPORTS ANNEXES
INDUSTRY PEERS AND COMPETITORS Fostering and engaging in fair competition while promoting ethical business practices is vital for the development of the industry. By actively participating in various industry initiatives which will uplift the standard of the industry as a whole, we can enhance our reputation among our peers.
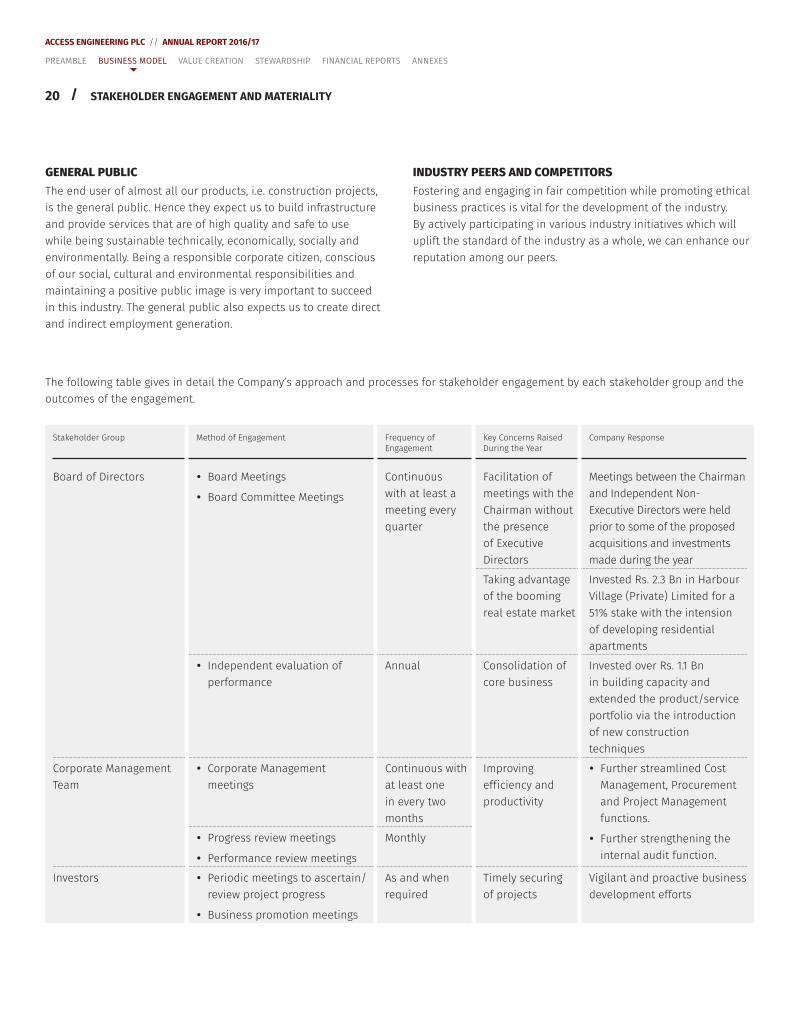
The following table gives in detail the Company’s approach and processes for stakeholder engagement by each stakeholder group and the outcomes of the engagement.
Stakeholder Group Method of Engagement Frequency of Engagement
Key Concerns Raised During the Year
Company Response
Board of Directors y Board Meetings
y Board Committee Meetings
Continuous with at least a meeting every quarter
Facilitation of meetings with the Chairman without the presence of Executive Directors
Meetings between the Chairman and Independent Non-Executive Directors were held prior to some of the proposed acquisitions and investments made during the year
Taking advantage of the booming real estate market
Invested Rs. 2.3 Bn in Harbour Village (Private) Limited for a 51% stake with the intension of developing residential apartments
y Independent evaluation of performance
Annual Consolidation of core business
Invested over Rs. 1.1 Bn in building capacity and extended the product/service portfolio via the introduction of new construction techniques
Corporate Management Team
y Corporate Management meetings
Continuous with at least one in every two months
Improving eff iciency and productivity
y Further streamlined Cost Management, Procurement and Project Management functions.
y Further strengthening the internal audit function.
y Progress review meetings
y Performance review meetings
Monthly
Investors y Periodic meetings to ascertain/review project progress
y Business promotion meetings
As and when required
Timely securing of projects
Vigilant and proactive business development efforts

21
ACCESS ENGINEERING PLC // ANNUAL REPORT 2016/17
/
Stakeholder Group Method of Engagement Frequency of Engagement
Key Concerns Raised During the Year
Company Response
Shareholders y Annual Report and General Meeting
Annual Provision of a monetary return on their investment
Declared Rs. 1 Bn in dividends out of 2016/17 prof its
y Interim Financial Statements Quarterly
y Extraordinary General Meetings As and when required
y Updated website and dedicated investor relations e-mail
y Newspaper articles and other publications
y Road shows and investor forums
y CSE disclosures and announcements
y Research reports of the stock broking community
y Telephone communication
y E-mail and other written correspondence
Continuous Providing up-to-date information about the affairs of the Company
y Press releases featuring every project at three stages of the life cycle commencement, execution and completion), earnings reviews and other publications such as the Annual Integrated Report
y Frequent release of research reports about the Company via stock broker companies
y Participation at investor forums both local and foreign
Bankers and prospective lenders
y Timely settlement of dues
y Providing periodic f inancial information
Continuous Mitigating the negative effects of high interest regime that prevailed during most part of 2016/17
y Negotiated better rates with f inancial institutions
y Strengthened treasury management function y Responding to lenders’ queries As and when
required
Employees y Periodic management-employee meetings
y ‘Open-door’ policy
y Training and development
y Maintaining transparency in all activities
y CSR initiatives
y Staff welfare activities
y AEL News Portal
y Exit interviews
Continuous
Need of recognizing and rewarding high performers
y Continued the performance based reward system
Need to enhance the competence of staff
y Provided training and development opportunities to staff members
STAKEHOLDER ENGAGEMENT AND MATERIALITY
PREAMBLE BUSINESS MODEL VALUE CREATION STEWARDSHIP FINANCIAL REPORTS ANNEXES
22 /
ACCESS ENGINEERING PLC // ANNUAL REPORT 2016/17
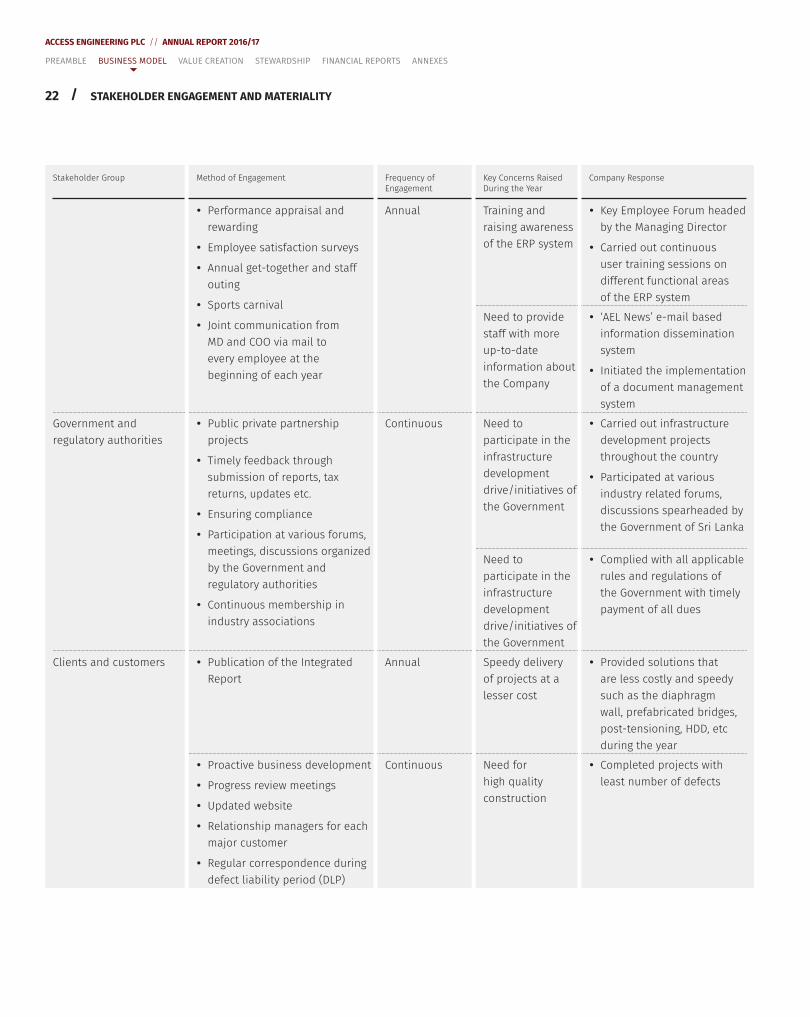
Stakeholder Group Method of Engagement Frequency of Engagement
Key Concerns Raised During the Year
Company Response
y Performance appraisal and rewarding
y Employee satisfaction surveys
y Annual get-together and staff outing
y Sports carnival
y Joint communication from MD and COO via mail to every employee at the beginning of each year
Annual Training and raising awareness of the ERP system
y Key Employee Forum headed by the Managing Director
y Carried out continuous user training sessions on different functional areas of the ERP system
Need to provide staff with more up-to-date information about the Company
y ‘AEL News’ e-mail based information dissemination system
y Initiated the implementation of a document management system
Government and regulatory authorities
y Public private partnership projects
y Timely feedback through submission of reports, tax returns, updates etc.
y Ensuring compliance
y Participation at various forums, meetings, discussions organized by the Government and regulatory authorities
y Continuous membership in industry associations
Continuous Need to participate in the infrastructure development drive/initiatives of the Government
y Carried out infrastructure development projects throughout the country
y Participated at various industry related forums, discussions spearheaded by the Government of Sri Lanka
Need to participate in the infrastructure development drive/initiatives of the Government
y Complied with all applicable rules and regulations of the Government with timely payment of all dues
Clients and customers y Publication of the Integrated Report
Annual Speedy delivery of projects at a lesser cost
y Provided solutions that are less costly and speedy such as the diaphragm wall, prefabricated bridges, post-tensioning, HDD, etc during the year
y Proactive business development
y Progress review meetings
y Updated website
y Relationship managers for each major customer
y Regular correspondence during defect liability period (DLP)
Continuous Need for high quality construction
y Completed projects with least number of defects
STAKEHOLDER ENGAGEMENT AND MATERIALITY
PREAMBLE BUSINESS MODEL VALUE CREATION STEWARDSHIP FINANCIAL REPORTS ANNEXES
23
ACCESS ENGINEERING PLC // ANNUAL REPORT 2016/17
/
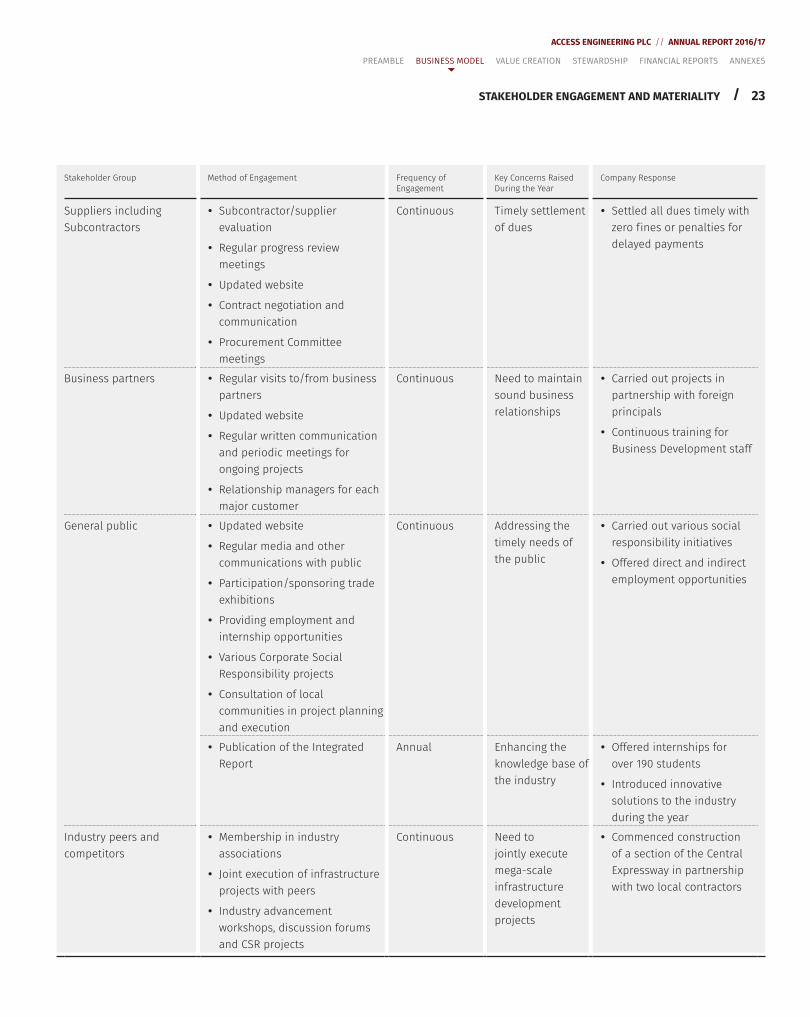
Stakeholder Group Method of Engagement Frequency of Engagement
Key Concerns Raised During the Year
Company Response
Suppliers including Subcontractors
y Subcontractor/supplier evaluation
y Regular progress review meetings
y Updated website
y Contract negotiation and communication
y Procurement Committee meetings
Continuous Timely settlement of dues
y Settled all dues timely with zero f ines or penalties for delayed payments
Business partners y Regular visits to/from business partners
y Updated website
y Regular written communication and periodic meetings for ongoing projects
y Relationship managers for each major customer
Continuous Need to maintain sound business relationships
y Carried out projects in partnership with foreign principals
y Continuous training for Business Development staff
General public y Updated website
y Regular media and other communications with public
y Participation/sponsoring trade exhibitions
y Providing employment and internship opportunities
y Various Corporate Social Responsibility projects
y Consultation of local communities in project planning and execution
Continuous Addressing the timely needs of the public
y Carried out various social responsibility initiatives
y Offered direct and indirect employment opportunities
y Publication of the Integrated Report
Annual Enhancing the knowledge base of the industry
y Offered internships for over 190 students
y Introduced innovative solutions to the industry during the year
Industry peers and competitors
y Membership in industry associations
y Joint execution of infrastructure projects with peers
y Industry advancement workshops, discussion forums and CSR projects
Continuous Need to jointly execute mega-scale infrastructure development projects
y Commenced construction of a section of the Central Expressway in partnership with two local contractors
STAKEHOLDER ENGAGEMENT AND MATERIALITY
PREAMBLE BUSINESS MODEL VALUE CREATION STEWARDSHIP FINANCIAL REPORTS ANNEXES
24 /
ACCESS ENGINEERING PLC // ANNUAL REPORT 2016/17
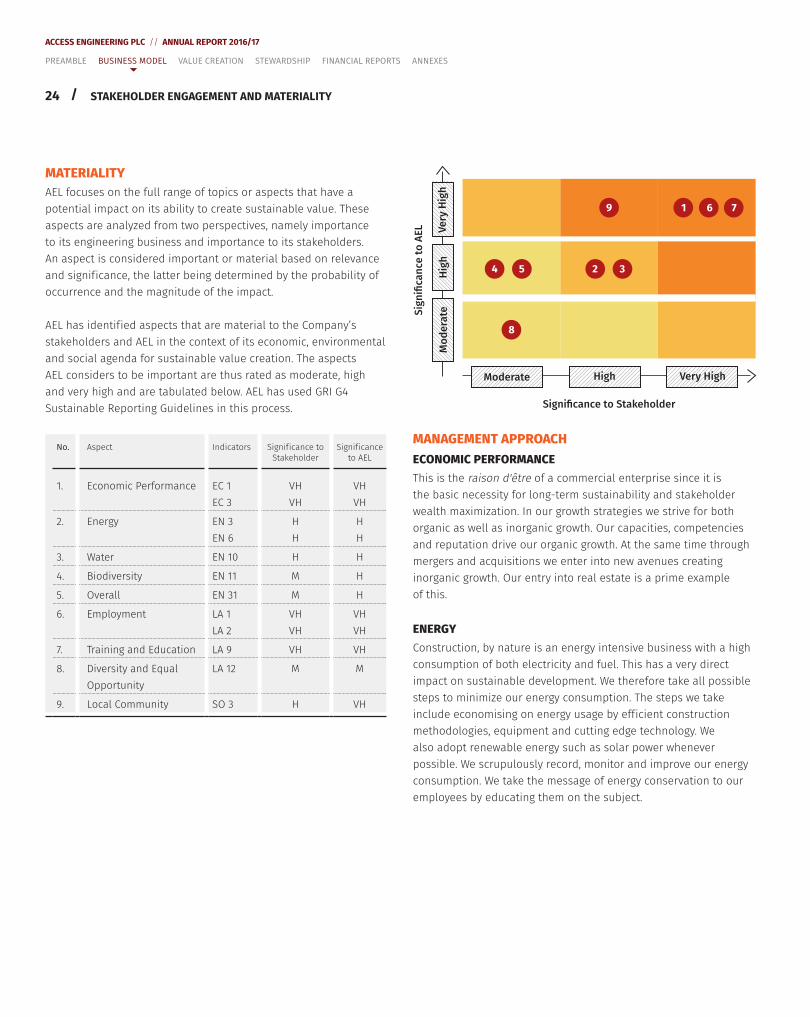
MATERIALITYAEL focuses on the full range of topics or aspects that have a potential impact on its ability to create sustainable value. These aspects are analyzed from two perspectives, namely importance to its engineering business and importance to its stakeholders. An aspect is considered important or material based on relevance and signif icance, the latter being determined by the probability of occurrence and the magnitude of the impact.
AEL has identif ied aspects that are material to the Company’s stakeholders and AEL in the context of its economic, environmental and social agenda for sustainable value creation. The aspects AEL considers to be important are thus rated as moderate, high and very high and are tabulated below. AEL has used GRI G4 Sustainable Reporting Guidelines in this process.
No. Aspect Indicators Signif icance to Stakeholder
Signif icance to AEL
1. Economic Performance EC 1EC 3
VHVH
VHVH
2. Energy EN 3EN 6
HH
HH
3. Water EN 10 H H
4. Biodiversity EN 11 M H
5. Overall EN 31 M H
6. Employment LA 1LA 2
VHVH
VHVH
7. Training and Education LA 9 VH VH
8. Diversity and Equal Opportunity
LA 12 M M
9. Local Community SO 3 H VH
STAKEHOLDER ENGAGEMENT AND MATERIALITY
Sig
nifi
can
ce t
o A
EL
Significance to Stakeholder
High Very High
Ve
ry H
igh
Hig
hM
od
era
te
Moderate
4
1 6 7
5 2 3
9
8
MANAGEMENT APPROACHECONOMIC PERFORMANCEThis is the raison d'être of a commercial enterprise since it is the basic necessity for long-term sustainability and stakeholder wealth maximization. In our growth strategies we strive for both organic as well as inorganic growth. Our capacities, competencies and reputation drive our organic growth. At the same time through mergers and acquisitions we enter into new avenues creating inorganic growth. Our entry into real estate is a prime example of this.
ENERGYConstruction, by nature is an energy intensive business with a high consumption of both electricity and fuel. This has a very direct impact on sustainable development. We therefore take all possible steps to minimize our energy consumption. The steps we take include economising on energy usage by eff icient construction methodologies, equipment and cutting edge technology. We also adopt renewable energy such as solar power whenever possible. We scrupulously record, monitor and improve our energy consumption. We take the message of energy conservation to our employees by educating them on the subject.
PREAMBLE BUSINESS MODEL VALUE CREATION STEWARDSHIP FINANCIAL REPORTS ANNEXES
25
ACCESS ENGINEERING PLC // ANNUAL REPORT 2016/17
/STAKEHOLDER ENGAGEMENT AND MATERIALITY
WATERSimilar to the above, our industry also requires heavy water consumption and also carries the risk of causing serious water contamination. We take stringent measures to minimize both impacts. We budget our water consumption by each project and activity and diligently monitor actual usage against the budget. We also reuse and recycle water whenever practicable and also inculcate the importance of reducing water usage in our employees.
BIODIVERSITYThe nature of our core business has the potential to destroy natural habitats and thereby seriously impact biodiversity. We carry-out several measures to mitigate this impact through the project cycle. Environmental impact assessments are carried out before project commencement. Environmental performance is monitored through the Environmental Management System (EMS); the EMS itself is also externally verif ied. Impacts on biodiversity are periodically reported to the client, as well as being included in project process review meetings. As with all other social and environmental considerations we promote employee awareness on biodiversity conservation too.
EMPLOYMENT AND TRAINING We consider that our most important asset is our people and it is they who enable us to stand out among our competitors. We are and we intend to remain the ‘employer of choice’ in the industry. Our many initiatives in this direction include training and development as well as monetary and non-monetary rewards. We also organize many events to promote the work-life balance of our employees such as sports f iesta, annual trips, Christmas carnivals, and annual get-together.
To excel in the industry we need to ensure that our employees have the necessary knowledge and skills; these need to be constantly upgraded to keep up with changing needs and technologies. We conduct both internal and external training programs and training is given to both staff categories and workers.
DIVERSITY AND EQUAL OPPORTUNITYThe ‘Access Engineering Family’ includes people from various nationalities, races, religions and cultures. We are proud of being an equal opportunity employer and do not discriminate based on gender, age, religion or race. However due to the nature of the work and socio-cultural conditions of Sri Lanka the majority of the workforce is male. However, where the scope of a job permits we endeavor to give employment to as many females as possible. For example, a majority of the design staff is female. We have a strictly performance based reward system based on results of performance appraisals.
LOCAL COMMUNITYConstruction projects by nature have a major impact on local communities, often on rural communities. It is paramount to maintain cordial relationships with them to prevent projects being obstructed by conflicts and delays arising. Among the initiatives we take to maintain good relations are, recruiting from among the people in the area wherever possible; sourcing material, equipment, machinery and other required resources from the locality; executing corporate social responsibility projects (CSR) projects which will benef it local residents; maintaining dialogue with the communities throughout the project.
PREAMBLE BUSINESS MODEL VALUE CREATION STEWARDSHIP FINANCIAL REPORTS ANNEXES
26 /
ACCESS ENGINEERING PLC // ANNUAL REPORT 2016/17
PREAMBLE BUSINESS MODEL VALUE CREATION STEWARDSHIP FINANCIAL REPORTS ANNEXES
VALUE CREATION
FINANCIAL CAPITAL
Increasing shareholders’ wealth through improving Return on Equity (ROE) of the Group is the key strategic focus of the management.
Review of f inancial capital and f inancial performance describes how the Group met this objective by improving net prof it margins through operating eff iciently, effective utilization of assets and optimal capital structure.
REVIEW OF FINANCIAL PERFORMANCEReview of f inancial performance covers aspects of improving the Return on Equity (ROE) via operating eff iciency (Net Prof it Margin) and effective utilization of assets (Asset Turnover).
TURNOVERIn the year under review, Company income increased by 27.4% to Rs. 14,787 Mn (2015/16: Rs. 11,604 Mn).
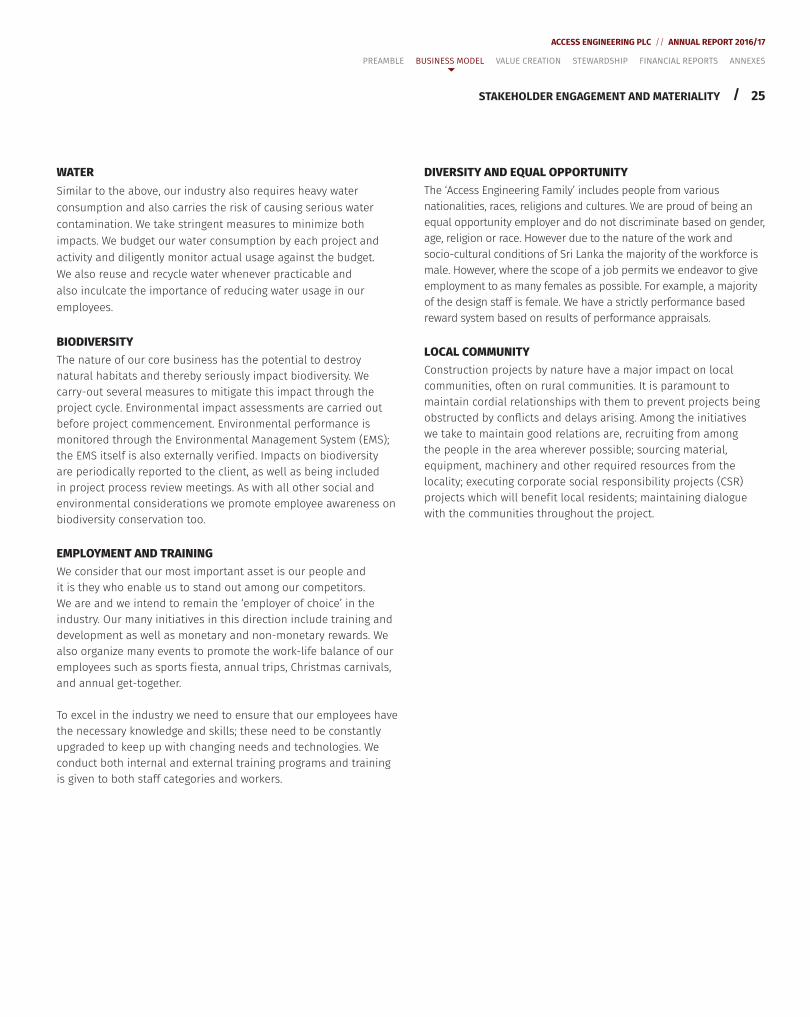
Group revenue increased by 16% to Rs. 20,448 Mn (2015/16: Rs. 17,625 Mn) with primary contributions from the construction 63%, automobile 26%, property 1% and the construction-related material 11%.
Construction
Property Automobile
Construction-Related Material
67%9%
1%
23%
SEGMENT REVENUE
63%11%
1%
25%
2016/17
2015/16
“In the year under review, Company and Group turnover increased by 27.4% and 16% respectively”
Construction segment witnessed a revenue growth of (+8.75%), primarily due to revenue increase of bridge construction segment to Rs. 1,414 Mn (2015/16: Rs. 16 Mn) mainly with new flyover projects.
Construction-related materials increased by 37.11% YoY mainly with the positive contribution from asphalt plants and concrete batching plants. The Second highest amount for the overall increase in Group revenue was contributed by the automobile segment revenue (29.19% YoY) which operates under 84.42% owned subsidiary of Sathosa Motors PLC.
CONSOLIDATED REVENUE
Rs. Mn
25,000
20,000
15,000
10,000
5,000
0
2014/152014/15 2015/16 2016/17
Water and Drainage Construction
Building and Other Construction
Hiring Income
Consultancy Service Income
Service Charges
Highways Construction
Bridge Construction
Construction-Related Material
Fabrication Income
Rental Income
Automobile
The following table provides a comparison of segment and Group turnover:
Business Domain 2016/17 Rs. Mn
2015/16 Rs. Mn
Change%
Construction 12,866 11,831 8.75
Construction-related Material 2,170 1,583 37.08
Property 183 163 12.27
Automobile 5,230 4,048 29.19
Group Turnover 20,448 17,625 16.02
27
ACCESS ENGINEERING PLC // ANNUAL REPORT 2016/17
/
PREAMBLE BUSINESS MODEL VALUE CREATION STEWARDSHIP FINANCIAL REPORTS ANNEXES
FINANCIAL CAPITAL
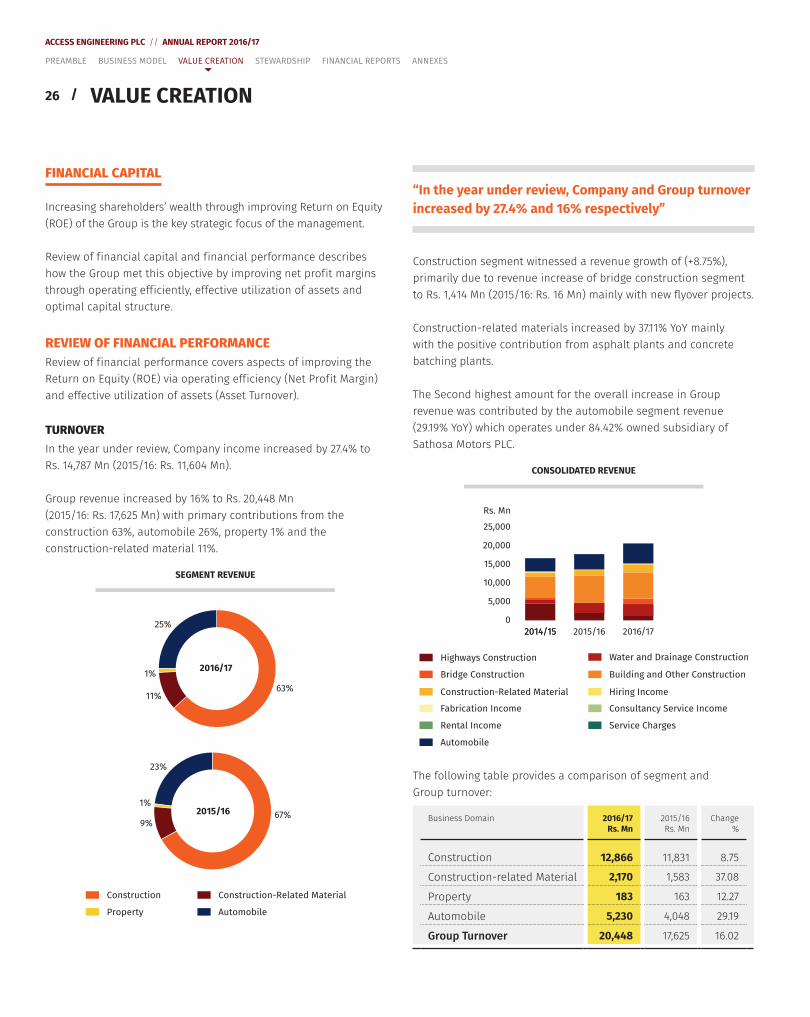
PROFITABILITYIn the year under review the Group overall gross prof it margin remained stable at 23.1% (2015/16: 22.6%) despite the (-8%) slight reduction of gross prof it margin of the automobile segment which was offset with the increase in Company turnover along with stable Company gross prof it margin of 23% (2015/16: 22.1%).
The Group gross prof it however increased by 19% to Rs. 4,732 Mn from Rs. 3,977 Mn the previous year.
The marginal gain (+0.5%) of the Group gross prof it margin did not flow through to the operating prof it (EBIT) mainly due to the Rs. 279 Mn increase in administrative expenses which accounted for -7.7% of the Group turnover 2016/17. (2015/16: -7.3% of turnover).
But the Company operating margins improved from 19% in 2015/16 to 21% with the contribution given by other income and control of the increase of the administration expenses aligned with the turnover (2016/17: -4.8% of turnover; 2015/16: -4.8% of turnover) in addition to growth of Company turnover.
The Company recorded other income amounting to Rs. 478 Mn, a growth rate of 90% YoY mainly due to the recorded signif icant dividend income growth of 242% during the year on account of Rs. 151 Mn and Rs. 82 Mn increase in the dividends declared by its fully-owned subsidiary of Access Realties and 84.42% owned subsidiary Sathosa Motors PLC respectively.
EBITDA
30
24
18
12
6
0
2015/16 2016/17
%Rs. Mn
5,000
4,000
3,000
2,000
1,000
0
2014/15
Group EBITDA (Rs. Mn)
Company EBITDA (Rs. Mn) Company EBITDA Margin (%)
Group EBITDA Margin (%)
“Gross prof it margin remains stable at 23%”
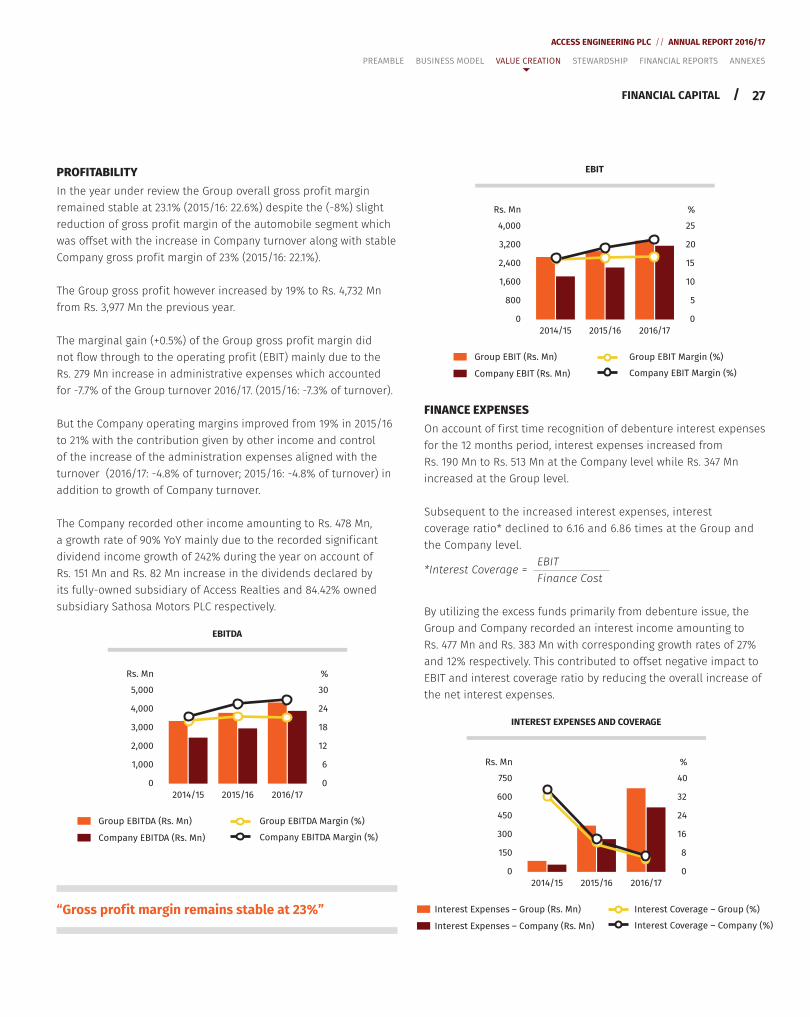
EBIT
25
20
15
10
5
0
2015/16 2016/17
%Rs. Mn
4,000
3,200
2,400
1,600
800
0
2014/15
Group EBIT (Rs. Mn)
Company EBIT (Rs. Mn) Company EBIT Margin (%)
Group EBIT Margin (%)
FINANCE EXPENSESOn account of f irst time recognition of debenture interest expenses for the 12 months period, interest expenses increased from Rs. 190 Mn to Rs. 513 Mn at the Company level while Rs. 347 Mn increased at the Group level.
Subsequent to the increased interest expenses, interest coverage ratio* declined to 6.16 and 6.86 times at the Group and the Company level.
*Interest Coverage = EBIT
Finance Cost
By utilizing the excess funds primarily from debenture issue, the Group and Company recorded an interest income amounting to Rs. 477 Mn and Rs. 383 Mn with corresponding growth rates of 27% and 12% respectively. This contributed to offset negative impact to EBIT and interest coverage ratio by reducing the overall increase of the net interest expenses.
INTEREST EXPENSES AND COVERAGE
40
32
24
16
8
0
2015/16 2016/17
%Rs. Mn
750
600
450
300
150
0
2014/15
Interest Expenses – Group (Rs. Mn)
Interest Expenses – Company (Rs. Mn) Interest Coverage – Company (%)
Interest Coverage – Group (%)
28 /
ACCESS ENGINEERING PLC // ANNUAL REPORT 2016/17
TAXATIONThe effective tax rates for 2016/17 remained at 15% and 11% respectively at the Group and the Company levels, same as those in 2015/16. However, Group tax expenses increased by 9% partly contributed by increased Dividend Tax while Company Tax expenses increased by 19% YoY partly contributed by increased deferred tax provision.
During the f inancial year 2016/17 the Company and its 80% owned subsidiary Access Projects (Private) Limited continued to enjoy a concessionary tax rate on construction income of 12%. Similarly prof its attributable to manufacturing of construction-related material of the Company are exempted from income tax, commencing from year of assessment 2011/12 for a period of seven years. The Company’s fully-owned subsidiary Access Realties (Private) Limited is taxed at 2% on revenue while Sathosa Motors PLC is taxed at 28%.
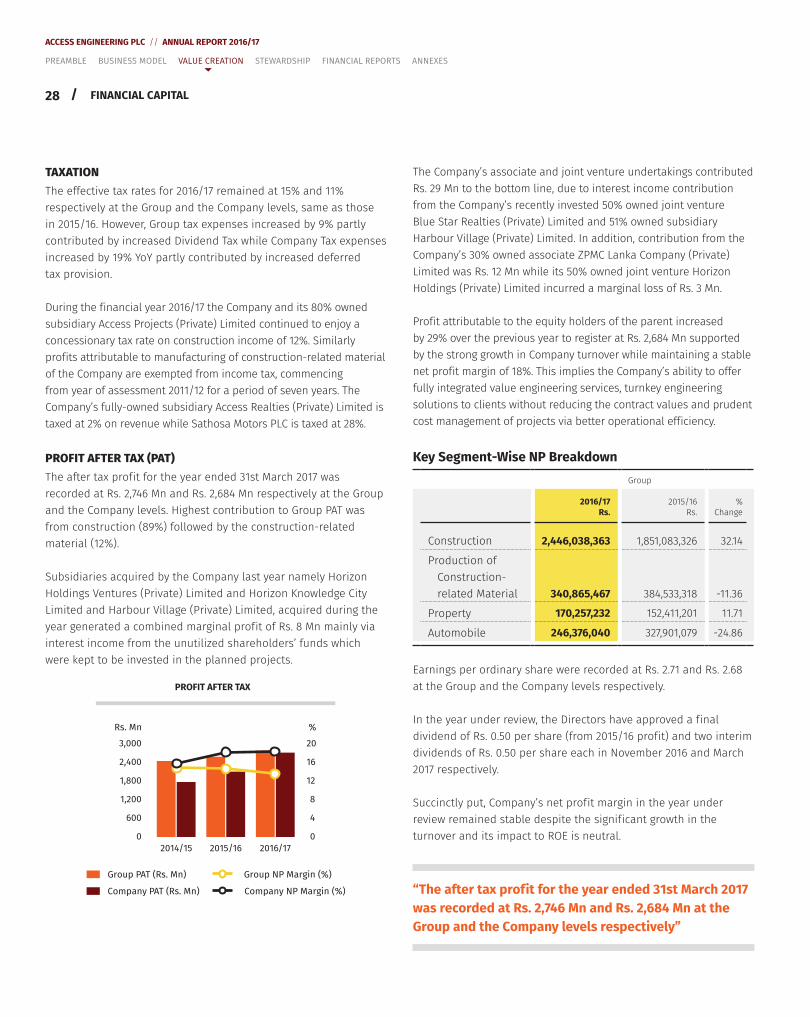
PROFIT AFTER TAX (PAT)The after tax prof it for the year ended 31st March 2017 was recorded at Rs. 2,746 Mn and Rs. 2,684 Mn respectively at the Group and the Company levels. Highest contribution to Group PAT was from construction (89%) followed by the construction-related material (12%).
Subsidiaries acquired by the Company last year namely Horizon Holdings Ventures (Private) Limited and Horizon Knowledge City Limited and Harbour Village (Private) Limited, acquired during the year generated a combined marginal prof it of Rs. 8 Mn mainly via interest income from the unutilized shareholders’ funds which were kept to be invested in the planned projects.
PROFIT AFTER TAX
20
16
12
8
4
0
2015/16 2016/17
%Rs. Mn
3,000
2,400
1,800
1,200
600
0
2014/15
Group PAT (Rs. Mn)
Company PAT (Rs. Mn) Company NP Margin (%)
Group NP Margin (%)
The Company’s associate and joint venture undertakings contributed Rs. 29 Mn to the bottom line, due to interest income contribution from the Company’s recently invested 50% owned joint venture Blue Star Realties (Private) Limited and 51% owned subsidiary Harbour Village (Private) Limited. In addition, contribution from the Company’s 30% owned associate ZPMC Lanka Company (Private) Limited was Rs. 12 Mn while its 50% owned joint venture Horizon Holdings (Private) Limited incurred a marginal loss of Rs. 3 Mn.
Prof it attributable to the equity holders of the parent increased by 29% over the previous year to register at Rs. 2,684 Mn supported by the strong growth in Company turnover while maintaining a stable net prof it margin of 18%. This implies the Company’s ability to offer fully integrated value engineering services, turnkey engineering solutions to clients without reducing the contract values and prudent cost management of projects via better operational eff iciency.
Key Segment-Wise NP BreakdownGroup
2016/17 Rs.
2015/16 Rs.
% Change
Construction 2,446,038,363 1,851,083,326 32.14
Production of Construction- related Material 340,865,467 384,533,318 -11.36
Property 170,257,232 152,411,201 11.71
Automobile 246,376,040 327,901,079 -24.86
Earnings per ordinary share were recorded at Rs. 2.71 and Rs. 2.68 at the Group and the Company levels respectively.
In the year under review, the Directors have approved a f inal dividend of Rs. 0.50 per share (from 2015/16 prof it) and two interim dividends of Rs. 0.50 per share each in November 2016 and March 2017 respectively.
Succinctly put, Company’s net prof it margin in the year under review remained stable despite the signif icant growth in the turnover and its impact to ROE is neutral.
“The after tax prof it for the year ended 31st March 2017 was recorded at Rs. 2,746 Mn and Rs. 2,684 Mn at the Group and the Company levels respectively”
FINANCIAL CAPITAL
PREAMBLE BUSINESS MODEL VALUE CREATION STEWARDSHIP FINANCIAL REPORTS ANNEXES
29
ACCESS ENGINEERING PLC // ANNUAL REPORT 2016/17
/
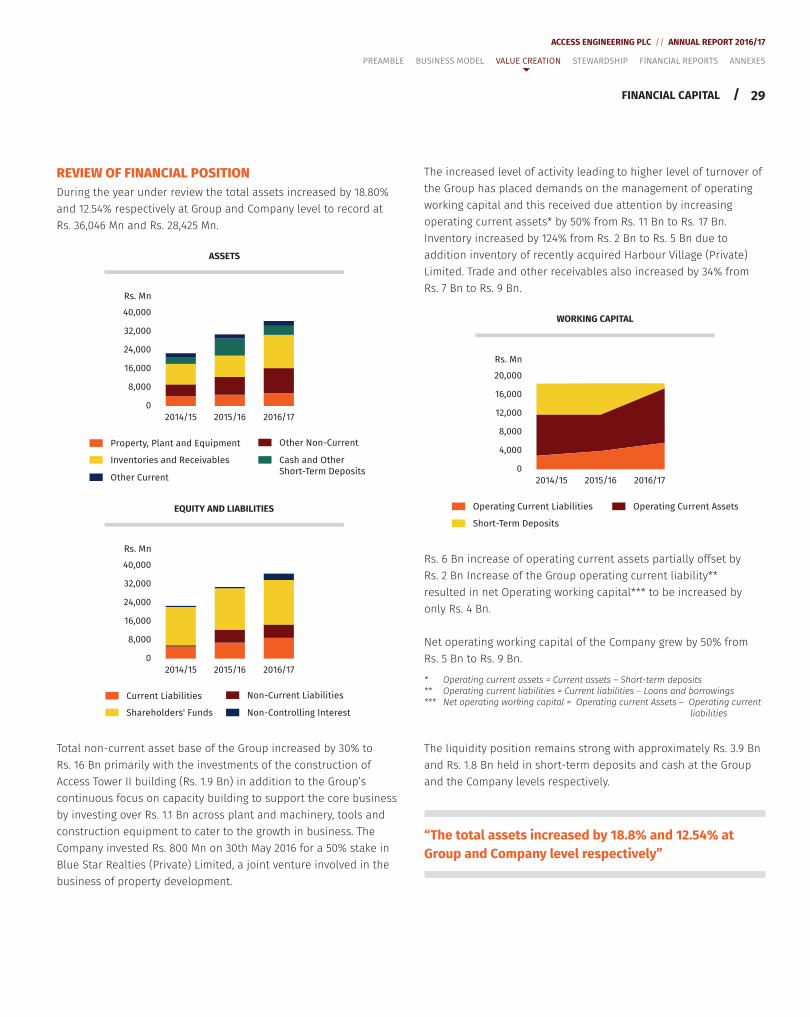
REVIEW OF FINANCIAL POSITIONDuring the year under review the total assets increased by 18.80% and 12.54% respectively at Group and Company level to record at Rs. 36,046 Mn and Rs. 28,425 Mn.
ASSETS
Rs. Mn
40,000
32,000
24,000
16,000
8,000
0
2014/15 2015/16 2016/17
Other Non-Current
Cash and OtherShort-Term Deposits
Property, Plant and Equipment
Inventories and Receivables
Other Current
EQUITY AND LIABILITIES
Rs. Mn
40,000
32,000
24,000
16,000
8,000
0
2014/15 2015/16 2016/17
Non-Current Liabilities
Non-Controlling Interest
Current Liabilities
Shareholders' Funds
Total non-current asset base of the Group increased by 30% to Rs. 16 Bn primarily with the investments of the construction of Access Tower II building (Rs. 1.9 Bn) in addition to the Group’s continuous focus on capacity building to support the core business by investing over Rs. 1.1 Bn across plant and machinery, tools and construction equipment to cater to the growth in business. The Company invested Rs. 800 Mn on 30th May 2016 for a 50% stake in Blue Star Realties (Private) Limited, a joint venture involved in the business of property development.
The increased level of activity leading to higher level of turnover of the Group has placed demands on the management of operating working capital and this received due attention by increasing operating current assets* by 50% from Rs. 11 Bn to Rs. 17 Bn. Inventory increased by 124% from Rs. 2 Bn to Rs. 5 Bn due to addition inventory of recently acquired Harbour Village (Private) Limited. Trade and other receivables also increased by 34% from Rs. 7 Bn to Rs. 9 Bn.
WORKING CAPITAL
Rs. Mn
20,000
16,000
12,000
8,000
4,000
0
2014/15 2015/16 2016/17
Operating Current Liabilities
Short-Term Deposits
Operating Current Assets
Rs. 6 Bn increase of operating current assets partially offset by Rs. 2 Bn Increase of the Group operating current liability** resulted in net Operating working capital*** to be increased by only Rs. 4 Bn.
Net operating working capital of the Company grew by 50% from Rs. 5 Bn to Rs. 9 Bn.
* Operating current assets = Current assets – Short-term deposits** Operating current liabilities = Current liabilities – Loans and borrowings*** Net operating working capital = Operating current Assets – Operating current liabilities
The liquidity position remains strong with approximately Rs. 3.9 Bn and Rs. 1.8 Bn held in short-term deposits and cash at the Group and the Company levels respectively.
“The total assets increased by 18.8% and 12.54% at Group and Company level respectively”
FINANCIAL CAPITAL
PREAMBLE BUSINESS MODEL VALUE CREATION STEWARDSHIP FINANCIAL REPORTS ANNEXES
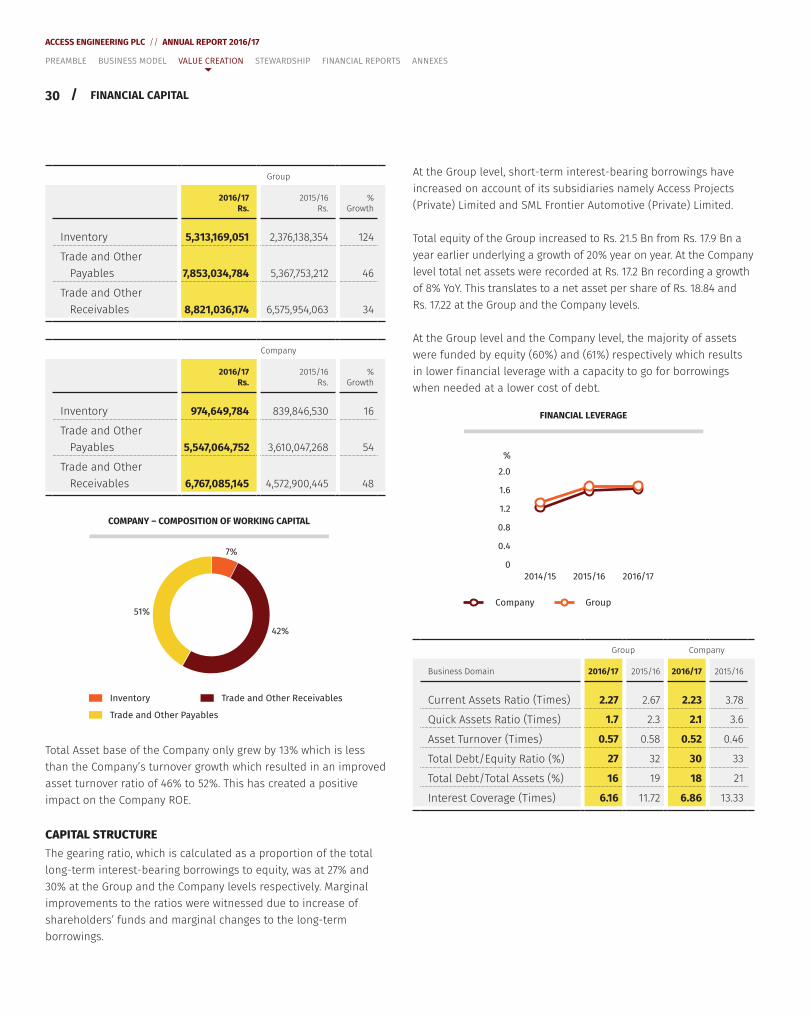
30 /
ACCESS ENGINEERING PLC // ANNUAL REPORT 2016/17
Group
2016/17 Rs.
2015/16 Rs.
% Growth
Inventory 5,313,169,051 2,376,138,354 124
Trade and Other Payables 7,853,034,784 5,367,753,212 46
Trade and Other Receivables 8,821,036,174 6,575,954,063 34
Company
2016/17 Rs.
2015/16 Rs.
% Growth
Inventory 974,649,784 839,846,530 16
Trade and Other Payables 5,547,064,752 3,610,047,268 54
Trade and Other Receivables 6,767,085,145 4,572,900,445 48
Inventory
Trade and Other Payables
Trade and Other Receivables
COMPANY – COMPOSITION OF WORKING CAPITAL
7%
42%
51%
Total Asset base of the Company only grew by 13% which is less than the Company’s turnover growth which resulted in an improved asset turnover ratio of 46% to 52%. This has created a positive impact on the Company ROE.
CAPITAL STRUCTUREThe gearing ratio, which is calculated as a proportion of the total long-term interest-bearing borrowings to equity, was at 27% and 30% at the Group and the Company levels respectively. Marginal improvements to the ratios were witnessed due to increase of shareholders’ funds and marginal changes to the long-term borrowings.
At the Group level, short-term interest-bearing borrowings have increased on account of its subsidiaries namely Access Projects (Private) Limited and SML Frontier Automotive (Private) Limited.
Total equity of the Group increased to Rs. 21.5 Bn from Rs. 17.9 Bn a year earlier underlying a growth of 20% year on year. At the Company level total net assets were recorded at Rs. 17.2 Bn recording a growth of 8% YoY. This translates to a net asset per share of Rs. 18.84 and Rs. 17.22 at the Group and the Company levels.
At the Group level and the Company level, the majority of assets were funded by equity (60%) and (61%) respectively which results in lower f inancial leverage with a capacity to go for borrowings when needed at a lower cost of debt.
FINANCIAL LEVERAGE
%
2.0
1.6
1.2
0.8
0.4
0
2014/15 2015/16 2016/17
GroupCompany
Group Company
Business Domain 2016/17 2015/16 2016/17 2015/16
Current Assets Ratio (Times) 2.27 2.67 2.23 3.78
Quick Assets Ratio (Times) 1.7 2.3 2.1 3.6
Asset Turnover (Times) 0.57 0.58 0.52 0.46
Total Debt/Equity Ratio (%) 27 32 30 33
Total Debt/Total Assets (%) 16 19 18 21
Interest Coverage (Times) 6.16 11.72 6.86 13.33
FINANCIAL CAPITAL
PREAMBLE BUSINESS MODEL VALUE CREATION STEWARDSHIP FINANCIAL REPORTS ANNEXES
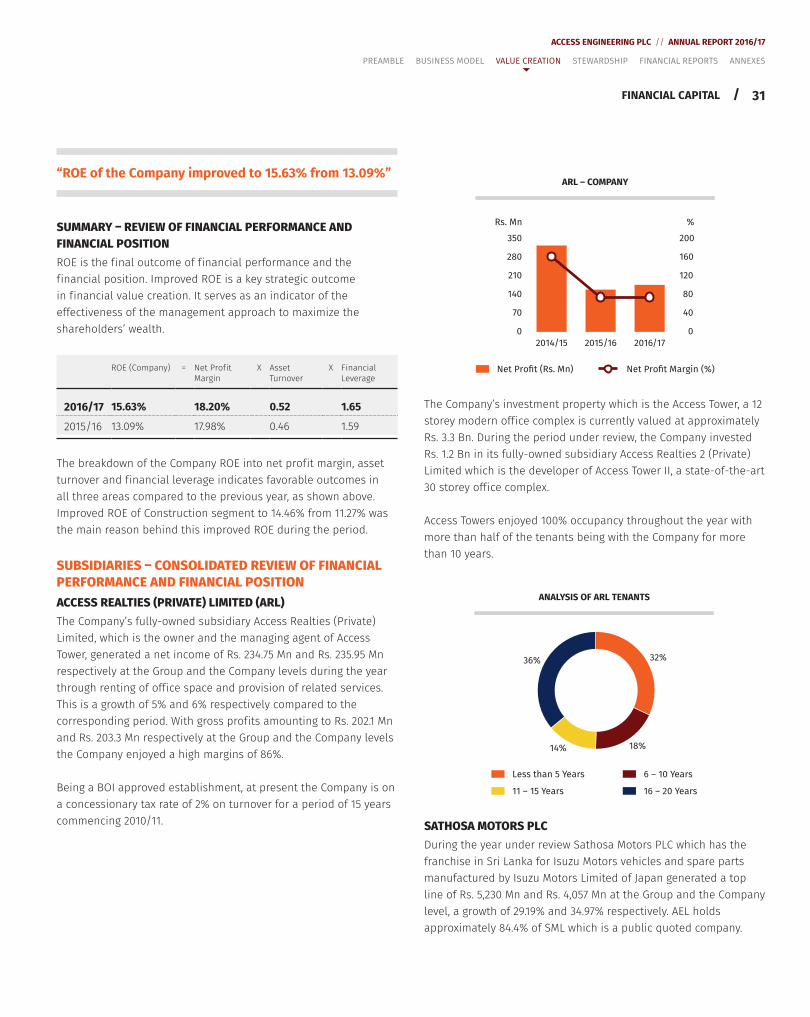
31
ACCESS ENGINEERING PLC // ANNUAL REPORT 2016/17
/
“ROE of the Company improved to 15.63% from 13.09%”
SUMMARY – REVIEW OF FINANCIAL PERFORMANCE AND FINANCIAL POSITIONROE is the f inal outcome of f inancial performance and the f inancial position. Improved ROE is a key strategic outcome in f inancial value creation. It serves as an indicator of the effectiveness of the management approach to maximize the shareholders’ wealth.
ROE (Company) = Net Prof it Margin
X Asset Turnover
X Financial Leverage
2016/17 15.63% 18.20% 0.52 1.65
2015/16 13.09% 17.98% 0.46 1.59
The breakdown of the Company ROE into net prof it margin, asset turnover and f inancial leverage indicates favorable outcomes in all three areas compared to the previous year, as shown above. Improved ROE of Construction segment to 14.46% from 11.27% was the main reason behind this improved ROE during the period.
SUBSIDIARIES – CONSOLIDATED REVIEW OF FINANCIAL PERFORMANCE AND FINANCIAL POSITIONACCESS REALTIES (PRIVATE) LIMITED (ARL)The Company’s fully-owned subsidiary Access Realties (Private) Limited, which is the owner and the managing agent of Access Tower, generated a net income of Rs. 234.75 Mn and Rs. 235.95 Mn respectively at the Group and the Company levels during the year through renting of off ice space and provision of related services. This is a growth of 5% and 6% respectively compared to the corresponding period. With gross prof its amounting to Rs. 202.1 Mn and Rs. 203.3 Mn respectively at the Group and the Company levels the Company enjoyed a high margins of 86%.
Being a BOI approved establishment, at present the Company is on a concessionary tax rate of 2% on turnover for a period of 15 years commencing 2010/11.
ARL – COMPANY
Rs. Mn
350
280
210
140
70
0
200
160
120
80
40
0
2014/15 2015/16 2016/17
%
Net Profit (Rs. Mn) Net Profit Margin (%)
The Company’s investment property which is the Access Tower, a 12 storey modern off ice complex is currently valued at approximately Rs. 3.3 Bn. During the period under review, the Company invested Rs. 1.2 Bn in its fully-owned subsidiary Access Realties 2 (Private) Limited which is the developer of Access Tower II, a state-of-the-art 30 storey off ice complex.
Access Towers enjoyed 100% occupancy throughout the year with more than half of the tenants being with the Company for more than 10 years.
18%
36%
14%
32%
ANALYSIS OF ARL TENANTS
Less than 5 Years
11 – 15 Years 16 – 20 Years
6 – 10 Years
SATHOSA MOTORS PLCDuring the year under review Sathosa Motors PLC which has the franchise in Sri Lanka for Isuzu Motors vehicles and spare parts manufactured by Isuzu Motors Limited of Japan generated a top line of Rs. 5,230 Mn and Rs. 4,057 Mn at the Group and the Company level, a growth of 29.19% and 34.97% respectively. AEL holds approximately 84.4% of SML which is a public quoted company.
FINANCIAL CAPITAL
PREAMBLE BUSINESS MODEL VALUE CREATION STEWARDSHIP FINANCIAL REPORTS ANNEXES
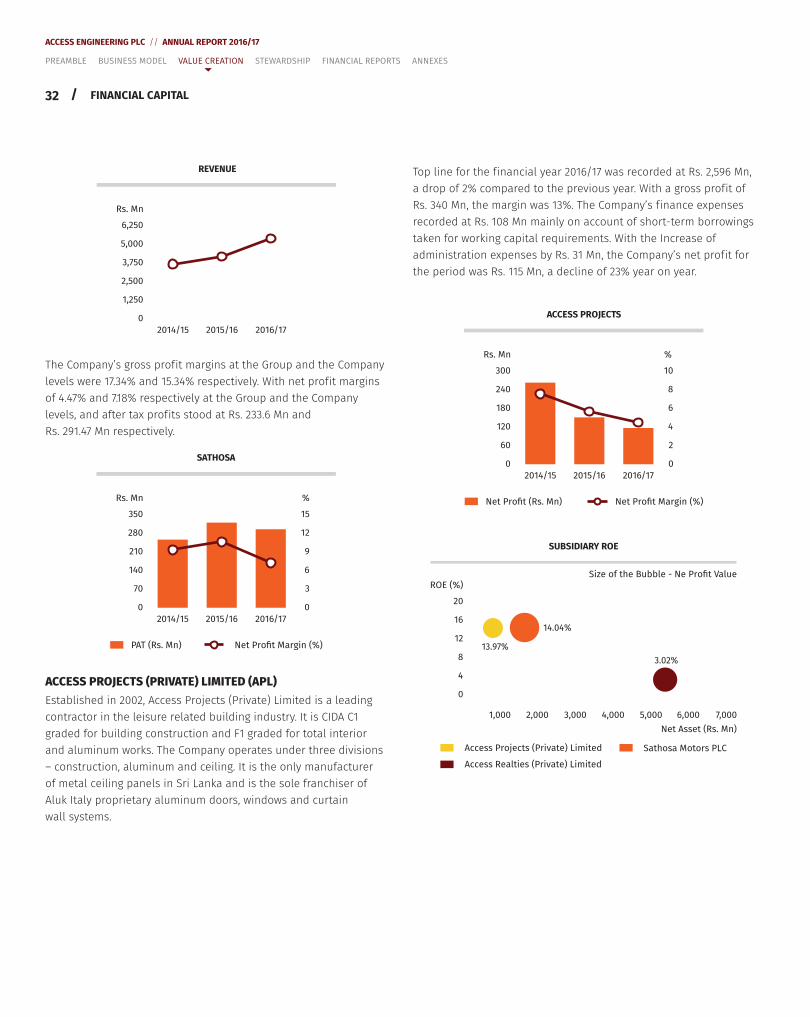
32 /
ACCESS ENGINEERING PLC // ANNUAL REPORT 2016/17
REVENUE
Rs. Mn
6,250
5,000
3,750
2,500
1,250
0
2014/15 2015/16 2016/17
The Company’s gross prof it margins at the Group and the Company levels were 17.34% and 15.34% respectively. With net prof it margins of 4.47% and 7.18% respectively at the Group and the Company levels, and after tax prof its stood at Rs. 233.6 Mn and Rs. 291.47 Mn respectively.
SATHOSA
Rs. Mn
350
280
210
140
70
0
2014/15 2015/16 2016/17
15
12
9
6
3
0
%
PAT (Rs. Mn) Net Profit Margin (%)
ACCESS PROJECTS (PRIVATE) LIMITED (APL)Established in 2002, Access Projects (Private) Limited is a leading contractor in the leisure related building industry. It is CIDA C1 graded for building construction and F1 graded for total interior and aluminum works. The Company operates under three divisions – construction, aluminum and ceiling. It is the only manufacturer of metal ceiling panels in Sri Lanka and is the sole franchiser of Aluk Italy proprietary aluminum doors, windows and curtain wall systems.
Top line for the f inancial year 2016/17 was recorded at Rs. 2,596 Mn, a drop of 2% compared to the previous year. With a gross prof it of Rs. 340 Mn, the margin was 13%. The Company’s f inance expenses recorded at Rs. 108 Mn mainly on account of short-term borrowings taken for working capital requirements. With the Increase of administration expenses by Rs. 31 Mn, the Company’s net prof it for the period was Rs. 115 Mn, a decline of 23% year on year.
ACCESS PROJECTS
Rs. Mn
300
240
180
120
60
0
2014/15 2015/16 2016/17
10
8
6
4
2
0
%
Net Profit (Rs. Mn) Net Profit Margin (%)
SUBSIDIARY ROE
ROE (%)
Net Asset (Rs. Mn)
20
16
12
8
4
0
1,000 2,000 3,000 4,000 5,000 6,000 7,000
14.04%
13.97%
3.02%
Access Projects (Private) Limited
Access Realties (Private) Limited
Sathosa Motors PLC
Size of the Bubble - Ne Profit Value
FINANCIAL CAPITAL
PREAMBLE BUSINESS MODEL VALUE CREATION STEWARDSHIP FINANCIAL REPORTS ANNEXES
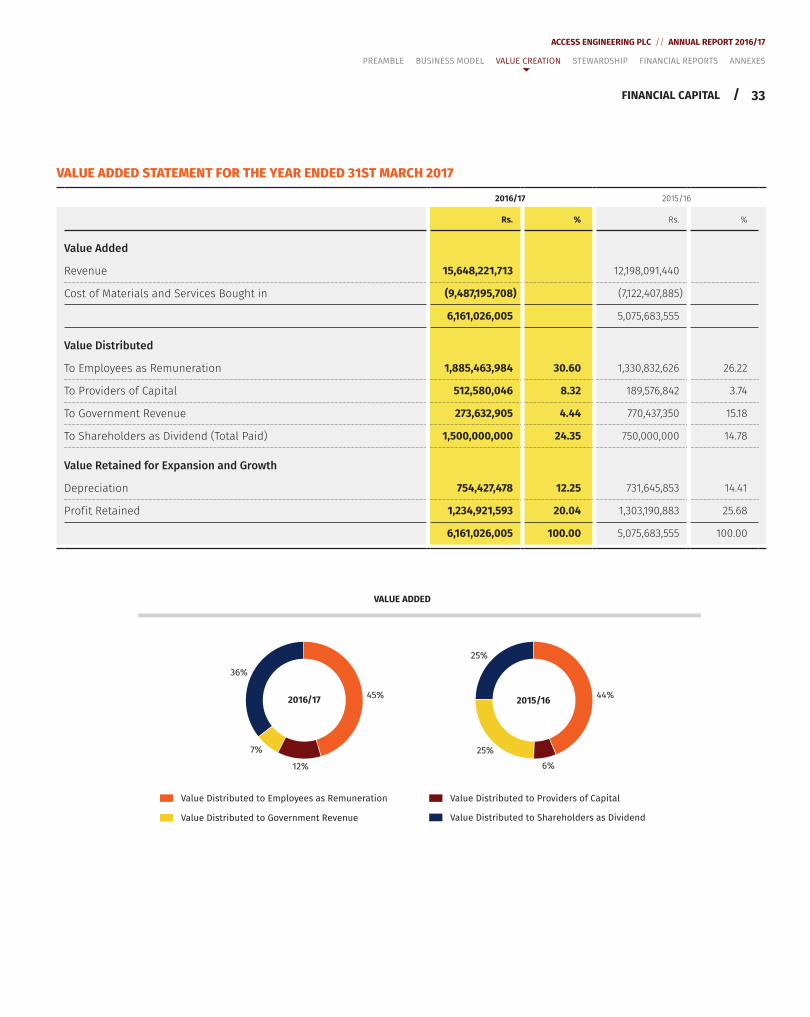
33
ACCESS ENGINEERING PLC // ANNUAL REPORT 2016/17
/
VALUE ADDED STATEMENT FOR THE YEAR ENDED 31ST MARCH 2017
2016/17 2015/16
Rs. % Rs. %
Value Added
Revenue 15,648,221,713 12,198,091,440
Cost of Materials and Services Bought in (9,487,195,708) (7,122,407,885)
6,161,026,005 5,075,683,555
Value Distributed
To Employees as Remuneration 1,885,463,984 30.60 1,330,832,626 26.22
To Providers of Capital 512,580,046 8.32 189,576,842 3.74
To Government Revenue 273,632,905 4.44 770,437,350 15.18
To Shareholders as Dividend (Total Paid) 1,500,000,000 24.35 750,000,000 14.78
Value Retained for Expansion and Growth
Depreciation 754,427,478 12.25 731,645,853 14.41
Prof it Retained 1,234,921,593 20.04 1,303,190,883 25.68
6,161,026,005 100.00 5,075,683,555 100.00
FINANCIAL CAPITAL
PREAMBLE BUSINESS MODEL VALUE CREATION STEWARDSHIP FINANCIAL REPORTS ANNEXES
VALUE ADDED
Value Distributed to Government Revenue Value Distributed to Shareholders as Dividend
Value Distributed to Employees as Remuneration Value Distributed to Providers of Capital
12%
36%
7%
45%
6%
25%
25%
44%2016/17 2015/16
34 /
ACCESS ENGINEERING PLC // ANNUAL REPORT 2016/17
INSTITUTIONAL CAPITAL
Institutional capital consists of a number of intangible attributes of an organization which defy precise quantif ication. They include systems and procedures, organizational learning, knowledge bases, software, brand value, ethics and values.
SYSTEMS AND PROCEDURESWe have the distinction of being the f irst construction Company to implement an ERP system. The SAP system which we f irst installed in 2013 provides an integrated platform to automate the full range of our business processes. The direct project processes covered include materials management, project systems, production planning and equipment and tool management. The system also supports other functions such as f inance and controlling, sales and distribution and plant maintenance. Since implementing such a system is a complex process, continuous user training is provided by the ERP vendor, supplemented with regular audits. We have also built a highly skilled internal team of experts on the system. The team f ixes operational problems as well as carry out system modif ications and enhancements where necessary to streamline the SAP operations. The system is also compatible with smart phones and touch devices increasing the eff iciency of transaction processing. It also uses the cutting edge hardware including servers and backups, in addition to the latest in supporting software such as f irewalls. Our HRIS system provides integrated HR information. We have also implemented an ‘AEL News’ platform which keeps all employees updated on project progress, f inancial news and any other important information. Our in-house library is a valuable resource to technical and managerial personnel (on paper and electronic media) on civil engineering and project management.
Many benef its have accrued from the implementation of the ERP system. Due to the streamlining of processes a number of eff iciencies have been realized. Due to the highly integrated nature of the system, encompassing planning, design, project management and operations management has been provided with enterprise-wide visibility. Approval processes have been brought online enabling quicker decision-making and implementation of decisions. Quality of products and services have been improved by better design and more stringent controls on operations.
Rigorous health and safety procedures have also contributed to a reduction in the Lost Time Injury Frequency Rate (LTIFR).
“We have the distinction of being the f irst construction company to implement an ERP system. Several improvements including SAP Fiori will further upgrade the system”
LOOKING AHEADSeveral improvements in systems are planned for implementation. ‘SAP Fiori’ is due for implementation in 2017/18. This upgrading will enable transaction processing through a mobile app, which will be more user friendly, secured and eff icient than the current system.
Planning for a complete disaster recovery system to cope with a wide range of possible disaster situations in the ERP system is underway, and will be implemented in 2017/18. We also intend to move to a fully-automated document management system which will bring about a paperless off ice environment in the coming year.
BRAND AND ITS DEVELOPMENT Access Engineering is a diversif ied engineering Company, integrating many civil engineering disciplines such as engineering designs, foundations, construction materials and construction projects. It has now moved into forward integration beyond the conf ines of engineering with its foray into real estate. AEL has jointly executed projects with partners from several countries around the globe with advanced engineering industries including China, Hungary, Australia, United Kingdom, USA, Japan, Malaysia, Korea and Spain. This is a tribute to the standing the Company enjoys in the construction industry worldwide. AEL also has the distinction of being the Company with the highest market capitalization in the construction and engineering sector in the Colombo Stock Exchange. It was also a constituent of the S&P SL 20 index of the CSE during the year 2016/17. Furthermore, it was the only Company from the construction sector to be awarded a slot among Business Today Top 30 for 2015/16 and the only listed construction company to be recognized by the Ceylon Chamber of Commerce as a sustainable corporate citizen.
AEL has also taken its own initiatives to demonstrate its commitment to sustainability and good governance. We are the only civil engineering Company to be a signatory to the United Nations Global Compact. Another unique distinction is that we are the only construction Company in Sri Lanka to be a member in good standing of Trace International, UK for anti-bribery compliance. Our commitment to the conservation of nature is shown by our Patron
PREAMBLE BUSINESS MODEL VALUE CREATION STEWARDSHIP FINANCIAL REPORTS ANNEXES
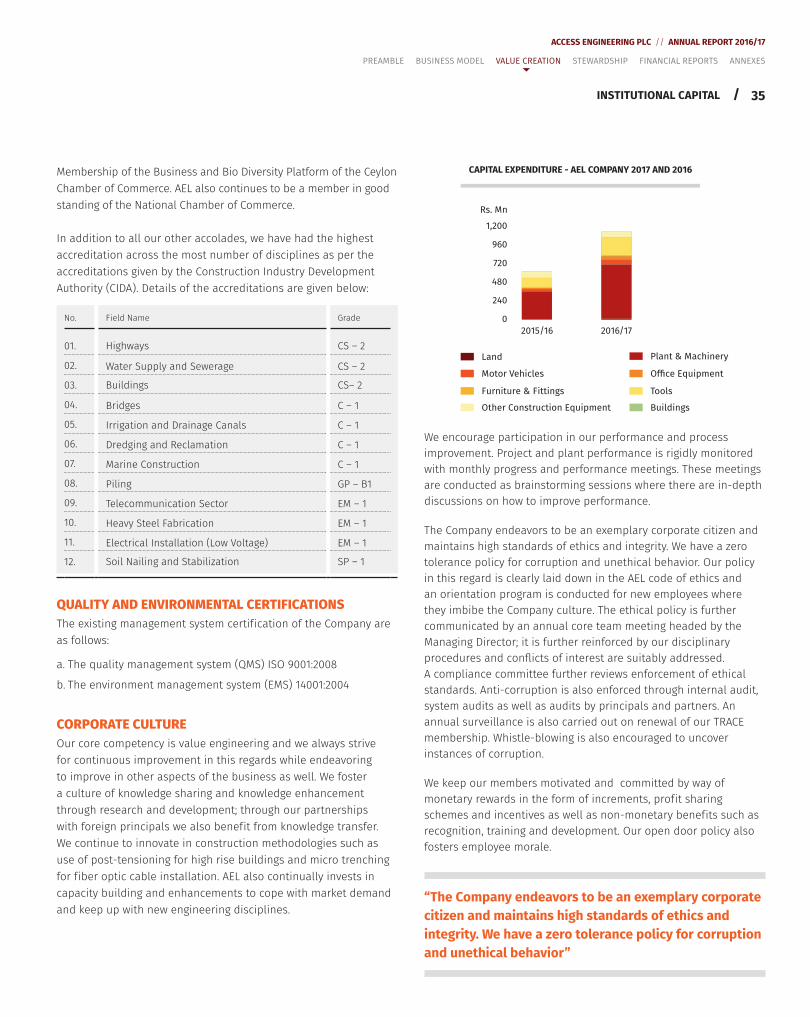
35
ACCESS ENGINEERING PLC // ANNUAL REPORT 2016/17
/INSTITUTIONAL CAPITAL
Membership of the Business and Bio Diversity Platform of the Ceylon Chamber of Commerce. AEL also continues to be a member in good standing of the National Chamber of Commerce.
In addition to all our other accolades, we have had the highest accreditation across the most number of disciplines as per the accreditations given by the Construction Industry Development Authority (CIDA). Details of the accreditations are given below:
No. Field Name Grade
01. Highways CS – 2
02. Water Supply and Sewerage CS – 2
03. Buildings CS– 2
04. Bridges C – 1
05. Irrigation and Drainage Canals C – 1
06. Dredging and Reclamation C – 1
07. Marine Construction C – 1
08. Piling GP – B1
09. Telecommunication Sector EM – 1
10. Heavy Steel Fabrication EM – 1
11. Electrical Installation (Low Voltage) EM – 1
12. Soil Nailing and Stabilization SP – 1
QUALITY AND ENVIRONMENTAL CERTIFICATIONSThe existing management system certif ication of the Company are as follows:
a. The quality management system (QMS) ISO 9001:2008
b. The environment management system (EMS) 14001:2004
CORPORATE CULTURE Our core competency is value engineering and we always strive for continuous improvement in this regards while endeavoring to improve in other aspects of the business as well. We foster a culture of knowledge sharing and knowledge enhancement through research and development; through our partnerships with foreign principals we also benef it from knowledge transfer. We continue to innovate in construction methodologies such as use of post-tensioning for high rise buildings and micro trenching for f iber optic cable installation. AEL also continually invests in capacity building and enhancements to cope with market demand and keep up with new engineering disciplines.
CAPITAL EXPENDITURE - AEL COMPANY 2017 AND 2016
Rs. Mn
1,200
960
720
480
240
0
2016/17
Plant & Machinery
Office Equipment
Tools
Buildings
Land
Motor Vehicles
Furniture & Fittings
Other Construction Equipment
2015/16
We encourage participation in our performance and process improvement. Project and plant performance is rigidly monitored with monthly progress and performance meetings. These meetings are conducted as brainstorming sessions where there are in-depth discussions on how to improve performance.
The Company endeavors to be an exemplary corporate citizen and maintains high standards of ethics and integrity. We have a zero tolerance policy for corruption and unethical behavior. Our policy in this regard is clearly laid down in the AEL code of ethics and an orientation program is conducted for new employees where they imbibe the Company culture. The ethical policy is further communicated by an annual core team meeting headed by the Managing Director; it is further reinforced by our disciplinary procedures and conflicts of interest are suitably addressed. A compliance committee further reviews enforcement of ethical standards. Anti-corruption is also enforced through internal audit, system audits as well as audits by principals and partners. An annual surveillance is also carried out on renewal of our TRACE membership. Whistle-blowing is also encouraged to uncover instances of corruption.
We keep our members motivated and committed by way of monetary rewards in the form of increments, prof it sharing schemes and incentives as well as non-monetary benef its such as recognition, training and development. Our open door policy also fosters employee morale.
“The Company endeavors to be an exemplary corporate citizen and maintains high standards of ethics and integrity. We have a zero tolerance policy for corruption and unethical behavior”
PREAMBLE BUSINESS MODEL VALUE CREATION STEWARDSHIP FINANCIAL REPORTS ANNEXES
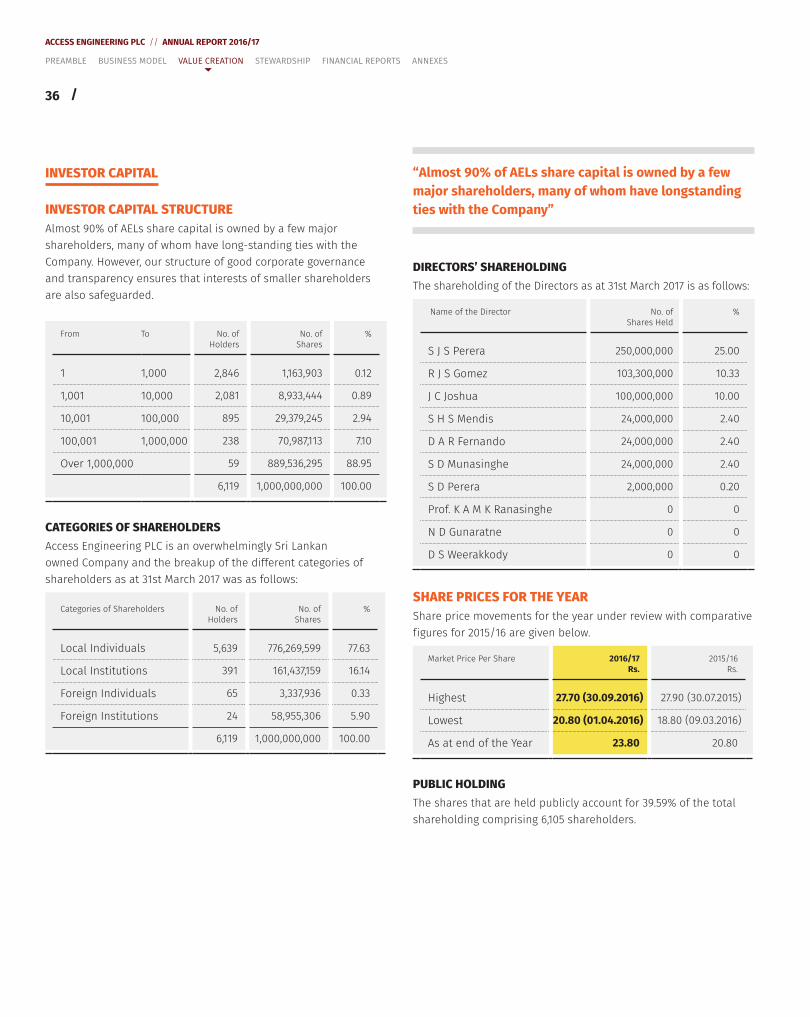
36 /
ACCESS ENGINEERING PLC // ANNUAL REPORT 2016/17
INVESTOR CAPITAL
INVESTOR CAPITAL STRUCTUREAlmost 90% of AELs share capital is owned by a few major shareholders, many of whom have long-standing ties with the Company. However, our structure of good corporate governance and transparency ensures that interests of smaller shareholders are also safeguarded.
From To No. of Holders
No. of Shares
%
1 1,000 2,846 1,163,903 0.12
1,001 10,000 2,081 8,933,444 0.89
10,001 100,000 895 29,379,245 2.94
100,001 1,000,000 238 70,987,113 7.10
Over 1,000,000 59 889,536,295 88.95
6,119 1,000,000,000 100.00
CATEGORIES OF SHAREHOLDERSAccess Engineering PLC is an overwhelmingly Sri Lankan owned Company and the breakup of the different categories of shareholders as at 31st March 2017 was as follows:
Categories of Shareholders No. of Holders
No. of Shares
%
Local Individuals 5,639 776,269,599 77.63
Local Institutions 391 161,437,159 16.14
Foreign Individuals 65 3,337,936 0.33
Foreign Institutions 24 58,955,306 5.90
6,119 1,000,000,000 100.00
“Almost 90% of AELs share capital is owned by a few major shareholders, many of whom have longstanding ties with the Company”
DIRECTORS’ SHAREHOLDING The shareholding of the Directors as at 31st March 2017 is as follows:
Name of the Director No. of Shares Held
%
S J S Perera 250,000,000 25.00
R J S Gomez 103,300,000 10.33
J C Joshua 100,000,000 10.00
S H S Mendis 24,000,000 2.40
D A R Fernando 24,000,000 2.40
S D Munasinghe 24,000,000 2.40
S D Perera 2,000,000 0.20
Prof. K A M K Ranasinghe 0 0
N D Gunaratne 0 0
D S Weerakkody 0 0
SHARE PRICES FOR THE YEARShare price movements for the year under review with comparative f igures for 2015/16 are given below.
Market Price Per Share 2016/17Rs.
2015/16Rs.
Highest 27.70 (30.09.2016) 27.90 (30.07.2015)
Lowest 20.80 (01.04.2016) 18.80 (09.03.2016)
As at end of the Year 23.80 20.80
PUBLIC HOLDINGThe shares that are held publicly account for 39.59% of the total shareholding comprising 6,105 shareholders.
PREAMBLE BUSINESS MODEL VALUE CREATION STEWARDSHIP FINANCIAL REPORTS ANNEXES
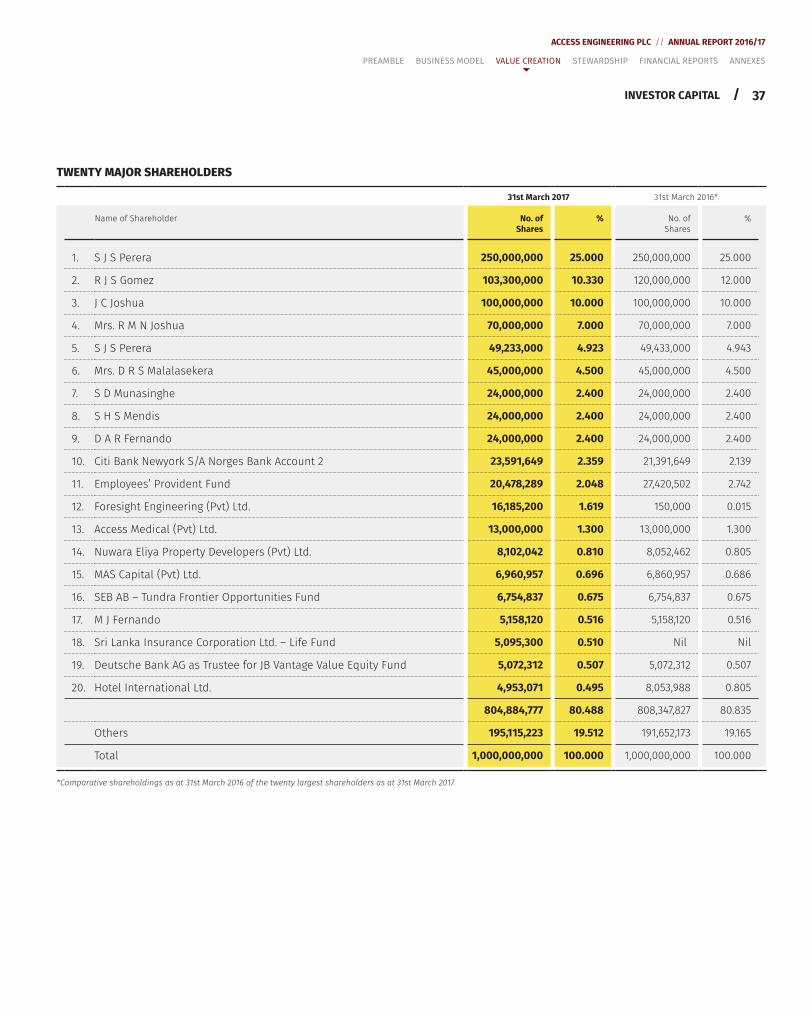
37
ACCESS ENGINEERING PLC // ANNUAL REPORT 2016/17
/
TWENTY MAJOR SHAREHOLDERS
31st March 2017 31st March 2016*
Name of Shareholder No. of Shares
% No. of Shares
%
1. S J S Perera 250,000,000 25.000 250,000,000 25.000
2. R J S Gomez 103,300,000 10.330 120,000,000 12.000
3. J C Joshua 100,000,000 10.000 100,000,000 10.000
4. Mrs. R M N Joshua 70,000,000 7.000 70,000,000 7.000
5. S J S Perera 49,233,000 4.923 49,433,000 4.943
6. Mrs. D R S Malalasekera 45,000,000 4.500 45,000,000 4.500
7. S D Munasinghe 24,000,000 2.400 24,000,000 2.400
8. S H S Mendis 24,000,000 2.400 24,000,000 2.400
9. D A R Fernando 24,000,000 2.400 24,000,000 2.400
10. Citi Bank Newyork S/A Norges Bank Account 2 23,591,649 2.359 21,391,649 2.139
11. Employeesʼ Provident Fund 20,478,289 2.048 27,420,502 2.742
12. Foresight Engineering (Pvt) Ltd. 16,185,200 1.619 150,000 0.015
13. Access Medical (Pvt) Ltd. 13,000,000 1.300 13,000,000 1.300
14. Nuwara Eliya Property Developers (Pvt) Ltd. 8,102,042 0.810 8,052,462 0.805
15. MAS Capital (Pvt) Ltd. 6,960,957 0.696 6,860,957 0.686
16. SEB AB – Tundra Frontier Opportunities Fund 6,754,837 0.675 6,754,837 0.675
17. M J Fernando 5,158,120 0.516 5,158,120 0.516
18. Sri Lanka Insurance Corporation Ltd. – Life Fund 5,095,300 0.510 Nil Nil
19. Deutsche Bank AG as Trustee for JB Vantage Value Equity Fund 5,072,312 0.507 5,072,312 0.507
20. Hotel International Ltd. 4,953,071 0.495 8,053,988 0.805
804,884,777 80.488 808,347,827 80.835
Others 195,115,223 19.512 191,652,173 19.165
Total 1,000,000,000 100.000 1,000,000,000 100.000
*Comparative shareholdings as at 31st March 2016 of the twenty largest shareholders as at 31st March 2017.
INVESTOR CAPITAL
PREAMBLE BUSINESS MODEL VALUE CREATION STEWARDSHIP FINANCIAL REPORTS ANNEXES
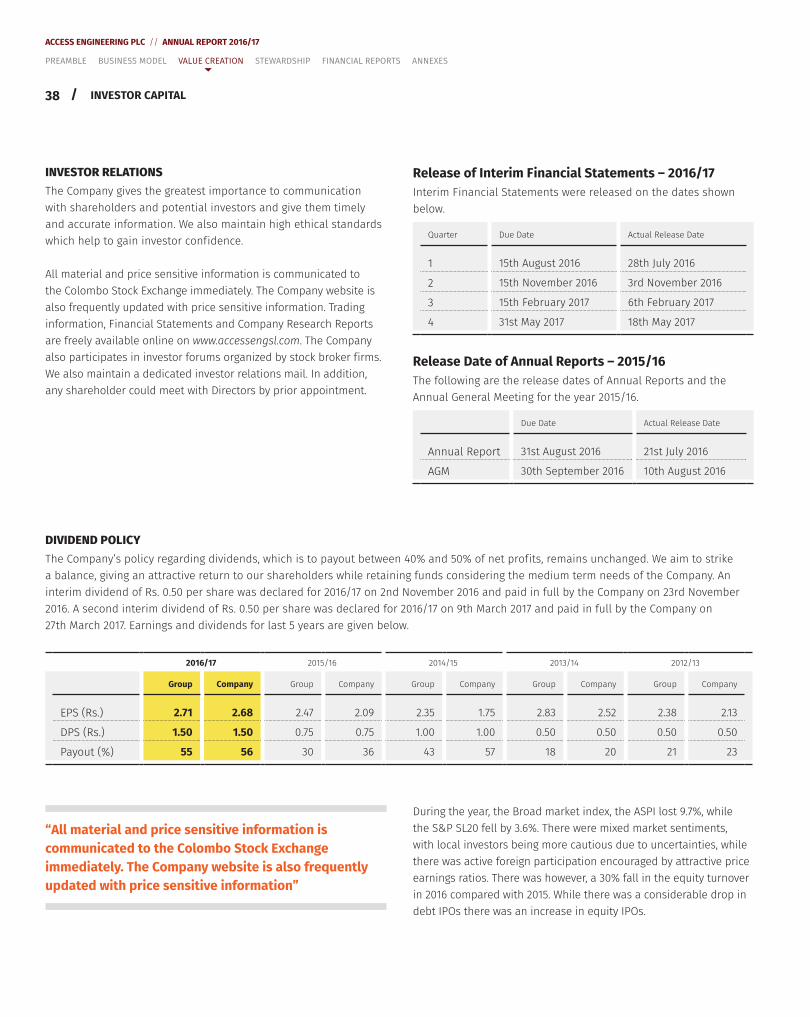
38 /
ACCESS ENGINEERING PLC // ANNUAL REPORT 2016/17
INVESTOR RELATIONSThe Company gives the greatest importance to communication with shareholders and potential investors and give them timely and accurate information. We also maintain high ethical standards which help to gain investor conf idence.
All material and price sensitive information is communicated to the Colombo Stock Exchange immediately. The Company website is also frequently updated with price sensitive information. Trading information, Financial Statements and Company Research Reports are freely available online on www.accessengsl.com. The Company also participates in investor forums organized by stock broker f irms. We also maintain a dedicated investor relations mail. In addition, any shareholder could meet with Directors by prior appointment.
Release of Interim Financial Statements – 2016/17Interim Financial Statements were released on the dates shown below.
Quarter Due Date Actual Release Date
1 15th August 2016 28th July 2016
2 15th November 2016 3rd November 2016
3 15th February 2017 6th February 2017
4 31st May 2017 18th May 2017
Release Date of Annual Reports – 2015/16The following are the release dates of Annual Reports and the Annual General Meeting for the year 2015/16.
Due Date Actual Release Date
Annual Report 31st August 2016 21st July 2016
AGM 30th September 2016 10th August 2016
DIVIDEND POLICY The Company’s policy regarding dividends, which is to payout between 40% and 50% of net prof its, remains unchanged. We aim to strike a balance, giving an attractive return to our shareholders while retaining funds considering the medium term needs of the Company. An interim dividend of Rs. 0.50 per share was declared for 2016/17 on 2nd November 2016 and paid in full by the Company on 23rd November 2016. A second interim dividend of Rs. 0.50 per share was declared for 2016/17 on 9th March 2017 and paid in full by the Company on 27th March 2017. Earnings and dividends for last 5 years are given below.
2016/17 2015/16 2014/15 2013/14 2012/13
Group Company Group Company Group Company Group Company Group Company
EPS (Rs.) 2.71 2.68 2.47 2.09 2.35 1.75 2.83 2.52 2.38 2.13
DPS (Rs.) 1.50 1.50 0.75 0.75 1.00 1.00 0.50 0.50 0.50 0.50
Payout (%) 55 56 30 36 43 57 18 20 21 23
During the year, the Broad market index, the ASPI lost 9.7%, while the S&P SL20 fell by 3.6%. There were mixed market sentiments, with local investors being more cautious due to uncertainties, while there was active foreign participation encouraged by attractive price earnings ratios. There was however, a 30% fall in the equity turnover in 2016 compared with 2015. While there was a considerable drop in debt IPOs there was an increase in equity IPOs.
INVESTOR CAPITAL
PREAMBLE BUSINESS MODEL VALUE CREATION STEWARDSHIP FINANCIAL REPORTS ANNEXES
“All material and price sensitive information is communicated to the Colombo Stock Exchange immediately. The Company website is also frequently updated with price sensitive information”
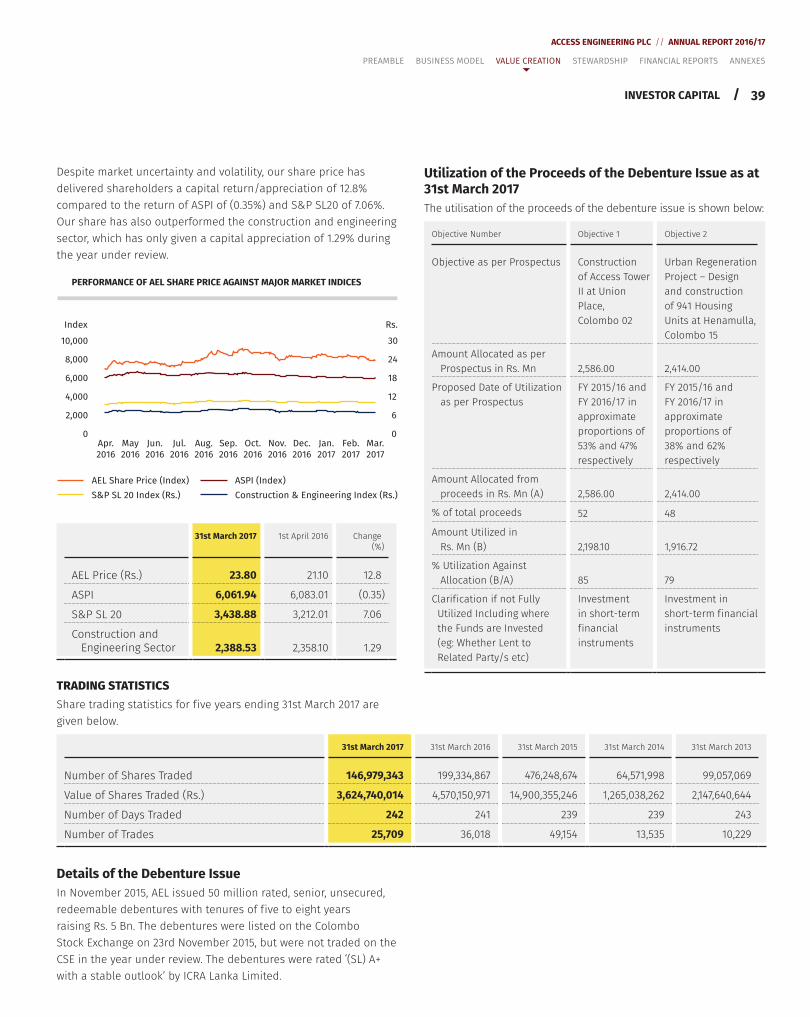
39
ACCESS ENGINEERING PLC // ANNUAL REPORT 2016/17
/
Despite market uncertainty and volatility, our share price has delivered shareholders a capital return/appreciation of 12.8% compared to the return of ASPI of (0.35%) and S&P SL20 of 7.06%. Our share has also outperformed the construction and engineering sector, which has only given a capital appreciation of 1.29% during the year under review.
PERFORMANCE OF AEL SHARE PRICE AGAINST MAJOR MARKET INDICES
Index
10,000
8,000
6,000
4,000
2,000
0Apr.2016
May2016
Jun.2016
Jul.2016
Aug.2016
Sep.2016
Oct.2016
Nov.2016
Dec.2016
Jan.2017
Feb.2017
Mar.2017
30
24
18
12
6
0
Rs.
AEL Share Price (Index)
S&P SL 20 Index (Rs.)
ASPI (Index)
Construction & Engineering Index (Rs.)
31st March 2017 1st April 2016 Change (%)
AEL Price (Rs.) 23.80 21.10 12.8
ASPI 6,061.94 6,083.01 (0.35)
S&P SL 20 3,438.88 3,212.01 7.06
Construction and Engineering Sector 2,388.53 2,358.10 1.29
TRADING STATISTICSShare trading statistics for f ive years ending 31st March 2017 are given below.
31st March 2017 31st March 2016 31st March 2015 31st March 2014 31st March 2013
Number of Shares Traded 146,979,343 199,334,867 476,248,674 64,571,998 99,057,069
Value of Shares Traded (Rs.) 3,624,740,014 4,570,150,971 14,900,355,246 1,265,038,262 2,147,640,644
Number of Days Traded 242 241 239 239 243
Number of Trades 25,709 36,018 49,154 13,535 10,229
Details of the Debenture IssueIn November 2015, AEL issued 50 million rated, senior, unsecured, redeemable debentures with tenures of f ive to eight years raising Rs. 5 Bn. The debentures were listed on the Colombo Stock Exchange on 23rd November 2015, but were not traded on the CSE in the year under review. The debentures were rated ʻ(SL) A+ with a stable outlookʼ by ICRA Lanka Limited.
Utilization of the Proceeds of the Debenture Issue as at 31st March 2017The utilisation of the proceeds of the debenture issue is shown below:
Objective Number Objective 1 Objective 2
Objective as per Prospectus Construction of Access Tower II at Union Place, Colombo 02
Urban Regeneration Project – Design and construction of 941 Housing Units at Henamulla, Colombo 15
Amount Allocated as per Prospectus in Rs. Mn 2,586.00 2,414.00
Proposed Date of Utilization as per Prospectus
FY 2015/16 and FY 2016/17 in approximate proportions of 53% and 47% respectively
FY 2015/16 and FY 2016/17 in approximate proportions of 38% and 62% respectively
Amount Allocated from proceeds in Rs. Mn (A) 2,586.00 2,414.00
% of total proceeds 52 48
Amount Utilized in Rs. Mn (B) 2,198.10 1,916.72
% Utilization Against Allocation (B/A) 85 79
Clarif ication if not Fully Utilized Including where the Funds are Invested (eg: Whether Lent to Related Party/s etc)
Investment in short-term f inancial instruments
Investment in short-term f inancial instruments
INVESTOR CAPITAL
PREAMBLE BUSINESS MODEL VALUE CREATION STEWARDSHIP FINANCIAL REPORTS ANNEXES
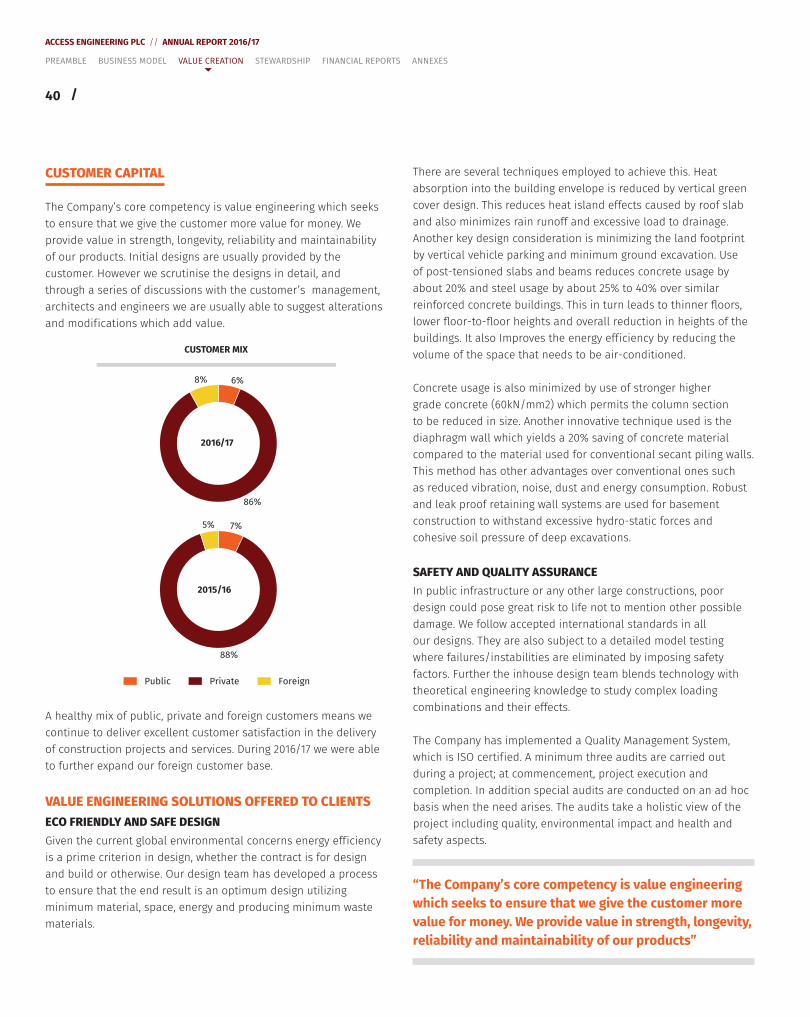
40 /
ACCESS ENGINEERING PLC // ANNUAL REPORT 2016/17
CUSTOMER CAPITAL
The Company’s core competency is value engineering which seeks to ensure that we give the customer more value for money. We provide value in strength, longevity, reliability and maintainability of our products. Initial designs are usually provided by the customer. However we scrutinise the designs in detail, and through a series of discussions with the customer’s management, architects and engineers we are usually able to suggest alterations and modif ications which add value.
Public ForeignPrivate
7%5%
88%
CUSTOMER MIX
8%
86%
6%
2015/16
2016/17
A healthy mix of public, private and foreign customers means we continue to deliver excellent customer satisfaction in the delivery of construction projects and services. During 2016/17 we were able to further expand our foreign customer base.
VALUE ENGINEERING SOLUTIONS OFFERED TO CLIENTSECO FRIENDLY AND SAFE DESIGNGiven the current global environmental concerns energy eff iciency is a prime criterion in design, whether the contract is for design and build or otherwise. Our design team has developed a process to ensure that the end result is an optimum design utilizing minimum material, space, energy and producing minimum waste materials.
There are several techniques employed to achieve this. Heat absorption into the building envelope is reduced by vertical green cover design. This reduces heat island effects caused by roof slab and also minimizes rain runoff and excessive load to drainage. Another key design consideration is minimizing the land footprint by vertical vehicle parking and minimum ground excavation. Use of post-tensioned slabs and beams reduces concrete usage by about 20% and steel usage by about 25% to 40% over similar reinforced concrete buildings. This in turn leads to thinner floors, lower floor-to-floor heights and overall reduction in heights of the buildings. It also Improves the energy eff iciency by reducing the volume of the space that needs to be air-conditioned.
Concrete usage is also minimized by use of stronger higher grade concrete (60kN/mm2) which permits the column section to be reduced in size. Another innovative technique used is the diaphragm wall which yields a 20% saving of concrete material compared to the material used for conventional secant piling walls. This method has other advantages over conventional ones such as reduced vibration, noise, dust and energy consumption. Robust and leak proof retaining wall systems are used for basement construction to withstand excessive hydro-static forces and cohesive soil pressure of deep excavations.
SAFETY AND QUALITY ASSURANCEIn public infrastructure or any other large constructions, poor design could pose great risk to life not to mention other possible damage. We follow accepted international standards in all our designs. They are also subject to a detailed model testing where failures/instabilities are eliminated by imposing safety factors. Further the inhouse design team blends technology with theoretical engineering knowledge to study complex loading combinations and their effects.
The Company has implemented a Quality Management System, which is ISO certif ied. A minimum three audits are carried out during a project; at commencement, project execution and completion. In addition special audits are conducted on an ad hoc basis when the need arises. The audits take a holistic view of the project including quality, environmental impact and health and safety aspects.
“The Company’s core competency is value engineering which seeks to ensure that we give the customer more value for money. We provide value in strength, longevity, reliability and maintainability of our products”
PREAMBLE BUSINESS MODEL VALUE CREATION STEWARDSHIP FINANCIAL REPORTS ANNEXES
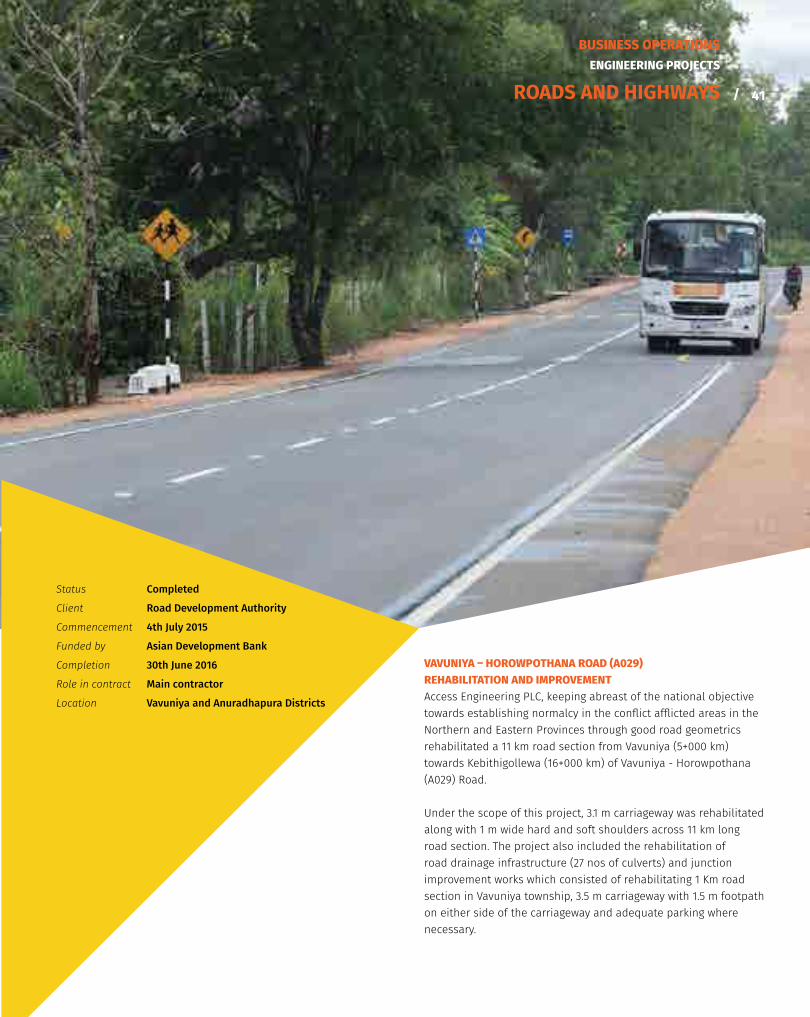
ACCESS ENGINEERING PLC // ANNUAL REPORT 2016/17BUSINESS OPERATIONSENGINEERING PROJECTS
ROADS AND HIGHWAYS
VAVUNIYA – HOROWPOTHANA ROAD (A029) REHABILITATION AND IMPROVEMENTAccess Engineering PLC, keeping abreast of the national objective towards establishing normalcy in the conflict afflicted areas in the Northern and Eastern Provinces through good road geometrics rehabilitated a 11 km road section from Vavuniya (5+000 km) towards Kebithigollewa (16+000 km) of Vavuniya - Horowpothana (A029) Road.
Under the scope of this project, 3.1 m carriageway was rehabilitated along with 1 m wide hard and soft shoulders across 11 km long road section. The project also included the rehabilitation of road drainage infrastructure (27 nos of culverts) and junction improvement works which consisted of rehabilitating 1 Km road section in Vavuniya township, 3.5 m carriageway with 1.5 m footpath on either side of the carriageway and adequate parking where necessary.
Status Completed
Client Road Development Authority
Commencement 4th July 2015
Funded by Asian Development Bank
Completion 30th June 2016
Role in contract Main contractor
Location Vavuniya and Anuradhapura Districts
41/
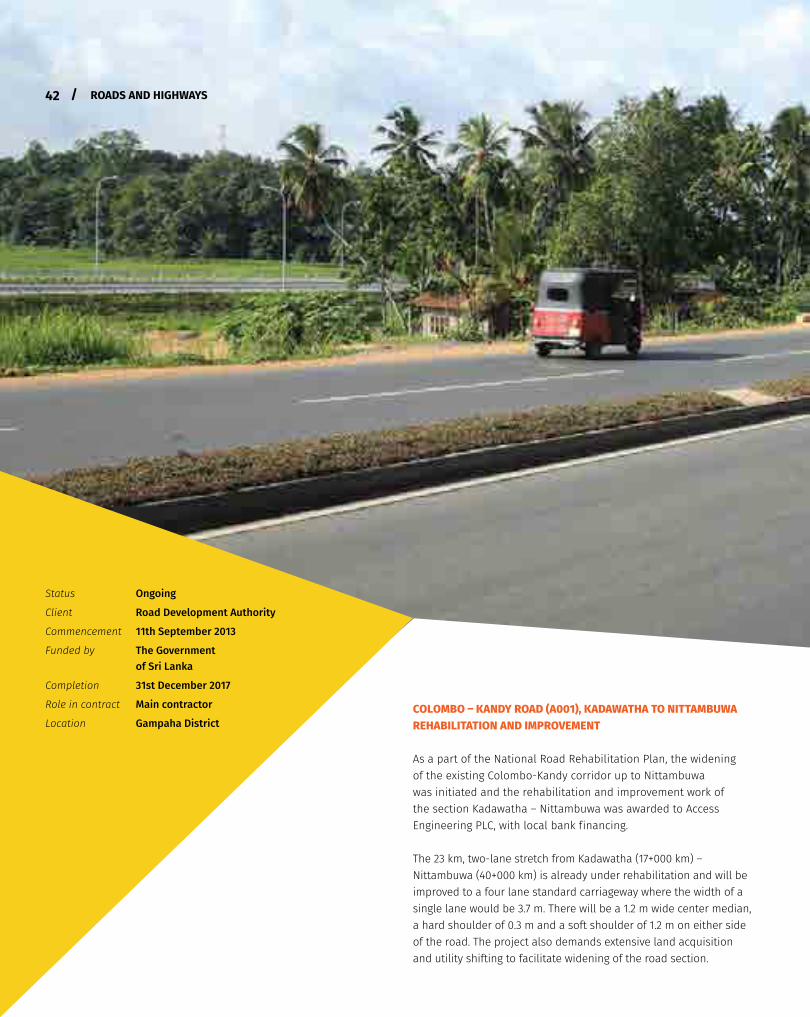
ACCESS ENGINEERING PLC // ANNUAL REPORT 2016/17
COLOMBO – KANDY ROAD (A001), KADAWATHA TO NITTAMBUWA REHABILITATION AND IMPROVEMENT
As a part of the National Road Rehabilitation Plan, the widening of the existing Colombo-Kandy corridor up to Nittambuwa was initiated and the rehabilitation and improvement work of the section Kadawatha – Nittambuwa was awarded to Access Engineering PLC, with local bank f inancing.
The 23 km, two-lane stretch from Kadawatha (17+000 km) – Nittambuwa (40+000 km) is already under rehabilitation and will be improved to a four lane standard carriageway where the width of a single lane would be 3.7 m. There will be a 1.2 m wide center median, a hard shoulder of 0.3 m and a soft shoulder of 1.2 m on either side of the road. The project also demands extensive land acquisition and utility shifting to facilitate widening of the road section.
/42
Status Ongoing
Client Road Development Authority
Commencement 11th September 2013
Funded by The Government of Sri Lanka
Completion 31st December 2017
Role in contract Main contractor
Location Gampaha District
ROADS AND HIGHWAYS
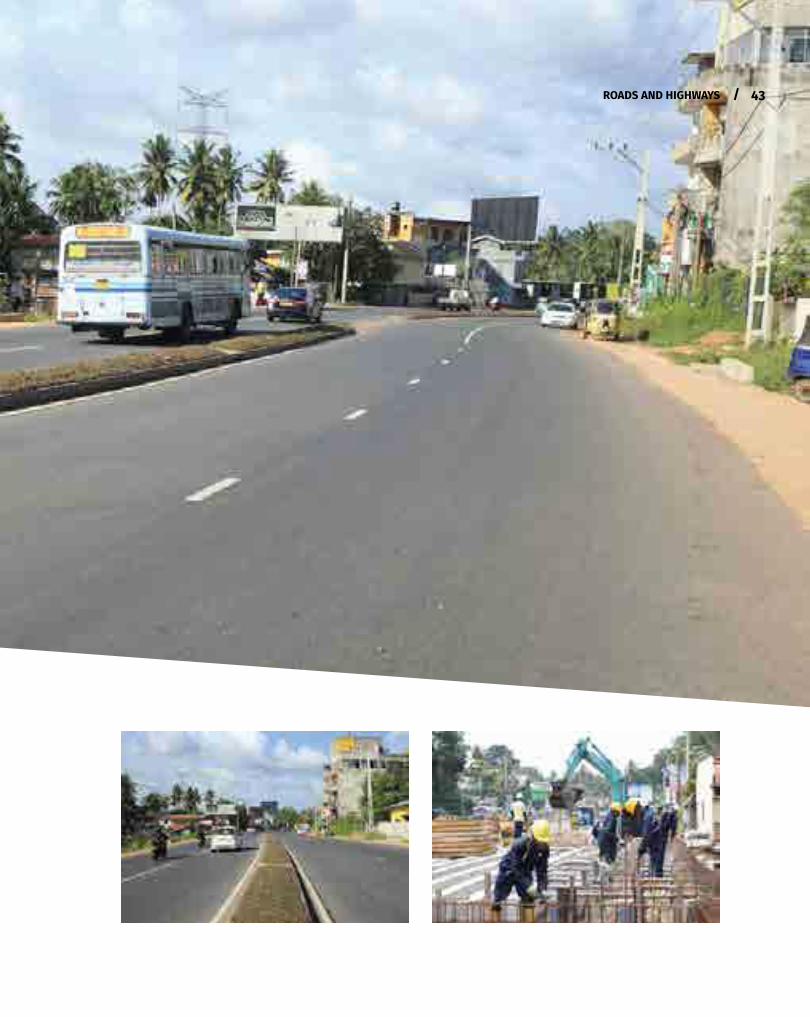
ACCESS ENGINEERING PLC // ANNUAL REPORT 2016/17
43/ROADS AND HIGHWAYS
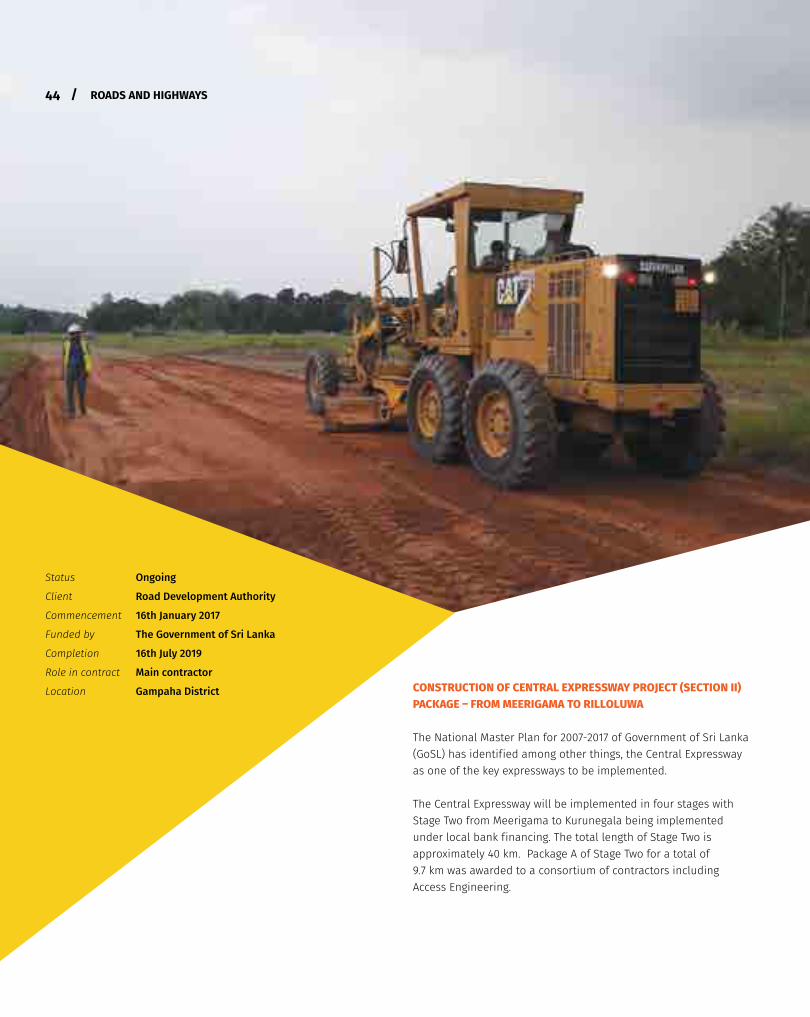
CONSTRUCTION OF CENTRAL EXPRESSWAY PROJECT (SECTION II) PACKAGE – FROM MEERIGAMA TO RILLOLUWA
The National Master Plan for 2007-2017 of Government of Sri Lanka (GoSL) has identif ied among other things, the Central Expressway as one of the key expressways to be implemented.
The Central Expressway will be implemented in four stages with Stage Two from Meerigama to Kurunegala being implemented under local bank f inancing. The total length of Stage Two is approximately 40 km. Package A of Stage Two for a total of 9.7 km was awarded to a consortium of contractors including Access Engineering.
44 /
Status Ongoing
Client Road Development Authority
Commencement 16th January 2017
Funded by The Government of Sri Lanka
Completion 16th July 2019
Role in contract Main contractor
Location Gampaha District
ROADS AND HIGHWAYS
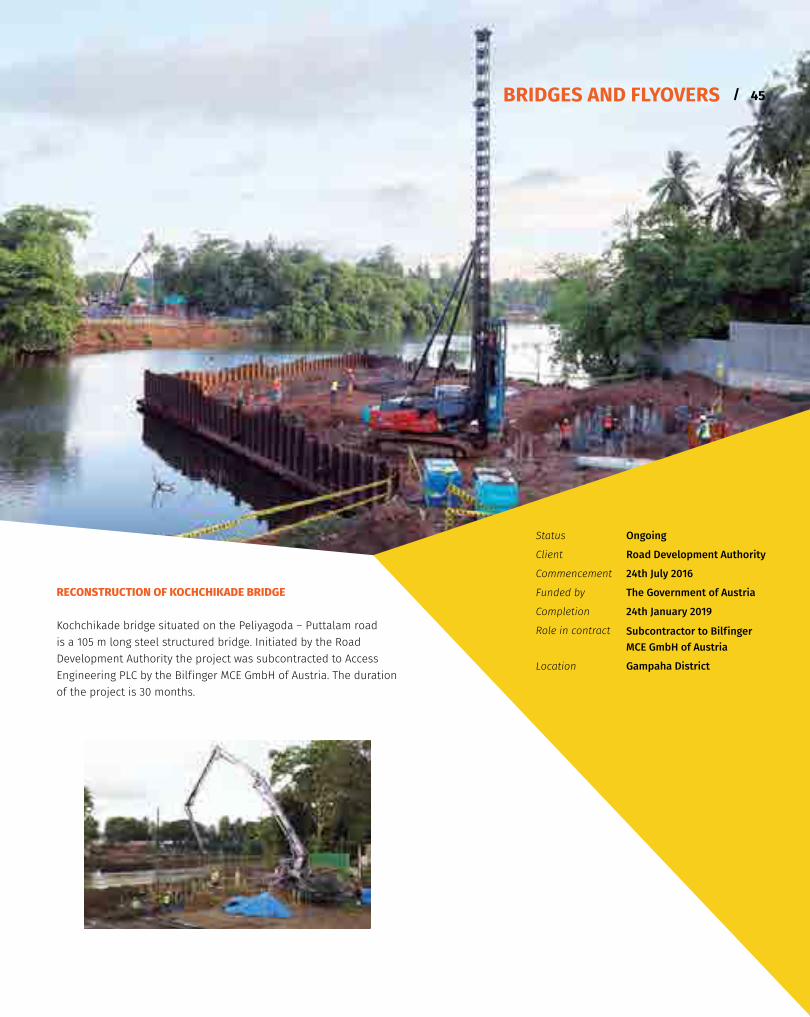
RECONSTRUCTION OF KOCHCHIKADE BRIDGE
Kochchikade bridge situated on the Peliyagoda – Puttalam road is a 105 m long steel structured bridge. Initiated by the Road Development Authority the project was subcontracted to Access Engineering PLC by the Bilf inger MCE GmbH of Austria. The duration of the project is 30 months.
BRIDGES AND FLYOVERS
Status Ongoing
Client Road Development Authority
Commencement 24th July 2016
Funded by The Government of Austria
Completion 24th January 2019
Role in contract Subcontractor to Bilf inger MCE GmbH of Austria
Location Gampaha District
45/
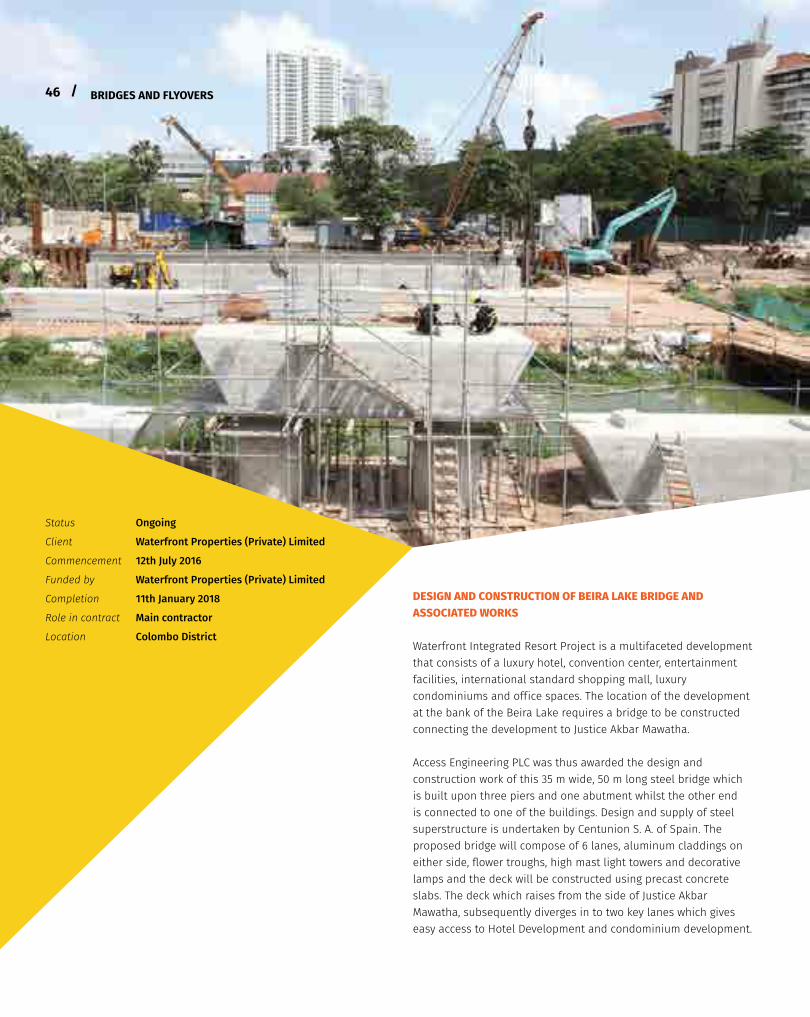
ACCESS ENGINEERING PLC // ANNUAL REPORT 2016/17
46 /
Status Ongoing
Client Waterfront Properties (Private) Limited
Commencement 12th July 2016
Funded by Waterfront Properties (Private) Limited
Completion 11th January 2018
Role in contract Main contractor
Location Colombo District
DESIGN AND CONSTRUCTION OF BEIRA LAKE BRIDGE AND ASSOCIATED WORKS
Waterfront Integrated Resort Project is a multifaceted development that consists of a luxury hotel, convention center, entertainment facilities, international standard shopping mall, luxury condominiums and off ice spaces. The location of the development at the bank of the Beira Lake requires a bridge to be constructed connecting the development to Justice Akbar Mawatha.
Access Engineering PLC was thus awarded the design and construction work of this 35 m wide, 50 m long steel bridge which is built upon three piers and one abutment whilst the other end is connected to one of the buildings. Design and supply of steel superstructure is undertaken by Centunion S. A. of Spain. The proposed bridge will compose of 6 lanes, aluminum claddings on either side, flower troughs, high mast light towers and decorative lamps and the deck will be constructed using precast concrete slabs. The deck which raises from the side of Justice Akbar Mawatha, subsequently diverges in to two key lanes which gives easy access to Hotel Development and condominium development.
BRIDGES AND FLYOVERS
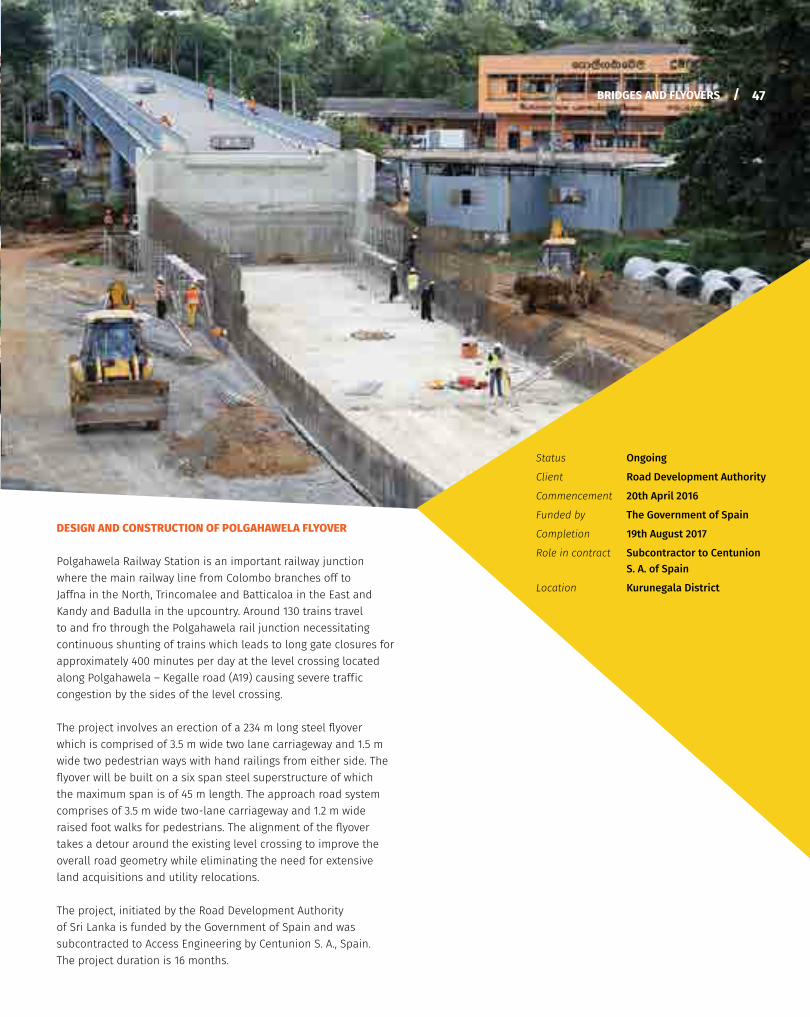
ACCESS ENGINEERING PLC // ANNUAL REPORT 2016/17
47/
DESIGN AND CONSTRUCTION OF POLGAHAWELA FLYOVER
Polgahawela Railway Station is an important railway junction where the main railway line from Colombo branches off to Jaffna in the North, Trincomalee and Batticaloa in the East and Kandy and Badulla in the upcountry. Around 130 trains travel to and fro through the Polgahawela rail junction necessitating continuous shunting of trains which leads to long gate closures for approximately 400 minutes per day at the level crossing located along Polgahawela – Kegalle road (A19) causing severe traff ic congestion by the sides of the level crossing.
The project involves an erection of a 234 m long steel flyover which is comprised of 3.5 m wide two lane carriageway and 1.5 m wide two pedestrian ways with hand railings from either side. The flyover will be built on a six span steel superstructure of which the maximum span is of 45 m length. The approach road system comprises of 3.5 m wide two-lane carriageway and 1.2 m wide raised foot walks for pedestrians. The alignment of the flyover takes a detour around the existing level crossing to improve the overall road geometry while eliminating the need for extensive land acquisitions and utility relocations.
The project, initiated by the Road Development Authority of Sri Lanka is funded by the Government of Spain and was subcontracted to Access Engineering by Centunion S. A., Spain. The project duration is 16 months.
Status Ongoing
Client Road Development Authority
Commencement 20th April 2016
Funded by The Government of Spain
Completion 19th August 2017
Role in contract Subcontractor to Centunion S. A. of Spain
Location Kurunegala District
BRIDGES AND FLYOVERS
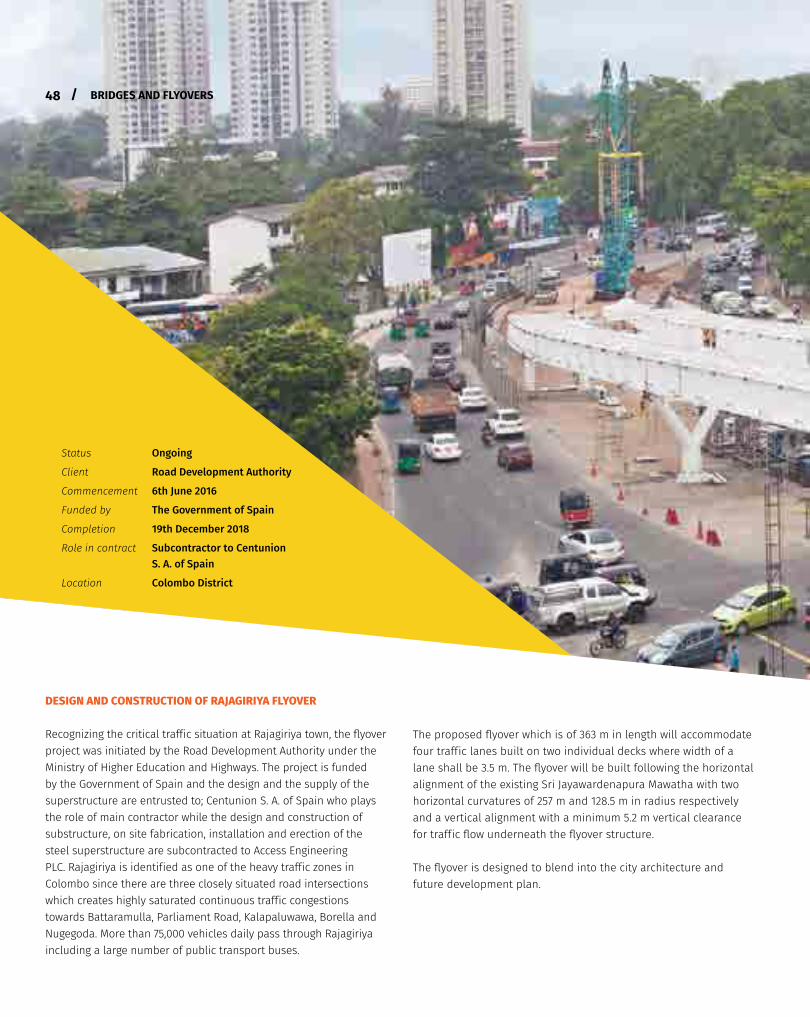
ACCESS ENGINEERING PLC // ANNUAL REPORT 2016/17
Status Ongoing
Client Road Development Authority
Commencement 6th June 2016
Funded by The Government of Spain
Completion 19th December 2018
Role in contract Subcontractor to Centunion S. A. of Spain
Location Colombo District
DESIGN AND CONSTRUCTION OF RAJAGIRIYA FLYOVER
Recognizing the critical traff ic situation at Rajagiriya town, the flyover project was initiated by the Road Development Authority under the Ministry of Higher Education and Highways. The project is funded by the Government of Spain and the design and the supply of the superstructure are entrusted to; Centunion S. A. of Spain who plays the role of main contractor while the design and construction of substructure, on site fabrication, installation and erection of the steel superstructure are subcontracted to Access Engineering PLC. Rajagiriya is identif ied as one of the heavy traff ic zones in Colombo since there are three closely situated road intersections which creates highly saturated continuous traff ic congestions towards Battaramulla, Parliament Road, Kalapaluwawa, Borella and Nugegoda. More than 75,000 vehicles daily pass through Rajagiriya including a large number of public transport buses.
The proposed flyover which is of 363 m in length will accommodate four traff ic lanes built on two individual decks where width of a lane shall be 3.5 m. The flyover will be built following the horizontal alignment of the existing Sri Jayawardenapura Mawatha with two horizontal curvatures of 257 m and 128.5 m in radius respectively and a vertical alignment with a minimum 5.2 m vertical clearance for traff ic flow underneath the flyover structure.
The flyover is designed to blend into the city architecture and future development plan.
48 / BRIDGES AND FLYOVERS
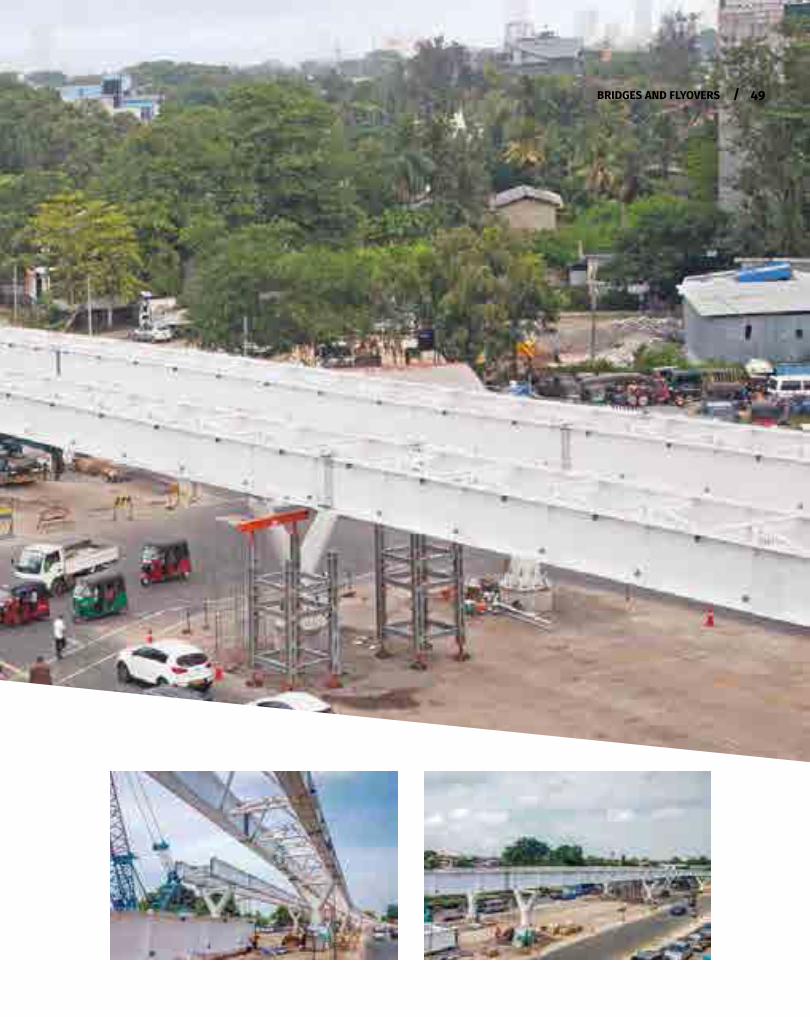
ACCESS ENGINEERING PLC // ANNUAL REPORT 2016/17
49/BRIDGES AND FLYOVERS
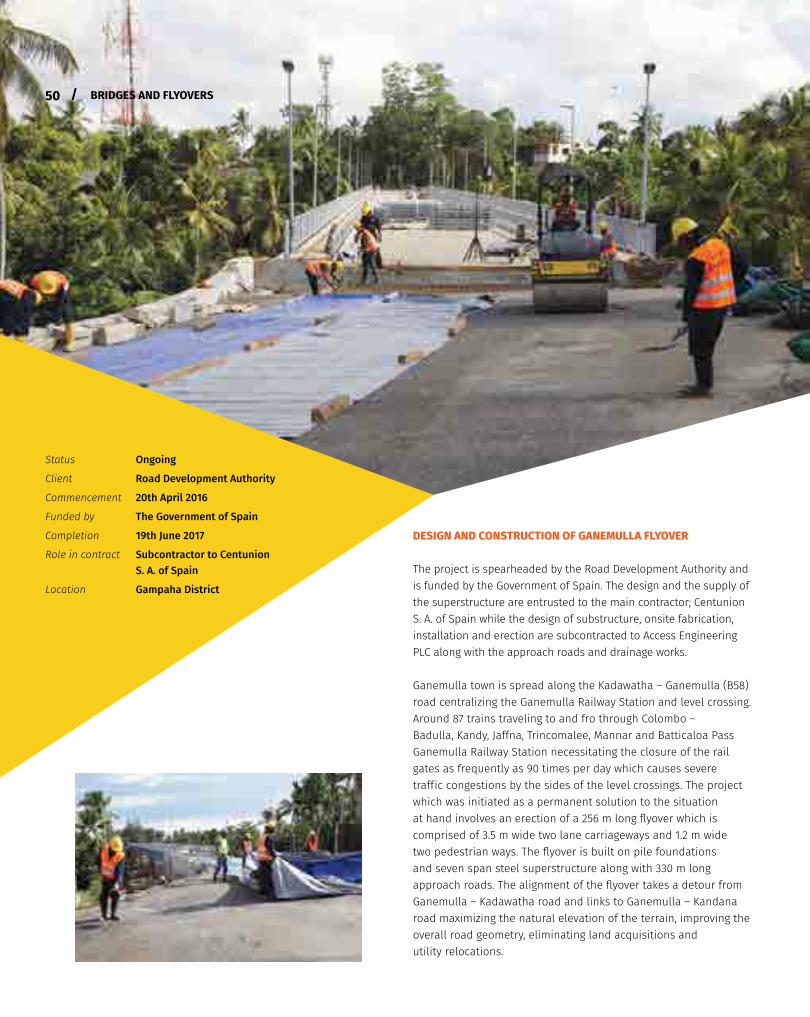
ACCESS ENGINEERING PLC // ANNUAL REPORT 2016/17
50 /
DESIGN AND CONSTRUCTION OF GANEMULLA FLYOVER
The project is spearheaded by the Road Development Authority and is funded by the Government of Spain. The design and the supply of the superstructure are entrusted to the main contractor; Centunion S. A. of Spain while the design of substructure, onsite fabrication, installation and erection are subcontracted to Access Engineering PLC along with the approach roads and drainage works.
Ganemulla town is spread along the Kadawatha – Ganemulla (B58) road centralizing the Ganemulla Railway Station and level crossing. Around 87 trains traveling to and fro through Colombo – Badulla, Kandy, Jaffna, Trincomalee, Mannar and Batticaloa Pass Ganemulla Railway Station necessitating the closure of the rail gates as frequently as 90 times per day which causes severe traff ic congestions by the sides of the level crossings. The project which was initiated as a permanent solution to the situation at hand involves an erection of a 256 m long flyover which is comprised of 3.5 m wide two lane carriageways and 1.2 m wide two pedestrian ways. The flyover is built on pile foundations and seven span steel superstructure along with 330 m long approach roads. The alignment of the flyover takes a detour from Ganemulla – Kadawatha road and links to Ganemulla – Kandana road maximizing the natural elevation of the terrain, improving the overall road geometry, eliminating land acquisitions and utility relocations.
Status Ongoing
Client Road Development Authority
Commencement 20th April 2016
Funded by The Government of Spain
Completion 19th June 2017
Role in contract Subcontractor to Centunion S. A. of Spain
Location Gampaha District
BRIDGES AND FLYOVERS
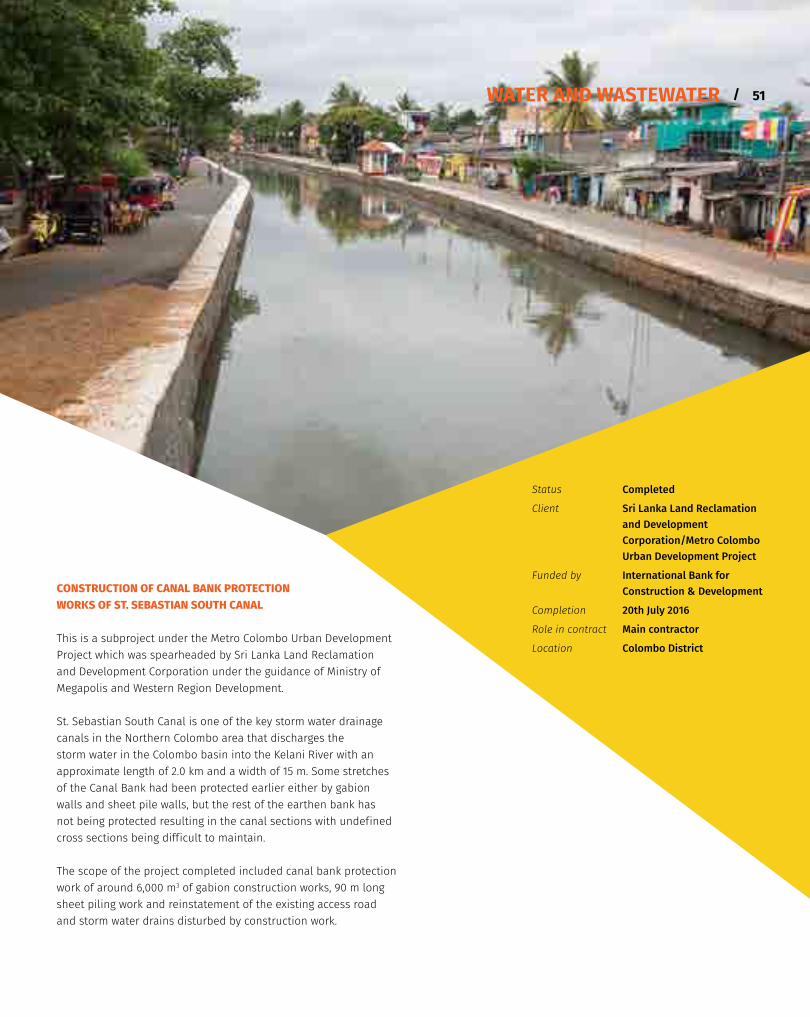
ACCESS ENGINEERING PLC // ANNUAL REPORT 2016/17
CONSTRUCTION OF CANAL BANK PROTECTION WORKS OF ST. SEBASTIAN SOUTH CANAL
This is a subproject under the Metro Colombo Urban Development Project which was spearheaded by Sri Lanka Land Reclamation and Development Corporation under the guidance of Ministry of Megapolis and Western Region Development.
St. Sebastian South Canal is one of the key storm water drainage canals in the Northern Colombo area that discharges the storm water in the Colombo basin into the Kelani River with an approximate length of 2.0 km and a width of 15 m. Some stretches of the Canal Bank had been protected earlier either by gabion walls and sheet pile walls, but the rest of the earthen bank has not being protected resulting in the canal sections with undef ined cross sections being diff icult to maintain.
The scope of the project completed included canal bank protection work of around 6,000 m3 of gabion construction works, 90 m long sheet piling work and reinstatement of the existing access road and storm water drains disturbed by construction work.
Status Completed
Client Sri Lanka Land Reclamation and Development Corporation/Metro Colombo Urban Development Project
Funded by International Bank for Construction & Development
Completion 20th July 2016
Role in contract Main contractor
Location Colombo District
WATER AND WASTEWATER 51/
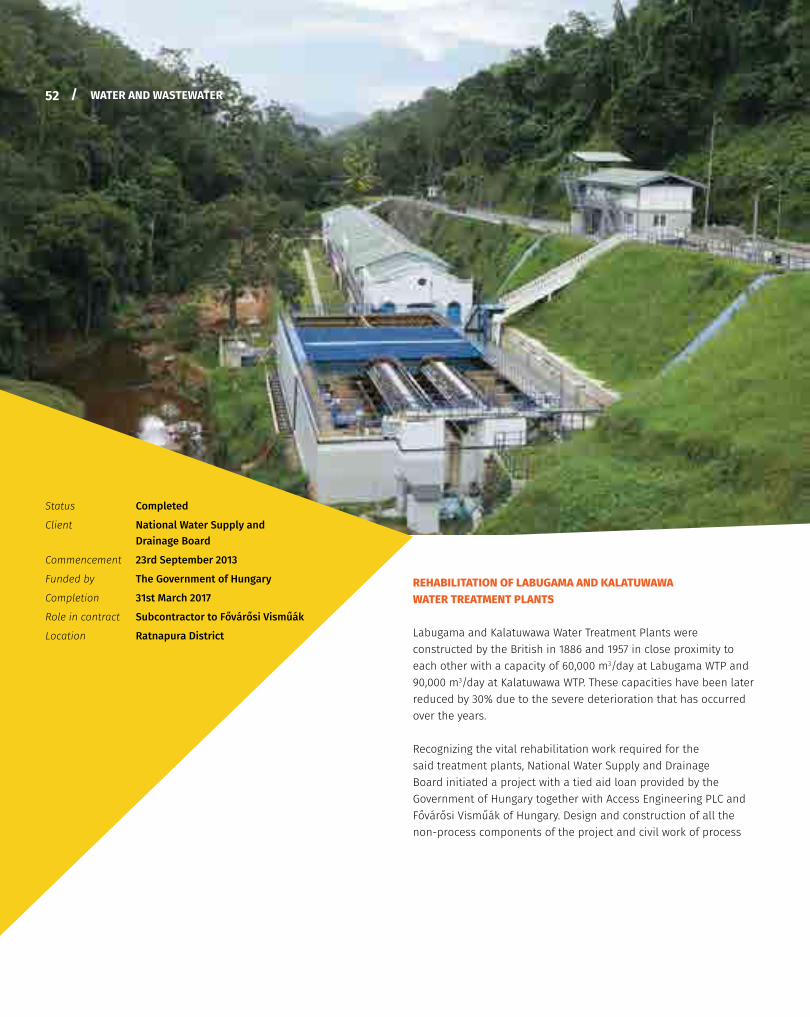
ACCESS ENGINEERING PLC // ANNUAL REPORT 2016/17
PREAMBLE BUSINESS MODEL VALUE CREATION STEWARDSHIP FINANCIAL REPORTS ANNEXES
REHABILITATION OF LABUGAMA AND KALATUWAWA WATER TREATMENT PLANTS
Labugama and Kalatuwawa Water Treatment Plants were constructed by the British in 1886 and 1957 in close proximity to each other with a capacity of 60,000 m3/day at Labugama WTP and 90,000 m3/day at Kalatuwawa WTP. These capacities have been later reduced by 30% due to the severe deterioration that has occurred over the years.
Recognizing the vital rehabilitation work required for the said treatment plants, National Water Supply and Drainage Board initiated a project with a tied aid loan provided by the Government of Hungary together with Access Engineering PLC and Fovarosi Vismuak of Hungary. Design and construction of all the non-process components of the project and civil work of process
Status Completed
Client National Water Supply and Drainage Board
Commencement 23rd September 2013
Funded by The Government of Hungary
Completion 31st March 2017
Role in contract Subcontractor to Fovarosi Vismuak
Location Ratnapura District
52 / WATER AND WASTEWATER
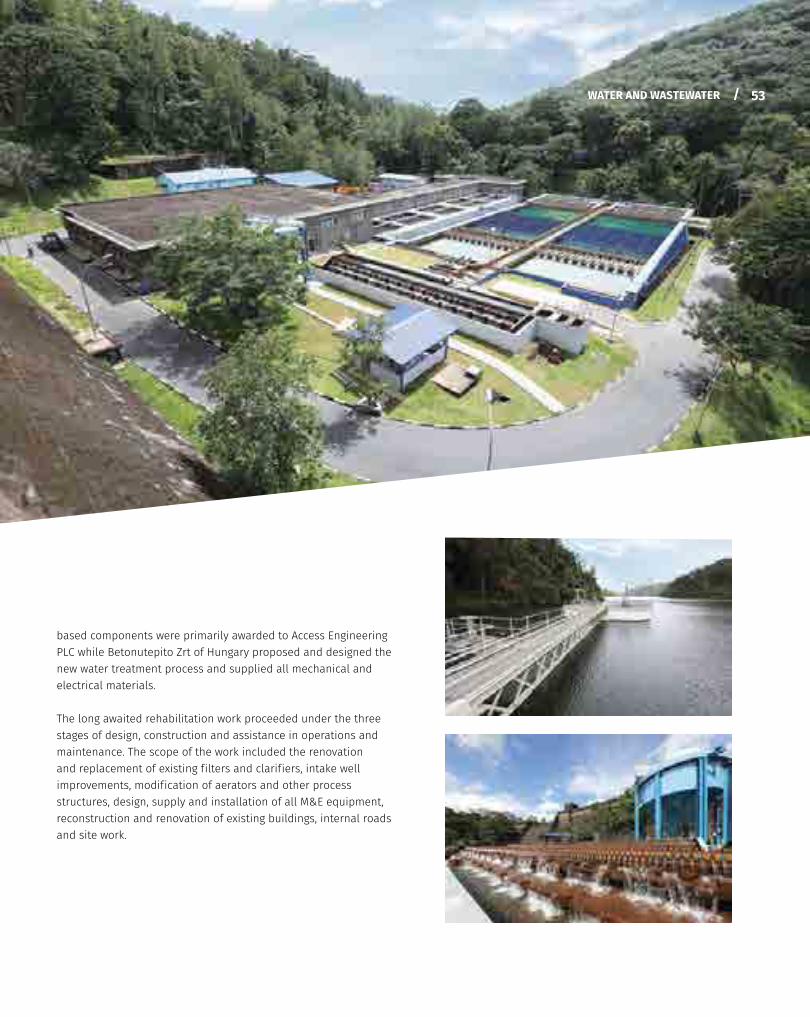
ACCESS ENGINEERING PLC // ANNUAL REPORT 2016/17
based components were primarily awarded to Access Engineering PLC while Betonutepito Zrt of Hungary proposed and designed the new water treatment process and supplied all mechanical and electrical materials.
The long awaited rehabilitation work proceeded under the three stages of design, construction and assistance in operations and maintenance. The scope of the work included the renovation and replacement of existing f ilters and clarif iers, intake well improvements, modif ication of aerators and other process structures, design, supply and installation of all M&E equipment, reconstruction and renovation of existing buildings, internal roads and site work.
53/WATER AND WASTEWATER
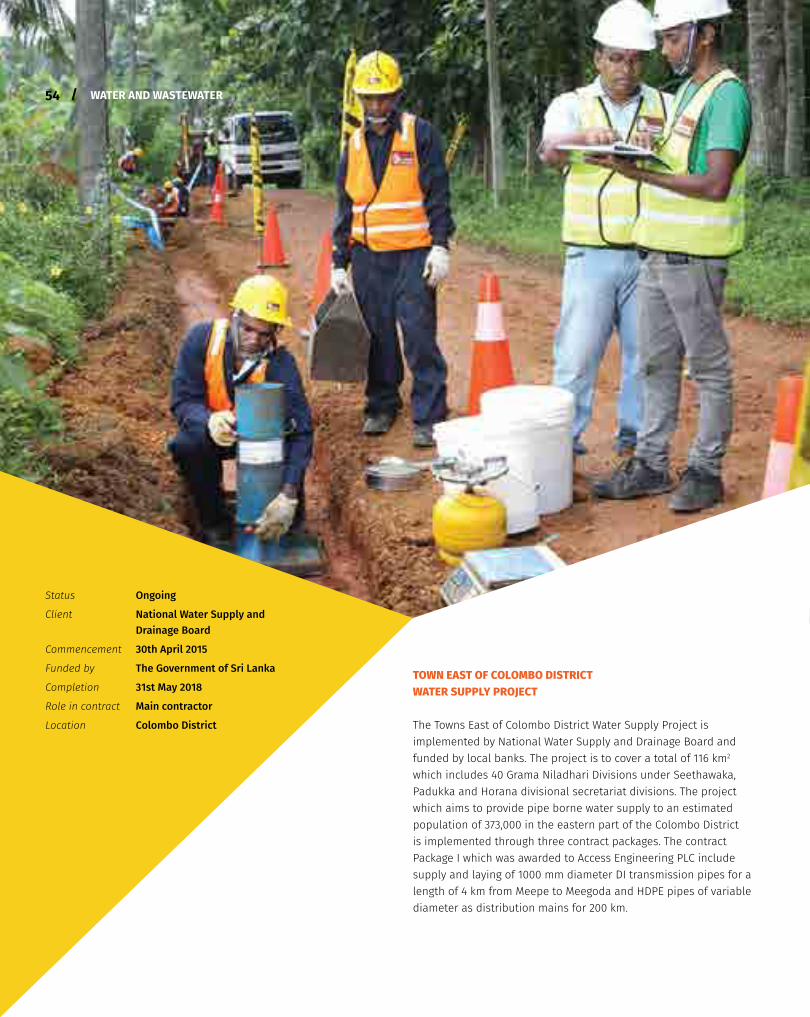
ACCESS ENGINEERING PLC // ANNUAL REPORT 2016/17
Status Ongoing
Client National Water Supply and Drainage Board
Commencement 30th April 2015
Funded by The Government of Sri Lanka
Completion 31st May 2018
Role in contract Main contractor
Location Colombo District
TOWN EAST OF COLOMBO DISTRICT WATER SUPPLY PROJECT
The Towns East of Colombo District Water Supply Project is implemented by National Water Supply and Drainage Board and funded by local banks. The project is to cover a total of 116 km2 which includes 40 Grama Niladhari Divisions under Seethawaka, Padukka and Horana divisional secretariat divisions. The project which aims to provide pipe borne water supply to an estimated population of 373,000 in the eastern part of the Colombo District is implemented through three contract packages. The contract Package I which was awarded to Access Engineering PLC include supply and laying of 1000 mm diameter DI transmission pipes for a length of 4 km from Meepe to Meegoda and HDPE pipes of variable diameter as distribution mains for 200 km.
/54 WATER AND WASTEWATER
55/
GREATER COLOMBO WASTEWATER MANAGEMENT PROJECT
The Greater Colombo Wastewater Management Project was initiated by National Water Supply and Drainage Board and the project was funded by the Asian Development Bank intending to improve the urban environment and public health of the urban and suburban residents of Colombo.
The Kolonnawa Sewerage System consists of 25 km sewer network and four wastewater pump stations (Kolonnawa, Wellampitiya, Meetotamulla, Dematagoda) including associated force mains. The entire flow of Kolonnawa Sewerage System is discharged to a manhole in the gravity sewer line which carries the flow to Maligawatta pump station.
Dehiwala and Mt. Lavinia Sewerage System which consists of 25 km sewerage network and two wastewater pump stations (Dehiwala, Mt. Lavinia) and associated force mains, pump the entire flow into Wellawatta sea outfall.
Status Completed
Client National Water Supply and Drainage Board
Commencement 16th January 2015
Funded by The Asian Development Bank
Completion 28th February 2017
Role in contract Subcontractor to CCB Envico (Private) Limited
Location Colombo District
The scope of the project includes rehabilitation of four wastewater pump stations under Kolonnawa Sewerage System and two pump stations of Dehiwala and Mt. Lavinia Sewerage System. Upon completion the project will rehabilitate above pump stations with f itted SCADA systems which automate the operation process by allowing operators and facility personnel to monitor and control the equipment either locally or remotely. Under the contract, each pump station consists of sanitary and off ice facilities required for the respective operational staff.
WATER AND WASTEWATER
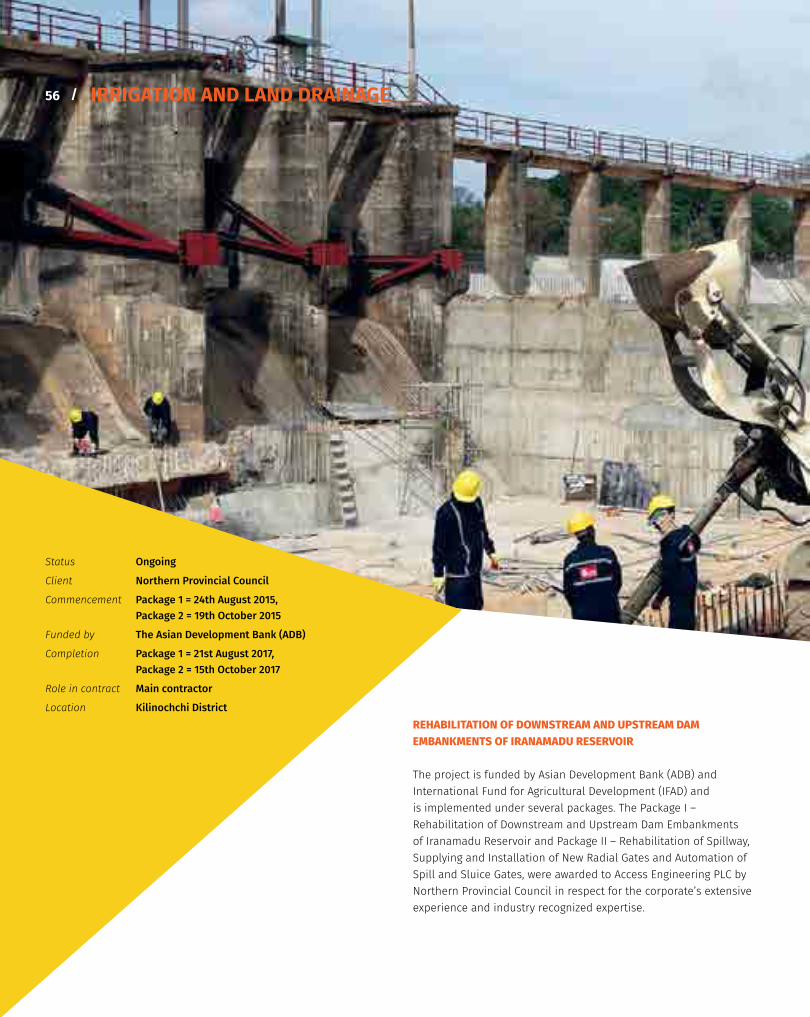
ACCESS ENGINEERING PLC // ANNUAL REPORT 2016/17
IRRIGATION AND LAND DRAINAGE
REHABILITATION OF DOWNSTREAM AND UPSTREAM DAM EMBANKMENTS OF IRANAMADU RESERVOIR
The project is funded by Asian Development Bank (ADB) and International Fund for Agricultural Development (IFAD) and is implemented under several packages. The Package I – Rehabilitation of Downstream and Upstream Dam Embankments of Iranamadu Reservoir and Package II – Rehabilitation of Spillway, Supplying and Installation of New Radial Gates and Automation of Spill and Sluice Gates, were awarded to Access Engineering PLC by Northern Provincial Council in respect for the corporate’s extensive experience and industry recognized expertise.
Status Ongoing
Client Northern Provincial Council
Commencement Package 1 = 24th August 2015, Package 2 = 19th October 2015
Funded by The Asian Development Bank (ADB)
Completion Package 1 = 21st August 2017, Package 2 = 15th October 2017
Role in contract Main contractor
Location Kilinochchi District
/56
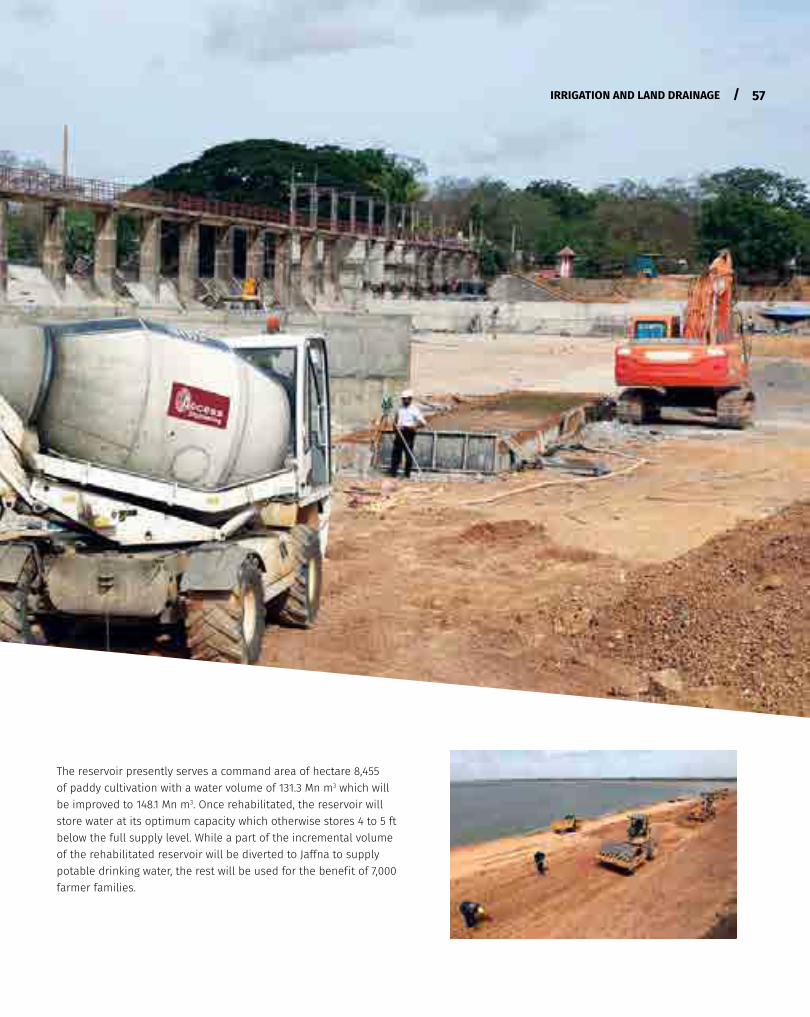
ACCESS ENGINEERING PLC // ANNUAL REPORT 2016/17
The reservoir presently serves a command area of hectare 8,455 of paddy cultivation with a water volume of 131.3 Mn m3 which will be improved to 148.1 Mn m3. Once rehabilitated, the reservoir will store water at its optimum capacity which otherwise stores 4 to 5 ft below the full supply level. While a part of the incremental volume of the rehabilitated reservoir will be diverted to Jaffna to supply potable drinking water, the rest will be used for the benef it of 7,000 farmer families.
57/IRRIGATION AND LAND DRAINAGE
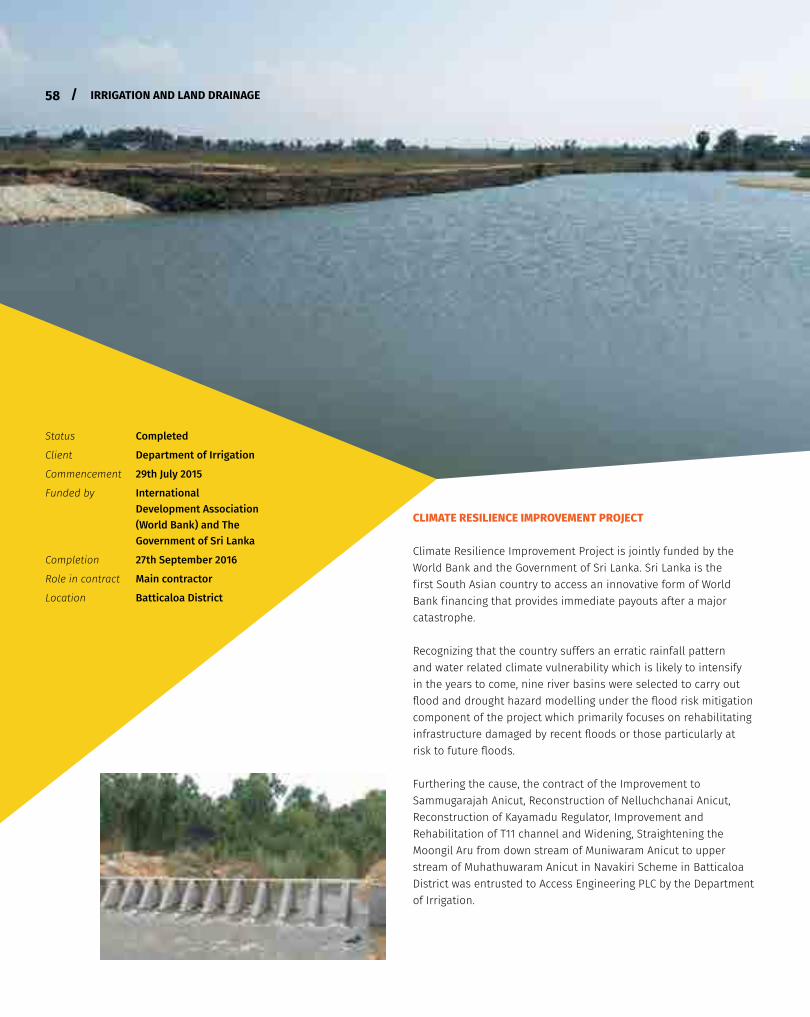
58 /
CLIMATE RESILIENCE IMPROVEMENT PROJECT
Climate Resilience Improvement Project is jointly funded by the World Bank and the Government of Sri Lanka. Sri Lanka is the f irst South Asian country to access an innovative form of World Bank f inancing that provides immediate payouts after a major catastrophe.
Recognizing that the country suffers an erratic rainfall pattern and water related climate vulnerability which is likely to intensify in the years to come, nine river basins were selected to carry out flood and drought hazard modelling under the flood risk mitigation component of the project which primarily focuses on rehabilitating infrastructure damaged by recent floods or those particularly at risk to future floods.
Furthering the cause, the contract of the Improvement to Sammugarajah Anicut, Reconstruction of Nelluchchanai Anicut, Reconstruction of Kayamadu Regulator, Improvement and Rehabilitation of T11 channel and Widening, Straightening the Moongil Aru from down stream of Muniwaram Anicut to upper stream of Muhathuwaram Anicut in Navakiri Scheme in Batticaloa District was entrusted to Access Engineering PLC by the Department of Irrigation.
Status Completed
Client Department of Irrigation
Commencement 29th July 2015
Funded by International Development Association (World Bank) and The Government of Sri Lanka
Completion 27th September 2016
Role in contract Main contractor
Location Batticaloa District
IRRIGATION AND LAND DRAINAGE/58
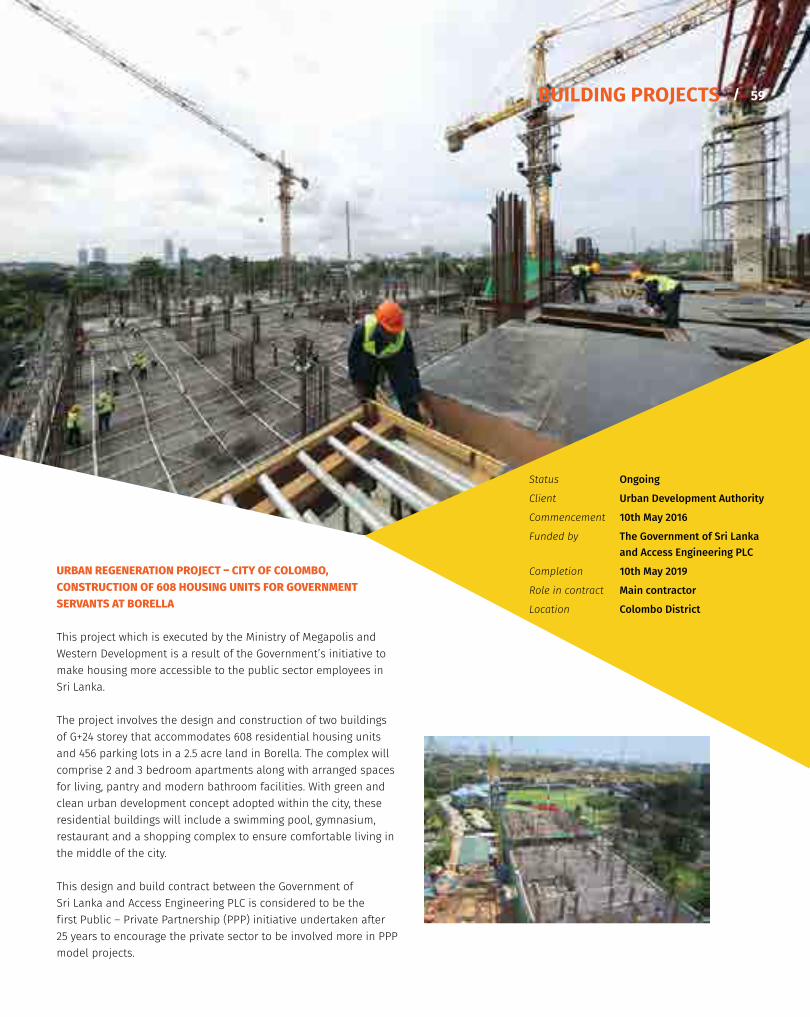
ACCESS ENGINEERING PLC // ANNUAL REPORT 2016/17
BUILDING PROJECTS
URBAN REGENERATION PROJECT – CITY OF COLOMBO, CONSTRUCTION OF 608 HOUSING UNITS FOR GOVERNMENT SERVANTS AT BORELLA
This project which is executed by the Ministry of Megapolis and Western Development is a result of the Government’s initiative to make housing more accessible to the public sector employees in Sri Lanka.
The project involves the design and construction of two buildings of G+24 storey that accommodates 608 residential housing units and 456 parking lots in a 2.5 acre land in Borella. The complex will comprise 2 and 3 bedroom apartments along with arranged spaces for living, pantry and modern bathroom facilities. With green and clean urban development concept adopted within the city, these residential buildings will include a swimming pool, gymnasium, restaurant and a shopping complex to ensure comfortable living in the middle of the city. This design and build contract between the Government of Sri Lanka and Access Engineering PLC is considered to be the f irst Public – Private Partnership (PPP) initiative undertaken after 25 years to encourage the private sector to be involved more in PPP model projects.
Status Ongoing
Client Urban Development Authority
Commencement 10th May 2016
Funded by The Government of Sri Lanka and Access Engineering PLC
Completion 10th May 2019
Role in contract Main contractor
Location Colombo District
59/
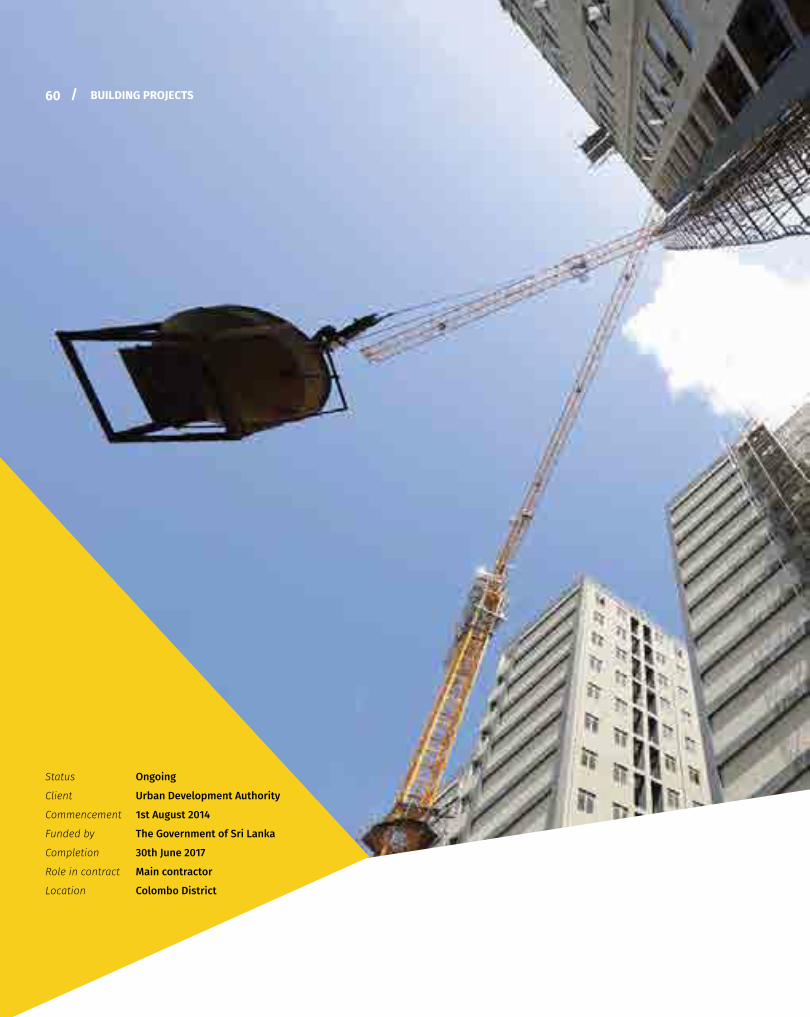
ACCESS ENGINEERING PLC // ANNUAL REPORT 2016/17
Status Ongoing
Client Urban Development Authority
Commencement 1st August 2014
Funded by The Government of Sri Lanka
Completion 30th June 2017
Role in contract Main contractor
Location Colombo District
60 / BUILDING PROJECTS
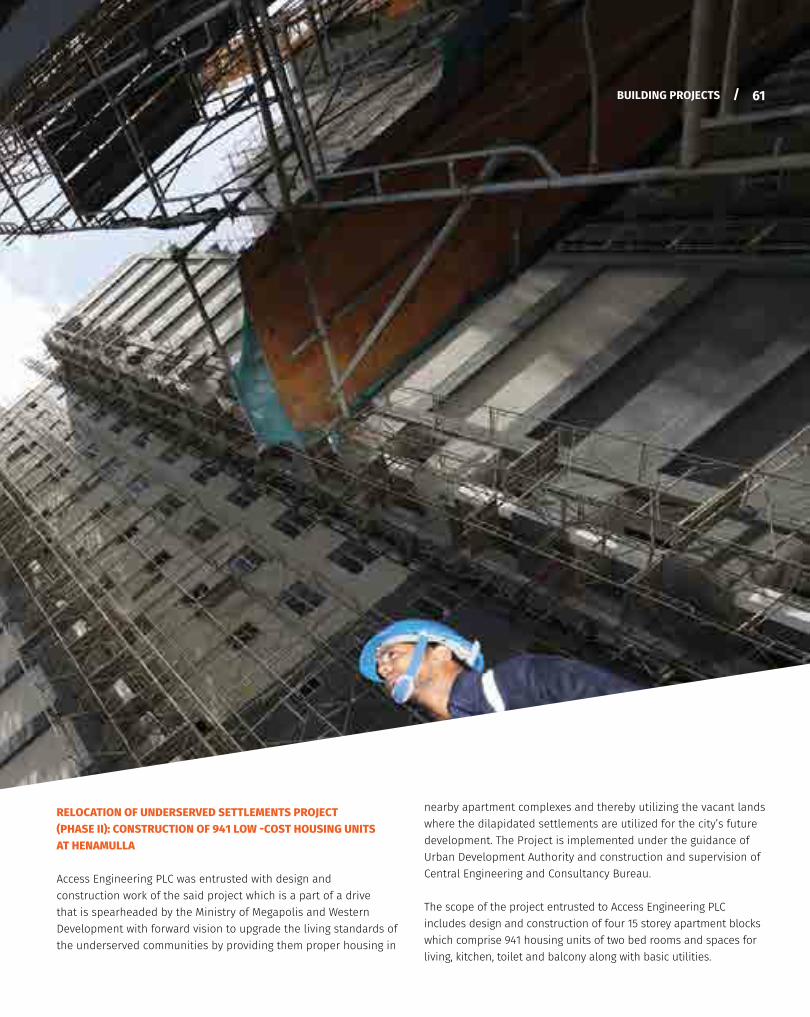
ACCESS ENGINEERING PLC // ANNUAL REPORT 2016/17
RELOCATION OF UNDERSERVED SETTLEMENTS PROJECT (PHASE II): CONSTRUCTION OF 941 LOW -COST HOUSING UNITS AT HENAMULLA
Access Engineering PLC was entrusted with design and construction work of the said project which is a part of a drive that is spearheaded by the Ministry of Megapolis and Western Development with forward vision to upgrade the living standards of the underserved communities by providing them proper housing in
nearby apartment complexes and thereby utilizing the vacant lands where the dilapidated settlements are utilized for the city’s future development. The Project is implemented under the guidance of Urban Development Authority and construction and supervision of Central Engineering and Consultancy Bureau.
The scope of the project entrusted to Access Engineering PLC includes design and construction of four 15 storey apartment blocks which comprise 941 housing units of two bed rooms and spaces for living, kitchen, toilet and balcony along with basic utilities.
/ 61BUILDING PROJECTS
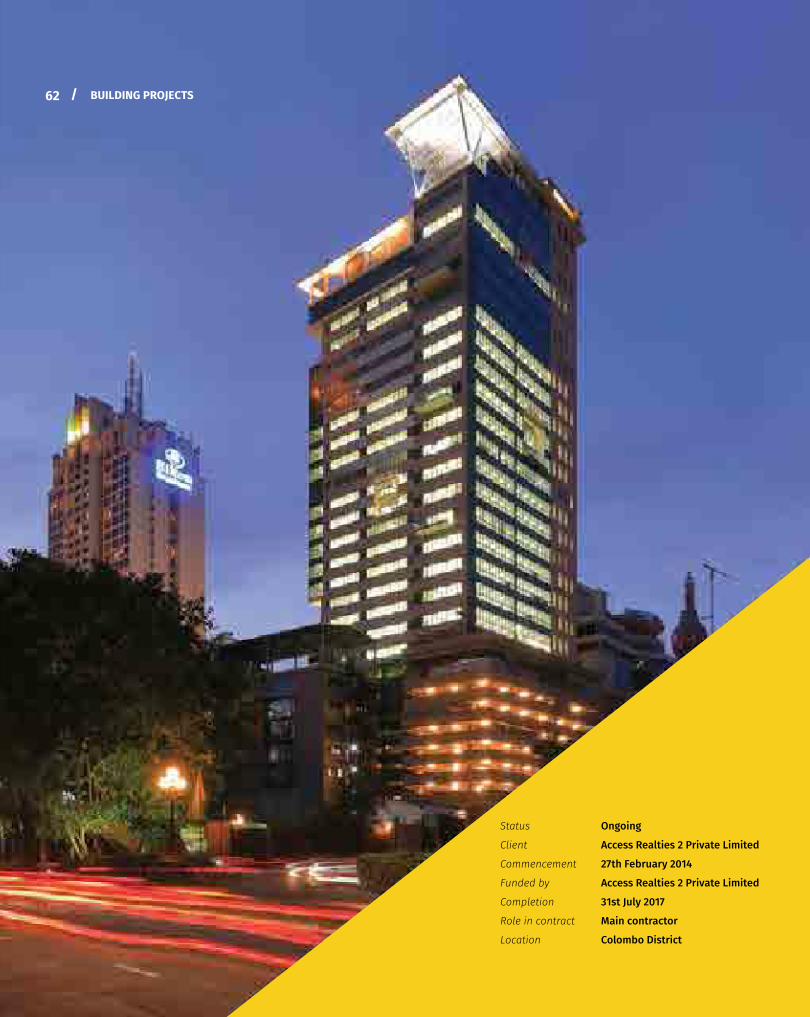
62 /
Status Ongoing
Client Access Realties 2 Private Limited
Commencement 27th February 2014
Funded by Access Realties 2 Private Limited
Completion 31st July 2017
Role in contract Main contractor
Location Colombo District
BUILDING PROJECTS62 /
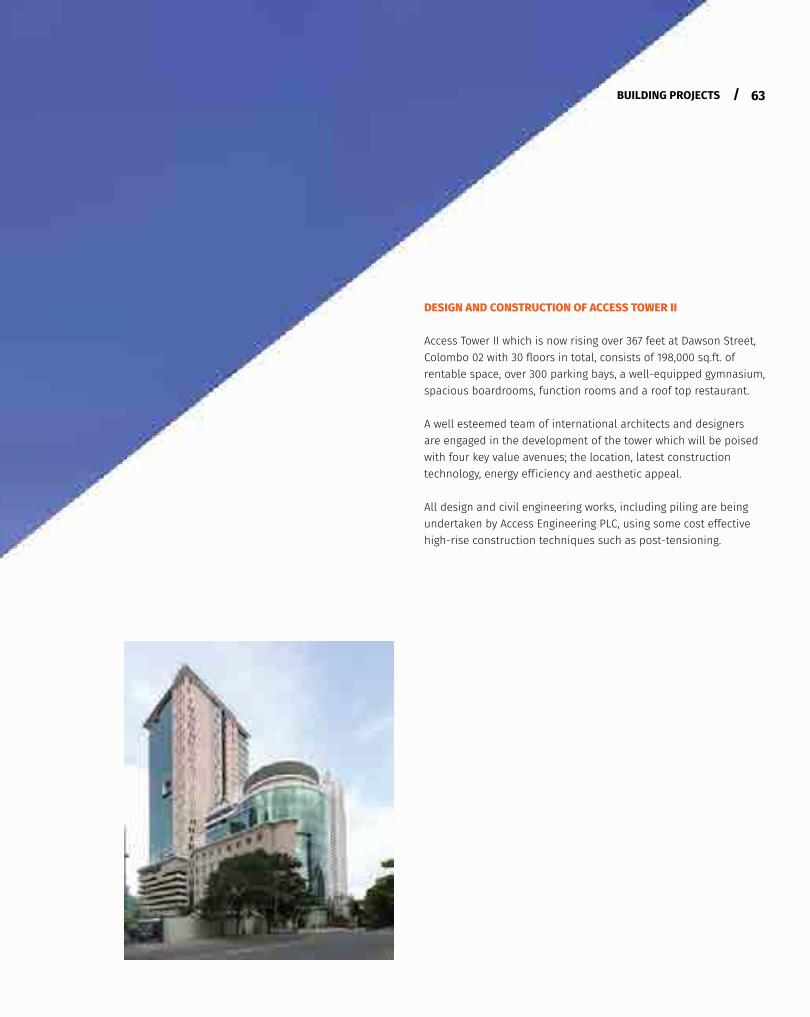
63/
DESIGN AND CONSTRUCTION OF ACCESS TOWER II
Access Tower II which is now rising over 367 feet at Dawson Street, Colombo 02 with 30 floors in total, consists of 198,000 sq.ft. of rentable space, over 300 parking bays, a well-equipped gymnasium, spacious boardrooms, function rooms and a roof top restaurant.
A well esteemed team of international architects and designers are engaged in the development of the tower which will be poised with four key value avenues; the location, latest construction technology, energy eff iciency and aesthetic appeal.
All design and civil engineering works, including piling are being undertaken by Access Engineering PLC, using some cost effective high-rise construction techniques such as post-tensioning.
BUILDING PROJECTS / 63
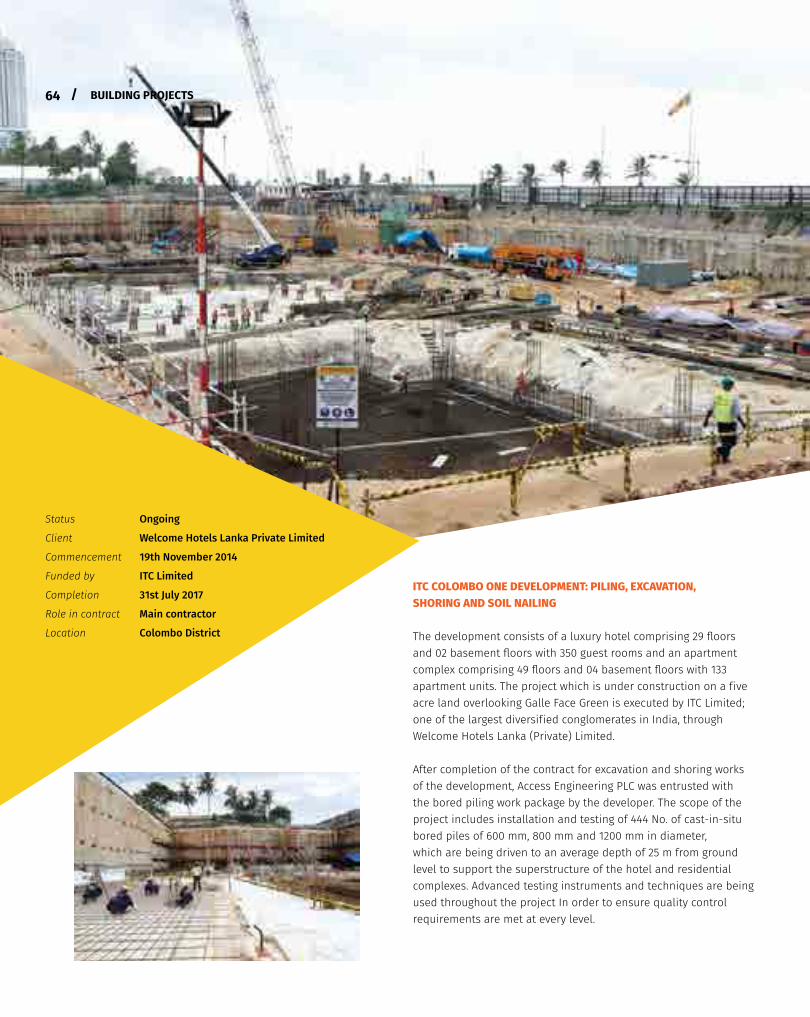
ACCESS ENGINEERING PLC // ANNUAL REPORT 2016/17
ITC COLOMBO ONE DEVELOPMENT: PILING, EXCAVATION, SHORING AND SOIL NAILING
The development consists of a luxury hotel comprising 29 floors and 02 basement floors with 350 guest rooms and an apartment complex comprising 49 floors and 04 basement floors with 133 apartment units. The project which is under construction on a f ive acre land overlooking Galle Face Green is executed by ITC Limited; one of the largest diversif ied conglomerates in India, through Welcome Hotels Lanka (Private) Limited.
After completion of the contract for excavation and shoring works of the development, Access Engineering PLC was entrusted with the bored piling work package by the developer. The scope of the project includes installation and testing of 444 No. of cast-in-situ bored piles of 600 mm, 800 mm and 1200 mm in diameter, which are being driven to an average depth of 25 m from ground level to support the superstructure of the hotel and residential complexes. Advanced testing instruments and techniques are being used throughout the project In order to ensure quality control requirements are met at every level.
Status Ongoing
Client Welcome Hotels Lanka Private Limited
Commencement 19th November 2014
Funded by ITC Limited
Completion 31st July 2017
Role in contract Main contractor
Location Colombo District
64 / BUILDING PROJECTS
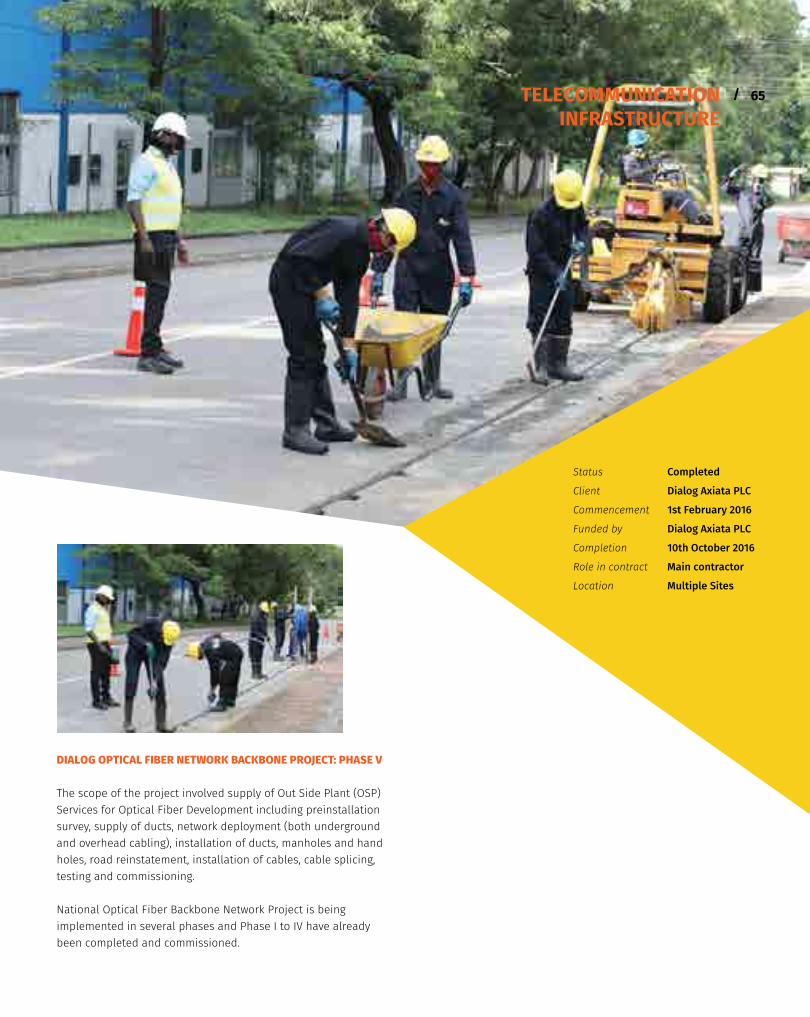
ACCESS ENGINEERING PLC // ANNUAL REPORT 2016/17
DIALOG OPTICAL FIBER NETWORK BACKBONE PROJECT: PHASE V
The scope of the project involved supply of Out Side Plant (OSP) Services for Optical Fiber Development including preinstallation survey, supply of ducts, network deployment (both underground and overhead cabling), installation of ducts, manholes and hand holes, road reinstatement, installation of cables, cable splicing, testing and commissioning.
National Optical Fiber Backbone Network Project is being implemented in several phases and Phase I to IV have already been completed and commissioned.
TELECOMMUNICATION INFRASTRUCTURE
Status Completed
Client Dialog Axiata PLC
Commencement 1st February 2016
Funded by Dialog Axiata PLC
Completion 10th October 2016
Role in contract Main contractor
Location Multiple Sites
/ 65
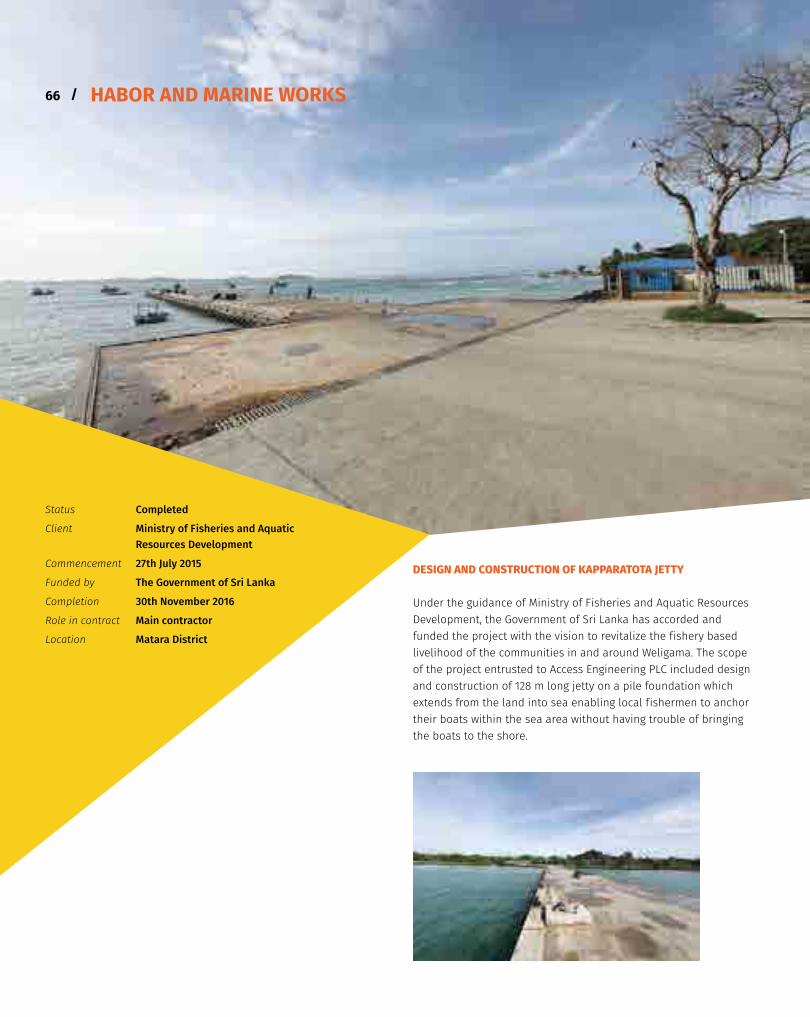
ACCESS ENGINEERING PLC // ANNUAL REPORT 2016/17
DESIGN AND CONSTRUCTION OF KAPPARATOTA JETTY
Under the guidance of Ministry of Fisheries and Aquatic Resources Development, the Government of Sri Lanka has accorded and funded the project with the vision to revitalize the f ishery based livelihood of the communities in and around Weligama. The scope of the project entrusted to Access Engineering PLC included design and construction of 128 m long jetty on a pile foundation which extends from the land into sea enabling local f ishermen to anchor their boats within the sea area without having trouble of bringing the boats to the shore.
HABOR AND MARINE WORKS
Status Completed
Client Ministry of Fisheries and Aquatic Resources Development
Commencement 27th July 2015
Funded by The Government of Sri Lanka
Completion 30th November 2016
Role in contract Main contractor
Location Matara District
66 /
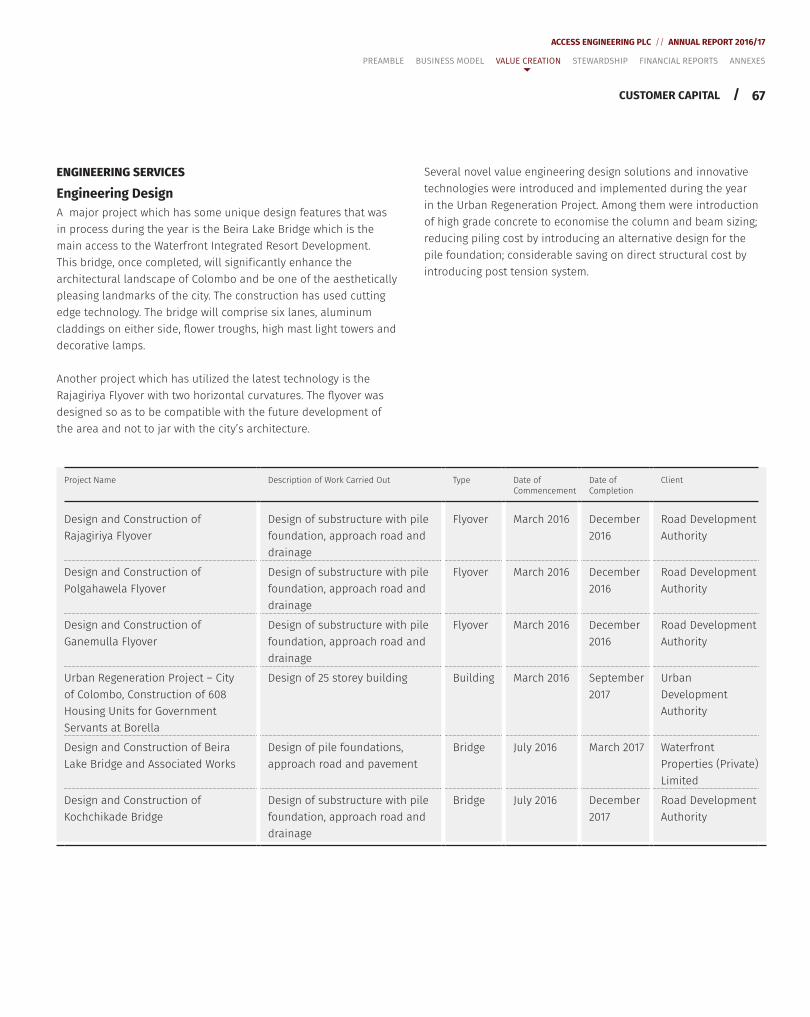
67
ACCESS ENGINEERING PLC // ANNUAL REPORT 2016/17
/
ENGINEERING SERVICES
Engineering DesignA major project which has some unique design features that was in process during the year is the Beira Lake Bridge which is the main access to the Waterfront Integrated Resort Development. This bridge, once completed, will signif icantly enhance the architectural landscape of Colombo and be one of the aesthetically pleasing landmarks of the city. The construction has used cutting edge technology. The bridge will comprise six lanes, aluminum claddings on either side, flower troughs, high mast light towers and decorative lamps.
Another project which has utilized the latest technology is the Rajagiriya Flyover with two horizontal curvatures. The flyover was designed so as to be compatible with the future development of the area and not to jar with the city’s architecture.
Several novel value engineering design solutions and innovative technologies were introduced and implemented during the year in the Urban Regeneration Project. Among them were introduction of high grade concrete to economise the column and beam sizing; reducing piling cost by introducing an alternative design for the pile foundation; considerable saving on direct structural cost by introducing post tension system.
Project Name Description of Work Carried Out Type Date of Commencement
Date of Completion
Client
Design and Construction ofRajagiriya Flyover
Design of substructure with pile foundation, approach road and drainage
Flyover March 2016 December 2016
Road Development Authority
Design and Construction ofPolgahawela Flyover
Design of substructure with pile foundation, approach road and drainage
Flyover March 2016 December 2016
Road Development Authority
Design and Construction ofGanemulla Flyover
Design of substructure with pile foundation, approach road and drainage
Flyover March 2016 December 2016
Road Development Authority
Urban Regeneration Project – City of Colombo, Construction of 608 Housing Units for Government Servants at Borella
Design of 25 storey building Building March 2016 September 2017
Urban Development Authority
Design and Construction of Beira Lake Bridge and Associated Works
Design of pile foundations, approach road and pavement
Bridge July 2016 March 2017 Waterfront Properties (Private) Limited
Design and Construction of Kochchikade Bridge
Design of substructure with pile foundation, approach road and drainage
Bridge July 2016 December 2017
Road Development Authority
CUSTOMER CAPITAL
PREAMBLE BUSINESS MODEL VALUE CREATION STEWARDSHIP FINANCIAL REPORTS ANNEXES
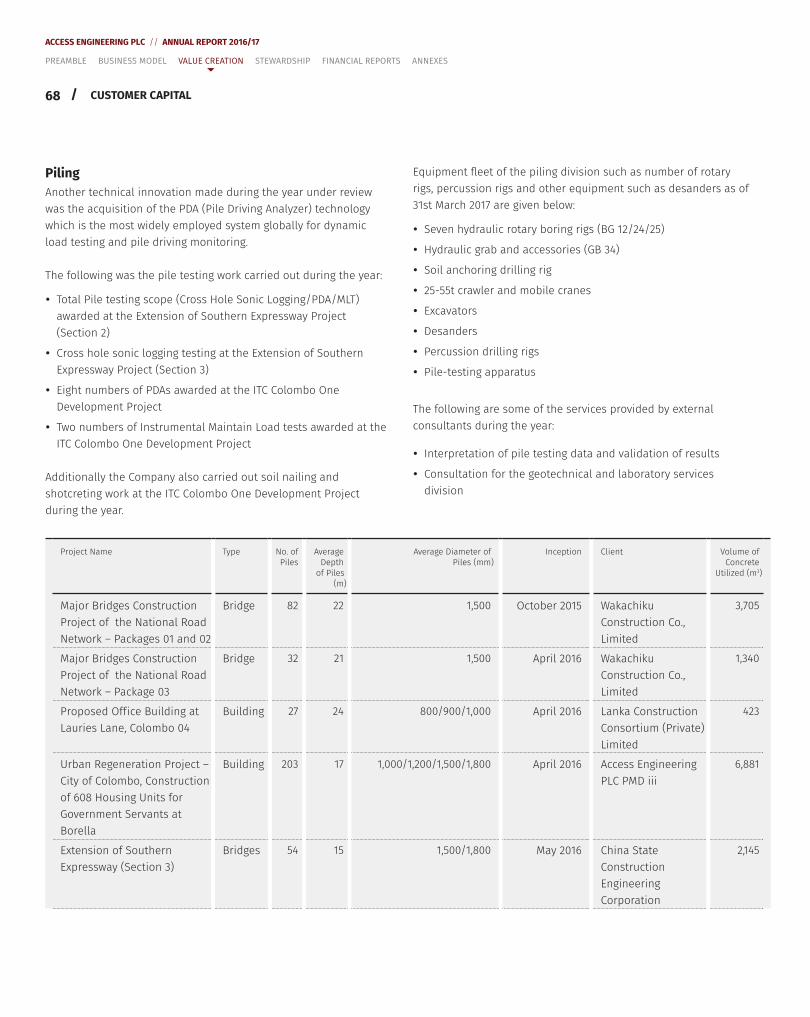
68 /
ACCESS ENGINEERING PLC // ANNUAL REPORT 2016/17
PilingAnother technical innovation made during the year under review was the acquisition of the PDA (Pile Driving Analyzer) technology which is the most widely employed system globally for dynamic load testing and pile driving monitoring.
The following was the pile testing work carried out during the year:
y Total Pile testing scope (Cross Hole Sonic Logging/PDA/MLT) awarded at the Extension of Southern Expressway Project (Section 2)
y Cross hole sonic logging testing at the Extension of Southern Expressway Project (Section 3)
y Eight numbers of PDAs awarded at the ITC Colombo One Development Project
y Two numbers of Instrumental Maintain Load tests awarded at the ITC Colombo One Development Project
Additionally the Company also carried out soil nailing and shotcreting work at the ITC Colombo One Development Project during the year.
Equipment fleet of the piling division such as number of rotary rigs, percussion rigs and other equipment such as desanders as of 31st March 2017 are given below:
y Seven hydraulic rotary boring rigs (BG 12/24/25)
y Hydraulic grab and accessories (GB 34)
y Soil anchoring drilling rig
y 25-55t crawler and mobile cranes
y Excavators
y Desanders
y Percussion drilling rigs
y Pile-testing apparatus
The following are some of the services provided by external consultants during the year:
y Interpretation of pile testing data and validation of results
y Consultation for the geotechnical and laboratory services division
CUSTOMER CAPITAL
Project Name Type No. of Piles
Average Depth
of Piles (m)
Average Diameter of Piles (mm)
Inception Client Volume of Concrete
Utilized (m3)
Major Bridges Construction Project of the National Road Network – Packages 01 and 02
Bridge 82 22 1,500 October 2015 Wakachiku Construction Co.,Limited
3,705
Major Bridges Construction Project of the National Road Network – Package 03
Bridge 32 21 1,500 April 2016 Wakachiku Construction Co., Limited
1,340
Proposed Off ice Building at Lauries Lane, Colombo 04
Building 27 24 800/900/1,000 April 2016 Lanka Construction Consortium (Private) Limited
423
Urban Regeneration Project – City of Colombo, Construction of 608 Housing Units for Government Servants at Borella
Building 203 17 1,000/1,200/1,500/1,800 April 2016 Access Engineering PLC PMD iii
6,881
Extension of Southern Expressway (Section 3)
Bridges 54 15 1,500/1,800 May 2016 China State Construction Engineering Corporation
2,145
PREAMBLE BUSINESS MODEL VALUE CREATION STEWARDSHIP FINANCIAL REPORTS ANNEXES
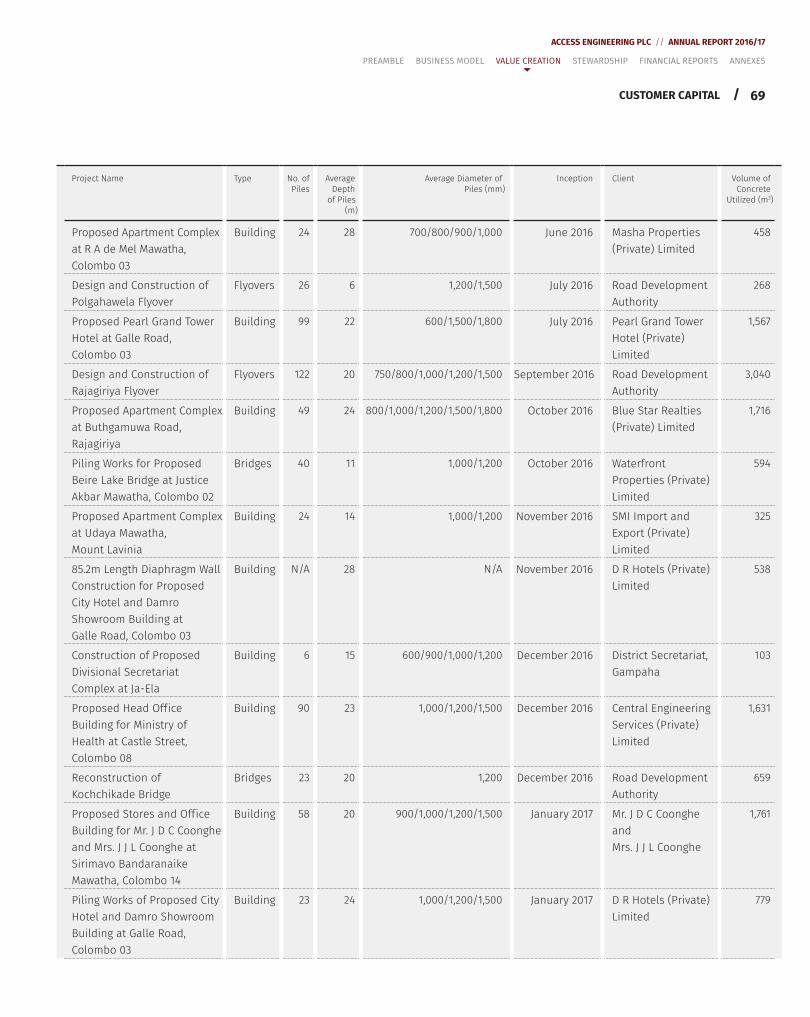
69
ACCESS ENGINEERING PLC // ANNUAL REPORT 2016/17
/
Project Name Type No. of Piles
Average Depth
of Piles (m)
Average Diameter of Piles (mm)
Inception Client Volume of Concrete
Utilized (m3)
Proposed Apartment Complex at R A de Mel Mawatha, Colombo 03
Building 24 28 700/800/900/1,000 June 2016 Masha Properties (Private) Limited
458
Design and Construction of Polgahawela Flyover
Flyovers 26 6 1,200/1,500 July 2016 Road Development Authority
268
Proposed Pearl Grand Tower Hotel at Galle Road, Colombo 03
Building 99 22 600/1,500/1,800 July 2016 Pearl Grand Tower Hotel (Private) Limited
1,567
Design and Construction of Rajagiriya Flyover
Flyovers 122 20 750/800/1,000/1,200/1,500 September 2016 Road Development Authority
3,040
Proposed Apartment Complex at Buthgamuwa Road, Rajagiriya
Building 49 24 800/1,000/1,200/1,500/1,800 October 2016 Blue Star Realties (Private) Limited
1,716
Piling Works for Proposed Beire Lake Bridge at Justice Akbar Mawatha, Colombo 02
Bridges 40 11 1,000/1,200 October 2016 Waterfront Properties (Private) Limited
594
Proposed Apartment Complex at Udaya Mawatha, Mount Lavinia
Building 24 14 1,000/1,200 November 2016 SMI Import and Export (Private) Limited
325
85.2m Length Diaphragm Wall Construction for Proposed City Hotel and Damro Showroom Building at Galle Road, Colombo 03
Building N/A 28 N/A November 2016 D R Hotels (Private) Limited
538
Construction of Proposed Divisional Secretariat Complex at Ja-Ela
Building 6 15 600/900/1,000/1,200 December 2016 District Secretariat, Gampaha
103
Proposed Head Off ice Building for Ministry of Health at Castle Street, Colombo 08
Building 90 23 1,000/1,200/1,500 December 2016 Central Engineering Services (Private) Limited
1,631
Reconstruction of Kochchikade Bridge
Bridges 23 20 1,200 December 2016 Road Development Authority
659
Proposed Stores and Off ice Building for Mr. J D C Coonghe and Mrs. J J L Coonghe at Sirimavo Bandaranaike Mawatha, Colombo 14
Building 58 20 900/1,000/1,200/1,500 January 2017 Mr. J D C Coonghe and Mrs. J J L Coonghe
1,761
Piling Works of Proposed City Hotel and Damro Showroom Building at Galle Road, Colombo 03
Building 23 24 1,000/1,200/1,500 January 2017 D R Hotels (Private) Limited
779
CUSTOMER CAPITAL
PREAMBLE BUSINESS MODEL VALUE CREATION STEWARDSHIP FINANCIAL REPORTS ANNEXES
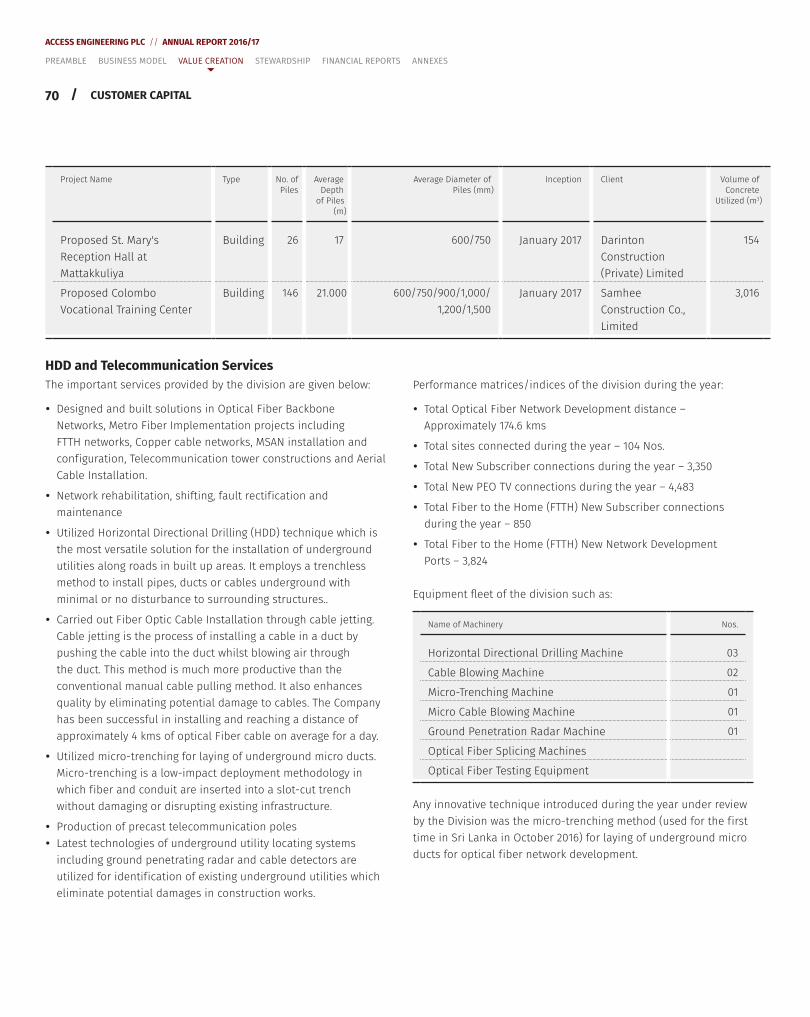
70 /
ACCESS ENGINEERING PLC // ANNUAL REPORT 2016/17
Project Name Type No. of Piles
Average Depth
of Piles (m)
Average Diameter of Piles (mm)
Inception Client Volume of Concrete
Utilized (m3)
Proposed St. Mary's Reception Hall at Mattakkuliya
Building 26 17 600/750 January 2017 Darinton Construction (Private) Limited
154
Proposed Colombo Vocational Training Center
Building 146 21.000 600/750/900/1,000/ 1,200/1,500
January 2017 Samhee Construction Co., Limited
3,016
HDD and Telecommunication ServicesThe important services provided by the division are given below:
y Designed and built solutions in Optical Fiber Backbone Networks, Metro Fiber Implementation projects including FTTH networks, Copper cable networks, MSAN installation and conf iguration, Telecommunication tower constructions and Aerial Cable Installation.
y Network rehabilitation, shifting, fault rectif ication and maintenance
y Utilized Horizontal Directional Drilling (HDD) technique which is the most versatile solution for the installation of underground utilities along roads in built up areas. It employs a trenchless method to install pipes, ducts or cables underground with minimal or no disturbance to surrounding structures..
y Carried out Fiber Optic Cable Installation through cable jetting. Cable jetting is the process of installing a cable in a duct by pushing the cable into the duct whilst blowing air through the duct. This method is much more productive than the conventional manual cable pulling method. It also enhances quality by eliminating potential damage to cables. The Company has been successful in installing and reaching a distance of approximately 4 kms of optical Fiber cable on average for a day.
y Utilized micro-trenching for laying of underground micro ducts. Micro-trenching is a low-impact deployment methodology in which f iber and conduit are inserted into a slot-cut trench without damaging or disrupting existing infrastructure.
y Production of precast telecommunication poles y Latest technologies of underground utility locating systems including ground penetrating radar and cable detectors are utilized for identif ication of existing underground utilities which eliminate potential damages in construction works.
CUSTOMER CAPITAL
Performance matrices/indices of the division during the year:
y Total Optical Fiber Network Development distance – Approximately 174.6 kms
y Total sites connected during the year – 104 Nos.
y Total New Subscriber connections during the year – 3,350
y Total New PEO TV connections during the year – 4,483
y Total Fiber to the Home (FTTH) New Subscriber connections during the year – 850
y Total Fiber to the Home (FTTH) New Network Development Ports – 3,824
Equipment fleet of the division such as:
Name of Machinery Nos.
Horizontal Directional Drilling Machine 03
Cable Blowing Machine 02
Micro-Trenching Machine 01
Micro Cable Blowing Machine 01
Ground Penetration Radar Machine 01
Optical Fiber Splicing Machines
Optical Fiber Testing Equipment
Any innovative technique introduced during the year under review by the Division was the micro-trenching method (used for the f irst time in Sri Lanka in October 2016) for laying of underground micro ducts for optical f iber network development.
PREAMBLE BUSINESS MODEL VALUE CREATION STEWARDSHIP FINANCIAL REPORTS ANNEXES
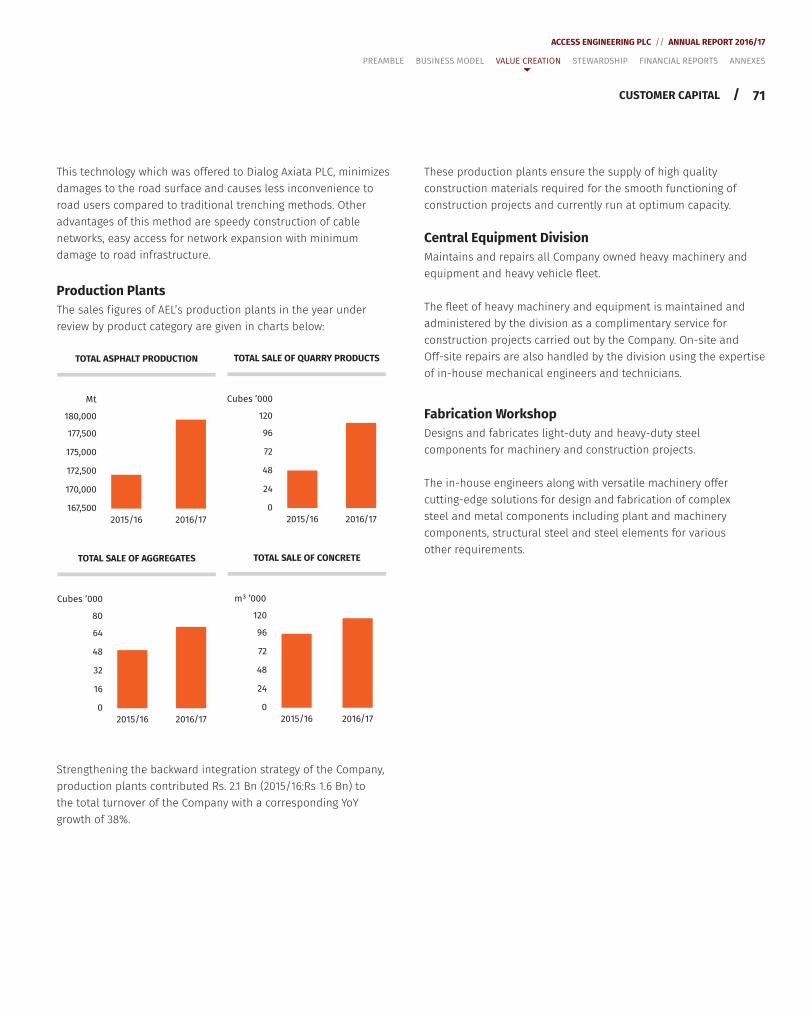
71
ACCESS ENGINEERING PLC // ANNUAL REPORT 2016/17
/CUSTOMER CAPITAL
This technology which was offered to Dialog Axiata PLC, minimizes damages to the road surface and causes less inconvenience to road users compared to traditional trenching methods. Other advantages of this method are speedy construction of cable networks, easy access for network expansion with minimum damage to road infrastructure.
Production PlantsThe sales f igures of AEL’s production plants in the year under review by product category are given in charts below:
TOTAL ASPHALT PRODUCTION
Mt
180,000
177,500
175,000
172,500
170,000
167,500
2015/16 2016/17
TOTAL SALE OF QUARRY PRODUCTS
Cubes ’000
120
96
72
48
24
0
2015/16 2016/17
TOTAL SALE OF AGGREGATES
Cubes ’000
80
64
48
32
16
0
2015/16 2016/17
TOTAL SALE OF CONCRETE
m ’000³
120
96
72
48
24
0
2015/16 2016/17
Strengthening the backward integration strategy of the Company, production plants contributed Rs. 2.1 Bn (2015/16:Rs 1.6 Bn) to the total turnover of the Company with a corresponding YoY growth of 38%.
PREAMBLE BUSINESS MODEL VALUE CREATION STEWARDSHIP FINANCIAL REPORTS ANNEXES
These production plants ensure the supply of high quality construction materials required for the smooth functioning of construction projects and currently run at optimum capacity.
Central Equipment DivisionMaintains and repairs all Company owned heavy machinery and equipment and heavy vehicle fleet.
The fleet of heavy machinery and equipment is maintained and administered by the division as a complimentary service for construction projects carried out by the Company. On-site and Off-site repairs are also handled by the division using the expertise of in-house mechanical engineers and technicians.
Fabrication WorkshopDesigns and fabricates light-duty and heavy-duty steel components for machinery and construction projects.
The in-house engineers along with versatile machinery offer cutting-edge solutions for design and fabrication of complex steel and metal components including plant and machinery components, structural steel and steel elements for various other requirements.
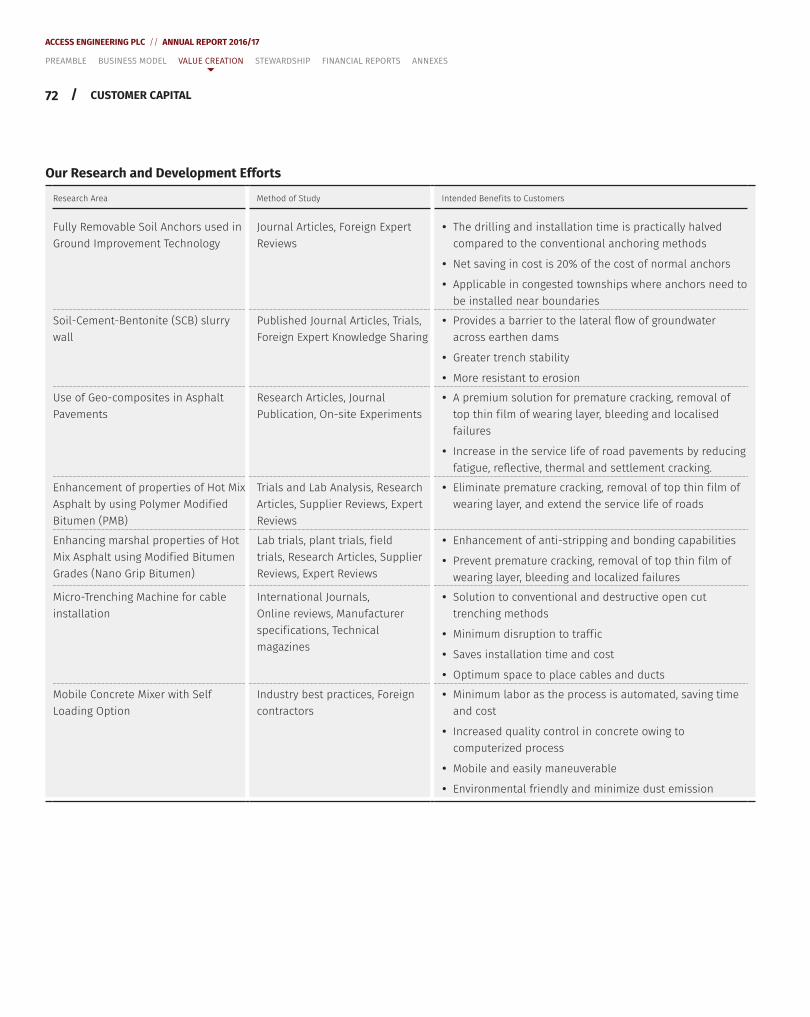
72 /
ACCESS ENGINEERING PLC // ANNUAL REPORT 2016/17
Our Research and Development Efforts
Research Area Method of Study Intended Benef its to Customers
Fully Removable Soil Anchors used in Ground Improvement Technology
Journal Articles, Foreign Expert Reviews
y The drilling and installation time is practically halved compared to the conventional anchoring methods
y Net saving in cost is 20% of the cost of normal anchors
y Applicable in congested townships where anchors need to be installed near boundaries
Soil-Cement-Bentonite (SCB) slurry wall
Published Journal Articles, Trials, Foreign Expert Knowledge Sharing
y Provides a barrier to the lateral flow of groundwater across earthen dams
y Greater trench stability
y More resistant to erosion
Use of Geo-composites in Asphalt Pavements
Research Articles, Journal Publication, On-site Experiments
y A premium solution for premature cracking, removal of top thin f ilm of wearing layer, bleeding and localised failures
y Increase in the service life of road pavements by reducing fatigue, reflective, thermal and settlement cracking.
Enhancement of properties of Hot Mix Asphalt by using Polymer Modif ied Bitumen (PMB)
Trials and Lab Analysis, Research Articles, Supplier Reviews, Expert Reviews
y Eliminate premature cracking, removal of top thin f ilm of wearing layer, and extend the service life of roads
Enhancing marshal properties of Hot Mix Asphalt using Modif ied Bitumen Grades (Nano Grip Bitumen)
Lab trials, plant trials, f ield trials, Research Articles, Supplier Reviews, Expert Reviews
y Enhancement of anti-stripping and bonding capabilities
y Prevent premature cracking, removal of top thin f ilm of wearing layer, bleeding and localized failures
Micro-Trenching Machine for cable installation
International Journals, Online reviews, Manufacturer specif ications, Technical magazines
y Solution to conventional and destructive open cut trenching methods
y Minimum disruption to traff ic
y Saves installation time and cost
y Optimum space to place cables and ducts
Mobile Concrete Mixer with Self Loading Option
Industry best practices, Foreign contractors
y Minimum labor as the process is automated, saving time and cost
y Increased quality control in concrete owing to computerized process
y Mobile and easily maneuverable
y Environmental friendly and minimize dust emission
PREAMBLE BUSINESS MODEL VALUE CREATION STEWARDSHIP FINANCIAL REPORTS ANNEXES
CUSTOMER CAPITAL
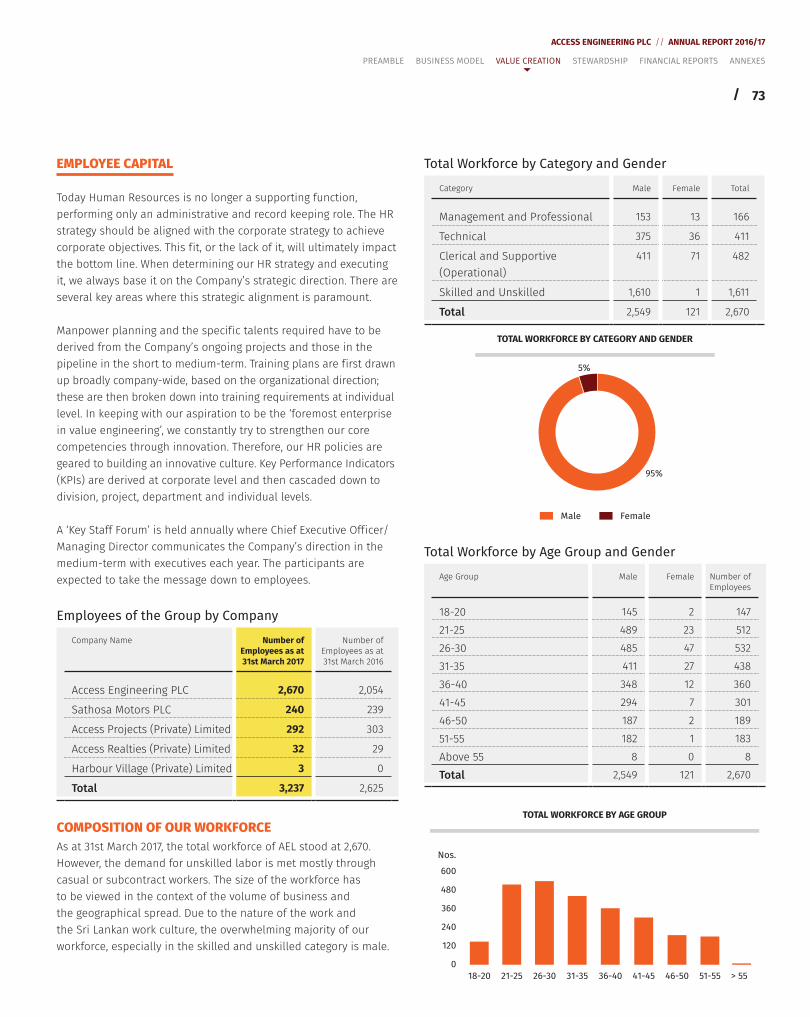
73
ACCESS ENGINEERING PLC // ANNUAL REPORT 2016/17
/
EMPLOYEE CAPITAL
Today Human Resources is no longer a supporting function, performing only an administrative and record keeping role. The HR strategy should be aligned with the corporate strategy to achieve corporate objectives. This f it, or the lack of it, will ultimately impact the bottom line. When determining our HR strategy and executing it, we always base it on the Company’s strategic direction. There are several key areas where this strategic alignment is paramount.
Manpower planning and the specif ic talents required have to be derived from the Company’s ongoing projects and those in the pipeline in the short to medium-term. Training plans are f irst drawn up broadly company-wide, based on the organizational direction; these are then broken down into training requirements at individual level. In keeping with our aspiration to be the ‘foremost enterprise in value engineering’, we constantly try to strengthen our core competencies through innovation. Therefore, our HR policies are geared to building an innovative culture. Key Performance Indicators (KPIs) are derived at corporate level and then cascaded down to division, project, department and individual levels.
A ‘Key Staff Forum’ is held annually where Chief Executive Off icer/Managing Director communicates the Company’s direction in the medium-term with executives each year. The participants are expected to take the message down to employees.
Employees of the Group by Company
Company Name Number of Employees as at 31st March 2017
Number of Employees as at 31st March 2016
Access Engineering PLC 2,670 2,054
Sathosa Motors PLC 240 239
Access Projects (Private) Limited 292 303
Access Realties (Private) Limited 32 29
Harbour Village (Private) Limited 3 0
Total 3,237 2,625
COMPOSITION OF OUR WORKFORCE As at 31st March 2017, the total workforce of AEL stood at 2,670. However, the demand for unskilled labor is met mostly through casual or subcontract workers. The size of the workforce has to be viewed in the context of the volume of business and the geographical spread. Due to the nature of the work and the Sri Lankan work culture, the overwhelming majority of our workforce, especially in the skilled and unskilled category is male.
Total Workforce by Category and Gender
Category Male Female Total
Management and Professional 153 13 166
Technical 375 36 411
Clerical and Supportive (Operational)
411 71 482
Skilled and Unskilled 1,610 1 1,611
Total 2,549 121 2,670
5%
95%
TOTAL WORKFORCE BY CATEGORY AND GENDER
Male Female
Total Workforce by Age Group and Gender
Age Group Male Female Number of Employees
18-20 145 2 14721-25 489 23 51226-30 485 47 53231-35 411 27 43836-40 348 12 36041-45 294 7 30146-50 187 2 18951-55 182 1 183Above 55 8 0 8Total 2,549 121 2,670
TOTAL WORKFORCE BY AGE GROUP
Nos.
600
480
360
240
120
0
18-20 21-25 26-30 31-35 36-40 41-45 46-50 51-55 > 55
PREAMBLE BUSINESS MODEL VALUE CREATION STEWARDSHIP FINANCIAL REPORTS ANNEXES
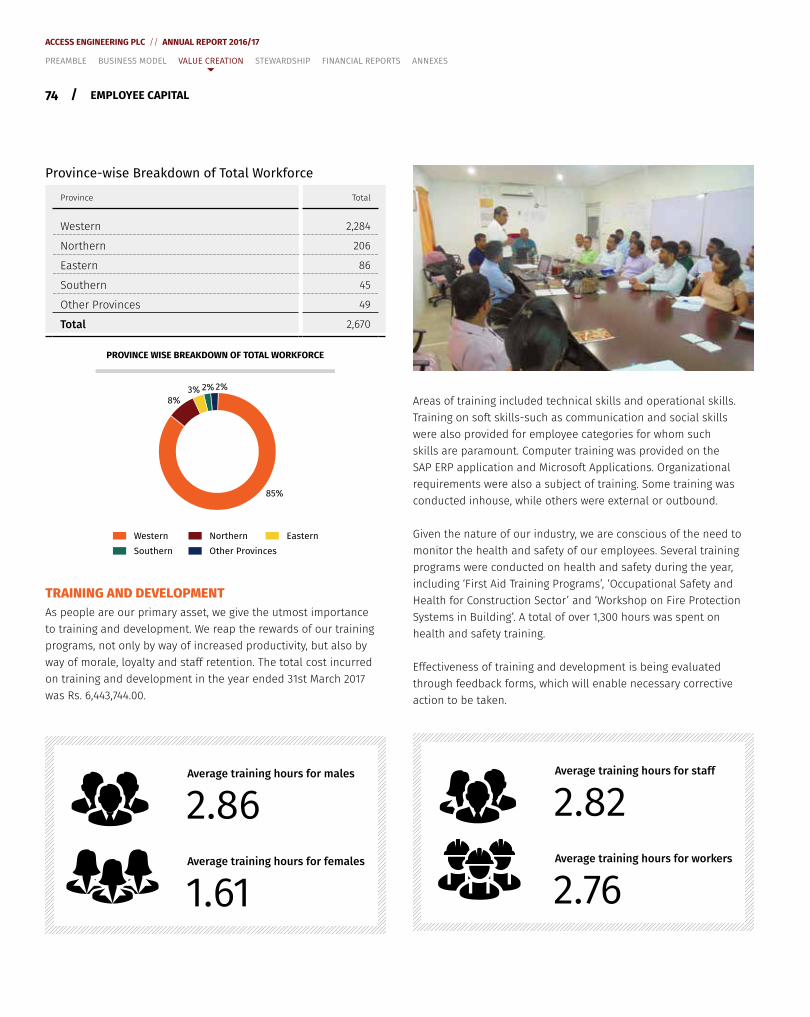
74 /
ACCESS ENGINEERING PLC // ANNUAL REPORT 2016/17
EMPLOYEE CAPITAL
Province-wise Breakdown of Total Workforce
Province Total
Western 2,284
Northern 206
Eastern 86
Southern 45
Other Provinces 49
Total 2,670
8%3% 2% 2%
85%
PROVINCE WISE BREAKDOWN OF TOTAL WORKFORCE
Western Northern Eastern
Southern Other Provinces
TRAINING AND DEVELOPMENT As people are our primary asset, we give the utmost importance to training and development. We reap the rewards of our training programs, not only by way of increased productivity, but also by way of morale, loyalty and staff retention. The total cost incurred on training and development in the year ended 31st March 2017 was Rs. 6,443,744.00.
Areas of training included technical skills and operational skills. Training on soft skills-such as communication and social skills were also provided for employee categories for whom such skills are paramount. Computer training was provided on the SAP ERP application and Microsoft Applications. Organizational requirements were also a subject of training. Some training was conducted inhouse, while others were external or outbound.
Given the nature of our industry, we are conscious of the need to monitor the health and safety of our employees. Several training programs were conducted on health and safety during the year, including ‘First Aid Training Programs’, ‘Occupational Safety and Health for Construction Sector’ and ‘Workshop on Fire Protection Systems in Building’. A total of over 1,300 hours was spent on health and safety training.
Effectiveness of training and development is being evaluated through feedback forms, which will enable necessary corrective action to be taken.
Average training hours for staff
2.82Average training hours for workers
2.76
Average training hours for males
2.86Average training hours for females
1.61
PREAMBLE BUSINESS MODEL VALUE CREATION STEWARDSHIP FINANCIAL REPORTS ANNEXES
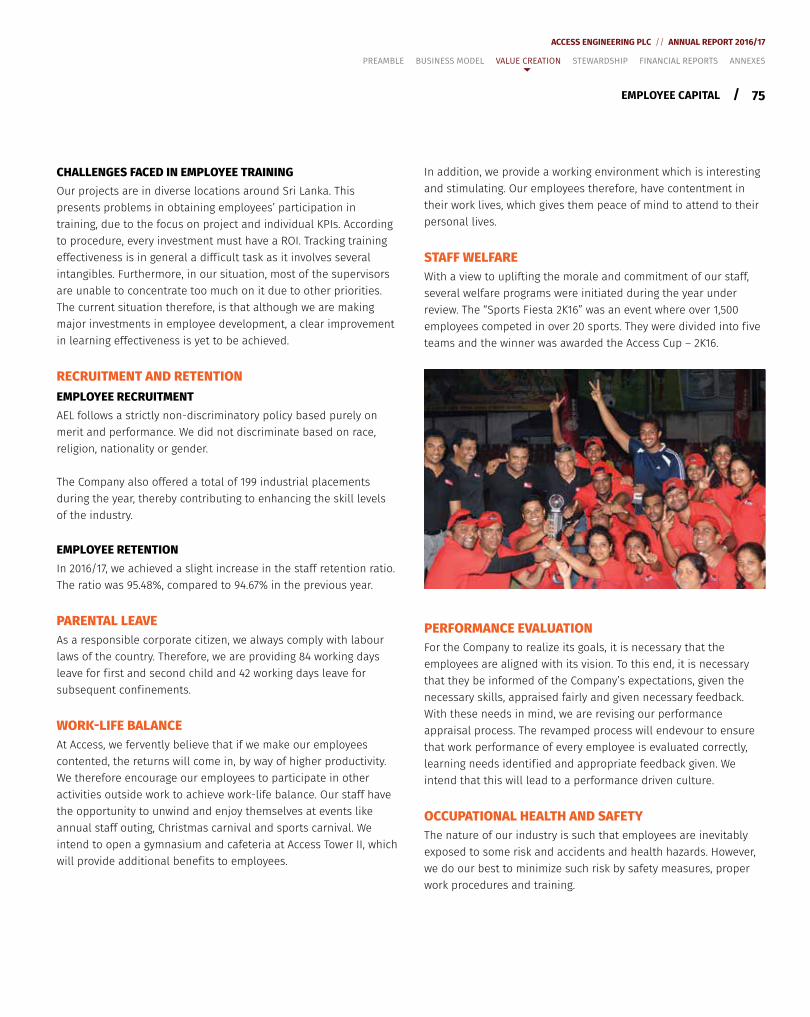
75
ACCESS ENGINEERING PLC // ANNUAL REPORT 2016/17
/
CHALLENGES FACED IN EMPLOYEE TRAININGOur projects are in diverse locations around Sri Lanka. This presents problems in obtaining employees’ participation in training, due to the focus on project and individual KPIs. According to procedure, every investment must have a ROI. Tracking training effectiveness is in general a diff icult task as it involves several intangibles. Furthermore, in our situation, most of the supervisors are unable to concentrate too much on it due to other priorities. The current situation therefore, is that although we are making major investments in employee development, a clear improvement in learning effectiveness is yet to be achieved.
RECRUITMENT AND RETENTIONEMPLOYEE RECRUITMENTAEL follows a strictly non-discriminatory policy based purely on merit and performance. We did not discriminate based on race, religion, nationality or gender.
The Company also offered a total of 199 industrial placements during the year, thereby contributing to enhancing the skill levels of the industry.
EMPLOYEE RETENTIONIn 2016/17, we achieved a slight increase in the staff retention ratio. The ratio was 95.48%, compared to 94.67% in the previous year.
PARENTAL LEAVEAs a responsible corporate citizen, we always comply with labour laws of the country. Therefore, we are providing 84 working days leave for f irst and second child and 42 working days leave for subsequent conf inements.
WORK-LIFE BALANCE At Access, we fervently believe that if we make our employees contented, the returns will come in, by way of higher productivity. We therefore encourage our employees to participate in other activities outside work to achieve work-life balance. Our staff have the opportunity to unwind and enjoy themselves at events like annual staff outing, Christmas carnival and sports carnival. We intend to open a gymnasium and cafeteria at Access Tower II, which will provide additional benef its to employees.
In addition, we provide a working environment which is interesting and stimulating. Our employees therefore, have contentment in their work lives, which gives them peace of mind to attend to their personal lives.
STAFF WELFARE With a view to uplifting the morale and commitment of our staff, several welfare programs were initiated during the year under review. The “Sports Fiesta 2K16” was an event where over 1,500 employees competed in over 20 sports. They were divided into f ive teams and the winner was awarded the Access Cup – 2K16.
PERFORMANCE EVALUATIONFor the Company to realize its goals, it is necessary that the employees are aligned with its vision. To this end, it is necessary that they be informed of the Company’s expectations, given the necessary skills, appraised fairly and given necessary feedback. With these needs in mind, we are revising our performance appraisal process. The revamped process will endevour to ensure that work performance of every employee is evaluated correctly, learning needs identif ied and appropriate feedback given. We intend that this will lead to a performance driven culture.
OCCUPATIONAL HEALTH AND SAFETYThe nature of our industry is such that employees are inevitably exposed to some risk and accidents and health hazards. However, we do our best to minimize such risk by safety measures, proper work procedures and training.
EMPLOYEE CAPITAL
PREAMBLE BUSINESS MODEL VALUE CREATION STEWARDSHIP FINANCIAL REPORTS ANNEXES
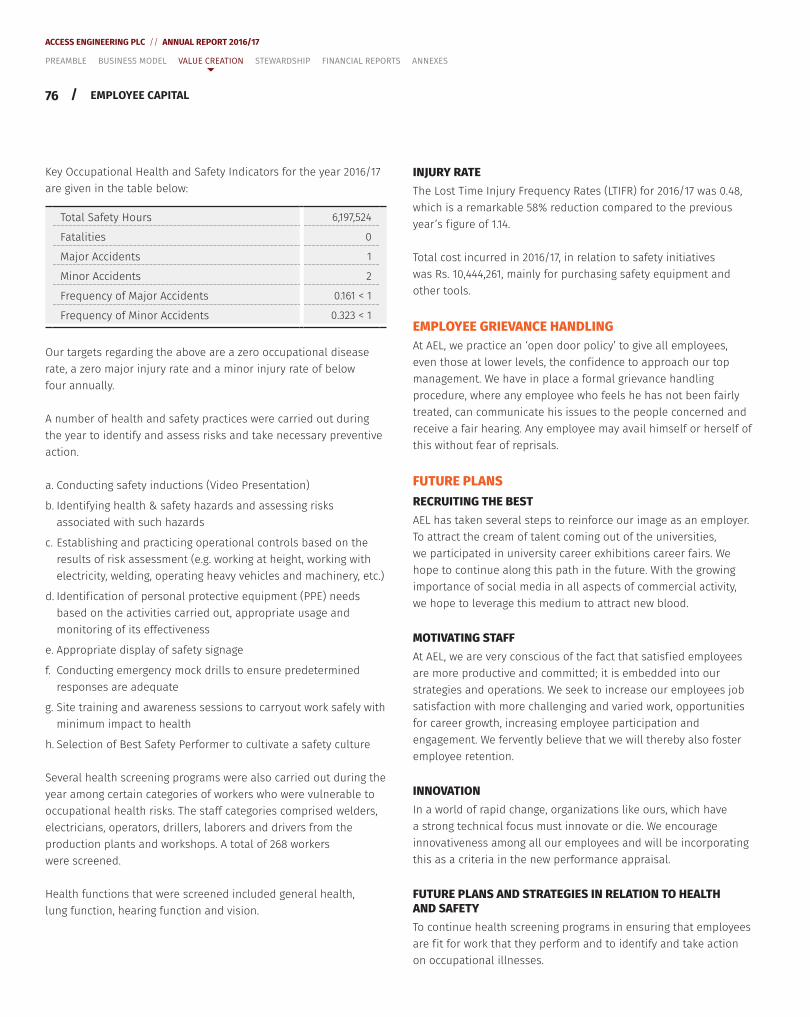
76 /
ACCESS ENGINEERING PLC // ANNUAL REPORT 2016/17
Key Occupational Health and Safety Indicators for the year 2016/17 are given in the table below:
Total Safety Hours 6,197,524
Fatalities 0
Major Accidents 1
Minor Accidents 2
Frequency of Major Accidents 0.161 < 1
Frequency of Minor Accidents 0.323 < 1
Our targets regarding the above are a zero occupational disease rate, a zero major injury rate and a minor injury rate of below four annually.
A number of health and safety practices were carried out during the year to identify and assess risks and take necessary preventive action.
a. Conducting safety inductions (Video Presentation)
b. Identifying health & safety hazards and assessing risks associated with such hazards
c. Establishing and practicing operational controls based on the results of risk assessment (e.g. working at height, working with electricity, welding, operating heavy vehicles and machinery, etc.)
d. Identif ication of personal protective equipment (PPE) needs based on the activities carried out, appropriate usage and monitoring of its effectiveness
e. Appropriate display of safety signage
f. Conducting emergency mock drills to ensure predetermined responses are adequate
g. Site training and awareness sessions to carryout work safely with minimum impact to health
h. Selection of Best Safety Performer to cultivate a safety culture
Several health screening programs were also carried out during the year among certain categories of workers who were vulnerable to occupational health risks. The staff categories comprised welders, electricians, operators, drillers, laborers and drivers from the production plants and workshops. A total of 268 workers were screened.
Health functions that were screened included general health, lung function, hearing function and vision.
INJURY RATEThe Lost Time Injury Frequency Rates (LTIFR) for 2016/17 was 0.48, which is a remarkable 58% reduction compared to the previous year’s f igure of 1.14.
Total cost incurred in 2016/17, in relation to safety initiatives was Rs. 10,444,261, mainly for purchasing safety equipment and other tools.
EMPLOYEE GRIEVANCE HANDLING At AEL, we practice an ‘open door policy’ to give all employees, even those at lower levels, the conf idence to approach our top management. We have in place a formal grievance handling procedure, where any employee who feels he has not been fairly treated, can communicate his issues to the people concerned and receive a fair hearing. Any employee may avail himself or herself of this without fear of reprisals.
FUTURE PLANSRECRUITING THE BESTAEL has taken several steps to reinforce our image as an employer. To attract the cream of talent coming out of the universities, we participated in university career exhibitions career fairs. We hope to continue along this path in the future. With the growing importance of social media in all aspects of commercial activity, we hope to leverage this medium to attract new blood.
MOTIVATING STAFFAt AEL, we are very conscious of the fact that satisf ied employees are more productive and committed; it is embedded into our strategies and operations. We seek to increase our employees job satisfaction with more challenging and varied work, opportunities for career growth, increasing employee participation and engagement. We fervently believe that we will thereby also foster employee retention.
INNOVATIONIn a world of rapid change, organizations like ours, which have a strong technical focus must innovate or die. We encourage innovativeness among all our employees and will be incorporating this as a criteria in the new performance appraisal.
FUTURE PLANS AND STRATEGIES IN RELATION TO HEALTH AND SAFETYTo continue health screening programs in ensuring that employees are f it for work that they perform and to identify and take action on occupational illnesses.
EMPLOYEE CAPITAL
PREAMBLE BUSINESS MODEL VALUE CREATION STEWARDSHIP FINANCIAL REPORTS ANNEXES
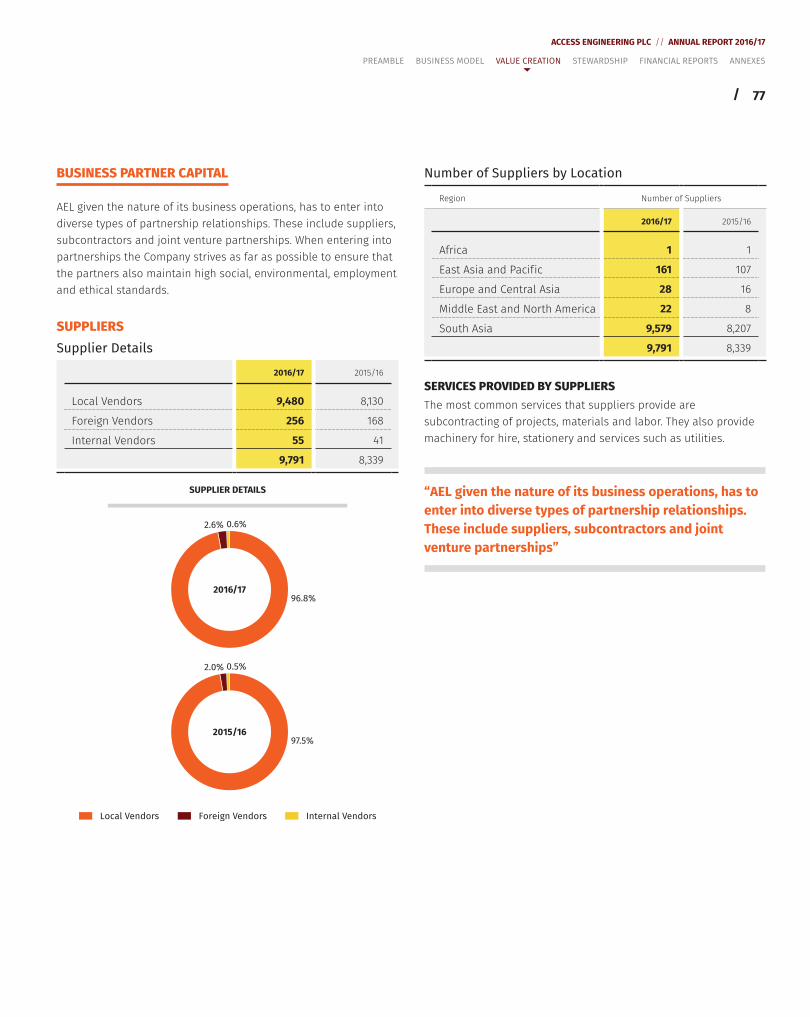
77
ACCESS ENGINEERING PLC // ANNUAL REPORT 2016/17
/
BUSINESS PARTNER CAPITAL
AEL given the nature of its business operations, has to enter into diverse types of partnership relationships. These include suppliers, subcontractors and joint venture partnerships. When entering into partnerships the Company strives as far as possible to ensure that the partners also maintain high social, environmental, employment and ethical standards.
SUPPLIERSSupplier Details
2016/17 2015/16
Local Vendors 9,480 8,130
Foreign Vendors 256 168
Internal Vendors 55 41
9,791 8,339
SUPPLIER DETAILS
Local Vendors Internal VendorsForeign Vendors
97.5%
2.0% 0.5%
96.8%
2.6% 0.6%
2016/17
2015/16
Number of Suppliers by Location
Region Number of Suppliers
2016/17 2015/16
Africa 1 1
East Asia and Pacif ic 161 107
Europe and Central Asia 28 16
Middle East and North America 22 8
South Asia 9,579 8,207
9,791 8,339
SERVICES PROVIDED BY SUPPLIERS The most common services that suppliers provide are subcontracting of projects, materials and labor. They also provide machinery for hire, stationery and services such as utilities.
“AEL given the nature of its business operations, has to enter into diverse types of partnership relationships. These include suppliers, subcontractors and joint venture partnerships”
PREAMBLE BUSINESS MODEL VALUE CREATION STEWARDSHIP FINANCIAL REPORTS ANNEXES
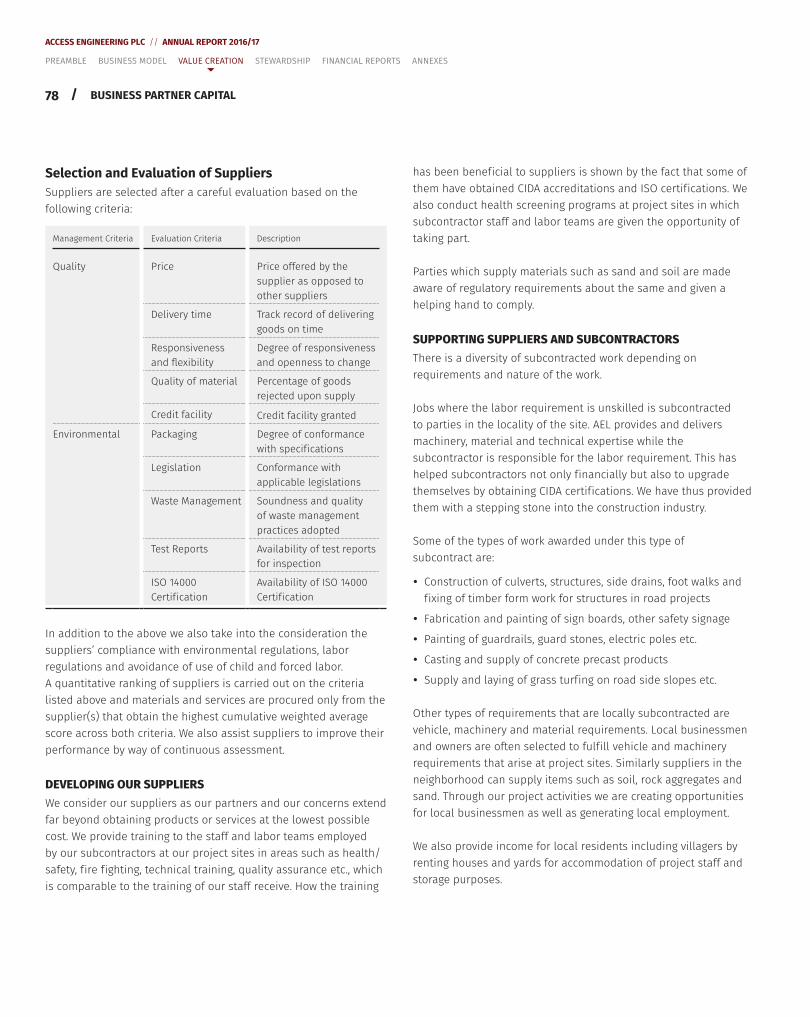
78 /
ACCESS ENGINEERING PLC // ANNUAL REPORT 2016/17
BUSINESS PARTNER CAPITAL
Selection and Evaluation of Suppliers Suppliers are selected after a careful evaluation based on the following criteria:
Management Criteria Evaluation Criteria Description
Quality Price Price offered by the supplier as opposed to other suppliers
Delivery time Track record of delivering goods on time
Responsiveness and flexibility
Degree of responsiveness and openness to change
Quality of material Percentage of goods rejected upon supply
Credit facility Credit facility granted
Environmental Packaging Degree of conformance with specif ications
Legislation Conformance with applicable legislations
Waste Management Soundness and quality of waste management practices adopted
Test Reports Availability of test reports for inspection
ISO 14000 Certif ication
Availability of ISO 14000 Certif ication
In addition to the above we also take into the consideration the suppliers’ compliance with environmental regulations, labor regulations and avoidance of use of child and forced labor. A quantitative ranking of suppliers is carried out on the criteria listed above and materials and services are procured only from the supplier(s) that obtain the highest cumulative weighted average score across both criteria. We also assist suppliers to improve their performance by way of continuous assessment.
DEVELOPING OUR SUPPLIERS We consider our suppliers as our partners and our concerns extend far beyond obtaining products or services at the lowest possible cost. We provide training to the staff and labor teams employed by our subcontractors at our project sites in areas such as health/safety, f ire f ighting, technical training, quality assurance etc., which is comparable to the training of our staff receive. How the training
has been benef icial to suppliers is shown by the fact that some of them have obtained CIDA accreditations and ISO certif ications. We also conduct health screening programs at project sites in which subcontractor staff and labor teams are given the opportunity of taking part.
Parties which supply materials such as sand and soil are made aware of regulatory requirements about the same and given a helping hand to comply.
SUPPORTING SUPPLIERS AND SUBCONTRACTORSThere is a diversity of subcontracted work depending on requirements and nature of the work.
Jobs where the labor requirement is unskilled is subcontracted to parties in the locality of the site. AEL provides and delivers machinery, material and technical expertise while the subcontractor is responsible for the labor requirement. This has helped subcontractors not only f inancially but also to upgrade themselves by obtaining CIDA certif ications. We have thus provided them with a stepping stone into the construction industry.
Some of the types of work awarded under this type of subcontract are:
y Construction of culverts, structures, side drains, foot walks and f ixing of timber form work for structures in road projects
y Fabrication and painting of sign boards, other safety signage
y Painting of guardrails, guard stones, electric poles etc.
y Casting and supply of concrete precast products
y Supply and laying of grass turf ing on road side slopes etc.
Other types of requirements that are locally subcontracted are vehicle, machinery and material requirements. Local businessmen and owners are often selected to fulf ill vehicle and machinery requirements that arise at project sites. Similarly suppliers in the neighborhood can supply items such as soil, rock aggregates and sand. Through our project activities we are creating opportunities for local businessmen as well as generating local employment.
We also provide income for local residents including villagers by renting houses and yards for accommodation of project staff and storage purposes.
PREAMBLE BUSINESS MODEL VALUE CREATION STEWARDSHIP FINANCIAL REPORTS ANNEXES
79
ACCESS ENGINEERING PLC // ANNUAL REPORT 2016/17
/
LABOR AND ENVIRONMENTAL STANDARDS APPLIED TO SUPPLIERS The labor and environmental standards applied to suppliers is given below:
Labor The following list is in addition to EPF, ETF and Gratuity related Acts:
y Wages Boards Ordinance
y Factories Ordinance
y Workmen’s Compensation Ordinance
y Employment of Women, Young Persons and Children Act
y Shop and Off ice Employees' Regulation
y Industrial Disputes ActEnvironmental y Environmental Protection License (EPL)
y Mining License
y Archeology Clearance
y UDA Clearance
OTHER BUSINESS PARTNERS The other types of business partnerships we enter into are as follows:
1. Subcontractor
2. Joint venture partner
3. Partner of a consortium
4. Public private partnerships
PARTNERSHIP PROJECTS DURING THE YEAR Rehabilitation of Labugama and Kalatuwawa water treatment plants which were executed in partnership with Fovarosi Vismuak of Hungary were completed during the year.
There were also several flyover projects (Rajagiriya, Polgahawela and Ganemulla) and Kochchikade Bridge Project that were ongoing during 2016/17 in partnership with foreign principals. No new partnerships were entered into in 2016/17.
“We derive many benef its from our partnership ventures. Through the conduct of joint ventures knowledge and technology transfers take place”
MEMBERSHIPS OF NETWORKS1. AEL is a member of:
y Construction Industry Development Authority (CIDA)
y National Construction Association of Sri Lanka (NCASL) – Major Specialist Contractor
y TRACE International, UK
y Business & Biodiversity Sri Lanka of the Ceylon Chamber of Commerce – Patron Member
y UNGC – Member
y Lanka Business Coalition on HIV/AIDS – Member
y National Chamber of Commerce of Sri Lanka – Member
2. Our QMS, EMS and OHSAS are developed and maintained in accordance with the requirements of ISO.
STRATEGIC ALLIANCES AEL formed a joint venture with China Harbour Engineering Company and Mustafa’s Singapore taking a 51% stake, for the development of residential condominiums for lower middle income segment buyers in downtown Colombo. The two partners took a 33% and 16% share respectively. Our 50% Joint Venture in Blue Star Realties (Private) Limited with Iranian counterparts is for the development of semi-luxury apartments in the suburbs of Colombo. AEL also has a minority share (30%) in another joint venture with ZPMC China (which holds the remaining 70%) which carries out port machinery installation, commission and repair services.
SYNERGISTIC VALUE DERIVED FROM PARTNERSHIPS We derive many benef its from our partnership ventures. Through the conduct of joint ventures, knowledge and technology transfers take place. We have also opened doors to expand our operations overseas. One instance was the project with CHEC in Papua New Guinea which has been completed. Negotiations are currently ongoing with another foreign partner to expand our operations in Djibouti. We have also capitalised on opportunities to extend our portfolio and obtain accreditations in new f ields of engineering.
BUSINESS PARTNER CAPITAL
PREAMBLE BUSINESS MODEL VALUE CREATION STEWARDSHIP FINANCIAL REPORTS ANNEXES
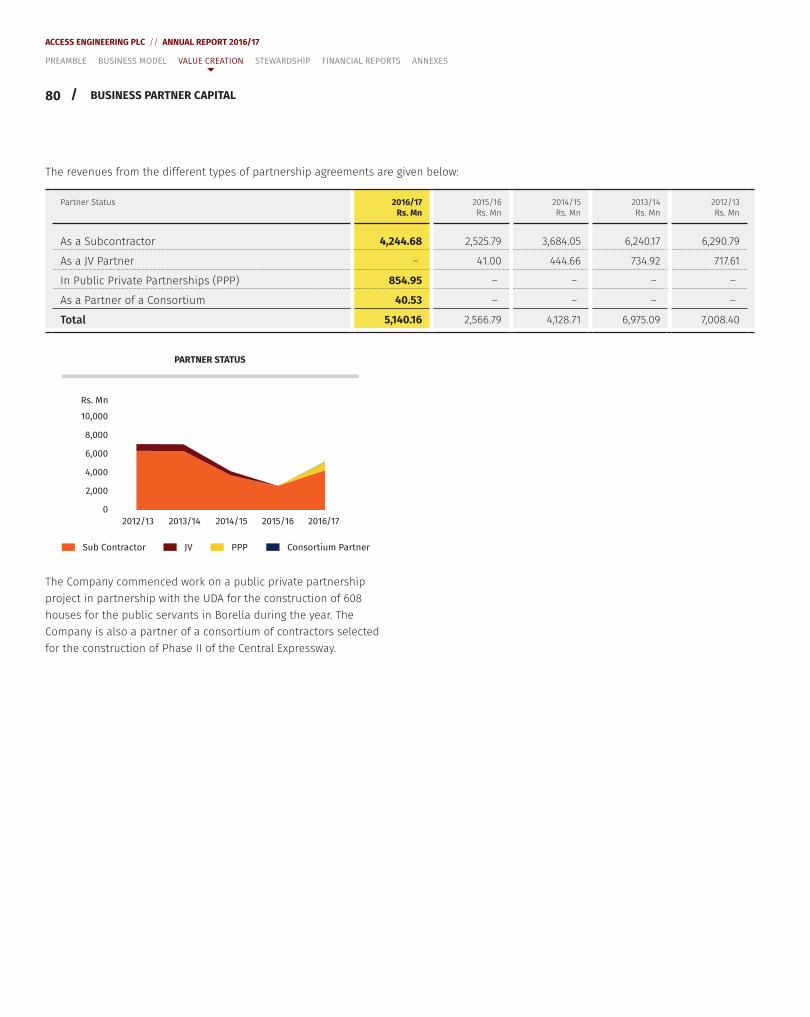
80 /
ACCESS ENGINEERING PLC // ANNUAL REPORT 2016/17
The revenues from the different types of partnership agreements are given below:
Partner Status 2016/17Rs. Mn
2015/16Rs. Mn
2014/15Rs. Mn
2013/14Rs. Mn
2012/13Rs. Mn
As a Subcontractor 4,244.68 2,525.79 3,684.05 6,240.17 6,290.79
As a JV Partner – 41.00 444.66 734.92 717.61
In Public Private Partnerships (PPP) 854.95 – – – –
As a Partner of a Consortium 40.53 – – – –
Total 5,140.16 2,566.79 4,128.71 6,975.09 7,008.40
PARTNER STATUS
Sub Contractor PPP Consortium PartnerJV
Rs. Mn
10,000
8,000
6,000
4,000
2,000
0
2013/14 2014/15 2015/16 2016/172012/13
The Company commenced work on a public private partnership project in partnership with the UDA for the construction of 608 houses for the public servants in Borella during the year. The Company is also a partner of a consortium of contractors selected for the construction of Phase II of the Central Expressway.
BUSINESS PARTNER CAPITAL
PREAMBLE BUSINESS MODEL VALUE CREATION STEWARDSHIP FINANCIAL REPORTS ANNEXES
81
ACCESS ENGINEERING PLC // ANNUAL REPORT 2016/17
/
SOCIAL AND ENVIRONMENTAL CAPITAL
SOCIAL RESPONSIBILITY POLICYAs a responsible corporate citizen we are conscious about how we draw inputs from society and how our outputs and activities impact society. There we consider it our duty to give back to the society whatever possible within our resources, beyond the contribution we make from our commercial projects. Our social policy is founded on compliance with the law, ethical conduct and building trusting relationships with our stakeholders. Mindful of impacts our activities have on the society and the environment, we constantly strive to manage the impact in a positive manner.
Our CSR policy is spearheaded by a CSR Committee, which during the year under review focused on the following areas:
y Making CSR activities more visible
y Adoption of a focused social responsibility approach
y Launching of a theme, a tagline and a logo for CSR projects
y Identifying f ive pillars for CSR activities
“While we work with materials and equipment, we never forget that the end result is more than bricks and steel. It is to improve the quality of life of people”
The CSR activities were incorporated into f ive platforms and policies were drawn up for each platform as described below:
LOCAL COMMUNITY DEVELOPMENT We will contribute to the well-being of the communities in the neighborhood of our project activities and make a tangible positive impact on their economic and social development. We seek to mitigate any negative impacts on people or the environment of our activities. We will also respect the culture, heritage and any indigenous people in the community.
PREAMBLE BUSINESS MODEL VALUE CREATION STEWARDSHIP FINANCIAL REPORTS ANNEXES
“There we consider it our duty to give back to the society whatever possible within our resources, beyond the contribution we make from our commercial projects”
HUMAN CAPACITY BUILDINGWe will strive to build up human resources, including those of our employees and their families by assisting formal education at all levels as well as by informal education, social interaction and dialogue.
HEALTH AND WELLNESSWe will promote health (both physical and psychological), social and spiritual well-being through providing or promoting health facilities, health education programs and sports and social events.
INDUSTRY ADVANCEMENTWe take leadership in the construction industry to face future challenges through the introduction of modern technology, development of human resources and dissemination of best practices.
ENVIRONMENTAL STEWARDSHIPWe will do our utmost to safeguard the environment by minimizing the impact of our activities. This includes compliance with environmental regulations, eff icient use of resources and recycling, reducing wastes, protecting wildlife habitats and supporting local environmental projects and activities.
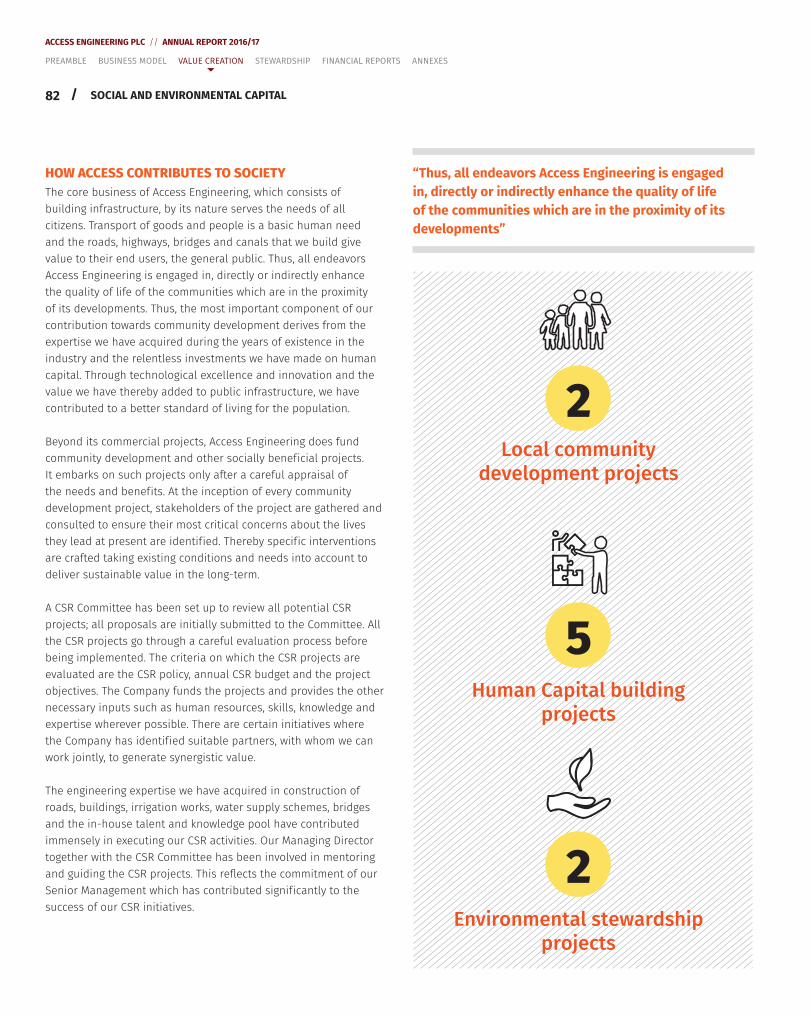
82 /
ACCESS ENGINEERING PLC // ANNUAL REPORT 2016/17
HOW ACCESS CONTRIBUTES TO SOCIETYThe core business of Access Engineering, which consists of building infrastructure, by its nature serves the needs of all citizens. Transport of goods and people is a basic human need and the roads, highways, bridges and canals that we build give value to their end users, the general public. Thus, all endeavors Access Engineering is engaged in, directly or indirectly enhance the quality of life of the communities which are in the proximity of its developments. Thus, the most important component of our contribution towards community development derives from the expertise we have acquired during the years of existence in the industry and the relentless investments we have made on human capital. Through technological excellence and innovation and the value we have thereby added to public infrastructure, we have contributed to a better standard of living for the population.
Beyond its commercial projects, Access Engineering does fund community development and other socially benef icial projects. It embarks on such projects only after a careful appraisal of the needs and benef its. At the inception of every community development project, stakeholders of the project are gathered and consulted to ensure their most critical concerns about the lives they lead at present are identif ied. Thereby specif ic interventions are crafted taking existing conditions and needs into account to deliver sustainable value in the long-term.
A CSR Committee has been set up to review all potential CSR projects; all proposals are initially submitted to the Committee. All the CSR projects go through a careful evaluation process before being implemented. The criteria on which the CSR projects are evaluated are the CSR policy, annual CSR budget and the project objectives. The Company funds the projects and provides the other necessary inputs such as human resources, skills, knowledge and expertise wherever possible. There are certain initiatives where the Company has identif ied suitable partners, with whom we can work jointly, to generate synergistic value.
The engineering expertise we have acquired in construction of roads, buildings, irrigation works, water supply schemes, bridges and the in-house talent and knowledge pool have contributed immensely in executing our CSR activities. Our Managing Director together with the CSR Committee has been involved in mentoring and guiding the CSR projects. This reflects the commitment of our Senior Management which has contributed signif icantly to the success of our CSR initiatives.
“Thus, all endeavors Access Engineering is engaged in, directly or indirectly enhance the quality of life of the communities which are in the proximity of its developments”
Local communitydevelopment projects
2
Human Capital buildingprojects
5
Environmental stewardshipprojects
2
PREAMBLE BUSINESS MODEL VALUE CREATION STEWARDSHIP FINANCIAL REPORTS ANNEXES
SOCIAL AND ENVIRONMENTAL CAPITAL
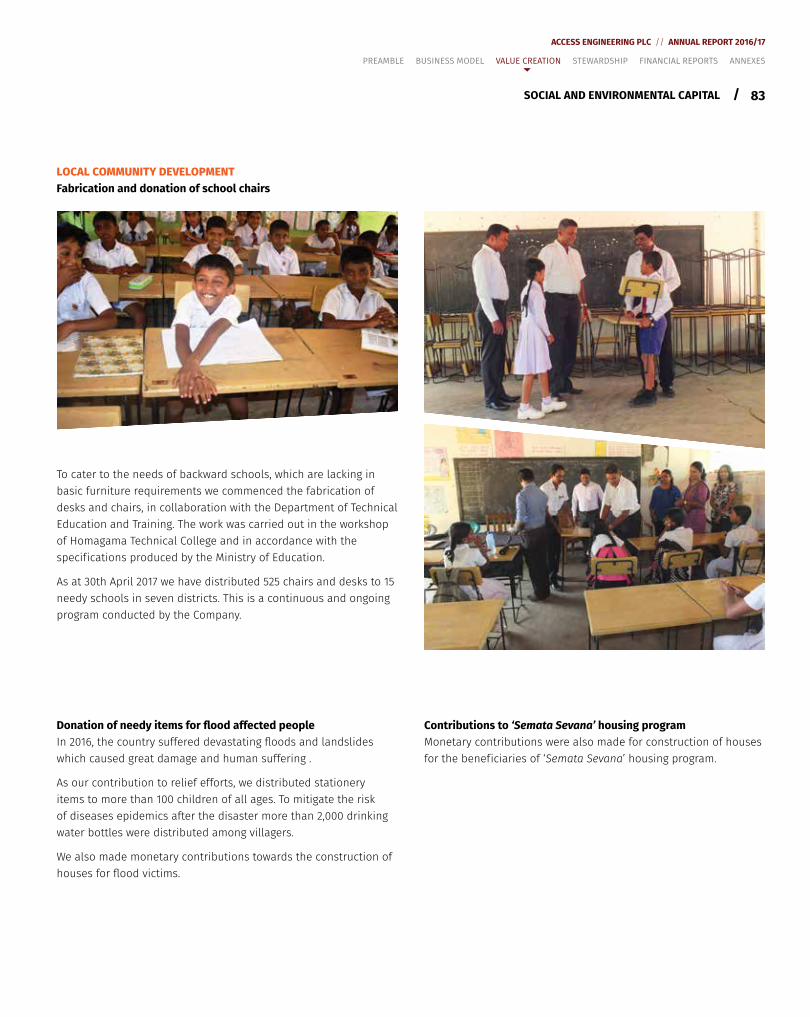
83
ACCESS ENGINEERING PLC // ANNUAL REPORT 2016/17
/
LOCAL COMMUNITY DEVELOPMENTFabrication and donation of school chairs
To cater to the needs of backward schools, which are lacking in basic furniture requirements we commenced the fabrication of desks and chairs, in collaboration with the Department of Technical Education and Training. The work was carried out in the workshop of Homagama Technical College and in accordance with the specif ications produced by the Ministry of Education.
As at 30th April 2017 we have distributed 525 chairs and desks to 15 needy schools in seven districts. This is a continuous and ongoing program conducted by the Company.
PREAMBLE BUSINESS MODEL VALUE CREATION STEWARDSHIP FINANCIAL REPORTS ANNEXES
SOCIAL AND ENVIRONMENTAL CAPITAL
Donation of needy items for flood affected peopleIn 2016, the country suffered devastating floods and landslides which caused great damage and human suffering .
As our contribution to relief efforts, we distributed stationery items to more than 100 children of all ages. To mitigate the risk of diseases epidemics after the disaster more than 2,000 drinking water bottles were distributed among villagers.
We also made monetary contributions towards the construction of houses for flood victims.
Contributions to ‘Semata Sevana’ housing programMonetary contributions were also made for construction of houses for the benef iciaries of ‘Semata Sevana’ housing program.
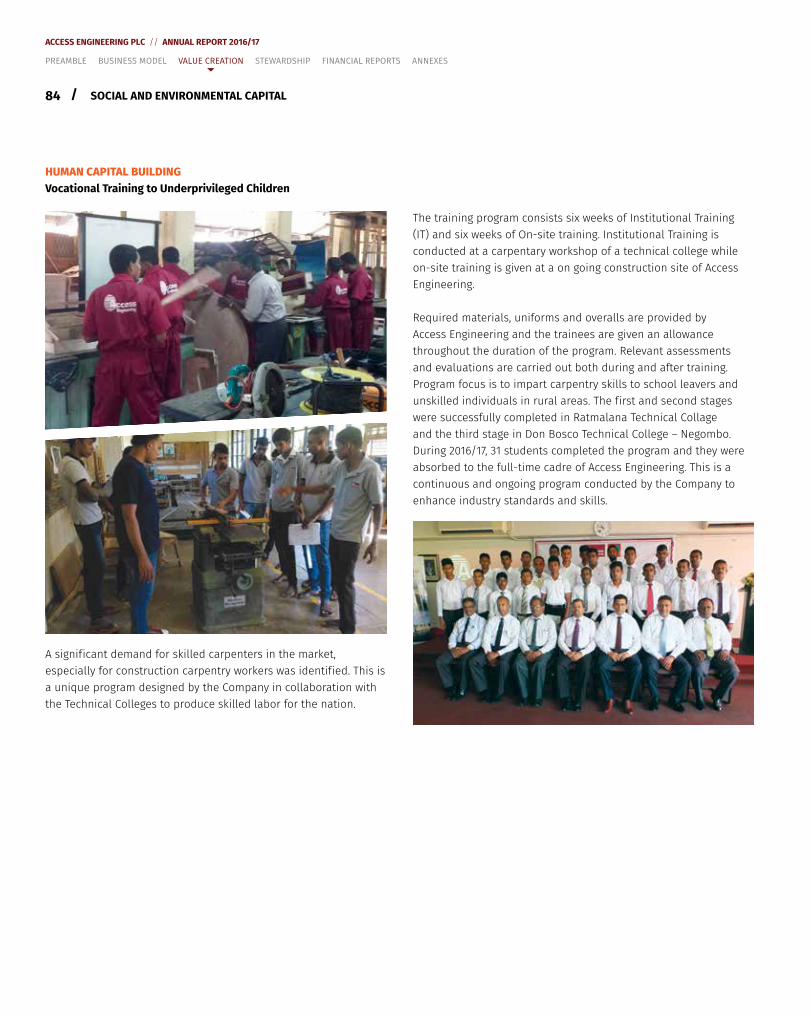
84 /
ACCESS ENGINEERING PLC // ANNUAL REPORT 2016/17
SOCIAL AND ENVIRONMENTAL CAPITAL
HUMAN CAPITAL BUILDINGVocational Training to Underprivileged Children
A signif icant demand for skilled carpenters in the market, especially for construction carpentry workers was identif ied. This is a unique program designed by the Company in collaboration with the Technical Colleges to produce skilled labor for the nation.
The training program consists six weeks of Institutional Training (IT) and six weeks of On-site training. Institutional Training is conducted at a carpentary workshop of a technical college while on-site training is given at a on going construction site of Access Engineering.
Required materials, uniforms and overalls are provided by Access Engineering and the trainees are given an allowance throughout the duration of the program. Relevant assessments and evaluations are carried out both during and after training. Program focus is to impart carpentry skills to school leavers and unskilled individuals in rural areas. The f irst and second stages were successfully completed in Ratmalana Technical Collage and the third stage in Don Bosco Technical College – Negombo. During 2016/17, 31 students completed the program and they were absorbed to the full-time cadre of Access Engineering. This is a continuous and ongoing program conducted by the Company to enhance industry standards and skills.
PREAMBLE BUSINESS MODEL VALUE CREATION STEWARDSHIP FINANCIAL REPORTS ANNEXES
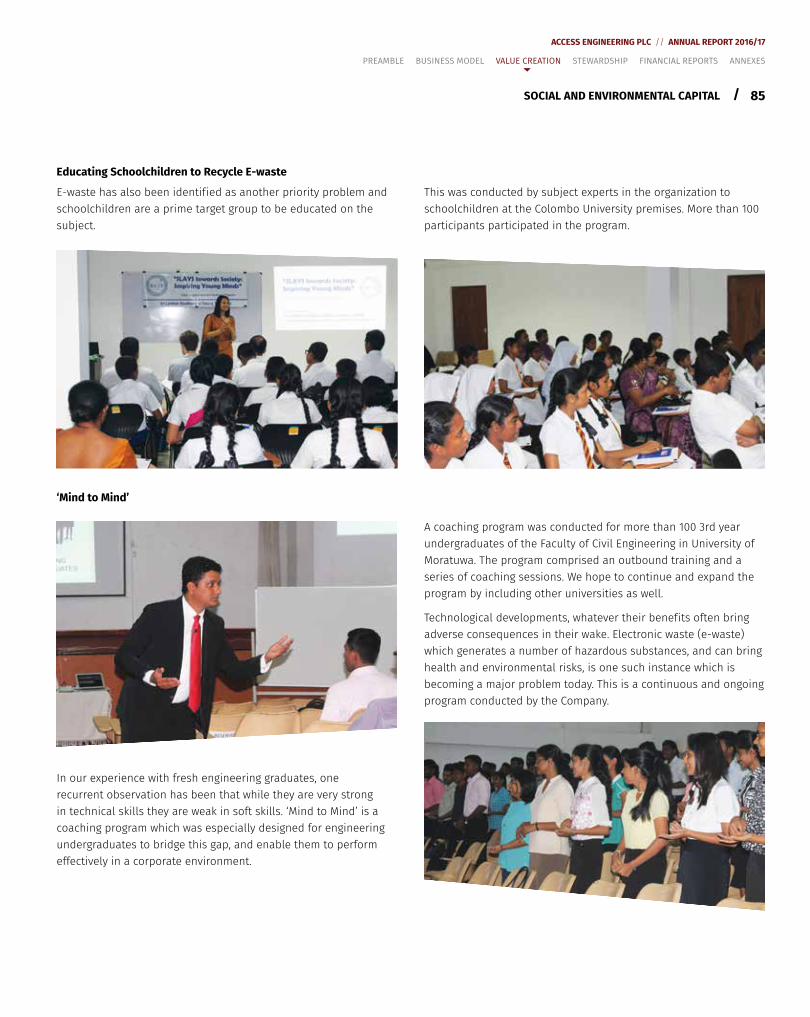
85
ACCESS ENGINEERING PLC // ANNUAL REPORT 2016/17
/
Educating Schoolchildren to Recycle E-waste
E-waste has also been identif ied as another priority problem and schoolchildren are a prime target group to be educated on the subject.
This was conducted by subject experts in the organization to schoolchildren at the Colombo University premises. More than 100 participants participated in the program.
‘Mind to Mind’
In our experience with fresh engineering graduates, one recurrent observation has been that while they are very strong in technical skills they are weak in soft skills. ‘Mind to Mind’ is a coaching program which was especially designed for engineering undergraduates to bridge this gap, and enable them to perform effectively in a corporate environment.
A coaching program was conducted for more than 100 3rd year undergraduates of the Faculty of Civil Engineering in University of Moratuwa. The program comprised an outbound training and a series of coaching sessions. We hope to continue and expand the program by including other universities as well.
Technological developments, whatever their benef its often bring adverse consequences in their wake. Electronic waste (e-waste) which generates a number of hazardous substances, and can bring health and environmental risks, is one such instance which is becoming a major problem today. This is a continuous and ongoing program conducted by the Company.
SOCIAL AND ENVIRONMENTAL CAPITAL
PREAMBLE BUSINESS MODEL VALUE CREATION STEWARDSHIP FINANCIAL REPORTS ANNEXES
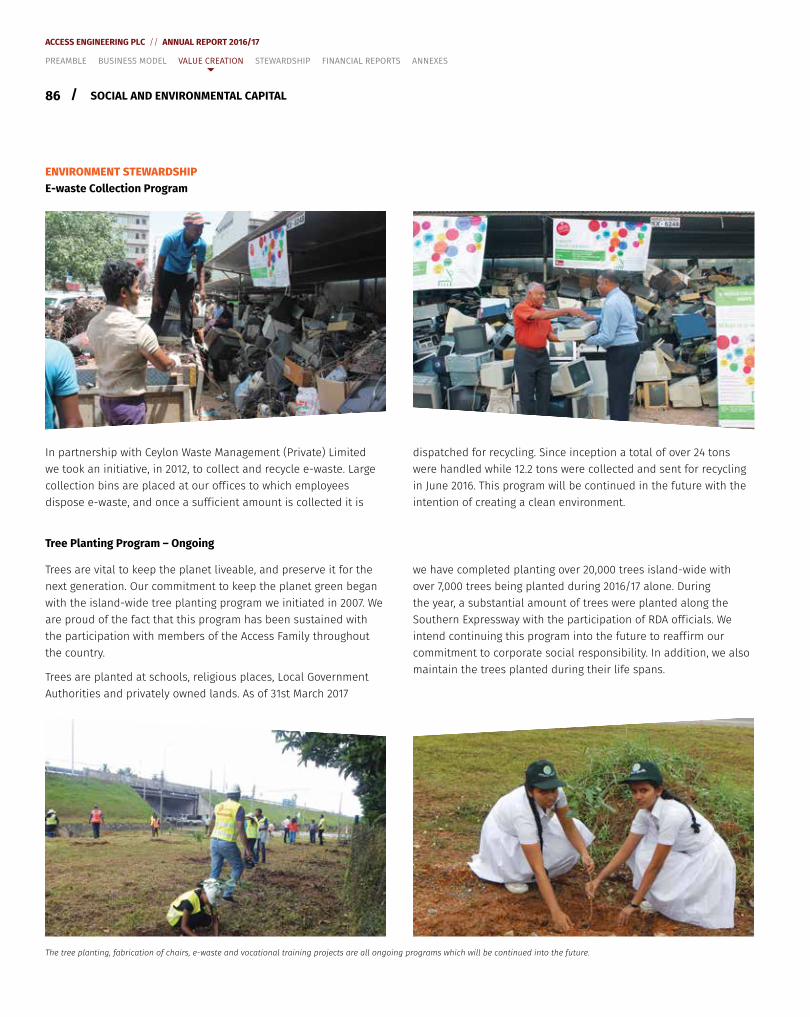
86 /
ACCESS ENGINEERING PLC // ANNUAL REPORT 2016/17
ENVIRONMENT STEWARDSHIPE-waste Collection Program
In partnership with Ceylon Waste Management (Private) Limited we took an initiative, in 2012, to collect and recycle e-waste. Large collection bins are placed at our off ices to which employees dispose e-waste, and once a suff icient amount is collected it is
dispatched for recycling. Since inception a total of over 24 tons were handled while 12.2 tons were collected and sent for recycling in June 2016. This program will be continued in the future with the intention of creating a clean environment.
Tree Planting Program – Ongoing
Trees are vital to keep the planet liveable, and preserve it for the next generation. Our commitment to keep the planet green began with the island-wide tree planting program we initiated in 2007. We are proud of the fact that this program has been sustained with the participation with members of the Access Family throughout the country.
Trees are planted at schools, religious places, Local Government Authorities and privately owned lands. As of 31st March 2017
we have completed planting over 20,000 trees island-wide with over 7,000 trees being planted during 2016/17 alone. During the year, a substantial amount of trees were planted along the Southern Expressway with the participation of RDA off icials. We intend continuing this program into the future to reaff irm our commitment to corporate social responsibility. In addition, we also maintain the trees planted during their life spans.
The tree planting, fabrication of chairs, e-waste and vocational training projects are all ongoing programs which will be continued into the future.
SOCIAL AND ENVIRONMENTAL CAPITAL
PREAMBLE BUSINESS MODEL VALUE CREATION STEWARDSHIP FINANCIAL REPORTS ANNEXES
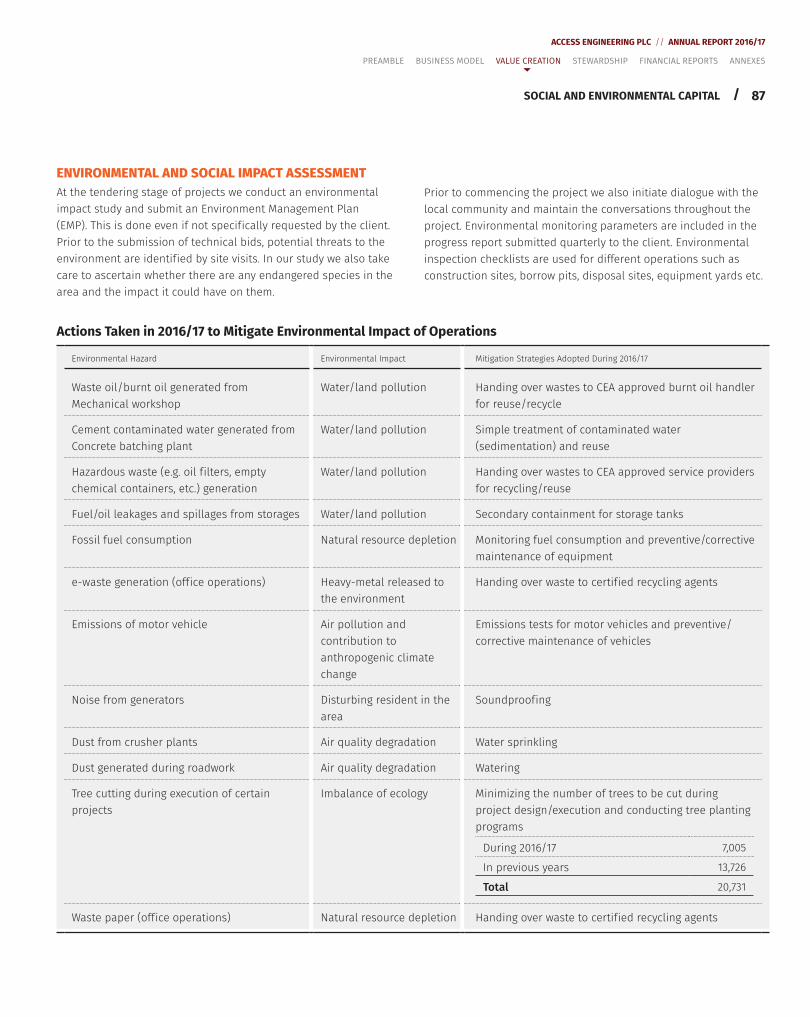
87
ACCESS ENGINEERING PLC // ANNUAL REPORT 2016/17
/
ENVIRONMENTAL AND SOCIAL IMPACT ASSESSMENTAt the tendering stage of projects we conduct an environmental impact study and submit an Environment Management Plan (EMP). This is done even if not specif ically requested by the client. Prior to the submission of technical bids, potential threats to the environment are identif ied by site visits. In our study we also take care to ascertain whether there are any endangered species in the area and the impact it could have on them.
SOCIAL AND ENVIRONMENTAL CAPITAL
PREAMBLE BUSINESS MODEL VALUE CREATION STEWARDSHIP FINANCIAL REPORTS ANNEXES
Prior to commencing the project we also initiate dialogue with the local community and maintain the conversations throughout the project. Environmental monitoring parameters are included in the progress report submitted quarterly to the client. Environmental inspection checklists are used for different operations such as construction sites, borrow pits, disposal sites, equipment yards etc.
Actions Taken in 2016/17 to Mitigate Environmental Impact of Operations
Environmental Hazard Environmental Impact Mitigation Strategies Adopted During 2016/17
Waste oil/burnt oil generated from Mechanical workshop
Water/land pollution Handing over wastes to CEA approved burnt oil handler for reuse/recycle
Cement contaminated water generated from Concrete batching plant
Water/land pollution Simple treatment of contaminated water (sedimentation) and reuse
Hazardous waste (e.g. oil f ilters, empty chemical containers, etc.) generation
Water/land pollution Handing over wastes to CEA approved service providers for recycling/reuse
Fuel/oil leakages and spillages from storages Water/land pollution Secondary containment for storage tanks
Fossil fuel consumption Natural resource depletion Monitoring fuel consumption and preventive/corrective maintenance of equipment
e-waste generation (off ice operations) Heavy-metal released to the environment
Handing over waste to certif ied recycling agents
Emissions of motor vehicle Air pollution and contribution to anthropogenic climate change
Emissions tests for motor vehicles and preventive/corrective maintenance of vehicles
Noise from generators Disturbing resident in the area
Soundproof ing
Dust from crusher plants Air quality degradation Water sprinkling
Dust generated during roadwork Air quality degradation Watering
Tree cutting during execution of certain projects
Imbalance of ecology Minimizing the number of trees to be cut during project design/execution and conducting tree planting programs
During 2016/17 7,005
In previous years 13,726
Total 20,731
Waste paper (off ice operations) Natural resource depletion Handing over waste to certif ied recycling agents
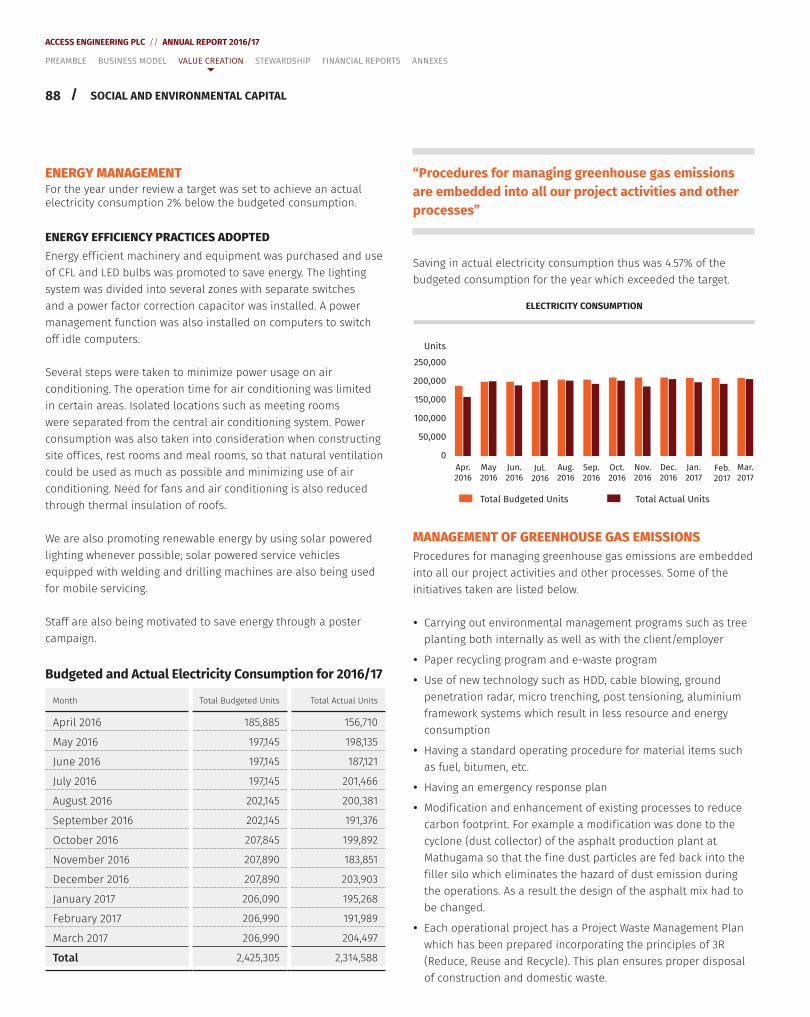
88 /
ACCESS ENGINEERING PLC // ANNUAL REPORT 2016/17
ENERGY MANAGEMENTFor the year under review a target was set to achieve an actual electricity consumption 2% below the budgeted consumption.
ENERGY EFFICIENCY PRACTICES ADOPTEDEnergy eff icient machinery and equipment was purchased and use of CFL and LED bulbs was promoted to save energy. The lighting system was divided into several zones with separate switches and a power factor correction capacitor was installed. A power management function was also installed on computers to switch off idle computers.
Several steps were taken to minimize power usage on air conditioning. The operation time for air conditioning was limited in certain areas. Isolated locations such as meeting rooms were separated from the central air conditioning system. Power consumption was also taken into consideration when constructing site off ices, rest rooms and meal rooms, so that natural ventilation could be used as much as possible and minimizing use of air conditioning. Need for fans and air conditioning is also reduced through thermal insulation of roofs.
We are also promoting renewable energy by using solar powered lighting whenever possible; solar powered service vehicles equipped with welding and drilling machines are also being used for mobile servicing.
Staff are also being motivated to save energy through a poster campaign.
Budgeted and Actual Electricity Consumption for 2016/17
Month Total Budgeted Units Total Actual Units
April 2016 185,885 156,710
May 2016 197,145 198,135
June 2016 197,145 187,121
July 2016 197,145 201,466
August 2016 202,145 200,381
September 2016 202,145 191,376
October 2016 207,845 199,892
November 2016 207,890 183,851
December 2016 207,890 203,903
January 2017 206,090 195,268
February 2017 206,990 191,989
March 2017 206,990 204,497
Total 2,425,305 2,314,588
SOCIAL AND ENVIRONMENTAL CAPITAL
PREAMBLE BUSINESS MODEL VALUE CREATION STEWARDSHIP FINANCIAL REPORTS ANNEXES
“Procedures for managing greenhouse gas emissions are embedded into all our project activities and other processes”
Saving in actual electricity consumption thus was 4.57% of the budgeted consumption for the year which exceeded the target.
Total Budgeted Units Total Actual Units
ELECTRICITY CONSUMPTION
Units
250,000
200,000
150,000
100,000
50,000
0
May2016
Jun.2016
Jul.2016
Aug.2016
Sep.2016
Oct.2016
Nov.2016
Dec.2016
Jan.2017
Mar.2017
Feb.2017
Apr.2016
MANAGEMENT OF GREENHOUSE GAS EMISSIONS Procedures for managing greenhouse gas emissions are embedded into all our project activities and other processes. Some of the initiatives taken are listed below.
y Carrying out environmental management programs such as tree planting both internally as well as with the client/employer
y Paper recycling program and e-waste program
y Use of new technology such as HDD, cable blowing, ground penetration radar, micro trenching, post tensioning, aluminium framework systems which result in less resource and energy consumption
y Having a standard operating procedure for material items such as fuel, bitumen, etc.
y Having an emergency response plan
y Modif ication and enhancement of existing processes to reduce carbon footprint. For example a modif ication was done to the cyclone (dust collector) of the asphalt production plant at Mathugama so that the f ine dust particles are fed back into the f iller silo which eliminates the hazard of dust emission during the operations. As a result the design of the asphalt mix had to be changed.
y Each operational project has a Project Waste Management Plan which has been prepared incorporating the principles of 3R (Reduce, Reuse and Recycle). This plan ensures proper disposal of construction and domestic waste.
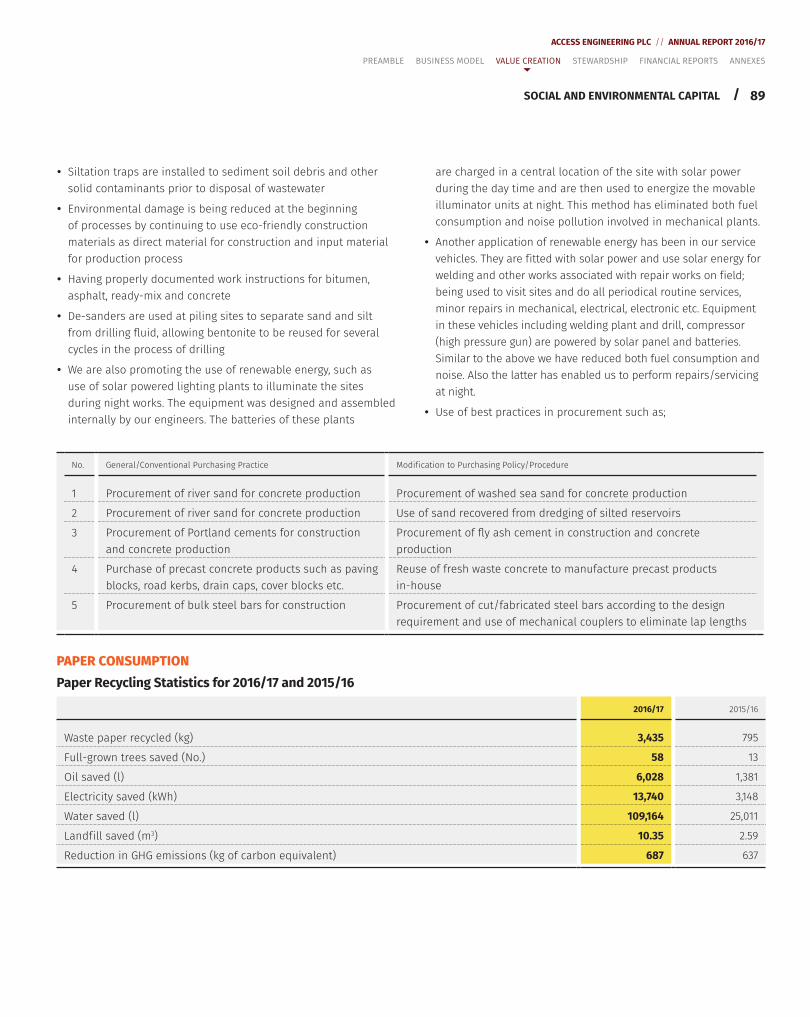
89
ACCESS ENGINEERING PLC // ANNUAL REPORT 2016/17
/
y Siltation traps are installed to sediment soil debris and other solid contaminants prior to disposal of wastewater
y Environmental damage is being reduced at the beginning of processes by continuing to use eco-friendly construction materials as direct material for construction and input material for production process
y Having properly documented work instructions for bitumen, asphalt, ready-mix and concrete
y De-sanders are used at piling sites to separate sand and silt from drilling fluid, allowing bentonite to be reused for several cycles in the process of drilling
y We are also promoting the use of renewable energy, such as use of solar powered lighting plants to illuminate the sites during night works. The equipment was designed and assembled internally by our engineers. The batteries of these plants
SOCIAL AND ENVIRONMENTAL CAPITAL
are charged in a central location of the site with solar power during the day time and are then used to energize the movable illuminator units at night. This method has eliminated both fuel consumption and noise pollution involved in mechanical plants.
y Another application of renewable energy has been in our service vehicles. They are f itted with solar power and use solar energy for welding and other works associated with repair works on f ield; being used to visit sites and do all periodical routine services, minor repairs in mechanical, electrical, electronic etc. Equipment in these vehicles including welding plant and drill, compressor (high pressure gun) are powered by solar panel and batteries. Similar to the above we have reduced both fuel consumption and noise. Also the latter has enabled us to perform repairs/servicing at night.
y Use of best practices in procurement such as;
PREAMBLE BUSINESS MODEL VALUE CREATION STEWARDSHIP FINANCIAL REPORTS ANNEXES
No. General/Conventional Purchasing Practice Modif ication to Purchasing Policy/Procedure
1 Procurement of river sand for concrete production Procurement of washed sea sand for concrete production
2 Procurement of river sand for concrete production Use of sand recovered from dredging of silted reservoirs
3 Procurement of Portland cements for construction and concrete production
Procurement of fly ash cement in construction and concrete production
4 Purchase of precast concrete products such as paving blocks, road kerbs, drain caps, cover blocks etc.
Reuse of fresh waste concrete to manufacture precast products in-house
5 Procurement of bulk steel bars for construction Procurement of cut/fabricated steel bars according to the design requirement and use of mechanical couplers to eliminate lap lengths
PAPER CONSUMPTIONPaper Recycling Statistics for 2016/17 and 2015/16
2016/17 2015/16
Waste paper recycled (kg) 3,435 795
Full-grown trees saved (No.) 58 13
Oil saved (l) 6,028 1,381
Electricity saved (kWh) 13,740 3,148
Water saved (l) 109,164 25,011
Landf ill saved (m3) 10.35 2.59
Reduction in GHG emissions (kg of carbon equivalent) 687 637
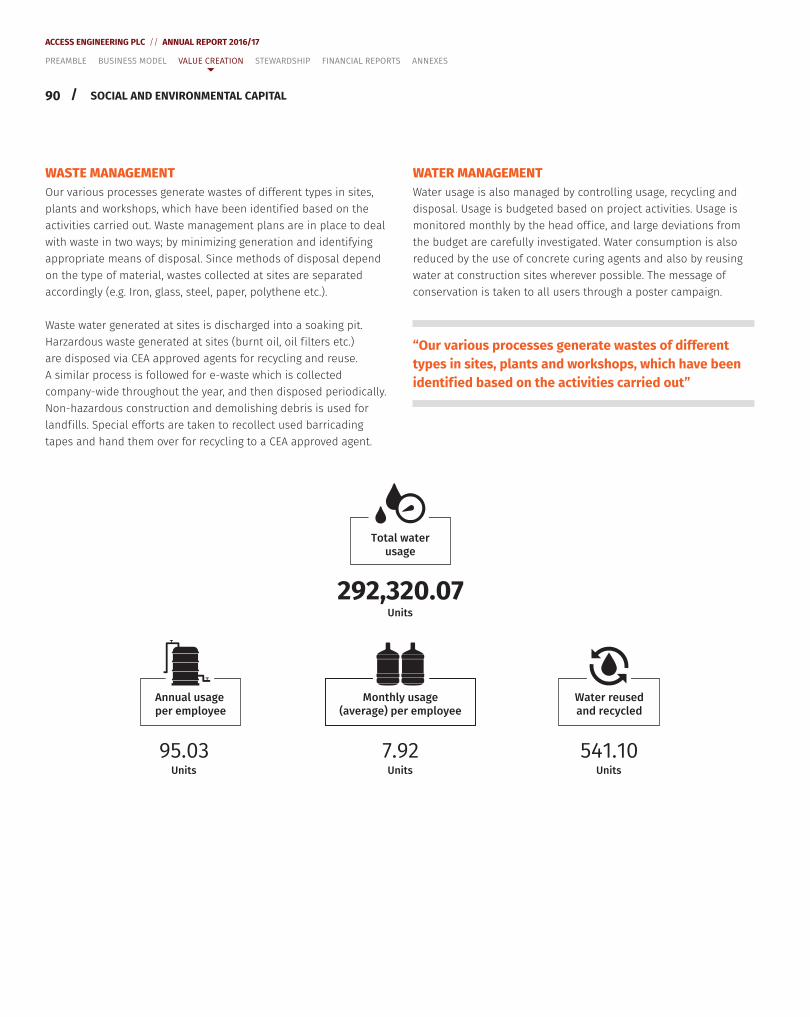
90 /
ACCESS ENGINEERING PLC // ANNUAL REPORT 2016/17
WASTE MANAGEMENTOur various processes generate wastes of different types in sites, plants and workshops, which have been identif ied based on the activities carried out. Waste management plans are in place to deal with waste in two ways; by minimizing generation and identifying appropriate means of disposal. Since methods of disposal depend on the type of material, wastes collected at sites are separated accordingly (e.g. Iron, glass, steel, paper, polythene etc.).
Waste water generated at sites is discharged into a soaking pit. Harzardous waste generated at sites (burnt oil, oil f ilters etc.) are disposed via CEA approved agents for recycling and reuse. A similar process is followed for e-waste which is collected company-wide throughout the year, and then disposed periodically. Non-hazardous construction and demolishing debris is used for landf ills. Special efforts are taken to recollect used barricading tapes and hand them over for recycling to a CEA approved agent.
SOCIAL AND ENVIRONMENTAL CAPITAL
WATER MANAGEMENTWater usage is also managed by controlling usage, recycling and disposal. Usage is budgeted based on project activities. Usage is monitored monthly by the head off ice, and large deviations from the budget are carefully investigated. Water consumption is also reduced by the use of concrete curing agents and also by reusing water at construction sites wherever possible. The message of conservation is taken to all users through a poster campaign.
“Our various processes generate wastes of different types in sites, plants and workshops, which have been identif ied based on the activities carried out”
Total waterusage
292,320.07
Annual usageper employee
95.03Units
Monthly usage(average) per employee
7.92Units
Water reusedand recycled
541.10Units
Units
PREAMBLE BUSINESS MODEL VALUE CREATION STEWARDSHIP FINANCIAL REPORTS ANNEXES
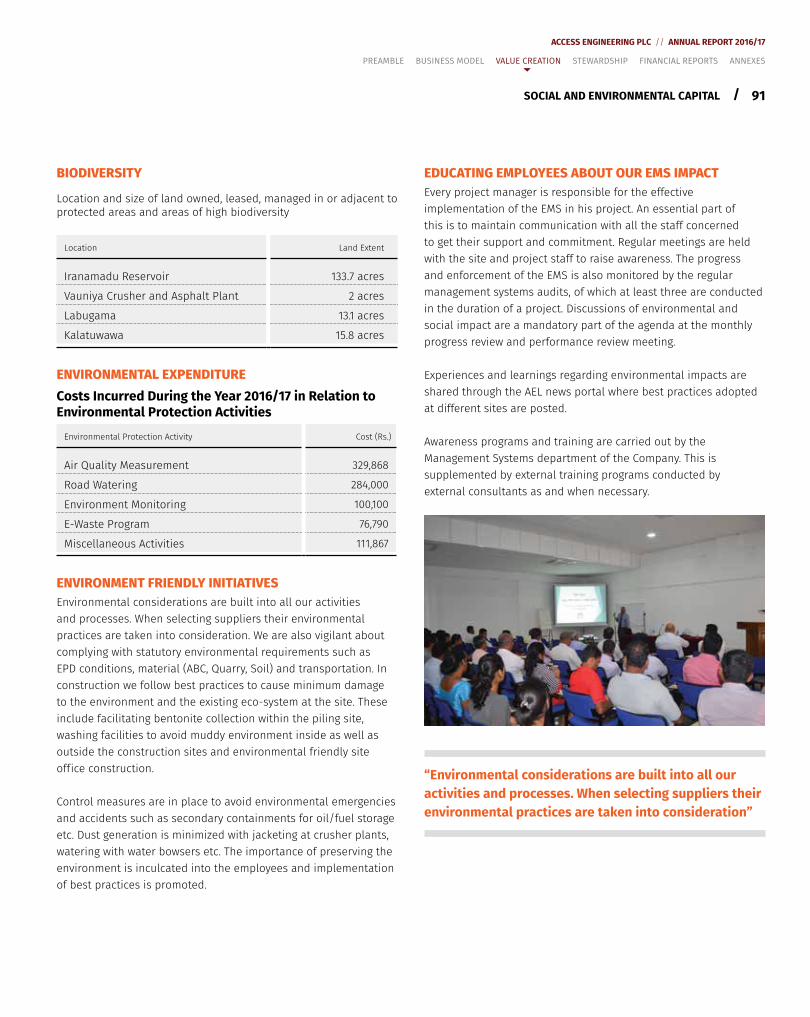
91
ACCESS ENGINEERING PLC // ANNUAL REPORT 2016/17
/
BIODIVERSITY
Location and size of land owned, leased, managed in or adjacent to protected areas and areas of high biodiversity
Location Land Extent
Iranamadu Reservoir 133.7 acres
Vauniya Crusher and Asphalt Plant 2 acres
Labugama 13.1 acres
Kalatuwawa 15.8 acres
ENVIRONMENTAL EXPENDITURECosts Incurred During the Year 2016/17 in Relation to Environmental Protection Activities
Environmental Protection Activity Cost (Rs.)
Air Quality Measurement 329,868
Road Watering 284,000
Environment Monitoring 100,100
E-Waste Program 76,790
Miscellaneous Activities 111,867
ENVIRONMENT FRIENDLY INITIATIVES Environmental considerations are built into all our activities and processes. When selecting suppliers their environmental practices are taken into consideration. We are also vigilant about complying with statutory environmental requirements such as EPD conditions, material (ABC, Quarry, Soil) and transportation. In construction we follow best practices to cause minimum damage to the environment and the existing eco-system at the site. These include facilitating bentonite collection within the piling site, washing facilities to avoid muddy environment inside as well as outside the construction sites and environmental friendly site off ice construction.
Control measures are in place to avoid environmental emergencies and accidents such as secondary containments for oil/fuel storage etc. Dust generation is minimized with jacketing at crusher plants, watering with water bowsers etc. The importance of preserving the environment is inculcated into the employees and implementation of best practices is promoted.
SOCIAL AND ENVIRONMENTAL CAPITAL
EDUCATING EMPLOYEES ABOUT OUR EMS IMPACTEvery project manager is responsible for the effective implementation of the EMS in his project. An essential part of this is to maintain communication with all the staff concerned to get their support and commitment. Regular meetings are held with the site and project staff to raise awareness. The progress and enforcement of the EMS is also monitored by the regular management systems audits, of which at least three are conducted in the duration of a project. Discussions of environmental and social impact are a mandatory part of the agenda at the monthly progress review and performance review meeting.
Experiences and learnings regarding environmental impacts are shared through the AEL news portal where best practices adopted at different sites are posted.
Awareness programs and training are carried out by the Management Systems department of the Company. This is supplemented by external training programs conducted by external consultants as and when necessary.
“Environmental considerations are built into all our activities and processes. When selecting suppliers their environmental practices are taken into consideration”
PREAMBLE BUSINESS MODEL VALUE CREATION STEWARDSHIP FINANCIAL REPORTS ANNEXES
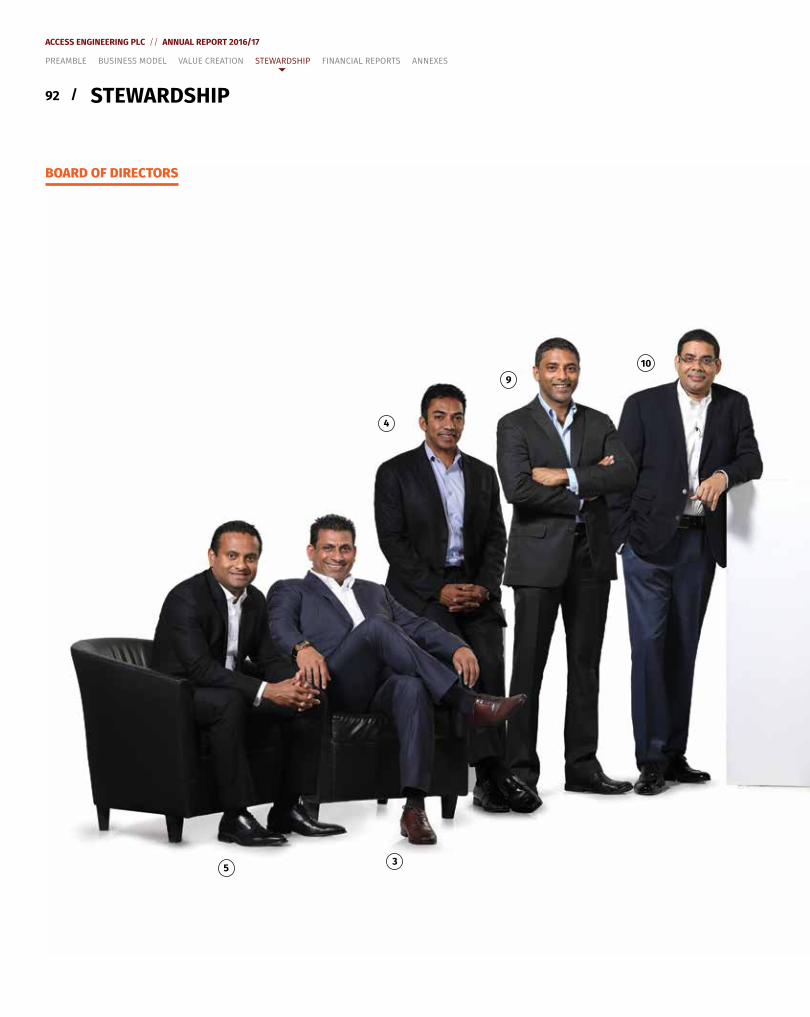
92 /
ACCESS ENGINEERING PLC // ANNUAL REPORT 2016/17
STEWARDSHIP
PREAMBLE BUSINESS MODEL VALUE CREATION STEWARDSHIP FINANCIAL REPORTS ANNEXES
35
4
910
BOARD OF DIRECTORS
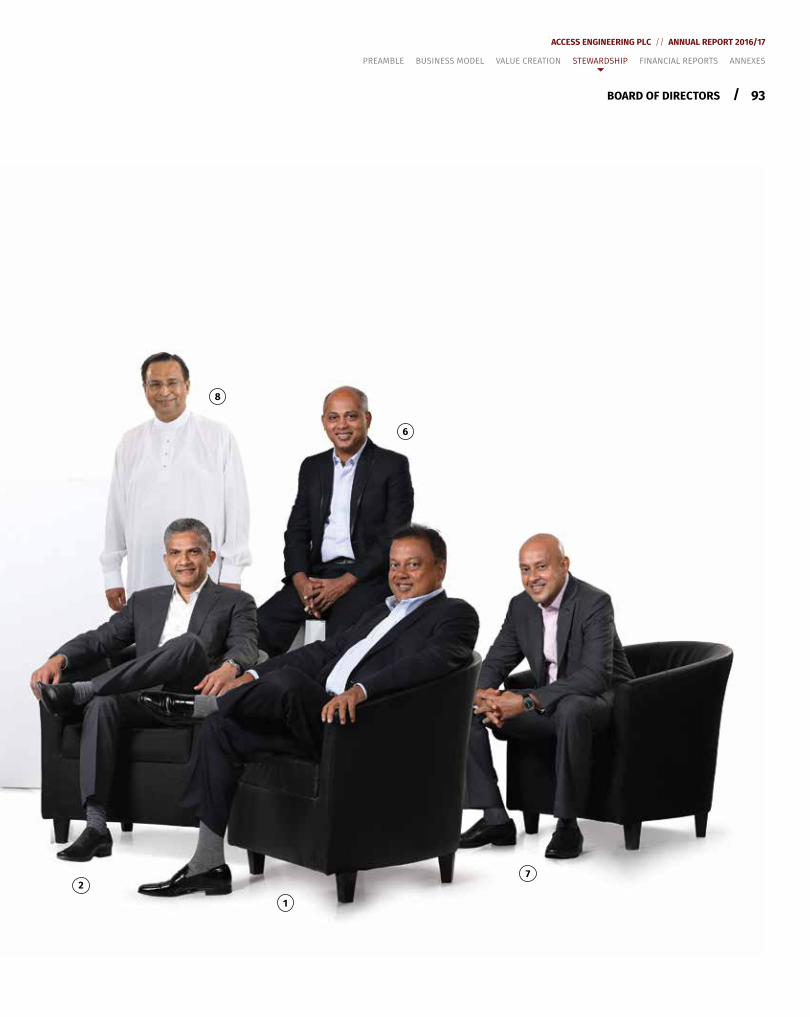
93
ACCESS ENGINEERING PLC // ANNUAL REPORT 2016/17
/
PREAMBLE BUSINESS MODEL VALUE CREATION STEWARDSHIP FINANCIAL REPORTS ANNEXES
1
2
6
8
7
BOARD OF DIRECTORS
94 /
ACCESS ENGINEERING PLC // ANNUAL REPORT 2016/17
1. SUMAL JOSEPH SANJIVA PERERACHAIRMAN
The Founder Chairman of the Access Group of Companies founded in 1989, he is also the Founder Chairman and a shareholder of Access Engineering. He continues to be the Chairman of all companies under the umbrella of the Access Group and Chairman of Sathosa Motors PLC, a company that gained a public listing in 1993. He is a Fellow Member of the Chartered Institute of Management Accountants – UK. It is under his vision and leadership that the Access Group of Companies has grown to be a diversif ied and successful business enterprise, in a short span of over two decades.
2. JOSEPH CHRISTOPHER JOSHUAMANAGING DIRECTOR
One of the founder Directors of the Access Group of Companies, he was instrumental in heading some of the most successful business units within the Group. A founder shareholder, he was the Joint Managing Director/CEO of the Company. It was under his leadership that Access Engineering achieved signif icant milestones in growth. He also functions as the Joint Managing Director of the Access Group since 1997. Companies under his purview include Access Realties (Private) Limited, Access Realties 2 (Private) Limited, Harbour Village (Private) Limited, Access Energy (Private) Limited, Access Natural Water (Private) Limited, Eco Friendly Power Developers (Private) Limited and business units of Access International (Private) Limited. He is also a Director of Sathosa Motors PLC.
3. DALPADORUGE ANTON ROHANA FERNANDOEXECUTIVE DIRECTOR/CHIEF OPERATING OFFICER
Joining the Access Group in 1998 as an Engineer based in the Engineering Division, he played a vital role in enabling the division to become a separate business entity, encompassing the nameand persons of Access Engineering. Having held senior management positions in Access Engineering, he was appointed to the Board in 2002. In 2007, he was appointed as the Director/COO of Access Engineering. He is a Corporate Member of Institution of Engineers Sri Lanka (IESL) and has a B.Sc. Degree in Civil Engineering from the University of Peradeniya. He is also a Director of Access International (Private) Limited, Sathosa Motors PLC, Eco Friendly Power Developers (Private) Limited, Access Realties (Private) Limited, Access Realties 2 (Private) Limited and Harbour Village (Private) Limited.
4. SHEVANTHA HARINDRA SUDHARAKA MENDISEXECUTIVE DIRECTOR/DIRECTOR – BUSINESS DEVELOPMENT
Having held many executive and management positions within the Access Group, he has functioned within the Engineering Division since its inception. With the genesis of Access Engineering, he became a part of that unit and was appointed as Director – Business Development in 2002. He is also a Director of Access International (Private) Limited, Sathosa Motors PLC, SML Frontier Automotive (Private) Limited, Access Realties (Private) Limited, Blue Star Realties (Private) Limited and Access Realties 2 (Private) Limited.
5. SAUMAYA DHARSHANA MUNASINGHEEXECUTIVE DIRECTOR/DIRECTOR – BUSINESS DEVELOPMENT
He joined Access International (Private) Limited in 1996 and was promoted to the position of Assistant Manager in 1999. In 2001, he assumed duties as Manager – Special Projects in Access International (Private) Limited and was promoted as General Manager – Special Projects in 2004. He joined Access Engineering in 2006 and was appointed to the Board of Access Engineering as Director – Business Development. He is also a Director of Access International (Private) Limited, Sathosa Motors PLC, SML Frontier Automotive (Private) Limited, Access Realties (Private) Limited and Access Realties 2 (Private) Limited.
6. DILHAN PERERANON-EXECUTIVE DIRECTOR
Mr. Dilhan Perera is serving in the capacity of Non-Executive Director of Access Engineering PLC since December 2013. He is serving as Chief Financial Off icer in Aff iliated Companies which are not coming under the Group of Companies of Access Engineering PLC.
7. RANJAN JOHN SURIYAKUMAR GOMEZNON-EXECUTIVE DIRECTOR
One of the Founder Directors of the Access Group of Companies and has functioned as the Joint Managing Director of the Group since 1997. Companies under his purview include ATSL International (Private) Limited, ATSL Telesoft (Private) Limited, Access Energy Solutions (Private) Limited, Think Cube Systems (Private) Limited, Science Land Information Technology (Private) Limited, e-buy (Private) Limited and business units of Access International (Private) Limited. He is also a Director of Sathosa Motors PLC.
BOARD OF DIRECTORS
PREAMBLE BUSINESS MODEL VALUE CREATION STEWARDSHIP FINANCIAL REPORTS ANNEXES
95
ACCESS ENGINEERING PLC // ANNUAL REPORT 2016/17
/
8. PROF. KULATILLEKE ARTHANAYAKE MALIK KUMAR RANASINGHEINDEPENDENT NON-EXECUTIVE DIRECTOR
A member of the Access Engineering Board since 2011, he is a Senior Professor in Civil Engineering at the University of Moratuwa and a Member of the University Grants Commission. He is a Chartered Engineer, International Professional Engineer, a Fellow of the Institution of Engineers, Sri Lanka, National Academy of Sciences, Sri Lanka and Institute of Project Managers. A past Vice-Chancellor of the University of Moratuwa, he functions as the Deputy Chairman of Sampath Bank PLC, an Independent Non- Executive Director of Sampath Bank PLC, Textured Jersey Lanka PLC, United Motors Lanka PLC and Resus Energy PLC. He is a former Fellow of the National University of Singapore and has been a Non-Executive Director of the Colombo Stock Exchange, Hemas Power PLC and Lanka IOC PLC.
Prof. Ranasinghe has been honoured with the SLAAS General Research Committee Award for Outstanding Contribution to Sri Lankan Science, Trinity Prize for Engineering in 2004, Committee of Vice-Chancellors and Directors (CVCD) Excellence Award 2012 for the Most Outstanding Senior Researcher in Technology and related Sciences in the Sri Lankan Universities, Award for Outstanding Contribution to Education at the World Education Congress 2012, India and the Education Leadership Award 2013 at the 4th Asia’s Best B-School Awards in Singapore.
9. NIROSHAN DAKSHINA GUNARATNEINDEPENDENT NON-EXECUTIVE DIRECTOR
Appointed to the Access Engineering Board in 2011, he is also the Finance Director of ASCOT Holdings PLC, an Associate Member of the Chartered Institute of Management Accountants – UK. He possesses over nineteen years of experience in the f ield of f inance and accounting and has been at MB Financial Services (Private) Limited, a primary dealer appointed by the CBSL and Jewelknit, a subsidiary of Mast Industries – USA.
10. DINESH WEERAKKODYINDEPENDENT NON-EXECUTIVE DIRECTOR
Mr. Dinesh Weerakkody is the Chairman of the National Human Resource Development Council of Sri Lanka and Cornucopia Sri Lanka. He is an Advisor to the Ministry of National Policies and Economic Affairs. He was the Chairman of the Government-appointed Committee to review the Banking Sector and NBFI consolidation and the Committee appointed to review the budgetary allocation for education. He is a former Chairman of the Commercial Bank of Ceylon PLC and the Employees’ Trust Fund Board of Sri Lanka. He serves in a number of private sector Boards including Glaxo SmithKline Consumer Sri Lanka and Ceylon Tobacco PLC. He is also a Vice-President of the International Chamber of Commerce, Sri Lanka Chapter, a Committee Member of Sri Lanka Tennis Association, a Council Member of the Employers Federation of Ceylon, a Member of the Institute of Directors of Sri Lanka, a Member of the National Health Development Fund and a Member of the CIMA Global Asia Pacif ic Industry Experts Panel.
He is a Graduate in Business Administration from UK, a Fellow of both CIMA (UK) and CMA (Sri Lanka), Professional Member of the Singapore Human Resource Institute and holds an MBA from the University of Leicester, UK. He was conferred an honorary membership by the Institute of Personnel Management of Sri Lanka.
He is the recipient of Jaycees Ten Outstanding Young Persons Award in 1999 and an International Associations of Lions Clubs National Achievers Award in 2008 for the advancement of good governance in the public sector.
BOARD OF DIRECTORS
PREAMBLE BUSINESS MODEL VALUE CREATION STEWARDSHIP FINANCIAL REPORTS ANNEXES
96 /
ACCESS ENGINEERING PLC // ANNUAL REPORT 2016/17
SUMAL PERERACHAIRMANProf ile given on page 94.
ROHANA FERNANDOEXECUTIVE DIRECTOR/COOProf ile given on page 94.
DHARSHANA MUNASINGHEEXECUTIVE DIRECTOR/DIRECTOR – BUSINESS DEVELOPMENTProf ile given on page 94.
CHRISTOPHER JOSHUAMANAGING DIRECTORProf ile given on page 94.
SHEVANTHA MENDISEXECUTIVE DIRECTOR/DIRECTOR – BUSINESS DEVELOPMENTProf ile given on page 94.
PREAMBLE BUSINESS MODEL VALUE CREATION STEWARDSHIP FINANCIAL REPORTS ANNEXES
CORPORATE MANAGEMENT TEAM
97
ACCESS ENGINEERING PLC // ANNUAL REPORT 2016/17
/
VASANTHA MANATUNGESENIOR GENERAL MANAGER
V K Manatunge joined the Company in early 2003 and is currently functioning as the Senior General Manager of Access Engineering. He obtained his Degree in Civil Engineering from the University of Moratuwa in 1978 and has been a Corporate Member of the Institution of Engineers Sri Lanka since 1982. He counts near 40 years of experience in the civil engineering f ield and has worked in various capacities in the state sector as well as private sector.
DHARMASIRI CHANDRAPALAGENERAL MANAGER – TECHNICAL
T D D Chandrapala joined the Company in 2002 and counts over 12 years of experience at the Senior Management level of the Company. He holds a B.Sc. Degree in Civil Engineering and he is also a Chartered Civil Engineer. He has over 38 years of experience in the f ields of Irrigation and Drainage, Building Construction, Water Supply, Roads and Bridges.
MANOAJ JAYAHSURIYAGENERAL MANAGER PROJECT MANAGEMENT DIVISION – I
Manoaj joined the Company in March 2006. He has over 31 years of experience in diversif ied f ields such as the Sri Lanka Navy, operations, apparel manufacturing, corporate planning and human resources management. He is a Project Management Professional (PMP) who holds an MBA from the Postgraduate Institute of Management (PIM) of University of Sri Jayewardenepura, B.Sc. (Hons.) from the University of Colombo and a Postgraduate Diploma in Psychology as well as several naval professional qualif ications.
SRIMAL FERNANDOGENERAL MANAGER PROJECT MANAGEMENT DIVISION – II
Srimal joined the Company in August 1999 as a civil engineer and was promoted to Manager – Engineering in January 2004 and as General Manager in January 2008. He holds a Bachelor’s Degree in Civil Engineering from the University of Peradeniya and is a Corporate Member of the Institution of Engineers Sri Lanka. During the period of his service, he was involved with major projects in many diversif ied f ields such as Roads and Highways, Bridges, Telecommunication, Water and Waste Water, Piling and Buildings in a senior level management capacity.
CORPORATE MANAGEMENT TEAM
PREAMBLE BUSINESS MODEL VALUE CREATION STEWARDSHIP FINANCIAL REPORTS ANNEXES
98 /
ACCESS ENGINEERING PLC // ANNUAL REPORT 2016/17
PALITHA WANIGASUNDARAGENERAL MANAGERPROJECT MANAGEMENT DIVISION – III
Palitha joined the Company in 2007 as Deputy General Manager (Construction) and currently functions as the General Manager (Project Management Division – III). He holds a Master of Science Degree in Civil Engineering (USSR), a Master of Engineering Degree in Construction Management (University of Moratuwa) and a Master of Business Administration Degree (Postgraduate Institute of Management, University of Sri Jayewardenepura). He is a Fellow Member of Institution of Engineers Sri Lanka and a Corporate Member of the Institute of Engineers (Australia). Prior to joining the Company, he served in the National Water Supply and Drainage Board for 20 years in the capacities of Chief Engineer, Project Manager, Assistant General Manager and a Project Director.
KOSALA WICKRAMASINGHEGENERAL MANAGERPLANNING AND DEVELOPMENT
Kosala joined the Company as a Project Manager in 2007 and currently functions as the General Manager (Planning and Development). He holds a Bachelor of Science Honors Degree in Civil Engineering from the University of Moratuwa, Postgraduate Diploma in Structural Engineering from the University of Moratuwa and a Master of Business Administration Degree (UK). He is also a Corporate Member of the Institution of Engineers Sri Lanka and a Corporate Member of the Society of Structural Engineers Sri Lanka. He has over 18 years experience in various disciplines of Civil Engineering including Structural Engineering designs, contract administration and project management in Sri Lanka and overseas.
NIROSHAN THILAKARATHNEGENERAL MANAGER – COMMERCIAL
Niroshan presently serves in the capacity of the General Manager – Commercial after serving in various capacities in the Company over a period of almost 14 years. Also, he has over six years of experience before joining Access having worked in a professional f irm which provides Audit, Tax, Finance and Advisory services. He is also a Finalist of The Institute of Chartered Accountants of Sri Lanka.
CORPORATE MANAGEMENT TEAM
PREAMBLE BUSINESS MODEL VALUE CREATION STEWARDSHIP FINANCIAL REPORTS ANNEXES
99
ACCESS ENGINEERING PLC // ANNUAL REPORT 2016/17
/
PRABASHANA KUMARADEPUTY GENERAL MANAGER PROJECT MANAGEMENT DIVISION – II
Prabashana joined the Company in December 2006 as an Operations Manager – Telecom Projects and was promoted to Senior Manager – Telecom Projects in 2010 and as Deputy General Manager in April 2014. He holds a Bachelor of Science Degree in Electrical and Electronics Engineering from the University of Peradeniya. He has 18 years of experience in the f ields of Telecommunication and Building Services (M&E) and was involved in several major projects in Sri Lanka and overseas in Key Management roles.
NILANTHA IDDAGODADEPUTY GENERAL MANAGER – FINANCE
Nilantha joined the Company in 2008 and presently serves in the capacity of the Deputy General Manager – Finance of the Company. He is an Associate Member (ACA) of The Institute of Chartered Accountants of Sri Lanka and an Associate Member of the Association of Accounting Technicians of Sri Lanka. He holds an MBA from the Postgraduate Institute of Management (PIM) of University of Sri Jayewardenepura and holds a B.Sc. Estate Management and Valuation (Special) Degree from the University of Sri Jayewardenepura. He has over 12 years of experience in the f ield of Finance and Auditing.
THASANTHA KUMARADEPUTY GENERAL MANAGER
Thasantha joined the Company at the beginning of 2013. He has over 21 years of experience in the f ield of Civil Engineering including Roads, Highways and Bridge Engineering and Project Management. He has served in the capacity of Resident Engineer, Design Engineer, Executive Engineer for the Road Development Authority for seven years and in the private sector for 13 years in the capacity of Project Manager, Senior Project Manager and Divisional Co-ordinator in the Roads, Highways and Bridges Division. He has a B.Sc. (Hons.) in Civil Engineering from the University of Moratuwa and a Postgraduate Diploma in Highway and Traff ic Engineering from the University of Moratuwa. He is also a Corporate Member of the Institution of Engineers Sri Lanka.
CORPORATE MANAGEMENT TEAM
PREAMBLE BUSINESS MODEL VALUE CREATION STEWARDSHIP FINANCIAL REPORTS ANNEXES
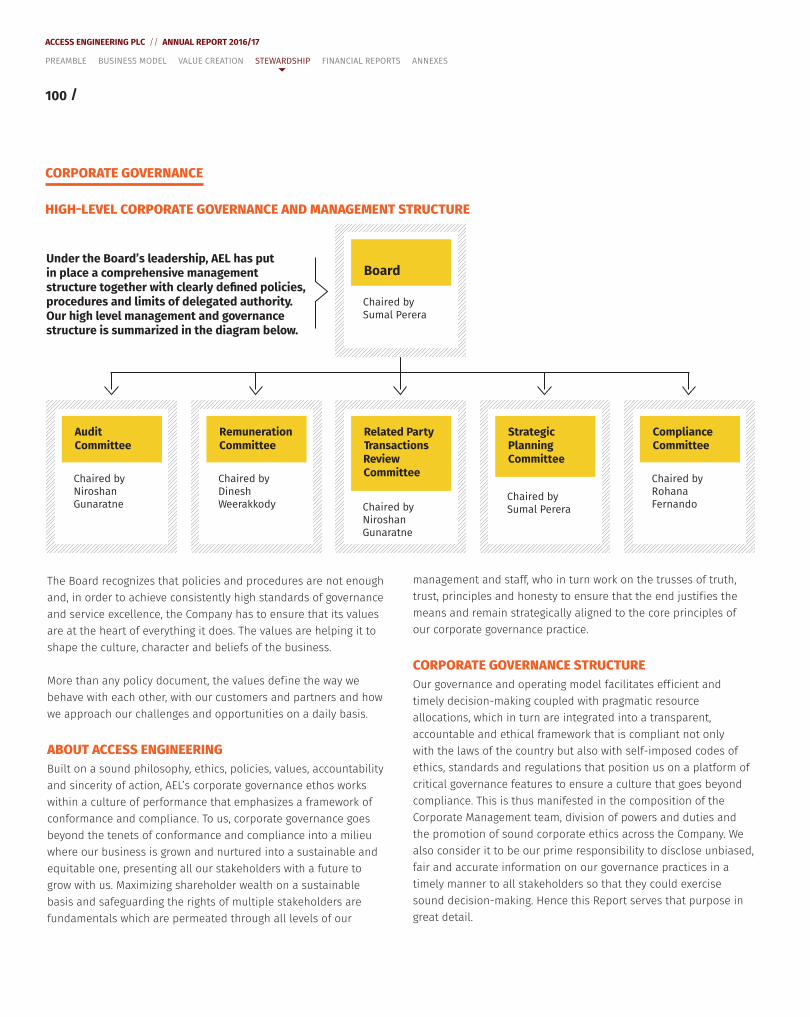
100 /
ACCESS ENGINEERING PLC // ANNUAL REPORT 2016/17
CORPORATE GOVERNANCE
HIGH-LEVEL CORPORATE GOVERNANCE AND MANAGEMENT STRUCTURE
Under the Board’s leadership, AEL has putin place a comprehensive management
fistructure together with clearly de ned policies,procedures and limits of delegated authority.Our high level management and governance
zstructure is summari ed in the diagram below.
AuditCommittee
Chai ed byrNiroshan
aGun ratne
RemunerationCommittee
Chai ed byrDineshWeerakkody
Related PartyTransactionsReviewCommittee
Chai ed byrNiroshan
aGun ratne
StrategicPlanningCommittee
Chai ed byrSumal Perera
ComplianceCommittee
Chai ed byrRohanaFernando
Board
Chai ed byrSumal Perera
The Board recognizes that policies and procedures are not enough and, in order to achieve consistently high standards of governance and service excellence, the Company has to ensure that its values are at the heart of everything it does. The values are helping it to shape the culture, character and beliefs of the business.
More than any policy document, the values def ine the way we behave with each other, with our customers and partners and how we approach our challenges and opportunities on a daily basis.
ABOUT ACCESS ENGINEERINGBuilt on a sound philosophy, ethics, policies, values, accountability and sincerity of action, AEL’s corporate governance ethos works within a culture of performance that emphasizes a framework of conformance and compliance. To us, corporate governance goes beyond the tenets of conformance and compliance into a milieu where our business is grown and nurtured into a sustainable and equitable one, presenting all our stakeholders with a future to grow with us. Maximizing shareholder wealth on a sustainable basis and safeguarding the rights of multiple stakeholders are fundamentals which are permeated through all levels of our
management and staff, who in turn work on the trusses of truth, trust, principles and honesty to ensure that the end justif ies the means and remain strategically aligned to the core principles of our corporate governance practice.
CORPORATE GOVERNANCE STRUCTUREOur governance and operating model facilitates eff icient and timely decision-making coupled with pragmatic resource allocations, which in turn are integrated into a transparent, accountable and ethical framework that is compliant not only with the laws of the country but also with self-imposed codes of ethics, standards and regulations that position us on a platform of critical governance features to ensure a culture that goes beyond compliance. This is thus manifested in the composition of the Corporate Management team, division of powers and duties and the promotion of sound corporate ethics across the Company. We also consider it to be our prime responsibility to disclose unbiased, fair and accurate information on our governance practices in a timely manner to all stakeholders so that they could exercise sound decision-making. Hence this Report serves that purpose in great detail.
PREAMBLE BUSINESS MODEL VALUE CREATION STEWARDSHIP FINANCIAL REPORTS ANNEXES
101
ACCESS ENGINEERING PLC // ANNUAL REPORT 2016/17
/CORPORATE GOVERNANCE
The Company’s vision and mission remain f irmly embedded in our future journey with the Board of Directors and Executive Management providing the necessary stewardship to our team and other stakeholders to achieve our objectives. Evaluating and setting the direction of the Company’s strategic initiatives, performance objectives and targets also remain entrenched within the Board of Directors, in addition to strengthening the overarching Company principle of protecting the interests of all stakeholders and consolidation of business activities to ensure continuity and sustainability.
LEADERSHIPTHE CHAIRMANChairman of the Company who acts in an Executive capacity is mainly responsible for directing the affairs of the Board while maintaining effective external relationships and practice of good corporate governance. The Chairman is responsible for making sure that the agenda, minutes of prior meetings, Board papers and supplementary information are circulated among the members in advance giving suff icient time for preparation. He encourages active and effective participation of all Board members facilitating productive discussions. The Chairman ensures the proper recording of all matters discussed at the meetings through the Company Secretary. He is also responsible for making the Board members aware of the importance of creating value to all stakeholders of the Company. Chairman’s responsibilities are discussed in detail on pages 114 and 115.
BOARD OF DIRECTORSThe Board as a whole continues to take ownership of effective leadership and the long-term success of the Company. The management and governance framework, which the Board has implemented to support the Company’s long-term growth objectives is set out on page 100. The Board comprises ten (10) Directors out of which f ive (5) are Executive Directors and f ive (5) are Non-Executive Directors. Day-to-day affairs of the Company are headed by the Managing Director who is supported by the Director/Chief Operating Off icer (COO). Three of the Non-Executive Directors are independent in respect of criteria laid down by the regulatory authorities and have no interests or relationships in relation to the affairs of the Company. The diverse range of skills and leadership experience offered by the Non-Executive Directors means that they are well-qualif ied to scrutinize performance, assess the Group’s risk management and control processes, provide constructive challenge and to support the Executive Directors. Decisions regarding new Board appointments are taken by the Board collectively and the qualif ications and experience of
Board members are decided based on the nature of the business of the Company and the value addition the member is expected to bring to the Board and the Company. Biographical details for each of the Directors are set out on pages 94 to 95.
CORPORATE MANAGEMENT OF ACCESS ENGINEERINGAccess Engineering’s Corporate Management team is committed to achieving sustained value creation for the benef it of all stakeholders through adherence to a set of well-def ined corporate governance principles, coupled with maintaining effective structures and processes within the Company. The team, which comprises the Managing Director, Chief Operating Off icer, Board Members and Senior Management, meet at regular intervals to discuss the management of business activities. Project implementation is carried out by the Project Management Divisions wherein General Managers and Deputy General Managers work on plans and targets, matching those to realistic time frames and ensuring any shortfalls or delays are speedily rectif ied. Authority is exercised within an ethical framework of business practices established by the Board, which demands compliance with existing laws and regulations as well as best practices in dealing with employees, customers, suppliers and the community at large.
We have also infused a milieu of increased participation by middle management to permeate the need for a more responsible, transparent and accountable administration, which in turn will strengthen the f inancial discipline of the Company. The culture of high authority tied-up with high accountability has given us the freedom to respond to customer needs faster than most of the competitors which has been the cornerstone of our competitive advantage. The permeation of authority and accountability right down to the shop-floor level and the front-line has freed up the top management to dwell on the more strategic and conceptual inputs.
Driving a team branded on excellence, people remain centric to our entire operational capabilities and engineering competencies. The experience and professionalism within our team has been the catalyst in integrating our core competencies into strategic partnerships. Maintaining a healthy work-life balance with an environment of superior human resource development via a comprehensive Quality Management System and Occupational Health and Safety Management System inculcate the culture of meritocracy and performance-oriented individuals who make-up for an excellent team, driven to achieve ambitious goals. Part of the compensation of staff including Executive Directors and the Corporate Management is performance based and the distribution
PREAMBLE BUSINESS MODEL VALUE CREATION STEWARDSHIP FINANCIAL REPORTS ANNEXES
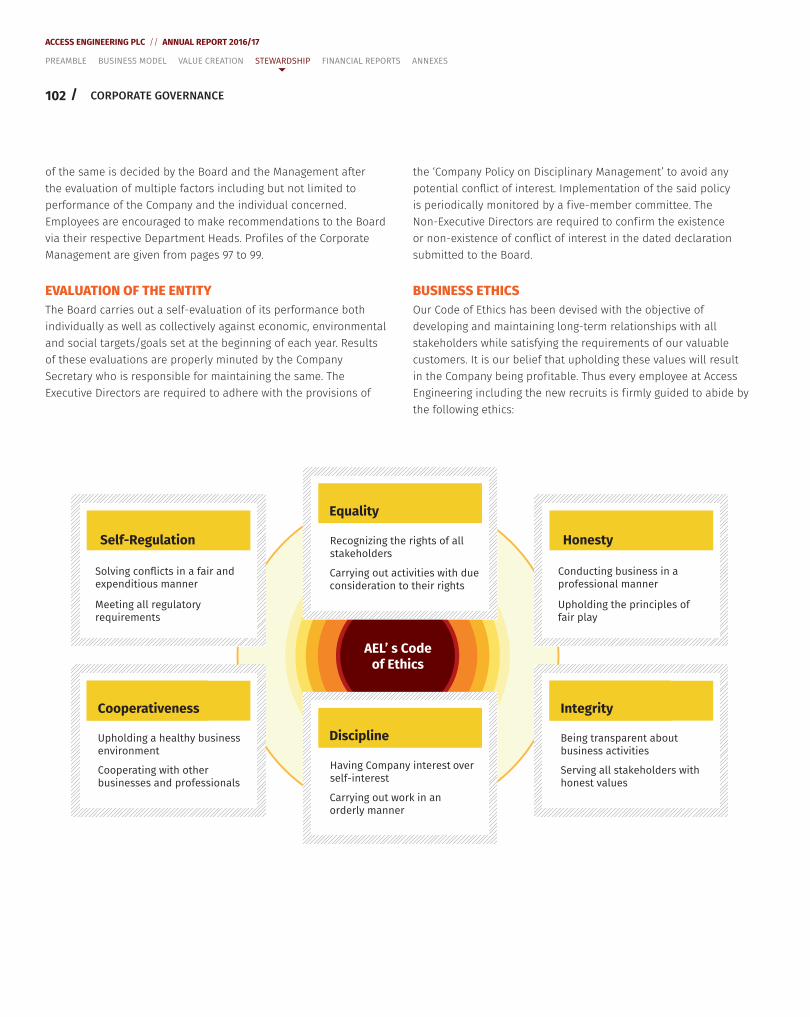
102 /
ACCESS ENGINEERING PLC // ANNUAL REPORT 2016/17
of the same is decided by the Board and the Management after the evaluation of multiple factors including but not limited to performance of the Company and the individual concerned. Employees are encouraged to make recommendations to the Board via their respective Department Heads. Prof iles of the Corporate Management are given from pages 97 to 99.
EVALUATION OF THE ENTITYThe Board carries out a self-evaluation of its performance both individually as well as collectively against economic, environmental and social targets/goals set at the beginning of each year. Results of these evaluations are properly minuted by the Company Secretary who is responsible for maintaining the same. The Executive Directors are required to adhere with the provisions of
the ‘Company Policy on Disciplinary Management’ to avoid any potential conflict of interest. Implementation of the said policy is periodically monitored by a f ive-member committee. The Non-Executive Directors are required to conf irm the existence or non-existence of conflict of interest in the dated declaration submitted to the Board.
BUSINESS ETHICSOur Code of Ethics has been devised with the objective of developing and maintaining long-term relationships with all stakeholders while satisfying the requirements of our valuable customers. It is our belief that upholding these values will result in the Company being prof itable. Thus every employee at Access Engineering including the new recruits is f irmly guided to abide by the following ethics:
CORPORATE GOVERNANCE
AEL’ s Codeof Ethics
Integrity
Being transparent aboutbusiness activities
Serving all stakeholders withhonest values
Conducting business in aprofessional manner
Upholding the principles offair play
Honesty
Cooperativeness
Upholding a healthy businessenvironment
Cooperating with otherbusinesses and professionals
Solving conflicts in a fair andexpenditious manner
Meeting all regulatoryrequirements
Self-Regulation
Discipline
Having Company interest overself-interest
Carrying out work in anorderly manner
Equality
Recognizing the rights of allstakeholders
Carrying out activities with dueconsideration to their rights
PREAMBLE BUSINESS MODEL VALUE CREATION STEWARDSHIP FINANCIAL REPORTS ANNEXES
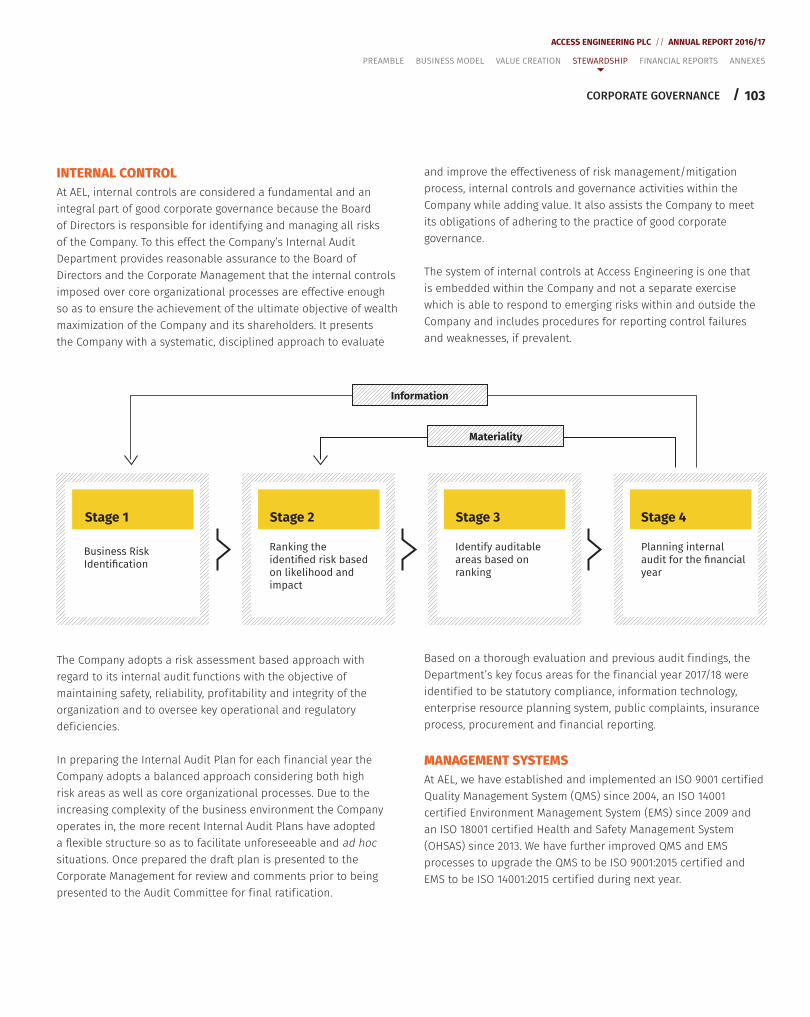
103
ACCESS ENGINEERING PLC // ANNUAL REPORT 2016/17
/
INTERNAL CONTROLAt AEL, internal controls are considered a fundamental and an integral part of good corporate governance because the Board of Directors is responsible for identifying and managing all risks of the Company. To this effect the Company’s Internal Audit Department provides reasonable assurance to the Board of Directors and the Corporate Management that the internal controls imposed over core organizational processes are effective enough so as to ensure the achievement of the ultimate objective of wealth maximization of the Company and its shareholders. It presents the Company with a systematic, disciplined approach to evaluate
and improve the effectiveness of risk management/mitigation process, internal controls and governance activities within the Company while adding value. It also assists the Company to meet its obligations of adhering to the practice of good corporate governance.
The system of internal controls at Access Engineering is one that is embedded within the Company and not a separate exercise which is able to respond to emerging risks within and outside the Company and includes procedures for reporting control failures and weaknesses, if prevalent.
CORPORATE GOVERNANCE
Stage 1
Business RiskficationIdenti
Ranking theidentified risk basedon likelihood andimpact
Stage 2 Stage 3
Identify auditableareas based onranking
Stage 4
Planning internalaudit for the financialyear
Information
Materiality
The Company adopts a risk assessment based approach with regard to its internal audit functions with the objective of maintaining safety, reliability, prof itability and integrity of the organization and to oversee key operational and regulatory def iciencies.
In preparing the Internal Audit Plan for each f inancial year the Company adopts a balanced approach considering both high risk areas as well as core organizational processes. Due to the increasing complexity of the business environment the Company operates in, the more recent Internal Audit Plans have adopted a flexible structure so as to facilitate unforeseeable and ad hoc situations. Once prepared the draft plan is presented to the Corporate Management for review and comments prior to being presented to the Audit Committee for f inal ratif ication.
Based on a thorough evaluation and previous audit f indings, the Department’s key focus areas for the f inancial year 2017/18 were identif ied to be statutory compliance, information technology, enterprise resource planning system, public complaints, insurance process, procurement and f inancial reporting.
MANAGEMENT SYSTEMSAt AEL, we have established and implemented an ISO 9001 certif ied Quality Management System (QMS) since 2004, an ISO 14001 certif ied Environment Management System (EMS) since 2009 and an ISO 18001 certif ied Health and Safety Management System (OHSAS) since 2013. We have further improved QMS and EMS processes to upgrade the QMS to be ISO 9001:2015 certif ied and EMS to be ISO 14001:2015 certif ied during next year.
PREAMBLE BUSINESS MODEL VALUE CREATION STEWARDSHIP FINANCIAL REPORTS ANNEXES
104 /
ACCESS ENGINEERING PLC // ANNUAL REPORT 2016/17
The Corporate Management of AEL ensures its commitment and provision of adequate resources for the effective implementation of management systems while internal audits are carried out to ensure conformance with the management systems. They are also periodically reviewed for continual improvement.
QUALITY MANAGEMENT SYSTEM (QMS)QMS of the Company establishes policies, objectives, processes and procedures in order to continually improve the effectiveness and eff iciency of its performance. The system def ines processes which will result in the production of quality products and services instead of adopting a reactive approach of detecting defective products or services after production. It ensures:
y The ability of AEL to deliver the desired product and/or service consistently, while meeting relevant interested parties' needs and expectations; and
y That the products and services are produced at an optimum cost with eff icient use of the available resources – materials, human, technology and information.
Risk based thinking is one the key feature of the existing QMS which has replaced the concept of preventive actions. The system interacts with all activities of the organization, beginning with the identif ication of relevant interested parties' needs and expectations, and ending with their satisfaction while enabling AEL to improve process control, reduce wastage, increase market share and raise morale of employees.
Our Quality Policy y Access Engineering PLC is committed to satisfy customer needs and expectations by providing high quality products and services with effective, eff icient and innovative solutions.
y The top management determines the context of the organization by strategically analyzing and reviewing its internal and external factors to support its strategic direction.
y The Company is committed, towards the identif ication of relevant interested parties, their needs and expectations and fulf illment to enhance the sustainability of the business.
y To meet with the above commitment, the Company continually improves its quality management system whilst adhering to the applicable regulatory requirements through cost effective, prof itable, safe and sound environmental friendly operations.
ENVIRONMENT MANAGEMENT SYSTEM (EMS)The EMS of AEL enables it to manage the organization's signif icant environmental impact/s due to operations which includes waste, emissions, energy use and consumption of materials. During the implementation of EMS signif icant environmental impacts due to the organization’s business activities are identif ied and appropriate controls and programs are established to ensure minimal impact to the environment. This enables us to:
y Manage and improve our environmental performance (managing negative impacts) and increase the eff iciency of resource utilization (e.g. reduce waste and energy use).
y Comply with environmental laws and regulations.
y Improve our standing and reputation among staff, clients, partners and other stakeholders.
y Adapt to changing environments (in operations and/or products and services).
OUR ENVIRONMENT POLICY y Access Engineering PLC is committed to carry out its operations to have a minimal impact to the environment as its strategic direction for the sustainable business.
y The Company analyzes the internal and external factors affecting the performance of its environment management system.
y The Company identif ies and reviews the needs and the expectations of the interested parties including compliance obligations with regards to the environment and establishes communication with the relevant interested parties on environmental obligations.
y The environmental management system is continually improved by reviewing, assessing and setting targets and objectives for enhancing its performance.
HEALTH AND SAFETY MANAGEMENT SYSTEM Our Health and Safety Management System is a systematic approach put in place to minimize the risk of injury and illness. It involves identifying, assessing and controlling risks to workers in all workplace operations. The core elements of our Health and Safety Management System includes management involvement and commitment, hazard identif ication and risk assessment, hazard control, training, emergency response, incident reporting and investigation and communication. The system enables us to protect our workforce, comply with laws and regulations, reduce cost, enhance employee relations and create an incident-free workplace.
CORPORATE GOVERNANCE
PREAMBLE BUSINESS MODEL VALUE CREATION STEWARDSHIP FINANCIAL REPORTS ANNEXES
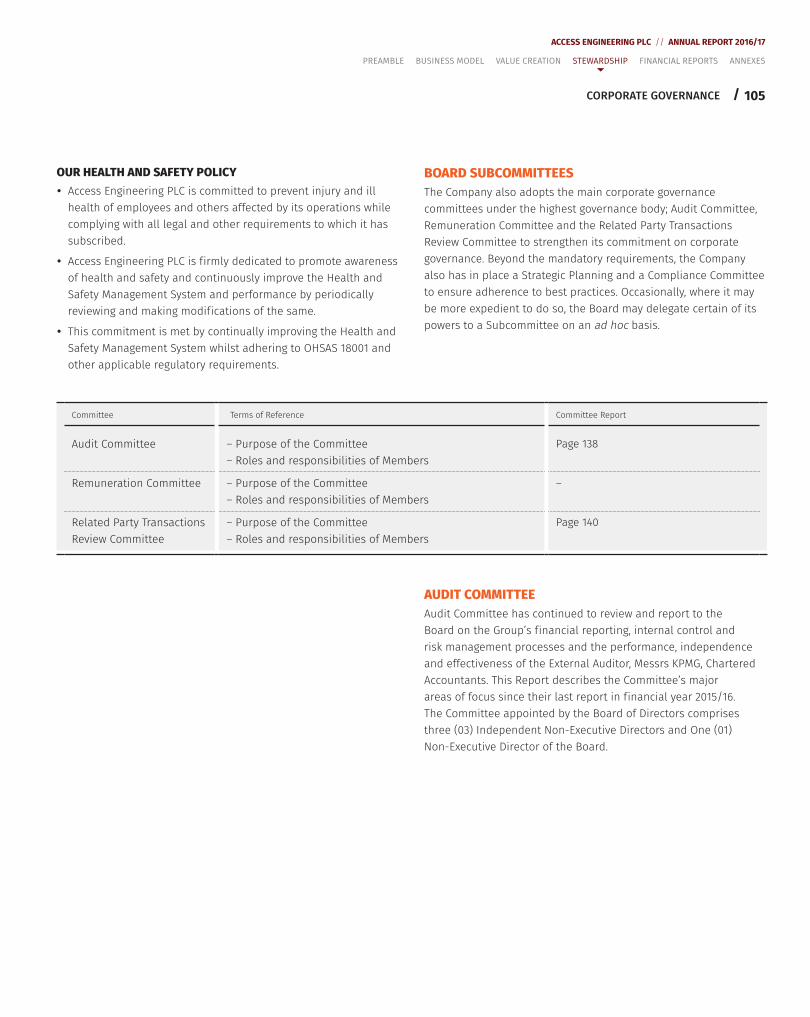
105
ACCESS ENGINEERING PLC // ANNUAL REPORT 2016/17
/
OUR HEALTH AND SAFETY POLICY y Access Engineering PLC is committed to prevent injury and ill health of employees and others affected by its operations while complying with all legal and other requirements to which it has subscribed.
y Access Engineering PLC is f irmly dedicated to promote awareness of health and safety and continuously improve the Health and Safety Management System and performance by periodically reviewing and making modif ications of the same.
y This commitment is met by continually improving the Health and Safety Management System whilst adhering to OHSAS 18001 and other applicable regulatory requirements.
BOARD SUBCOMMITTEESThe Company also adopts the main corporate governance committees under the highest governance body; Audit Committee, Remuneration Committee and the Related Party Transactions Review Committee to strengthen its commitment on corporate governance. Beyond the mandatory requirements, the Company also has in place a Strategic Planning and a Compliance Committee to ensure adherence to best practices. Occasionally, where it may be more expedient to do so, the Board may delegate certain of its powers to a Subcommittee on an ad hoc basis.
Committee Terms of Reference Committee Report
Audit Committee – Purpose of the Committee– Roles and responsibilities of Members
Page 138
Remuneration Committee – Purpose of the Committee– Roles and responsibilities of Members
–
Related Party Transactions Review Committee
– Purpose of the Committee– Roles and responsibilities of Members
Page 140
CORPORATE GOVERNANCE
PREAMBLE BUSINESS MODEL VALUE CREATION STEWARDSHIP FINANCIAL REPORTS ANNEXES
AUDIT COMMITTEEAudit Committee has continued to review and report to the Board on the Group’s f inancial reporting, internal control and risk management processes and the performance, independence and effectiveness of the External Auditor, Messrs KPMG, Chartered Accountants. This Report describes the Committee’s major areas of focus since their last report in f inancial year 2015/16. The Committee appointed by the Board of Directors comprises three (03) Independent Non-Executive Directors and One (01) Non-Executive Director of the Board.
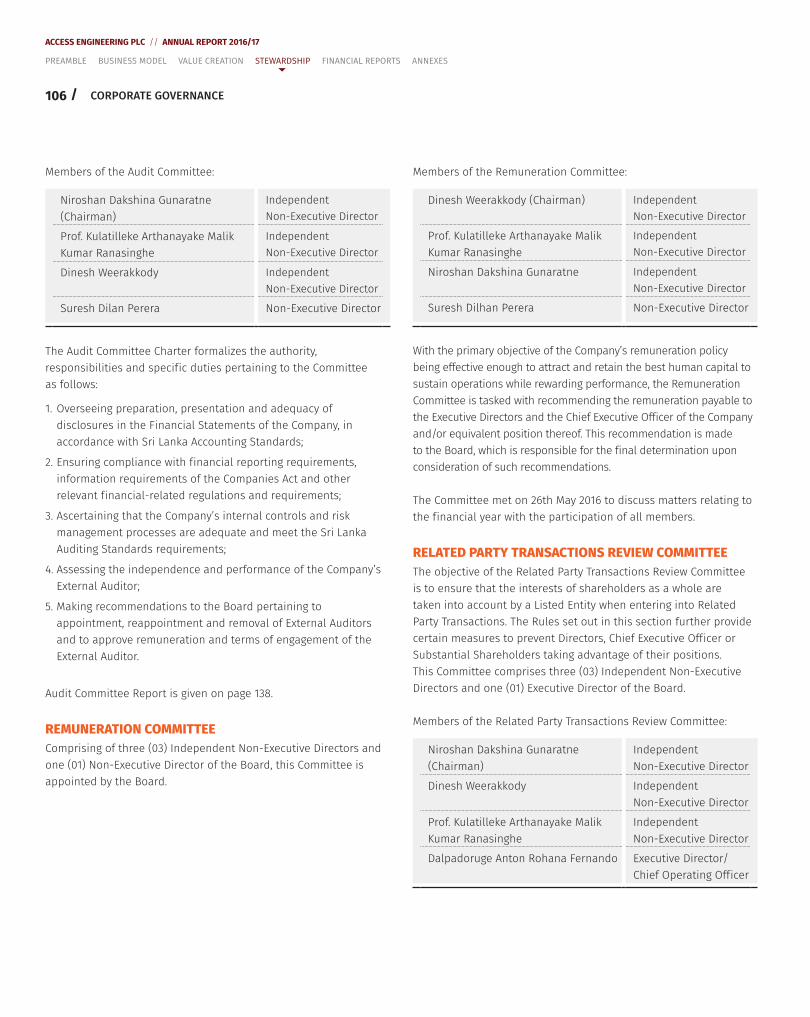
106 /
ACCESS ENGINEERING PLC // ANNUAL REPORT 2016/17
Members of the Audit Committee:
Niroshan Dakshina Gunaratne (Chairman)
Independent Non-Executive Director
Prof. Kulatilleke Arthanayake Malik Kumar Ranasinghe
Independent Non-Executive Director
Dinesh Weerakkody Independent Non-Executive Director
Suresh Dilan Perera Non-Executive Director
The Audit Committee Charter formalizes the authority, responsibilities and specif ic duties pertaining to the Committee as follows:
1. Overseeing preparation, presentation and adequacy of disclosures in the Financial Statements of the Company, in accordance with Sri Lanka Accounting Standards;
2. Ensuring compliance with f inancial reporting requirements, information requirements of the Companies Act and other relevant f inancial-related regulations and requirements;
3. Ascertaining that the Company’s internal controls and risk management processes are adequate and meet the Sri Lanka Auditing Standards requirements;
4. Assessing the independence and performance of the Company’s External Auditor;
5. Making recommendations to the Board pertaining to appointment, reappointment and removal of External Auditors and to approve remuneration and terms of engagement of the External Auditor.
Audit Committee Report is given on page 138.
REMUNERATION COMMITTEEComprising of three (03) Independent Non-Executive Directors and one (01) Non-Executive Director of the Board, this Committee is appointed by the Board.
Members of the Remuneration Committee:
Dinesh Weerakkody (Chairman) Independent Non-Executive Director
Prof. Kulatilleke Arthanayake Malik Kumar Ranasinghe
Independent Non-Executive Director
Niroshan Dakshina Gunaratne Independent Non-Executive Director
Suresh Dilhan Perera Non-Executive Director
With the primary objective of the Company’s remuneration policy being effective enough to attract and retain the best human capital to sustain operations while rewarding performance, the Remuneration Committee is tasked with recommending the remuneration payable to the Executive Directors and the Chief Executive Off icer of the Company and/or equivalent position thereof. This recommendation is made to the Board, which is responsible for the f inal determination upon consideration of such recommendations.
The Committee met on 26th May 2016 to discuss matters relating to the f inancial year with the participation of all members.
RELATED PARTY TRANSACTIONS REVIEW COMMITTEE The objective of the Related Party Transactions Review Committee is to ensure that the interests of shareholders as a whole are taken into account by a Listed Entity when entering into Related Party Transactions. The Rules set out in this section further provide certain measures to prevent Directors, Chief Executive Off icer or Substantial Shareholders taking advantage of their positions. This Committee comprises three (03) Independent Non-Executive Directors and one (01) Executive Director of the Board.
Members of the Related Party Transactions Review Committee:
Niroshan Dakshina Gunaratne (Chairman)
Independent Non-Executive Director
Dinesh Weerakkody Independent Non-Executive Director
Prof. Kulatilleke Arthanayake Malik Kumar Ranasinghe
Independent Non-Executive Director
Dalpadoruge Anton Rohana Fernando Executive Director/Chief Operating Off icer
CORPORATE GOVERNANCE
PREAMBLE BUSINESS MODEL VALUE CREATION STEWARDSHIP FINANCIAL REPORTS ANNEXES
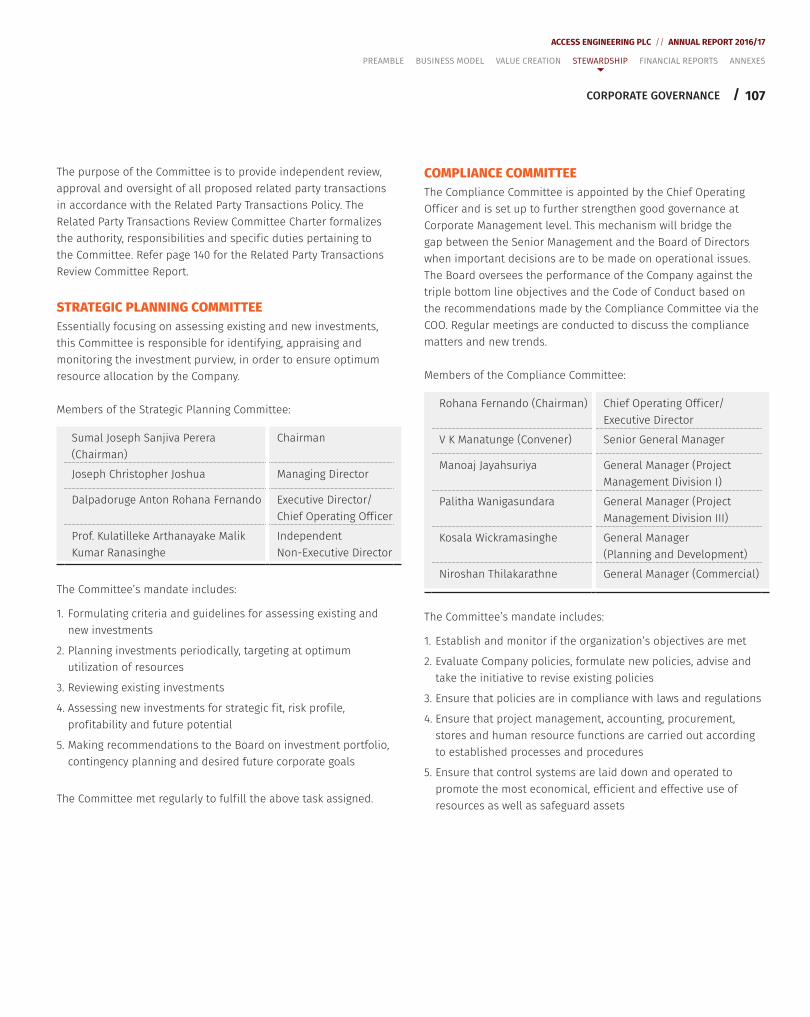
107
ACCESS ENGINEERING PLC // ANNUAL REPORT 2016/17
/
The purpose of the Committee is to provide independent review, approval and oversight of all proposed related party transactions in accordance with the Related Party Transactions Policy. The Related Party Transactions Review Committee Charter formalizes the authority, responsibilities and specif ic duties pertaining to the Committee. Refer page 140 for the Related Party Transactions Review Committee Report.
STRATEGIC PLANNING COMMITTEEEssentially focusing on assessing existing and new investments, this Committee is responsible for identifying, appraising and monitoring the investment purview, in order to ensure optimum resource allocation by the Company.
Members of the Strategic Planning Committee:
Sumal Joseph Sanjiva Perera (Chairman)
Chairman
Joseph Christopher Joshua Managing Director
Dalpadoruge Anton Rohana Fernando Executive Director/Chief Operating Off icer
Prof. Kulatilleke Arthanayake Malik Kumar Ranasinghe
Independent Non-Executive Director
The Committee’s mandate includes:
1. Formulating criteria and guidelines for assessing existing and new investments
2. Planning investments periodically, targeting at optimum utilization of resources
3. Reviewing existing investments
4. Assessing new investments for strategic f it, risk prof ile, prof itability and future potential
5. Making recommendations to the Board on investment portfolio, contingency planning and desired future corporate goals
The Committee met regularly to fulf ill the above task assigned.
COMPLIANCE COMMITTEEThe Compliance Committee is appointed by the Chief Operating Off icer and is set up to further strengthen good governance at Corporate Management level. This mechanism will bridge the gap between the Senior Management and the Board of Directors when important decisions are to be made on operational issues. The Board oversees the performance of the Company against the triple bottom line objectives and the Code of Conduct based on the recommendations made by the Compliance Committee via the COO. Regular meetings are conducted to discuss the compliance matters and new trends.
Members of the Compliance Committee:
Rohana Fernando (Chairman) Chief Operating Off icer/Executive Director
V K Manatunge (Convener) Senior General Manager
Manoaj Jayahsuriya General Manager (Project Management Division I)
Palitha Wanigasundara General Manager (Project Management Division III)
Kosala Wickramasinghe General Manager (Planning and Development)
Niroshan Thilakarathne General Manager (Commercial)
The Committee’s mandate includes:
1. Establish and monitor if the organization’s objectives are met
2. Evaluate Company policies, formulate new policies, advise and take the initiative to revise existing policies
3. Ensure that policies are in compliance with laws and regulations
4. Ensure that project management, accounting, procurement, stores and human resource functions are carried out according to established processes and procedures
5. Ensure that control systems are laid down and operated to promote the most economical, eff icient and effective use of resources as well as safeguard assets
CORPORATE GOVERNANCE
PREAMBLE BUSINESS MODEL VALUE CREATION STEWARDSHIP FINANCIAL REPORTS ANNEXES
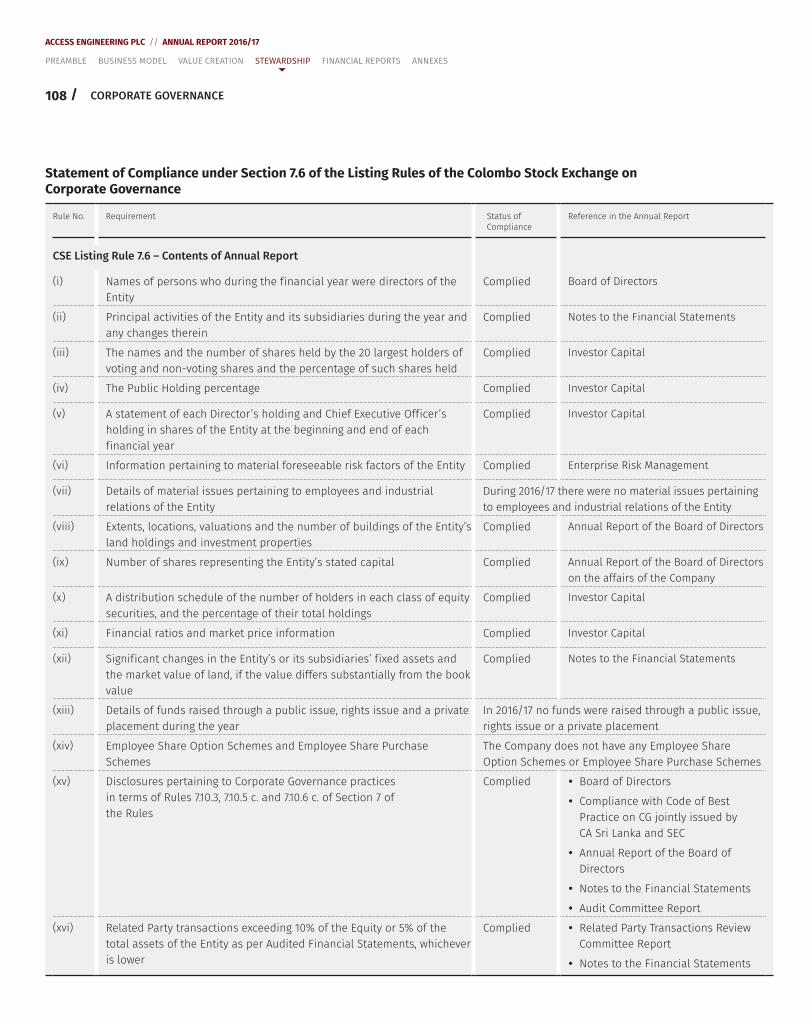
108 /
ACCESS ENGINEERING PLC // ANNUAL REPORT 2016/17
Statement of Compliance under Section 7.6 of the Listing Rules of the Colombo Stock Exchange on Corporate Governance
Rule No. Requirement Status of Compliance
Reference in the Annual Report
CSE Listing Rule 7.6 – Contents of Annual Report
(i) Names of persons who during the f inancial year were directors of the Entity
Complied Board of Directors
(ii) Principal activities of the Entity and its subsidiaries during the year and any changes therein
Complied Notes to the Financial Statements
(iii) The names and the number of shares held by the 20 largest holders of voting and non-voting shares and the percentage of such shares held
Complied Investor Capital
(iv) The Public Holding percentage Complied Investor Capital
(v) A statement of each Director’s holding and Chief Executive Off icer’s holding in shares of the Entity at the beginning and end of each f inancial year
Complied Investor Capital
(vi) Information pertaining to material foreseeable risk factors of the Entity Complied Enterprise Risk Management
(vii) Details of material issues pertaining to employees and industrial relations of the Entity
During 2016/17 there were no material issues pertaining to employees and industrial relations of the Entity
(viii) Extents, locations, valuations and the number of buildings of the Entity’s land holdings and investment properties
Complied Annual Report of the Board of Directors
(ix) Number of shares representing the Entity’s stated capital Complied Annual Report of the Board of Directors on the affairs of the Company
(x) A distribution schedule of the number of holders in each class of equity securities, and the percentage of their total holdings
Complied Investor Capital
(xi) Financial ratios and market price information Complied Investor Capital
(xii) Signif icant changes in the Entity’s or its subsidiaries’ f ixed assets and the market value of land, if the value differs substantially from the book value
Complied Notes to the Financial Statements
(xiii) Details of funds raised through a public issue, rights issue and a private placement during the year
In 2016/17 no funds were raised through a public issue, rights issue or a private placement
(xiv) Employee Share Option Schemes and Employee Share Purchase Schemes
The Company does not have any Employee Share Option Schemes or Employee Share Purchase Schemes
(xv) Disclosures pertaining to Corporate Governance practices in terms of Rules 7.10.3, 7.10.5 c. and 7.10.6 c. of Section 7 of the Rules
Complied y Board of Directors
y Compliance with Code of Best Practice on CG jointly issued by CA Sri Lanka and SEC
y Annual Report of the Board of Directors
y Notes to the Financial Statements
y Audit Committee Report
(xvi) Related Party transactions exceeding 10% of the Equity or 5% of the total assets of the Entity as per Audited Financial Statements, whichever is lower
Complied y Related Party Transactions Review Committee Report
y Notes to the Financial Statements
CORPORATE GOVERNANCE
PREAMBLE BUSINESS MODEL VALUE CREATION STEWARDSHIP FINANCIAL REPORTS ANNEXES
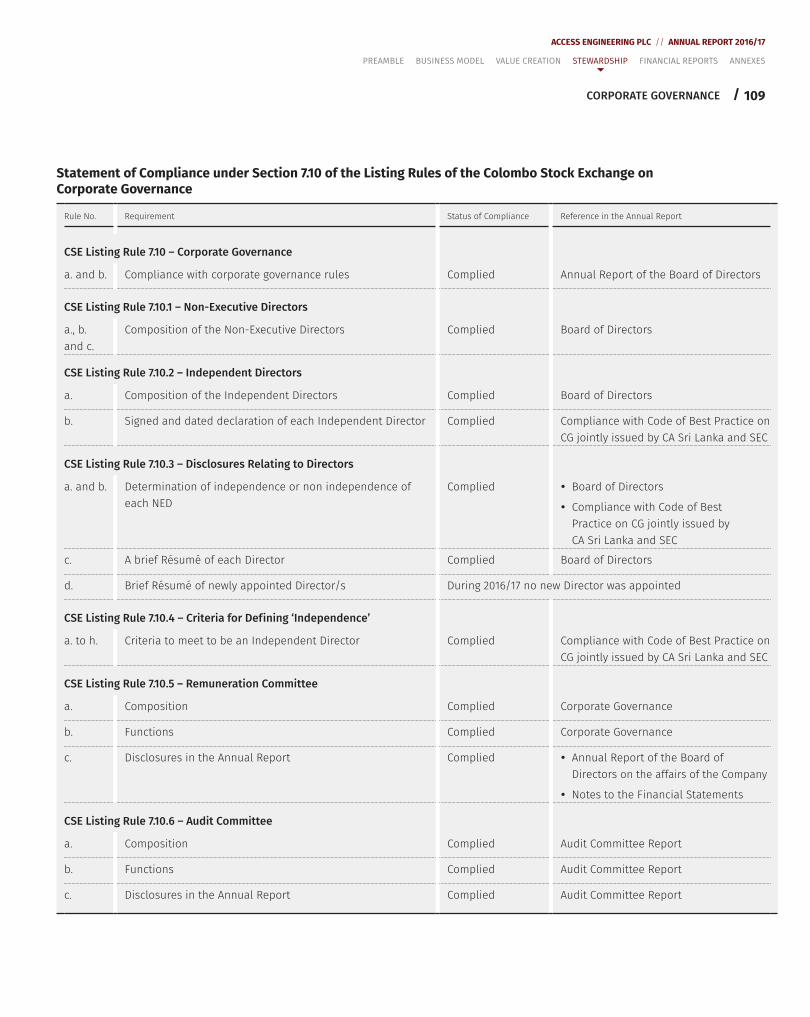
109
ACCESS ENGINEERING PLC // ANNUAL REPORT 2016/17
/
Statement of Compliance under Section 7.10 of the Listing Rules of the Colombo Stock Exchange on Corporate Governance
Rule No. Requirement Status of Compliance Reference in the Annual Report
CSE Listing Rule 7.10 – Corporate Governance
a. and b. Compliance with corporate governance rules Complied Annual Report of the Board of Directors
CSE Listing Rule 7.10.1 – Non-Executive Directors
a., b. and c.
Composition of the Non-Executive Directors Complied Board of Directors
CSE Listing Rule 7.10.2 – Independent Directors
a. Composition of the Independent Directors Complied Board of Directors
b. Signed and dated declaration of each Independent Director Complied Compliance with Code of Best Practice on CG jointly issued by CA Sri Lanka and SEC
CSE Listing Rule 7.10.3 – Disclosures Relating to Directors
a. and b. Determination of independence or non independence of each NED
Complied y Board of Directors
y Compliance with Code of Best Practice on CG jointly issued by CA Sri Lanka and SEC
c. A brief Résumé of each Director Complied Board of Directors
d. Brief Résumé of newly appointed Director/s During 2016/17 no new Director was appointed
CSE Listing Rule 7.10.4 – Criteria for Def ining ‘Independence’
a. to h. Criteria to meet to be an Independent Director Complied Compliance with Code of Best Practice on CG jointly issued by CA Sri Lanka and SEC
CSE Listing Rule 7.10.5 – Remuneration Committee
a. Composition Complied Corporate Governance
b. Functions Complied Corporate Governance
c. Disclosures in the Annual Report Complied y Annual Report of the Board of Directors on the affairs of the Company
y Notes to the Financial Statements
CSE Listing Rule 7.10.6 – Audit Committee
a. Composition Complied Audit Committee Report
b. Functions Complied Audit Committee Report
c. Disclosures in the Annual Report Complied Audit Committee Report
CORPORATE GOVERNANCE
PREAMBLE BUSINESS MODEL VALUE CREATION STEWARDSHIP FINANCIAL REPORTS ANNEXES
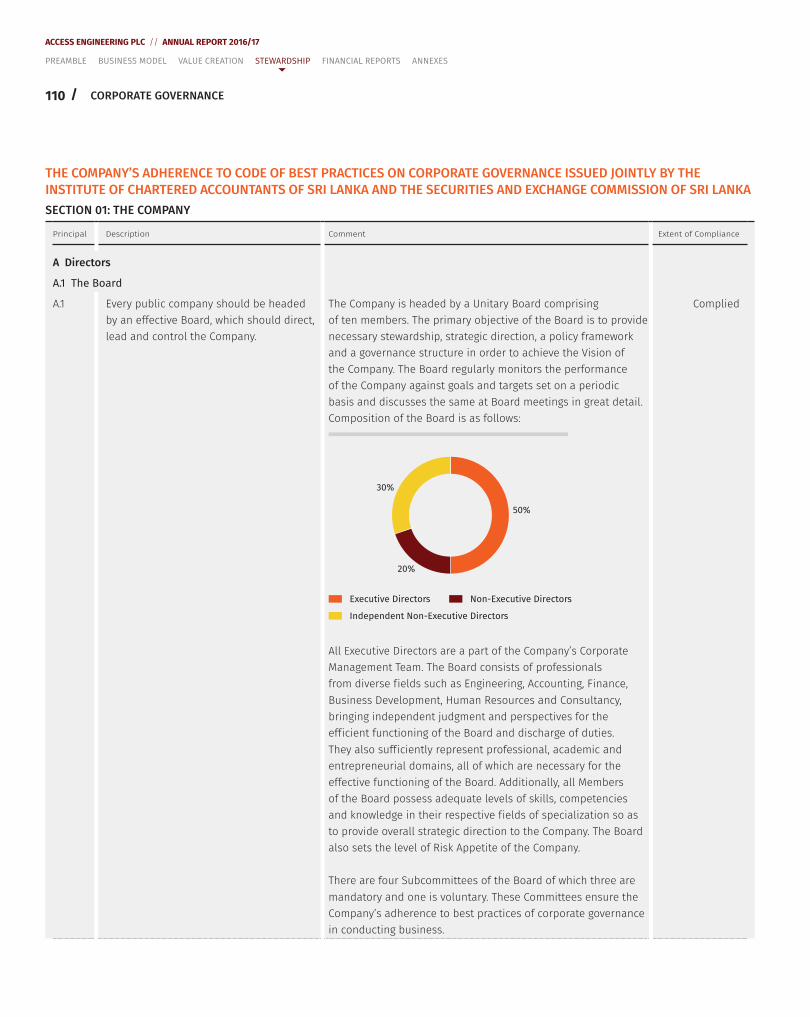
110 /
ACCESS ENGINEERING PLC // ANNUAL REPORT 2016/17
THE COMPANY’S ADHERENCE TO CODE OF BEST PRACTICES ON CORPORATE GOVERNANCE ISSUED JOINTLY BY THE INSTITUTE OF CHARTERED ACCOUNTANTS OF SRI LANKA AND THE SECURITIES AND EXCHANGE COMMISSION OF SRI LANKASECTION 01: THE COMPANY
Principal Description Comment Extent of Compliance
A Directors
A.1 The Board
A.1 Every public company should be headed by an effective Board, which should direct, lead and control the Company.
The Company is headed by a Unitary Board comprising of ten members. The primary objective of the Board is to provide necessary stewardship, strategic direction, a policy framework and a governance structure in order to achieve the Vision of the Company. The Board regularly monitors the performance of the Company against goals and targets set on a periodic basis and discusses the same at Board meetings in great detail. Composition of the Board is as follows:
20%
30%
50%
Executive Directors
Independent Non-Executive Directors
Non-Executive Directors
All Executive Directors are a part of the Company’s Corporate Management Team. The Board consists of professionals from diverse f ields such as Engineering, Accounting, Finance, Business Development, Human Resources and Consultancy, bringing independent judgment and perspectives for the eff icient functioning of the Board and discharge of duties. They also suff iciently represent professional, academic and entrepreneurial domains, all of which are necessary for the effective functioning of the Board. Additionally, all Members of the Board possess adequate levels of skills, competencies and knowledge in their respective f ields of specialization so as to provide overall strategic direction to the Company. The Board also sets the level of Risk Appetite of the Company.
There are four Subcommittees of the Board of which three are mandatory and one is voluntary. These Committees ensure the Company’s adherence to best practices of corporate governance in conducting business.
Complied
CORPORATE GOVERNANCE
PREAMBLE BUSINESS MODEL VALUE CREATION STEWARDSHIP FINANCIAL REPORTS ANNEXES
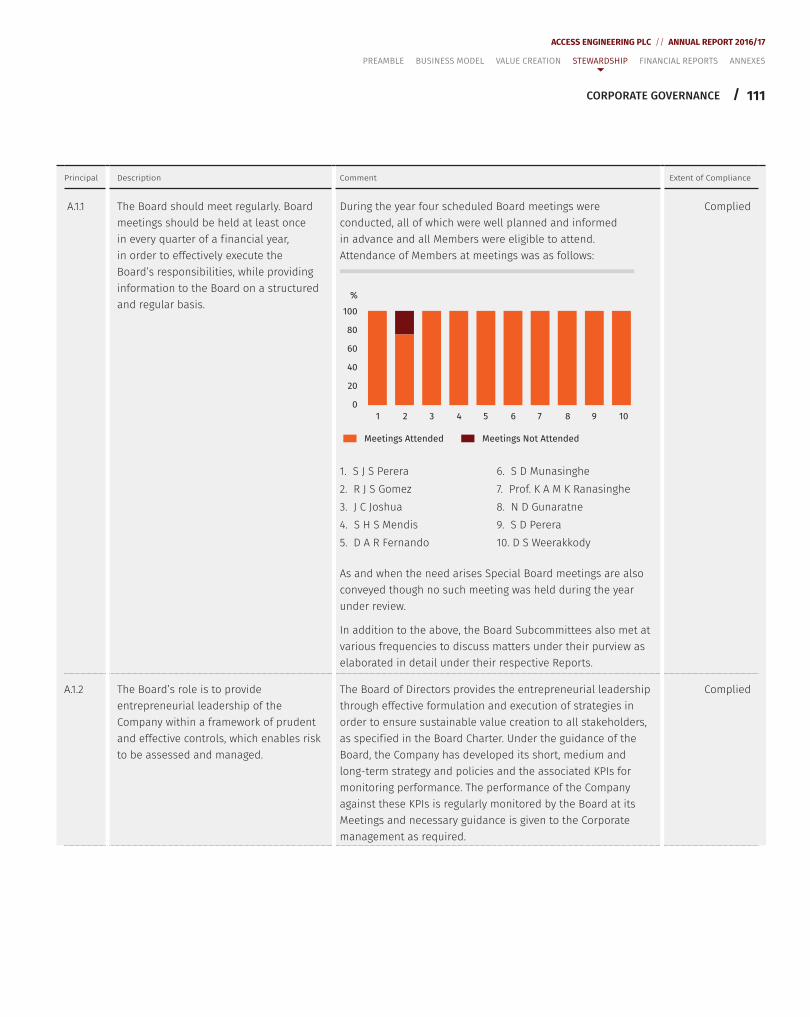
111
ACCESS ENGINEERING PLC // ANNUAL REPORT 2016/17
/
Principal Description Comment Extent of Compliance
A.1.1 The Board should meet regularly. Board meetings should be held at least once in every quarter of a f inancial year, in order to effectively execute the Board’s responsibilities, while providing information to the Board on a structured and regular basis.
During the year four scheduled Board meetings were conducted, all of which were well planned and informed in advance and all Members were eligible to attend. Attendance of Members at meetings was as follows:
%
100
80
60
40
20
0
1 2 3 4 5 6 7 8 9 10
Meetings Attended Meetings Not Attended
1. S J S Perera 6. S D Munasinghe2. R J S Gomez 7. Prof. K A M K Ranasinghe3. J C Joshua 8. N D Gunaratne4. S H S Mendis 9. S D Perera5. D A R Fernando 10. D S Weerakkody
As and when the need arises Special Board meetings are also conveyed though no such meeting was held during the year under review.
In addition to the above, the Board Subcommittees also met at various frequencies to discuss matters under their purview as elaborated in detail under their respective Reports.
Complied
A.1.2 The Board’s role is to provide entrepreneurial leadership of the Company within a framework of prudent and effective controls, which enables risk to be assessed and managed.
The Board of Directors provides the entrepreneurial leadership through effective formulation and execution of strategies in order to ensure sustainable value creation to all stakeholders, as specif ied in the Board Charter. Under the guidance of the Board, the Company has developed its short, medium and long-term strategy and policies and the associated KPIs for monitoring performance. The performance of the Company against these KPIs is regularly monitored by the Board at its Meetings and necessary guidance is given to the Corporate management as required.
Complied
CORPORATE GOVERNANCE
PREAMBLE BUSINESS MODEL VALUE CREATION STEWARDSHIP FINANCIAL REPORTS ANNEXES
112 /
ACCESS ENGINEERING PLC // ANNUAL REPORT 2016/17
Principal Description Comment Extent of Compliance
The Managing Director, Chief Operating Off icer and the Corporate Management possess skills, experience and knowledge necessary for the effective implementation of strategy formulated and ratif ied. The Corporate Management team, which is collectively responsible for the execution of strategies set by the Board, is directly headed by the Managing Director and the Chief Operating Off icer. A brief prof ile of each member of the Corporate Management team is given on pages 97 to 99.
The system of internal controls, which is based on a ‘Risk Assessment Approach’ ensures safety, reliability, prof itability and integrity of the organization within a broader framework of enterprise risk management. The Board is responsible for the eff icient functioning of the system as the level of risk appetite of the Company is set by the Board.
The Board is also responsible for the preparation of Financial Statements of the Company to reflect a true and fair view of the state of affairs, establishment of an adequate corporate governance framework and the appointment of the External Auditor.
A.1.3 The Board collectively, and Directors individually, must act in accordance with the Laws of the Country, as applicable to the business enterprise. There should be a procedure agreed to by the Board of Directors, to obtain independent professional advice where necessary, at the Company’s expense.
The Board collectively and the Directors individually, have recognized their duty to act in accordance with the prevailing Laws of the Country. The Board has put in place the Compliance Committee, which is headed by the Chief Operating Off icer to ensure compliance with all necessary rules and regulations applicable to the Company.
The Board also complies with the sound framework of business practices in place, which further strengthens compliance with existing laws and regulations. In matters of strategic importance to the company, the Board obtains independent professional advice, if it deems necessary, at the expense of the Company.
Complied
A.1.4 All Directors should have access to the advice and services of the Company Secretary, who is responsible to the Board in ensuring that Board procedures are followed and that applicable rules and regulations are complied with. Any questions of the removal of the Company Secretary should be a matter for the Board as a whole.
All Directors had access to the services of a professional Company secretarial body, which ensured that the Board received information on a timely manner for the effective conduct of meetings. The f irm also provided the Board with advice on matters relating to compliance with rules and regulations, proper conduct of meetings and the adoption of best practices of corporate governance. The f irm is also responsible for the distribution of the Company’s Annual Report to its shareholders.
Complied
CORPORATE GOVERNANCE
PREAMBLE BUSINESS MODEL VALUE CREATION STEWARDSHIP FINANCIAL REPORTS ANNEXES
113
ACCESS ENGINEERING PLC // ANNUAL REPORT 2016/17
/
Principal Description Comment Extent of Compliance
A.1.5 All Directors should bring independent judgment to bear on issues of strategy, performance, resources (including key appointments) and standards of business conduct.
All Directors are encouraged to bring independent judgment on matters relating to strategic direction of the Company, effective utilization of resources, performance and business conduct. The vast experience and knowledge they possess in their specialized f ields ensure the execution of this judgment.
Transparency of the judgments is further enhanced with the existence of three Independent Non-Executive Directors who continue to critically evaluate the decisions of the Executive Directors. The Board has put in place a culture of accepting the contribution of each member and all Directors have an equal opportunity to express their views and ideas. The composition of the Board is suff icient enough to ensure balance of power and no Director dominates the conduct of meetings or the Board’s decision-making process.
Complied
A.1.6 Every Director should dedicate adequate time and effort to matters of the Board and the Company, to ensure that the duties and responsibilities owed to the Company are satisfactorily discharged. It must be recognized that Directors have to dedicate suff icient time before a meeting to review Board papers and call for additional information and clarif ication, and after a meeting to follow up on issues consequent to the meeting. This should be supplemented by a time allocation for familiarization with business changes, operations, risks and controls.
All Directors dedicated an adequate amount of time on matters relating to the Company and the Board. Their contribution to the Company was evident in the participation at Board meetings, Board Subcommittee meetings and in the decisions passed through circular resolution. Relevant Board Papers, together with supplementary information, were sent at least a week prior to the Board meetings so as to give them adequate time to critically review and study the contents. In the event additional information was requested by the Board through the Company Secretary the same was made available at the earliest in order to enhance the effectiveness of Board decisions.
Complied
A.1.7 Every Director should receive appropriate training when f irst appointed to the Board of a company, and subsequently as necessary. Training curricula should encompass both general aspects of directorship and matters specif ic to the particular industry/company concerned. A Director must recognize that there is a need for continuous training and an expansion of the knowledge and skills required to effectively perform his duties as a Director. The Board should regularly review and agree the training and development needs of the Directors.
A new Director who is appointed to the Board receives an orientation on the operations, risk management, internal control and other areas from the Managing Director in order to familiarize the new Director with the Company.
Majority of the Independent Non-Executive Directors are members of the Sri Lanka Institute of Directors. Each Director was well aware of the need to continuously enhance his knowledge and skills so as to effectively perform his duties as a Director. Knowledge sharing among members, attending seminars organized by relevant professional bodies, participating in industry advancement sessions and policy making initiatives are some of the methods adopted during the year with respect to training and development.
Complied
CORPORATE GOVERNANCE
PREAMBLE BUSINESS MODEL VALUE CREATION STEWARDSHIP FINANCIAL REPORTS ANNEXES
114 /
ACCESS ENGINEERING PLC // ANNUAL REPORT 2016/17
Principal Description Comment Extent of Compliance
A.2 Chairman and Chief Executive Off icer (CEO)
A.2 There are two key tasks at the top of every public company – conducting of the business of the Board, and facilitating executive responsibility for management of the Company’s business. There should be a clear division of responsibilities at the head of the Company, which will ensure a balance of power and authority, such that no one individual has unfettered powers of decision.
The Chairman is responsible for the effective conduct of the business of the Board, while the executive responsibility for management of the Company’s business is vested with the Managing Director. Hence there is a balance of power and authority. The Managing Director is supported by the Director/Chief Operating Off icer in managing the day-to-day affairs of the Company.
Decision-making at the highest level happens by adopting the rule of simple majority. No one individual is vested with unfettered powers of decision-making.
Complied
A.2.1 A decision to combine the posts of Chairman and CEO in one person should be justif ied and highlighted in the Annual Report.
The Chairman is mainly responsible for leading, directing and controlling the affairs of the Board including the Board Balance, effective conduct of Board meetings and Special meetings of the Board. He is also responsible for maintaining effective external relationships.
Day-to-day affairs of the Company are headed by the Managing Director who is supported by the Director/Chief Operating Off icer (COO). The MD and COO give leadership to the Corporate Management team who is collectively responsible for the conduct of day-to-day operations.
Complied
A.3 Chairman’s Role
A.3 The Chairman’s role in preserving good Corporate Governance is crucial. As the person responsible for running the Board, the Chairman should preserve order and facilitate the effective discharge of Board functions.
As the highest member of the organization, the Chairman is committed to the practice of good corporate governance. As the head at the Board meetings, the Chairman ensures that the Board members receive adequate information prior to every meeting together with the agenda to enable them to take accurate decisions about the Company, facilitates discussions at the meetings to include the views of all Members, encourages participation of all members in the decision-making process and ensures accurate recording of proceedings via minutes through the Company Secretary. He is responsible for ensuring that the objectives of the meeting are achieved and adequately discussed among its members.
The Chairman is also responsible for the composition and the structure of the Board, representing the views of the Company to the public, maintaining relationships with shareholders and overseeing the self-evaluation of Board members performance.
Complied
CORPORATE GOVERNANCE
PREAMBLE BUSINESS MODEL VALUE CREATION STEWARDSHIP FINANCIAL REPORTS ANNEXES
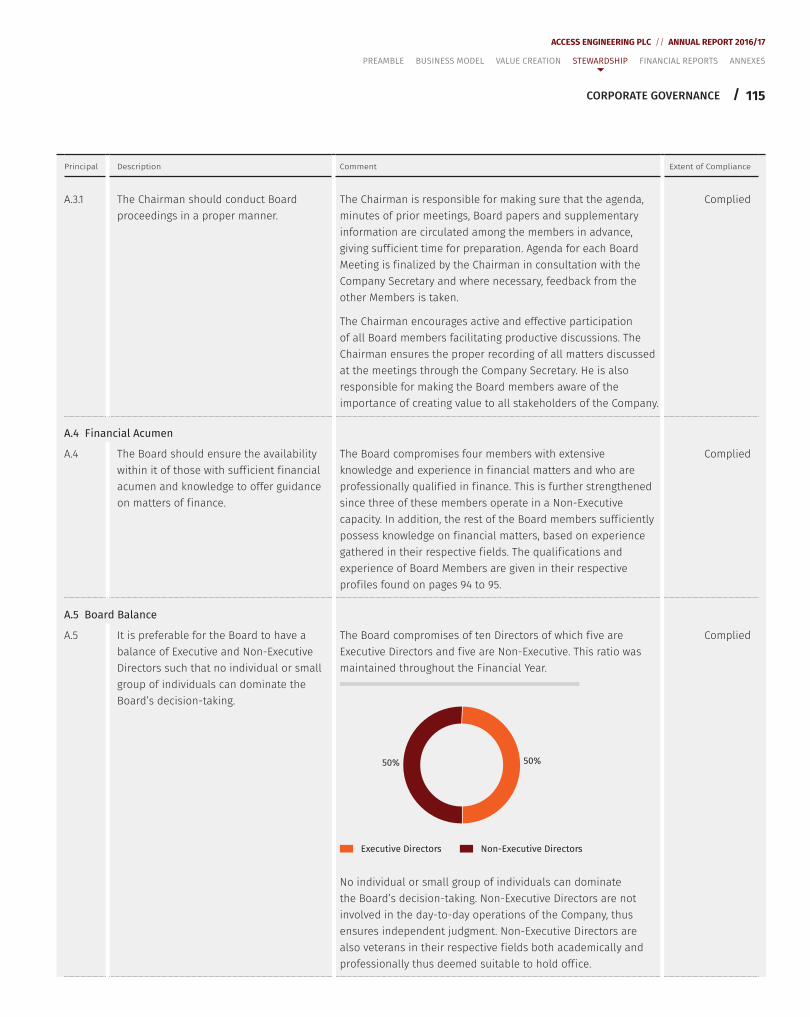
115
ACCESS ENGINEERING PLC // ANNUAL REPORT 2016/17
/
Principal Description Comment Extent of Compliance
A.3.1 The Chairman should conduct Board proceedings in a proper manner.
The Chairman is responsible for making sure that the agenda, minutes of prior meetings, Board papers and supplementary information are circulated among the members in advance, giving suff icient time for preparation. Agenda for each Board Meeting is f inalized by the Chairman in consultation with the Company Secretary and where necessary, feedback from the other Members is taken.
The Chairman encourages active and effective participation of all Board members facilitating productive discussions. The Chairman ensures the proper recording of all matters discussed at the meetings through the Company Secretary. He is also responsible for making the Board members aware of the importance of creating value to all stakeholders of the Company.
Complied
A.4 Financial Acumen
A.4 The Board should ensure the availability within it of those with suff icient f inancial acumen and knowledge to offer guidance on matters of f inance.
The Board compromises four members with extensive knowledge and experience in f inancial matters and who are professionally qualif ied in f inance. This is further strengthened since three of these members operate in a Non-Executive capacity. In addition, the rest of the Board members suff iciently possess knowledge on f inancial matters, based on experience gathered in their respective f ields. The qualif ications and experience of Board Members are given in their respective prof iles found on pages 94 to 95.
Complied
A.5 Board Balance
A.5 It is preferable for the Board to have a balance of Executive and Non-Executive Directors such that no individual or small group of individuals can dominate the Board’s decision-taking.
The Board compromises of ten Directors of which f ive are Executive Directors and f ive are Non-Executive. This ratio was maintained throughout the Financial Year.
50% 50%
Executive Directors Non-Executive Directors
No individual or small group of individuals can dominate the Board’s decision-taking. Non-Executive Directors are not involved in the day-to-day operations of the Company, thus ensures independent judgment. Non-Executive Directors are also veterans in their respective f ields both academically and professionally thus deemed suitable to hold off ice.
Complied
CORPORATE GOVERNANCE
PREAMBLE BUSINESS MODEL VALUE CREATION STEWARDSHIP FINANCIAL REPORTS ANNEXES
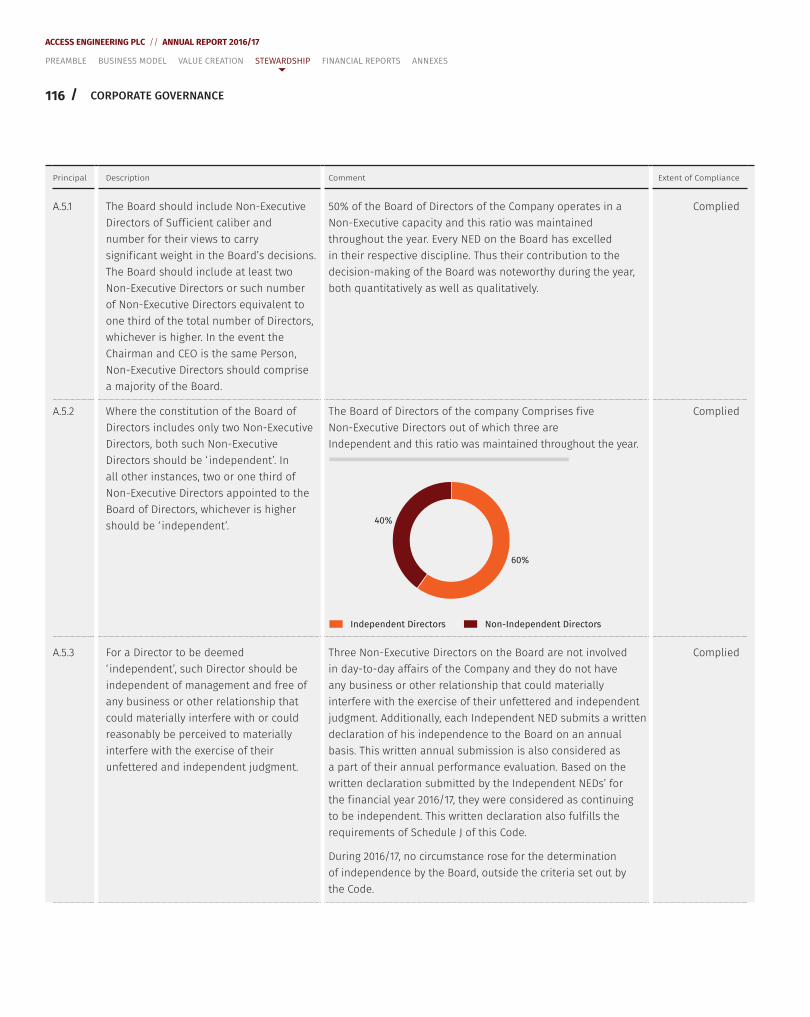
116 /
ACCESS ENGINEERING PLC // ANNUAL REPORT 2016/17
Principal Description Comment Extent of Compliance
A.5.1 The Board should include Non-Executive Directors of Suff icient caliber and number for their views to carry signif icant weight in the Board’s decisions. The Board should include at least two Non-Executive Directors or such number of Non-Executive Directors equivalent to one third of the total number of Directors, whichever is higher. In the event the Chairman and CEO is the same Person, Non-Executive Directors should comprise a majority of the Board.
50% of the Board of Directors of the Company operates in a Non-Executive capacity and this ratio was maintained throughout the year. Every NED on the Board has excelled in their respective discipline. Thus their contribution to the decision-making of the Board was noteworthy during the year, both quantitatively as well as qualitatively.
Complied
A.5.2 Where the constitution of the Board of Directors includes only two Non-Executive Directors, both such Non-Executive Directors should be ‘ independent’. In all other instances, two or one third of Non-Executive Directors appointed to the Board of Directors, whichever is higher should be ‘ independent’.
The Board of Directors of the company Comprises f ive Non-Executive Directors out of which three are Independent and this ratio was maintained throughout the year.
40%
60%
Independent Directors Non-Independent Directors
Complied
A.5.3 For a Director to be deemed ‘ independent’, such Director should be independent of management and free of any business or other relationship that could materially interfere with or could reasonably be perceived to materially interfere with the exercise of their unfettered and independent judgment.
Three Non-Executive Directors on the Board are not involved in day-to-day affairs of the Company and they do not have any business or other relationship that could materially interfere with the exercise of their unfettered and independent judgment. Additionally, each Independent NED submits a written declaration of his independence to the Board on an annual basis. This written annual submission is also considered as a part of their annual performance evaluation. Based on the written declaration submitted by the Independent NEDs’ for the f inancial year 2016/17, they were considered as continuing to be independent. This written declaration also fulf ills the requirements of Schedule J of this Code.
During 2016/17, no circumstance rose for the determination of independence by the Board, outside the criteria set out by the Code.
Complied
CORPORATE GOVERNANCE
PREAMBLE BUSINESS MODEL VALUE CREATION STEWARDSHIP FINANCIAL REPORTS ANNEXES
117
ACCESS ENGINEERING PLC // ANNUAL REPORT 2016/17
/
Principal Description Comment Extent of Compliance
A.5.4 Each Non-Executive Director should submit a signed and dated declaration annually of his/her independence or non-independence against the specif ied criteria set out in the Specimen in Schedule H.
During the year, each Non-Executive Director submitted a dated and signed declaration regarding their independence against the specif ied criteria set out in the Code. While this declaration fulf illed the requirements of Schedule J of this Code, no circumstance rose for the determination of independence by the Board outside the criteria set out by the Code.
Complied
A.5.5 The Board should make a determination annually as to the independence or non-independence of each Non-Executive Director, based on such a declaration made of decided criteria and other information available to the Board. The Board should determine whether the Director is independent in character and judgment and whether there are relationships or circumstances which are likely to affect, or could appear to affect, the Director’s judgment. The Board should specify the criteria not met and the basis for its determination in the Annual Report, if it determines that a Director is independent notwithstanding the existence of relationships or circumstances which indicate the contrary and should set out in the Annual Report the names of Directors determined to be ‘ independent’.
Based on the declarations submitted to the Board and other information available, the following NEDs’ of the Board were decided to be independent as at the end of the Financial Year.
y D S Weerakkody
y Prof. K A M K Ranasinghe
y N D Gunaratne
The Board considered the annual declaration made by the NEDs’ to be a fair representation of their independence.
Complied
A.5.6 If an alternate Director is appointed by a Non-Executive Director such Alternate Director should not be an executive of the Company. If an Alternate Director is appointed by an independent Director, the person who is appointed also should meet the criteria of independence and the provision on minimum number of independent Directors also should be satisf ied.
This is not applicable as there are no Alternate Directors in the Company.
Not Applicable
A.5.7 In the event the Chairman and CEO is the same person, the Board should appoint one of the Independent Non-Executive Directors to be the ‘Senior Independent Director’ (SID) and disclose this appointment in the Annual Report.
This is not applicable as the Chairman of the Company is not the CEO.
Not Applicable
CORPORATE GOVERNANCE
PREAMBLE BUSINESS MODEL VALUE CREATION STEWARDSHIP FINANCIAL REPORTS ANNEXES
118 /
ACCESS ENGINEERING PLC // ANNUAL REPORT 2016/17
Principal Description Comment Extent of Compliance
A.5.8 The Senior Independent Director should make himself available for conf idential discussions with other Directors who may have concerns which they believe have not been properly considered by the Board as a whole and which pertain to signif icant issues that are detrimental to the Company.
Please refer comment under A.5.7. Not Applicable
A.5.9 The Chairman should hold meetings with the Non-Executive Directors only, without the Executive Directors being present, as necessary and at least once each year.
The Chairman holds meetings with the NEDs’ without the presence of Executive Directors as and when necessary. During the year one such meeting was held.
Complied
A.5.10 Where Directors have concerns about the matters of the Company, which cannot be unanimously resolved, they should ensure their concerns are recorded in the Board Minutes.
During the year, there were no matters of the Company that the Board was unable to resolve unanimously. However, in the event such matter arises, the Company Secretary records same in suff icient detail in the Board minutes. These minutes are circulated among Board members prior to the next meeting.
Proceedings of all Board Meetings are recorded in detail and if required, the members have access to past Board Papers and minutes on request.
Complied
A.6 Supply of Information
A.6 The Board should be provided with timely information in a form and of a quality appropriate to enable it to discharge its duties.
The Board was provided with timely information by way of Management Reports, Proposals and Board Papers during the year. The information was made available by the Company Secretary along with the agenda at least seven days prior to the meeting in order to provide suff icient, time for preparation. In the event, information provided was not suff icient supplementary information was provided on the request of Board Members.
Complied
CORPORATE GOVERNANCE
PREAMBLE BUSINESS MODEL VALUE CREATION STEWARDSHIP FINANCIAL REPORTS ANNEXES
119
ACCESS ENGINEERING PLC // ANNUAL REPORT 2016/17
/
Principal Description Comment Extent of Compliance
A.6.1 Management has an obligation to provide the Board with appropriate and timely information, but information volunteered by management may not be enough in all circumstances and Directors should make further inquiries where necessary. The Chairman should ensure all Directors are properly briefed on issues arising at Board meetings.
Members of the Board (mainly Executive) are provided with Management Reports, Proposals and Project Performance Reports on a monthly basis, both in a quantitative and qualitative manner. In addition to this, the entire Board is provided with Board Papers and other relevant information by the Corporate Management. The Board is also appraised on areas such as CSR, Risk Management, Corporate Governance, Human Resources and Legal Compliance by the Corporate Management time to time. In instances where additional information is required the same is requested, from the Corporate Management or the responsible individuals. As and when necessary, the Corporate Management also makes presentations to the Board in order to enable sound decision-making.
The Board has free and open access to all Corporate Management members. The Chairman ensured that all Board Members were briefed suff iciently on any matter/s arising from the meeting/s. Any Director who was unable to attend a particular Board meeting is briefed on the proceedings before the next meeting by the Chairman and through the minutes of the meeting.
Complied
A.6.2 The minutes, agenda and papers required for a Board meeting should ordinarily be provided to Directors at least seven days before the meeting, to facilitate its effective conduct.
Effective conduct of the Board meetings was facilitated through the proper circulation of agenda, Board minutes and other papers among the Directors by the Company Secretary, seven days before the meeting.
Although there is a provision for the circulation of urgent Board Papers with short notice, such practice is discouraged and was not prevalent during the year 2016/17.
Complied
A.7 Appointments to the Board
A.7 There should be a formal and transparent procedure for the appointment of New Directors to the Board.
All Board appointments are based on the capacity of the individual concerned to pass the ‘f it and proper’ test, which in turn is based on the qualif ications, experience and the value that can be added by the individual to the Board as well as to the Company. Existing Directors are vested with the autonomy to critically evaluate the potential candidate in the above test and a f inal decision is taken by the Board collectively.
Complied
A.7.1 The Nomination Committee should be established to make recommendations to the Board on all new Board appointments. Terms of Reference for Nomination Committees are set out in Schedule A. The Chairman and members of the Nomination Committee should be identif ied in the Annual Report.
The Company does not have a Nomination Committee in place. However, the existing Board members function in a manner that is similar to a formally appointed Nomination Committee in matters concerning new appointments to the Board.
Not Complied
CORPORATE GOVERNANCE
PREAMBLE BUSINESS MODEL VALUE CREATION STEWARDSHIP FINANCIAL REPORTS ANNEXES
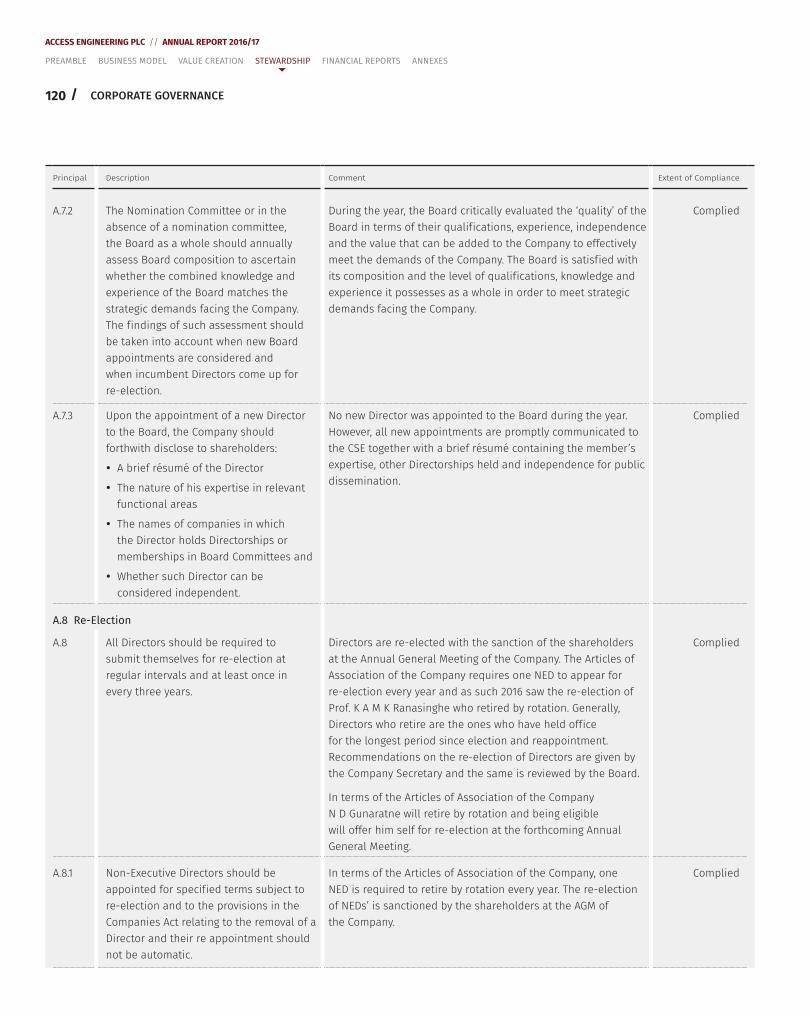
120 /
ACCESS ENGINEERING PLC // ANNUAL REPORT 2016/17
Principal Description Comment Extent of Compliance
A.7.2 The Nomination Committee or in the absence of a nomination committee, the Board as a whole should annually assess Board composition to ascertain whether the combined knowledge and experience of the Board matches the strategic demands facing the Company. The f indings of such assessment should be taken into account when new Board appointments are considered and when incumbent Directors come up for re-election.
During the year, the Board critically evaluated the ‘quality’ of the Board in terms of their qualif ications, experience, independence and the value that can be added to the Company to effectively meet the demands of the Company. The Board is satisf ied with its composition and the level of qualif ications, knowledge and experience it possesses as a whole in order to meet strategic demands facing the Company.
Complied
A.7.3 Upon the appointment of a new Director to the Board, the Company should forthwith disclose to shareholders:
y A brief résumé of the Director
y The nature of his expertise in relevant functional areas
y The names of companies in which the Director holds Directorships or memberships in Board Committees and
y Whether such Director can be considered independent.
No new Director was appointed to the Board during the year. However, all new appointments are promptly communicated to the CSE together with a brief résumé containing the member’s expertise, other Directorships held and independence for public dissemination.
Complied
A.8 Re-Election
A.8 All Directors should be required to submit themselves for re-election at regular intervals and at least once in every three years.
Directors are re-elected with the sanction of the shareholders at the Annual General Meeting of the Company. The Articles of Association of the Company requires one NED to appear for re-election every year and as such 2016 saw the re-election of Prof. K A M K Ranasinghe who retired by rotation. Generally, Directors who retire are the ones who have held off ice for the longest period since election and reappointment. Recommendations on the re-election of Directors are given by the Company Secretary and the same is reviewed by the Board.
In terms of the Articles of Association of the Company N D Gunaratne will retire by rotation and being eligible will offer him self for re-election at the forthcoming Annual General Meeting.
Complied
A.8.1 Non-Executive Directors should be appointed for specif ied terms subject to re-election and to the provisions in the Companies Act relating to the removal of a Director and their re appointment should not be automatic.
In terms of the Articles of Association of the Company, one NED is required to retire by rotation every year. The re-election of NEDs’ is sanctioned by the shareholders at the AGM of the Company.
Complied
CORPORATE GOVERNANCE
PREAMBLE BUSINESS MODEL VALUE CREATION STEWARDSHIP FINANCIAL REPORTS ANNEXES
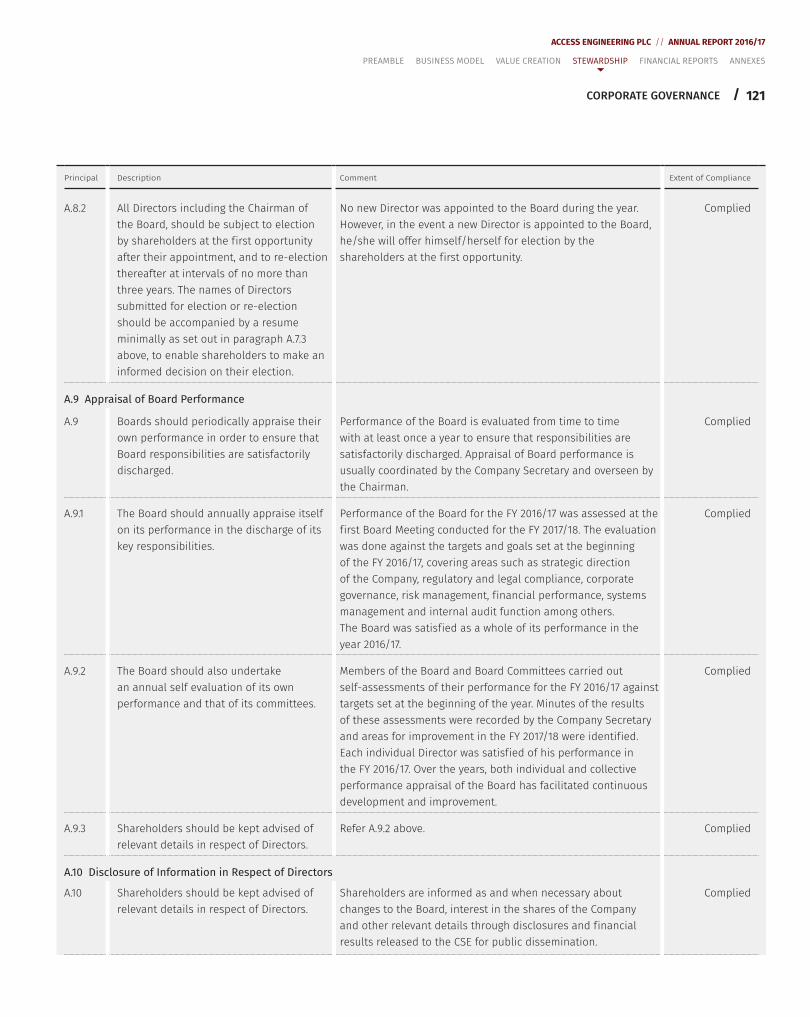
121
ACCESS ENGINEERING PLC // ANNUAL REPORT 2016/17
/
Principal Description Comment Extent of Compliance
A.8.2 All Directors including the Chairman of the Board, should be subject to election by shareholders at the f irst opportunity after their appointment, and to re-election thereafter at intervals of no more than three years. The names of Directors submitted for election or re-election should be accompanied by a resume minimally as set out in paragraph A.7.3 above, to enable shareholders to make an informed decision on their election.
No new Director was appointed to the Board during the year. However, in the event a new Director is appointed to the Board, he/she will offer himself/herself for election by the shareholders at the f irst opportunity.
Complied
A.9 Appraisal of Board Performance
A.9 Boards should periodically appraise their own performance in order to ensure that Board responsibilities are satisfactorily discharged.
Performance of the Board is evaluated from time to time with at least once a year to ensure that responsibilities are satisfactorily discharged. Appraisal of Board performance is usually coordinated by the Company Secretary and overseen by the Chairman.
Complied
A.9.1 The Board should annually appraise itself on its performance in the discharge of its key responsibilities.
Performance of the Board for the FY 2016/17 was assessed at the f irst Board Meeting conducted for the FY 2017/18. The evaluation was done against the targets and goals set at the beginning of the FY 2016/17, covering areas such as strategic direction of the Company, regulatory and legal compliance, corporate governance, risk management, f inancial performance, systems management and internal audit function among others. The Board was satisf ied as a whole of its performance in the year 2016/17.
Complied
A.9.2 The Board should also undertake an annual self evaluation of its own performance and that of its committees.
Members of the Board and Board Committees carried out self-assessments of their performance for the FY 2016/17 against targets set at the beginning of the year. Minutes of the results of these assessments were recorded by the Company Secretary and areas for improvement in the FY 2017/18 were identif ied. Each individual Director was satisf ied of his performance in the FY 2016/17. Over the years, both individual and collective performance appraisal of the Board has facilitated continuous development and improvement.
Complied
A.9.3 Shareholders should be kept advised of relevant details in respect of Directors.
Refer A.9.2 above. Complied
A.10 Disclosure of Information in Respect of Directors
A.10 Shareholders should be kept advised of relevant details in respect of Directors.
Shareholders are informed as and when necessary about changes to the Board, interest in the shares of the Company and other relevant details through disclosures and f inancial results released to the CSE for public dissemination.
Complied
CORPORATE GOVERNANCE
PREAMBLE BUSINESS MODEL VALUE CREATION STEWARDSHIP FINANCIAL REPORTS ANNEXES
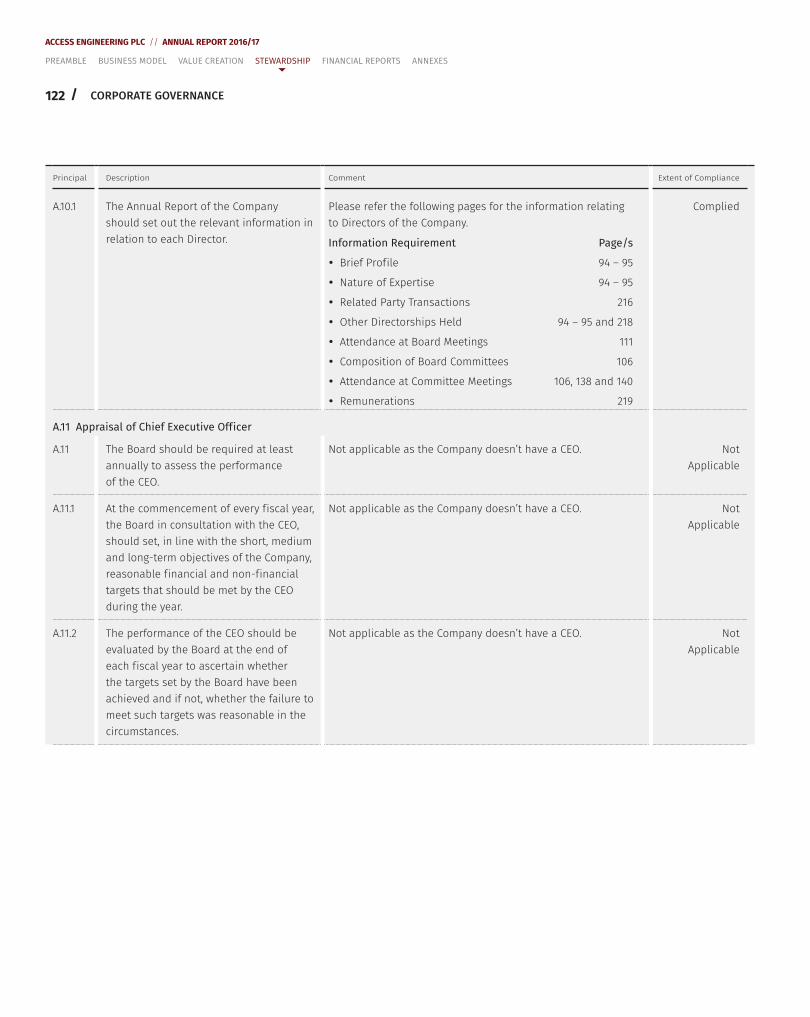
122 /
ACCESS ENGINEERING PLC // ANNUAL REPORT 2016/17
Principal Description Comment Extent of Compliance
A.10.1 The Annual Report of the Company should set out the relevant information in relation to each Director.
Please refer the following pages for the information relating to Directors of the Company.
Information Requirement Page/s
y Brief Prof ile 94 – 95
y Nature of Expertise 94 – 95
y Related Party Transactions 216
y Other Directorships Held 94 – 95 and 218
y Attendance at Board Meetings 111
y Composition of Board Committees 106
y Attendance at Committee Meetings 106, 138 and 140
y Remunerations 219
Complied
A.11 Appraisal of Chief Executive Off icer
A.11 The Board should be required at least annually to assess the performance of the CEO.
Not applicable as the Company doesn’t have a CEO. NotApplicable
A.11.1 At the commencement of every f iscal year, the Board in consultation with the CEO, should set, in line with the short, medium and long-term objectives of the Company, reasonable f inancial and non-f inancial targets that should be met by the CEO during the year.
Not applicable as the Company doesn’t have a CEO. NotApplicable
A.11.2 The performance of the CEO should be evaluated by the Board at the end of each f iscal year to ascertain whether the targets set by the Board have been achieved and if not, whether the failure to meet such targets was reasonable in the circumstances.
Not applicable as the Company doesn’t have a CEO. NotApplicable
CORPORATE GOVERNANCE
PREAMBLE BUSINESS MODEL VALUE CREATION STEWARDSHIP FINANCIAL REPORTS ANNEXES
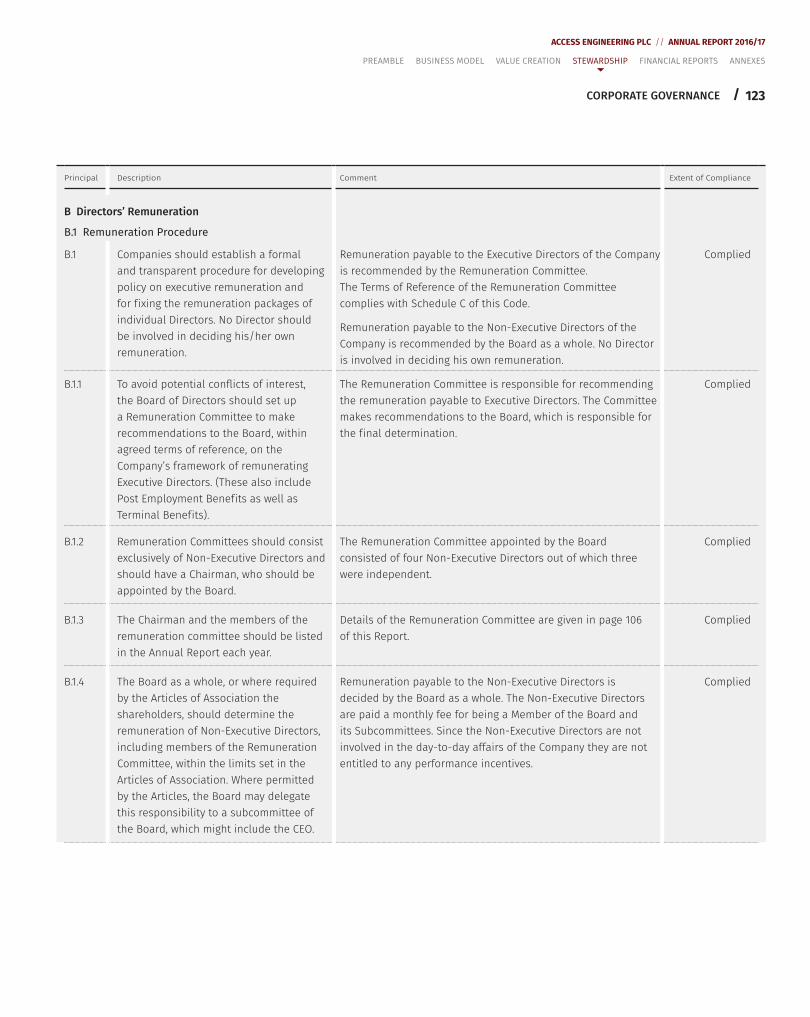
123
ACCESS ENGINEERING PLC // ANNUAL REPORT 2016/17
/
Principal Description Comment Extent of Compliance
B Directors’ Remuneration
B.1 Remuneration Procedure
B.1 Companies should establish a formal and transparent procedure for developing policy on executive remuneration and for f ixing the remuneration packages of individual Directors. No Director should be involved in deciding his/her own remuneration.
Remuneration payable to the Executive Directors of the Company is recommended by the Remuneration Committee. The Terms of Reference of the Remuneration Committee complies with Schedule C of this Code.
Remuneration payable to the Non-Executive Directors of the Company is recommended by the Board as a whole. No Director is involved in deciding his own remuneration.
Complied
B.1.1 To avoid potential conflicts of interest, the Board of Directors should set up a Remuneration Committee to make recommendations to the Board, within agreed terms of reference, on the Company’s framework of remunerating Executive Directors. (These also include Post Employment Benef its as well as Terminal Benef its).
The Remuneration Committee is responsible for recommending the remuneration payable to Executive Directors. The Committee makes recommendations to the Board, which is responsible for the f inal determination.
Complied
B.1.2 Remuneration Committees should consist exclusively of Non-Executive Directors and should have a Chairman, who should be appointed by the Board.
The Remuneration Committee appointed by the Board consisted of four Non-Executive Directors out of which three were independent.
Complied
B.1.3 The Chairman and the members of the remuneration committee should be listed in the Annual Report each year.
Details of the Remuneration Committee are given in page 106 of this Report.
Complied
B.1.4 The Board as a whole, or where required by the Articles of Association the shareholders, should determine the remuneration of Non-Executive Directors, including members of the Remuneration Committee, within the limits set in the Articles of Association. Where permitted by the Articles, the Board may delegate this responsibility to a subcommittee of the Board, which might include the CEO.
Remuneration payable to the Non-Executive Directors is decided by the Board as a whole. The Non-Executive Directors are paid a monthly fee for being a Member of the Board and its Subcommittees. Since the Non-Executive Directors are not involved in the day-to-day affairs of the Company they are not entitled to any performance incentives.
Complied
CORPORATE GOVERNANCE
PREAMBLE BUSINESS MODEL VALUE CREATION STEWARDSHIP FINANCIAL REPORTS ANNEXES
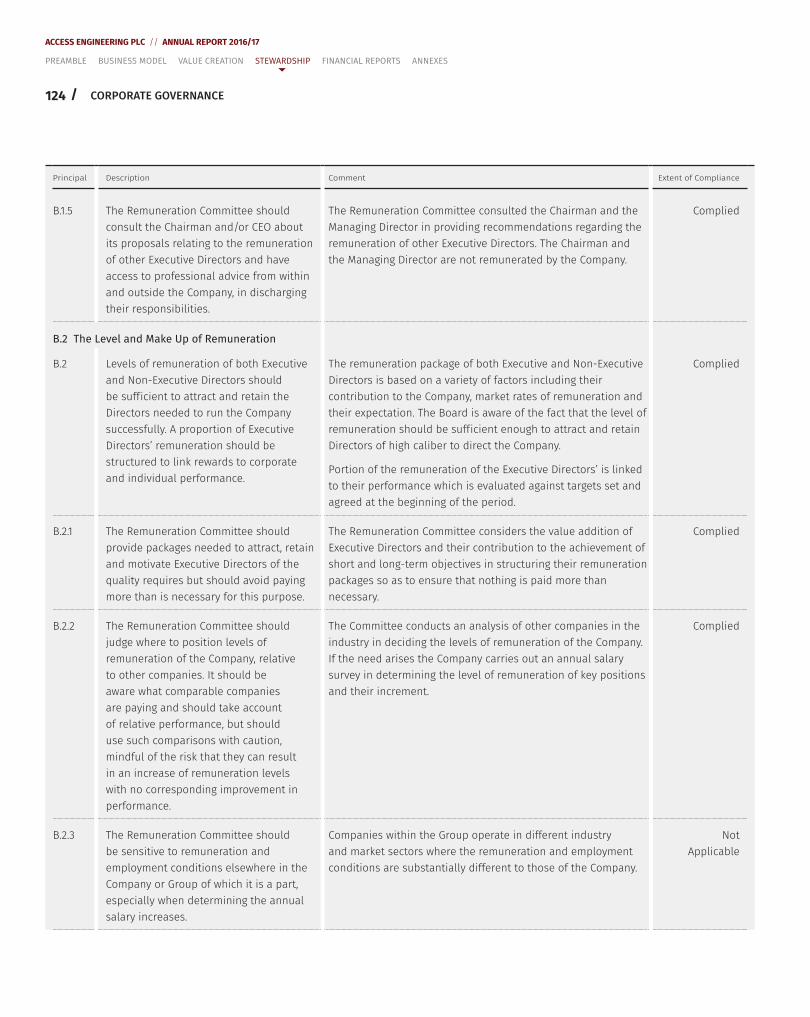
124 /
ACCESS ENGINEERING PLC // ANNUAL REPORT 2016/17
Principal Description Comment Extent of Compliance
B.1.5 The Remuneration Committee should consult the Chairman and/or CEO about its proposals relating to the remuneration of other Executive Directors and have access to professional advice from within and outside the Company, in discharging their responsibilities.
The Remuneration Committee consulted the Chairman and the Managing Director in providing recommendations regarding the remuneration of other Executive Directors. The Chairman and the Managing Director are not remunerated by the Company.
Complied
B.2 The Level and Make Up of Remuneration
B.2 Levels of remuneration of both Executive and Non-Executive Directors should be suff icient to attract and retain the Directors needed to run the Company successfully. A proportion of Executive Directors’ remuneration should be structured to link rewards to corporate and individual performance.
The remuneration package of both Executive and Non-Executive Directors is based on a variety of factors including their contribution to the Company, market rates of remuneration and their expectation. The Board is aware of the fact that the level of remuneration should be suff icient enough to attract and retain Directors of high caliber to direct the Company.
Portion of the remuneration of the Executive Directors’ is linked to their performance which is evaluated against targets set and agreed at the beginning of the period.
Complied
B.2.1 The Remuneration Committee should provide packages needed to attract, retain and motivate Executive Directors of the quality requires but should avoid paying more than is necessary for this purpose.
The Remuneration Committee considers the value addition of Executive Directors and their contribution to the achievement of short and long-term objectives in structuring their remuneration packages so as to ensure that nothing is paid more than necessary.
Complied
B.2.2 The Remuneration Committee should judge where to position levels of remuneration of the Company, relative to other companies. It should be aware what comparable companies are paying and should take account of relative performance, but should use such comparisons with caution, mindful of the risk that they can result in an increase of remuneration levels with no corresponding improvement in performance.
The Committee conducts an analysis of other companies in the industry in deciding the levels of remuneration of the Company. If the need arises the Company carries out an annual salary survey in determining the level of remuneration of key positions and their increment.
Complied
B.2.3 The Remuneration Committee should be sensitive to remuneration and employment conditions elsewhere in the Company or Group of which it is a part, especially when determining the annual salary increases.
Companies within the Group operate in different industry and market sectors where the remuneration and employment conditions are substantially different to those of the Company.
NotApplicable
CORPORATE GOVERNANCE
PREAMBLE BUSINESS MODEL VALUE CREATION STEWARDSHIP FINANCIAL REPORTS ANNEXES
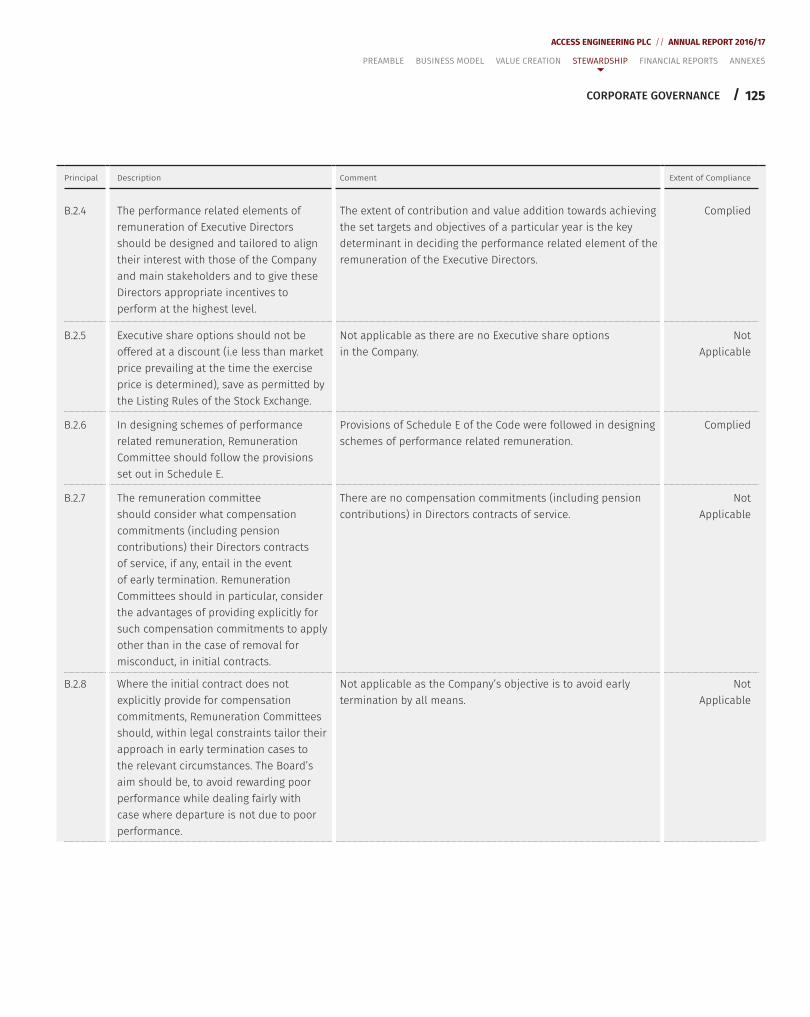
125
ACCESS ENGINEERING PLC // ANNUAL REPORT 2016/17
/
Principal Description Comment Extent of Compliance
B.2.4 The performance related elements of remuneration of Executive Directors should be designed and tailored to align their interest with those of the Company and main stakeholders and to give these Directors appropriate incentives to perform at the highest level.
The extent of contribution and value addition towards achieving the set targets and objectives of a particular year is the key determinant in deciding the performance related element of the remuneration of the Executive Directors.
Complied
B.2.5 Executive share options should not be offered at a discount (i.e less than market price prevailing at the time the exercise price is determined), save as permitted by the Listing Rules of the Stock Exchange.
Not applicable as there are no Executive share options in the Company.
NotApplicable
B.2.6 In designing schemes of performance related remuneration, Remuneration Committee should follow the provisions set out in Schedule E.
Provisions of Schedule E of the Code were followed in designing schemes of performance related remuneration.
Complied
B.2.7 The remuneration committee should consider what compensation commitments (including pension contributions) their Directors contracts of service, if any, entail in the event of early termination. Remuneration Committees should in particular, consider the advantages of providing explicitly for such compensation commitments to apply other than in the case of removal for misconduct, in initial contracts.
There are no compensation commitments (including pension contributions) in Directors contracts of service.
Not Applicable
B.2.8 Where the initial contract does not explicitly provide for compensation commitments, Remuneration Committees should, within legal constraints tailor their approach in early termination cases to the relevant circumstances. The Board’s aim should be, to avoid rewarding poor performance while dealing fairly with case where departure is not due to poor performance.
Not applicable as the Company’s objective is to avoid early termination by all means.
Not Applicable
CORPORATE GOVERNANCE
PREAMBLE BUSINESS MODEL VALUE CREATION STEWARDSHIP FINANCIAL REPORTS ANNEXES
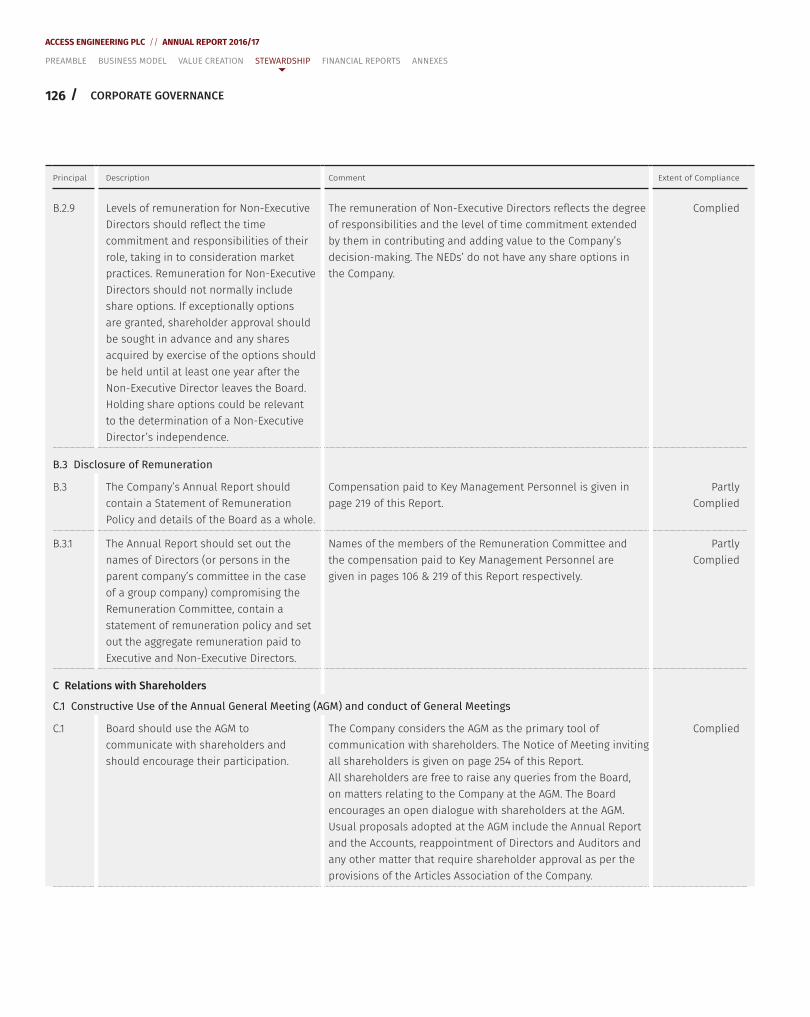
126 /
ACCESS ENGINEERING PLC // ANNUAL REPORT 2016/17
Principal Description Comment Extent of Compliance
B.2.9 Levels of remuneration for Non-Executive Directors should reflect the time commitment and responsibilities of their role, taking in to consideration market practices. Remuneration for Non-Executive Directors should not normally include share options. If exceptionally options are granted, shareholder approval should be sought in advance and any shares acquired by exercise of the options should be held until at least one year after the Non-Executive Director leaves the Board. Holding share options could be relevant to the determination of a Non-Executive Director’s independence.
The remuneration of Non-Executive Directors reflects the degree of responsibilities and the level of time commitment extended by them in contributing and adding value to the Company’s decision-making. The NEDs’ do not have any share options in the Company.
Complied
B.3 Disclosure of Remuneration
B.3 The Company’s Annual Report should contain a Statement of Remuneration Policy and details of the Board as a whole.
Compensation paid to Key Management Personnel is given in page 219 of this Report.
Partly Complied
B.3.1 The Annual Report should set out the names of Directors (or persons in the parent company’s committee in the case of a group company) compromising the Remuneration Committee, contain a statement of remuneration policy and set out the aggregate remuneration paid to Executive and Non-Executive Directors.
Names of the members of the Remuneration Committee and the compensation paid to Key Management Personnel are given in pages 106 & 219 of this Report respectively.
Partly Complied
C Relations with Shareholders
C.1 Constructive Use of the Annual General Meeting (AGM) and conduct of General Meetings
C.1 Board should use the AGM to communicate with shareholders and should encourage their participation.
The Company considers the AGM as the primary tool of communication with shareholders. The Notice of Meeting inviting all shareholders is given on page 254 of this Report. All shareholders are free to raise any queries from the Board, on matters relating to the Company at the AGM. The Board encourages an open dialogue with shareholders at the AGM. Usual proposals adopted at the AGM include the Annual Report and the Accounts, reappointment of Directors and Auditors and any other matter that require shareholder approval as per the provisions of the Articles Association of the Company.
Complied
CORPORATE GOVERNANCE
PREAMBLE BUSINESS MODEL VALUE CREATION STEWARDSHIP FINANCIAL REPORTS ANNEXES
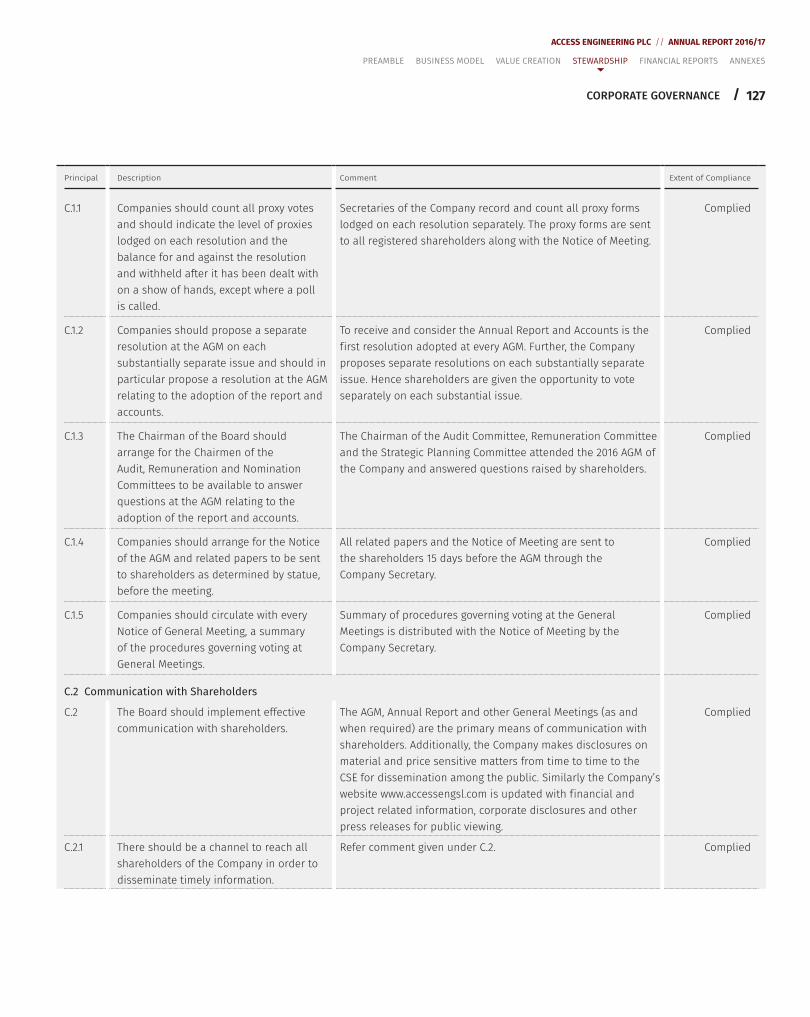
127
ACCESS ENGINEERING PLC // ANNUAL REPORT 2016/17
/
Principal Description Comment Extent of Compliance
C.1.1 Companies should count all proxy votes and should indicate the level of proxies lodged on each resolution and the balance for and against the resolution and withheld after it has been dealt with on a show of hands, except where a poll is called.
Secretaries of the Company record and count all proxy forms lodged on each resolution separately. The proxy forms are sent to all registered shareholders along with the Notice of Meeting.
Complied
C.1.2 Companies should propose a separate resolution at the AGM on each substantially separate issue and should in particular propose a resolution at the AGM relating to the adoption of the report and accounts.
To receive and consider the Annual Report and Accounts is the f irst resolution adopted at every AGM. Further, the Company proposes separate resolutions on each substantially separate issue. Hence shareholders are given the opportunity to vote separately on each substantial issue.
Complied
C.1.3 The Chairman of the Board should arrange for the Chairmen of the Audit, Remuneration and Nomination Committees to be available to answer questions at the AGM relating to the adoption of the report and accounts.
The Chairman of the Audit Committee, Remuneration Committee and the Strategic Planning Committee attended the 2016 AGM of the Company and answered questions raised by shareholders.
Complied
C.1.4 Companies should arrange for the Notice of the AGM and related papers to be sent to shareholders as determined by statue, before the meeting.
All related papers and the Notice of Meeting are sent to the shareholders 15 days before the AGM through the Company Secretary.
Complied
C.1.5 Companies should circulate with every Notice of General Meeting, a summary of the procedures governing voting at General Meetings.
Summary of procedures governing voting at the General Meetings is distributed with the Notice of Meeting by the Company Secretary.
Complied
C.2 Communication with Shareholders
C.2 The Board should implement effective communication with shareholders.
The AGM, Annual Report and other General Meetings (as and when required) are the primary means of communication with shareholders. Additionally, the Company makes disclosures on material and price sensitive matters from time to time to the CSE for dissemination among the public. Similarly the Company’s website www.accessengsl.com is updated with f inancial and project related information, corporate disclosures and other press releases for public viewing.
Complied
C.2.1 There should be a channel to reach all shareholders of the Company in order to disseminate timely information.
Refer comment given under C.2. Complied
CORPORATE GOVERNANCE
PREAMBLE BUSINESS MODEL VALUE CREATION STEWARDSHIP FINANCIAL REPORTS ANNEXES
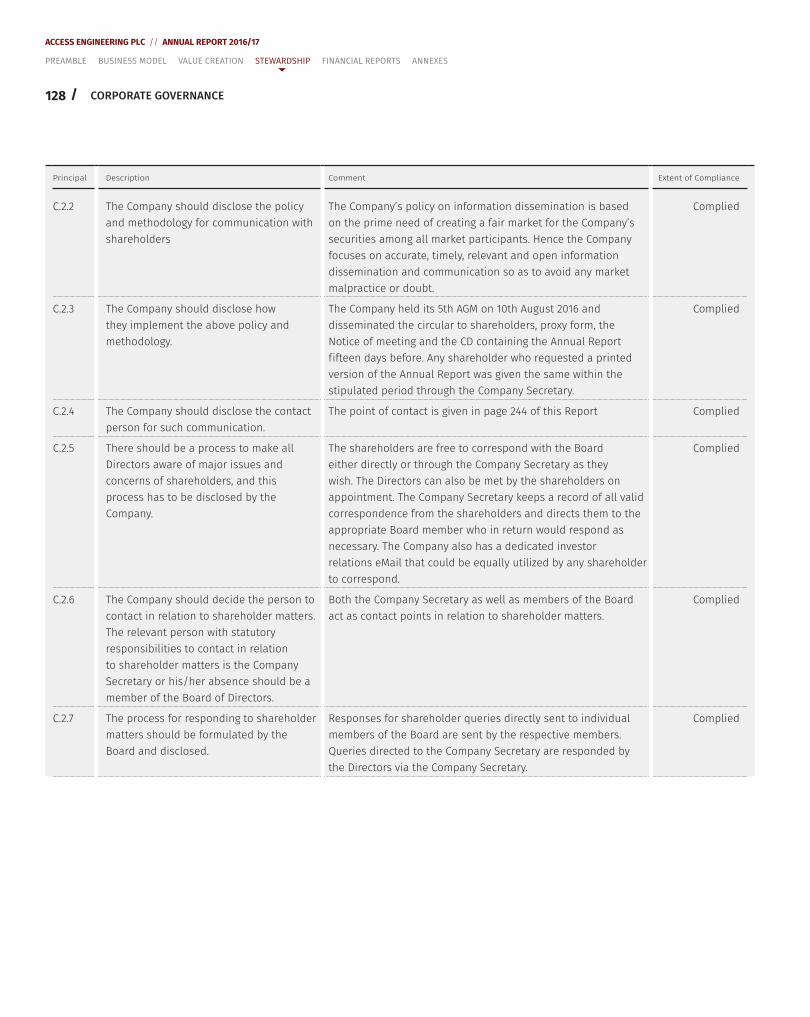
128 /
ACCESS ENGINEERING PLC // ANNUAL REPORT 2016/17
Principal Description Comment Extent of Compliance
C.2.2 The Company should disclose the policy and methodology for communication with shareholders
The Company’s policy on information dissemination is based on the prime need of creating a fair market for the Company’s securities among all market participants. Hence the Company focuses on accurate, timely, relevant and open information dissemination and communication so as to avoid any market malpractice or doubt.
Complied
C.2.3 The Company should disclose how they implement the above policy and methodology.
The Company held its 5th AGM on 10th August 2016 and disseminated the circular to shareholders, proxy form, the Notice of meeting and the CD containing the Annual Report f ifteen days before. Any shareholder who requested a printed version of the Annual Report was given the same within the stipulated period through the Company Secretary.
Complied
C.2.4 The Company should disclose the contact person for such communication.
The point of contact is given in page 244 of this Report Complied
C.2.5 There should be a process to make all Directors aware of major issues and concerns of shareholders, and this process has to be disclosed by the Company.
The shareholders are free to correspond with the Board either directly or through the Company Secretary as they wish. The Directors can also be met by the shareholders on appointment. The Company Secretary keeps a record of all valid correspondence from the shareholders and directs them to the appropriate Board member who in return would respond as necessary. The Company also has a dedicated investor relations eMail that could be equally utilized by any shareholder to correspond.
Complied
C.2.6 The Company should decide the person to contact in relation to shareholder matters. The relevant person with statutory responsibilities to contact in relation to shareholder matters is the Company Secretary or his/her absence should be a member of the Board of Directors.
Both the Company Secretary as well as members of the Board act as contact points in relation to shareholder matters.
Complied
C.2.7 The process for responding to shareholder matters should be formulated by the Board and disclosed.
Responses for shareholder queries directly sent to individual members of the Board are sent by the respective members. Queries directed to the Company Secretary are responded by the Directors via the Company Secretary.
Complied
CORPORATE GOVERNANCE
PREAMBLE BUSINESS MODEL VALUE CREATION STEWARDSHIP FINANCIAL REPORTS ANNEXES
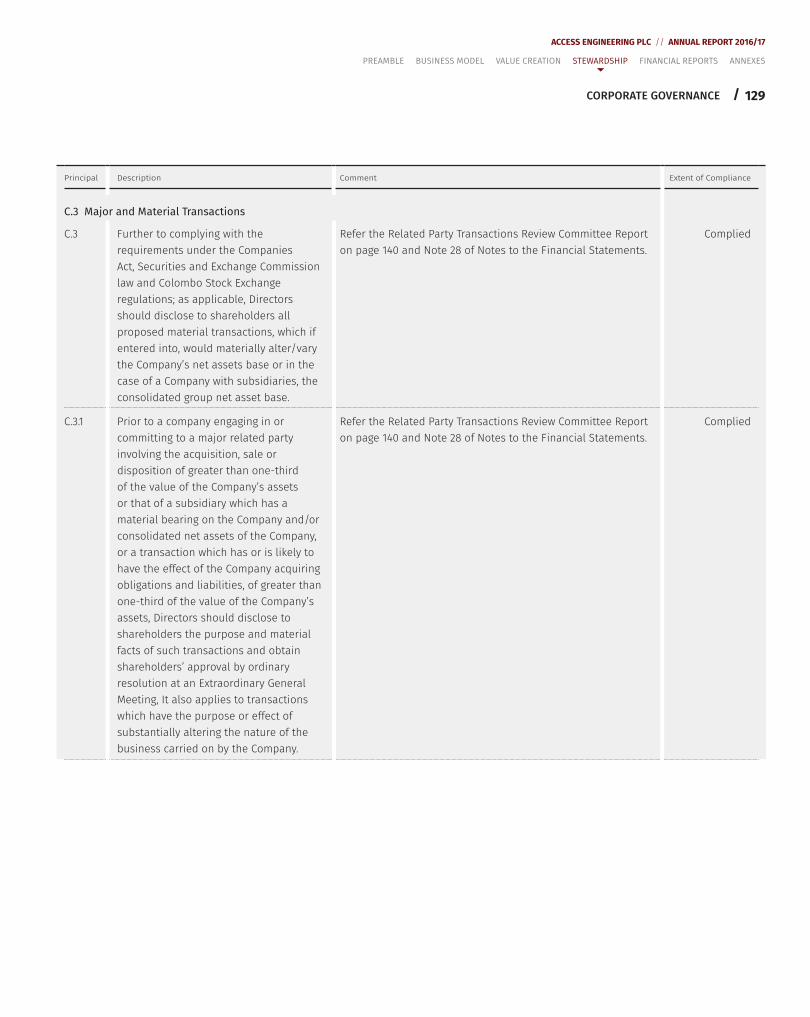
129
ACCESS ENGINEERING PLC // ANNUAL REPORT 2016/17
/
Principal Description Comment Extent of Compliance
C.3 Major and Material Transactions
C.3 Further to complying with the requirements under the Companies Act, Securities and Exchange Commission law and Colombo Stock Exchange regulations; as applicable, Directors should disclose to shareholders all proposed material transactions, which if entered into, would materially alter/vary the Company’s net assets base or in the case of a Company with subsidiaries, the consolidated group net asset base.
Refer the Related Party Transactions Review Committee Report on page 140 and Note 28 of Notes to the Financial Statements.
Complied
C.3.1 Prior to a company engaging in or committing to a major related party involving the acquisition, sale or disposition of greater than one-third of the value of the Company’s assets or that of a subsidiary which has a material bearing on the Company and/or consolidated net assets of the Company, or a transaction which has or is likely to have the effect of the Company acquiring obligations and liabilities, of greater than one-third of the value of the Company’s assets, Directors should disclose to shareholders the purpose and material facts of such transactions and obtain shareholders’ approval by ordinary resolution at an Extraordinary General Meeting, It also applies to transactions which have the purpose or effect of substantially altering the nature of the business carried on by the Company.
Refer the Related Party Transactions Review Committee Report on page 140 and Note 28 of Notes to the Financial Statements.
Complied
CORPORATE GOVERNANCE
PREAMBLE BUSINESS MODEL VALUE CREATION STEWARDSHIP FINANCIAL REPORTS ANNEXES
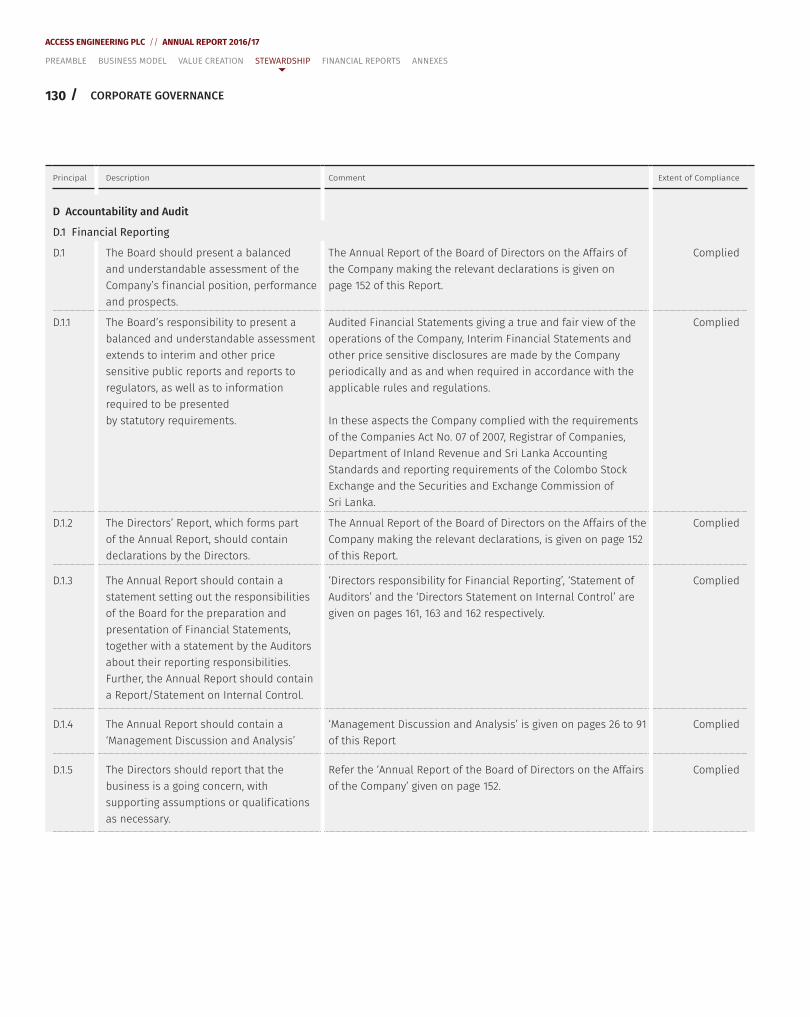
130 /
ACCESS ENGINEERING PLC // ANNUAL REPORT 2016/17
Principal Description Comment Extent of Compliance
D Accountability and Audit
D.1 Financial Reporting
D.1 The Board should present a balanced and understandable assessment of the Company’s f inancial position, performance and prospects.
The Annual Report of the Board of Directors on the Affairs of the Company making the relevant declarations is given on page 152 of this Report.
Complied
D.1.1 The Board’s responsibility to present a balanced and understandable assessment extends to interim and other price sensitive public reports and reports to regulators, as well as to information required to be presented by statutory requirements.
Audited Financial Statements giving a true and fair view of the operations of the Company, Interim Financial Statements and other price sensitive disclosures are made by the Company periodically and as and when required in accordance with the applicable rules and regulations.
In these aspects the Company complied with the requirements of the Companies Act No. 07 of 2007, Registrar of Companies, Department of Inland Revenue and Sri Lanka Accounting Standards and reporting requirements of the Colombo Stock Exchange and the Securities and Exchange Commission of Sri Lanka.
Complied
D.1.2 The Directors’ Report, which forms part of the Annual Report, should contain declarations by the Directors.
The Annual Report of the Board of Directors on the Affairs of the Company making the relevant declarations, is given on page 152 of this Report.
Complied
D.1.3 The Annual Report should contain a statement setting out the responsibilities of the Board for the preparation and presentation of Financial Statements, together with a statement by the Auditors about their reporting responsibilities. Further, the Annual Report should contain a Report/Statement on Internal Control.
‘Directors responsibility for Financial Reporting’, ‘Statement of Auditors’ and the ‘Directors Statement on Internal Control’ are given on pages 161, 163 and 162 respectively.
Complied
D.1.4 The Annual Report should contain a ‘Management Discussion and Analysis’
‘Management Discussion and Analysis’ is given on pages 26 to 91 of this Report
Complied
D.1.5 The Directors should report that the business is a going concern, with supporting assumptions or qualif ications as necessary.
Refer the ‘Annual Report of the Board of Directors on the Affairs of the Company’ given on page 152.
Complied
CORPORATE GOVERNANCE
PREAMBLE BUSINESS MODEL VALUE CREATION STEWARDSHIP FINANCIAL REPORTS ANNEXES
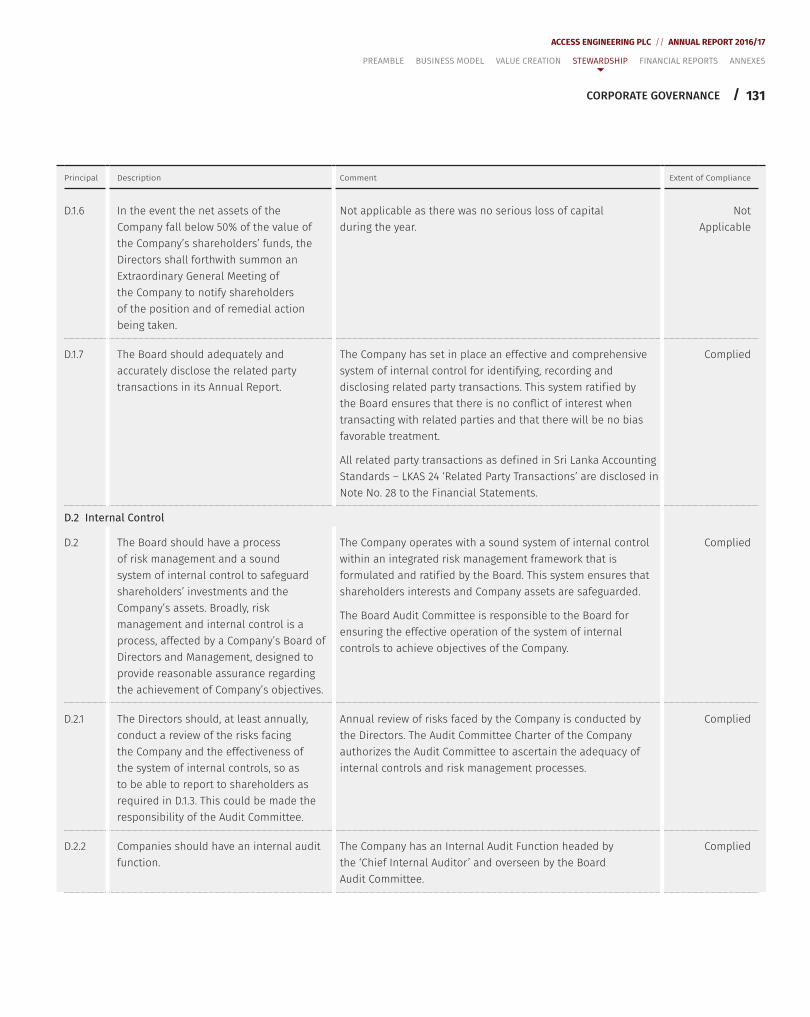
131
ACCESS ENGINEERING PLC // ANNUAL REPORT 2016/17
/
Principal Description Comment Extent of Compliance
D.1.6 In the event the net assets of the Company fall below 50% of the value of the Company’s shareholders’ funds, the Directors shall forthwith summon an Extraordinary General Meeting of the Company to notify shareholders of the position and of remedial action being taken.
Not applicable as there was no serious loss of capital during the year.
Not Applicable
D.1.7 The Board should adequately and accurately disclose the related party transactions in its Annual Report.
The Company has set in place an effective and comprehensive system of internal control for identifying, recording and disclosing related party transactions. This system ratif ied by the Board ensures that there is no conflict of interest when transacting with related parties and that there will be no bias favorable treatment.
All related party transactions as def ined in Sri Lanka Accounting Standards – LKAS 24 ‘Related Party Transactions’ are disclosed in Note No. 28 to the Financial Statements.
Complied
D.2 Internal Control
D.2 The Board should have a process of risk management and a sound system of internal control to safeguard shareholders’ investments and the Company’s assets. Broadly, risk management and internal control is a process, affected by a Company’s Board of Directors and Management, designed to provide reasonable assurance regarding the achievement of Company’s objectives.
The Company operates with a sound system of internal control within an integrated risk management framework that is formulated and ratif ied by the Board. This system ensures that shareholders interests and Company assets are safeguarded.
The Board Audit Committee is responsible to the Board for ensuring the effective operation of the system of internal controls to achieve objectives of the Company.
Complied
D.2.1 The Directors should, at least annually, conduct a review of the risks facing the Company and the effectiveness of the system of internal controls, so as to be able to report to shareholders as required in D.1.3. This could be made the responsibility of the Audit Committee.
Annual review of risks faced by the Company is conducted by the Directors. The Audit Committee Charter of the Company authorizes the Audit Committee to ascertain the adequacy of internal controls and risk management processes.
Complied
D.2.2 Companies should have an internal audit function.
The Company has an Internal Audit Function headed by the ‘Chief Internal Auditor’ and overseen by the Board Audit Committee.
Complied
CORPORATE GOVERNANCE
PREAMBLE BUSINESS MODEL VALUE CREATION STEWARDSHIP FINANCIAL REPORTS ANNEXES
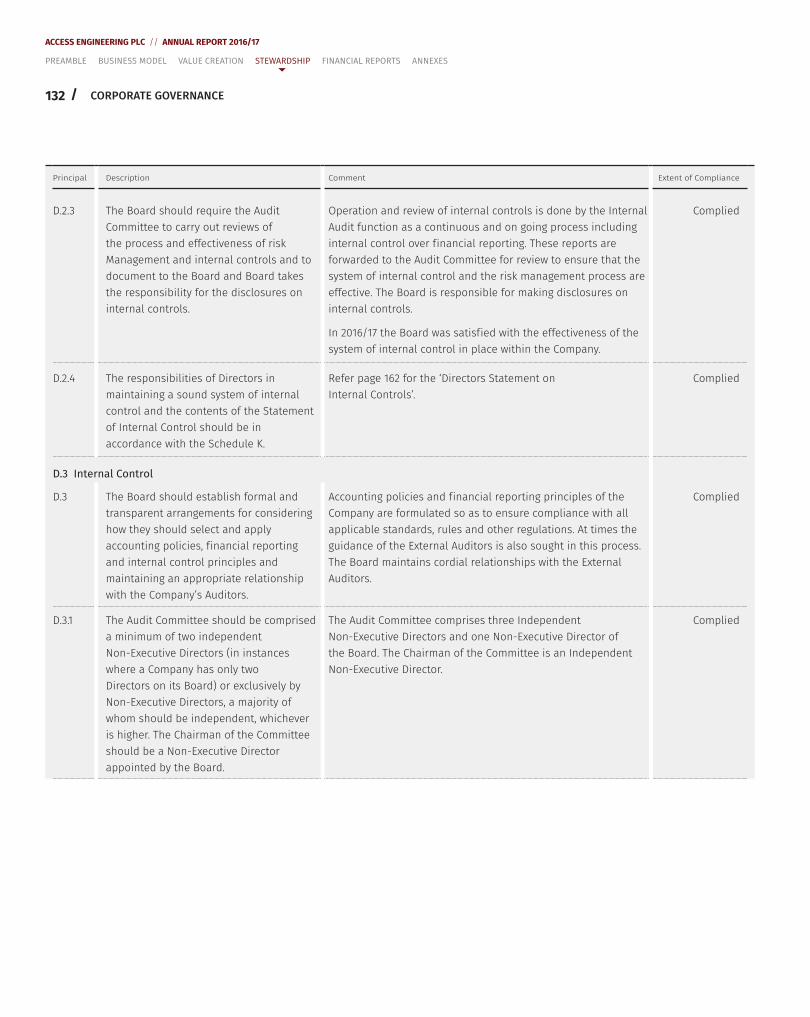
132 /
ACCESS ENGINEERING PLC // ANNUAL REPORT 2016/17
Principal Description Comment Extent of Compliance
D.2.3 The Board should require the Audit Committee to carry out reviews of the process and effectiveness of risk Management and internal controls and to document to the Board and Board takes the responsibility for the disclosures on internal controls.
Operation and review of internal controls is done by the Internal Audit function as a continuous and on going process including internal control over f inancial reporting. These reports are forwarded to the Audit Committee for review to ensure that the system of internal control and the risk management process are effective. The Board is responsible for making disclosures on internal controls.
In 2016/17 the Board was satisf ied with the effectiveness of the system of internal control in place within the Company.
Complied
D.2.4 The responsibilities of Directors in maintaining a sound system of internal control and the contents of the Statement of Internal Control should be in accordance with the Schedule K.
Refer page 162 for the ‘Directors Statement on Internal Controls’.
Complied
D.3 Internal Control
D.3 The Board should establish formal and transparent arrangements for considering how they should select and apply accounting policies, f inancial reporting and internal control principles and maintaining an appropriate relationship with the Company’s Auditors.
Accounting policies and f inancial reporting principles of the Company are formulated so as to ensure compliance with all applicable standards, rules and other regulations. At times the guidance of the External Auditors is also sought in this process. The Board maintains cordial relationships with the External Auditors.
Complied
D.3.1 The Audit Committee should be comprised a minimum of two independent Non-Executive Directors (in instances where a Company has only two Directors on its Board) or exclusively by Non-Executive Directors, a majority of whom should be independent, whichever is higher. The Chairman of the Committee should be a Non-Executive Director appointed by the Board.
The Audit Committee comprises three Independent Non-Executive Directors and one Non-Executive Director of the Board. The Chairman of the Committee is an Independent Non-Executive Director.
Complied
CORPORATE GOVERNANCE
PREAMBLE BUSINESS MODEL VALUE CREATION STEWARDSHIP FINANCIAL REPORTS ANNEXES
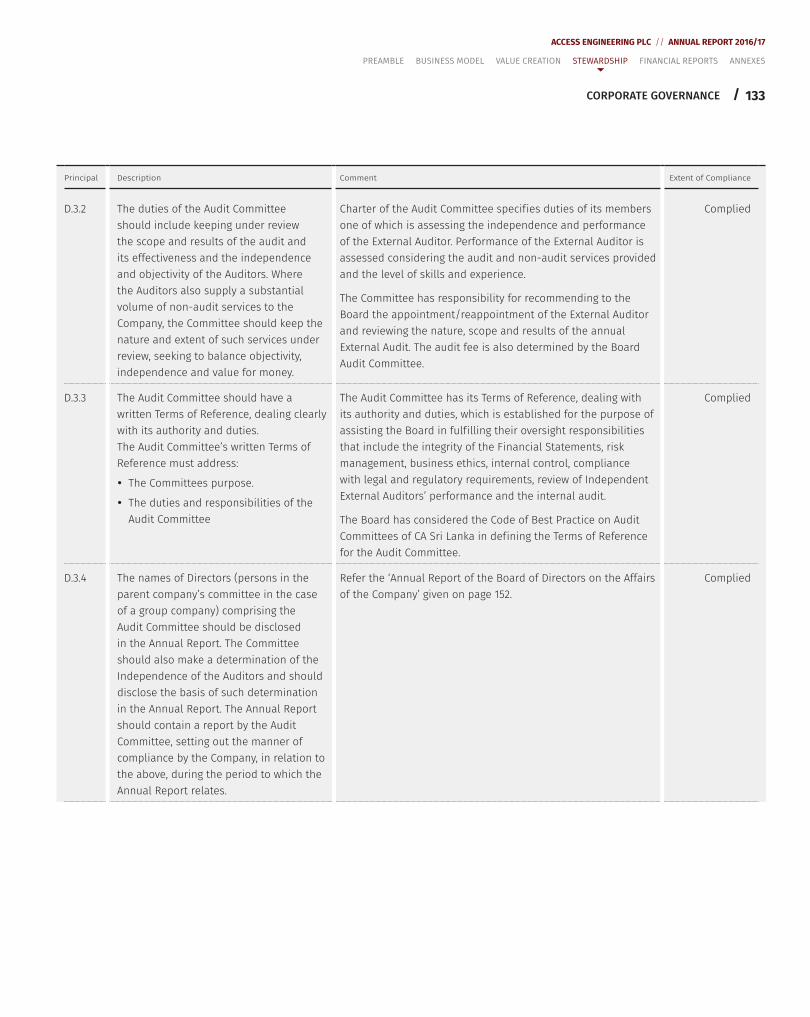
133
ACCESS ENGINEERING PLC // ANNUAL REPORT 2016/17
/
Principal Description Comment Extent of Compliance
D.3.2 The duties of the Audit Committee should include keeping under review the scope and results of the audit and its effectiveness and the independence and objectivity of the Auditors. Where the Auditors also supply a substantial volume of non-audit services to the Company, the Committee should keep the nature and extent of such services under review, seeking to balance objectivity, independence and value for money.
Charter of the Audit Committee specif ies duties of its members one of which is assessing the independence and performance of the External Auditor. Performance of the External Auditor is assessed considering the audit and non-audit services provided and the level of skills and experience.
The Committee has responsibility for recommending to the Board the appointment/reappointment of the External Auditor and reviewing the nature, scope and results of the annual External Audit. The audit fee is also determined by the Board Audit Committee.
Complied
D.3.3 The Audit Committee should have a written Terms of Reference, dealing clearly with its authority and duties. The Audit Committee’s written Terms of Reference must address:
y The Committees purpose.
y The duties and responsibilities of the Audit Committee
The Audit Committee has its Terms of Reference, dealing with its authority and duties, which is established for the purpose of assisting the Board in fulf illing their oversight responsibilities that include the integrity of the F inancial Statements, risk management, business ethics, internal control, compliance with legal and regulatory requirements, review of Independent External Auditors’ performance and the internal audit.
The Board has considered the Code of Best Practice on Audit Committees of CA Sri Lanka in def ining the Terms of Reference for the Audit Committee.
Complied
D.3.4 The names of Directors (persons in the parent company’s committee in the case of a group company) comprising the Audit Committee should be disclosed in the Annual Report. The Committee should also make a determination of the Independence of the Auditors and should disclose the basis of such determination in the Annual Report. The Annual Report should contain a report by the Audit Committee, setting out the manner of compliance by the Company, in relation to the above, during the period to which the Annual Report relates.
Refer the ‘Annual Report of the Board of Directors on the Affairs of the Company’ given on page 152.
Complied
CORPORATE GOVERNANCE
PREAMBLE BUSINESS MODEL VALUE CREATION STEWARDSHIP FINANCIAL REPORTS ANNEXES
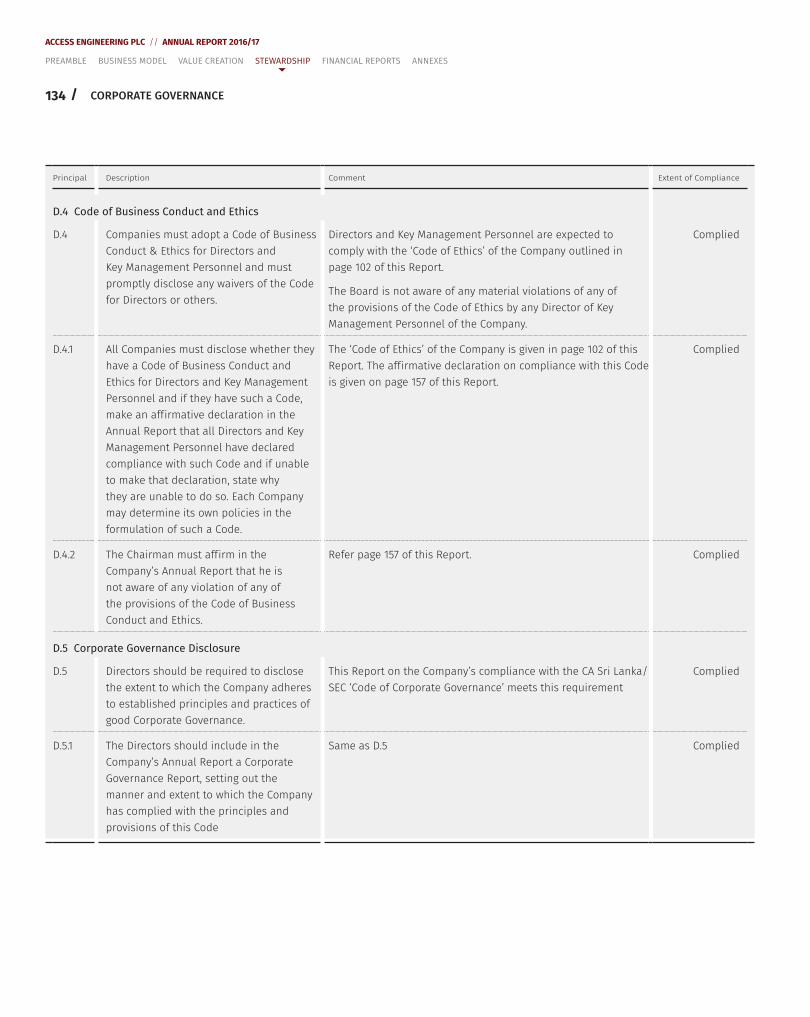
134 /
ACCESS ENGINEERING PLC // ANNUAL REPORT 2016/17
Principal Description Comment Extent of Compliance
D.4 Code of Business Conduct and Ethics
D.4 Companies must adopt a Code of Business Conduct & Ethics for Directors and Key Management Personnel and must promptly disclose any waivers of the Code for Directors or others.
Directors and Key Management Personnel are expected to comply with the ‘Code of Ethics’ of the Company outlined in page 102 of this Report.
The Board is not aware of any material violations of any of the provisions of the Code of Ethics by any Director of Key Management Personnel of the Company.
Complied
D.4.1 All Companies must disclose whether they have a Code of Business Conduct and Ethics for Directors and Key Management Personnel and if they have such a Code, make an aff irmative declaration in the Annual Report that all Directors and Key Management Personnel have declared compliance with such Code and if unable to make that declaration, state why they are unable to do so. Each Company may determine its own policies in the formulation of such a Code.
The ‘Code of Ethics’ of the Company is given in page 102 of this Report. The aff irmative declaration on compliance with this Code is given on page 157 of this Report.
Complied
D.4.2 The Chairman must aff irm in the Company’s Annual Report that he is not aware of any violation of any of the provisions of the Code of Business Conduct and Ethics.
Refer page 157 of this Report. Complied
D.5 Corporate Governance Disclosure
D.5 Directors should be required to disclose the extent to which the Company adheres to established principles and practices of good Corporate Governance.
This Report on the Company’s compliance with the CA Sri Lanka/SEC ‘Code of Corporate Governance’ meets this requirement
Complied
D.5.1 The Directors should include in the Company’s Annual Report a Corporate Governance Report, setting out the manner and extent to which the Company has complied with the principles and provisions of this Code
Same as D.5 Complied
CORPORATE GOVERNANCE
PREAMBLE BUSINESS MODEL VALUE CREATION STEWARDSHIP FINANCIAL REPORTS ANNEXES
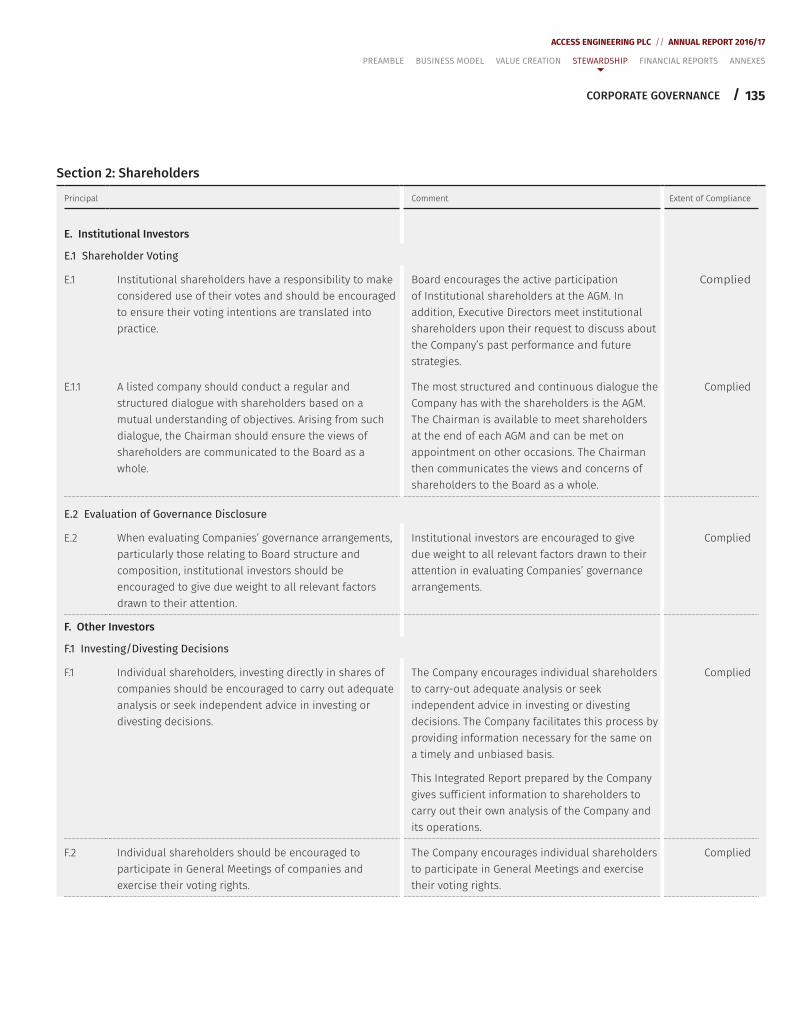
135
ACCESS ENGINEERING PLC // ANNUAL REPORT 2016/17
/
Section 2: Shareholders
Principal Comment Extent of Compliance
E. Institutional Investors
E.1 Shareholder Voting
E.1 Institutional shareholders have a responsibility to make considered use of their votes and should be encouraged to ensure their voting intentions are translated into practice.
Board encourages the active participation of Institutional shareholders at the AGM. In addition, Executive Directors meet institutional shareholders upon their request to discuss about the Company’s past performance and future strategies.
Complied
E.1.1 A listed company should conduct a regular and structured dialogue with shareholders based on a mutual understanding of objectives. Arising from such dialogue, the Chairman should ensure the views of shareholders are communicated to the Board as a whole.
The most structured and continuous dialogue the Company has with the shareholders is the AGM. The Chairman is available to meet shareholders at the end of each AGM and can be met on appointment on other occasions. The Chairman then communicates the views and concerns of shareholders to the Board as a whole.
Complied
E.2 Evaluation of Governance Disclosure
E.2 When evaluating Companies’ governance arrangements, particularly those relating to Board structure and composition, institutional investors should be encouraged to give due weight to all relevant factors drawn to their attention.
Institutional investors are encouraged to give due weight to all relevant factors drawn to their attention in evaluating Companies’ governance arrangements.
Complied
F. Other Investors
F.1 Investing/Divesting Decisions
F.1 Individual shareholders, investing directly in shares of companies should be encouraged to carry out adequate analysis or seek independent advice in investing or divesting decisions.
The Company encourages individual shareholders to carry-out adequate analysis or seek independent advice in investing or divesting decisions. The Company facilitates this process by providing information necessary for the same on a timely and unbiased basis.
This Integrated Report prepared by the Company gives suff icient information to shareholders to carry out their own analysis of the Company and its operations.
Complied
F.2 Individual shareholders should be encouraged to participate in General Meetings of companies and exercise their voting rights.
The Company encourages individual shareholders to participate in General Meetings and exercise their voting rights.
Complied
CORPORATE GOVERNANCE
PREAMBLE BUSINESS MODEL VALUE CREATION STEWARDSHIP FINANCIAL REPORTS ANNEXES
136 /
ACCESS ENGINEERING PLC // ANNUAL REPORT 2016/17
Principal Comment Extent of Compliance
G. Other Investors
G.1 Investing/Divesting Decisions
G.1.1 Economic Sustainability The principle of economic sustainability governance recognizes how organizations take responsibilities for impacts of their strategies, decisions and activities on economic performance and corporate citizenship in their sphere of influence (including geographic) and how this is integrated throughout the organization.
Refer page 250 of this Report for a full list of performance indicators relating to economic sustainability.
Complied
G.1.2 The EnvironmentEnvironmental governance of an organization should adopt an integrated approach that takes into consideration the direct and indirect economic, social, health and environmental implications of their decisions and activities, including pollution prevention, sustainable resource use, climate change, protection of environment, biodiversity and restoration of national resources.
Refer page 250 of this Report for a full list of performance indicators relating to the environment.
Complied
G.1.3 Labor PracticesLabor practices governance of an organization encompass all policies and practices relating to work performed by or on behalf of the organization.
Refer page 250 of this Report for a full list of performance indicators relating to labour practices.
Complied
G.1.4 SocietySociety governance encompasses support for and building a relationship with the community and striving for sustainable development including responsible public policy participation, fair competition and responsible community involvement.
Refer page 251 of this Report for a full list of performance indicators relating to the society.
Complied
G.1.5 Product ResponsibilityProduct responsibility governance includes manufacturing quality products and distributing them and ensuring that the products are safe for the consumers and the environment and also communicating clearly with consumers so that they can make an informed choice including factual unbiased information and fair contractual practices and consumer data protection and privacy.
All construction related activities of the company are carried out with the highest quality in accordance with the best practices adopted. The QMS of the Company is also ISO 9001:2008 certif ied.
Complied
G.1.6 Stakeholder identif ication, engagement and effective communication.
Refer page 18 of this Report on stakeholder engagement.
Complied
G.1.7 Sustainability reporting is and disclosure should be formalized as a part of the company’s reporting processes and take place on regular basis.
Prior to 2013/14 the Company produced stand-alone Sustainability Reports. This Report is the Company’s fourth Integrated Report.
Complied
CORPORATE GOVERNANCE
PREAMBLE BUSINESS MODEL VALUE CREATION STEWARDSHIP FINANCIAL REPORTS ANNEXES
137
ACCESS ENGINEERING PLC // ANNUAL REPORT 2016/17
/
Statement of Compliance under Section 168 of Companies Act No. 7 of 2007
Rule No. Requirement Status of Compliance Reference in the Annual Report
Section 168 – Contents of Annual Report
(1) (a) The nature of the business of the Group and theCompany together with any change thereof during the accounting period
Complied Notes to the Financial Statements
(1) (b) Signed Financial Statements of the Group and theCompany for the accounting period completed
Complied Financial Statements
(1) (c) Auditor’s Report on the F inancial Statements and any group F inancial Statements
Complied Independent Auditors’ Report
(1) (d) Change in accounting policies made during the accounting period
Complied Notes to the Financial Statements
(1) (e) Particulars of entries in the interests register made during the accounting period
Complied Annual Report of the Board of Directors
(1) (f ) Remuneration and other benef its of Directors during the accounting period
Complied Notes to the Financial Statements
(1) (g) Total amount of donations made by the Company during the accounting period
Complied Annual Report of the Board of Directors
(1) (h) Names of the persons holding off ice as Directors of the Company as at the end of the accounting period and the names of any persons who ceased to hold off ice as Directors of the Company during the accounting period
Complied Board of Directors
(1) (i) Amounts payable by the Company to the person or f irm holding off ice as Auditor of the Company as audit fees and as a separate item, fees payable by the Company for other services provided by that person or f irm
Complied Notes to the Financial Statements
(1) (j) Particulars of any relationship (other than that of Auditor) which the Auditor has with or any interests which the Auditor has in, the Company or any of its subsidiaries
Complied Annual Report of the Board of Directors
(1) (k) Be signed on behalf of the Board by two Directors of the Company
Complied Financial Statements
CORPORATE GOVERNANCE
PREAMBLE BUSINESS MODEL VALUE CREATION STEWARDSHIP FINANCIAL REPORTS ANNEXES
138 /
ACCESS ENGINEERING PLC // ANNUAL REPORT 2016/17
AUDIT COMMITTEE REPORT
I am pleased to present the report of the Audit Committee for the f inancial year ended 31st March 2017. During the year, the Committee has continued to review and report to the Board on the Group’s f inancial reporting, internal control and risk management processes and the performance, independence and effectiveness of the External Auditor Messrs KPMG. This report describes the Committee’s major areas of focus since my last report in March 2016.
ROLE OF THE AUDIT COMMITTEEThe role of the Audit Committee is to oversee the f inancial reporting system of the Company, with a view to safeguarding the interests of the shareholders and all other stakeholders. The assurance framework required by the Audit Committee is provided by complementary contributions from management reports, internal and external audit reports and from risk management reports.
COMMITTEE COMPOSITIONThere were no changes to the composition of the Committee as at 31st March 2017. The Committee continued to comprise four Non-Executive Directors as set out below. To ensure compliance with the requirements of the Rule 7.10.6 of Listing Rules of the Colombo Stock Exchange and Code of Best Practices on Corporate Governance issued jointly by The Institute of Chartered Accountants of Sri Lanka and Securities Exchange Commission of Sri Lanka, Committee membership comprises three (3) Independent Non-Executive Directors and one (1) Non-Executive Director of the Company.
Category Number of Directors
Independent Non-Executive Directors 3
Non-Executive Directors 1
The Committee is authorised by the Board to seek any information necessary to fulf ill its duties, call any member of staff to be questioned at a meeting of the Committee, as and when required, and obtain independent legal, accounting or other professional advice, at the Company’s expense, which might be necessary for the fulf illment of its duties.
MEETING ATTENDANCEThe Committee met on the following occasions to discuss matters relating to the f inancial year of which the Members’ attendance was as follows:
Name 25th May 2016
27th July
2016
2nd November
2016
26th January
2017
3rd February
2017
Niroshan Dakshina Gunaratne (Chairman)
Prof. Kulatilleke Arthanayake Malik Kumar Ranasinghe
Suresh Dilhan Perera
Dinesh Weerakkody
In addition to the Committee members, the meetings were attended by the Director/COO, GM-Commercial, DGM-Finance and the Internal Auditor on invitation. The Company Secretaries were also present at every meeting.
TERMS OF REFERENCEThe Audit Committee has its Terms of Reference, dealing with its authority and duties, which is established for the purpose of assisting the Board in fulf illing their oversight responsibilities that include the integrity of the Financial Statements, risk management, business ethics, internal control, compliance with legal and regulatory requirements, review of Independent External Auditors’ performance and the internal audit.
COMPLIANCEFINANCIAL REPORTING AND SIGNIFICANT JUDGMENTSThe Committee is responsible for reviewing whether suitable accounting policies have been adopted and whether Management has made appropriate estimates and judgments in the preparation of the Financial Statements. As part of its review the Committee considers the clarity and completeness of disclosures in the Financial Statements to assess whether these have been set appropriately in the context. The Committee also keeps under
PREAMBLE BUSINESS MODEL VALUE CREATION STEWARDSHIP FINANCIAL REPORTS ANNEXES
139
ACCESS ENGINEERING PLC // ANNUAL REPORT 2016/17
/AUDIT COMMITTEE REPORT
review the impact of any actual or expected changes to accounting standards applicable to the Group and provides general oversight in relation to the f inancial policies of the Group.
The Audit Committee reviewed the quarterly and annual Financial Statements prior to its publication and the review included:
y Appropriateness and changes in accounting policies
y Signif icant estimates and judgments made by the Management
y Compliance with relevant accounting standards and applicable regulatory requirements
y Impairment of assets
y Issues arising from the internal audit and independent external audit
y The Group’s/Company’s ability to continue as a going concern
LAWS AND REGULATIONSThe Audit Committee reviewed the reports submitted by the Management and the Internal Auditors on compliance with applicable laws and regulations. The Committee is satisf ied that laws and regulations are duly complied with and statutory payments have been made on a timely basis.
AUDIT AND ACCOUNTABILITYINTERNAL CONTROLSThe Committee is satisf ied that an effective system of internal control is in place to provide reasonable assurance on safeguarding the Company’s assets and reliability of Financial Statements. Effectiveness of the Company’s system of internal controls is evaluated through reports provided by the Management, Internal Auditors and Independent External Auditors.
INTERNAL AUDITThe Committee is responsible for reviewing the role and effectiveness of the internal audit function by monitoring the results of its work and the responses of Management to its recommendations. The Audit Committee meets the Internal Auditors on a quarterly basis and reviews their f indings in order to identify risks attached to different areas of operation and effectiveness of internal controls.
The Committee reviewed and approved the 2016/17 internal audit plan at its meeting in May 2016 and continued to monitor progress against this plan during the year. Results and Management actions arising from the reviews undertaken in 2016/17 were discussed in
detail at each of the Committee’s meetings. The Head of Internal Audit attended all of the Committee’s meetings during 2016 and held discussions with the Committee in the absence of Executive Management
INDEPENDENT AUDITORSThe Audit Committee reviewed the independence and objectivity of the Independent External Auditors Messrs KPMG Sri Lanka, Chartered Accountants. The Audit Committee has met with the External Auditors to review their audit plan and any observations made by them.
The Committee has received a declaration from the External Auditors, conf irming that they do not have any relationship or interest in the Company or its subsidiaries. The Committee reviewed the non-audit services and its impact on the independence of the External Auditors.
The Audit Committee has recommended to the Board that Messrs KPMG be reappointed as the Independent External Auditor and that the reappointment be included in the agenda of the Annual General Meeting.
CONCLUSIONThe Audit Committee is satisf ied that the effectiveness of the organizational structure of the Group and of the implementation of Group’s Accounting Policies and operational controls provide reasonable assurance that the affairs of the Group are managed in accordance with Group policies and that the Group assets are properly accounted for and adequately safeguarded. The Committee is also satisf ied that the Company and its subsidiaries are able to continue as a going concern.
N D Gunaratne Chairman – Audit Committee
30th June 2017
PREAMBLE BUSINESS MODEL VALUE CREATION STEWARDSHIP FINANCIAL REPORTS ANNEXES
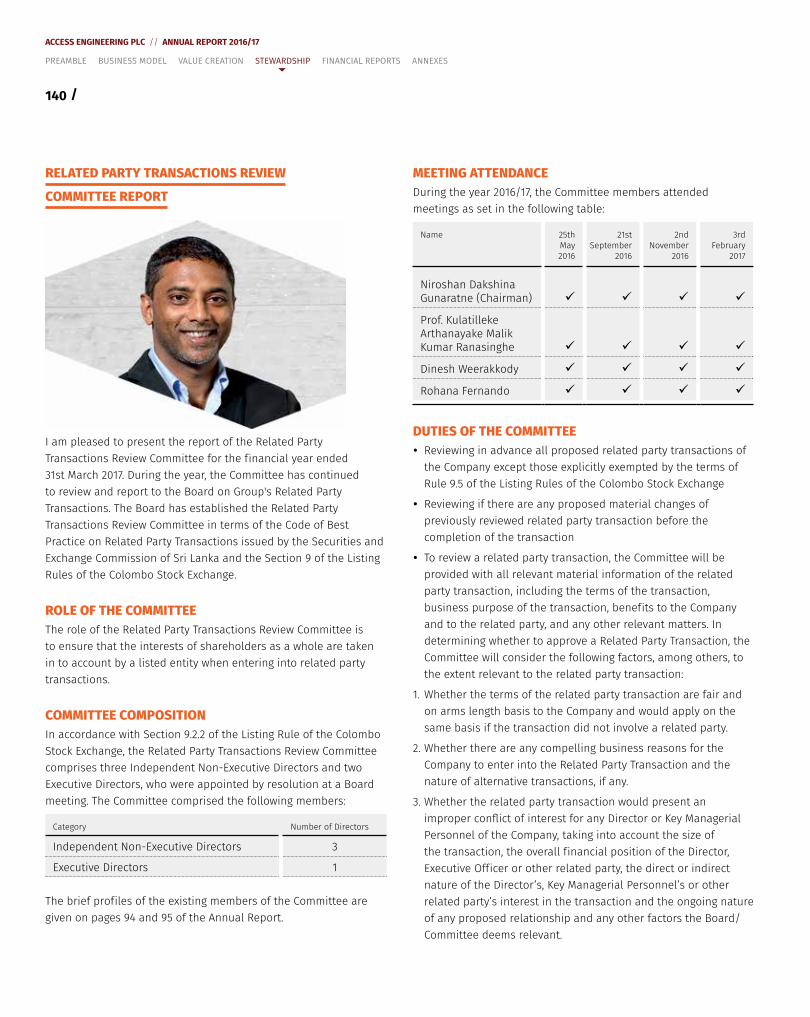
140 /
ACCESS ENGINEERING PLC // ANNUAL REPORT 2016/17
RELATED PARTY TRANSACTIONS REVIEW
COMMITTEE REPORT
I am pleased to present the report of the Related Party Transactions Review Committee for the f inancial year ended 31st March 2017. During the year, the Committee has continued to review and report to the Board on Group's Related Party Transactions. The Board has established the Related Party Transactions Review Committee in terms of the Code of Best Practice on Related Party Transactions issued by the Securities and Exchange Commission of Sri Lanka and the Section 9 of the Listing Rules of the Colombo Stock Exchange.
ROLE OF THE COMMITTEEThe role of the Related Party Transactions Review Committee is to ensure that the interests of shareholders as a whole are taken in to account by a listed entity when entering into related party transactions.
COMMITTEE COMPOSITIONIn accordance with Section 9.2.2 of the Listing Rule of the Colombo Stock Exchange, the Related Party Transactions Review Committee comprises three Independent Non-Executive Directors and two Executive Directors, who were appointed by resolution at a Board meeting. The Committee comprised the following members:
Category Number of Directors
Independent Non-Executive Directors 3
Executive Directors 1
The brief prof iles of the existing members of the Committee are given on pages 94 and 95 of the Annual Report.
MEETING ATTENDANCEDuring the year 2016/17, the Committee members attended meetings as set in the following table:
Name 25th May 2016
21st September
2016
2nd November
2016
3rd February
2017
Niroshan Dakshina Gunaratne (Chairman)
Prof. Kulatilleke Arthanayake Malik Kumar Ranasinghe
Dinesh Weerakkody
Rohana Fernando
DUTIES OF THE COMMITTEE y Reviewing in advance all proposed related party transactions of the Company except those explicitly exempted by the terms of Rule 9.5 of the Listing Rules of the Colombo Stock Exchange
y Reviewing if there are any proposed material changes of previously reviewed related party transaction before the completion of the transaction
y To review a related party transaction, the Committee will be provided with all relevant material information of the related party transaction, including the terms of the transaction, business purpose of the transaction, benef its to the Company and to the related party, and any other relevant matters. In determining whether to approve a Related Party Transaction, the Committee will consider the following factors, among others, to the extent relevant to the related party transaction:
1. Whether the terms of the related party transaction are fair and on arms length basis to the Company and would apply on the same basis if the transaction did not involve a related party.
2. Whether there are any compelling business reasons for the Company to enter into the Related Party Transaction and the nature of alternative transactions, if any.
3. Whether the related party transaction would present an improper conflict of interest for any Director or Key Managerial Personnel of the Company, taking into account the size of the transaction, the overall f inancial position of the Director, Executive Off icer or other related party, the direct or indirect nature of the Director’s, Key Managerial Personnel’s or other related party’s interest in the transaction and the ongoing nature of any proposed relationship and any other factors the Board/Committee deems relevant.
PREAMBLE BUSINESS MODEL VALUE CREATION STEWARDSHIP FINANCIAL REPORTS ANNEXES
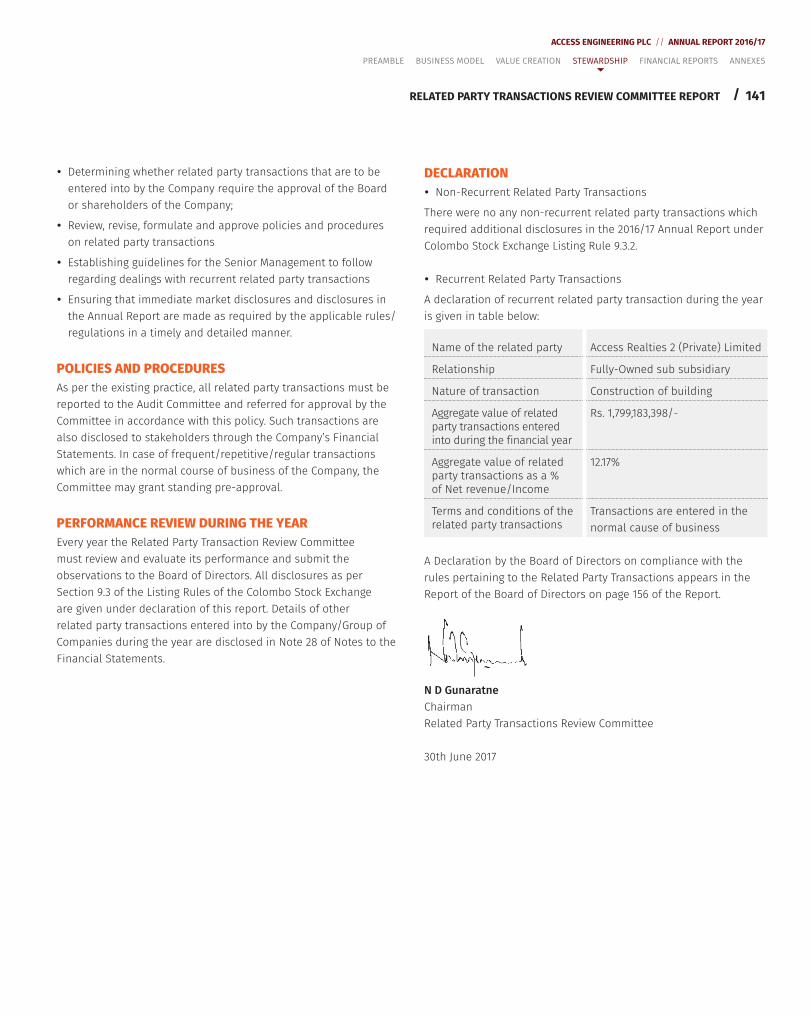
141
ACCESS ENGINEERING PLC // ANNUAL REPORT 2016/17
/RELATED PARTY TRANSACTIONS REVIEW COMMITTEE REPORT
y Determining whether related party transactions that are to be entered into by the Company require the approval of the Board or shareholders of the Company;
y Review, revise, formulate and approve policies and procedures on related party transactions
y Establishing guidelines for the Senior Management to follow regarding dealings with recurrent related party transactions
y Ensuring that immediate market disclosures and disclosures in the Annual Report are made as required by the applicable rules/regulations in a timely and detailed manner.
POLICIES AND PROCEDURESAs per the existing practice, all related party transactions must be reported to the Audit Committee and referred for approval by the Committee in accordance with this policy. Such transactions are also disclosed to stakeholders through the Company’s Financial Statements. In case of frequent/repetitive/regular transactions which are in the normal course of business of the Company, the Committee may grant standing pre-approval.
PERFORMANCE REVIEW DURING THE YEAREvery year the Related Party Transaction Review Committee must review and evaluate its performance and submit the observations to the Board of Directors. All disclosures as per Section 9.3 of the Listing Rules of the Colombo Stock Exchange are given under declaration of this report. Details of other related party transactions entered into by the Company/Group of Companies during the year are disclosed in Note 28 of Notes to the Financial Statements.
DECLARATION y Non-Recurrent Related Party Transactions
There were no any non-recurrent related party transactions which required additional disclosures in the 2016/17 Annual Report under Colombo Stock Exchange Listing Rule 9.3.2.
y Recurrent Related Party Transactions
A declaration of recurrent related party transaction during the year is given in table below:
Name of the related party Access Realties 2 (Private) Limited
Relationship Fully-Owned sub subsidiary
Nature of transaction Construction of building
Aggregate value of related party transactions entered into during the f inancial year
Rs. 1,799,183,398/-
Aggregate value of related party transactions as a % of Net revenue/Income
12.17%
Terms and conditions of the related party transactions
Transactions are entered in the normal cause of business
A Declaration by the Board of Directors on compliance with the rules pertaining to the Related Party Transactions appears in the Report of the Board of Directors on page 156 of the Report.
N D GunaratneChairmanRelated Party Transactions Review Committee
30th June 2017
PREAMBLE BUSINESS MODEL VALUE CREATION STEWARDSHIP FINANCIAL REPORTS ANNEXES
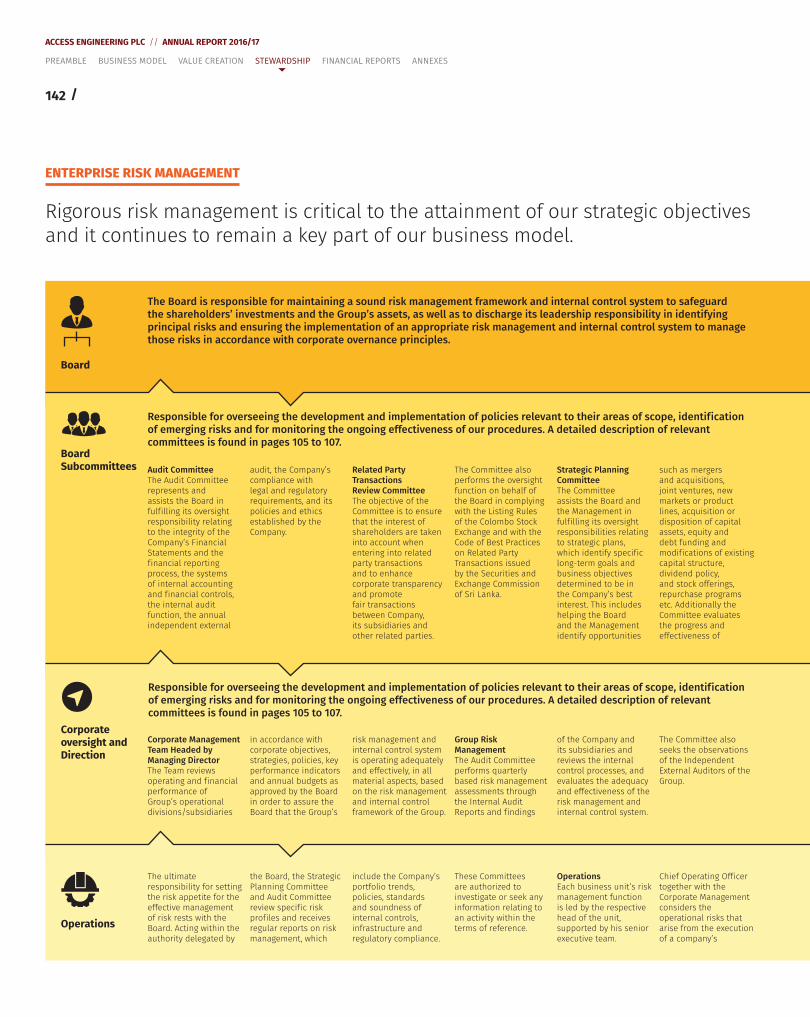
142 /
ACCESS ENGINEERING PLC // ANNUAL REPORT 2016/17
PREAMBLE BUSINESS MODEL VALUE CREATION STEWARDSHIP FINANCIAL REPORTS ANNEXES
ENTERPRISE RISK MANAGEMENT
Rigorous risk management is critical to the attainment of our strategic objectives and it continues to remain a key part of our business model.
The Board is responsible for maintaining a sound risk management framework and internal control system to safeguard the shareholders’ investments and the Group’s assets, as well as to discharge its leadership responsibility in identifying principal risks and ensuring the implementation of an appropriate risk management and internal control system to manage those risks in accordance with corporate overnance principles.
Responsible for overseeing the development and implementation of policies relevant to their areas of scope, identif ication of emerging risks and for monitoring the ongoing effectiveness of our procedures. A detailed description of relevant committees is found in pages 105 to 107.
Audit CommitteeThe Audit Committee represents and assists the Board in fulf illing its oversight responsibility relating to the integrity of the Company’s Financial Statements and the f inancial reporting process, the systems of internal accounting and f inancial controls, the internal audit function, the annual independent external
audit, the Company’s compliance with legal and regulatory requirements, and its policies and ethics established by the Company.
Related Party Transactions Review CommitteeThe objective of the Committee is to ensure that the interest of shareholders are taken into account when entering into related party transactions and to enhance corporate transparency and promote fair transactions between Company, its subsidiaries and other related parties.
The Committee also performs the oversight function on behalf of the Board in complying with the Listing Rules of the Colombo Stock Exchange and with the Code of Best Practices on Related Party Transactions issued by the Securities and Exchange Commission of Sri Lanka.
Strategic Planning CommitteeThe Committee assists the Board and the Management in fulf illing its oversight responsibilities relating to strategic plans, which identify specif ic long-term goals and business objectives determined to be in the Company’s best interest. This includes helping the Board and the Management identify opportunities
such as mergers and acquisitions, joint ventures, new markets or product lines, acquisition or disposition of capital assets, equity and debt funding and modif ications of existing capital structure, dividend policy, and stock offerings, repurchase programs etc. Additionally the Committee evaluates the progress and effectiveness of
The ultimate responsibility for setting the risk appetite for the effective management of risk rests with the Board. Acting within the authority delegated by
the Board, the Strategic Planning Committee and Audit Committee review specif ic risk prof iles and receives regular reports on risk management, which
include the Company’s portfolio trends, policies, standards and soundness of internal controls, infrastructure and regulatory compliance.
These Committees are authorized to investigate or seek any information relating to an activity within the terms of reference.
OperationsEach business unit’s risk management function is led by the respective head of the unit, supported by his senior executive team.
Chief Operating Off icer together with the Corporate Management considers the operational risks that arise from the execution of a company’s
Responsible for overseeing the development and implementation of policies relevant to their areas of scope, identif ication of emerging risks and for monitoring the ongoing effectiveness of our procedures. A detailed description of relevant committees is found in pages 105 to 107.
Corporate Management Team Headed by Managing DirectorThe Team reviews operating and f inancial performance of Group’s operational divisions/subsidiaries
in accordance with corporate objectives, strategies, policies, key performance indicators and annual budgets as approved by the Board in order to assure the Board that the Group’s
risk management and internal control system is operating adequately and effectively, in all material aspects, based on the risk management and internal control framework of the Group.
Group Risk ManagementThe Audit Committee performs quarterly based risk management assessments through the Internal Audit Reports and f indings
of the Company and its subsidiaries and reviews the internal control processes, and evaluates the adequacy and effectiveness of the risk management and internal control system.
The Committee also seeks the observations of the Independent External Auditors of the Group.
Board
Board Subcommittees
Corporate oversight and Direction
Operations
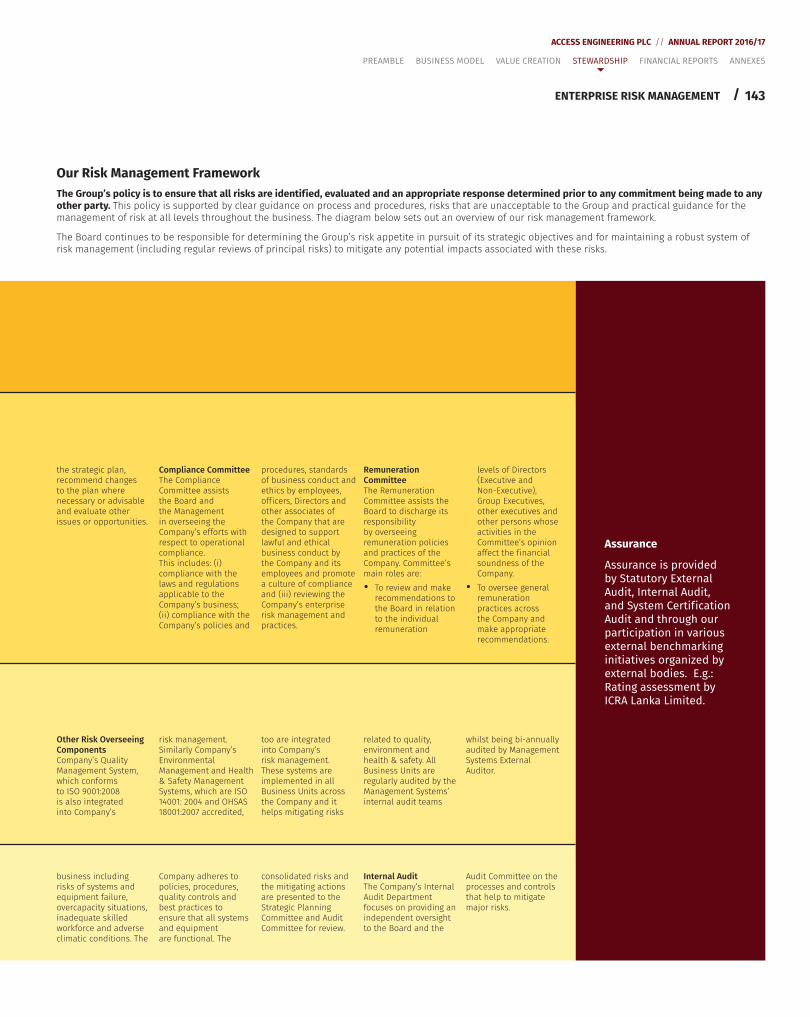
143
ACCESS ENGINEERING PLC // ANNUAL REPORT 2016/17
/ENTERPRISE RISK MANAGEMENT
PREAMBLE BUSINESS MODEL VALUE CREATION STEWARDSHIP FINANCIAL REPORTS ANNEXES
the strategic plan, recommend changes to the plan where necessary or advisable and evaluate other issues or opportunities.
Compliance CommitteeThe Compliance Committee assists the Board and the Management in overseeing the Company’s efforts with respect to operational compliance. This includes: (i) compliance with the laws and regulations applicable to the Company’s business; (ii) compliance with the Company’s policies and
procedures, standards of business conduct and ethics by employees, off icers, Directors and other associates of the Company that are designed to support lawful and ethical business conduct by the Company and its employees and promote a culture of compliance and (iii) reviewing the Company’s enterprise risk management and practices.
Remuneration CommitteeThe Remuneration Committee assists the Board to discharge its responsibility by overseeing remuneration policies and practices of the Company. Committee’s main roles are: y To review and make
recommendations to the Board in relation to the individual remuneration
levels of Directors (Executive and Non-Executive), Group Executives, other executives and other persons whose activities in the Committee’s opinion affect the f inancial soundness of the Company.
y To oversee general remuneration practices across the Company and make appropriate recommendations.
Assurance
Assurance is provided by Statutory External Audit, Internal Audit, and System Certif ication Audit and through our participation in various external benchmarking initiatives organized by external bodies. E.g.: Rating assessment by ICRA Lanka Limited.
business including risks of systems and equipment failure, overcapacity situations, inadequate skilled workforce and adverse climatic conditions. The
Company adheres to policies, procedures, quality controls and best practices to ensure that all systems and equipment are functional. The
consolidated risks and the mitigating actions are presented to the Strategic Planning Committee and Audit Committee for review.
Internal AuditThe Company’s Internal Audit Department focuses on providing an independent oversight to the Board and the
Audit Committee on the processes and controls that help to mitigate major risks.
Other Risk Overseeing ComponentsCompany’s Quality Management System, which conforms to ISO 9001:2008 is also integrated into Company’s
risk management. Similarly Company’s Environmental Management and Health & Safety Management Systems, which are ISO 14001: 2004 and OHSAS 18001:2007 accredited,
too are integrated into Company’s risk management. These systems are implemented in all Business Units across the Company and it helps mitigating risks
related to quality, environment and health & safety. All Business Units are regularly audited by the Management Systems’ internal audit teams
whilst being bi-annually audited by Management Systems External Auditor.
Our Risk Management FrameworkThe Group’s policy is to ensure that all risks are identif ied, evaluated and an appropriate response determined prior to any commitment being made to any other party. This policy is supported by clear guidance on process and procedures, risks that are unacceptable to the Group and practical guidance for the management of risk at all levels throughout the business. The diagram below sets out an overview of our risk management framework.
The Board continues to be responsible for determining the Group’s risk appetite in pursuit of its strategic objectives and for maintaining a robust system of risk management (including regular reviews of principal risks) to mitigate any potential impacts associated with these risks.
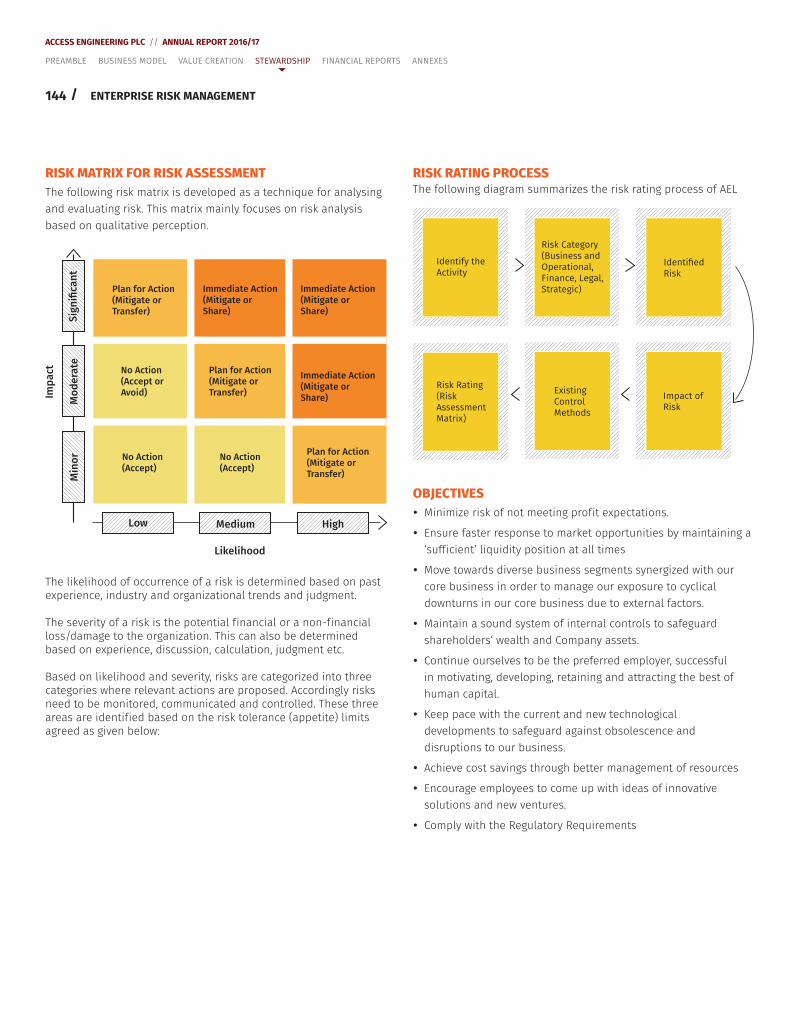
144 /
ACCESS ENGINEERING PLC // ANNUAL REPORT 2016/17
RISK MATRIX FOR RISK ASSESSMENTThe following risk matrix is developed as a technique for analysing and evaluating risk. This matrix mainly focuses on risk analysis based on qualitative perception.
Imp
act
Likelihood
Medium High
Sig
nifi
can
tM
od
era
teM
ino
r
Plan for Action(Mitigate orTransfer)
Immediate Action(Mitigate orShare)
Immediate Action(Mitigate orShare)
Immediate Action(Mitigate orShare)
No Action(Accept orAvoid)
Plan for Action(Mitigate orTransfer)
No Action(Accept)
No Action(Accept)
Plan for Action(Mitigate orTransfer)
Low
The likelihood of occurrence of a risk is determined based on past experience, industry and organizational trends and judgment.
The severity of a risk is the potential f inancial or a non-f inancial loss/damage to the organization. This can also be determined based on experience, discussion, calculation, judgment etc.
Based on likelihood and severity, risks are categorized into three categories where relevant actions are proposed. Accordingly risks need to be monitored, communicated and controlled. These three areas are identif ied based on the risk tolerance (appetite) limits agreed as given below:
RISK RATING PROCESSThe following diagram summarizes the risk rating process of AEL
Risk Rating(RiskAssessmentMatrix)
ExistingControlMethods
Impact ofRisk
Identify theActivity
IdentifiedRisk
Risk Category(Business andOperational,Finance, Legal,Strategic)
OBJECTIVES y Minimize risk of not meeting prof it expectations.
y Ensure faster response to market opportunities by maintaining a ‘suff icient’ liquidity position at all times
y Move towards diverse business segments synergized with our core business in order to manage our exposure to cyclical downturns in our core business due to external factors.
y Maintain a sound system of internal controls to safeguard shareholders‘ wealth and Company assets.
y Continue ourselves to be the preferred employer, successful in motivating, developing, retaining and attracting the best of human capital.
y Keep pace with the current and new technological developments to safeguard against obsolescence and disruptions to our business.
y Achieve cost savings through better management of resources
y Encourage employees to come up with ideas of innovative solutions and new ventures.
y Comply with the Regulatory Requirements
ENTERPRISE RISK MANAGEMENT
PREAMBLE BUSINESS MODEL VALUE CREATION STEWARDSHIP FINANCIAL REPORTS ANNEXES
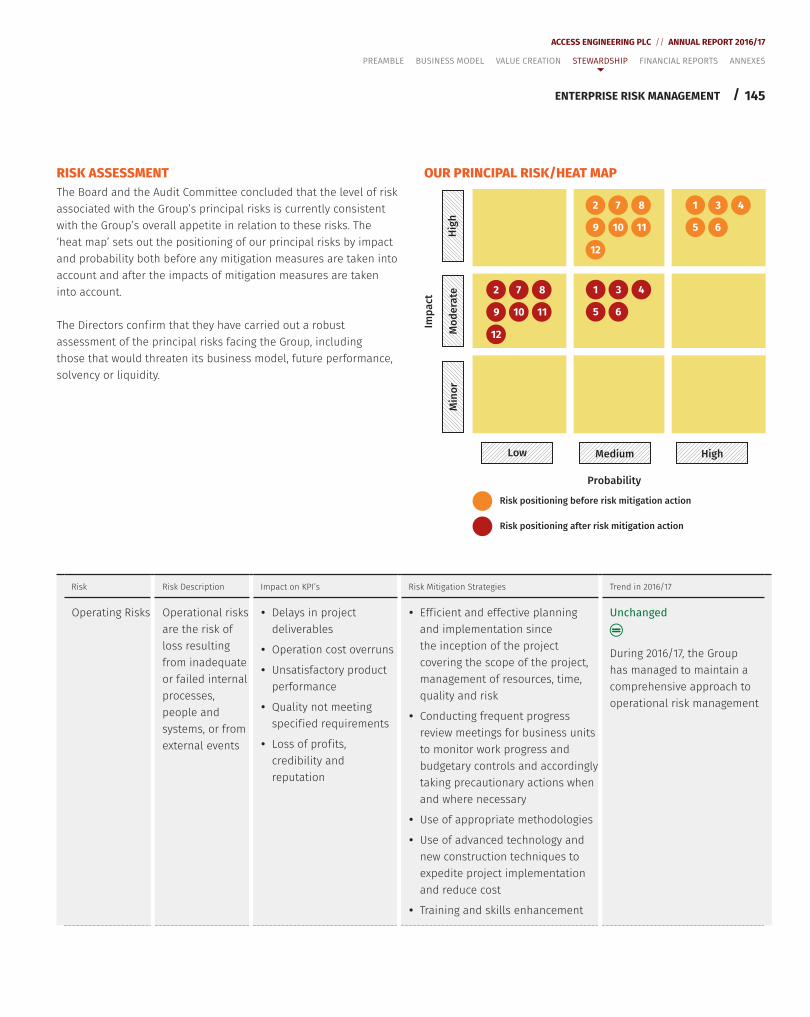
145
ACCESS ENGINEERING PLC // ANNUAL REPORT 2016/17
/
RISK ASSESSMENTThe Board and the Audit Committee concluded that the level of risk associated with the Group’s principal risks is currently consistent with the Group’s overall appetite in relation to these risks. The ‘heat map’ sets out the positioning of our principal risks by impact and probability both before any mitigation measures are taken into account and after the impacts of mitigation measures are taken into account.
The Directors conf irm that they have carried out a robust assessment of the principal risks facing the Group, including those that would threaten its business model, future performance, solvency or liquidity.
OUR PRINCIPAL RISK/HEAT MAP
Imp
act
Probability
Medium HighH
igh
Mo
de
rate
Min
or
Low
2 7 8
9 10 11
12
1 3 4
5 6
2 7 8
9 10 11
12
1 3 4
5 6
Risk positioning before risk mitigation action
Risk positioning after risk mitigation action
Risk Risk Description Impact on KPI’s Risk Mitigation Strategies Trend in 2016/17
Operating Risks Operational risks are the risk of loss resulting from inadequate or failed internal processes, people and systems, or from external events
y Delays in project deliverables
y Operation cost overruns
y Unsatisfactory product performance
y Quality not meeting specif ied requirements
y Loss of prof its, credibility and reputation
y Eff icient and effective planning and implementation since the inception of the project covering the scope of the project, management of resources, time, quality and risk
y Conducting frequent progress review meetings for business units to monitor work progress and budgetary controls and accordingly taking precautionary actions when and where necessary
y Use of appropriate methodologies
y Use of advanced technology and new construction techniques to expedite project implementation and reduce cost
y Training and skills enhancement
Unchanged
During 2016/17, the Group has managed to maintain a comprehensive approach to operational risk management
ENTERPRISE RISK MANAGEMENT
PREAMBLE BUSINESS MODEL VALUE CREATION STEWARDSHIP FINANCIAL REPORTS ANNEXES
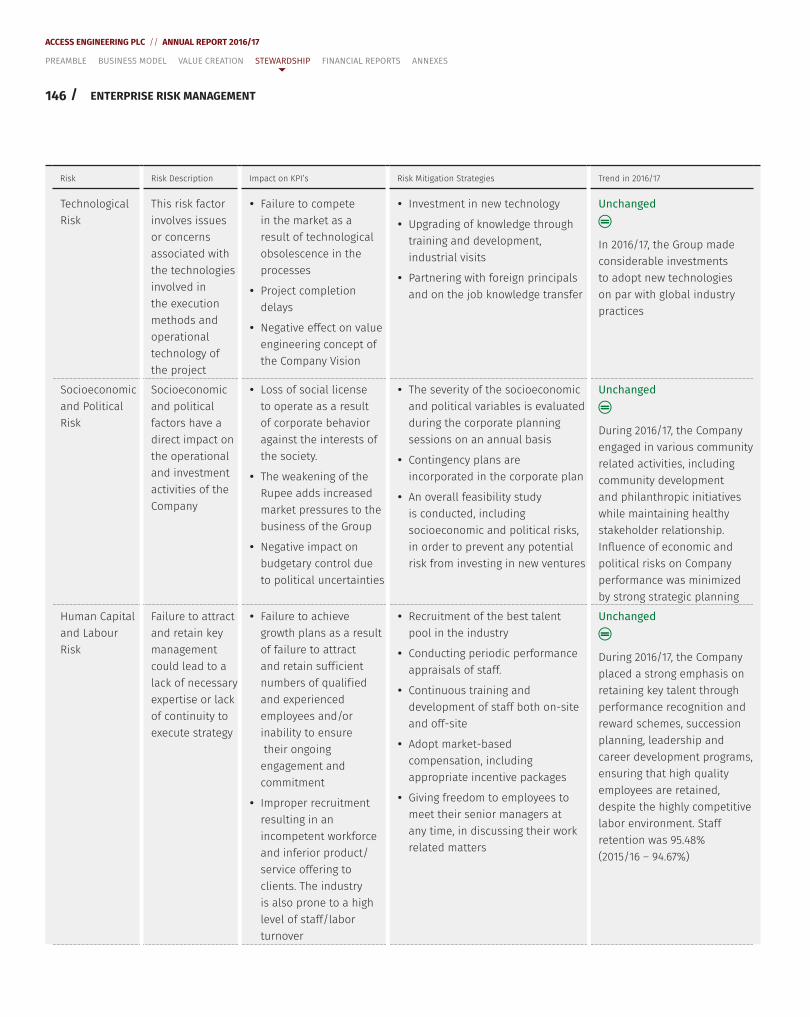
146 /
ACCESS ENGINEERING PLC // ANNUAL REPORT 2016/17
ENTERPRISE RISK MANAGEMENT
Risk Risk Description Impact on KPI’s Risk Mitigation Strategies Trend in 2016/17
Technological Risk
This risk factor involves issues or concerns associated with the technologies involved in the execution methods and operational technology of the project
y Failure to compete in the market as a result of technological obsolescence in the processes
y Project completion delays
y Negative effect on value engineering concept of the Company Vision
y Investment in new technology
y Upgrading of knowledge through training and development, industrial visits
y Partnering with foreign principals and on the job knowledge transfer
Unchanged
In 2016/17, the Group made considerable investments to adopt new technologies on par with global industry practices
Socioeconomic and Political Risk
Socioeconomic and political factors have a direct impact on the operational and investment activities of the Company
y Loss of social license to operate as a result of corporate behavior against the interests of the society.
y The weakening of the Rupee adds increased market pressures to the business of the Group
y Negative impact on budgetary control due to political uncertainties
y The severity of the socioeconomic and political variables is evaluated during the corporate planning sessions on an annual basis
y Contingency plans are incorporated in the corporate plan
y An overall feasibility study is conducted, including socioeconomic and political risks, in order to prevent any potential risk from investing in new ventures
Unchanged
During 2016/17, the Company engaged in various community related activities, including community development and philanthropic initiatives while maintaining healthy stakeholder relationship. Influence of economic and political risks on Company performance was minimized by strong strategic planning
Human Capital and Labour Risk
Failure to attract and retain key management could lead to a lack of necessary expertise or lack of continuity to execute strategy
y Failure to achieve growth plans as a result of failure to attract and retain suff icient numbers of qualif ied and experienced employees and/or inability to ensure their ongoing engagement and commitment
y Improper recruitment resulting in an incompetent workforce and inferior product/service offering to clients. The industry is also prone to a high level of staff/labor turnover
y Recruitment of the best talent pool in the industry
y Conducting periodic performance appraisals of staff.
y Continuous training and development of staff both on-site and off-site
y Adopt market-based compensation, including appropriate incentive packages
y Giving freedom to employees to meet their senior managers at any time, in discussing their work related matters
Unchanged
During 2016/17, the Company placed a strong emphasis on retaining key talent through performance recognition and reward schemes, succession planning, leadership and career development programs, ensuring that high quality employees are retained, despite the highly competitive labor environment. Staff retention was 95.48% (2015/16 – 94.67%)
PREAMBLE BUSINESS MODEL VALUE CREATION STEWARDSHIP FINANCIAL REPORTS ANNEXES
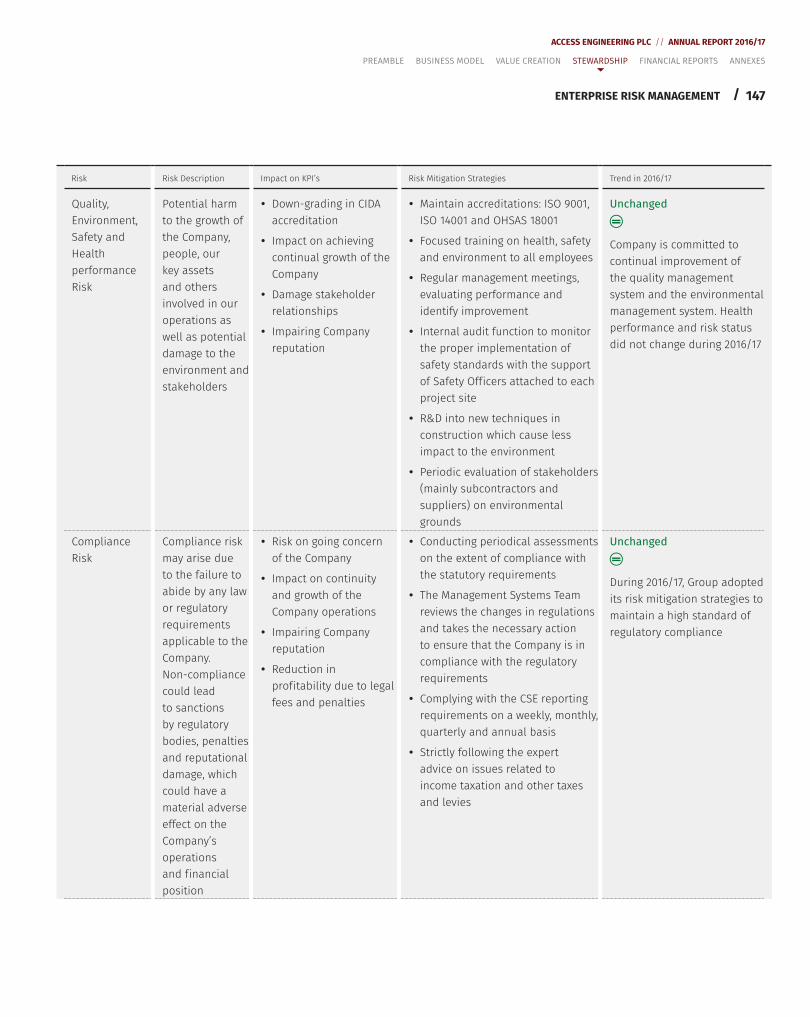
147
ACCESS ENGINEERING PLC // ANNUAL REPORT 2016/17
/ENTERPRISE RISK MANAGEMENT
Risk Risk Description Impact on KPI’s Risk Mitigation Strategies Trend in 2016/17
Quality, Environment, Safety and Health performance Risk
Potential harm to the growth of the Company, people, our key assets and others involved in our operations as well as potential damage to the environment and stakeholders
y Down-grading in CIDA accreditation
y Impact on achieving continual growth of the Company
y Damage stakeholder relationships
y Impairing Company reputation
y Maintain accreditations: ISO 9001, ISO 14001 and OHSAS 18001
y Focused training on health, safety and environment to all employees
y Regular management meetings, evaluating performance and identify improvement
y Internal audit function to monitor the proper implementation of safety standards with the support of Safety Off icers attached to each project site
y R&D into new techniques in construction which cause less impact to the environment
y Periodic evaluation of stakeholders (mainly subcontractors and suppliers) on environmental grounds
Unchanged
Company is committed to continual improvement of the quality management system and the environmental management system. Health performance and risk status did not change during 2016/17
Compliance Risk
Compliance risk may arise due to the failure to abide by any law or regulatory requirements applicable to the Company. Non-compliance could lead to sanctions by regulatory bodies, penalties and reputational damage, which could have a material adverse effect on the Company’s operations and f inancial position
y Risk on going concern of the Company
y Impact on continuity and growth of the Company operations
y Impairing Company reputation
y Reduction in prof itability due to legal fees and penalties
y Conducting periodical assessments on the extent of compliance with the statutory requirements
y The Management Systems Team reviews the changes in regulations and takes the necessary action to ensure that the Company is in compliance with the regulatory requirements
y Complying with the CSE reporting requirements on a weekly, monthly, quarterly and annual basis
y Strictly following the expert advice on issues related to income taxation and other taxes and levies
Unchanged
During 2016/17, Group adopted its risk mitigation strategies to maintain a high standard of regulatory compliance
PREAMBLE BUSINESS MODEL VALUE CREATION STEWARDSHIP FINANCIAL REPORTS ANNEXES
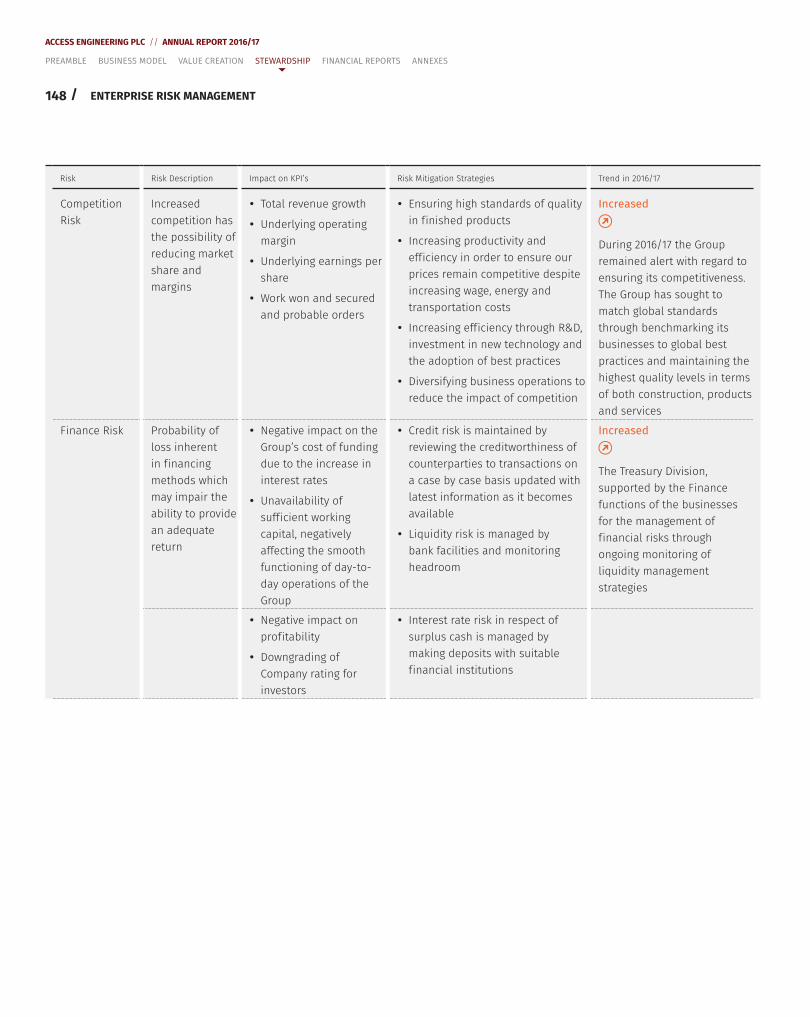
148 /
ACCESS ENGINEERING PLC // ANNUAL REPORT 2016/17
Risk Risk Description Impact on KPI’s Risk Mitigation Strategies Trend in 2016/17
Competition Risk
Increased competition has the possibility of reducing market share and margins
y Total revenue growth
y Underlying operating margin
y Underlying earnings per share
y Work won and secured and probable orders
y Ensuring high standards of quality in f inished products
y Increasing productivity and eff iciency in order to ensure our prices remain competitive despite increasing wage, energy and transportation costs
y Increasing eff iciency through R&D, investment in new technology and the adoption of best practices
y Diversifying business operations to reduce the impact of competition
Increased
During 2016/17 the Group remained alert with regard to ensuring its competitiveness. The Group has sought to match global standards through benchmarking its businesses to global best practices and maintaining the highest quality levels in terms of both construction, products and services
Finance Risk Probability of loss inherent in f inancing methods which may impair the ability to provide an adequate return
y Negative impact on the Group’s cost of funding due to the increase in interest rates
y Unavailability of suff icient working capital, negatively affecting the smooth functioning of day-to-day operations of the Group
y Credit risk is maintained by reviewing the creditworthiness of counterparties to transactions on a case by case basis updated with latest information as it becomes available
y Liquidity risk is managed by bank facilities and monitoring headroom
Increased
The Treasury Division, supported by the Finance functions of the businesses for the management of f inancial risks through ongoing monitoring of liquidity management strategies
y Negative impact on prof itability
y Downgrading of Company rating for investors
y Interest rate risk in respect of surplus cash is managed by making deposits with suitable f inancial institutions
ENTERPRISE RISK MANAGEMENT
PREAMBLE BUSINESS MODEL VALUE CREATION STEWARDSHIP FINANCIAL REPORTS ANNEXES
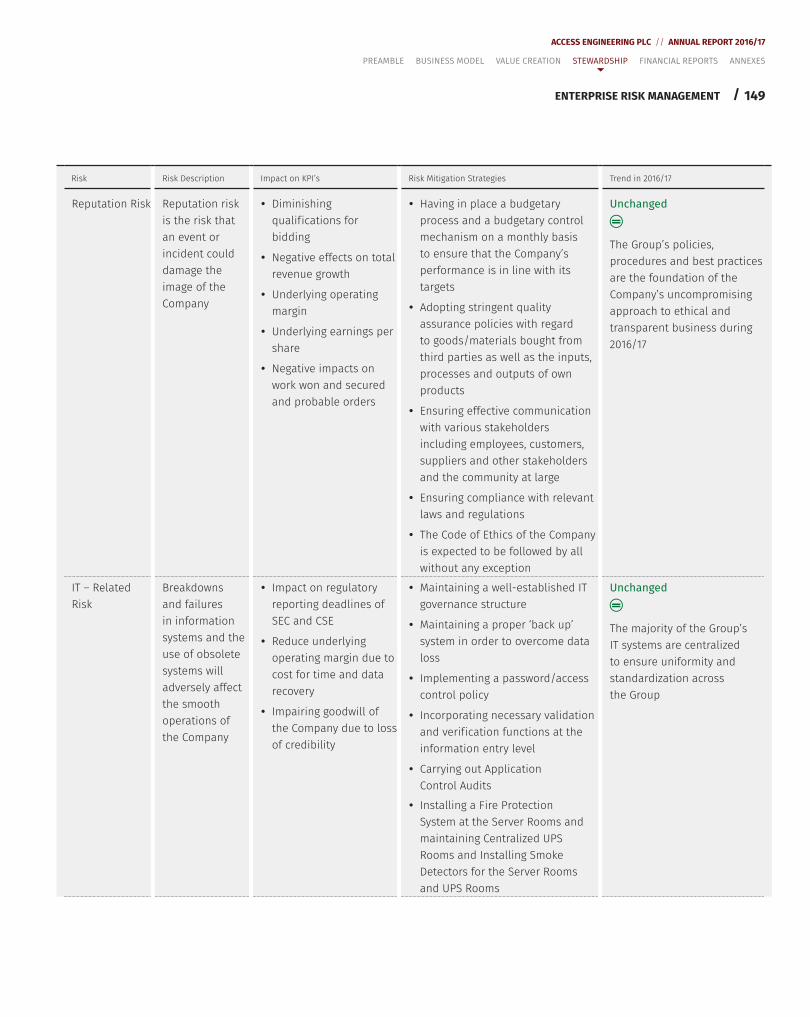
149
ACCESS ENGINEERING PLC // ANNUAL REPORT 2016/17
/
Risk Risk Description Impact on KPI’s Risk Mitigation Strategies Trend in 2016/17
Reputation Risk Reputation risk is the risk that an event or incident could damage the image of the Company
y Diminishing qualif ications for bidding
y Negative effects on total revenue growth
y Underlying operating margin
y Underlying earnings per share
y Negative impacts on work won and secured and probable orders
y Having in place a budgetary process and a budgetary control mechanism on a monthly basis to ensure that the Company’s performance is in line with its targets
y Adopting stringent quality assurance policies with regard to goods/materials bought from third parties as well as the inputs, processes and outputs of own products
y Ensuring effective communication with various stakeholders including employees, customers, suppliers and other stakeholders and the community at large
y Ensuring compliance with relevant laws and regulations
y The Code of Ethics of the Company is expected to be followed by all without any exception
Unchanged
The Group’s policies, procedures and best practices are the foundation of the Company’s uncompromising approach to ethical and transparent business during 2016/17
IT – Related Risk
Breakdowns and failures in information systems and the use of obsolete systems will adversely affect the smooth operations of the Company
y Impact on regulatory reporting deadlines of SEC and CSE
y Reduce underlying operating margin due to cost for time and data recovery
y Impairing goodwill of the Company due to loss of credibility
y Maintaining a well-established IT governance structure
y Maintaining a proper ‘back up’ system in order to overcome data loss
y Implementing a password/access control policy
y Incorporating necessary validation and verif ication functions at the information entry level
y Carrying out Application Control Audits
Unchanged
The majority of the Group’s IT systems are centralized to ensure uniformity and standardization across the Group
y Installing a Fire Protection System at the Server Rooms and maintaining Centralized UPS Rooms and Installing Smoke Detectors for the Server Rooms and UPS Rooms
ENTERPRISE RISK MANAGEMENT
PREAMBLE BUSINESS MODEL VALUE CREATION STEWARDSHIP FINANCIAL REPORTS ANNEXES
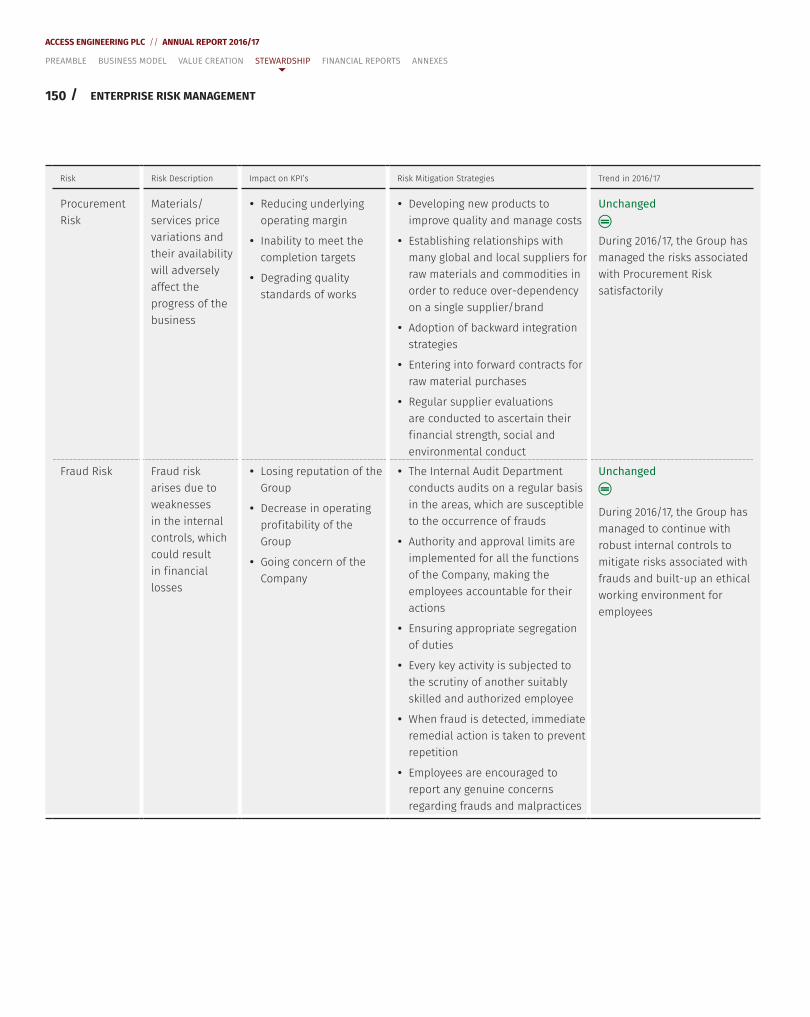
150 /
ACCESS ENGINEERING PLC // ANNUAL REPORT 2016/17
Risk Risk Description Impact on KPI’s Risk Mitigation Strategies Trend in 2016/17
Procurement Risk
Materials/services price variations and their availability will adversely affect the progress of the business
y Reducing underlying operating margin
y Inability to meet the completion targets
y Degrading quality standards of works
y Developing new products to improve quality and manage costs
y Establishing relationships with many global and local suppliers for raw materials and commodities in order to reduce over-dependency on a single supplier/brand
y Adoption of backward integration strategies
y Entering into forward contracts for raw material purchases
y Regular supplier evaluations are conducted to ascertain their f inancial strength, social and environmental conduct
Unchanged
During 2016/17, the Group has managed the risks associated with Procurement Risk satisfactorily
Fraud Risk Fraud risk arises due to weaknesses in the internal controls, which could result in f inancial losses
y Losing reputation of the Group
y Decrease in operating prof itability of the Group
y Going concern of the Company
y The Internal Audit Department conducts audits on a regular basis in the areas, which are susceptible to the occurrence of frauds
y Authority and approval limits are implemented for all the functions of the Company, making the employees accountable for their actions
y Ensuring appropriate segregation of duties
y Every key activity is subjected to the scrutiny of another suitably skilled and authorized employee
y When fraud is detected, immediate remedial action is taken to prevent repetition
y Employees are encouraged to report any genuine concerns regarding frauds and malpractices
Unchanged
During 2016/17, the Group has managed to continue with robust internal controls to mitigate risks associated with frauds and built-up an ethical working environment for employees
ENTERPRISE RISK MANAGEMENT
PREAMBLE BUSINESS MODEL VALUE CREATION STEWARDSHIP FINANCIAL REPORTS ANNEXES
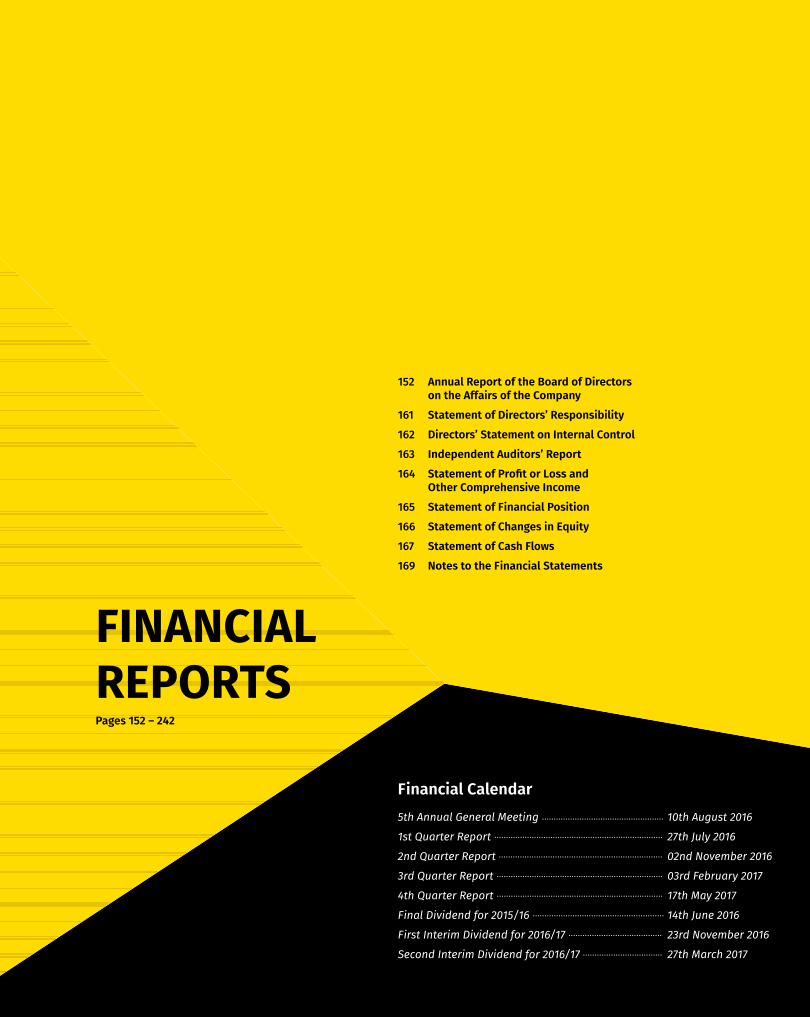
151
ACCESS ENGINEERING PLC // ANNUAL REPORT 2016/17
/
PREAMBLE BUSINESS MODEL VALUE CREATION STEWARDSHIP FINANCIAL REPORTS ANNEXES
FINANCIALREPORTS
152 Annual Report of the Board of Directors on the Affairs of the Company
161 Statement of Directors’ Responsibility
162 Directors’ Statement on Internal Control
163 Independent Auditors’ Report
164 Statement of Profit or Loss and Other Comprehensive Income
165 Statement of Financial Position
166 Statement of Changes in Equity
167 Statement of Cash Flows
169 Notes to the Financial Statements
Financial Calendar5th Annual General Meeting .................................................... 10th August 2016
1st Quarter Report ........................................................................ 27th July 2016
2nd Quarter Report ...................................................................... 02nd November 2016
3rd Quarter Report ....................................................................... 03rd February 2017
4th Quarter Report ....................................................................... 17th May 2017
Final Dividend for 2015/16 ........................................……………. 14th June 2016
First Interim Dividend for 2016/17 ........................................ 23rd November 2016
Second Interim Dividend for 2016/17 .................................. 27th March 2017
Pages 152 – 242
152 /
ACCESS ENGINEERING PLC // ANNUAL REPORT 2016/17
PREAMBLE BUSINESS MODEL VALUE CREATION STEWARDSHIP FINANCIAL REPORTS ANNEXES
ANNUAL REPORT OF THE BOARD OF DIRECTORS ON THE AFFAIRS OF THE COMPANY
The Directors of Access Engineering PLC have pleasure in presenting their Annual Report of the Company, together with the Audited Financial Statements of the Company for the year ended 31st March 2017. This Report covers Chairman’s Message, Corporate Governance and Management Structure, Enterprise Risk Management, Sustainability and all other relevant information for the year ended 31st March 2017, in addition to the Audited Financial Statements.
The Company’s Board of Directors is responsible for confirming that the information stated in the Annual Report on the Affairs of the Company, contains the information required in terms of the Companies Act No. 07 of 2007, the Listing Rules of the Colombo Stock Exchange and is guided by recommended best practices.
GENERAL Access Engineering PLC was incorporated in terms of the Companies Act No. 17 of 1982 and re-registered as per the amended Companies Act No. 07 of 2007 on 6th February 2008. The new number assigned to the Company is PB200. Thereafter, the Company obtained a listing on the Diri Savi Board of the Colombo Stock Exchange on 27th March 2012 and changed its name to Access Engineering PLC on 12th June 2012. The registration number of the Company changed to PB200 PQ.
The Company is now listed on the Main Board of the Colombo Stock Exchange with effect from 8th January 2013.
The Company also has Rs. 5,000 Mn Rated Senior Unsecured Redeemable Debentures at a par value of Rs. 100/- which are listed on the Main Board of the Colombo Stock Exchange.
Both, the Company and the Debentures in issue have been assigned a Rating of ‘(SL) A+ with a stable outlook’ by ICRA Lanka Limited.
PRINCIPAL ACTIVITIES OF THE COMPANY AND REVIEW OF PERFORMANCE DURING THE YEAR Access Engineering PLC manages a portfolio of diverse range of business including Construction, Construction-Related Material, Property and Automobile. Refer Note 1.3 to the Financial Statements on page 169 for a brief description of the principal activities of the Company and subsidiaries.
Significant changes of the subsidiaries comprises the Company acquiring 51% of the share capital of Harbour Village (Private) Limited, for a cash consideration of Rs. 2,295 Mn on 10th January 2017.
REVIEW OF THE PERFORMANCEReview of the financial and operational performance of the Company and the Group are described in the Joint Statement of Managing Director and Chief Operating Officer and under the review of business operations in Pages 8 to 11. Segment-wise contribution to Group revenue, results, assets and liabilities are provided in Note 4 (Page 174) to the Financial Statements.
FINANCIAL STATEMENTSThe Financial Statements of the Group prepared in-line with Sri Lanka Accounting Standards (SLFRs/LKASs), inclusive of specific disclosures, duly signed by two Directors on behalf of the Board and the Auditors are included in this Annual Report and forms part and parcel hereof.
FINANCIAL RESULTS AND APPROPRIATIONSREVENUERevenue generated by the Company amounted to Rs. 14,787 Mn (2016 – Rs. 11,604 Mn), whilst Group revenue amounted to Rs. 20,448 Mn (2016 – Rs. 17,625 Mn). Contribution to Group revenue, from the different business sectors is provided in Note 4 (page 174) to the Financial Statements.
PROFIT AND APPROPRIATIONSThe profit after tax of the Company was Rs. 2,684 Mn (2016 – Rs. 2,087 Mn), whilst the Group profit attributable to equity holders of the Parent for the year was Rs. 2,708 Mn (2016 – Rs. 2,465 Mn).
DIVIDENDSAn interim dividend of Rs. 0.50 per share was declared for 2016/17 on 2nd November 2016 and was paid in full by the Company on 23rd November 2016. A second interim dividend of Rs. 0.50 per share was declared for 2016/17 on 9th March 2017 and was paid in full by the Company on 27th March 2017.
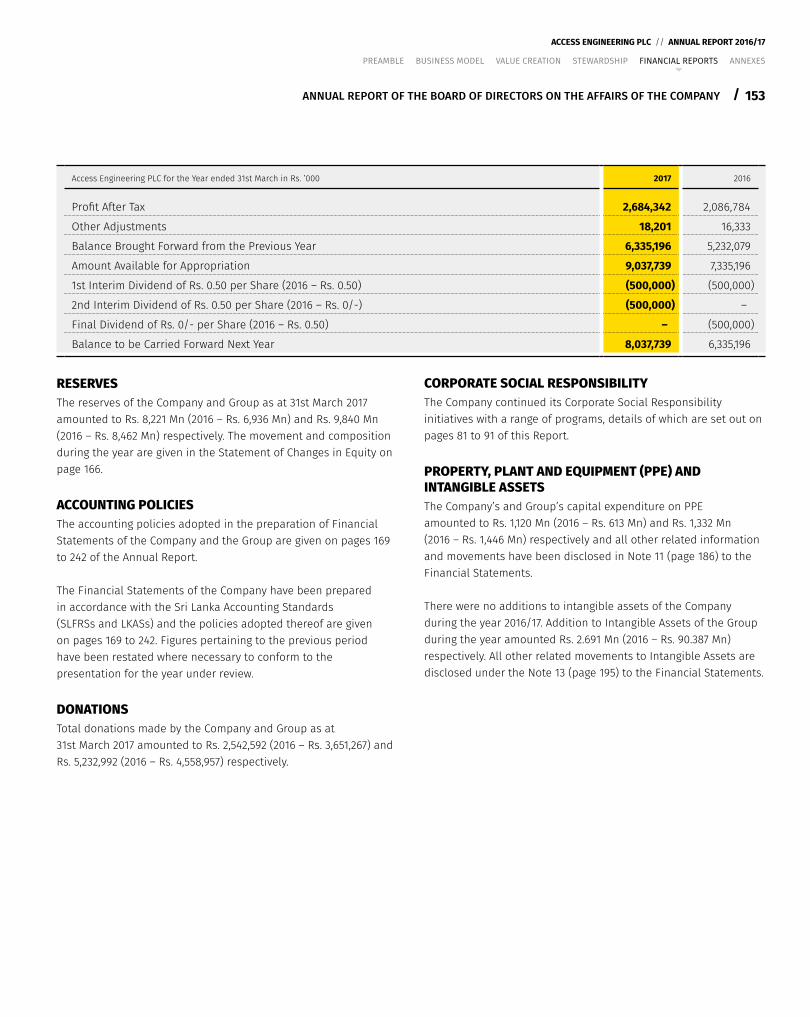
153
ACCESS ENGINEERING PLC // ANNUAL REPORT 2016/17
/
PREAMBLE BUSINESS MODEL VALUE CREATION STEWARDSHIP FINANCIAL REPORTS ANNEXES
ANNUAL REPORT OF THE BOARD OF DIRECTORS ON THE AFFAIRS OF THE COMPANY
Access Engineering PLC for the Year ended 31st March in Rs. ’000 2017 2016
Profit After Tax 2,684,342 2,086,784
Other Adjustments 18,201 16,333
Balance Brought Forward from the Previous Year 6,335,196 5,232,079
Amount Available for Appropriation 9,037,739 7,335,196
1st Interim Dividend of Rs. 0.50 per Share (2016 – Rs. 0.50) (500,000) (500,000)
2nd Interim Dividend of Rs. 0.50 per Share (2016 – Rs. 0/-) (500,000) –
Final Dividend of Rs. 0/- per Share (2016 – Rs. 0.50) – (500,000)
Balance to be Carried Forward Next Year 8,037,739 6,335,196
RESERVESThe reserves of the Company and Group as at 31st March 2017 amounted to Rs. 8,221 Mn (2016 – Rs. 6,936 Mn) and Rs. 9,840 Mn (2016 – Rs. 8,462 Mn) respectively. The movement and composition during the year are given in the Statement of Changes in Equity on page 166.
ACCOUNTING POLICIESThe accounting policies adopted in the preparation of Financial Statements of the Company and the Group are given on pages 169 to 242 of the Annual Report.
The Financial Statements of the Company have been prepared in accordance with the Sri Lanka Accounting Standards (SLFRSs and LKASs) and the policies adopted thereof are given on pages 169 to 242. Figures pertaining to the previous period have been restated where necessary to conform to the presentation for the year under review.
DONATIONSTotal donations made by the Company and Group as at 31st March 2017 amounted to Rs. 2,542,592 (2016 – Rs. 3,651,267) and Rs. 5,232,992 (2016 – Rs. 4,558,957) respectively.
CORPORATE SOCIAL RESPONSIBILITY The Company continued its Corporate Social Responsibility initiatives with a range of programs, details of which are set out on pages 81 to 91 of this Report.
PROPERTY, PLANT AND EQUIPMENT (PPE) AND INTANGIBLE ASSETSThe Company’s and Group’s capital expenditure on PPE amounted to Rs. 1,120 Mn (2016 – Rs. 613 Mn) and Rs. 1,332 Mn (2016 – Rs. 1,446 Mn) respectively and all other related information and movements have been disclosed in Note 11 (page 186) to the Financial Statements.
There were no additions to intangible assets of the Company during the year 2016/17. Addition to Intangible Assets of the Group during the year amounted Rs. 2.691 Mn (2016 – Rs. 90.387 Mn) respectively. All other related movements to Intangible Assets are disclosed under the Note 13 (page 195) to the Financial Statements.
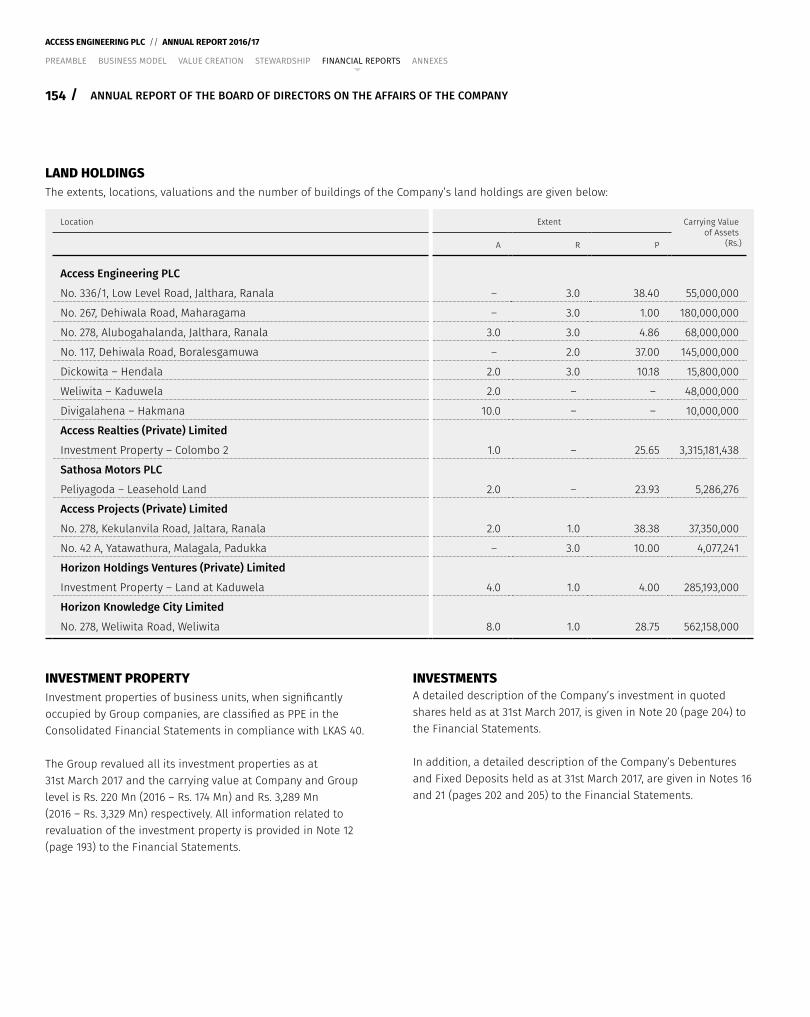
154 /
ACCESS ENGINEERING PLC // ANNUAL REPORT 2016/17
PREAMBLE BUSINESS MODEL VALUE CREATION STEWARDSHIP FINANCIAL REPORTS ANNEXES
ANNUAL REPORT OF THE BOARD OF DIRECTORS ON THE AFFAIRS OF THE COMPANY
LAND HOLDINGSThe extents, locations, valuations and the number of buildings of the Company’s land holdings are given below:
Location Extent Carrying Value of Assets
(Rs.)A R P
Access Engineering PLC
No. 336/1, Low Level Road, Jalthara, Ranala – 3.0 38.40 55,000,000
No. 267, Dehiwala Road, Maharagama – 3.0 1.00 180,000,000
No. 278, Alubogahalanda, Jalthara, Ranala 3.0 3.0 4.86 68,000,000
No. 117, Dehiwala Road, Boralesgamuwa – 2.0 37.00 145,000,000
Dickowita – Hendala 2.0 3.0 10.18 15,800,000
Weliwita – Kaduwela 2.0 – – 48,000,000
Divigalahena – Hakmana 10.0 – – 10,000,000
Access Realties (Private) Limited
Investment Property – Colombo 2 1.0 – 25.65 3,315,181,438
Sathosa Motors PLC
Peliyagoda – Leasehold Land 2.0 – 23.93 5,286,276
Access Projects (Private) Limited
No. 278, Kekulanvila Road, Jaltara, Ranala 2.0 1.0 38.38 37,350,000
No. 42 A, Yatawathura, Malagala, Padukka – 3.0 10.00 4,077,241
Horizon Holdings Ventures (Private) Limited
Investment Property – Land at Kaduwela 4.0 1.0 4.00 285,193,000
Horizon Knowledge City Limited
No. 278, Weliwita Road, Weliwita 8.0 1.0 28.75 562,158,000
INVESTMENT PROPERTYInvestment properties of business units, when significantly occupied by Group companies, are classified as PPE in the Consolidated Financial Statements in compliance with LKAS 40.
The Group revalued all its investment properties as at 31st March 2017 and the carrying value at Company and Group level is Rs. 220 Mn (2016 – Rs. 174 Mn) and Rs. 3,289 Mn (2016 – Rs. 3,329 Mn) respectively. All information related to revaluation of the investment property is provided in Note 12 (page 193) to the Financial Statements.
INVESTMENTSA detailed description of the Company’s investment in quoted shares held as at 31st March 2017, is given in Note 20 (page 204) to the Financial Statements.
In addition, a detailed description of the Company’s Debentures and Fixed Deposits held as at 31st March 2017, are given in Notes 16 and 21 (pages 202 and 205) to the Financial Statements.
155
ACCESS ENGINEERING PLC // ANNUAL REPORT 2016/17
/
PREAMBLE BUSINESS MODEL VALUE CREATION STEWARDSHIP FINANCIAL REPORTS ANNEXES
ANNUAL REPORT OF THE BOARD OF DIRECTORS ON THE AFFAIRS OF THE COMPANY
STATED CAPITALThe Stated Capital of the Company is Rs. 9,000,000,000/- representing 1,000,000,000 ordinary shares (2016 – Rs. 9,000,000,000/- representing 1,000,000,000 ordinary shares), as given in Note 23 (page 206) to the Financial Statements.
DEBENTUREDebentures of the Company is Rs. 5,000 Mn representing 50,000,000 debentures (2016 – Rs. 5,000 Mn of 50,000,000 debentures), as given in Note 25.1 (page 208) to the Financial Statements. The said Debentures have been assigned a Rating of ‘(SL) A+ with a stable outlook’ by ICRA Lanka Limited.
SHARE INFORMATIONSHAREHOLDERS There were 6,119 shareholders registered as at 31st March 2017 (5,757 shareholders as at 31st March 2016). The details of distribution are given on page 36 of this Report.
MAJOR SHAREHOLDERS, DISTRIBUTION SCHEDULE AND OTHER INFORMATIONInformation on the distribution of shareholding, analysis of shareholders, market values per share, earnings, dividends, net assets per share, twenty largest shareholders of the Company, percentage of shares held by the public as per the Listing Rules of the Colombo Stock Exchange are given on pages 36 to 39 under Investor Capital.
THE BOARD OF DIRECTORSDIRECTORS’ RESPONSIBILITY FOR FINANCIAL REPORTINGThe Directors are responsible for the preparation of Financial Statements of the Company to reflect a true and fair view of the state of its affairs. The Directors are of the view that these Financial Statements have been prepared in conformity with requirements of the Sri Lanka Accounting Standards (SLFRSs/LKASs), the Companies Act No. 07 of 2007 and the Listing Rules of the Colombo Stock Exchange.
The Statement of Directors’ Responsibility is given on page 161.
NAMES OF DIRECTORSThe names of the Directors who held office as at the end of the accounting period of 31st March 2017 are given below and their brief profiles appear on pages 94 to 95.
EXECUTIVE DIRECTORSMr. S J S Perera – ChairmanMr. J C Joshua – Managing DirectorMr. D A R Fernando – Chief Operating OfficerMr. S H S MendisMr. S D Munasinghe
NON-EXECUTIVE DIRECTORSMr. R J S Gomez Mr. S D Perera
INDEPENDENT NON-EXECUTIVE DIRECTORSProf. K A M K Ranasinghe Mr. N D Gunaratne Mr. D S Weerakkody
RETIREMENT AND RE-ELECTION OF DIRECTORS In terms of Article 88 (i) of the Articles of Association, Mr. N D Gunaratne shall retire by rotation and being eligible, is recommended by the Board for re-election at the forthcoming Annual General Meeting.
Directors of subsidiary companies are given in the Annexure A of this Report.
REVIEW OF THE PERFORMANCE OF THE BOARDThe performance of the Board has been appraised through a formalized process of individual appraisal by enabling each member to self-appraise on an anonymous basis and it is mentioned in page 121.
156 /
ACCESS ENGINEERING PLC // ANNUAL REPORT 2016/17
PREAMBLE BUSINESS MODEL VALUE CREATION STEWARDSHIP FINANCIAL REPORTS ANNEXES
ANNUAL REPORT OF THE BOARD OF DIRECTORS ON THE AFFAIRS OF THE COMPANY
BOARD COMMITTEESThe Audit Committee, Remuneration Committee, Strategic Planning Committee and the Related Party Transactions Review Committee function as Board Subcommittees, with Directors, who possess the requisite qualifications and experience. The composition of the said Committees as at 31st March 2017 is as follows:
AUDIT COMMITTEEMr. N D Gunaratne – ChairmanProf. K A M K RanasingheMr. D S WeerakkodyMr. S D Perera
REMUNERATION COMMITTEEMr. D S Weerakkody – Chairman Prof. K A M K Ranasinghe Mr. N D Gunaratne Mr. S D Perera
RELATED PARTY TRANSACTION REVIEW COMMITTEEMr. N D Gunaratne – Chairman Prof. K A M K Ranasinghe Mr. D S Weerakkody Mr. D A R Fernando
STRATEGIC PLANNING COMMITTEEMr. S J S Perera – ChairmanMr. J C JoshuaMr. D A R FernandoProf. K A M K Ranasinghe
INTERESTS REGISTERThe Company maintains an Interests Register in terms of the Companies Act No. 07 of 2007, which is deemed to form part and parcel of this Annual Report and is available at the registered head office of the Company for inspection upon request.
All related party transactions, which encompass the transactions of Directors who were directly or indirectly interested in a contract or a related party transaction with the Company during the accounting period are recorded in the Interests Register in due compliance with the applicable rules and regulations of the relevant Regulatory Authorities.
The relevant interests of Directors in the shares of the Company as at 31st March 2017 as recorded in the Interests Register are given in this Report under Directors’ Shareholding.
RELATED PARTY TRANSACTIONSThe Company’s transactions with Related Parties, given in Note 28 to the Financial Statements, have complied with Colombo Stock Exchange Listing Rule 9.3.2 and Code of Best Practices on Related Party Transactions under the Securities Exchange Commission Directive issued under Section 13 (c) of the Securities Exchange Commission Act as declared by the Board of Directors.
DIRECTORS’ REMUNERATIONThe Directors’ remuneration is disclosed under Key Management Personnel Compensation in Note 28.6 to the Financial Statements on page 218.
DIRECTORS’ INTERESTS IN CONTRACTSDirectors’ interests in contracts with the Company are stated below. The Directors have no direct or indirect interest in any other contract or proposed contract with the Company. Except for the transactions referred to in Note 28 (Page 216) to the Financial Statements, the Company did not carry out any transaction with any of the Directors.
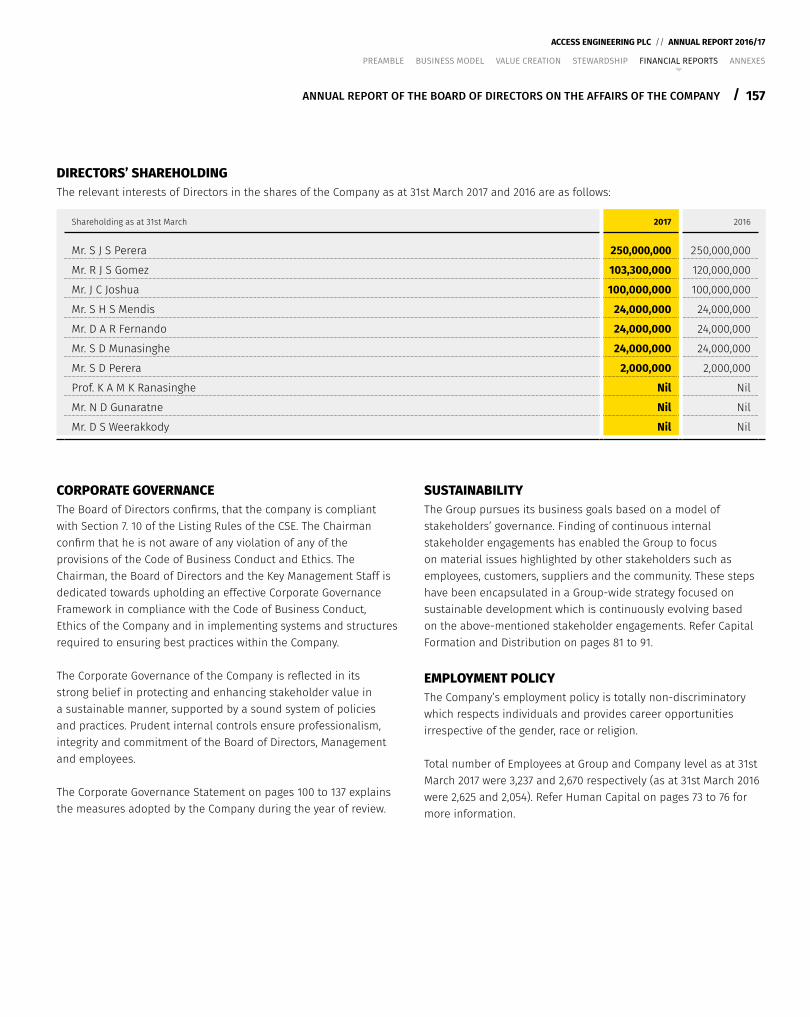
157
ACCESS ENGINEERING PLC // ANNUAL REPORT 2016/17
/
PREAMBLE BUSINESS MODEL VALUE CREATION STEWARDSHIP FINANCIAL REPORTS ANNEXES
ANNUAL REPORT OF THE BOARD OF DIRECTORS ON THE AFFAIRS OF THE COMPANY
DIRECTORS’ SHAREHOLDINGThe relevant interests of Directors in the shares of the Company as at 31st March 2017 and 2016 are as follows:
Shareholding as at 31st March 2017 2016
Mr. S J S Perera 250,000,000 250,000,000
Mr. R J S Gomez 103,300,000 120,000,000
Mr. J C Joshua 100,000,000 100,000,000
Mr. S H S Mendis 24,000,000 24,000,000
Mr. D A R Fernando 24,000,000 24,000,000
Mr. S D Munasinghe 24,000,000 24,000,000
Mr. S D Perera 2,000,000 2,000,000
Prof. K A M K Ranasinghe Nil Nil
Mr. N D Gunaratne Nil Nil
Mr. D S Weerakkody Nil Nil
CORPORATE GOVERNANCE The Board of Directors confirms, that the company is compliant with Section 7. 10 of the Listing Rules of the CSE. The Chairman confirm that he is not aware of any violation of any of the provisions of the Code of Business Conduct and Ethics. The Chairman, the Board of Directors and the Key Management Staff is dedicated towards upholding an effective Corporate Governance Framework in compliance with the Code of Business Conduct, Ethics of the Company and in implementing systems and structures required to ensuring best practices within the Company.
The Corporate Governance of the Company is reflected in its strong belief in protecting and enhancing stakeholder value in a sustainable manner, supported by a sound system of policies and practices. Prudent internal controls ensure professionalism, integrity and commitment of the Board of Directors, Management and employees.
The Corporate Governance Statement on pages 100 to 137 explains the measures adopted by the Company during the year of review.
SUSTAINABILITYThe Group pursues its business goals based on a model of stakeholders’ governance. Finding of continuous internal stakeholder engagements has enabled the Group to focus on material issues highlighted by other stakeholders such as employees, customers, suppliers and the community. These steps have been encapsulated in a Group-wide strategy focused on sustainable development which is continuously evolving based on the above-mentioned stakeholder engagements. Refer Capital Formation and Distribution on pages 81 to 91.
EMPLOYMENT POLICYThe Company’s employment policy is totally non-discriminatory which respects individuals and provides career opportunities irrespective of the gender, race or religion.
Total number of Employees at Group and Company level as at 31st March 2017 were 3,237 and 2,670 respectively (as at 31st March 2016 were 2,625 and 2,054). Refer Human Capital on pages 73 to 76 for more information.
158 /
ACCESS ENGINEERING PLC // ANNUAL REPORT 2016/17
PREAMBLE BUSINESS MODEL VALUE CREATION STEWARDSHIP FINANCIAL REPORTS ANNEXES
SUPPLIER POLICYThe Group applies an overall policy of agreeing and clearly communicating terms of payment as part of the commercial agreements negotiated with suppliers and endeavors to pay for all items properly charged in accordance with these agreed terms. As at 31st March 2017, trade and other payables of the Company and Group amounted to Rs. 5,547 Mn (2016 – Rs. 3,610 Mn) and Rs. 7,852 Mn (2016 – Rs. 5,368 Mn) respectively.
The Group strives to integrate principles of sustainable practices in its value chain through extensive stakeholder consultations, the findings of which are integrated into work plans.
ENVIRONMENTAL PROTECTIONThe Group complies with appropriate environmental laws and regulations to fulfill the best practices applicable in the country of operation. After making adequate enquiries from the Management, the Directors are satisfied that the Company operates in a manner that minimizes the detrimental effects on the environment and provides products and services, that have a beneficial effect on the customers and the communities within, which the Company operates. Refer Environmental Capital on pages 81 to 91 for more information.
RESEARCH AND DEVELOPMENTThe Group has an active approach to research and development and recognizes the contribution that it can make to the Group’s operations. Significant expenditure has taken place over the years and substantial effort will continue to be made to introduce new products and processes and develop existing products and processes to improve operational efficiency.
STATUTORY PAYMENTSThe Directors confirm that to the best of their knowledge, all taxes, duties and levies payable by the Company and its subsidiaries, all contributions, levies and taxes payable on behalf of and in respect of employees of the Company and the Group and all other known statutory dues as were due and payable by the Company and the Group as at the Statement of Financial Position date have been paid or, where relevant provided for, except as specified in Note 29 (page 219) to the Financial Statements covering commitments and contingencies.
CONTINGENT LIABILITIESExcept as disclosed in Note 29 (page 219) to the Financial Statements, there were no material Contingent Liabilities as at reporting date.
RISK MANAGEMENT An ongoing process is in place to identify and manage the risks that are associated with the business and operations of the Company and the Group on a quarter basis. The Directors review this process through the Audit Committee, to identify the competence and success of internal controls.
Specific steps taken by the Company in managing the risks are detailed in the section on Enterprise Risk Management on pages 142 to 150.
EVENTS AFTER THE REPORTING PERIODExcept for the matters disclosed in Note 30 (page 222) to the Financial Statements, there were no material events as at the date of the Auditors’ Report, which require adjustment to or disclosure in the Financial Statements.
ANNUAL REPORT OF THE BOARD OF DIRECTORS ON THE AFFAIRS OF THE COMPANY
159
ACCESS ENGINEERING PLC // ANNUAL REPORT 2016/17
/
PREAMBLE BUSINESS MODEL VALUE CREATION STEWARDSHIP FINANCIAL REPORTS ANNEXES
ANNUAL REPORT OF THE BOARD OF DIRECTORS ON THE AFFAIRS OF THE COMPANY
GOING CONCERNThe Financial Statements are prepared on going concern principles. After making adequate enquires from the Management, the Directors are satisfied that the Company has adequate resources to continue its operations in the foreseeable future.
INDEPENDENT AUDITORS’ REPORTThe Report of the Independent Auditor on the Financial Statements of the Company is given on page 163.
AUDITORSMessrs KPMG, Chartered Accountants served as the Auditor during the year under review and also provided non-audit/consultants services. They do not have any interest in the Company other than that of Auditor and provider of tax-related services.
A total amount of Rs. 4,023,829/- is payable by the Company to the Auditor for the year under review comprising Rs. 2,403,500/- as statutory Audit and related service and Rs. 1,620,329/- for non-audit services.
The Auditors have expressed their willingness to continue in office. A resolution to reappoint the Auditors and to authorize the Directors to determine their remuneration will be proposed at the Annual General Meeting.
COMPLIANCE WITH LAWS AND REGULATIONSTo the best of knowledge and belief of the Directors, the Group/Company has not engaged in any activity, which contravenes laws and regulations of the country.
ANNUAL REPORTThe Board of Directors approved the Consolidated Financial Statements on 30th June 2017. The appropriate number of copies of this Report will be submitted to the Colombo Stock Exchange and to the Sri Lanka Accounting and Auditing Standard Monitoring Board on 8th August 2017.
ANNUAL GENERAL MEETINGThe Sixth Annual General Meeting will be held on 30th August 2017.
The Notice of the Annual General Meeting appears on page 254.
This Annual Report is signed for and on behalf of the Board of Directors by,
S J S Perera Chairman
J C JoshuaManaging Director
P W Corporate Secretarial (Private) LimitedSecretaries30th June 2017Colombo
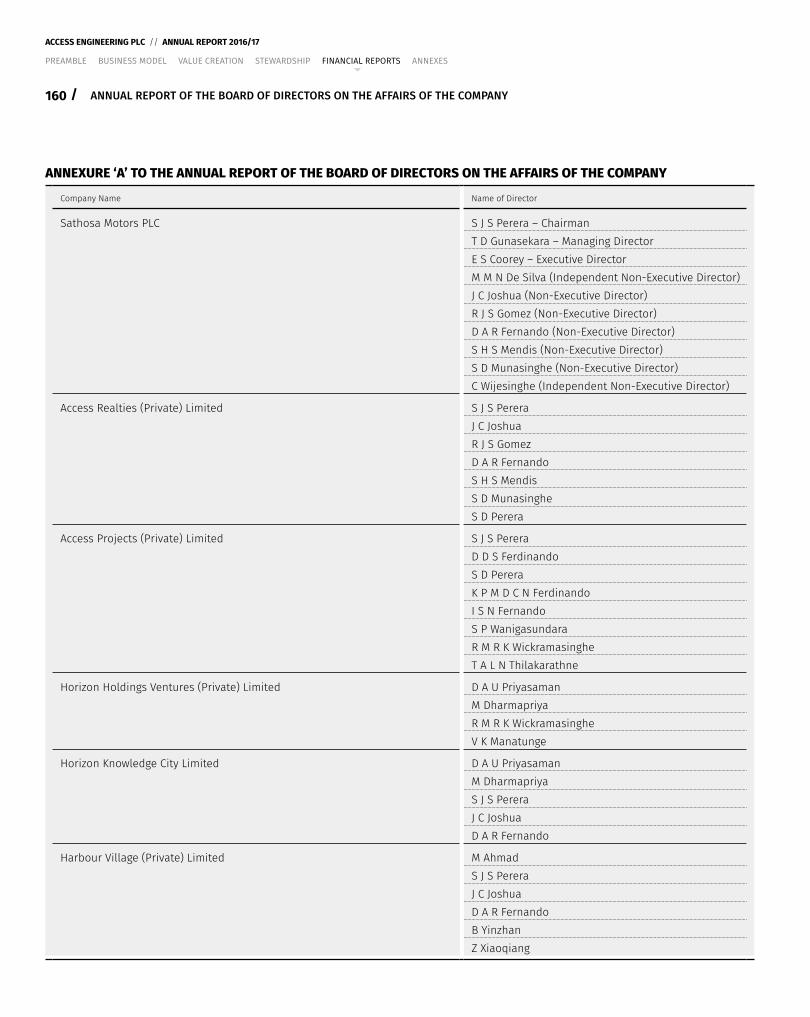
160 /
ACCESS ENGINEERING PLC // ANNUAL REPORT 2016/17
PREAMBLE BUSINESS MODEL VALUE CREATION STEWARDSHIP FINANCIAL REPORTS ANNEXES
ANNEXURE ‘A’ TO THE ANNUAL REPORT OF THE BOARD OF DIRECTORS ON THE AFFAIRS OF THE COMPANY
Company Name Name of Director
Sathosa Motors PLC S J S Perera – ChairmanT D Gunasekara – Managing DirectorE S Coorey – Executive Director M M N De Silva (Independent Non-Executive Director)J C Joshua (Non-Executive Director)R J S Gomez (Non-Executive Director)D A R Fernando (Non-Executive Director)S H S Mendis (Non-Executive Director)S D Munasinghe (Non-Executive Director)C Wijesinghe (Independent Non-Executive Director)
Access Realties (Private) Limited S J S PereraJ C JoshuaR J S GomezD A R FernandoS H S MendisS D MunasingheS D Perera
Access Projects (Private) Limited S J S PereraD D S FerdinandoS D PereraK P M D C N FerdinandoI S N FernandoS P WanigasundaraR M R K WickramasingheT A L N Thilakarathne
Horizon Holdings Ventures (Private) Limited D A U PriyasamanM DharmapriyaR M R K WickramasingheV K Manatunge
Horizon Knowledge City Limited D A U PriyasamanM DharmapriyaS J S PereraJ C JoshuaD A R Fernando
Harbour Village (Private) Limited M AhmadS J S PereraJ C JoshuaD A R FernandoB YinzhanZ Xiaoqiang
ANNUAL REPORT OF THE BOARD OF DIRECTORS ON THE AFFAIRS OF THE COMPANY
161
ACCESS ENGINEERING PLC // ANNUAL REPORT 2016/17
/
PREAMBLE BUSINESS MODEL VALUE CREATION STEWARDSHIP FINANCIAL REPORTS ANNEXES
STATEMENT OF DIRECTORS’ RESPONSIBILITY
THE STATEMENT OF DIRECTORS’ RESPONSIBILITYThis statement sets out the responsibility of the Board of Directors in relation to the Financial Statements of the Company and its subsidiaries. Responsibility of the Auditors in relation to the Financial Statements of the Company and its subsidiaries is set out in the ‘Independent Auditors Report’ given in page 163.
The Directors are responsible for the proper recording and maintenance of books of accounts of all transactions of the Company and its subsidiaries under the provisions of the Companies Act No. 07 of 2007.
In terms of this Act, the Directors are responsible for preparing Financial Statements that give a true and fair view of the state of affairs of the Company and its subsidiaries at the end of each financial year. These statements consist of the Statement of Comprehensive Income giving a true and fair view of the profit or loss of the Company and its subsidiaries for the financial year, the Statement of Financial Position giving a true and fair view of the state of affairs of the Company and its subsidiaries as at the end of the financial year, Statement of Changes in Equity, Statement of Cash Flows and the Notes thereto.
In preparing these Financial Statements the Directors are required to ensure that:
y Appropriate accounting policies have been selected and applied in a consistent manner and material departures, if any, have been disclosed and explained;
y Financial Statements are presented in accordance with Sri Lanka Accounting Standards (SLFRSs/LKASs); and reasonable and prudent judgments and estimates have been made so that the form and substance of transactions are properly reflected;
y Financial Statements provide the information required by and otherwise comply with the Companies Act and the Listing Rules of the Colombo Stock Exchange;
y The Company maintains with reasonable accuracy sufficient accounting records to disclose the financial position of the Company and the Group;
y Financial Statements have been prepared on a going concern basis and they are of the view that sufficient resources are available to justify it.
Further, the Directors confirm that they have taken reasonable measures to safeguard the assets of the Company and the Group and in this regard have established appropriate systems of internal control with a view to preventing and detecting fraud and other irregularities.
The External Auditors were provided with all information and explanations necessary to enable them to form their independent opinion on the Financial Statements.
COMPLIANCE REPORTThe Directors confirm that to the best of their knowledge, all taxes, duties and levies payable by the Company and its subsidiaries, all contributions, levies and taxes payable on behalf of and in respect of the employees of the Company and its subsidiaries and all other known statutory dues as were due and payable by the Company and its subsidiaries as at Reporting Date have been paid or, where relevant, provided for, except as specified in Note 29 to the Financial Statements covering commitments and contingencies.
By Order of the Board,
P W Corporate Secretarial (Private) LimitedSecretaries30th June 2017Colombo
162 /
ACCESS ENGINEERING PLC // ANNUAL REPORT 2016/17
PREAMBLE BUSINESS MODEL VALUE CREATION STEWARDSHIP FINANCIAL REPORTS ANNEXES
DIRECTORS’ STATEMENT ON INTERNAL CONTROL
INTRODUCTION This statement is presented by the Board based on the recommendation made by the ‘Code of Best Practice on Corporate Governance 2013’ jointly issued by the Securities and Exchange Commission of Sri Lanka and The Institute of Chartered Accountants of Sri Lanka.
BOARD’S RESPONSIBILITYThe Board of Directors is responsible for the adequacy and effectiveness of the Group’s system of internal controls. However, such a system is designed to manage the Group’s key exposure areas within an acceptable risk profile rather than eliminating the risk of failure to achieve the Group’s objectives. Accordingly the system of internal controls can only provide a reasonable assurance but not absolute against the material misstatement of management and financial information and records or against financial losses or fraud. The Board has established an ongoing process for identifying, evaluating and managing the significant exposures faced by the Company and this process includes enhancing the system of internal controls as and when there are changes for the business environment or regulatory framework.
KEY INTERNAL CONTROL PROCESSESFollowing features of the System of Internal Control put in place by the Board provide reasonable assurance regarding the reliability of financial reporting. They also ensure the adequacy and effectiveness of the system.
y Committees appointed by the Board to assist them in ensuring the effectiveness of Company’s daily operations and to ensure that these daily operations are within the corporate objectives, strategies and annual budget ratified by the Board.
y Internal Audit Department which is headed by the Chief Internal Auditor carries out periodic audits on an ongoing basis covering all operational projects/units to ensure the effectiveness of the system of internal control. These audits are carried out in accordance with the Annual Audit Plan approved by the Board Audit Committee and findings of the same are submitted to the Board Audit Committee for their review on a quarterly basis. Additionally Special Audits are conducted as and when the need arises and findings of the same are submitted to the Board Audit Committee for their review.
y The Board Audit Committee reviews internal control issues identified by the Internal Audit Department, regulatory bodies and the Management and evaluates the adequacy and effectiveness of the risk management and internal control systems. They also review the internal audit functions with particular emphasis on the scope of audits and quality of internal audits. The minutes of the Board Audit Committee meetings are tabled at the Board meetings of the Company.
y In accordance with Sri Lanka Accounting Standards comprising SLFRS and LKAS, processes that are required to comply with requirements of recognition, measurement, presentation and disclosures were introduced and implemented. Continuous monitoring is in progress to enhance the system’s effectiveness and efficiency.
y The comments made by External Auditors in connection with the internal control system during the financial year 2015/16 were taken into consideration and appropriate steps have been taken to incorporate them where appropriate.
CONFIRMATION STATEMENTBased on the above processes, the Board of Directors confirms that the financial reporting system of the Company has been designed to provide reasonable assurance regarding the reliability of financial reporting and the preparation of Financial Statements for external purposes has been done in accordance with the Sri Lanka Accounting Standards (SLFRSs/LKASs), requirements of the Companies Act No. 07 of 2007 and Listing Rules of the Colombo Stock Exchange.
S J S PereraChairman
J C JoshuaManaging Director
N D GunaratneChairman Audit Committee30th June 2017
163
ACCESS ENGINEERING PLC // ANNUAL REPORT 2016/17
/
PREAMBLE BUSINESS MODEL VALUE CREATION STEWARDSHIP FINANCIAL REPORTS ANNEXES
INDEPENDENT AUDITORS’ REPORT
TO THE SHAREHOLDERS OF ACCESS ENGINEERING PLCREPORT ON THE FINANCIAL STATEMENTSWe have audited the accompanying Financial Statements of Access Engineering PLC, (‘the Company’) and the consolidated Financial Statements of the Company and its subsidiaries (‘the Group’), which comprise the Statement of Financial Position as at 31st March 2017 and the Statement of Profit or Loss and Other Comprehensive Income, Statement of Changes in Equity and Statement of Cash Flows for the year then ended and a summary of significant accounting policies and other explanatory information, set out in pages 169 to 242.
BOARD’S RESPONSIBILITY FOR THE FINANCIAL STATEMENTS The Board of Directors (‘Board’) is responsible for the preparation of these Financial Statements that give a true and fair view in accordance with Sri Lanka Accounting Standards and for such internal control as Board determines is necessary to enable the preparation of Financial Statements that are free from material misstatement, whether due to fraud or error.
AUDITORS’ RESPONSIBILITYOur responsibility is to express an opinion on these Financial Statements based on our audit. We conducted our audit in accordance with Sri Lanka Auditing Standards. Those standards require that we comply with ethical requirements and plan and perform the audit to obtain reasonable assurance about whether the Financial Statements are free from material misstatement.
An audit involves performing procedures to obtain audit evidence about the amounts and disclosures in the Financial Statements. The procedures selected depend on the Auditors’ judgment, including the assessment of the risks of material misstatement of the Financial Statements, whether due to fraud or error. In making those risk assessments, the Auditor considers internal control relevant to the entity’s preparation of the Financial Statements that give a true and fair view in order to design audit procedures that are appropriate in the circumstances, but not for the purpose of expressing an opinion on the effectiveness of the entity’s internal control. An audit also includes evaluating the appropriateness of accounting policies used and the reasonableness of accounting
estimates made by Board, as well as evaluating the overall presentation of the consolidated Financial Statements.
We believe that the audit evidence we have obtained is sufficient and appropriate to provide a basis for our audit opinion.
OPINIONIn our opinion, the Consolidated Financial Statements give a true and fair view of the financial position of the Company and its subsidiaries dealt with thereby as at 31st March 2017 and of its financial performance and cash flows for the year then ended in accordance with Sri Lanka Accounting Standards.
REPORT ON OTHER LEGAL AND REGULATORY REQUIREMENTSAs required by Section 163 (2) of the Companies Act No. 07 of 2007, we state the following:
(a) The basis of opinion and scope and limitations of the audit are as stated above.
(b) In our opinion:
– We have obtained all the information and explanations that were required for the audit and, as far as appears from our examination, proper accounting records have been kept by the Company,
– The Financial Statements of the Company give a true and fair view of its financial position as at 31st March 2017 and of its financial performance and cash flows for the year then ended in accordance with Sri Lanka Accounting Standards,
– The Financial Statements of the Company and the Group comply with the requirements of Sections 151 and 153 of the Companies Act No. 07 of 2007.
Chartered AccountantsColombo30th June 2017
M.R. Mihular FCA P.Y.S. Perera FCA C.P. Jayatilake FCA
T.J.S. Rajakarier FCA W.W.J.C. Perera FCA Ms. S. Joseph FCA
Ms. S.M.B. Jayasekara ACA W.K.D.C. Abeyrathne FCA S.T.D.L. Perera FCA
G.A.U. Karunaratne FCA R.M.D.B. Rajapakse FCA Ms. B.K.D.T.N. Rodrigo FCA
R.H. Rajan ACA
Principals - S.R.I. Perera FCMA(UK), LLB, Attorney-at-Law, H.S. Goonewardene ACA
Ms. C.T.K.N. Perera ACA
KPMG, a Sri Lankan partnership and a member firm
of the KPMG network of independent member firms
affiliated with KPMG International Cooperative
(”KPMG International”), a Swiss entity.
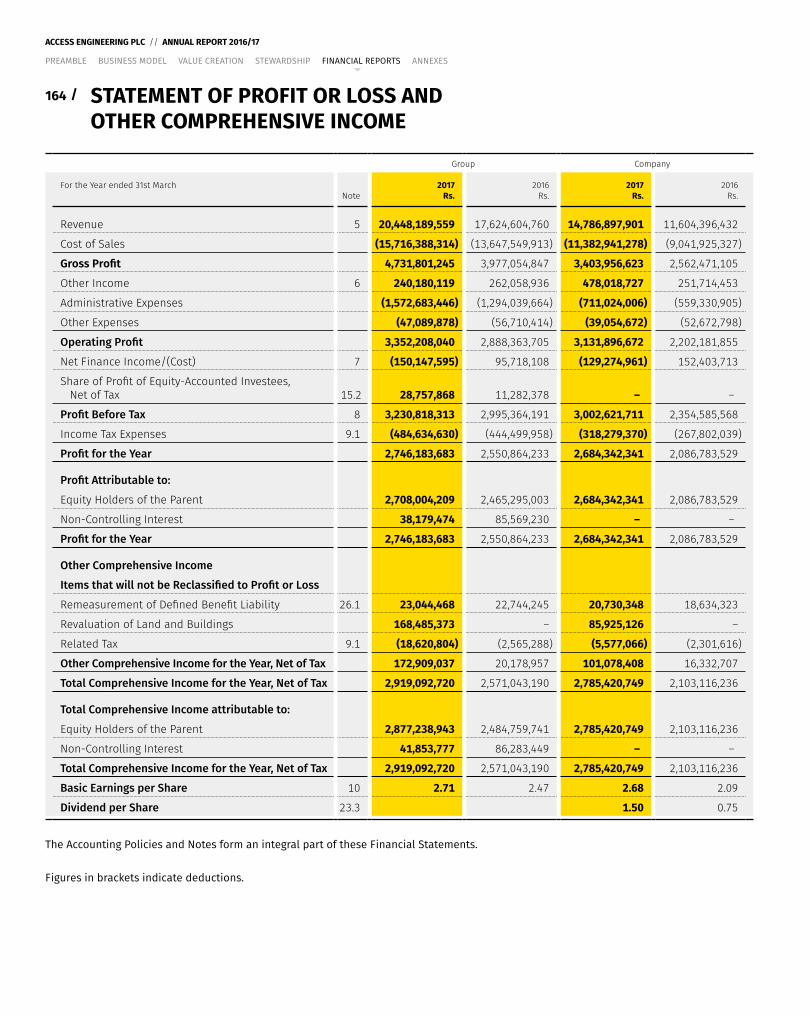
164 /
ACCESS ENGINEERING PLC // ANNUAL REPORT 2016/17
PREAMBLE BUSINESS MODEL VALUE CREATION STEWARDSHIP FINANCIAL REPORTS ANNEXES
Group Company
For the Year ended 31st March Note
2017Rs.
2016Rs.
2017Rs.
2016Rs.
Revenue 5 20,448,189,559 17,624,604,760 14,786,897,901 11,604,396,432
Cost of Sales (15,716,388,314) (13,647,549,913) (11,382,941,278) (9,041,925,327)
Gross Profit 4,731,801,245 3,977,054,847 3,403,956,623 2,562,471,105
Other Income 6 240,180,119 262,058,936 478,018,727 251,714,453
Administrative Expenses (1,572,683,446) (1,294,039,664) (711,024,006) (559,330,905)
Other Expenses (47,089,878) (56,710,414) (39,054,672) (52,672,798)
Operating Profit 3,352,208,040 2,888,363,705 3,131,896,672 2,202,181,855
Net Finance Income/(Cost) 7 (150,147,595) 95,718,108 (129,274,961) 152,403,713
Share of Profit of Equity-Accounted Investees, Net of Tax 15.2 28,757,868 11,282,378 – –
Profit Before Tax 8 3,230,818,313 2,995,364,191 3,002,621,711 2,354,585,568
Income Tax Expenses 9.1 (484,634,630) (444,499,958) (318,279,370) (267,802,039)
Profit for the Year 2,746,183,683 2,550,864,233 2,684,342,341 2,086,783,529
Profit Attributable to:
Equity Holders of the Parent 2,708,004,209 2,465,295,003 2,684,342,341 2,086,783,529
Non-Controlling Interest 38,179,474 85,569,230 – –
Profit for the Year 2,746,183,683 2,550,864,233 2,684,342,341 2,086,783,529
Other Comprehensive Income
Items that will not be Reclassified to Profit or Loss
Remeasurement of Defined Benefit Liability 26.1 23,044,468 22,744,245 20,730,348 18,634,323
Revaluation of Land and Buildings 168,485,373 – 85,925,126 –
Related Tax 9.1 (18,620,804) (2,565,288) (5,577,066) (2,301,616)
Other Comprehensive Income for the Year, Net of Tax 172,909,037 20,178,957 101,078,408 16,332,707
Total Comprehensive Income for the Year, Net of Tax 2,919,092,720 2,571,043,190 2,785,420,749 2,103,116,236
Total Comprehensive Income attributable to:
Equity Holders of the Parent 2,877,238,943 2,484,759,741 2,785,420,749 2,103,116,236
Non-Controlling Interest 41,853,777 86,283,449 – –
Total Comprehensive Income for the Year, Net of Tax 2,919,092,720 2,571,043,190 2,785,420,749 2,103,116,236
Basic Earnings per Share 10 2.71 2.47 2.68 2.09
Dividend per Share 23.3 1.50 0.75
The Accounting Policies and Notes form an integral part of these Financial Statements.
Figures in brackets indicate deductions.
STATEMENT OF PROFIT OR LOSS AND OTHER COMPREHENSIVE INCOME
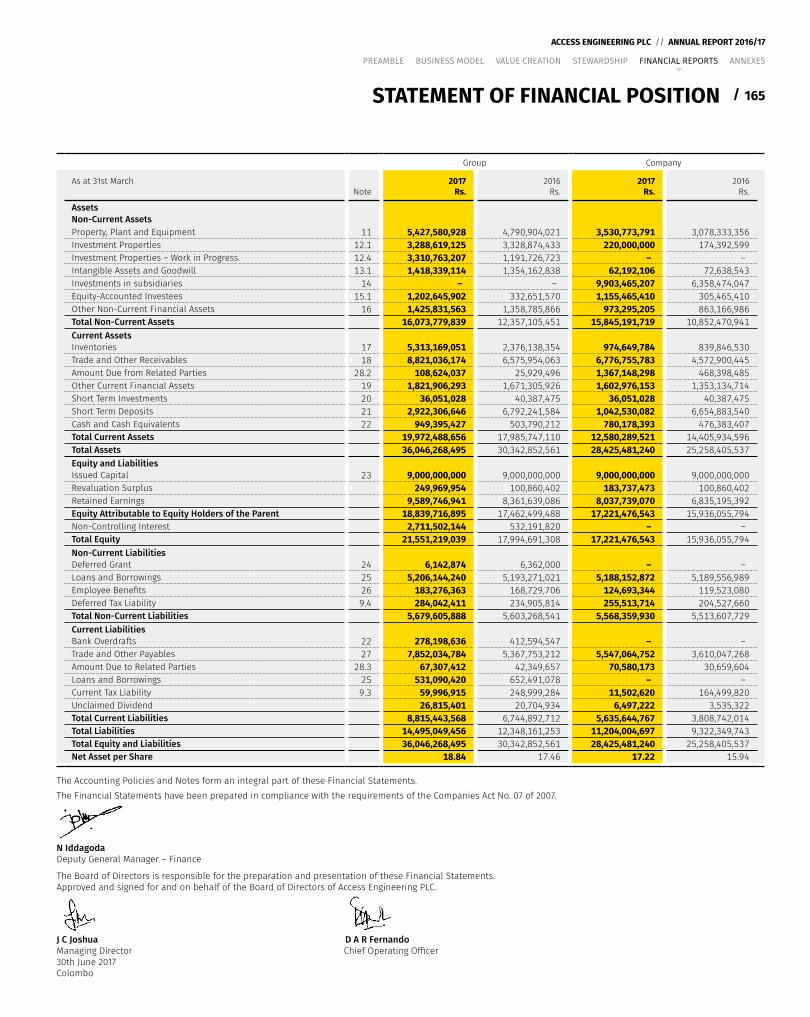
165
ACCESS ENGINEERING PLC // ANNUAL REPORT 2016/17
/
PREAMBLE BUSINESS MODEL VALUE CREATION STEWARDSHIP FINANCIAL REPORTS ANNEXES
Group Company
As at 31st MarchNote
2017Rs.
2016Rs.
2017Rs.
2016Rs.
AssetsNon-Current AssetsProperty, Plant and Equipment 11 5,427,580,928 4,790,904,021 3,530,773,791 3,078,333,356 Investment Properties 12.1 3,288,619,125 3,328,874,433 220,000,000 174,392,599 Investment Properties – Work in Progress 12.4 3,310,763,207 1,191,726,723 – – Intangible Assets and Goodwill 13.1 1,418,339,114 1,354,162,838 62,192,106 72,638,543 Investments in subsidiaries 14 – – 9,903,465,207 6,358,474,047 Equity-Accounted Investees 15.1 1,202,645,902 332,651,570 1,155,465,410 305,465,410 Other Non-Current Financial Assets 16 1,425,831,563 1,358,785,866 973,295,205 863,166,986 Total Non-Current Assets 16,073,779,839 12,357,105,451 15,845,191,719 10,852,470,941 Current AssetsInventories 17 5,313,169,051 2,376,138,354 974,649,784 839,846,530 Trade and Other Receivables 18 8,821,036,174 6,575,954,063 6,776,755,783 4,572,900,445 Amount Due from Related Parties 28.2 108,624,037 25,929,496 1,367,148,298 468,398,485 Other Current Financial Assets 19 1,821,906,293 1,671,305,926 1,602,976,153 1,353,134,714 Short Term Investments 20 36,051,028 40,387,475 36,051,028 40,387,475 Short Term Deposits 21 2,922,306,646 6,792,241,584 1,042,530,082 6,654,883,540 Cash and Cash Equivalents 22 949,395,427 503,790,212 780,178,393 476,383,407 Total Current Assets 19,972,488,656 17,985,747,110 12,580,289,521 14,405,934,596 Total Assets 36,046,268,495 30,342,852,561 28,425,481,240 25,258,405,537 Equity and LiabilitiesIssued Capital 23 9,000,000,000 9,000,000,000 9,000,000,000 9,000,000,000 Revaluation Surplus 249,969,954 100,860,402 183,737,473 100,860,402 Retained Earnings 9,589,746,941 8,361,639,086 8,037,739,070 6,835,195,392 Equity Attributable to Equity Holders of the Parent 18,839,716,895 17,462,499,488 17,221,476,543 15,936,055,794 Non-Controlling Interest 2,711,502,144 532,191,820 – – Total Equity 21,551,219,039 17,994,691,308 17,221,476,543 15,936,055,794 Non-Current LiabilitiesDeferred Grant 24 6,142,874 6,362,000 – – Loans and Borrowings 25 5,206,144,240 5,193,271,021 5,188,152,872 5,189,556,989 Employee Benefits 26 183,276,363 168,729,706 124,693,344 119,523,080 Deferred Tax Liability 9.4 284,042,411 234,905,814 255,513,714 204,527,660 Total Non-Current Liabilities 5,679,605,888 5,603,268,541 5,568,359,930 5,513,607,729 Current LiabilitiesBank Overdrafts 22 278,198,636 412,594,547 – – Trade and Other Payables 27 7,852,034,784 5,367,753,212 5,547,064,752 3,610,047,268 Amount Due to Related Parties 28.3 67,307,412 42,349,657 70,580,173 30,659,604 Loans and Borrowings 25 531,090,420 652,491,078 – – Current Tax Liability 9.3 59,996,915 248,999,284 11,502,620 164,499,820 Unclaimed Dividend 26,815,401 20,704,934 6,497,222 3,535,322 Total Current Liabilities 8,815,443,568 6,744,892,712 5,635,644,767 3,808,742,014 Total Liabilities 14,495,049,456 12,348,161,253 11,204,004,697 9,322,349,743 Total Equity and Liabilities 36,046,268,495 30,342,852,561 28,425,481,240 25,258,405,537 Net Asset per Share 18.84 17.46 17.22 15.94
The Accounting Policies and Notes form an integral part of these Financial Statements.The Financial Statements have been prepared in compliance with the requirements of the Companies Act No. 07 of 2007.
N IddagodaDeputy General Manager – Finance
The Board of Directors is responsible for the preparation and presentation of these Financial Statements.Approved and signed for and on behalf of the Board of Directors of Access Engineering PLC.
J C Joshua D A R FernandoManaging Director Chief Operating Officer30th June 2017Colombo
STATEMENT OF FINANCIAL POSITION
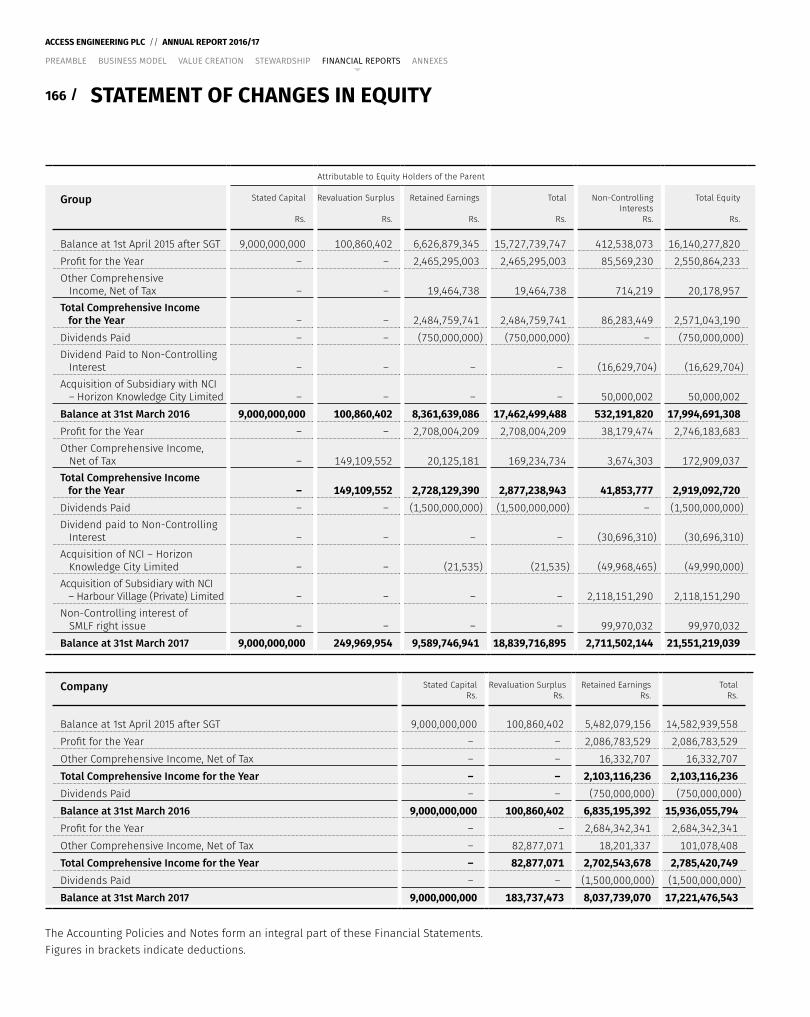
166 /
ACCESS ENGINEERING PLC // ANNUAL REPORT 2016/17
PREAMBLE BUSINESS MODEL VALUE CREATION STEWARDSHIP FINANCIAL REPORTS ANNEXES
Attributable to Equity Holders of the Parent
Group Stated Capital
Rs.
Revaluation Surplus
Rs.
Retained Earnings
Rs.
Total
Rs.
Non-Controlling Interests
Rs.
Total Equity
Rs.
Balance at 1st April 2015 after SGT 9,000,000,000 100,860,402 6,626,879,345 15,727,739,747 412,538,073 16,140,277,820 Profit for the Year – – 2,465,295,003 2,465,295,003 85,569,230 2,550,864,233 Other Comprehensive Income, Net of Tax – – 19,464,738 19,464,738 714,219 20,178,957 Total Comprehensive Income for the Year – – 2,484,759,741 2,484,759,741 86,283,449 2,571,043,190 Dividends Paid – – (750,000,000) (750,000,000) – (750,000,000)Dividend Paid to Non-Controlling Interest – – – – (16,629,704) (16,629,704)Acquisition of Subsidiary with NCI – Horizon Knowledge City Limited – – – – 50,000,002 50,000,002 Balance at 31st March 2016 9,000,000,000 100,860,402 8,361,639,086 17,462,499,488 532,191,820 17,994,691,308 Profit for the Year – – 2,708,004,209 2,708,004,209 38,179,474 2,746,183,683Other Comprehensive Income, Net of Tax – 149,109,552 20,125,181 169,234,734 3,674,303 172,909,037 Total Comprehensive Income for the Year – 149,109,552 2,728,129,390 2,877,238,943 41,853,777 2,919,092,720Dividends Paid – – (1,500,000,000) (1,500,000,000) – (1,500,000,000)Dividend paid to Non-Controlling Interest – – – – (30,696,310) (30,696,310)Acquisition of NCI – Horizon Knowledge City Limited – – (21,535) (21,535) (49,968,465) (49,990,000)Acquisition of Subsidiary with NCI – Harbour Village (Private) Limited – – – – 2,118,151,290 2,118,151,290 Non-Controlling interest of SMLF right issue – – – – 99,970,032 99,970,032 Balance at 31st March 2017 9,000,000,000 249,969,954 9,589,746,941 18,839,716,895 2,711,502,144 21,551,219,039
Company Stated CapitalRs.
Revaluation SurplusRs.
Retained EarningsRs.
TotalRs.
Balance at 1st April 2015 after SGT 9,000,000,000 100,860,402 5,482,079,156 14,582,939,558 Profit for the Year – – 2,086,783,529 2,086,783,529 Other Comprehensive Income, Net of Tax – – 16,332,707 16,332,707 Total Comprehensive Income for the Year – – 2,103,116,236 2,103,116,236 Dividends Paid – – (750,000,000) (750,000,000)Balance at 31st March 2016 9,000,000,000 100,860,402 6,835,195,392 15,936,055,794 Profit for the Year – – 2,684,342,341 2,684,342,341 Other Comprehensive Income, Net of Tax – 82,877,071 18,201,337 101,078,408 Total Comprehensive Income for the Year – 82,877,071 2,702,543,678 2,785,420,749 Dividends Paid – – (1,500,000,000) (1,500,000,000)Balance at 31st March 2017 9,000,000,000 183,737,473 8,037,739,070 17,221,476,543
The Accounting Policies and Notes form an integral part of these Financial Statements.Figures in brackets indicate deductions.
STATEMENT OF CHANGES IN EQUITY
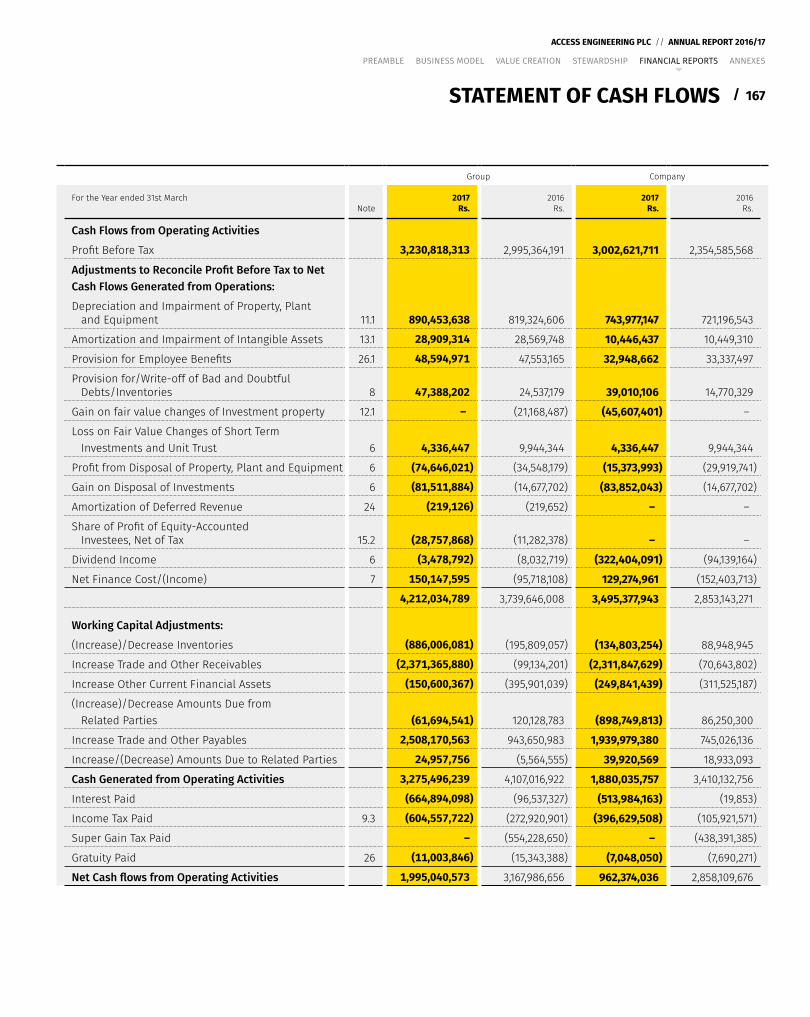
167
ACCESS ENGINEERING PLC // ANNUAL REPORT 2016/17
/
PREAMBLE BUSINESS MODEL VALUE CREATION STEWARDSHIP FINANCIAL REPORTS ANNEXES
Group Company
For the Year ended 31st March Note
2017Rs.
2016Rs.
2017Rs.
2016Rs.
Cash Flows from Operating Activities
Profit Before Tax 3,230,818,313 2,995,364,191 3,002,621,711 2,354,585,568
Adjustments to Reconcile Profit Before Tax to Net Cash Flows Generated from Operations:
Depreciation and Impairment of Property, Plant and Equipment 11.1 890,453,638 819,324,606 743,977,147 721,196,543
Amortization and Impairment of Intangible Assets 13.1 28,909,314 28,569,748 10,446,437 10,449,310
Provision for Employee Benefits 26.1 48,594,971 47,553,165 32,948,662 33,337,497
Provision for/Write-off of Bad and Doubtful Debts/Inventories 8 47,388,202 24,537,179 39,010,106 14,770,329
Gain on fair value changes of Investment property 12.1 – (21,168,487) (45,607,401) –
Loss on Fair Value Changes of Short Term Investments and Unit Trust 6 4,336,447 9,944,344 4,336,447 9,944,344
Profit from Disposal of Property, Plant and Equipment 6 (74,646,021) (34,548,179) (15,373,993) (29,919,741)
Gain on Disposal of Investments 6 (81,511,884) (14,677,702) (83,852,043) (14,677,702)
Amortization of Deferred Revenue 24 (219,126) (219,652) – –
Share of Profit of Equity-Accounted Investees, Net of Tax 15.2 (28,757,868) (11,282,378) – –
Dividend Income 6 (3,478,792) (8,032,719) (322,404,091) (94,139,164)
Net Finance Cost/(Income) 7 150,147,595 (95,718,108) 129,274,961 (152,403,713)
4,212,034,789 3,739,646,008 3,495,377,943 2,853,143,271
Working Capital Adjustments:
(Increase)/Decrease Inventories (886,006,081) (195,809,057) (134,803,254) 88,948,945
Increase Trade and Other Receivables (2,371,365,880) (99,134,201) (2,311,847,629) (70,643,802)
Increase Other Current Financial Assets (150,600,367) (395,901,039) (249,841,439) (311,525,187)
(Increase)/Decrease Amounts Due from Related Parties (61,694,541) 120,128,783 (898,749,813) 86,250,300
Increase Trade and Other Payables 2,508,170,563 943,650,983 1,939,979,380 745,026,136
Increase/(Decrease) Amounts Due to Related Parties 24,957,756 (5,564,555) 39,920,569 18,933,093
Cash Generated from Operating Activities 3,275,496,239 4,107,016,922 1,880,035,757 3,410,132,756
Interest Paid (664,894,098) (96,537,327) (513,984,163) (19,853)
Income Tax Paid 9.3 (604,557,722) (272,920,901) (396,629,508) (105,921,571)
Super Gain Tax Paid – (554,228,650) – (438,391,385)
Gratuity Paid 26 (11,003,846) (15,343,388) (7,048,050) (7,690,271)
Net Cash flows from Operating Activities 1,995,040,573 3,167,986,656 962,374,036 2,858,109,676
STATEMENT OF CASH FLOWS
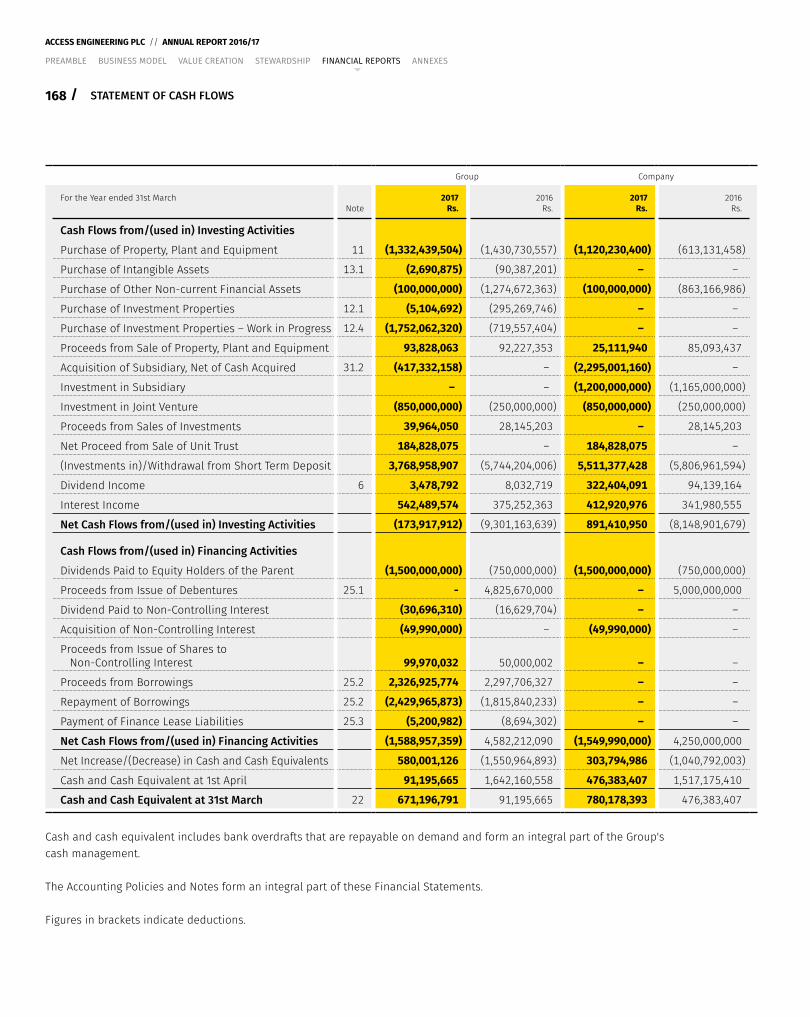
168 /
ACCESS ENGINEERING PLC // ANNUAL REPORT 2016/17
PREAMBLE BUSINESS MODEL VALUE CREATION STEWARDSHIP FINANCIAL REPORTS ANNEXES
Group Company
For the Year ended 31st March Note
2017Rs.
2016Rs.
2017Rs.
2016Rs.
Cash Flows from/(used in) Investing Activities
Purchase of Property, Plant and Equipment 11 (1,332,439,504) (1,430,730,557) (1,120,230,400) (613,131,458)
Purchase of Intangible Assets 13.1 (2,690,875) (90,387,201) – –
Purchase of Other Non-current Financial Assets (100,000,000) (1,274,672,363) (100,000,000) (863,166,986)
Purchase of Investment Properties 12.1 (5,104,692) (295,269,746) – –
Purchase of Investment Properties – Work in Progress 12.4 (1,752,062,320) (719,557,404) – –
Proceeds from Sale of Property, Plant and Equipment 93,828,063 92,227,353 25,111,940 85,093,437
Acquisition of Subsidiary, Net of Cash Acquired 31.2 (417,332,158) – (2,295,001,160) –
Investment in Subsidiary – – (1,200,000,000) (1,165,000,000)
Investment in Joint Venture (850,000,000) (250,000,000) (850,000,000) (250,000,000)
Proceeds from Sales of Investments 39,964,050 28,145,203 – 28,145,203
Net Proceed from Sale of Unit Trust 184,828,075 – 184,828,075 –
(Investments in)/Withdrawal from Short Term Deposit 3,768,958,907 (5,744,204,006) 5,511,377,428 (5,806,961,594)
Dividend Income 6 3,478,792 8,032,719 322,404,091 94,139,164
Interest Income 542,489,574 375,252,363 412,920,976 341,980,555
Net Cash Flows from/(used in) Investing Activities (173,917,912) (9,301,163,639) 891,410,950 (8,148,901,679)
Cash Flows from/(used in) Financing Activities
Dividends Paid to Equity Holders of the Parent (1,500,000,000) (750,000,000) (1,500,000,000) (750,000,000)
Proceeds from Issue of Debentures 25.1 - 4,825,670,000 – 5,000,000,000
Dividend Paid to Non-Controlling Interest (30,696,310) (16,629,704) – –
Acquisition of Non-Controlling Interest (49,990,000) – (49,990,000) –
Proceeds from Issue of Shares to Non-Controlling Interest 99,970,032 50,000,002 – –
Proceeds from Borrowings 25.2 2,326,925,774 2,297,706,327 – –
Repayment of Borrowings 25.2 (2,429,965,873) (1,815,840,233) – –
Payment of Finance Lease Liabilities 25.3 (5,200,982) (8,694,302) – –
Net Cash Flows from/(used in) Financing Activities (1,588,957,359) 4,582,212,090 (1,549,990,000) 4,250,000,000
Net Increase/(Decrease) in Cash and Cash Equivalents 580,001,126 (1,550,964,893) 303,794,986 (1,040,792,003)
Cash and Cash Equivalent at 1st April 91,195,665 1,642,160,558 476,383,407 1,517,175,410
Cash and Cash Equivalent at 31st March 22 671,196,791 91,195,665 780,178,393 476,383,407
Cash and cash equivalent includes bank overdrafts that are repayable on demand and form an integral part of the Group's cash management.
The Accounting Policies and Notes form an integral part of these Financial Statements.
Figures in brackets indicate deductions.
STATEMENT OF CASH FLOWS
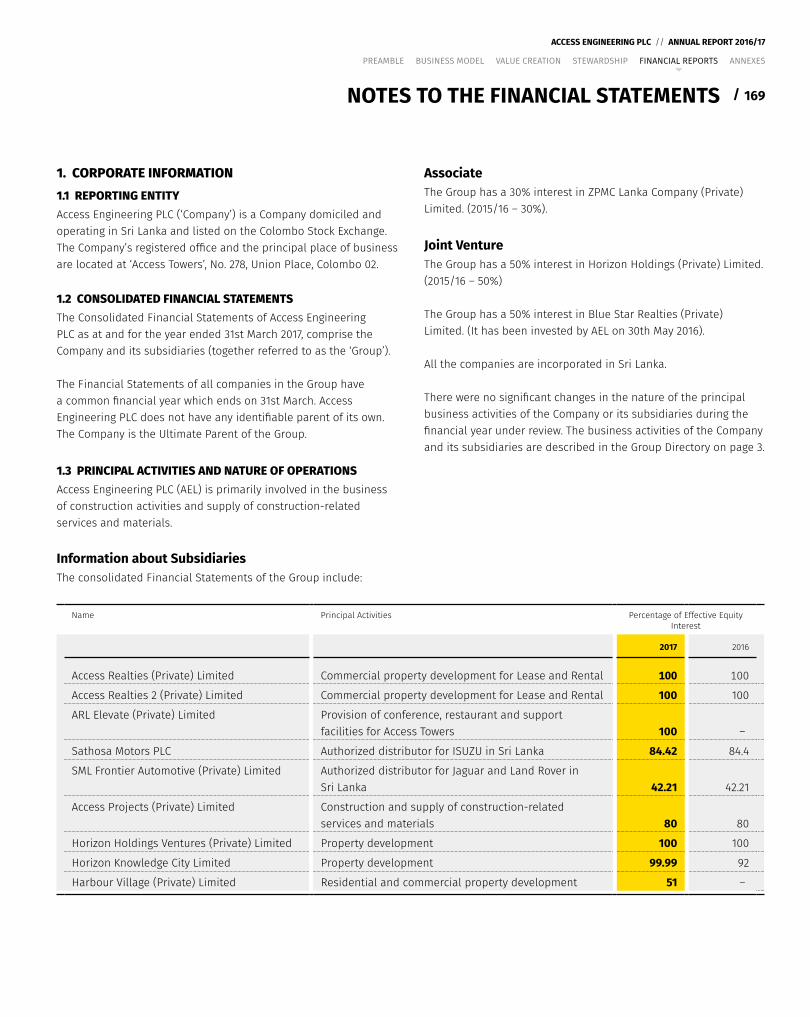
169
ACCESS ENGINEERING PLC // ANNUAL REPORT 2016/17
/
PREAMBLE BUSINESS MODEL VALUE CREATION STEWARDSHIP FINANCIAL REPORTS ANNEXES
1. CORPORATE INFORMATION1.1 REPORTING ENTITYAccess Engineering PLC (‘Company’) is a Company domiciled and operating in Sri Lanka and listed on the Colombo Stock Exchange. The Company’s registered office and the principal place of business are located at ‘Access Towers’, No. 278, Union Place, Colombo 02.
1.2 CONSOLIDATED FINANCIAL STATEMENTSThe Consolidated Financial Statements of Access Engineering PLC as at and for the year ended 31st March 2017, comprise the Company and its subsidiaries (together referred to as the ‘Group’).
The Financial Statements of all companies in the Group have a common financial year which ends on 31st March. Access Engineering PLC does not have any identifiable parent of its own. The Company is the Ultimate Parent of the Group.
1.3 PRINCIPAL ACTIVITIES AND NATURE OF OPERATIONSAccess Engineering PLC (AEL) is primarily involved in the business of construction activities and supply of construction-related services and materials.
Information about SubsidiariesThe consolidated Financial Statements of the Group include:
Name Principal Activities Percentage of Effective Equity Interest
2017 2016
Access Realties (Private) Limited Commercial property development for Lease and Rental 100 100
Access Realties 2 (Private) Limited Commercial property development for Lease and Rental 100 100
ARL Elevate (Private) Limited Provision of conference, restaurant and support facilities for Access Towers 100 –
Sathosa Motors PLC Authorized distributor for ISUZU in Sri Lanka 84.42 84.4
SML Frontier Automotive (Private) Limited Authorized distributor for Jaguar and Land Rover in Sri Lanka 42.21 42.21
Access Projects (Private) Limited Construction and supply of construction-related services and materials 80 80
Horizon Holdings Ventures (Private) Limited Property development 100 100
Horizon Knowledge City Limited Property development 99.99 92
Harbour Village (Private) Limited Residential and commercial property development 51 –
AssociateThe Group has a 30% interest in ZPMC Lanka Company (Private) Limited. (2015/16 – 30%).
Joint VentureThe Group has a 50% interest in Horizon Holdings (Private) Limited. (2015/16 – 50%)
The Group has a 50% interest in Blue Star Realties (Private) Limited. (It has been invested by AEL on 30th May 2016).
All the companies are incorporated in Sri Lanka.
There were no significant changes in the nature of the principal business activities of the Company or its subsidiaries during the financial year under review. The business activities of the Company and its subsidiaries are described in the Group Directory on page 3.
NOTES TO THE FINANCIAL STATEMENTS
170 /
ACCESS ENGINEERING PLC // ANNUAL REPORT 2016/17
PREAMBLE BUSINESS MODEL VALUE CREATION STEWARDSHIP FINANCIAL REPORTS ANNEXES
NOTES TO THE FINANCIAL STATEMENTS
2. BASIS OF PREPARATION2.1 STATEMENT OF COMPLIANCEThe Financial Statements of the Company and those consolidated comprise the Statement of Financial Position, Statement of Profit or Loss and Other Comprehensive Income, Statement of Changes in Equity and Statement of Cash Flows together with the Accounting Policies and Notes (the Financial Statements) have been prepared in accordance with Sri Lanka Accounting Standards (SLFRSs/LKASs) laid down by The Institute of Chartered Accountants of Sri Lanka (CA Sri Lanka) and with the requirement of the Companies Act No. 07 of 2007.
2.2 RESPONSIBILITIES FOR THE FINANCIAL STATEMENTSThe Board of Directors is responsible for the preparation and presentation of the Financial Statements of the Company and its subsidiaries as per provisions of the Companies Act No. 07 of 2007 and the Sri Lanka Accounting Standards (SLFRSs/LKASs).
The Board of Directors acknowledges this responsibility as set out in the Statement of “Directors' Responsibility for Financial Statements” (Refer page 161), ‘Annual Report of the Board of Directors’ (Refer page 152) and in the statement appearing with the Statement of Financial Position (Refer page 165) of this Annual Report.
2.3 COMPONENTS OF FINANCIAL STATEMENTSFinancial Statements include the following components:
y The Statement of Profit or Loss and Other Comprehensive Income: Providing information on the financial performance of the Group and the Company for the year. (Refer page 164)
y The Statement of Financial Position: providing information on the financial position of the Group and the Company as at the year-end. (Refer page 165)
y The Statement of Changes in Equity: Providing information on the movements of stated capital and reserves of the Group and the Company during the year under review. (Refer page 166)
y The Statement of Cash Flows: Providing information on the generating of cash and cash equivalents and utilization of the same. (Refer page 167 to 168)
y Notes to the Financial Statements: Comprising accounting policies and other explanatory notes. (Refer pages 169 to 242)
The Financial Statements for the year ended 31st March 2017, were authorized for issue by the Board of Directors on 30th June 2017.
2.4 BASIS OF MEASUREMENTThese Financial Statements have been prepared on the historical cost basis except for the following material items in the Statement of Financial Position:
y Financial assets and financial liabilities that have been measured at fair value – LKAS 39 (Refer Note 33).
y Employee benefit liability recognized based on actuarial valuation – LKAS 19 (Refer Note 26).
y Land and buildings stated at revalued amounts – LKAS 16 (Refer Note 11).
y Investment property measured at fair value – LKAS 40 (Refer Note 12).
2.5 FUNCTIONAL AND PRESENTATION CURRENCYItems included in the Financial Statements of each entity in the Group are measured using the currency of the primary economic environment in which the entity operates. The Consolidated Financial Statements are presented in Sri Lankan Rupees (Rs.), which is the Group’s functional currency.
2.6 SIGNIFICANT ACCOUNTING JUDGMENTS, ESTIMATES AND ASSUMPTIONSThe preparation of the Group’s Consolidated Financial Statements requires management to make judgments, estimates and assumptions that affect the reported amounts of revenues, expenses, assets and liabilities and the accompanying disclosures and the disclosure of contingent liabilities. Uncertainty about these assumptions and estimates could result in outcomes that require a material adjustment to the carrying amount of assets or liabilities affected in future periods.
In the process of applying the Group’s accounting policies, management has made various judgments. Those which management has assessed to have the most significant effect on the amounts recognized in the Consolidated Financial Statements have been discussed in the individual Notes of the related financial statement line items.
The key assumptions concerning the future and other key sources of estimation uncertainty at the Reporting Date, that have a significant risk of causing a material adjustment to the carrying amounts of assets and liabilities within the next financial year, are also described in the individual Notes of the related Financial Statement line items below. The Group based its assumptions and estimates on parameters available when the Consolidated Financial Statements were prepared. Existing circumstances and
171
ACCESS ENGINEERING PLC // ANNUAL REPORT 2016/17
/
PREAMBLE BUSINESS MODEL VALUE CREATION STEWARDSHIP FINANCIAL REPORTS ANNEXES
NOTES TO THE FINANCIAL STATEMENTS
assumptions about future developments, however, may change due to market changes or circumstances arising that are beyond the control of the Group. Such changes are reflected in the assumptions when they occur.
Management considered the following items, where significant judgments, estimates and assumptions have been used in preparing these Financial Statements:
Going ConcernThe management has made an assessment of its ability to continue as a going concern and is satisfied that it has the resources to continue in business for the foreseeable future. Furthermore, management is not aware of any material uncertainties related to the event of conditions that may cast significant doubt upon the Group’s/Company’s ability to continue as a going concern. Therefore, the Financial Statements continue to be prepared on a going concern basis.
Information about judgments, assumptions and estimation uncertainties that have an effect on the amount recognized and significant risk of resulting in a material adjustment to the consolidated Financial Statements is included in the following Notes:
y Revaluation of Property Plant and Equipment (Note 11)
y Fair value of the investment property (Note 12)
y Impairment of non-financial assets: key assumption underlying recoverable amount (Note 13)
y Measurement of defined benefit obligation: key actuarial assumptions (Note 26)
y Fair value measurement of financial instruments (Note 33)
y Impairment of financial assets: key assumption underlying recoverable amount (Note 34)
y Income Tax (current tax and deferred tax) (Note 9)
y Recognition and measurement of provisions and contingencies: key assumption about the likelihood and magnitude of an outflow of resources (Note 29)
y Acquisition of subsidiary: fair value of the assets acquired and liabilities assumed (Note 31)
2.7 SUMMARY OF SIGNIFICANT ACCOUNTING POLICIESSummary of significant accounting policies have been disclosed along with the relevant individual notes in the subsequent pages.
Those accounting policies presented with each note, have been applied consistently by the Group.
Following accounting policies which have been applied consistently by the Group, are considered to be significant but are not covered in any other sections.
2.7.1. Basis of ConsolidationThe Consolidated Financial Statements comprise the Financial Statements of the Group and its subsidiaries as at 31st March 2017 in terms of the Sri Lanka Accounting Standards SLFRS 10 – 'Consolidated Financial Statements'. Control is achieved when the Group is exposed or has rights, to variable returns from its involvement with the investee and has the ability to affect those returns through its power over the investee. Specifically, the Group controls an investee if and only if, the Group has:
y Power over the investee. (i.e., existing rights that give it the current ability to direct the relevant activities of the investee).
y Exposure or rights, to variable returns from its involvement with the investee.
y The ability to use its power over the investee to affect its returns.
Generally, there is a presumption that a majority of voting rights results in control. To support this presumption and when the Group has less than a majority of the voting or similar rights of an investee, the Group considers all relevant facts and circumstances in assessing whether it has power over an investee, including:
y The contractual arrangement(s) with the other vote holders of the investee.
y Rights arising from other contractual arrangements.
y The Group’s voting rights and potential voting rights.
The Group re-assesses whether or not it controls an investee if facts and circumstances indicate that there are changes to one or more of the three elements of control. Consolidation of a Subsidiary begins when the Group obtains control over the Subsidiary and ceases when the Group loses control of the subsidiary. Assets, liabilities, income and expenses of a Subsidiary acquired or disposed of during the year are included in the Consolidated Financial Statements from the date the Group gains control until the date the Group ceases to control the subsidiary.
Profit or loss and each component of Other Comprehensive Income are attributed to the equity holders of the Parent of the Group and to the non-controlling interests, even if this results in the non-controlling interests having a deficit balance. When necessary, adjustments are made to the Financial Statements of subsidiaries to bring their accounting policies into line with the Group’s accounting policies. All intra-group assets and liabilities, equity,
172 /
ACCESS ENGINEERING PLC // ANNUAL REPORT 2016/17
PREAMBLE BUSINESS MODEL VALUE CREATION STEWARDSHIP FINANCIAL REPORTS ANNEXES
NOTES TO THE FINANCIAL STATEMENTS
income, expenses and cash flows relating to transactions between members of the Group are eliminated in full on consolidation. A change in the ownership interest of a Subsidiary, without a loss of control, is accounted for as an equity transaction.
If the Group loses control over a subsidiary, it derecognizes the related assets (including goodwill), Liabilities, non-controlling interest and other components of equity, while any resultant gain or loss is recognized in profit or loss. Any investment retained is recognized at fair value.
2.7.2 Current Versus Non-current ClassificationThe Group presents assets and liabilities in the Statement of Financial Position based on current/non-current classification. An asset is current when it is:
y Expected to be realized or intended to sold or consumed in the normal operating cycle;
y Held primarily for the purpose of trading;
y Expected to be realized within twelve months after the Reporting Period;
Or y Cash or cash equivalent unless restricted from being exchanged or used to settle a liability for at least twelve months after the Reporting Period.
All other assets are classified as non-current.
A liability is current when:
y It is expected to be settled in the normal operating cycle;
y It is held primarily for the purpose of trading;
y It is due to be settled within twelve months after the Reporting Period;
Or y There is no unconditional right to defer the settlement of the liability for at least twelve months after the Reporting Period.
The Group classifies all other liabilities as non-current. Deferred tax liabilities are classified as non-current liabilities.
2.7.3 Borrowing CostsBorrowing costs directly attributable to the acquisition, construction or production of an asset that necessarily takes a substantial period of time to get ready for its intended use or sale are capitalised as part of the cost of the asset. All other borrowing costs are expensed in the period in which they occur using the EIR method.
Borrowing costs consist of interest and other costs that an entity incurs in connection with the borrowing of funds.
2.7.4 Foreign Currency TransactionsTransactions and BalancesAll foreign exchange transactions are converted to functional currency. For each entity, the Group determines the functional currency and items included in the Financial Statements of each entity are measured using that functional currency.
Transactions in foreign currencies are initially recorded by the Group’s entities at their respective functional currency spot rates at the date the transaction first qualifies for recognition.
Monetary assets and liabilities denominated in foreign currency are retranslated to functional currencies equivalents at the spot rate of exchange at the Reporting Date.
Non-monetary items that are measured in terms of historical cost in a foreign currency are translated using the exchange rates as at the dates of the initial transactions. Non-monetary assets and liabilities are translated using exchange rates that existed when the values were determined.
Foreign currency differences are generally recognized in Statement of Profit or Loss.
2.7.5 Impairment of Non-Financial AssetsThe Group assesses at each Reporting Date whether there is an indication that an asset may be impaired. If any indication exists, the Company estimates the asset’s recoverable amount. An asset’s recoverable amount is the higher of an asset’s or cash-generating unit’s (CGU) fair value less costs to sell and its value in use and is determined for an individual asset, unless the asset does not generate cash inflows that are largely independent of those from other assets or groups of assets. Where the carrying amount of an asset or CGU exceeds its recoverable amount, the asset is considered impaired and is written down to its recoverable amount.
In assessing value in use, the estimated future cash flows are discounted to their present value using a pre-tax discount rate that reflects current market assessments of the time value of money and the risks specific to the asset. In determining fair value less costs to sell, recent market transactions are taken into account, if available. If no such transactions can be identified, an appropriate valuation model is used. These calculations are corroborated
173
ACCESS ENGINEERING PLC // ANNUAL REPORT 2016/17
/
PREAMBLE BUSINESS MODEL VALUE CREATION STEWARDSHIP FINANCIAL REPORTS ANNEXES
NOTES TO THE FINANCIAL STATEMENTS
by valuation multiples, quoted share prices for publicly traded subsidiaries or other available fair value indicators.
Impairment losses are recognized in the Statement of Profit or Loss in those expense categories consistent with the function of the impaired asset, except for a property previously revalued where the revaluation was taken to other comprehensive income. In this case, the impairment is also recognized in other comprehensive income up to the amount of any previous revaluation.
For assets excluding goodwill, an assessment is made at each Reporting Date as to whether there is any indication that previously recognized impairment losses may no longer exist or may have decreased. If such indication exists, the Company estimates the asset’s or cash-generating unit’s recoverable amount. A previously recognized impairment loss is reversed only if there has been a change in the assumptions used to determine the asset’s recoverable amount since the last impairment loss was recognized. The reversal is limited so that the carrying amount of the asset does not exceed its recoverable amount, nor exceed the carrying amount that would have been determined, net of depreciation, had no impairment loss been recognized for the asset in prior years. Such reversal is recognized in the Statement of Profit or Loss unless the asset is carried at a revalued amount, in which case the reversal is treated as a revaluation increase.
2.7.6 Statement of Cash FlowsThe Statement Cash Flow has been prepared using the ‘ indirect method’ in accordance with Sri Lanka Accounting Standard – LKAS 7 on ‘Statement of Cash Flows’. Cash and cash equivalent comprise cash in hand, cash at bank and Short Term investments that are readily convertible to known amount of cash and subject to an insignificant risk of change in value.
Interest received and dividends received are classified as investing cash flows, while dividend paid is classified as financing cash flow and interest paid is classified under the operating cash flows for the purpose of presentation of Statement of Cash Flows.
Bank overdrafts and Short Term borrowings that are re-payable on demand and form an integral part of the Group’s cash management are included as a component of cash and cash equivalent for the purpose of the Statement of Cash Flow.
3. SRI LANKA ACCOUNTING STANDARDS (SLFRSs/LKASs) ISSUED BUT NOT YET EFFECTIVEThe standards and interpretations that are issued but not yet effective up to the date of issuance of the Company Financial Statements are disclosed below. The Group intends to adopt these standards, if applicable, when they become effective.
(a) SLFRS 9 – Financial InstrumentsCA Sri Lanka issued the final version of SLFRS 9 Financial Instruments that replaces LKAS 39 Financial Instruments: Recognition and Measurement. SLFRS 9 brings together all three aspects of the accounting for the financial instruments project: classification and measurement; impairment; and hedge accounting. This standard becomes effective for annual periods beginning on or after 1st January 2018, with early application permitted.
(b) SLFRS 15 – Revenue from Contracts with CustomersSLFRS 15 establishes a five-step model to account for revenue arising from contracts with customers. Under SLFRS 15, revenue is recognized at an amount that reflects the consideration to which an entity expects to be entitled in exchange for transferring goods or services to a customer. The new revenue standard will supersede all current revenue recognition requirements under SLFRS (LKAS 18 – ʻRevenueʼ and LKAS 11 – ʻConstruction Contractsʼ). Either a full retrospective application or a modified retrospective application is required for annual periods beginning on or after 1st January 2018. Early adoption is permitted. The Company is currently in the process of evaluating the potential impact of these standards.
(d) SLFRS 16 – LeasesSLFRS 16 replaces LKAS 17 Leases, IFRIC 4 Determining whether an Arrangement contains a lease, SIC-15 Operating Leases-Incentives and SIC-27 Evaluating the Substance of Transactions Involving the Legal Form of a Lease. SLFRS 16 sets out the principles for the recognition, measurement, presentation and disclosure of leases and requires lessees to account for all leases under a single on-balance sheet model similar to the accounting for finance leases under LKAS 17. This standard is effective for annual periods beginning on or after 1st January 2019. Early application is permitted, but not before an entity applies SLFRS 15. A lessee can choose to apply the standard using either a full retrospective or a modified retrospective approach.
The Group has not reasonably estimated the financial impact as at the date of publication of these Financial Statements.
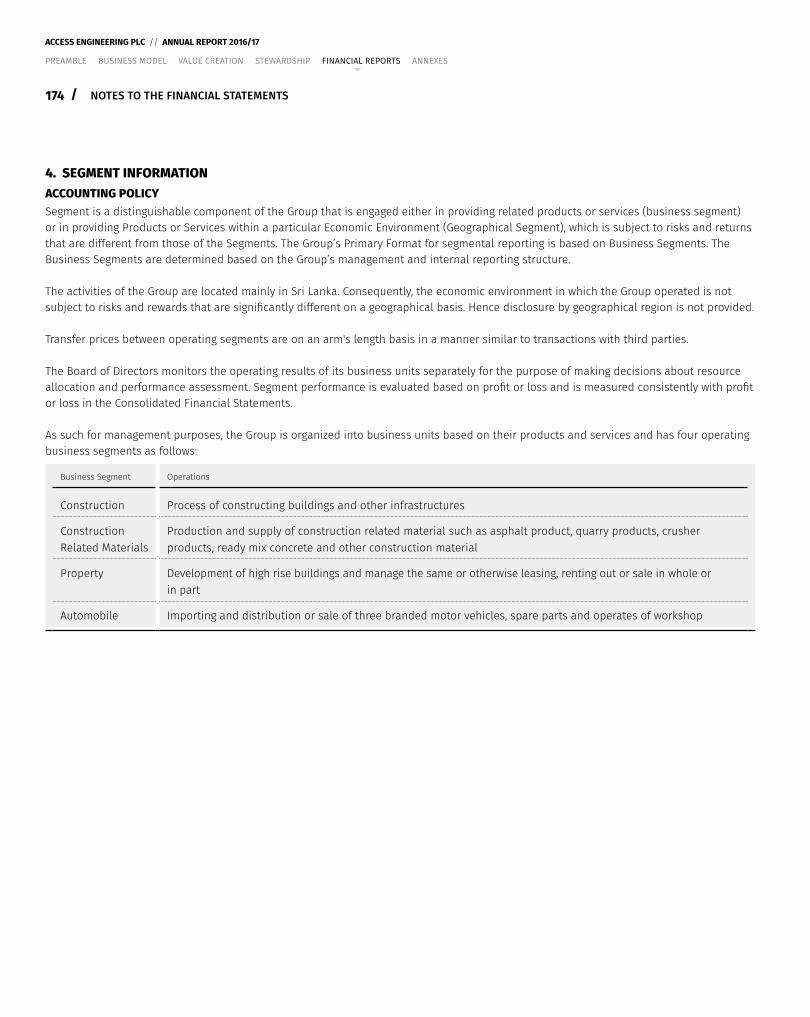
174 /
ACCESS ENGINEERING PLC // ANNUAL REPORT 2016/17
PREAMBLE BUSINESS MODEL VALUE CREATION STEWARDSHIP FINANCIAL REPORTS ANNEXES
NOTES TO THE FINANCIAL STATEMENTS
4. SEGMENT INFORMATIONACCOUNTING POLICYSegment is a distinguishable component of the Group that is engaged either in providing related products or services (business segment) or in providing Products or Services within a particular Economic Environment (Geographical Segment), which is subject to risks and returns that are different from those of the Segments. The Group’s Primary Format for segmental reporting is based on Business Segments. The Business Segments are determined based on the Group’s management and internal reporting structure.
The activities of the Group are located mainly in Sri Lanka. Consequently, the economic environment in which the Group operated is not subject to risks and rewards that are significantly different on a geographical basis. Hence disclosure by geographical region is not provided.
Transfer prices between operating segments are on an arm's length basis in a manner similar to transactions with third parties.
The Board of Directors monitors the operating results of its business units separately for the purpose of making decisions about resource allocation and performance assessment. Segment performance is evaluated based on profit or loss and is measured consistently with profit or loss in the Consolidated Financial Statements.
As such for management purposes, the Group is organized into business units based on their products and services and has four operating business segments as follows:
Business Segment Operations
Construction Process of constructing buildings and other infrastructures
Construction Related Materials
Production and supply of construction related material such as asphalt product, quarry products, crusher products, ready mix concrete and other construction material
Property Development of high rise buildings and manage the same or otherwise leasing, renting out or sale in whole or in part
Automobile Importing and distribution or sale of three branded motor vehicles, spare parts and operates of workshop
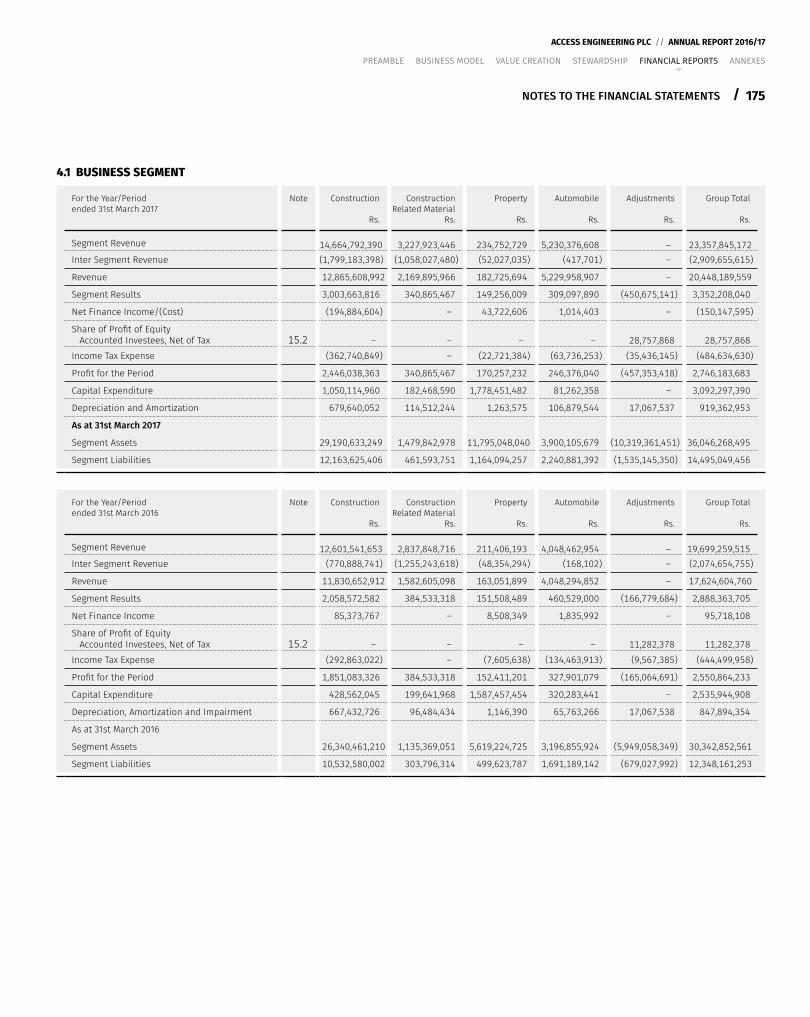
175
ACCESS ENGINEERING PLC // ANNUAL REPORT 2016/17
/
PREAMBLE BUSINESS MODEL VALUE CREATION STEWARDSHIP FINANCIAL REPORTS ANNEXES
NOTES TO THE FINANCIAL STATEMENTS
4.1 BUSINESS SEGMENT
For the Year/Period ended 31st March 2017
Note Construction
Rs.
Construction Related Material
Rs.
Property
Rs.
Automobile
Rs.
Adjustments
Rs.
Group Total
Rs.
Segment Revenue 14,664,792,390 3,227,923,446 234,752,729 5,230,376,608 – 23,357,845,172 Inter Segment Revenue (1,799,183,398) (1,058,027,480) (52,027,035) (417,701) – (2,909,655,615)
Revenue 12,865,608,992 2,169,895,966 182,725,694 5,229,958,907 – 20,448,189,559
Segment Results 3,003,663,816 340,865,467 149,256,009 309,097,890 (450,675,141) 3,352,208,040
Net Finance Income/(Cost) (194,884,604) – 43,722,606 1,014,403 – (150,147,595)
Share of Profit of Equity Accounted Investees, Net of Tax 15.2 – – – – 28,757,868 28,757,868 Income Tax Expense (362,740,849) – (22,721,384) (63,736,253) (35,436,145) (484,634,630)
Profit for the Period 2,446,038,363 340,865,467 170,257,232 246,376,040 (457,353,418) 2,746,183,683
Capital Expenditure 1,050,114,960 182,468,590 1,778,451,482 81,262,358 – 3,092,297,390
Depreciation and Amortization 679,640,052 114,512,244 1,263,575 106,879,544 17,067,537 919,362,953
As at 31st March 2017
Segment Assets 29,190,633,249 1,479,842,978 11,795,048,040 3,900,105,679 (10,319,361,451) 36,046,268,495
Segment Liabilities 12,163,625,406 461,593,751 1,164,094,257 2,240,881,392 (1,535,145,350) 14,495,049,456
For the Year/Period ended 31st March 2016
Note Construction
Rs.
Construction Related Material
Rs.
Property
Rs.
Automobile
Rs.
Adjustments
Rs.
Group Total
Rs.
Segment Revenue 12,601,541,653 2,837,848,716 211,406,193 4,048,462,954 – 19,699,259,515Inter Segment Revenue (770,888,741) (1,255,243,618) (48,354,294) (168,102) – (2,074,654,755)
Revenue 11,830,652,912 1,582,605,098 163,051,899 4,048,294,852 – 17,624,604,760
Segment Results 2,058,572,582 384,533,318 151,508,489 460,529,000 (166,779,684) 2,888,363,705
Net Finance Income 85,373,767 – 8,508,349 1,835,992 – 95,718,108
Share of Profit of Equity Accounted Investees, Net of Tax 15.2 – – – – 11,282,378 11,282,378 Income Tax Expense (292,863,022) – (7,605,638) (134,463,913) (9,567,385) (444,499,958)
Profit for the Period 1,851,083,326 384,533,318 152,411,201 327,901,079 (165,064,691) 2,550,864,233
Capital Expenditure 428,562,045 199,641,968 1,587,457,454 320,283,441 – 2,535,944,908
Depreciation, Amortization and Impairment 667,432,726 96,484,434 1,146,390 65,763,266 17,067,538 847,894,354
As at 31st March 2016
Segment Assets 26,340,461,210 1,135,369,051 5,619,224,725 3,196,855,924 (5,949,058,349) 30,342,852,561
Segment Liabilities 10,532,580,002 303,796,314 499,623,787 1,691,189,142 (679,027,992) 12,348,161,253
176 /
ACCESS ENGINEERING PLC // ANNUAL REPORT 2016/17
PREAMBLE BUSINESS MODEL VALUE CREATION STEWARDSHIP FINANCIAL REPORTS ANNEXES
NOTES TO THE FINANCIAL STATEMENTS
DETAILED INFORMATION ON STATEMENT OF PROFIT OR LOSS AND OCI ITEMS5. REVENUEACCOUNTING POLICYRevenue represents the amounts derived from the provision of services, which fall within the Group’s ordinary activities net of trade discounts and turnover related taxes.
Revenue Recognition Revenue is recognized to the extent that it is probable that the economic benefits will flow to the Group and the revenue and the associated costs incurred or to be incurred can be reliably measured, regardless of when the payment is received. Revenue is measured at the fair value of the consideration received or receivable, net of trade discounts and sales taxes and after eliminating sales within the Group.
The following specific criteria are used for the purpose of recognition of revenue:
Construction ContractsContract revenue includes the initial amount agreed in the contract plus any variations in contract work, claims and incentive payments, to the extent that it is probable that they will result in revenue and can be measured reliably.
If the outcome of a construction contract can be estimated reliably, then contract revenue is recognized in profit or loss in proportion to the stage of completion of the contract. The stage of completion is assessed with reference to surveys of work performed. Otherwise, contract revenue is recognized only to the extent of contract costs incurred that are likely to be recoverable.
Contract expenses are recognized as incurred unless they create an asset related to future contract activity. An expected loss on a contract is recognized immediately in profit or loss.
Sale of GoodsRevenue from the sale of goods in the course of ordinary activities is measured at the fair value of the consideration received or receivable, net of returns, trade discounts and volume rebates. Revenue is recognized when persuasive evidence exists, usually in the form of an executed sales agreement, that the significant risks and rewards of ownership have been transferred to the buyer, recovery of the consideration is probable, the associated costs and possible return of goods can be estimated reliably, there is no continuing management involvement with the goods and the amount of revenue can be measured reliably.
Rental IncomeRental income arising from operating leases on investment properties is recognized in Statement of Profit or Loss on a straight-line basis over the term of the lease.
Rendering of ServicesRevenue for services rendered is recognized in the Statement of Profit or Loss once all significant performance obligations have been completed.
Agency Commissions and Hire IncomeAgency Commissions are recognized in Statement of Profit or Loss on an accrual basis.
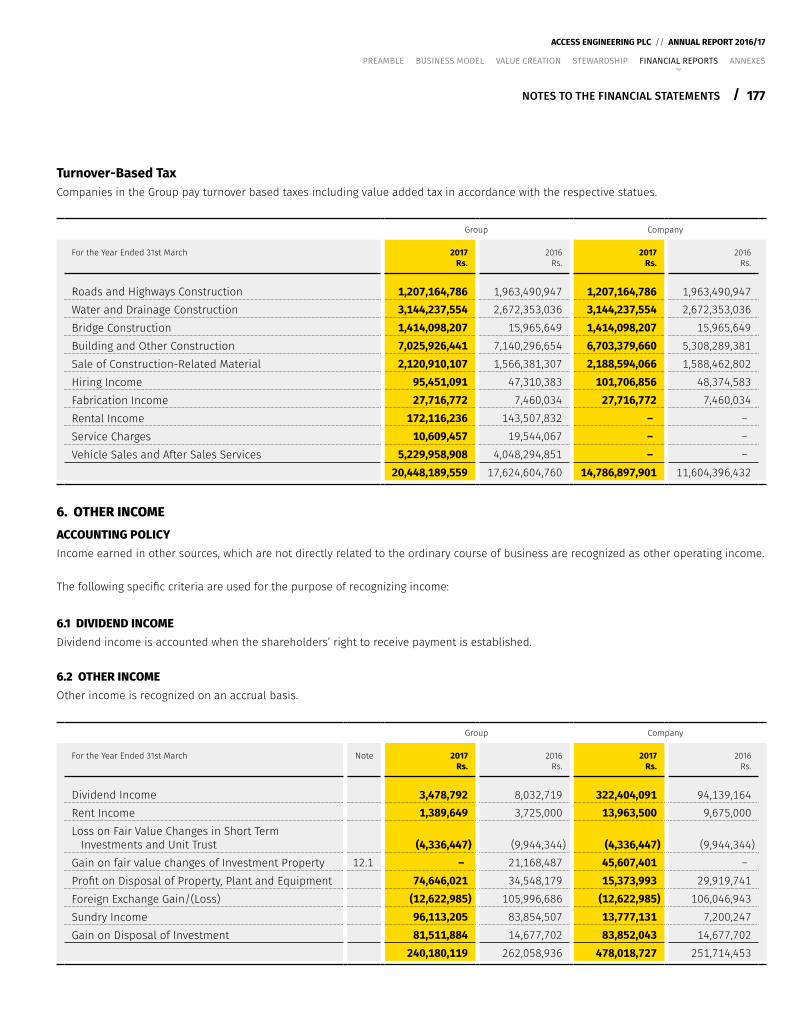
177
ACCESS ENGINEERING PLC // ANNUAL REPORT 2016/17
/
PREAMBLE BUSINESS MODEL VALUE CREATION STEWARDSHIP FINANCIAL REPORTS ANNEXES
NOTES TO THE FINANCIAL STATEMENTS
Turnover-Based TaxCompanies in the Group pay turnover based taxes including value added tax in accordance with the respective statues.
Group Company
For the Year Ended 31st March 2017Rs.
2016Rs.
2017Rs.
2016Rs.
Roads and Highways Construction 1,207,164,786 1,963,490,947 1,207,164,786 1,963,490,947 Water and Drainage Construction 3,144,237,554 2,672,353,036 3,144,237,554 2,672,353,036 Bridge Construction 1,414,098,207 15,965,649 1,414,098,207 15,965,649 Building and Other Construction 7,025,926,441 7,140,296,654 6,703,379,660 5,308,289,381 Sale of Construction-Related Material 2,120,910,107 1,566,381,307 2,188,594,066 1,588,462,802 Hiring Income 95,451,091 47,310,383 101,706,856 48,374,583 Fabrication Income 27,716,772 7,460,034 27,716,772 7,460,034 Rental Income 172,116,236 143,507,832 – – Service Charges 10,609,457 19,544,067 – – Vehicle Sales and After Sales Services 5,229,958,908 4,048,294,851 – –
20,448,189,559 17,624,604,760 14,786,897,901 11,604,396,432
6. OTHER INCOMEACCOUNTING POLICYIncome earned in other sources, which are not directly related to the ordinary course of business are recognized as other operating income.
The following specific criteria are used for the purpose of recognizing income:
6.1 DIVIDEND INCOMEDividend income is accounted when the shareholders’ right to receive payment is established.
6.2 OTHER INCOMEOther income is recognized on an accrual basis.
Group Company
For the Year Ended 31st March Note 2017Rs.
2016Rs.
2017Rs.
2016Rs.
Dividend Income 3,478,792 8,032,719 322,404,091 94,139,164 Rent Income 1,389,649 3,725,000 13,963,500 9,675,000 Loss on Fair Value Changes in Short Term Investments and Unit Trust (4,336,447) (9,944,344) (4,336,447) (9,944,344)Gain on fair value changes of Investment Property 12.1 – 21,168,487 45,607,401 – Profit on Disposal of Property, Plant and Equipment 74,646,021 34,548,179 15,373,993 29,919,741 Foreign Exchange Gain/(Loss) (12,622,985) 105,996,686 (12,622,985) 106,046,943 Sundry Income 96,113,205 83,854,507 13,777,131 7,200,247 Gain on Disposal of Investment 81,511,884 14,677,702 83,852,043 14,677,702
240,180,119 262,058,936 478,018,727 251,714,453
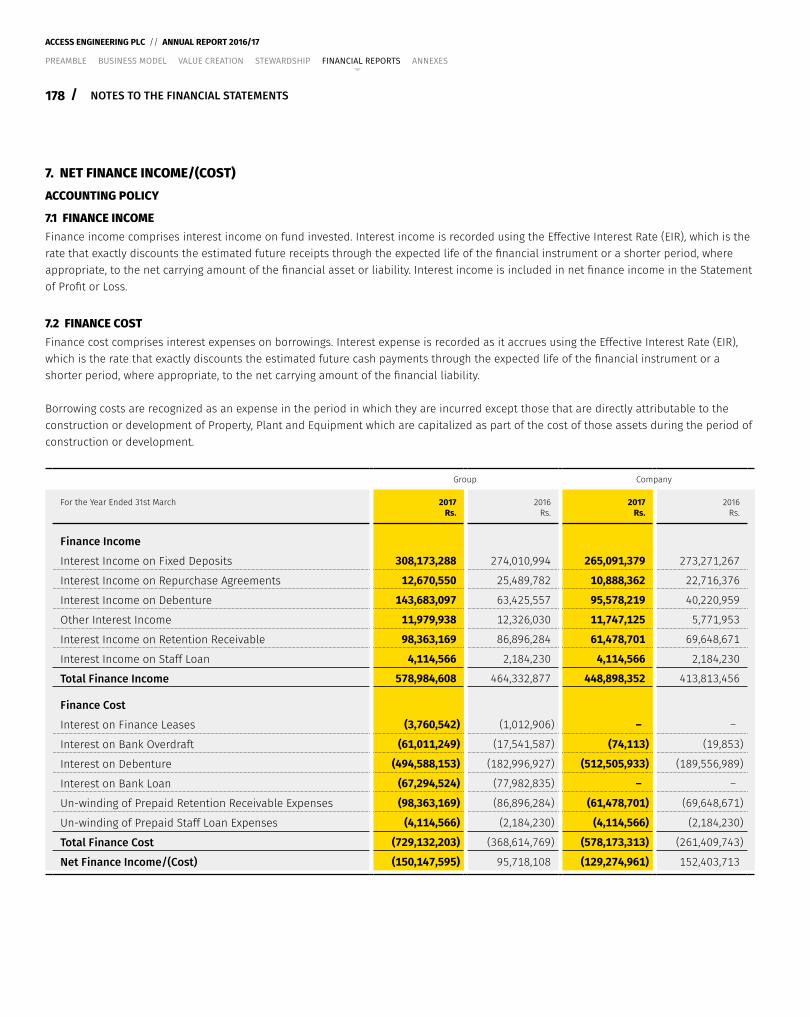
178 /
ACCESS ENGINEERING PLC // ANNUAL REPORT 2016/17
PREAMBLE BUSINESS MODEL VALUE CREATION STEWARDSHIP FINANCIAL REPORTS ANNEXES
NOTES TO THE FINANCIAL STATEMENTS
7. NET FINANCE INCOME/(COST)ACCOUNTING POLICY
7.1 FINANCE INCOMEFinance income comprises interest income on fund invested. Interest income is recorded using the Effective Interest Rate (EIR), which is the rate that exactly discounts the estimated future receipts through the expected life of the financial instrument or a shorter period, where appropriate, to the net carrying amount of the financial asset or liability. Interest income is included in net finance income in the Statement of Profit or Loss.
7.2 FINANCE COSTFinance cost comprises interest expenses on borrowings. Interest expense is recorded as it accrues using the Effective Interest Rate (EIR), which is the rate that exactly discounts the estimated future cash payments through the expected life of the financial instrument or a shorter period, where appropriate, to the net carrying amount of the financial liability.
Borrowing costs are recognized as an expense in the period in which they are incurred except those that are directly attributable to the construction or development of Property, Plant and Equipment which are capitalized as part of the cost of those assets during the period of construction or development.
Group Company
For the Year Ended 31st March 2017Rs.
2016Rs.
2017Rs.
2016Rs.
Finance Income
Interest Income on Fixed Deposits 308,173,288 274,010,994 265,091,379 273,271,267
Interest Income on Repurchase Agreements 12,670,550 25,489,782 10,888,362 22,716,376
Interest Income on Debenture 143,683,097 63,425,557 95,578,219 40,220,959
Other Interest Income 11,979,938 12,326,030 11,747,125 5,771,953
Interest Income on Retention Receivable 98,363,169 86,896,284 61,478,701 69,648,671
Interest Income on Staff Loan 4,114,566 2,184,230 4,114,566 2,184,230
Total Finance Income 578,984,608 464,332,877 448,898,352 413,813,456
Finance Cost
Interest on Finance Leases (3,760,542) (1,012,906) – –
Interest on Bank Overdraft (61,011,249) (17,541,587) (74,113) (19,853)
Interest on Debenture (494,588,153) (182,996,927) (512,505,933) (189,556,989)
Interest on Bank Loan (67,294,524) (77,982,835) – –
Un-winding of Prepaid Retention Receivable Expenses (98,363,169) (86,896,284) (61,478,701) (69,648,671)
Un-winding of Prepaid Staff Loan Expenses (4,114,566) (2,184,230) (4,114,566) (2,184,230)
Total Finance Cost (729,132,203) (368,614,769) (578,173,313) (261,409,743)
Net Finance Income/(Cost) (150,147,595) 95,718,108 (129,274,961) 152,403,713
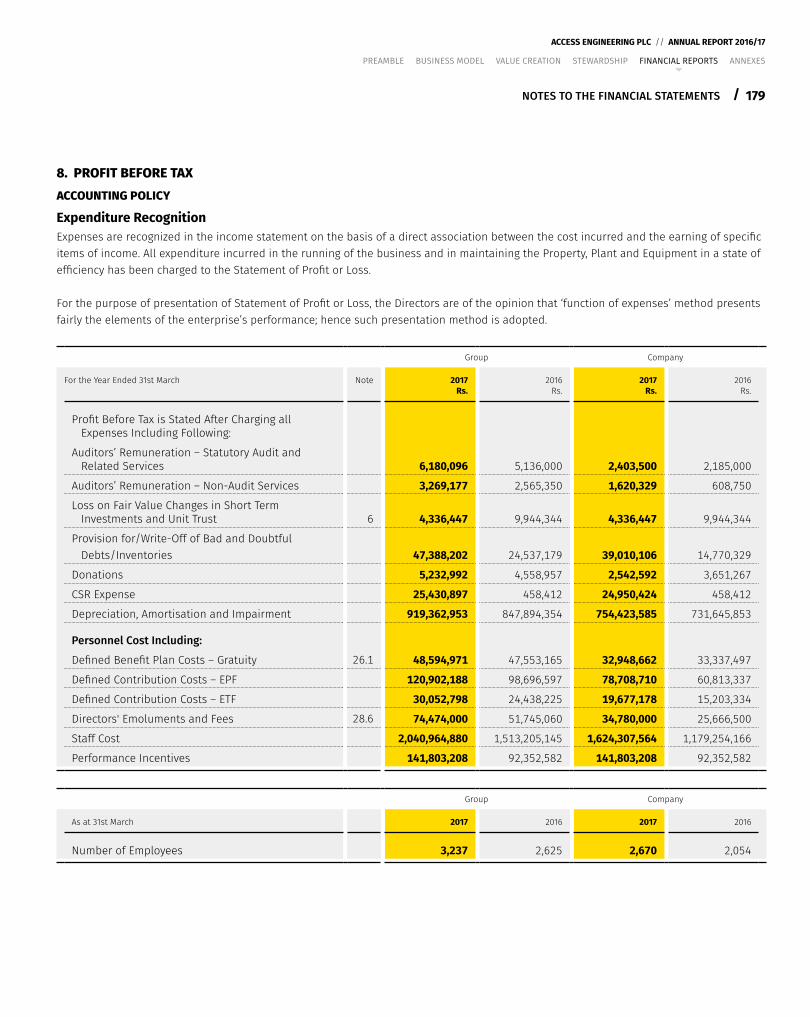
179
ACCESS ENGINEERING PLC // ANNUAL REPORT 2016/17
/
PREAMBLE BUSINESS MODEL VALUE CREATION STEWARDSHIP FINANCIAL REPORTS ANNEXES
NOTES TO THE FINANCIAL STATEMENTS
8. PROFIT BEFORE TAXACCOUNTING POLICY
Expenditure RecognitionExpenses are recognized in the income statement on the basis of a direct association between the cost incurred and the earning of specific items of income. All expenditure incurred in the running of the business and in maintaining the Property, Plant and Equipment in a state of efficiency has been charged to the Statement of Profit or Loss.
For the purpose of presentation of Statement of Profit or Loss, the Directors are of the opinion that ‘function of expenses’ method presents fairly the elements of the enterprise’s performance; hence such presentation method is adopted.
Group Company
For the Year Ended 31st March Note 2017Rs.
2016Rs.
2017Rs.
2016Rs.
Profit Before Tax is Stated After Charging all Expenses Including Following:
Auditors’ Remuneration – Statutory Audit and Related Services 6,180,096 5,136,000 2,403,500 2,185,000
Auditors’ Remuneration – Non-Audit Services 3,269,177 2,565,350 1,620,329 608,750
Loss on Fair Value Changes in Short Term Investments and Unit Trust 6 4,336,447 9,944,344 4,336,447 9,944,344
Provision for/Write-Off of Bad and Doubtful Debts/Inventories 47,388,202 24,537,179 39,010,106 14,770,329
Donations 5,232,992 4,558,957 2,542,592 3,651,267
CSR Expense 25,430,897 458,412 24,950,424 458,412
Depreciation, Amortisation and Impairment 919,362,953 847,894,354 754,423,585 731,645,853
Personnel Cost Including:
Defined Benefit Plan Costs – Gratuity 26.1 48,594,971 47,553,165 32,948,662 33,337,497
Defined Contribution Costs – EPF 120,902,188 98,696,597 78,708,710 60,813,337
Defined Contribution Costs – ETF 30,052,798 24,438,225 19,677,178 15,203,334
Directors' Emoluments and Fees 28.6 74,474,000 51,745,060 34,780,000 25,666,500
Staff Cost 2,040,964,880 1,513,205,145 1,624,307,564 1,179,254,166
Performance Incentives 141,803,208 92,352,582 141,803,208 92,352,582
Group Company
As at 31st March 2017 2016 2017 2016
Number of Employees 3,237 2,625 2,670 2,054

180 /
ACCESS ENGINEERING PLC // ANNUAL REPORT 2016/17
PREAMBLE BUSINESS MODEL VALUE CREATION STEWARDSHIP FINANCIAL REPORTS ANNEXES
NOTES TO THE FINANCIAL STATEMENTS
9. INCOME TAXACCOUNTING POLICYIncome tax expense comprises current and deferred tax. It is recognized in profit or loss except to the extent that it relates to a business combination or items recognized directly in equity or in Other Comprehensive Income.
Current TaxCurrent tax comprises the expected tax payable or receivable on the taxable income or loss for the year and any adjustment to the tax payable or receivable in respect of previous years. The amount of current tax payable or receivable is the best estimate of the tax amount expected to be paid or received that reflects uncertainty related to income taxes, if any. It is measured using tax rates enacted or substantively enacted at the Reporting Date. Current tax also includes any tax arising from dividends.
Current tax assets and liabilities are offset only if certain criteria are met.
Current tax relating to items recognized directly in equity is recognized in equity and not in the Statement of Profit or Loss. Management periodically evaluates positions taken in the tax returns with respect to situations in which applicable tax regulations are subject to interpretation and establishes provisions where appropriate.
Deferred TaxationDeferred tax is recognized in respect of temporary differences between the carrying amounts of assets and liabilities for financial reporting purposes and the amounts used for taxation purposes. Deferred tax is not recognized for:
y temporary differences on the initial recognition of assets or liabilities in a transaction that is not a business combination and that affects neither accounting nor taxable profit or loss;
y temporary differences related to investments in Subsidiaries, associates and joint arrangements to the extent that the Group is able to control the timing of the reversal of the temporary differences and it is probable that they will not reverse in the foreseeable future; and
y taxable temporary differences arising on the initial recognition of goodwill.
Deferred tax assets are recognized for unused tax losses, unused tax credits and deductible temporary differences to the extent that it is probable that future taxable profits will be available against which they can be used. Future taxable profits are determined based on business plans for individual subsidiaries in the Group and the reversal of temporary differences. Deferred tax assets are reviewed at each Reporting Date and are reduced to the extent that it is no longer probable that the related tax benefit will be realised; such reductions are reversed when the probability of future taxable profits improves.
Unrecognized deferred tax assets are reassessed at each Reporting Date and recognized to the extent that it has become probable that future taxable profits will be available against which they can be used.
Deferred tax is measured at the tax rates that are expected to be applied to temporary differences when they reverse, using tax rates enacted or substantively enacted at the Reporting Date.
The measurement of deferred tax reflects the tax consequences that would follow from the manner in which the Group expects, at the Reporting Date, to recover or settle the carrying amount of its assets and liabilities. For this purpose, the carrying amount of investment property measured at fair value is presumed to be recovered through sale and the Group has not rebutted this presumption.
Deferred tax relating to items recognized outside profit or loss is recognized outside profit or loss. Deferred tax items are recognized in correlation to the underlying transaction either in Other Comprehensive Income or directly in equity.
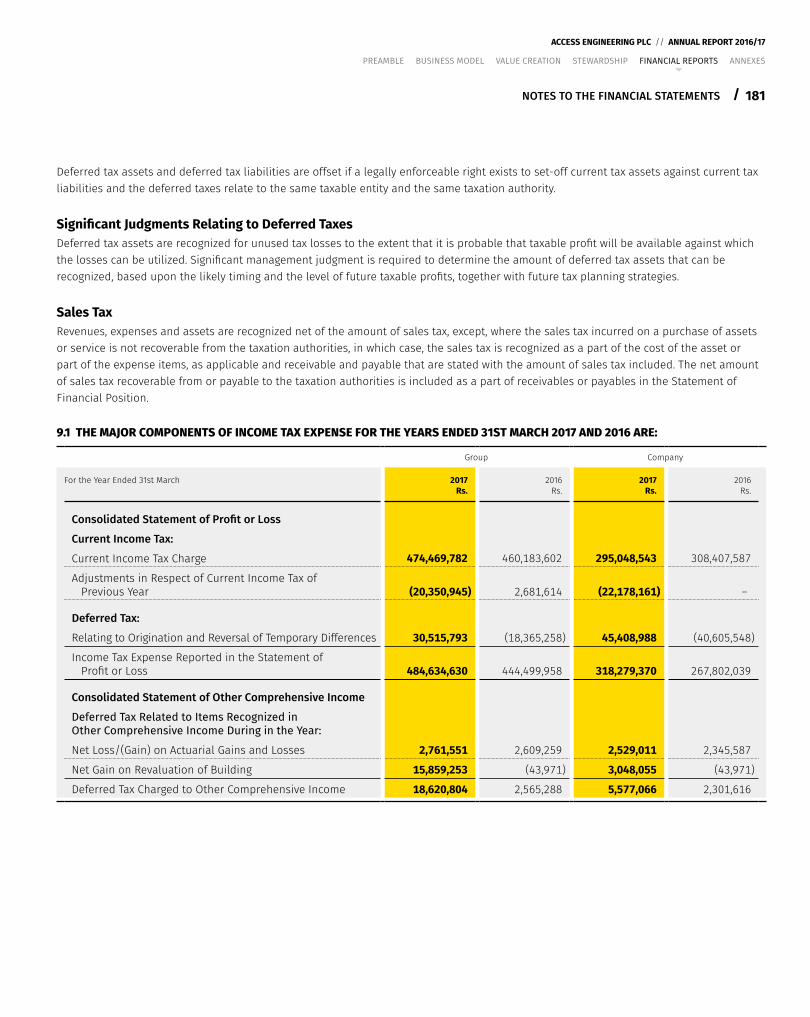
181
ACCESS ENGINEERING PLC // ANNUAL REPORT 2016/17
/
PREAMBLE BUSINESS MODEL VALUE CREATION STEWARDSHIP FINANCIAL REPORTS ANNEXES
NOTES TO THE FINANCIAL STATEMENTS
Deferred tax assets and deferred tax liabilities are offset if a legally enforceable right exists to set-off current tax assets against current tax liabilities and the deferred taxes relate to the same taxable entity and the same taxation authority.
Significant Judgments Relating to Deferred TaxesDeferred tax assets are recognized for unused tax losses to the extent that it is probable that taxable profit will be available against which the losses can be utilized. Significant management judgment is required to determine the amount of deferred tax assets that can be recognized, based upon the likely timing and the level of future taxable profits, together with future tax planning strategies.
Sales TaxRevenues, expenses and assets are recognized net of the amount of sales tax, except, where the sales tax incurred on a purchase of assets or service is not recoverable from the taxation authorities, in which case, the sales tax is recognized as a part of the cost of the asset or part of the expense items, as applicable and receivable and payable that are stated with the amount of sales tax included. The net amount of sales tax recoverable from or payable to the taxation authorities is included as a part of receivables or payables in the Statement of Financial Position.
9.1 THE MAJOR COMPONENTS OF INCOME TAX EXPENSE FOR THE YEARS ENDED 31ST MARCH 2017 AND 2016 ARE:
Group Company
For the Year Ended 31st March 2017Rs.
2016Rs.
2017Rs.
2016Rs.
Consolidated Statement of Profit or Loss
Current Income Tax:
Current Income Tax Charge 474,469,782 460,183,602 295,048,543 308,407,587
Adjustments in Respect of Current Income Tax of Previous Year (20,350,945) 2,681,614 (22,178,161) –
Deferred Tax:
Relating to Origination and Reversal of Temporary Differences 30,515,793 (18,365,258) 45,408,988 (40,605,548)
Income Tax Expense Reported in the Statement of Profit or Loss 484,634,630 444,499,958 318,279,370 267,802,039
Consolidated Statement of Other Comprehensive Income
Deferred Tax Related to Items Recognized in Other Comprehensive Income During in the Year:
Net Loss/(Gain) on Actuarial Gains and Losses 2,761,551 2,609,259 2,529,011 2,345,587
Net Gain on Revaluation of Building 15,859,253 (43,971) 3,048,055 (43,971)
Deferred Tax Charged to Other Comprehensive Income 18,620,804 2,565,288 5,577,066 2,301,616
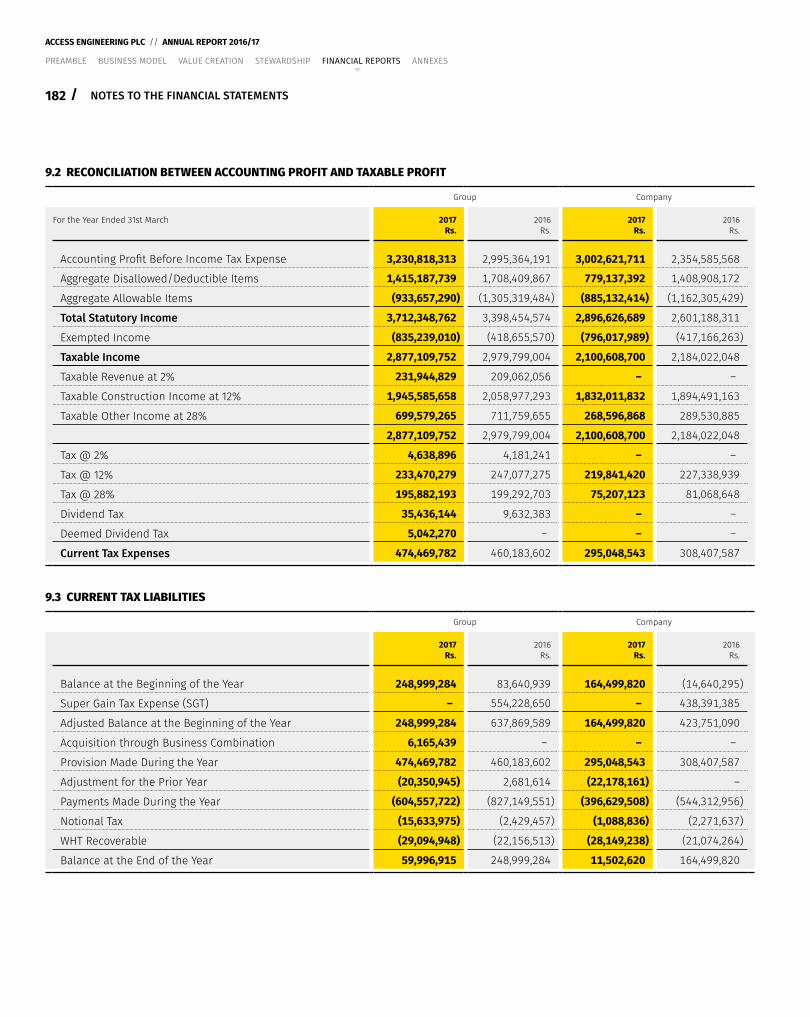
182 /
ACCESS ENGINEERING PLC // ANNUAL REPORT 2016/17
PREAMBLE BUSINESS MODEL VALUE CREATION STEWARDSHIP FINANCIAL REPORTS ANNEXES
NOTES TO THE FINANCIAL STATEMENTS
9.2 RECONCILIATION BETWEEN ACCOUNTING PROFIT AND TAXABLE PROFIT
Group Company
For the Year Ended 31st March 2017Rs.
2016Rs.
2017Rs.
2016Rs.
Accounting Profit Before Income Tax Expense 3,230,818,313 2,995,364,191 3,002,621,711 2,354,585,568
Aggregate Disallowed/Deductible Items 1,415,187,739 1,708,409,867 779,137,392 1,408,908,172
Aggregate Allowable Items (933,657,290) (1,305,319,484) (885,132,414) (1,162,305,429)
Total Statutory Income 3,712,348,762 3,398,454,574 2,896,626,689 2,601,188,311
Exempted Income (835,239,010) (418,655,570) (796,017,989) (417,166,263)
Taxable Income 2,877,109,752 2,979,799,004 2,100,608,700 2,184,022,048
Taxable Revenue at 2% 231,944,829 209,062,056 – –
Taxable Construction Income at 12% 1,945,585,658 2,058,977,293 1,832,011,832 1,894,491,163
Taxable Other Income at 28% 699,579,265 711,759,655 268,596,868 289,530,885
2,877,109,752 2,979,799,004 2,100,608,700 2,184,022,048
Tax @ 2% 4,638,896 4,181,241 – –
Tax @ 12% 233,470,279 247,077,275 219,841,420 227,338,939
Tax @ 28% 195,882,193 199,292,703 75,207,123 81,068,648
Dividend Tax 35,436,144 9,632,383 – –
Deemed Dividend Tax 5,042,270 – – –
Current Tax Expenses 474,469,782 460,183,602 295,048,543 308,407,587
9.3 CURRENT TAX LIABILITIES
Group Company
2017Rs.
2016Rs.
2017Rs.
2016Rs.
Balance at the Beginning of the Year 248,999,284 83,640,939 164,499,820 (14,640,295)
Super Gain Tax Expense (SGT) – 554,228,650 – 438,391,385
Adjusted Balance at the Beginning of the Year 248,999,284 637,869,589 164,499,820 423,751,090
Acquisition through Business Combination 6,165,439 – – –
Provision Made During the Year 474,469,782 460,183,602 295,048,543 308,407,587
Adjustment for the Prior Year (20,350,945) 2,681,614 (22,178,161) –
Payments Made During the Year (604,557,722) (827,149,551) (396,629,508) (544,312,956)
Notional Tax (15,633,975) (2,429,457) (1,088,836) (2,271,637)
WHT Recoverable (29,094,948) (22,156,513) (28,149,238) (21,074,264)
Balance at the End of the Year 59,996,915 248,999,284 11,502,620 164,499,820
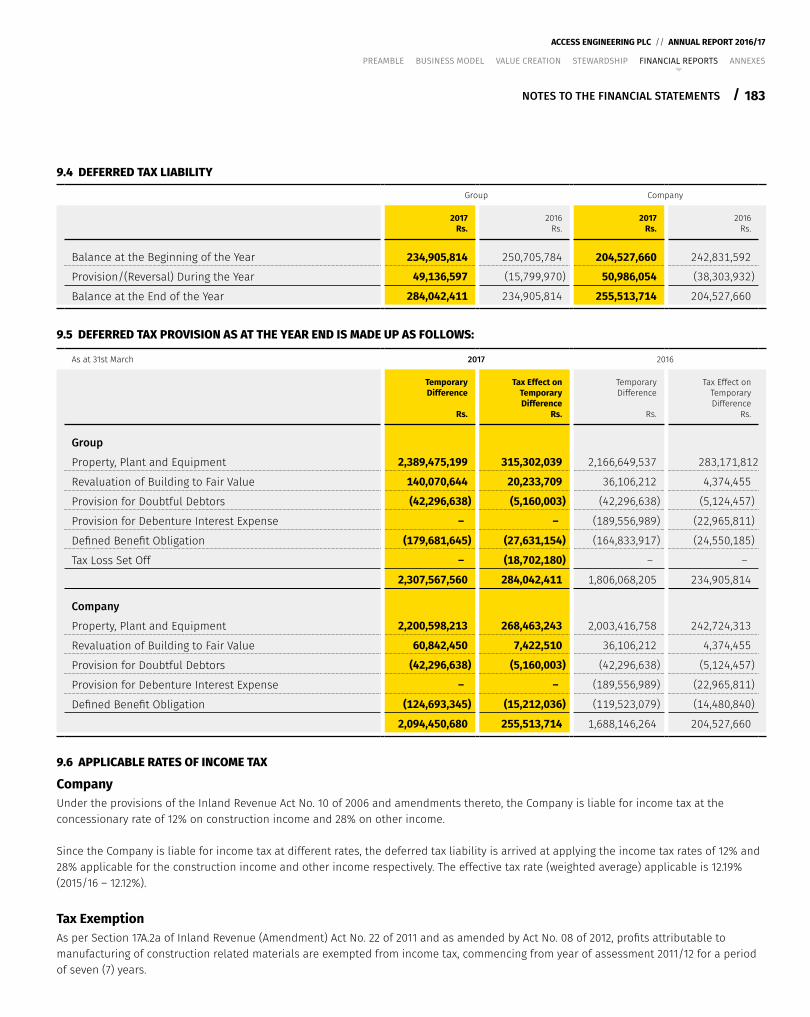
183
ACCESS ENGINEERING PLC // ANNUAL REPORT 2016/17
/
PREAMBLE BUSINESS MODEL VALUE CREATION STEWARDSHIP FINANCIAL REPORTS ANNEXES
NOTES TO THE FINANCIAL STATEMENTS
9.4 DEFERRED TAX LIABILITY
Group Company
2017Rs.
2016Rs.
2017Rs.
2016Rs.
Balance at the Beginning of the Year 234,905,814 250,705,784 204,527,660 242,831,592
Provision/(Reversal) During the Year 49,136,597 (15,799,970) 50,986,054 (38,303,932)
Balance at the End of the Year 284,042,411 234,905,814 255,513,714 204,527,660
9.5 DEFERRED TAX PROVISION AS AT THE YEAR END IS MADE UP AS FOLLOWS:
As at 31st March 2017 2016
Temporary Difference
Rs.
Tax Effect on Temporary Difference
Rs.
Temporary Difference
Rs.
Tax Effect on Temporary Difference
Rs.
Group
Property, Plant and Equipment 2,389,475,199 315,302,039 2,166,649,537 283,171,812
Revaluation of Building to Fair Value 140,070,644 20,233,709 36,106,212 4,374,455
Provision for Doubtful Debtors (42,296,638) (5,160,003) (42,296,638) (5,124,457)
Provision for Debenture Interest Expense – – (189,556,989) (22,965,811)
Defined Benefit Obligation (179,681,645) (27,631,154) (164,833,917) (24,550,185)
Tax Loss Set Off – (18,702,180) – –
2,307,567,560 284,042,411 1,806,068,205 234,905,814
Company
Property, Plant and Equipment 2,200,598,213 268,463,243 2,003,416,758 242,724,313
Revaluation of Building to Fair Value 60,842,450 7,422,510 36,106,212 4,374,455
Provision for Doubtful Debtors (42,296,638) (5,160,003) (42,296,638) (5,124,457)
Provision for Debenture Interest Expense – – (189,556,989) (22,965,811)
Defined Benefit Obligation (124,693,345) (15,212,036) (119,523,079) (14,480,840)
2,094,450,680 255,513,714 1,688,146,264 204,527,660
9.6 APPLICABLE RATES OF INCOME TAX
CompanyUnder the provisions of the Inland Revenue Act No. 10 of 2006 and amendments thereto, the Company is liable for income tax at the concessionary rate of 12% on construction income and 28% on other income.
Since the Company is liable for income tax at different rates, the deferred tax liability is arrived at applying the income tax rates of 12% and 28% applicable for the construction income and other income respectively. The effective tax rate (weighted average) applicable is 12.19% (2015/16 – 12.12%).
Tax ExemptionAs per Section 17A.2a of Inland Revenue (Amendment) Act No. 22 of 2011 and as amended by Act No. 08 of 2012, profits attributable to manufacturing of construction related materials are exempted from income tax, commencing from year of assessment 2011/12 for a period of seven (7) years.
184 /
ACCESS ENGINEERING PLC // ANNUAL REPORT 2016/17
PREAMBLE BUSINESS MODEL VALUE CREATION STEWARDSHIP FINANCIAL REPORTS ANNEXES
NOTES TO THE FINANCIAL STATEMENTS
Potential Impact of Income Tax Rate ChangesAs per the recent Policy Measures published on 29th April 2016 by the Ministry of Finance (www.treasury.gov.lk), the Company will be liable to pay current income tax at 28% instead of the prevailing concessionary rate of 12% on construction income whilst the tax rate on other sources of income will remain at 28% with effect from the year of assessment starting 01st April 2017.
As per the subsequent notice to the tax payers issued by Department of Inland Revenue on 12th April 2017, existing provisions of the Inland Revenue Act will be continued until issue of further notice. Accordingly, the Company has provided for deferred taxation at the existing income tax rates of 12% and 28% applicable for construction income and other income respectively, for the year ended 31st March 2017.
SubsidiariesAccess Realties (Private) LimitedAs per the agreement entered in to with the Board of Investment (BOI) of Sri Lanka, under Section 17 of the Board of Investment Act No. 04 of 1978, the Company is exempted from income tax for the period of seven (07) years from the year of assessment in which the enterprise commences making profit in relation to the transaction in that year or any year of assessment not later than five (05) years reckoned from the date of its operations whichever year is earlier. Accordingly, the seven (07) years income tax exemption period has commenced on 1st April 2003.
In accordance with the agreement entered into with the BOI of Sri Lanka, the Company is liable for Income Tax at 2% on its revenue for next fifteen (15) years immediately following the seven (07) years tax exemption period. On that basis, the revenue arising from the business shall be taxed at 2% during the concessionary period covering 1st April 2010 to 31st March 2025.
However, the Company is liable to pay income tax at 28% on other income.
No provision has been made on deferred taxation, since the Company is liable for income tax at 2% on its revenue for fifteen (15) years commencing from 1st April 2010.
Access Realties 2 (Private) LimitedAs per the agreement entered into with the Board of Investment of Sri Lanka under Section 17 (A) of Inland Revenue (Amendment) Act No. 08 of 2012, the Company shall qualify for a tax exemption period of 12 years subject to the condition that over of Rs. 2,500 Mn is made in the project within a period of 3 years from the date of 4th April 2013.
Further insertion of New Section under 48 D of Inland Revenue (Amendment) Act No. 09 to 2015, if the approval of Board of Investment was granted prior to 31st October 2014 and the Company which invested in such undertaking is unable to complete the required investment prior to 01st April 2015 and to commence commercial operations prior to 1st April 2016 due to practical reasons depending on the nature of the business such period shall be extended up to 1st April 2018.
Although, the Company has not commenced commercial operations prior to 4th April 2016 the Company could still claim the tax exemption as it has received an approval from BOI extending the implementation period until 31st July 2017.
The year of assessment shall be reckoned from the year in which the enterprise commences to make profits or any year of assessment not later than 2 years reckoned from the date of commencement of commercial operations whichever year is earlier as determined by Commissioner General of Inland Revenue.
However, the Company is liable to pay income tax at 28% on other income.
No provision has been made on deferred taxation since the Company is exempted from tax for the period of twelve (12) years.
185
ACCESS ENGINEERING PLC // ANNUAL REPORT 2016/17
/
PREAMBLE BUSINESS MODEL VALUE CREATION STEWARDSHIP FINANCIAL REPORTS ANNEXES
NOTES TO THE FINANCIAL STATEMENTS
ARL Elevate (Private) LimitedIn accordance with the provision in the Inland Revenue Act No. 10 of 2006 and amendments thereto, the Company is liable for income tax at 28%.
The Board of Directors of ARL Elevate (Private) Limited is of the opinion that the deferred tax asset amounting to Rs. 768,169/- would Not be crystallized in the foreseeable future. Therefore, the above mentioned deferred tax has not been recognized in the Financial Statements.
Sathosa Motors PLC and its SubsidiaryIn accordance with the provisions of the Inland Revenue Act No. 10 of 2006 and amendments thereto, the Company is liable for income tax at 28% on its taxable profit. Deferred tax rate is 28%.
Access Projects (Private) LimitedIn accordance with the provisions in the Inland Revenue Act No. 10 of 2006 and amendments thereto, the Company is liable for income tax at the rate of 12% on construction income and 28% on other income.
Since the Company is liable for Income tax at different rates, the deferred tax liability is arrived at applying the income tax rates of 12% and 28% applicable for the construction income and other income respectively. The effective tax rate (weighted average) applicable is 16.17% (2015/16 – 13.45%).
Horizon Holdings Ventures (Private) LimitedIn accordance with the provisions in the Inland Revenue Act No. 10 of 2006 and amendments thereto, the Company is liable for income tax at 28% on its taxable profit.
No provision has been made on deferred tax.
Horizon Knowledge City LimitedPursuant to the agreement dated 12th February 2016 entered into with the Board of Investment (BOI) under Section 17 of the Board of Investment Law No. 04 of 1978, the profits and income of the enterprise is exempt from income tax for a period of eight (08) years reckoned from the year of assessment as may be determined by the Board (‘Tax exemption period’).
After the expiration of the aforesaid tax exemption period, referred above, the profit and income of the Company charged at the rate of 15% for a period of two (02) years.
No provision has been made on deferred tax.
Harbour Village (Private) LimitedAs per the agreement entered with BOI the Company qualifies for tax exemption period of a ten (10) years commencing from the year of assessment in which the enterprise commences to make a profit or any year of assessment not later than two years reckoned from the date of commencement of commercial operations or production whichever is earlier. The Company is liable to pay income tax at 28% on other income.
No provision has been made on deferred tax.
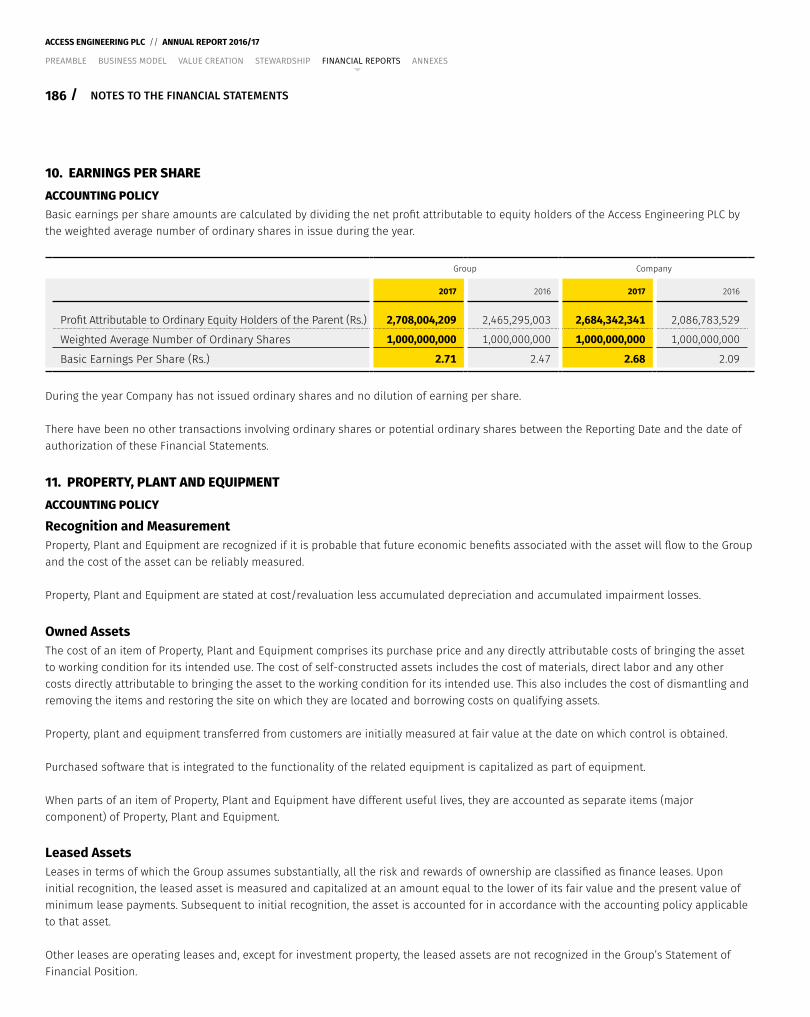
186 /
ACCESS ENGINEERING PLC // ANNUAL REPORT 2016/17
PREAMBLE BUSINESS MODEL VALUE CREATION STEWARDSHIP FINANCIAL REPORTS ANNEXES
NOTES TO THE FINANCIAL STATEMENTS
10. EARNINGS PER SHAREACCOUNTING POLICYBasic earnings per share amounts are calculated by dividing the net profit attributable to equity holders of the Access Engineering PLC by the weighted average number of ordinary shares in issue during the year.
Group Company
2017 2016 2017 2016
Profit Attributable to Ordinary Equity Holders of the Parent (Rs.) 2,708,004,209 2,465,295,003 2,684,342,341 2,086,783,529
Weighted Average Number of Ordinary Shares 1,000,000,000 1,000,000,000 1,000,000,000 1,000,000,000
Basic Earnings Per Share (Rs.) 2.71 2.47 2.68 2.09
During the year Company has not issued ordinary shares and no dilution of earning per share.
There have been no other transactions involving ordinary shares or potential ordinary shares between the Reporting Date and the date of authorization of these Financial Statements.
11. PROPERTY, PLANT AND EQUIPMENTACCOUNTING POLICY
Recognition and MeasurementProperty, Plant and Equipment are recognized if it is probable that future economic benefits associated with the asset will flow to the Group and the cost of the asset can be reliably measured.
Property, Plant and Equipment are stated at cost/revaluation less accumulated depreciation and accumulated impairment losses.
Owned AssetsThe cost of an item of Property, Plant and Equipment comprises its purchase price and any directly attributable costs of bringing the asset to working condition for its intended use. The cost of self-constructed assets includes the cost of materials, direct labor and any other costs directly attributable to bringing the asset to the working condition for its intended use. This also includes the cost of dismantling and removing the items and restoring the site on which they are located and borrowing costs on qualifying assets.
Property, plant and equipment transferred from customers are initially measured at fair value at the date on which control is obtained.
Purchased software that is integrated to the functionality of the related equipment is capitalized as part of equipment.
When parts of an item of Property, Plant and Equipment have different useful lives, they are accounted as separate items (major component) of Property, Plant and Equipment.
Leased AssetsLeases in terms of which the Group assumes substantially, all the risk and rewards of ownership are classified as finance leases. Upon initial recognition, the leased asset is measured and capitalized at an amount equal to the lower of its fair value and the present value of minimum lease payments. Subsequent to initial recognition, the asset is accounted for in accordance with the accounting policy applicable to that asset.
Other leases are operating leases and, except for investment property, the leased assets are not recognized in the Group’s Statement of Financial Position.
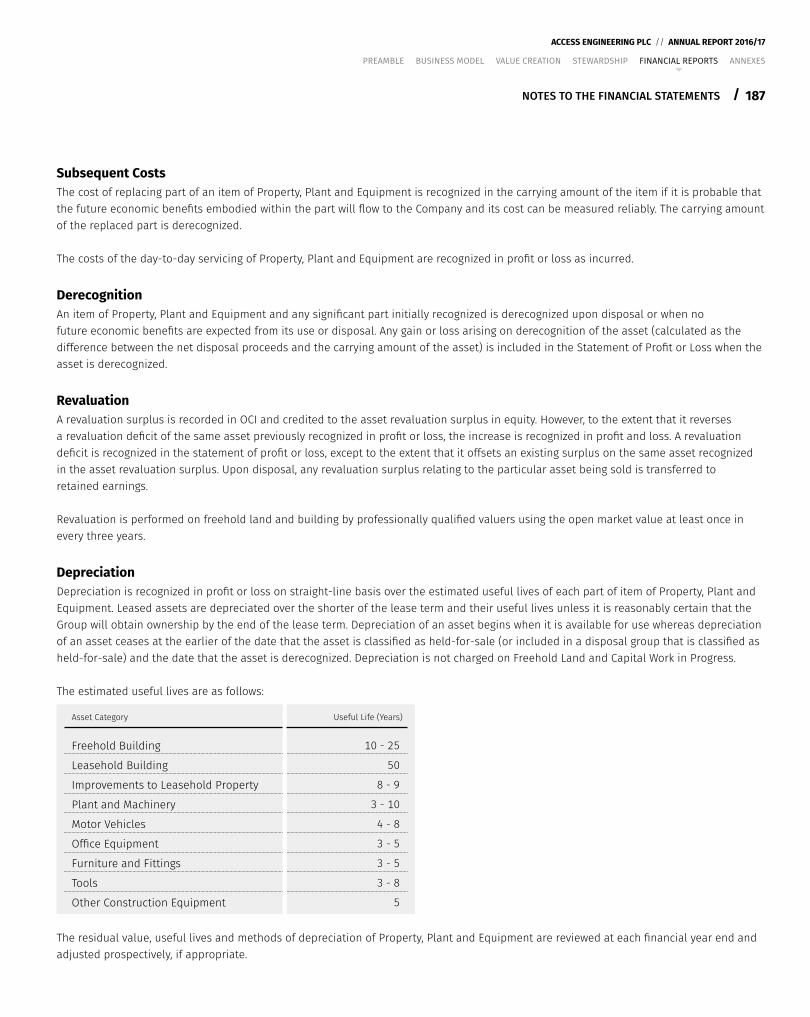
187
ACCESS ENGINEERING PLC // ANNUAL REPORT 2016/17
/
PREAMBLE BUSINESS MODEL VALUE CREATION STEWARDSHIP FINANCIAL REPORTS ANNEXES
NOTES TO THE FINANCIAL STATEMENTS
Subsequent CostsThe cost of replacing part of an item of Property, Plant and Equipment is recognized in the carrying amount of the item if it is probable that the future economic benefits embodied within the part will flow to the Company and its cost can be measured reliably. The carrying amount of the replaced part is derecognized.
The costs of the day-to-day servicing of Property, Plant and Equipment are recognized in profit or loss as incurred.
DerecognitionAn item of Property, Plant and Equipment and any significant part initially recognized is derecognized upon disposal or when no future economic benefits are expected from its use or disposal. Any gain or loss arising on derecognition of the asset (calculated as the difference between the net disposal proceeds and the carrying amount of the asset) is included in the Statement of Profit or Loss when the asset is derecognized.
RevaluationA revaluation surplus is recorded in OCI and credited to the asset revaluation surplus in equity. However, to the extent that it reverses a revaluation deficit of the same asset previously recognized in profit or loss, the increase is recognized in profit and loss. A revaluation deficit is recognized in the statement of profit or loss, except to the extent that it offsets an existing surplus on the same asset recognized in the asset revaluation surplus. Upon disposal, any revaluation surplus relating to the particular asset being sold is transferred to retained earnings.
Revaluation is performed on freehold land and building by professionally qualified valuers using the open market value at least once in every three years.
DepreciationDepreciation is recognized in profit or loss on straight-line basis over the estimated useful lives of each part of item of Property, Plant and Equipment. Leased assets are depreciated over the shorter of the lease term and their useful lives unless it is reasonably certain that the Group will obtain ownership by the end of the lease term. Depreciation of an asset begins when it is available for use whereas depreciation of an asset ceases at the earlier of the date that the asset is classified as held-for-sale (or included in a disposal group that is classified as held-for-sale) and the date that the asset is derecognized. Depreciation is not charged on Freehold Land and Capital Work in Progress.
The estimated useful lives are as follows:
Asset Category Useful Life (Years)
Freehold Building 10 - 25
Leasehold Building 50
Improvements to Leasehold Property 8 - 9
Plant and Machinery 3 - 10
Motor Vehicles 4 - 8
Office Equipment 3 - 5
Furniture and Fittings 3 - 5
Tools 3 - 8
Other Construction Equipment 5
The residual value, useful lives and methods of depreciation of Property, Plant and Equipment are reviewed at each financial year end and adjusted prospectively, if appropriate.
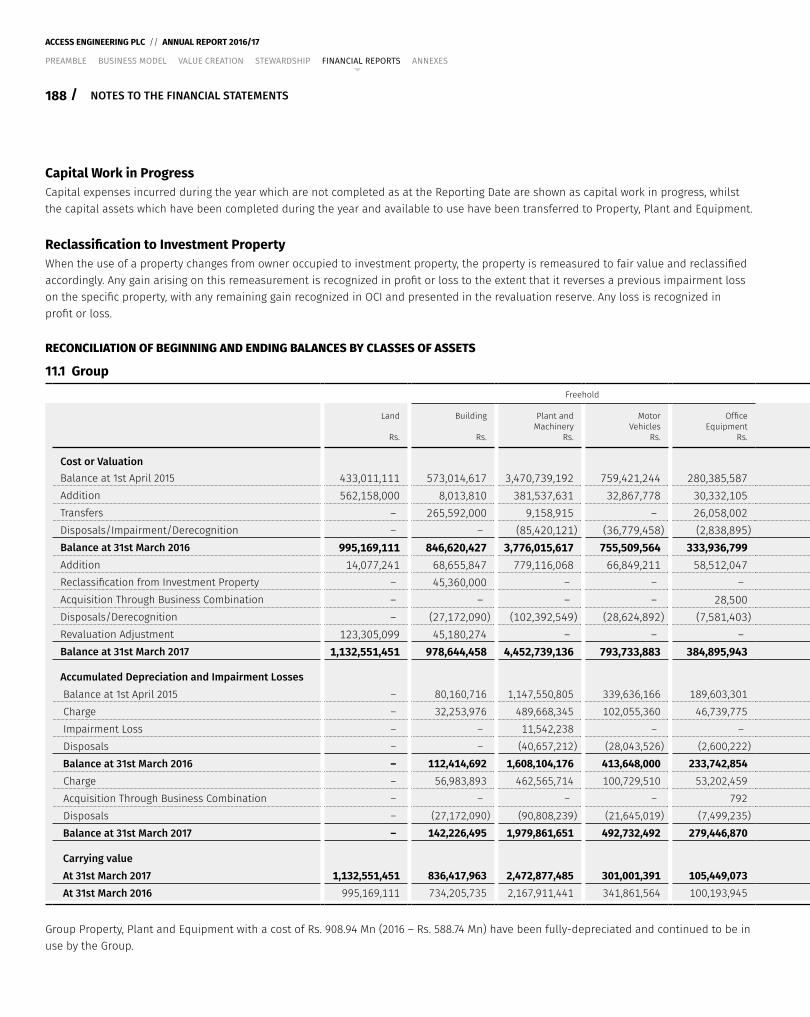
188 /
ACCESS ENGINEERING PLC // ANNUAL REPORT 2016/17
PREAMBLE BUSINESS MODEL VALUE CREATION STEWARDSHIP FINANCIAL REPORTS ANNEXES
NOTES TO THE FINANCIAL STATEMENTS
Capital Work in ProgressCapital expenses incurred during the year which are not completed as at the Reporting Date are shown as capital work in progress, whilst the capital assets which have been completed during the year and available to use have been transferred to Property, Plant and Equipment.
Reclassification to Investment PropertyWhen the use of a property changes from owner occupied to investment property, the property is remeasured to fair value and reclassified accordingly. Any gain arising on this remeasurement is recognized in profit or loss to the extent that it reverses a previous impairment loss on the specific property, with any remaining gain recognized in OCI and presented in the revaluation reserve. Any loss is recognized in profit or loss.
RECONCILIATION OF BEGINNING AND ENDING BALANCES BY CLASSES OF ASSETS
11.1 GroupFreehold Freehold Leasehold
Land
Rs.
Building
Rs.
Plant and Machinery
Rs.
Motor Vehicles
Rs.
Office Equipment
Rs.
Furniture and Fittings
Rs.
Tools
Rs.
Other Construction Equipment
Rs.
Motor Vehicles
Rs.
Capital Work in Progress
Rs.
Total
Rs.
Cost or ValuationBalance at 1st April 2015 433,011,111 573,014,617 3,470,739,192 759,421,244 280,385,587 134,075,500 321,050,535 145,264,282 14,486,144 175,917,576 6,307,365,788 Addition 562,158,000 8,013,810 381,537,631 32,867,778 30,332,105 8,257,447 125,147,441 81,616,270 18,000,000 198,445,431 1,446,375,913 Transfers – 265,592,000 9,158,915 – 26,058,002 46,650,194 – – (347,459,111) – Disposals/Impairment/Derecognition – – (85,420,121) (36,779,458) (2,838,895) (673,185) (9,430,991) – (5,632,930) – (140,775,580)Balance at 31st March 2016 995,169,111 846,620,427 3,776,015,617 755,509,564 333,936,799 188,309,956 436,766,985 226,880,552 26,853,214 26,903,896 7,612,966,121 Addition 14,077,241 68,655,847 779,116,068 66,849,211 58,512,047 16,365,847 230,000,576 73,865,897 – 24,996,771 1,332,439,504 Reclassification from Investment Property – 45,360,000 – – – – – – – – 45,360,000 Acquisition Through Business Combination – – – – 28,500 – – – – – 28,500 Disposals/Derecognition – (27,172,090) (102,392,549) (28,624,892) (7,581,403) (828,351) (11,923,707) – (2,500,000) – (181,023,002)Revaluation Adjustment 123,305,099 45,180,274 – – – – – – – – 168,485,373 Balance at 31st March 2017 1,132,551,451 978,644,458 4,452,739,136 793,733,883 384,895,943 203,847,452 654,843,844 300,746,449 24,353,214 51,900,667 8,978,256,497
Accumulated Depreciation and Impairment Losses Balance at 1st April 2015 – 80,160,716 1,147,550,805 339,636,166 189,603,301 78,884,542 181,488,188 60,006,020 8,504,163 – 2,085,833,901 Charge – 32,253,976 489,668,345 102,055,360 46,739,775 27,656,185 67,272,257 37,929,834 4,206,638 – 807,782,370 Impairment Loss – – 11,542,238 – – – – – – – 11,542,238 Disposals – – (40,657,212) (28,043,526) (2,600,222) (366,415) (7,469,218) – (3,959,816) – (83,096,409) Balance at 31st March 2016 – 112,414,692 1,608,104,176 413,648,000 233,742,854 106,174,312 241,291,227 97,935,854 8,750,985 – 2,822,062,100 Charge – 56,983,893 462,565,714 100,729,510 53,202,459 35,973,670 128,170,496 48,171,639 4,656,256 – 890,453,638 Acquisition Through Business Combination – – – – 792 – – – – – 792 Disposals – (27,172,090) (90,808,239) (21,645,019) (7,499,235) (826,312) (11,390,066) – (2,500,000) – (161,840,961) Balance at 31st March 2017 – 142,226,495 1,979,861,651 492,732,492 279,446,870 141,321,670 358,071,657 146,107,493 10,907,241 – 3,550,675,569
Carrying value At 31st March 2017 1,132,551,451 836,417,963 2,472,877,485 301,001,391 105,449,073 62,525,782 296,772,187 154,638,956 13,445,973 51,900,667 5,427,580,928 At 31st March 2016 995,169,111 734,205,735 2,167,911,441 341,861,564 100,193,945 82,135,644 195,475,758 128,944,698 18,102,229 26,903,896 4,790,904,021
Group Property, Plant and Equipment with a cost of Rs. 908.94 Mn (2016 – Rs. 588.74 Mn) have been fully-depreciated and continued to be in use by the Group.
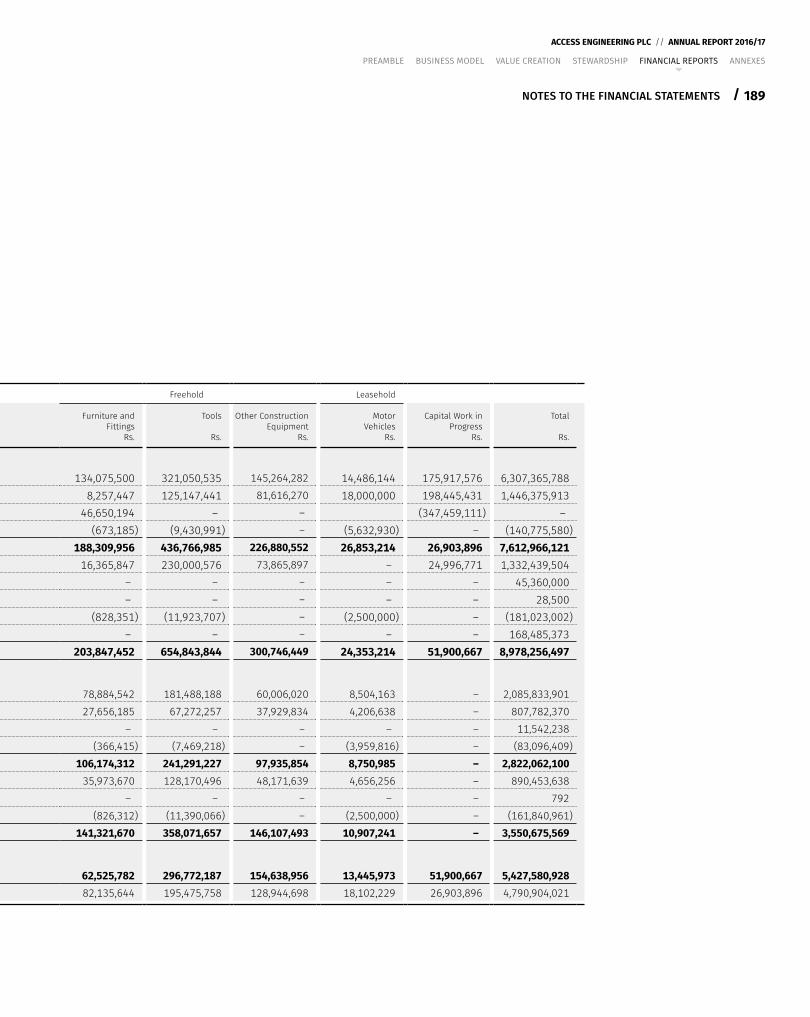
189
ACCESS ENGINEERING PLC // ANNUAL REPORT 2016/17
/
PREAMBLE BUSINESS MODEL VALUE CREATION STEWARDSHIP FINANCIAL REPORTS ANNEXES
NOTES TO THE FINANCIAL STATEMENTS
Capital Work in ProgressCapital expenses incurred during the year which are not completed as at the Reporting Date are shown as capital work in progress, whilst the capital assets which have been completed during the year and available to use have been transferred to Property, Plant and Equipment.
Reclassification to Investment PropertyWhen the use of a property changes from owner occupied to investment property, the property is remeasured to fair value and reclassified accordingly. Any gain arising on this remeasurement is recognized in profit or loss to the extent that it reverses a previous impairment loss on the specific property, with any remaining gain recognized in OCI and presented in the revaluation reserve. Any loss is recognized in profit or loss.
RECONCILIATION OF BEGINNING AND ENDING BALANCES BY CLASSES OF ASSETS
11.1 GroupFreehold Freehold Leasehold
Land
Rs.
Building
Rs.
Plant and Machinery
Rs.
Motor Vehicles
Rs.
Office Equipment
Rs.
Furniture and Fittings
Rs.
Tools
Rs.
Other Construction Equipment
Rs.
Motor Vehicles
Rs.
Capital Work in Progress
Rs.
Total
Rs.
Cost or ValuationBalance at 1st April 2015 433,011,111 573,014,617 3,470,739,192 759,421,244 280,385,587 134,075,500 321,050,535 145,264,282 14,486,144 175,917,576 6,307,365,788 Addition 562,158,000 8,013,810 381,537,631 32,867,778 30,332,105 8,257,447 125,147,441 81,616,270 18,000,000 198,445,431 1,446,375,913 Transfers – 265,592,000 9,158,915 – 26,058,002 46,650,194 – – (347,459,111) – Disposals/Impairment/Derecognition – – (85,420,121) (36,779,458) (2,838,895) (673,185) (9,430,991) – (5,632,930) – (140,775,580)Balance at 31st March 2016 995,169,111 846,620,427 3,776,015,617 755,509,564 333,936,799 188,309,956 436,766,985 226,880,552 26,853,214 26,903,896 7,612,966,121 Addition 14,077,241 68,655,847 779,116,068 66,849,211 58,512,047 16,365,847 230,000,576 73,865,897 – 24,996,771 1,332,439,504 Reclassification from Investment Property – 45,360,000 – – – – – – – – 45,360,000 Acquisition Through Business Combination – – – – 28,500 – – – – – 28,500 Disposals/Derecognition – (27,172,090) (102,392,549) (28,624,892) (7,581,403) (828,351) (11,923,707) – (2,500,000) – (181,023,002)Revaluation Adjustment 123,305,099 45,180,274 – – – – – – – – 168,485,373 Balance at 31st March 2017 1,132,551,451 978,644,458 4,452,739,136 793,733,883 384,895,943 203,847,452 654,843,844 300,746,449 24,353,214 51,900,667 8,978,256,497
Accumulated Depreciation and Impairment Losses Balance at 1st April 2015 – 80,160,716 1,147,550,805 339,636,166 189,603,301 78,884,542 181,488,188 60,006,020 8,504,163 – 2,085,833,901 Charge – 32,253,976 489,668,345 102,055,360 46,739,775 27,656,185 67,272,257 37,929,834 4,206,638 – 807,782,370 Impairment Loss – – 11,542,238 – – – – – – – 11,542,238 Disposals – – (40,657,212) (28,043,526) (2,600,222) (366,415) (7,469,218) – (3,959,816) – (83,096,409) Balance at 31st March 2016 – 112,414,692 1,608,104,176 413,648,000 233,742,854 106,174,312 241,291,227 97,935,854 8,750,985 – 2,822,062,100 Charge – 56,983,893 462,565,714 100,729,510 53,202,459 35,973,670 128,170,496 48,171,639 4,656,256 – 890,453,638 Acquisition Through Business Combination – – – – 792 – – – – – 792 Disposals – (27,172,090) (90,808,239) (21,645,019) (7,499,235) (826,312) (11,390,066) – (2,500,000) – (161,840,961) Balance at 31st March 2017 – 142,226,495 1,979,861,651 492,732,492 279,446,870 141,321,670 358,071,657 146,107,493 10,907,241 – 3,550,675,569
Carrying value At 31st March 2017 1,132,551,451 836,417,963 2,472,877,485 301,001,391 105,449,073 62,525,782 296,772,187 154,638,956 13,445,973 51,900,667 5,427,580,928 At 31st March 2016 995,169,111 734,205,735 2,167,911,441 341,861,564 100,193,945 82,135,644 195,475,758 128,944,698 18,102,229 26,903,896 4,790,904,021
Group Property, Plant and Equipment with a cost of Rs. 908.94 Mn (2016 – Rs. 588.74 Mn) have been fully-depreciated and continued to be in use by the Group.
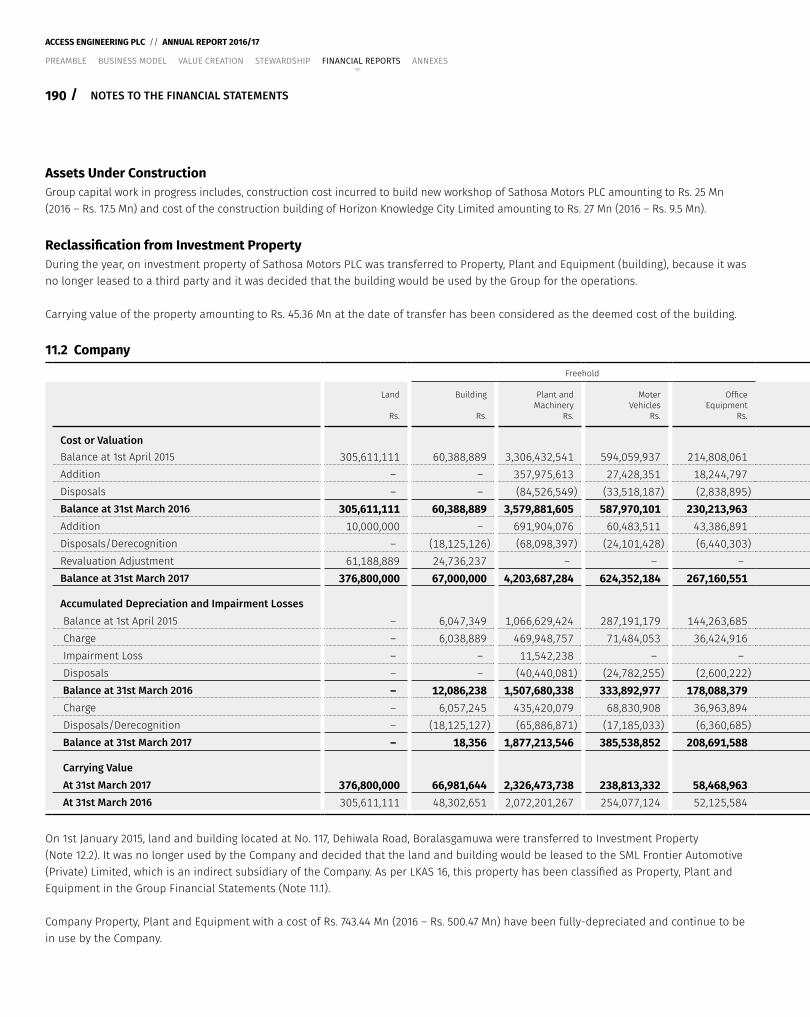
190 /
ACCESS ENGINEERING PLC // ANNUAL REPORT 2016/17
PREAMBLE BUSINESS MODEL VALUE CREATION STEWARDSHIP FINANCIAL REPORTS ANNEXES
NOTES TO THE FINANCIAL STATEMENTS
Assets Under Construction Group capital work in progress includes, construction cost incurred to build new workshop of Sathosa Motors PLC amounting to Rs. 25 Mn (2016 – Rs. 17.5 Mn) and cost of the construction building of Horizon Knowledge City Limited amounting to Rs. 27 Mn (2016 – Rs. 9.5 Mn).
Reclassification from Investment Property During the year, on investment property of Sathosa Motors PLC was transferred to Property, Plant and Equipment (building), because it was no longer leased to a third party and it was decided that the building would be used by the Group for the operations.
Carrying value of the property amounting to Rs. 45.36 Mn at the date of transfer has been considered as the deemed cost of the building.
11.2 CompanyFreehold Freehold
Land
Rs.
Building
Rs.
Plant and Machinery
Rs.
Moter Vehicles
Rs.
Office Equipment
Rs.
Furniture and Fittings
Rs.
Tools
Rs.
Other Construction Equipment
Rs.
Total
Rs.
Cost or ValuationBalance at 1st April 2015 305,611,111 60,388,889 3,306,432,541 594,059,937 214,808,061 101,200,964 317,131,626 145,264,282 5,044,897,411 Addition – – 357,975,613 27,428,351 18,244,797 3,897,972 123,968,455 81,616,270 613,131,458 Disposals – – (84,526,549) (33,518,187) (2,838,895) (496,665) (9,430,991) – (130,811,287)Balance at 31st March 2016 305,611,111 60,388,889 3,579,881,605 587,970,101 230,213,963 104,602,271 431,669,090 226,880,552 5,527,217,582 Addition 10,000,000 – 691,904,076 60,483,511 43,386,891 10,589,449 230,000,576 73,865,897 1,120,230,400 Disposals/Derecognition – (18,125,126) (68,098,397) (24,101,428) (6,440,303) (318,500) (11,917,553) – (129,001,308)Revaluation Adjustment 61,188,889 24,736,237 – – – – – – 85,925,126 Balance at 31st March 2017 376,800,000 67,000,000 4,203,687,284 624,352,184 267,160,551 114,873,220 649,752,113 300,746,449 6,604,371,801
Accumulated Depreciation and Impairment Losses Balance at 1st April 2015 – 6,047,349 1,066,629,424 287,191,179 144,263,685 61,478,921 177,708,697 60,006,020 1,803,325,275 Charge – 6,038,889 469,948,757 71,484,053 36,424,916 20,896,745 66,931,112 37,929,834 709,654,306 Impairment Loss – – 11,542,238 – – – – – 11,542,238 Disposals – – (40,440,081) (24,782,255) (2,600,222) (345,817) (7,469,218) – (75,637,593) Balance at 31st March 2016 – 12,086,238 1,507,680,338 333,892,977 178,088,379 82,029,849 237,170,591 97,935,854 2,448,884,226 Charge – 6,057,245 435,420,079 68,830,908 36,963,894 20,729,861 127,803,521 48,171,639 743,977,147 Disposals/Derecognition – (18,125,127) (65,886,871) (17,185,033) (6,360,685) (316,461) (11,389,186) – (119,263,363) Balance at 31st March 2017 – 18,356 1,877,213,546 385,538,852 208,691,588 102,443,249 353,584,926 146,107,493 3,073,598,010
Carrying Value At 31st March 2017 376,800,000 66,981,644 2,326,473,738 238,813,332 58,468,963 12,429,971 296,167,187 154,638,956 3,530,773,791 At 31st March 2016 305,611,111 48,302,651 2,072,201,267 254,077,124 52,125,584 22,572,422 194,498,499 128,944,698 3,078,333,356
On 1st January 2015, land and building located at No. 117, Dehiwala Road, Boralasgamuwa were transferred to Investment Property (Note 12.2). It was no longer used by the Company and decided that the land and building would be leased to the SML Frontier Automotive (Private) Limited, which is an indirect subsidiary of the Company. As per LKAS 16, this property has been classified as Property, Plant and Equipment in the Group Financial Statements (Note 11.1).
Company Property, Plant and Equipment with a cost of Rs. 743.44 Mn (2016 – Rs. 500.47 Mn) have been fully-depreciated and continue to be in use by the Company.
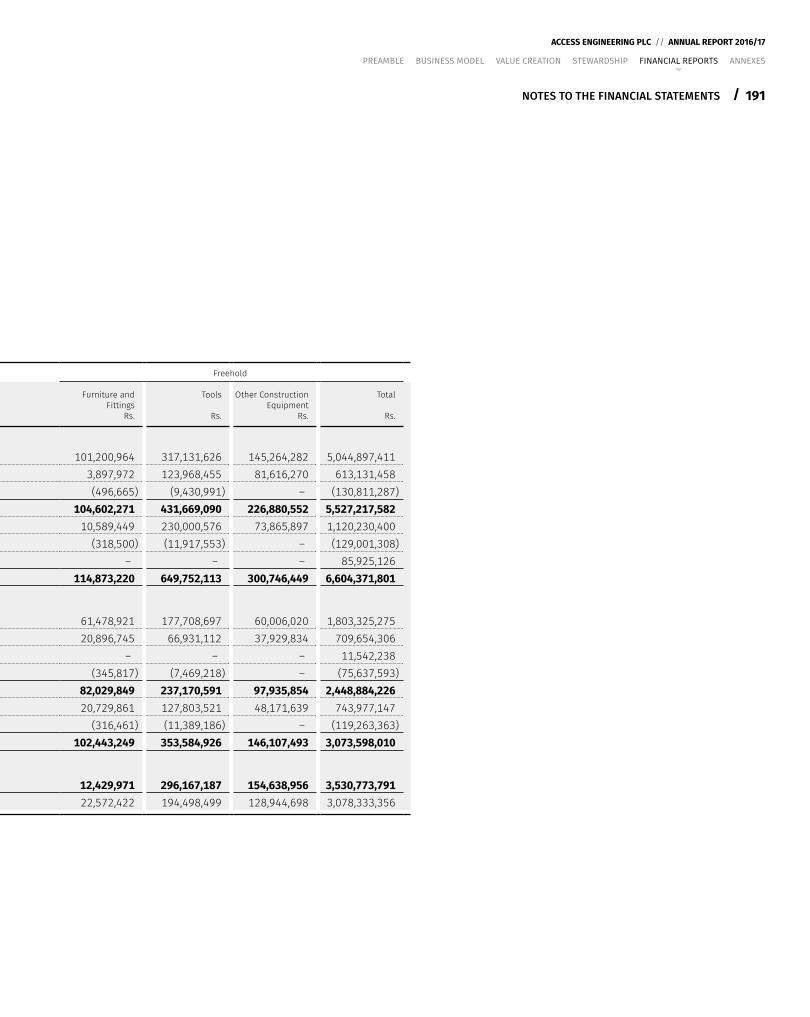
191
ACCESS ENGINEERING PLC // ANNUAL REPORT 2016/17
/
PREAMBLE BUSINESS MODEL VALUE CREATION STEWARDSHIP FINANCIAL REPORTS ANNEXES
NOTES TO THE FINANCIAL STATEMENTS
Assets Under Construction Group capital work in progress includes, construction cost incurred to build new workshop of Sathosa Motors PLC amounting to Rs. 25 Mn (2016 – Rs. 17.5 Mn) and cost of the construction building of Horizon Knowledge City Limited amounting to Rs. 27 Mn (2016 – Rs. 9.5 Mn).
Reclassification from Investment Property During the year, on investment property of Sathosa Motors PLC was transferred to Property, Plant and Equipment (building), because it was no longer leased to a third party and it was decided that the building would be used by the Group for the operations.
Carrying value of the property amounting to Rs. 45.36 Mn at the date of transfer has been considered as the deemed cost of the building.
11.2 CompanyFreehold Freehold
Land
Rs.
Building
Rs.
Plant and Machinery
Rs.
Moter Vehicles
Rs.
Office Equipment
Rs.
Furniture and Fittings
Rs.
Tools
Rs.
Other Construction Equipment
Rs.
Total
Rs.
Cost or ValuationBalance at 1st April 2015 305,611,111 60,388,889 3,306,432,541 594,059,937 214,808,061 101,200,964 317,131,626 145,264,282 5,044,897,411 Addition – – 357,975,613 27,428,351 18,244,797 3,897,972 123,968,455 81,616,270 613,131,458 Disposals – – (84,526,549) (33,518,187) (2,838,895) (496,665) (9,430,991) – (130,811,287)Balance at 31st March 2016 305,611,111 60,388,889 3,579,881,605 587,970,101 230,213,963 104,602,271 431,669,090 226,880,552 5,527,217,582 Addition 10,000,000 – 691,904,076 60,483,511 43,386,891 10,589,449 230,000,576 73,865,897 1,120,230,400 Disposals/Derecognition – (18,125,126) (68,098,397) (24,101,428) (6,440,303) (318,500) (11,917,553) – (129,001,308)Revaluation Adjustment 61,188,889 24,736,237 – – – – – – 85,925,126 Balance at 31st March 2017 376,800,000 67,000,000 4,203,687,284 624,352,184 267,160,551 114,873,220 649,752,113 300,746,449 6,604,371,801
Accumulated Depreciation and Impairment Losses Balance at 1st April 2015 – 6,047,349 1,066,629,424 287,191,179 144,263,685 61,478,921 177,708,697 60,006,020 1,803,325,275 Charge – 6,038,889 469,948,757 71,484,053 36,424,916 20,896,745 66,931,112 37,929,834 709,654,306 Impairment Loss – – 11,542,238 – – – – – 11,542,238 Disposals – – (40,440,081) (24,782,255) (2,600,222) (345,817) (7,469,218) – (75,637,593) Balance at 31st March 2016 – 12,086,238 1,507,680,338 333,892,977 178,088,379 82,029,849 237,170,591 97,935,854 2,448,884,226 Charge – 6,057,245 435,420,079 68,830,908 36,963,894 20,729,861 127,803,521 48,171,639 743,977,147 Disposals/Derecognition – (18,125,127) (65,886,871) (17,185,033) (6,360,685) (316,461) (11,389,186) – (119,263,363) Balance at 31st March 2017 – 18,356 1,877,213,546 385,538,852 208,691,588 102,443,249 353,584,926 146,107,493 3,073,598,010
Carrying Value At 31st March 2017 376,800,000 66,981,644 2,326,473,738 238,813,332 58,468,963 12,429,971 296,167,187 154,638,956 3,530,773,791 At 31st March 2016 305,611,111 48,302,651 2,072,201,267 254,077,124 52,125,584 22,572,422 194,498,499 128,944,698 3,078,333,356
On 1st January 2015, land and building located at No. 117, Dehiwala Road, Boralasgamuwa were transferred to Investment Property (Note 12.2). It was no longer used by the Company and decided that the land and building would be leased to the SML Frontier Automotive (Private) Limited, which is an indirect subsidiary of the Company. As per LKAS 16, this property has been classified as Property, Plant and Equipment in the Group Financial Statements (Note 11.1).
Company Property, Plant and Equipment with a cost of Rs. 743.44 Mn (2016 – Rs. 500.47 Mn) have been fully-depreciated and continue to be in use by the Company.
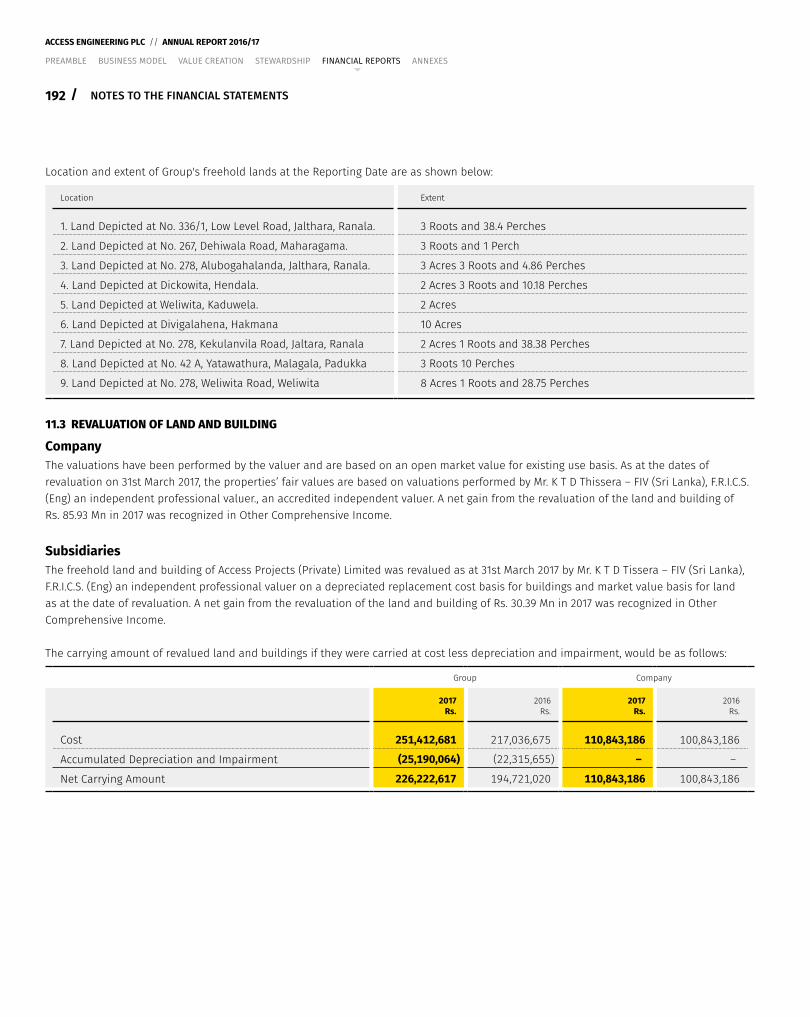
192 /
ACCESS ENGINEERING PLC // ANNUAL REPORT 2016/17
PREAMBLE BUSINESS MODEL VALUE CREATION STEWARDSHIP FINANCIAL REPORTS ANNEXES
NOTES TO THE FINANCIAL STATEMENTS
Location and extent of Group's freehold lands at the Reporting Date are as shown below:
Location Extent
1. Land Depicted at No. 336/1, Low Level Road, Jalthara, Ranala. 3 Roots and 38.4 Perches
2. Land Depicted at No. 267, Dehiwala Road, Maharagama. 3 Roots and 1 Perch
3. Land Depicted at No. 278, Alubogahalanda, Jalthara, Ranala. 3 Acres 3 Roots and 4.86 Perches
4. Land Depicted at Dickowita, Hendala. 2 Acres 3 Roots and 10.18 Perches
5. Land Depicted at Weliwita, Kaduwela. 2 Acres
6. Land Depicted at Divigalahena, Hakmana 10 Acres
7. Land Depicted at No. 278, Kekulanvila Road, Jaltara, Ranala 2 Acres 1 Roots and 38.38 Perches
8. Land Depicted at No. 42 A, Yatawathura, Malagala, Padukka 3 Roots 10 Perches
9. Land Depicted at No. 278, Weliwita Road, Weliwita 8 Acres 1 Roots and 28.75 Perches
11.3 REVALUATION OF LAND AND BUILDING
CompanyThe valuations have been performed by the valuer and are based on an open market value for existing use basis. As at the dates of revaluation on 31st March 2017, the properties’ fair values are based on valuations performed by Mr. K T D Thissera – FIV (Sri Lanka), F.R.I.C.S. (Eng) an independent professional valuer., an accredited independent valuer. A net gain from the revaluation of the land and building of Rs. 85.93 Mn in 2017 was recognized in Other Comprehensive Income.
SubsidiariesThe freehold land and building of Access Projects (Private) Limited was revalued as at 31st March 2017 by Mr. K T D Tissera – FIV (Sri Lanka), F.R.I.C.S. (Eng) an independent professional valuer on a depreciated replacement cost basis for buildings and market value basis for land as at the date of revaluation. A net gain from the revaluation of the land and building of Rs. 30.39 Mn in 2017 was recognized in Other Comprehensive Income.
The carrying amount of revalued land and buildings if they were carried at cost less depreciation and impairment, would be as follows:
Group Company
2017Rs.
2016Rs.
2017Rs.
2016Rs.
Cost 251,412,681 217,036,675 110,843,186 100,843,186
Accumulated Depreciation and Impairment (25,190,064) (22,315,655) – –
Net Carrying Amount 226,222,617 194,721,020 110,843,186 100,843,186
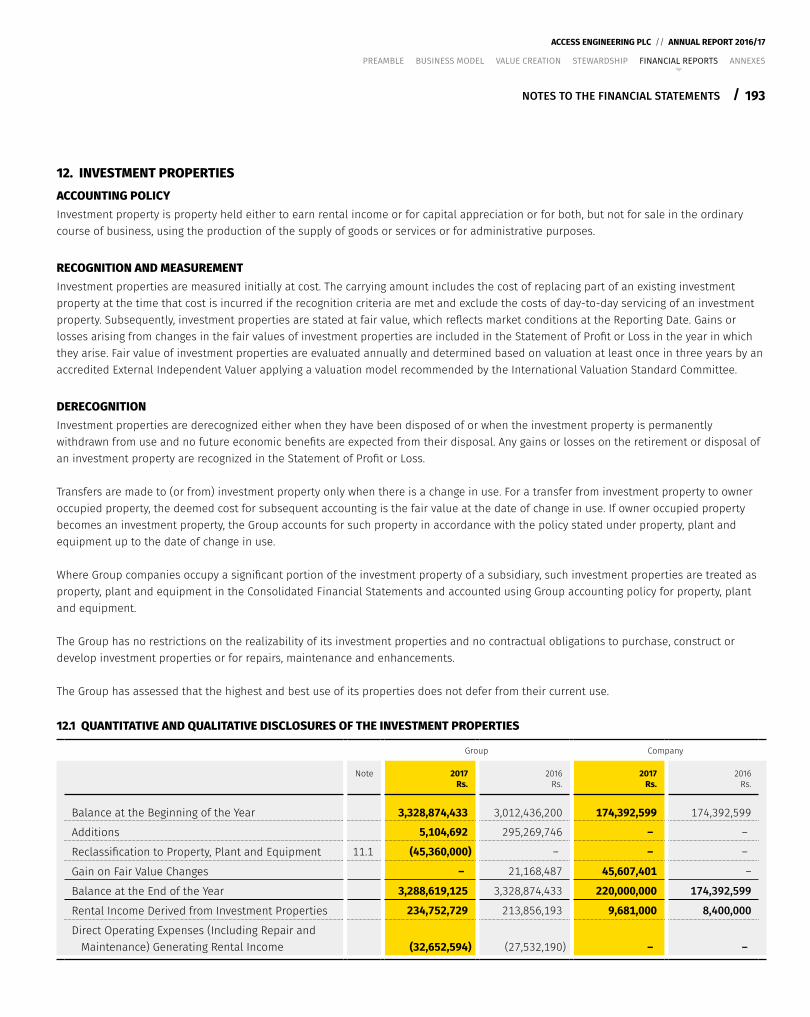
193
ACCESS ENGINEERING PLC // ANNUAL REPORT 2016/17
/
PREAMBLE BUSINESS MODEL VALUE CREATION STEWARDSHIP FINANCIAL REPORTS ANNEXES
NOTES TO THE FINANCIAL STATEMENTS
12. INVESTMENT PROPERTIESACCOUNTING POLICYInvestment property is property held either to earn rental income or for capital appreciation or for both, but not for sale in the ordinary course of business, using the production of the supply of goods or services or for administrative purposes.
RECOGNITION AND MEASUREMENTInvestment properties are measured initially at cost. The carrying amount includes the cost of replacing part of an existing investment property at the time that cost is incurred if the recognition criteria are met and exclude the costs of day-to-day servicing of an investment property. Subsequently, investment properties are stated at fair value, which reflects market conditions at the Reporting Date. Gains or losses arising from changes in the fair values of investment properties are included in the Statement of Profit or Loss in the year in which they arise. Fair value of investment properties are evaluated annually and determined based on valuation at least once in three years by an accredited External Independent Valuer applying a valuation model recommended by the International Valuation Standard Committee.
DERECOGNITION Investment properties are derecognized either when they have been disposed of or when the investment property is permanently withdrawn from use and no future economic benefits are expected from their disposal. Any gains or losses on the retirement or disposal of an investment property are recognized in the Statement of Profit or Loss.
Transfers are made to (or from) investment property only when there is a change in use. For a transfer from investment property to owner occupied property, the deemed cost for subsequent accounting is the fair value at the date of change in use. If owner occupied property becomes an investment property, the Group accounts for such property in accordance with the policy stated under property, plant and equipment up to the date of change in use.
Where Group companies occupy a significant portion of the investment property of a subsidiary, such investment properties are treated as property, plant and equipment in the Consolidated Financial Statements and accounted using Group accounting policy for property, plant and equipment.
The Group has no restrictions on the realizability of its investment properties and no contractual obligations to purchase, construct or develop investment properties or for repairs, maintenance and enhancements.
The Group has assessed that the highest and best use of its properties does not defer from their current use.
12.1 QUANTITATIVE AND QUALITATIVE DISCLOSURES OF THE INVESTMENT PROPERTIES
Group Company
Note 2017Rs.
2016Rs.
2017Rs.
2016Rs.
Balance at the Beginning of the Year 3,328,874,433 3,012,436,200 174,392,599 174,392,599
Additions 5,104,692 295,269,746 – –
Reclassification to Property, Plant and Equipment 11.1 (45,360,000) – – –
Gain on Fair Value Changes – 21,168,487 45,607,401 –
Balance at the End of the Year 3,288,619,125 3,328,874,433 220,000,000 174,392,599
Rental Income Derived from Investment Properties 234,752,729 213,856,193 9,681,000 8,400,000
Direct Operating Expenses (Including Repair and Maintenance) Generating Rental Income (32,652,594) (27,532,190) – –
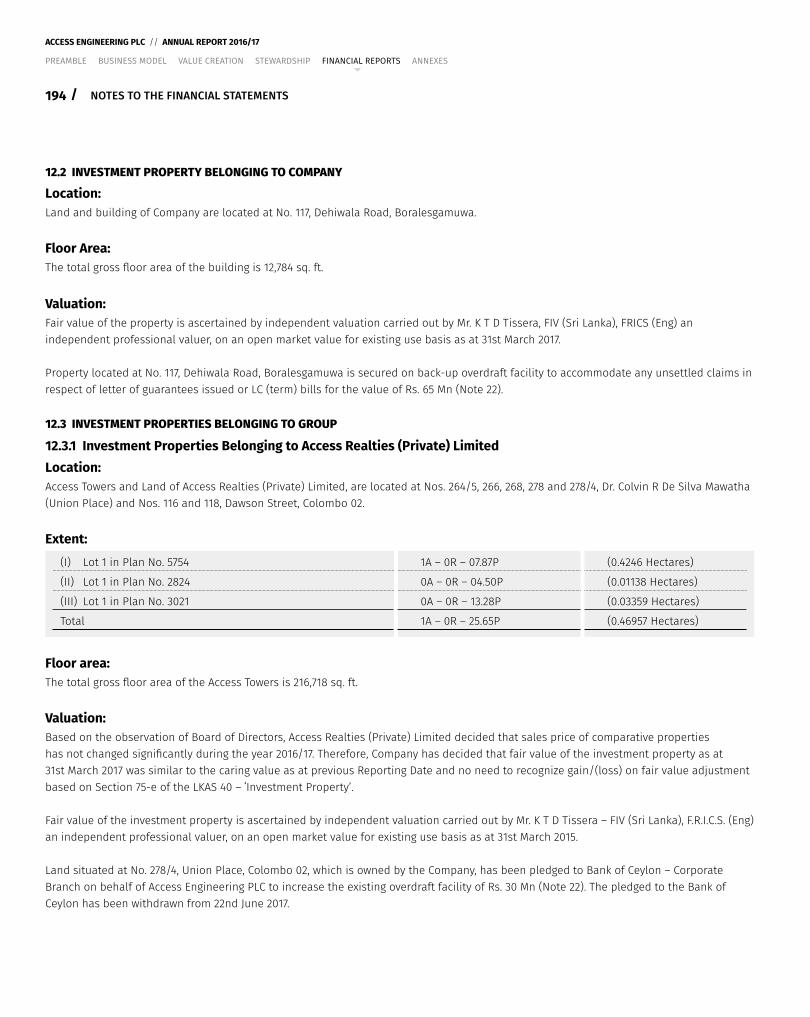
194 /
ACCESS ENGINEERING PLC // ANNUAL REPORT 2016/17
PREAMBLE BUSINESS MODEL VALUE CREATION STEWARDSHIP FINANCIAL REPORTS ANNEXES
NOTES TO THE FINANCIAL STATEMENTS
12.2 INVESTMENT PROPERTY BELONGING TO COMPANY
Location: Land and building of Company are located at No. 117, Dehiwala Road, Boralesgamuwa.
Floor Area:The total gross floor area of the building is 12,784 sq. ft.
Valuation:Fair value of the property is ascertained by independent valuation carried out by Mr. K T D Tissera, FIV (Sri Lanka), FRICS (Eng) an independent professional valuer, on an open market value for existing use basis as at 31st March 2017.
Property located at No. 117, Dehiwala Road, Boralesgamuwa is secured on back-up overdraft facility to accommodate any unsettled claims in respect of letter of guarantees issued or LC (term) bills for the value of Rs. 65 Mn (Note 22).
12.3 INVESTMENT PROPERTIES BELONGING TO GROUP
12.3.1 Investment Properties Belonging to Access Realties (Private) LimitedLocation: Access Towers and Land of Access Realties (Private) Limited, are located at Nos. 264/5, 266, 268, 278 and 278/4, Dr. Colvin R De Silva Mawatha (Union Place) and Nos. 116 and 118, Dawson Street, Colombo 02.
Extent:(I) Lot 1 in Plan No. 5754 1A – 0R – 07.87P (0.4246 Hectares)
(II) Lot 1 in Plan No. 2824 0A – 0R – 04.50P (0.01138 Hectares)
(III) Lot 1 in Plan No. 3021 0A – 0R – 13.28P (0.03359 Hectares)
Total 1A – 0R – 25.65P (0.46957 Hectares)
Floor area:The total gross floor area of the Access Towers is 216,718 sq. ft.
Valuation:Based on the observation of Board of Directors, Access Realties (Private) Limited decided that sales price of comparative properties has not changed significantly during the year 2016/17. Therefore, Company has decided that fair value of the investment property as at 31st March 2017 was similar to the caring value as at previous Reporting Date and no need to recognize gain/(loss) on fair value adjustment based on Section 75-e of the LKAS 40 – ʻInvestment Propertyʼ.
Fair value of the investment property is ascertained by independent valuation carried out by Mr. K T D Tissera – FIV (Sri Lanka), F.R.I.C.S. (Eng) an independent professional valuer, on an open market value for existing use basis as at 31st March 2015.
Land situated at No. 278/4, Union Place, Colombo 02, which is owned by the Company, has been pledged to Bank of Ceylon – Corporate Branch on behalf of Access Engineering PLC to increase the existing overdraft facility of Rs. 30 Mn (Note 22). The pledged to the Bank of Ceylon has been withdrawn from 22nd June 2017.
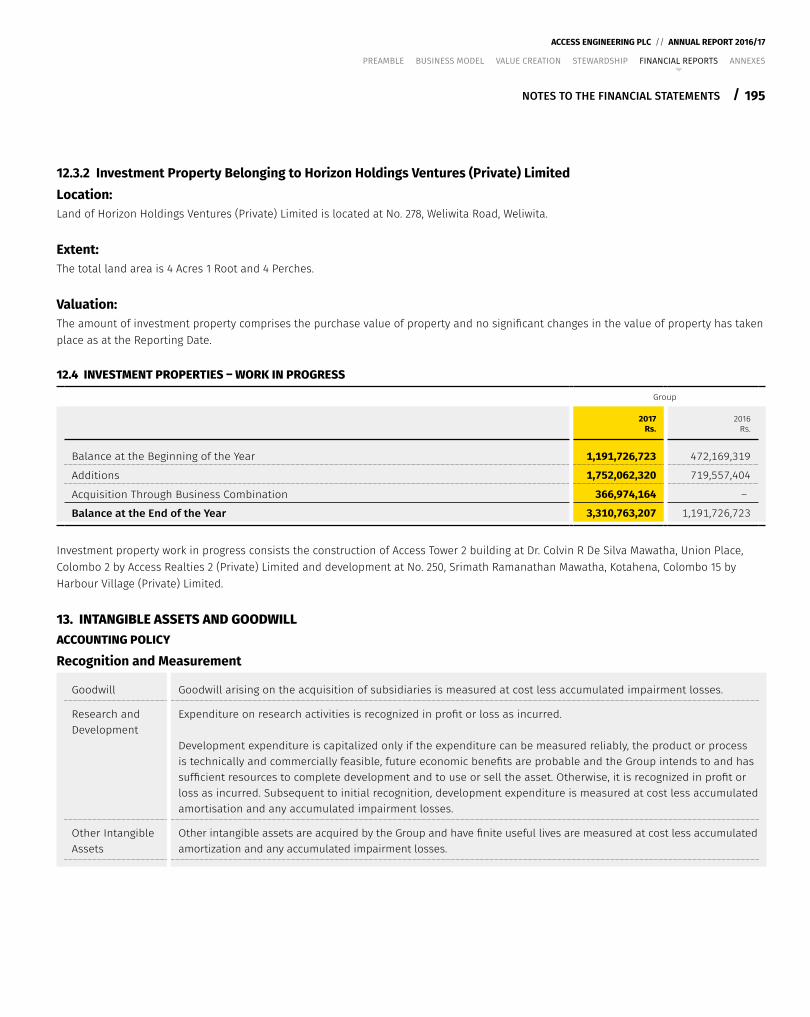
195
ACCESS ENGINEERING PLC // ANNUAL REPORT 2016/17
/
PREAMBLE BUSINESS MODEL VALUE CREATION STEWARDSHIP FINANCIAL REPORTS ANNEXES
NOTES TO THE FINANCIAL STATEMENTS
12.3.2 Investment Property Belonging to Horizon Holdings Ventures (Private) LimitedLocation: Land of Horizon Holdings Ventures (Private) Limited is located at No. 278, Weliwita Road, Weliwita.
Extent:The total land area is 4 Acres 1 Root and 4 Perches.
Valuation:The amount of investment property comprises the purchase value of property and no significant changes in the value of property has taken place as at the Reporting Date.
12.4 INVESTMENT PROPERTIES – WORK IN PROGRESS
Group
2017Rs.
2016Rs.
Balance at the Beginning of the Year 1,191,726,723 472,169,319
Additions 1,752,062,320 719,557,404
Acquisition Through Business Combination 366,974,164 –
Balance at the End of the Year 3,310,763,207 1,191,726,723
Investment property work in progress consists the construction of Access Tower 2 building at Dr. Colvin R De Silva Mawatha, Union Place, Colombo 2 by Access Realties 2 (Private) Limited and development at No. 250, Srimath Ramanathan Mawatha, Kotahena, Colombo 15 by Harbour Village (Private) Limited.
13. INTANGIBLE ASSETS AND GOODWILLACCOUNTING POLICY
Recognition and Measurement
Goodwill Goodwill arising on the acquisition of subsidiaries is measured at cost less accumulated impairment losses.
Research and Development
Expenditure on research activities is recognized in profit or loss as incurred.
Development expenditure is capitalized only if the expenditure can be measured reliably, the product or process is technically and commercially feasible, future economic benefits are probable and the Group intends to and has sufficient resources to complete development and to use or sell the asset. Otherwise, it is recognized in profit or loss as incurred. Subsequent to initial recognition, development expenditure is measured at cost less accumulated amortisation and any accumulated impairment losses.
Other Intangible Assets
Other intangible assets are acquired by the Group and have finite useful lives are measured at cost less accumulated amortization and any accumulated impairment losses.
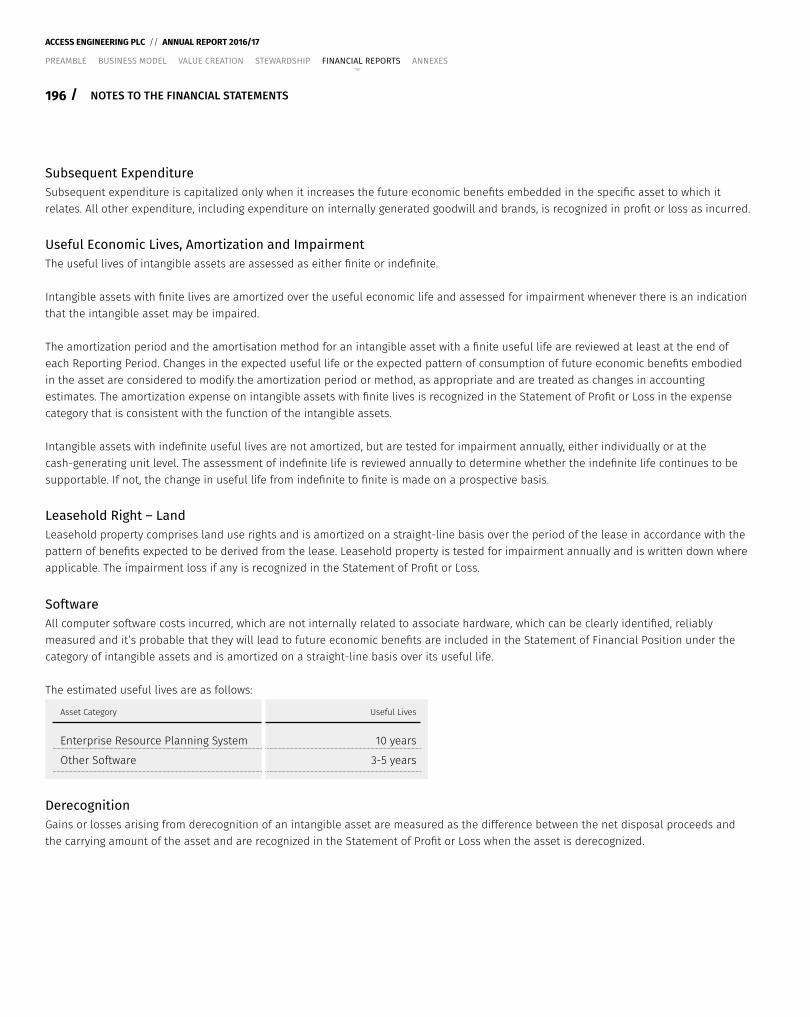
196 /
ACCESS ENGINEERING PLC // ANNUAL REPORT 2016/17
PREAMBLE BUSINESS MODEL VALUE CREATION STEWARDSHIP FINANCIAL REPORTS ANNEXES
NOTES TO THE FINANCIAL STATEMENTS
Subsequent ExpenditureSubsequent expenditure is capitalized only when it increases the future economic benefits embedded in the specific asset to which it relates. All other expenditure, including expenditure on internally generated goodwill and brands, is recognized in profit or loss as incurred.
Useful Economic Lives, Amortization and ImpairmentThe useful lives of intangible assets are assessed as either finite or indefinite.
Intangible assets with finite lives are amortized over the useful economic life and assessed for impairment whenever there is an indication that the intangible asset may be impaired.
The amortization period and the amortisation method for an intangible asset with a finite useful life are reviewed at least at the end of each Reporting Period. Changes in the expected useful life or the expected pattern of consumption of future economic benefits embodied in the asset are considered to modify the amortization period or method, as appropriate and are treated as changes in accounting estimates. The amortization expense on intangible assets with finite lives is recognized in the Statement of Profit or Loss in the expense category that is consistent with the function of the intangible assets.
Intangible assets with indefinite useful lives are not amortized, but are tested for impairment annually, either individually or at the cash-generating unit level. The assessment of indefinite life is reviewed annually to determine whether the indefinite life continues to be supportable. If not, the change in useful life from indefinite to finite is made on a prospective basis.
Leasehold Right – LandLeasehold property comprises land use rights and is amortized on a straight-line basis over the period of the lease in accordance with the pattern of benefits expected to be derived from the lease. Leasehold property is tested for impairment annually and is written down where applicable. The impairment loss if any is recognized in the Statement of Profit or Loss.
SoftwareAll computer software costs incurred, which are not internally related to associate hardware, which can be clearly identified, reliably measured and it’s probable that they will lead to future economic benefits are included in the Statement of Financial Position under the category of intangible assets and is amortized on a straight-line basis over its useful life.
The estimated useful lives are as follows:
Asset Category Useful Lives
Enterprise Resource Planning System 10 years
Other Software 3-5 years
Derecognition Gains or losses arising from derecognition of an intangible asset are measured as the difference between the net disposal proceeds and the carrying amount of the asset and are recognized in the Statement of Profit or Loss when the asset is derecognized.
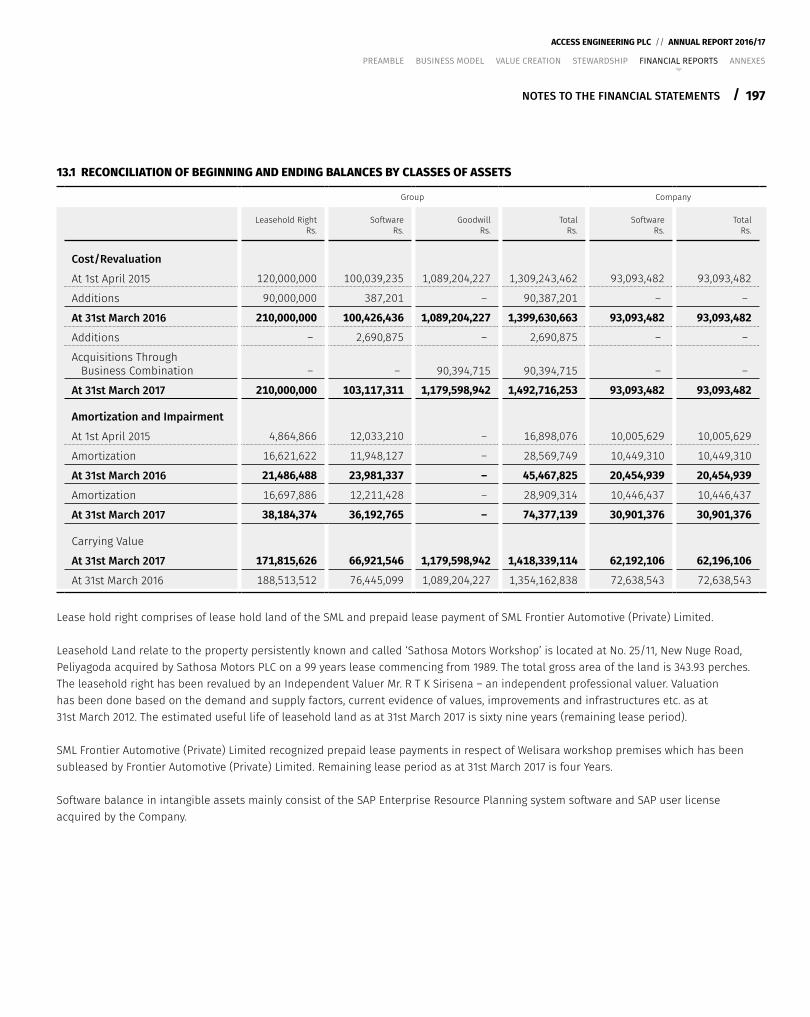
197
ACCESS ENGINEERING PLC // ANNUAL REPORT 2016/17
/
PREAMBLE BUSINESS MODEL VALUE CREATION STEWARDSHIP FINANCIAL REPORTS ANNEXES
NOTES TO THE FINANCIAL STATEMENTS
13.1 RECONCILIATION OF BEGINNING AND ENDING BALANCES BY CLASSES OF ASSETS
Group Company
Leasehold RightRs.
SoftwareRs.
GoodwillRs.
TotalRs.
SoftwareRs.
TotalRs.
Cost/Revaluation
At 1st April 2015 120,000,000 100,039,235 1,089,204,227 1,309,243,462 93,093,482 93,093,482
Additions 90,000,000 387,201 – 90,387,201 – –
At 31st March 2016 210,000,000 100,426,436 1,089,204,227 1,399,630,663 93,093,482 93,093,482
Additions – 2,690,875 – 2,690,875 – –
Acquisitions Through Business Combination – – 90,394,715 90,394,715 – –
At 31st March 2017 210,000,000 103,117,311 1,179,598,942 1,492,716,253 93,093,482 93,093,482
Amortization and Impairment
At 1st April 2015 4,864,866 12,033,210 – 16,898,076 10,005,629 10,005,629
Amortization 16,621,622 11,948,127 – 28,569,749 10,449,310 10,449,310
At 31st March 2016 21,486,488 23,981,337 – 45,467,825 20,454,939 20,454,939
Amortization 16,697,886 12,211,428 – 28,909,314 10,446,437 10,446,437
At 31st March 2017 38,184,374 36,192,765 – 74,377,139 30,901,376 30,901,376
Carrying Value
At 31st March 2017 171,815,626 66,921,546 1,179,598,942 1,418,339,114 62,192,106 62,196,106
At 31st March 2016 188,513,512 76,445,099 1,089,204,227 1,354,162,838 72,638,543 72,638,543
Lease hold right comprises of lease hold land of the SML and prepaid lease payment of SML Frontier Automotive (Private) Limited.
Leasehold Land relate to the property persistently known and called ‘Sathosa Motors Workshop’ is located at No. 25/11, New Nuge Road, Peliyagoda acquired by Sathosa Motors PLC on a 99 years lease commencing from 1989. The total gross area of the land is 343.93 perches. The leasehold right has been revalued by an Independent Valuer Mr. R T K Sirisena – an independent professional valuer. Valuation has been done based on the demand and supply factors, current evidence of values, improvements and infrastructures etc. as at 31st March 2012. The estimated useful life of leasehold land as at 31st March 2017 is sixty nine years (remaining lease period).
SML Frontier Automotive (Private) Limited recognized prepaid lease payments in respect of Welisara workshop premises which has been subleased by Frontier Automotive (Private) Limited. Remaining lease period as at 31st March 2017 is four Years.
Software balance in intangible assets mainly consist of the SAP Enterprise Resource Planning system software and SAP user license acquired by the Company.
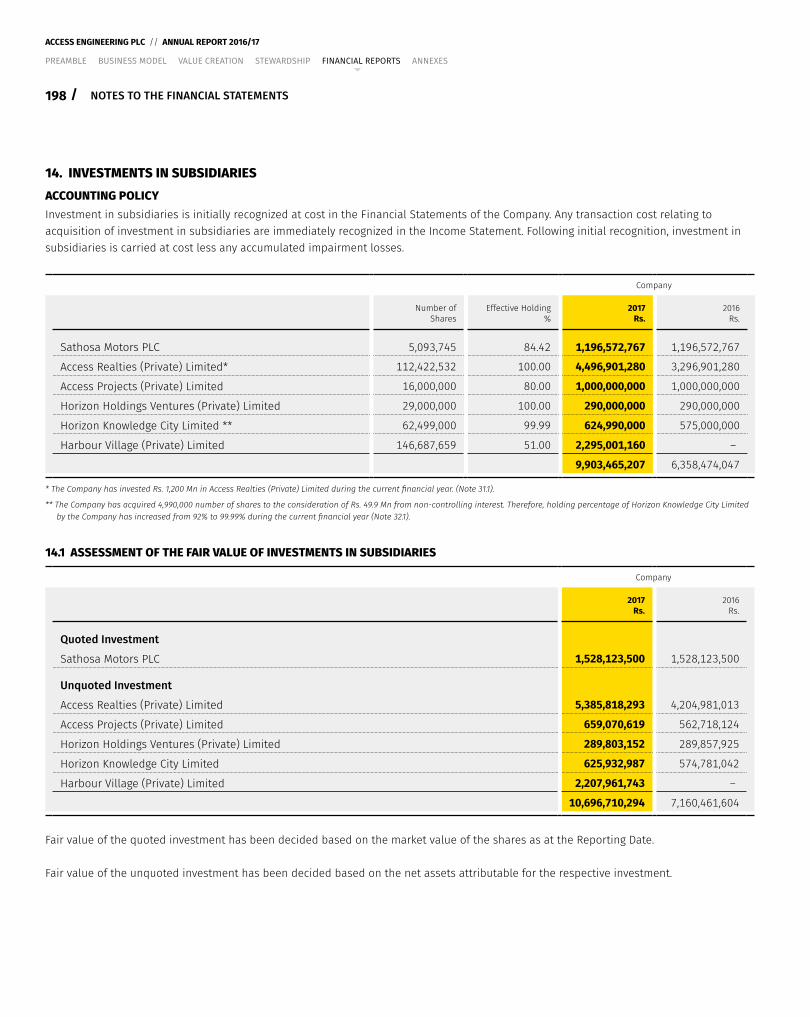
198 /
ACCESS ENGINEERING PLC // ANNUAL REPORT 2016/17
PREAMBLE BUSINESS MODEL VALUE CREATION STEWARDSHIP FINANCIAL REPORTS ANNEXES
NOTES TO THE FINANCIAL STATEMENTS
14. INVESTMENTS IN SUBSIDIARIESACCOUNTING POLICYInvestment in subsidiaries is initially recognized at cost in the Financial Statements of the Company. Any transaction cost relating to acquisition of investment in subsidiaries are immediately recognized in the Income Statement. Following initial recognition, investment in subsidiaries is carried at cost less any accumulated impairment losses.
Company
Number of Shares
Effective Holding %
2017Rs.
2016Rs.
Sathosa Motors PLC 5,093,745 84.42 1,196,572,767 1,196,572,767
Access Realties (Private) Limited* 112,422,532 100.00 4,496,901,280 3,296,901,280
Access Projects (Private) Limited 16,000,000 80.00 1,000,000,000 1,000,000,000
Horizon Holdings Ventures (Private) Limited 29,000,000 100.00 290,000,000 290,000,000
Horizon Knowledge City Limited ** 62,499,000 99.99 624,990,000 575,000,000
Harbour Village (Private) Limited 146,687,659 51.00 2,295,001,160 –
9,903,465,207 6,358,474,047
* The Company has invested Rs. 1,200 Mn in Access Realties (Private) Limited during the current financial year. (Note 31.1).
** The Company has acquired 4,990,000 number of shares to the consideration of Rs. 49.9 Mn from non-controlling interest. Therefore, holding percentage of Horizon Knowledge City Limited by the Company has increased from 92% to 99.99% during the current financial year (Note 32.1).
14.1 ASSESSMENT OF THE FAIR VALUE OF INVESTMENTS IN SUBSIDIARIES
Company
2017Rs.
2016Rs.
Quoted Investment
Sathosa Motors PLC 1,528,123,500 1,528,123,500
Unquoted Investment
Access Realties (Private) Limited 5,385,818,293 4,204,981,013
Access Projects (Private) Limited 659,070,619 562,718,124
Horizon Holdings Ventures (Private) Limited 289,803,152 289,857,925
Horizon Knowledge City Limited 625,932,987 574,781,042
Harbour Village (Private) Limited 2,207,961,743 –
10,696,710,294 7,160,461,604
Fair value of the quoted investment has been decided based on the market value of the shares as at the Reporting Date.
Fair value of the unquoted investment has been decided based on the net assets attributable for the respective investment.
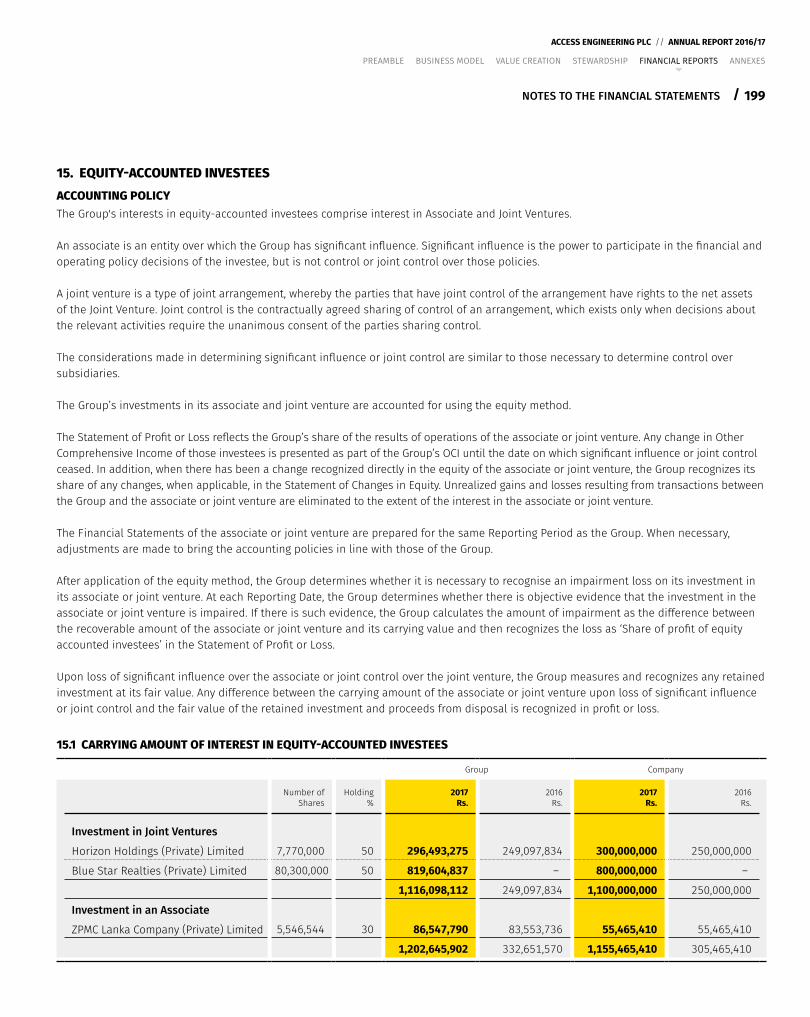
199
ACCESS ENGINEERING PLC // ANNUAL REPORT 2016/17
/
PREAMBLE BUSINESS MODEL VALUE CREATION STEWARDSHIP FINANCIAL REPORTS ANNEXES
NOTES TO THE FINANCIAL STATEMENTS
15. EQUITY-ACCOUNTED INVESTEESACCOUNTING POLICYThe Group's interests in equity-accounted investees comprise interest in Associate and Joint Ventures.
An associate is an entity over which the Group has significant influence. Significant influence is the power to participate in the financial and operating policy decisions of the investee, but is not control or joint control over those policies.
A joint venture is a type of joint arrangement, whereby the parties that have joint control of the arrangement have rights to the net assets of the Joint Venture. Joint control is the contractually agreed sharing of control of an arrangement, which exists only when decisions about the relevant activities require the unanimous consent of the parties sharing control.
The considerations made in determining significant influence or joint control are similar to those necessary to determine control over subsidiaries.
The Group’s investments in its associate and joint venture are accounted for using the equity method.
The Statement of Profit or Loss reflects the Group’s share of the results of operations of the associate or joint venture. Any change in Other Comprehensive Income of those investees is presented as part of the Group’s OCI until the date on which significant influence or joint control ceased. In addition, when there has been a change recognized directly in the equity of the associate or joint venture, the Group recognizes its share of any changes, when applicable, in the Statement of Changes in Equity. Unrealized gains and losses resulting from transactions between the Group and the associate or joint venture are eliminated to the extent of the interest in the associate or joint venture.
The Financial Statements of the associate or joint venture are prepared for the same Reporting Period as the Group. When necessary, adjustments are made to bring the accounting policies in line with those of the Group.
After application of the equity method, the Group determines whether it is necessary to recognise an impairment loss on its investment in its associate or joint venture. At each Reporting Date, the Group determines whether there is objective evidence that the investment in the associate or joint venture is impaired. If there is such evidence, the Group calculates the amount of impairment as the difference between the recoverable amount of the associate or joint venture and its carrying value and then recognizes the loss as ‘Share of profit of equity accounted investees’ in the Statement of Profit or Loss.
Upon loss of significant influence over the associate or joint control over the joint venture, the Group measures and recognizes any retained investment at its fair value. Any difference between the carrying amount of the associate or joint venture upon loss of significant influence or joint control and the fair value of the retained investment and proceeds from disposal is recognized in profit or loss.
15.1 CARRYING AMOUNT OF INTEREST IN EQUITY-ACCOUNTED INVESTEES
Group Company
Number of Shares
Holding %
2017Rs.
2016Rs.
2017Rs.
2016Rs.
Investment in Joint Ventures
Horizon Holdings (Private) Limited 7,770,000 50 296,493,275 249,097,834 300,000,000 250,000,000
Blue Star Realties (Private) Limited 80,300,000 50 819,604,837 – 800,000,000 –
1,116,098,112 249,097,834 1,100,000,000 250,000,000
Investment in an Associate
ZPMC Lanka Company (Private) Limited 5,546,544 30 86,547,790 83,553,736 55,465,410 55,465,410
1,202,645,902 332,651,570 1,155,465,410 305,465,410
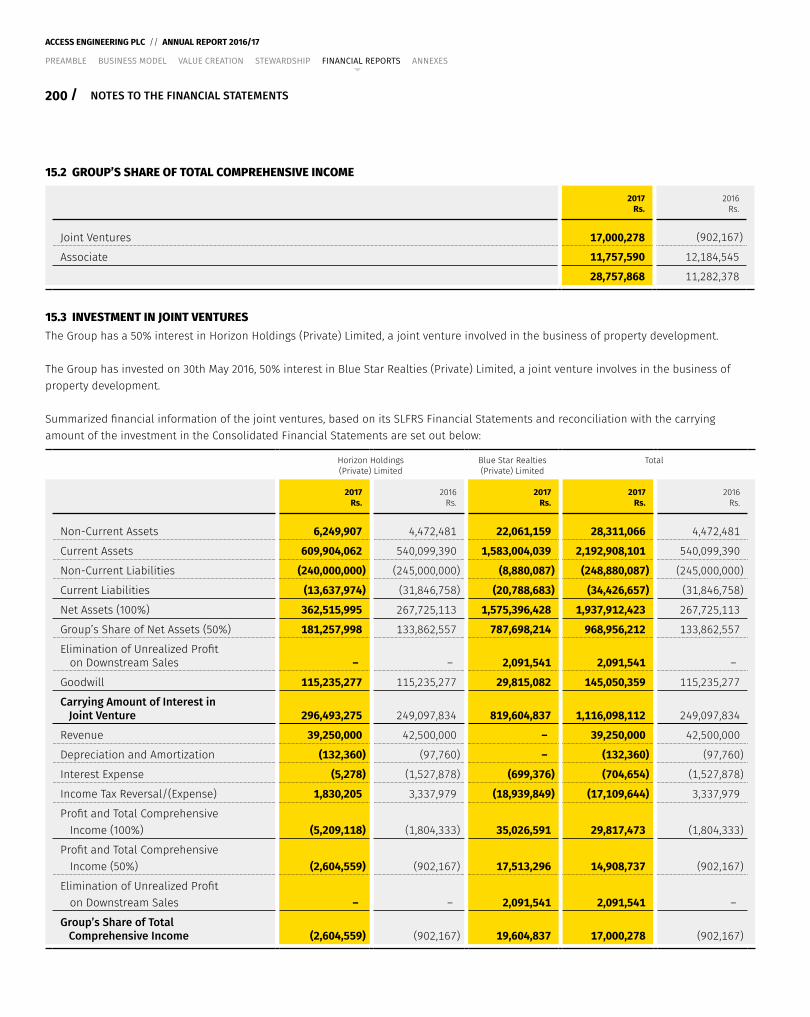
200 /
ACCESS ENGINEERING PLC // ANNUAL REPORT 2016/17
PREAMBLE BUSINESS MODEL VALUE CREATION STEWARDSHIP FINANCIAL REPORTS ANNEXES
NOTES TO THE FINANCIAL STATEMENTS
15.2 GROUP’S SHARE OF TOTAL COMPREHENSIVE INCOME
2017Rs.
2016Rs.
Joint Ventures 17,000,278 (902,167)
Associate 11,757,590 12,184,545
28,757,868 11,282,378
15.3 INVESTMENT IN JOINT VENTURESThe Group has a 50% interest in Horizon Holdings (Private) Limited, a joint venture involved in the business of property development.
The Group has invested on 30th May 2016, 50% interest in Blue Star Realties (Private) Limited, a joint venture involves in the business of property development.
Summarized financial information of the joint ventures, based on its SLFRS Financial Statements and reconciliation with the carrying amount of the investment in the Consolidated Financial Statements are set out below:
Horizon Holdings (Private) Limited
Blue Star Realties (Private) Limited
Total
2017Rs.
2016Rs.
2017Rs.
2017Rs.
2016Rs.
Non-Current Assets 6,249,907 4,472,481 22,061,159 28,311,066 4,472,481
Current Assets 609,904,062 540,099,390 1,583,004,039 2,192,908,101 540,099,390
Non-Current Liabilities (240,000,000) (245,000,000) (8,880,087) (248,880,087) (245,000,000)
Current Liabilities (13,637,974) (31,846,758) (20,788,683) (34,426,657) (31,846,758)
Net Assets (100%) 362,515,995 267,725,113 1,575,396,428 1,937,912,423 267,725,113
Group’s Share of Net Assets (50%) 181,257,998 133,862,557 787,698,214 968,956,212 133,862,557
Elimination of Unrealized Profit on Downstream Sales – – 2,091,541 2,091,541 –
Goodwill 115,235,277 115,235,277 29,815,082 145,050,359 115,235,277
Carrying Amount of Interest in Joint Venture 296,493,275 249,097,834 819,604,837 1,116,098,112 249,097,834
Revenue 39,250,000 42,500,000 – 39,250,000 42,500,000
Depreciation and Amortization (132,360) (97,760) – (132,360) (97,760)
Interest Expense (5,278) (1,527,878) (699,376) (704,654) (1,527,878)
Income Tax Reversal/(Expense) 1,830,205 3,337,979 (18,939,849) (17,109,644) 3,337,979
Profit and Total Comprehensive Income (100%) (5,209,118) (1,804,333) 35,026,591 29,817,473 (1,804,333)
Profit and Total Comprehensive Income (50%) (2,604,559) (902,167) 17,513,296 14,908,737 (902,167)
Elimination of Unrealized Profit on Downstream Sales – – 2,091,541 2,091,541 –
Group’s Share of Total Comprehensive Income (2,604,559) (902,167) 19,604,837 17,000,278 (902,167)
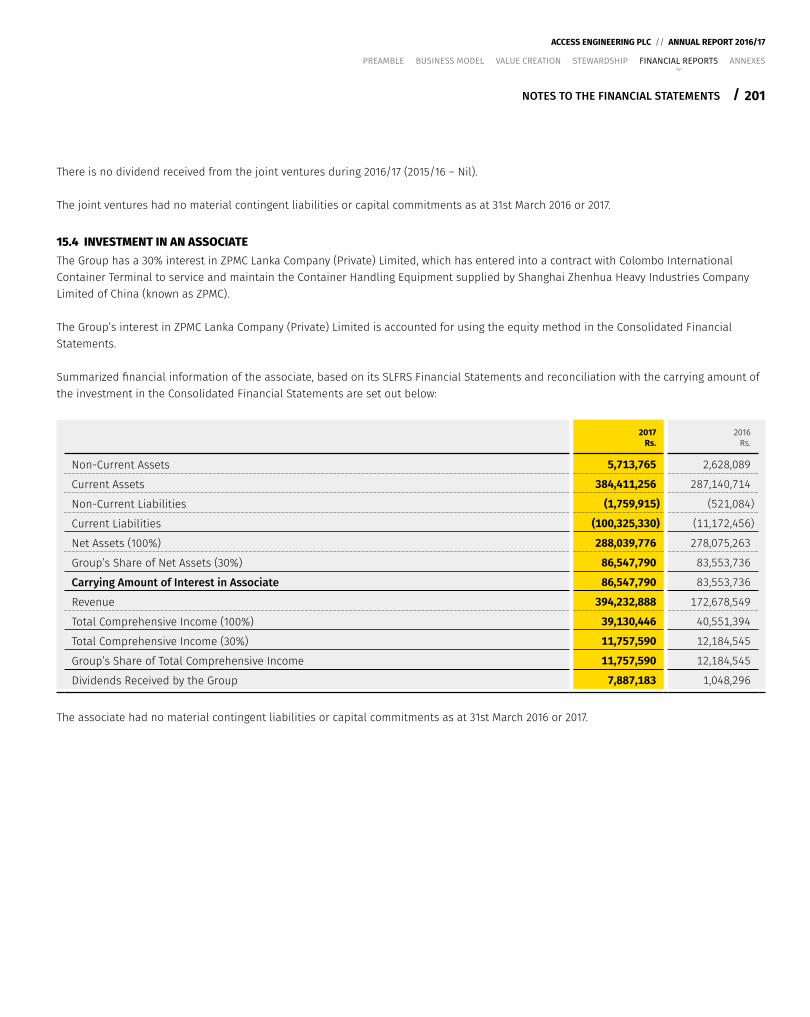
201
ACCESS ENGINEERING PLC // ANNUAL REPORT 2016/17
/
PREAMBLE BUSINESS MODEL VALUE CREATION STEWARDSHIP FINANCIAL REPORTS ANNEXES
NOTES TO THE FINANCIAL STATEMENTS
There is no dividend received from the joint ventures during 2016/17 (2015/16 – Nil).
The joint ventures had no material contingent liabilities or capital commitments as at 31st March 2016 or 2017.
15.4 INVESTMENT IN AN ASSOCIATEThe Group has a 30% interest in ZPMC Lanka Company (Private) Limited, which has entered into a contract with Colombo International Container Terminal to service and maintain the Container Handling Equipment supplied by Shanghai Zhenhua Heavy Industries Company Limited of China (known as ZPMC).
The Group’s interest in ZPMC Lanka Company (Private) Limited is accounted for using the equity method in the Consolidated Financial Statements.
Summarized financial information of the associate, based on its SLFRS Financial Statements and reconciliation with the carrying amount of the investment in the Consolidated Financial Statements are set out below:
2017Rs.
2016Rs.
Non-Current Assets 5,713,765 2,628,089
Current Assets 384,411,256 287,140,714
Non-Current Liabilities (1,759,915) (521,084)
Current Liabilities (100,325,330) (11,172,456)
Net Assets (100%) 288,039,776 278,075,263
Group’s Share of Net Assets (30%) 86,547,790 83,553,736
Carrying Amount of Interest in Associate 86,547,790 83,553,736
Revenue 394,232,888 172,678,549
Total Comprehensive Income (100%) 39,130,446 40,551,394
Total Comprehensive Income (30%) 11,757,590 12,184,545
Group’s Share of Total Comprehensive Income 11,757,590 12,184,545
Dividends Received by the Group 7,887,183 1,048,296
The associate had no material contingent liabilities or capital commitments as at 31st March 2016 or 2017.
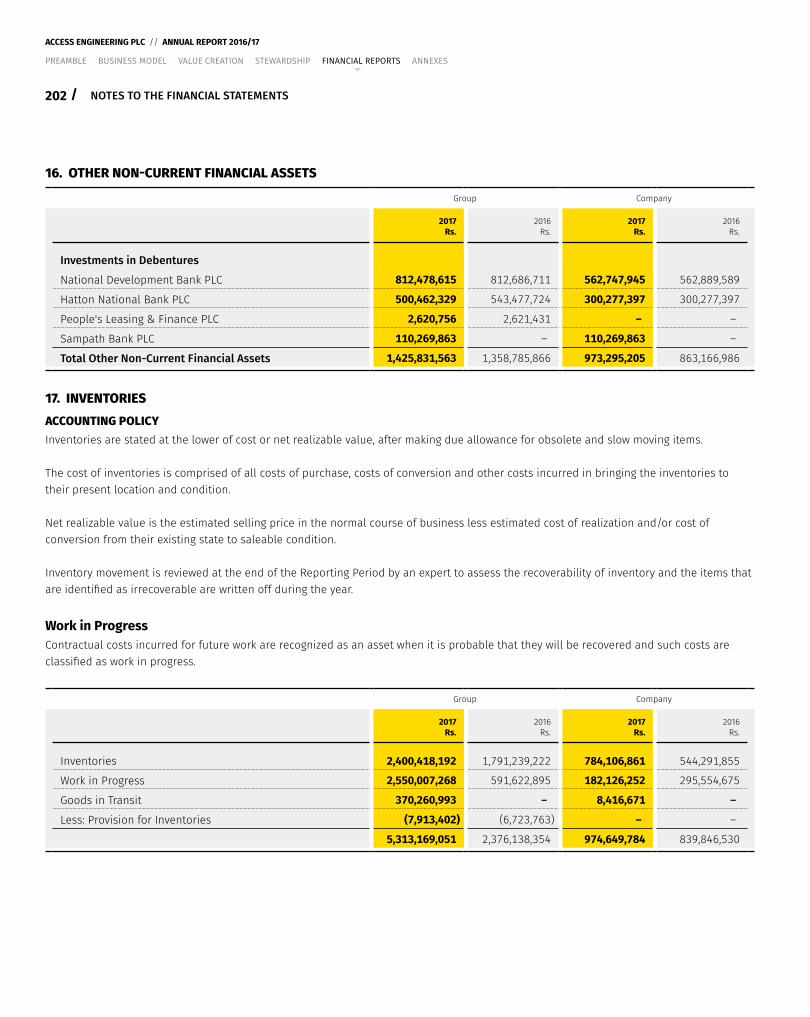
202 /
ACCESS ENGINEERING PLC // ANNUAL REPORT 2016/17
PREAMBLE BUSINESS MODEL VALUE CREATION STEWARDSHIP FINANCIAL REPORTS ANNEXES
NOTES TO THE FINANCIAL STATEMENTS
16. OTHER NON-CURRENT FINANCIAL ASSETS
Group Company
2017Rs.
2016Rs.
2017Rs.
2016Rs.
Investments in Debentures
National Development Bank PLC 812,478,615 812,686,711 562,747,945 562,889,589
Hatton National Bank PLC 500,462,329 543,477,724 300,277,397 300,277,397
People's Leasing & Finance PLC 2,620,756 2,621,431 – –
Sampath Bank PLC 110,269,863 – 110,269,863 –
Total Other Non-Current Financial Assets 1,425,831,563 1,358,785,866 973,295,205 863,166,986
17. INVENTORIESACCOUNTING POLICYInventories are stated at the lower of cost or net realizable value, after making due allowance for obsolete and slow moving items.
The cost of inventories is comprised of all costs of purchase, costs of conversion and other costs incurred in bringing the inventories to their present location and condition.
Net realizable value is the estimated selling price in the normal course of business less estimated cost of realization and/or cost of conversion from their existing state to saleable condition.
Inventory movement is reviewed at the end of the Reporting Period by an expert to assess the recoverability of inventory and the items that are identified as irrecoverable are written off during the year.
Work in ProgressContractual costs incurred for future work are recognized as an asset when it is probable that they will be recovered and such costs are classified as work in progress.
Group Company
2017Rs.
2016Rs.
2017Rs.
2016Rs.
Inventories 2,400,418,192 1,791,239,222 784,106,861 544,291,855
Work in Progress 2,550,007,268 591,622,895 182,126,252 295,554,675
Goods in Transit 370,260,993 – 8,416,671 –
Less: Provision for Inventories (7,913,402) (6,723,763) – –
5,313,169,051 2,376,138,354 974,649,784 839,846,530
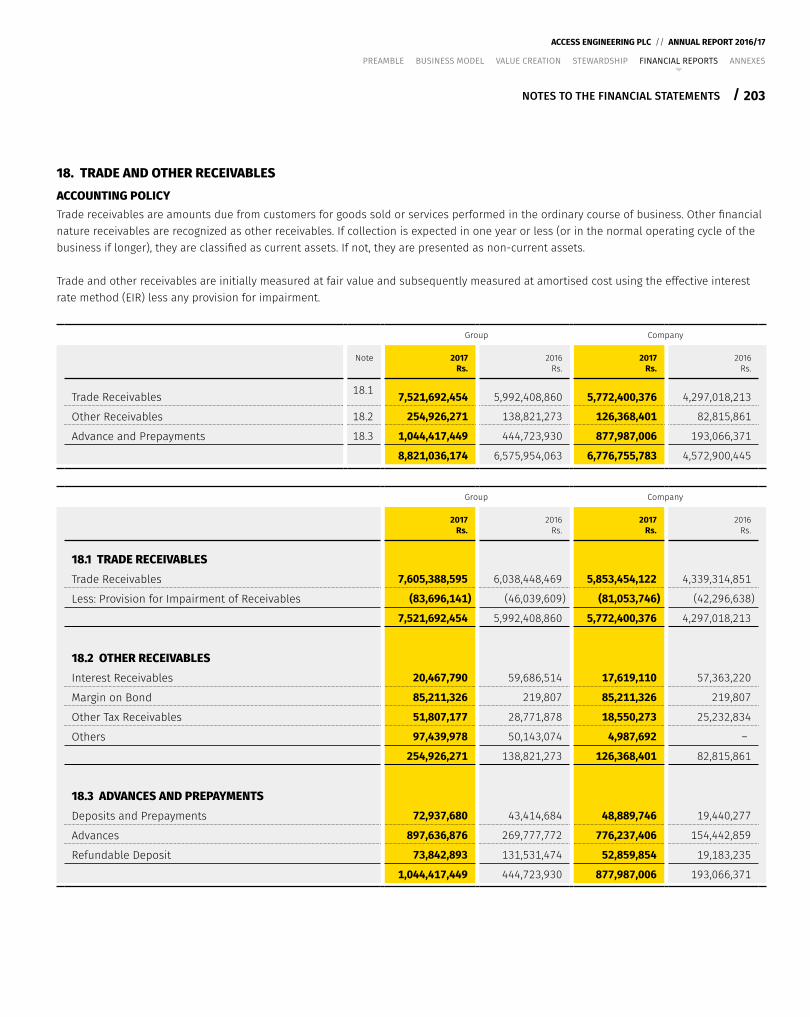
203
ACCESS ENGINEERING PLC // ANNUAL REPORT 2016/17
/
PREAMBLE BUSINESS MODEL VALUE CREATION STEWARDSHIP FINANCIAL REPORTS ANNEXES
NOTES TO THE FINANCIAL STATEMENTS
18. TRADE AND OTHER RECEIVABLESACCOUNTING POLICYTrade receivables are amounts due from customers for goods sold or services performed in the ordinary course of business. Other financial nature receivables are recognized as other receivables. If collection is expected in one year or less (or in the normal operating cycle of the business if longer), they are classified as current assets. If not, they are presented as non-current assets.
Trade and other receivables are initially measured at fair value and subsequently measured at amortised cost using the effective interest rate method (EIR) less any provision for impairment.
Group Company
Note 2017Rs.
2016Rs.
2017Rs.
2016Rs.
Trade Receivables 18.1 7,521,692,454 5,992,408,860 5,772,400,376 4,297,018,213
Other Receivables 18.2 254,926,271 138,821,273 126,368,401 82,815,861
Advance and Prepayments 18.3 1,044,417,449 444,723,930 877,987,006 193,066,371
8,821,036,174 6,575,954,063 6,776,755,783 4,572,900,445
Group Company
2017Rs.
2016Rs.
2017Rs.
2016Rs.
18.1 TRADE RECEIVABLESTrade Receivables 7,605,388,595 6,038,448,469 5,853,454,122 4,339,314,851
Less: Provision for Impairment of Receivables (83,696,141) (46,039,609) (81,053,746) (42,296,638)
7,521,692,454 5,992,408,860 5,772,400,376 4,297,018,213
18.2 OTHER RECEIVABLESInterest Receivables 20,467,790 59,686,514 17,619,110 57,363,220
Margin on Bond 85,211,326 219,807 85,211,326 219,807
Other Tax Receivables 51,807,177 28,771,878 18,550,273 25,232,834
Others 97,439,978 50,143,074 4,987,692 –
254,926,271 138,821,273 126,368,401 82,815,861
18.3 ADVANCES AND PREPAYMENTSDeposits and Prepayments 72,937,680 43,414,684 48,889,746 19,440,277
Advances 897,636,876 269,777,772 776,237,406 154,442,859
Refundable Deposit 73,842,893 131,531,474 52,859,854 19,183,235
1,044,417,449 444,723,930 877,987,006 193,066,371
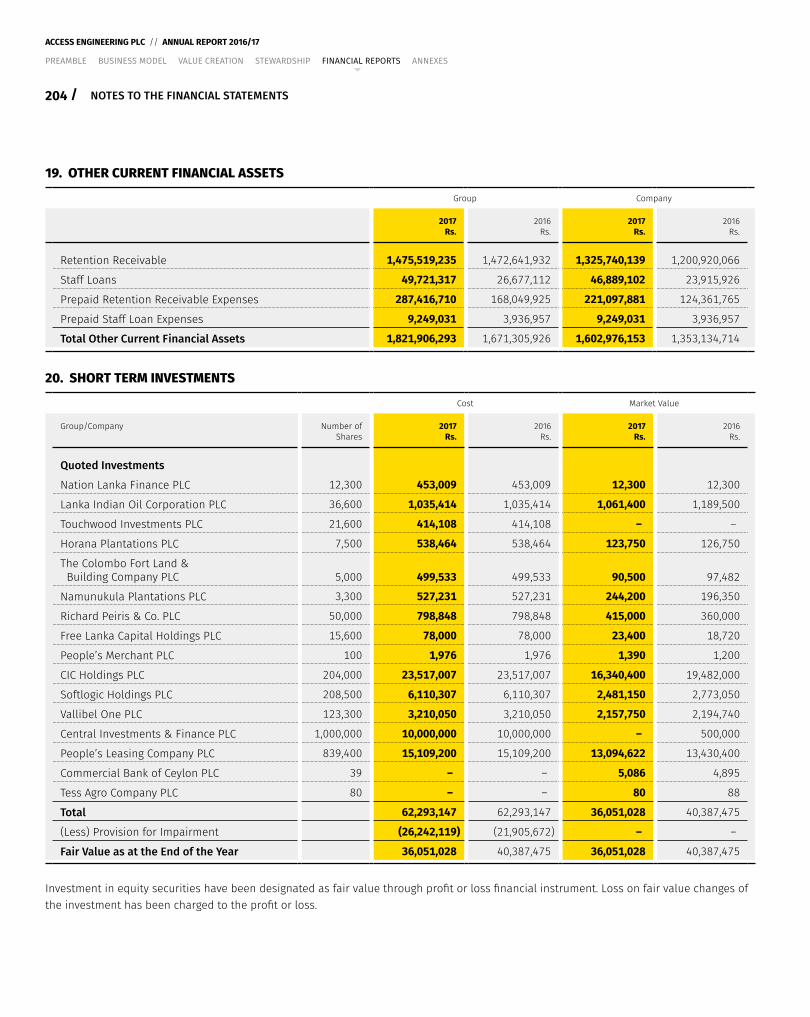
204 /
ACCESS ENGINEERING PLC // ANNUAL REPORT 2016/17
PREAMBLE BUSINESS MODEL VALUE CREATION STEWARDSHIP FINANCIAL REPORTS ANNEXES
NOTES TO THE FINANCIAL STATEMENTS
19. OTHER CURRENT FINANCIAL ASSETS
Group Company
2017Rs.
2016Rs.
2017Rs.
2016Rs.
Retention Receivable 1,475,519,235 1,472,641,932 1,325,740,139 1,200,920,066
Staff Loans 49,721,317 26,677,112 46,889,102 23,915,926
Prepaid Retention Receivable Expenses 287,416,710 168,049,925 221,097,881 124,361,765
Prepaid Staff Loan Expenses 9,249,031 3,936,957 9,249,031 3,936,957
Total Other Current Financial Assets 1,821,906,293 1,671,305,926 1,602,976,153 1,353,134,714
20. SHORT TERM INVESTMENTS
Cost Market Value
Group/Company Number of Shares
2017Rs.
2016Rs.
2017Rs.
2016Rs.
Quoted Investments
Nation Lanka Finance PLC 12,300 453,009 453,009 12,300 12,300
Lanka Indian Oil Corporation PLC 36,600 1,035,414 1,035,414 1,061,400 1,189,500
Touchwood Investments PLC 21,600 414,108 414,108 – –
Horana Plantations PLC 7,500 538,464 538,464 123,750 126,750
The Colombo Fort Land & Building Company PLC 5,000 499,533 499,533 90,500 97,482
Namunukula Plantations PLC 3,300 527,231 527,231 244,200 196,350
Richard Peiris & Co. PLC 50,000 798,848 798,848 415,000 360,000
Free Lanka Capital Holdings PLC 15,600 78,000 78,000 23,400 18,720
People’s Merchant PLC 100 1,976 1,976 1,390 1,200
CIC Holdings PLC 204,000 23,517,007 23,517,007 16,340,400 19,482,000
Softlogic Holdings PLC 208,500 6,110,307 6,110,307 2,481,150 2,773,050
Vallibel One PLC 123,300 3,210,050 3,210,050 2,157,750 2,194,740
Central Investments & Finance PLC 1,000,000 10,000,000 10,000,000 – 500,000
People’s Leasing Company PLC 839,400 15,109,200 15,109,200 13,094,622 13,430,400
Commercial Bank of Ceylon PLC 39 – – 5,086 4,895
Tess Agro Company PLC 80 – – 80 88
Total 62,293,147 62,293,147 36,051,028 40,387,475
(Less) Provision for Impairment (26,242,119) (21,905,672) – –
Fair Value as at the End of the Year 36,051,028 40,387,475 36,051,028 40,387,475
Investment in equity securities have been designated as fair value through profit or loss financial instrument. Loss on fair value changes of the investment has been charged to the profit or loss.
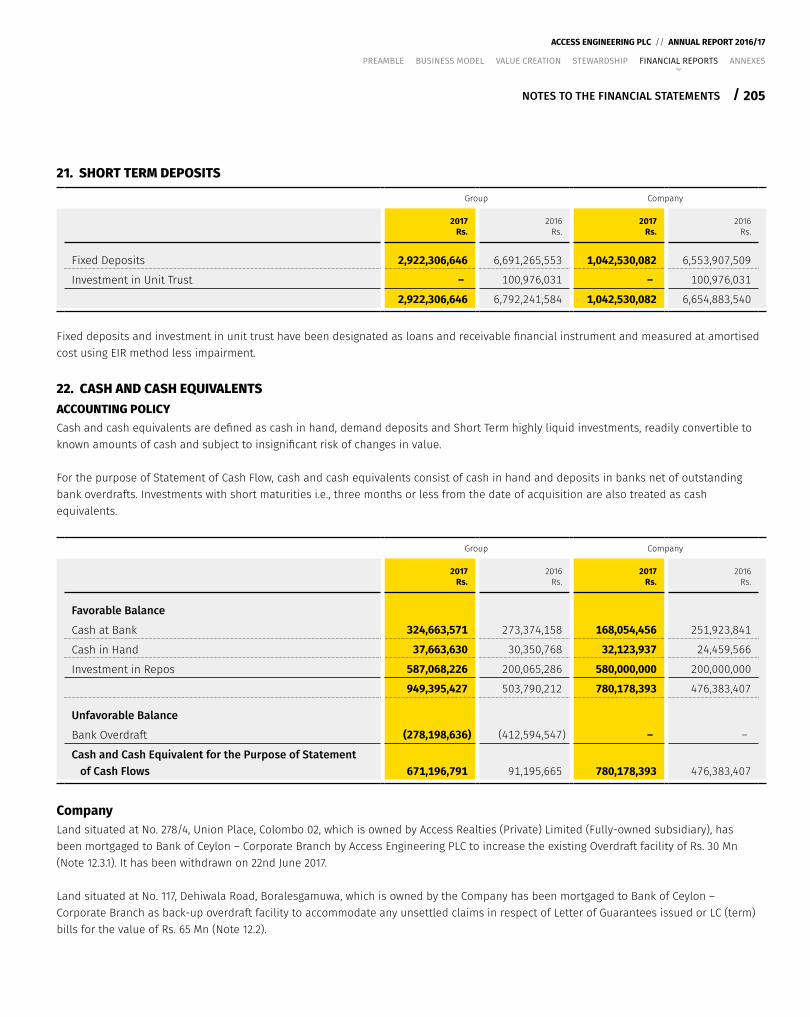
205
ACCESS ENGINEERING PLC // ANNUAL REPORT 2016/17
/
PREAMBLE BUSINESS MODEL VALUE CREATION STEWARDSHIP FINANCIAL REPORTS ANNEXES
NOTES TO THE FINANCIAL STATEMENTS
21. SHORT TERM DEPOSITS
Group Company
2017Rs.
2016Rs.
2017Rs.
2016Rs.
Fixed Deposits 2,922,306,646 6,691,265,553 1,042,530,082 6,553,907,509
Investment in Unit Trust – 100,976,031 – 100,976,031
2,922,306,646 6,792,241,584 1,042,530,082 6,654,883,540
Fixed deposits and investment in unit trust have been designated as loans and receivable financial instrument and measured at amortised cost using EIR method less impairment.
22. CASH AND CASH EQUIVALENTSACCOUNTING POLICYCash and cash equivalents are defined as cash in hand, demand deposits and Short Term highly liquid investments, readily convertible to known amounts of cash and subject to insignificant risk of changes in value.
For the purpose of Statement of Cash Flow, cash and cash equivalents consist of cash in hand and deposits in banks net of outstanding bank overdrafts. Investments with short maturities i.e., three months or less from the date of acquisition are also treated as cash equivalents.
Group Company
2017Rs.
2016Rs.
2017Rs.
2016Rs.
Favorable Balance
Cash at Bank 324,663,571 273,374,158 168,054,456 251,923,841
Cash in Hand 37,663,630 30,350,768 32,123,937 24,459,566
Investment in Repos 587,068,226 200,065,286 580,000,000 200,000,000
949,395,427 503,790,212 780,178,393 476,383,407
Unfavorable Balance
Bank Overdraft (278,198,636) (412,594,547) – –
Cash and Cash Equivalent for the Purpose of Statement of Cash Flows 671,196,791 91,195,665 780,178,393 476,383,407
CompanyLand situated at No. 278/4, Union Place, Colombo 02, which is owned by Access Realties (Private) Limited (Fully-owned subsidiary), has been mortgaged to Bank of Ceylon – Corporate Branch by Access Engineering PLC to increase the existing Overdraft facility of Rs. 30 Mn (Note 12.3.1). It has been withdrawn on 22nd June 2017.
Land situated at No. 117, Dehiwala Road, Boralesgamuwa, which is owned by the Company has been mortgaged to Bank of Ceylon – Corporate Branch as back-up overdraft facility to accommodate any unsettled claims in respect of Letter of Guarantees issued or LC (term) bills for the value of Rs. 65 Mn (Note 12.2).
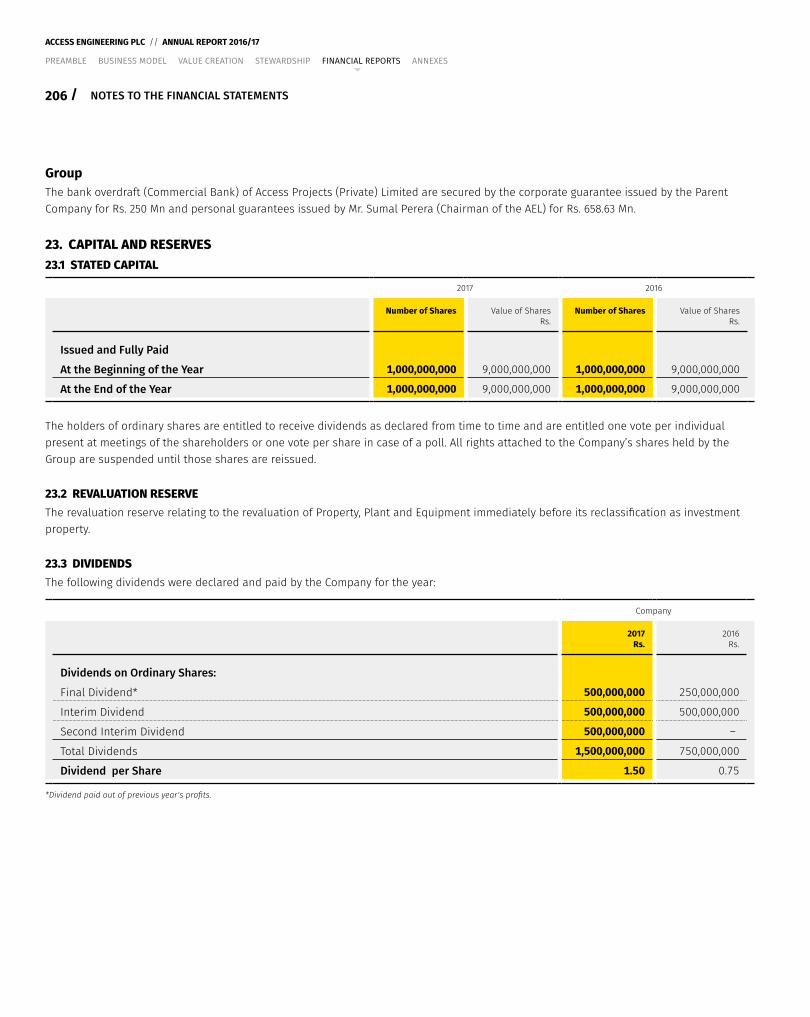
206 /
ACCESS ENGINEERING PLC // ANNUAL REPORT 2016/17
PREAMBLE BUSINESS MODEL VALUE CREATION STEWARDSHIP FINANCIAL REPORTS ANNEXES
NOTES TO THE FINANCIAL STATEMENTS
GroupThe bank overdraft (Commercial Bank) of Access Projects (Private) Limited are secured by the corporate guarantee issued by the Parent Company for Rs. 250 Mn and personal guarantees issued by Mr. Sumal Perera (Chairman of the AEL) for Rs. 658.63 Mn.
23. CAPITAL AND RESERVES 23.1 STATED CAPITAL
2017 2016
Number of Shares Value of SharesRs.
Number of Shares Value of SharesRs.
Issued and Fully Paid
At the Beginning of the Year 1,000,000,000 9,000,000,000 1,000,000,000 9,000,000,000
At the End of the Year 1,000,000,000 9,000,000,000 1,000,000,000 9,000,000,000
The holders of ordinary shares are entitled to receive dividends as declared from time to time and are entitled one vote per individual present at meetings of the shareholders or one vote per share in case of a poll. All rights attached to the Company’s shares held by the Group are suspended until those shares are reissued.
23.2 REVALUATION RESERVEThe revaluation reserve relating to the revaluation of Property, Plant and Equipment immediately before its reclassification as investment property.
23.3 DIVIDENDSThe following dividends were declared and paid by the Company for the year:
Company
2017Rs.
2016Rs.
Dividends on Ordinary Shares:
Final Dividend* 500,000,000 250,000,000
Interim Dividend 500,000,000 500,000,000
Second Interim Dividend 500,000,000 –
Total Dividends 1,500,000,000 750,000,000
Dividend per Share 1.50 0.75
*Dividend paid out of previous year's profits.
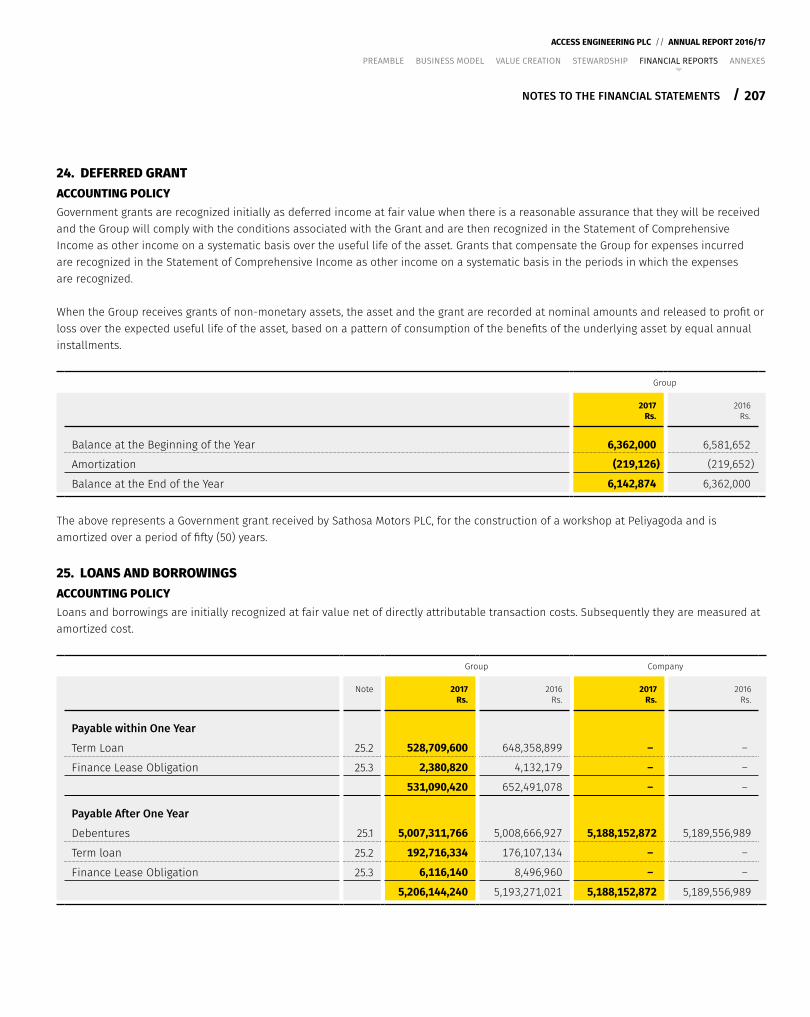
207
ACCESS ENGINEERING PLC // ANNUAL REPORT 2016/17
/
PREAMBLE BUSINESS MODEL VALUE CREATION STEWARDSHIP FINANCIAL REPORTS ANNEXES
NOTES TO THE FINANCIAL STATEMENTS
24. DEFERRED GRANTACCOUNTING POLICYGovernment grants are recognized initially as deferred income at fair value when there is a reasonable assurance that they will be received and the Group will comply with the conditions associated with the Grant and are then recognized in the Statement of Comprehensive Income as other income on a systematic basis over the useful life of the asset. Grants that compensate the Group for expenses incurred are recognized in the Statement of Comprehensive Income as other income on a systematic basis in the periods in which the expenses are recognized.
When the Group receives grants of non-monetary assets, the asset and the grant are recorded at nominal amounts and released to profit or loss over the expected useful life of the asset, based on a pattern of consumption of the benefits of the underlying asset by equal annual installments.
Group
2017Rs.
2016Rs.
Balance at the Beginning of the Year 6,362,000 6,581,652
Amortization (219,126) (219,652)
Balance at the End of the Year 6,142,874 6,362,000
The above represents a Government grant received by Sathosa Motors PLC, for the construction of a workshop at Peliyagoda and is amortized over a period of fifty (50) years.
25. LOANS AND BORROWINGSACCOUNTING POLICYLoans and borrowings are initially recognized at fair value net of directly attributable transaction costs. Subsequently they are measured at amortized cost.
Group Company
Note 2017Rs.
2016Rs.
2017Rs.
2016Rs.
Payable within One Year
Term Loan 25.2 528,709,600 648,358,899 – –
Finance Lease Obligation 25.3 2,380,820 4,132,179 – –
531,090,420 652,491,078 – –
Payable After One Year
Debentures 25.1 5,007,311,766 5,008,666,927 5,188,152,872 5,189,556,989
Term loan 25.2 192,716,334 176,107,134 – –
Finance Lease Obligation 25.3 6,116,140 8,496,960 – –
5,206,144,240 5,193,271,021 5,188,152,872 5,189,556,989
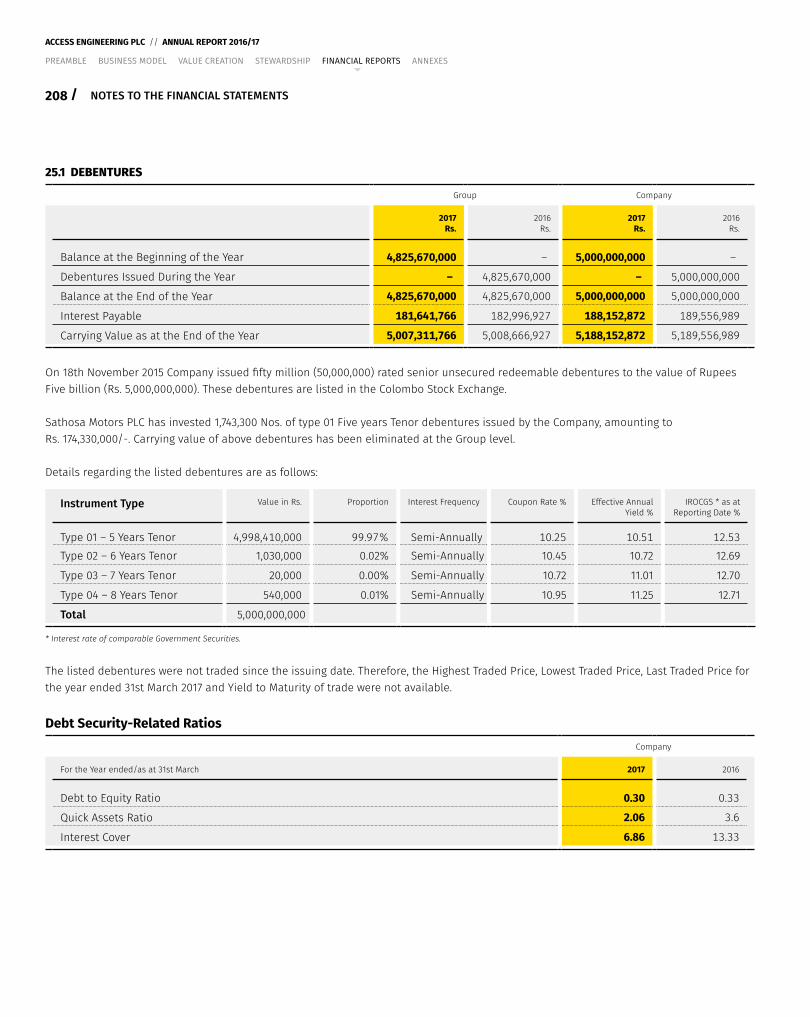
208 /
ACCESS ENGINEERING PLC // ANNUAL REPORT 2016/17
PREAMBLE BUSINESS MODEL VALUE CREATION STEWARDSHIP FINANCIAL REPORTS ANNEXES
NOTES TO THE FINANCIAL STATEMENTS
25.1 DEBENTURES
Group Company
2017Rs.
2016Rs.
2017Rs.
2016Rs.
Balance at the Beginning of the Year 4,825,670,000 – 5,000,000,000 –
Debentures Issued During the Year – 4,825,670,000 – 5,000,000,000
Balance at the End of the Year 4,825,670,000 4,825,670,000 5,000,000,000 5,000,000,000
Interest Payable 181,641,766 182,996,927 188,152,872 189,556,989
Carrying Value as at the End of the Year 5,007,311,766 5,008,666,927 5,188,152,872 5,189,556,989
On 18th November 2015 Company issued fifty million (50,000,000) rated senior unsecured redeemable debentures to the value of Rupees Five billion (Rs. 5,000,000,000). These debentures are listed in the Colombo Stock Exchange.
Sathosa Motors PLC has invested 1,743,300 Nos. of type 01 Five years Tenor debentures issued by the Company, amounting to Rs. 174,330,000/-. Carrying value of above debentures has been eliminated at the Group level.
Details regarding the listed debentures are as follows:
Instrument Type Value in Rs. Proportion Interest Frequency Coupon Rate % Effective Annual Yield %
IROCGS * as at Reporting Date %
Type 01 – 5 Years Tenor 4,998,410,000 99.97% Semi-Annually 10.25 10.51 12.53Type 02 – 6 Years Tenor 1,030,000 0.02% Semi-Annually 10.45 10.72 12.69
Type 03 – 7 Years Tenor 20,000 0.00% Semi-Annually 10.72 11.01 12.70
Type 04 – 8 Years Tenor 540,000 0.01% Semi-Annually 10.95 11.25 12.71
Total 5,000,000,000
* Interest rate of comparable Government Securities.
The listed debentures were not traded since the issuing date. Therefore, the Highest Traded Price, Lowest Traded Price, Last Traded Price for the year ended 31st March 2017 and Yield to Maturity of trade were not available.
Debt Security-Related RatiosCompany
For the Year ended/as at 31st March 2017 2016
Debt to Equity Ratio 0.30 0.33
Quick Assets Ratio 2.06 3.6
Interest Cover 6.86 13.33
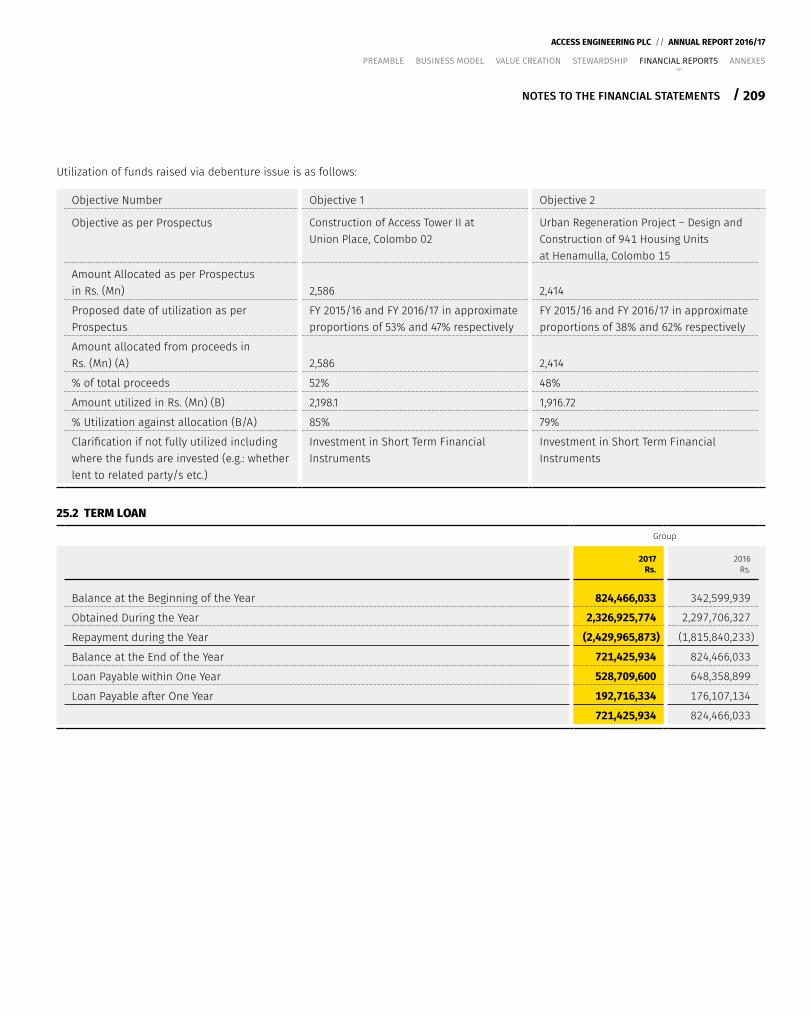
209
ACCESS ENGINEERING PLC // ANNUAL REPORT 2016/17
/
PREAMBLE BUSINESS MODEL VALUE CREATION STEWARDSHIP FINANCIAL REPORTS ANNEXES
NOTES TO THE FINANCIAL STATEMENTS
Utilization of funds raised via debenture issue is as follows:
Objective Number Objective 1 Objective 2
Objective as per Prospectus Construction of Access Tower II at Union Place, Colombo 02
Urban Regeneration Project – Design and Construction of 941 Housing Units at Henamulla, Colombo 15
Amount Allocated as per Prospectus in Rs. (Mn) 2,586 2,414
Proposed date of utilization as per Prospectus
FY 2015/16 and FY 2016/17 in approximate proportions of 53% and 47% respectively
FY 2015/16 and FY 2016/17 in approximate proportions of 38% and 62% respectively
Amount allocated from proceeds in Rs. (Mn) (A) 2,586 2,414
% of total proceeds 52% 48%
Amount utilized in Rs. (Mn) (B) 2,198.1 1,916.72
% Utilization against allocation (B/A) 85% 79%
Clarification if not fully utilized including where the funds are invested (e.g.: whether lent to related party/s etc.)
Investment in Short Term Financial Instruments
Investment in Short Term Financial Instruments
25.2 TERM LOAN
Group
2017Rs.
2016Rs.
Balance at the Beginning of the Year 824,466,033 342,599,939
Obtained During the Year 2,326,925,774 2,297,706,327
Repayment during the Year (2,429,965,873) (1,815,840,233)
Balance at the End of the Year 721,425,934 824,466,033
Loan Payable within One Year 528,709,600 648,358,899
Loan Payable after One Year 192,716,334 176,107,134
721,425,934 824,466,033
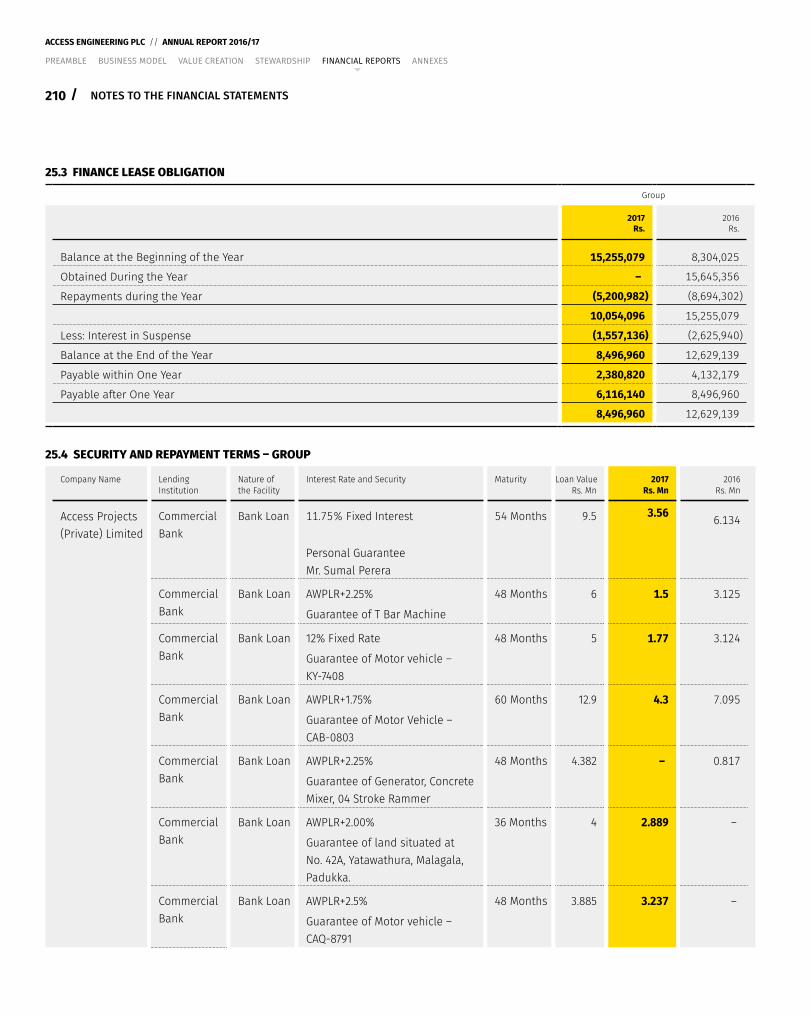
210 /
ACCESS ENGINEERING PLC // ANNUAL REPORT 2016/17
PREAMBLE BUSINESS MODEL VALUE CREATION STEWARDSHIP FINANCIAL REPORTS ANNEXES
NOTES TO THE FINANCIAL STATEMENTS
25.3 FINANCE LEASE OBLIGATION
Group
2017Rs.
2016Rs.
Balance at the Beginning of the Year 15,255,079 8,304,025
Obtained During the Year – 15,645,356
Repayments during the Year (5,200,982) (8,694,302)
10,054,096 15,255,079
Less: Interest in Suspense (1,557,136) (2,625,940)
Balance at the End of the Year 8,496,960 12,629,139
Payable within One Year 2,380,820 4,132,179
Payable after One Year 6,116,140 8,496,960
8,496,960 12,629,139
25.4 SECURITY AND REPAYMENT TERMS – GROUP
Company Name Lending Institution
Nature of the Facility
Interest Rate and Security Maturity Loan ValueRs. Mn
2017Rs. Mn
2016Rs. Mn
Access Projects (Private) Limited
Commercial Bank
Bank Loan 11.75% Fixed Interest 54 Months 9.5 3.56 6.134
Personal Guarantee Mr. Sumal Perera
Commercial Bank
Bank Loan AWPLR+2.25% 48 Months 6 1.5 3.125
Guarantee of T Bar Machine
Commercial Bank
Bank Loan 12% Fixed Rate 48 Months 5 1.77 3.124
Guarantee of Motor vehicle – KY-7408
Commercial Bank
Bank Loan AWPLR+1.75% 60 Months 12.9 4.3 7.095
Guarantee of Motor Vehicle – CAB-0803
Commercial Bank
Bank Loan AWPLR+2.25% 48 Months 4.382 – 0.817
Guarantee of Generator, Concrete Mixer, 04 Stroke Rammer
Commercial Bank
Bank Loan AWPLR+2.00% 36 Months 4 2.889 –
Guarantee of land situated at No. 42A, Yatawathura, Malagala, Padukka.
Commercial Bank
Bank Loan AWPLR+2.5% 48 Months 3.885 3.237 –
Guarantee of Motor vehicle – CAQ-8791
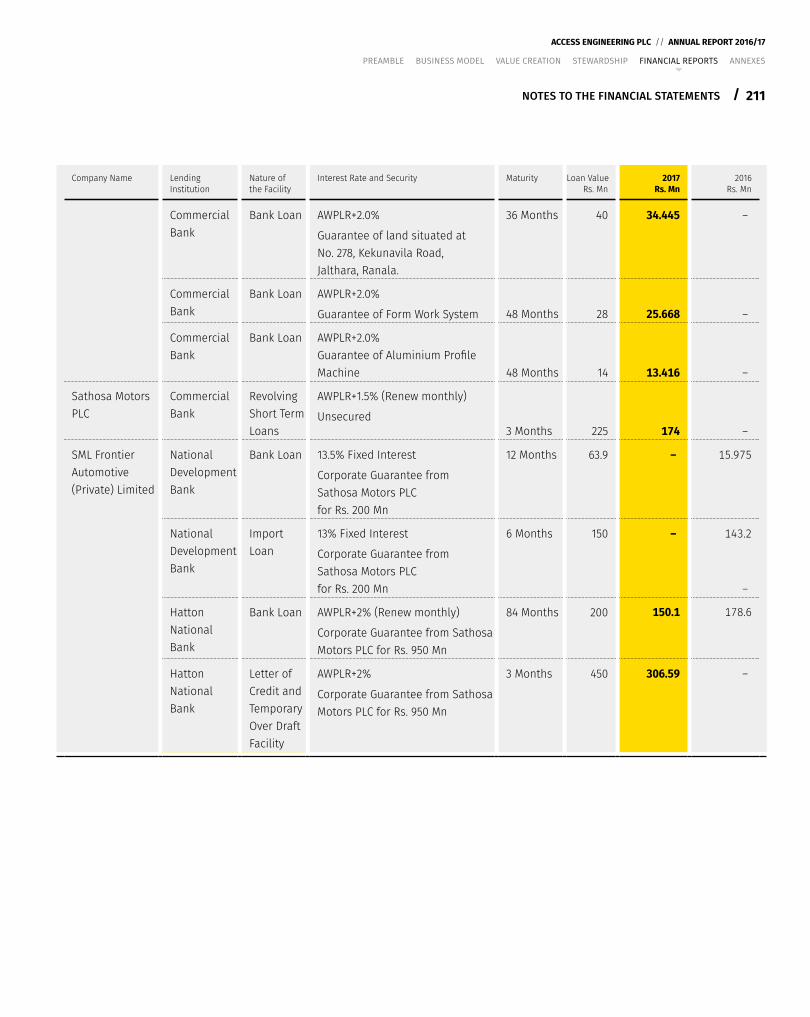
211
ACCESS ENGINEERING PLC // ANNUAL REPORT 2016/17
/
PREAMBLE BUSINESS MODEL VALUE CREATION STEWARDSHIP FINANCIAL REPORTS ANNEXES
NOTES TO THE FINANCIAL STATEMENTS
Company Name Lending Institution
Nature of the Facility
Interest Rate and Security Maturity Loan ValueRs. Mn
2017Rs. Mn
2016Rs. Mn
Commercial Bank
Bank Loan AWPLR+2.0% 36 Months 40 34.445 –
Guarantee of land situated at No. 278, Kekunavila Road, Jalthara, Ranala.
Commercial Bank
Bank Loan AWPLR+2.0% 48 Months 28 25.668 – Guarantee of Form Work System
Commercial Bank
Bank Loan AWPLR+2.0%Guarantee of Aluminium Profile Machine 48 Months 14 13.416 –
Sathosa Motors PLC
Commercial Bank
Revolving Short Term Loans
AWPLR+1.5% (Renew monthly)
3 Months 225 174 – Unsecured
SML Frontier Automotive (Private) Limited
National Development Bank
Bank Loan 13.5% Fixed Interest 12 Months 63.9 – 15.975
Corporate Guarantee from Sathosa Motors PLC for Rs. 200 Mn
National Development Bank
Import Loan
13% Fixed Interest 6 Months 150 – 143.2
Corporate Guarantee from Sathosa Motors PLC for Rs. 200 Mn –
Hatton National Bank
Bank Loan AWPLR+2% (Renew monthly) 84 Months 200 150.1 178.6
Corporate Guarantee from Sathosa Motors PLC for Rs. 950 Mn
Hatton National Bank
Letter of Credit and Temporary Over Draft Facility
AWPLR+2% 3 Months 450 306.59 –
Corporate Guarantee from Sathosa Motors PLC for Rs. 950 Mn
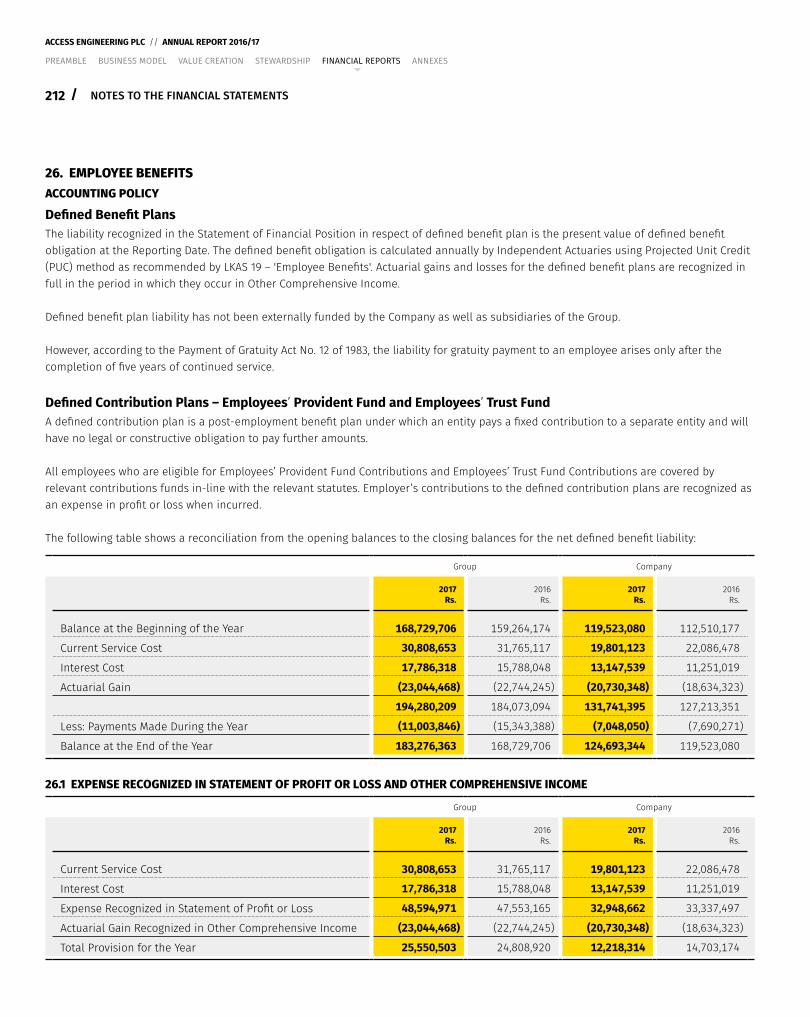
212 /
ACCESS ENGINEERING PLC // ANNUAL REPORT 2016/17
PREAMBLE BUSINESS MODEL VALUE CREATION STEWARDSHIP FINANCIAL REPORTS ANNEXES
NOTES TO THE FINANCIAL STATEMENTS
26. EMPLOYEE BENEFITSACCOUNTING POLICY
Defined Benefit PlansThe liability recognized in the Statement of Financial Position in respect of defined benefit plan is the present value of defined benefit obligation at the Reporting Date. The defined benefit obligation is calculated annually by Independent Actuaries using Projected Unit Credit (PUC) method as recommended by LKAS 19 – 'Employee Benefits'. Actuarial gains and losses for the defined benefit plans are recognized in full in the period in which they occur in Other Comprehensive Income.
Defined benefit plan liability has not been externally funded by the Company as well as subsidiaries of the Group.
However, according to the Payment of Gratuity Act No. 12 of 1983, the liability for gratuity payment to an employee arises only after the completion of five years of continued service.
Defined Contribution Plans – Employeesʼ Provident Fund and Employeesʼ Trust FundA defined contribution plan is a post-employment benefit plan under which an entity pays a fixed contribution to a separate entity and will have no legal or constructive obligation to pay further amounts.
All employees who are eligible for Employees’ Provident Fund Contributions and Employees’ Trust Fund Contributions are covered by relevant contributions funds in-line with the relevant statutes. Employer’s contributions to the defined contribution plans are recognized as an expense in profit or loss when incurred.
The following table shows a reconciliation from the opening balances to the closing balances for the net defined benefit liability:
Group Company
2017Rs.
2016Rs.
2017Rs.
2016Rs.
Balance at the Beginning of the Year 168,729,706 159,264,174 119,523,080 112,510,177
Current Service Cost 30,808,653 31,765,117 19,801,123 22,086,478
Interest Cost 17,786,318 15,788,048 13,147,539 11,251,019
Actuarial Gain (23,044,468) (22,744,245) (20,730,348) (18,634,323)
194,280,209 184,073,094 131,741,395 127,213,351
Less: Payments Made During the Year (11,003,846) (15,343,388) (7,048,050) (7,690,271)
Balance at the End of the Year 183,276,363 168,729,706 124,693,344 119,523,080
26.1 EXPENSE RECOGNIZED IN STATEMENT OF PROFIT OR LOSS AND OTHER COMPREHENSIVE INCOME
Group Company
2017Rs.
2016Rs.
2017Rs.
2016Rs.
Current Service Cost 30,808,653 31,765,117 19,801,123 22,086,478
Interest Cost 17,786,318 15,788,048 13,147,539 11,251,019
Expense Recognized in Statement of Profit or Loss 48,594,971 47,553,165 32,948,662 33,337,497
Actuarial Gain Recognized in Other Comprehensive Income (23,044,468) (22,744,245) (20,730,348) (18,634,323)
Total Provision for the Year 25,550,503 24,808,920 12,218,314 14,703,174
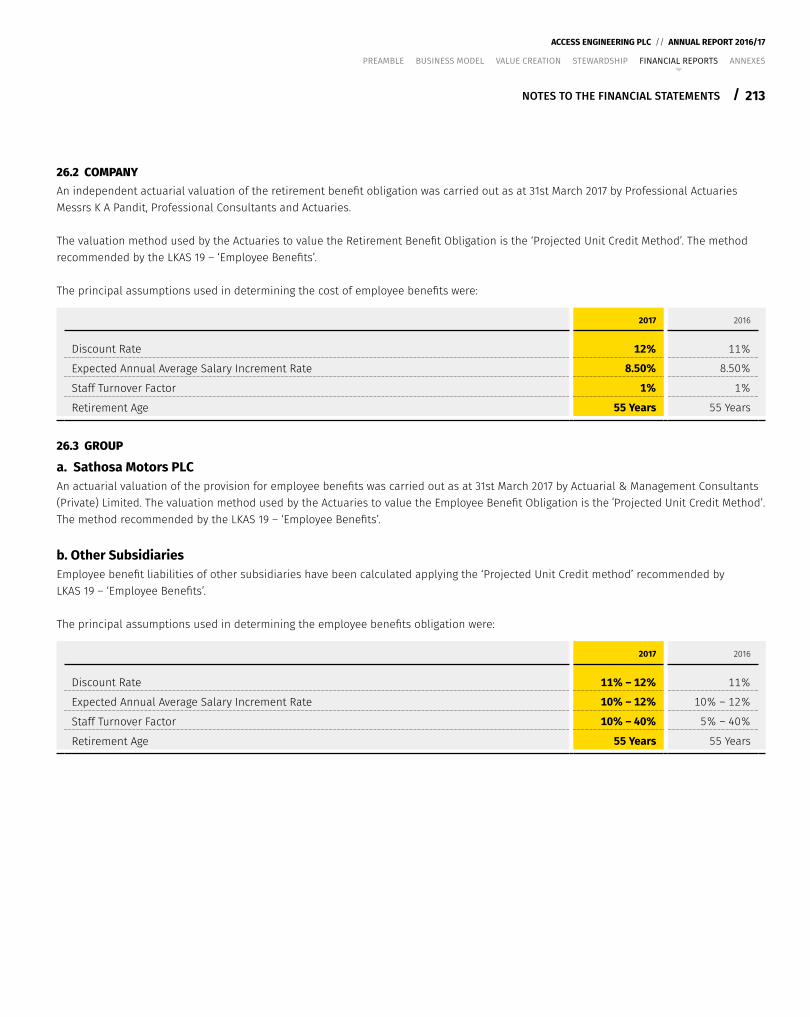
213
ACCESS ENGINEERING PLC // ANNUAL REPORT 2016/17
/
PREAMBLE BUSINESS MODEL VALUE CREATION STEWARDSHIP FINANCIAL REPORTS ANNEXES
NOTES TO THE FINANCIAL STATEMENTS
26.2 COMPANYAn independent actuarial valuation of the retirement benefit obligation was carried out as at 31st March 2017 by Professional Actuaries Messrs K A Pandit, Professional Consultants and Actuaries.
The valuation method used by the Actuaries to value the Retirement Benefit Obligation is the ‘Projected Unit Credit Method’. The method recommended by the LKAS 19 – ‘Employee Benefits’.
The principal assumptions used in determining the cost of employee benefits were:
2017 2016
Discount Rate 12% 11%
Expected Annual Average Salary Increment Rate 8.50% 8.50%
Staff Turnover Factor 1% 1%
Retirement Age 55 Years 55 Years
26.3 GROUP
a. Sathosa Motors PLCAn actuarial valuation of the provision for employee benefits was carried out as at 31st March 2017 by Actuarial & Management Consultants (Private) Limited. The valuation method used by the Actuaries to value the Employee Benefit Obligation is the ʻProjected Unit Credit Methodʼ. The method recommended by the LKAS 19 – ‘Employee Benefits’.
b. Other SubsidiariesEmployee benefit liabilities of other subsidiaries have been calculated applying the ‘Projected Unit Credit method’ recommended by LKAS 19 – ‘Employee Benefits’.
The principal assumptions used in determining the employee benefits obligation were:
2017 2016
Discount Rate 11% – 12% 11%
Expected Annual Average Salary Increment Rate 10% – 12% 10% – 12%
Staff Turnover Factor 10% – 40% 5% – 40%
Retirement Age 55 Years 55 Years
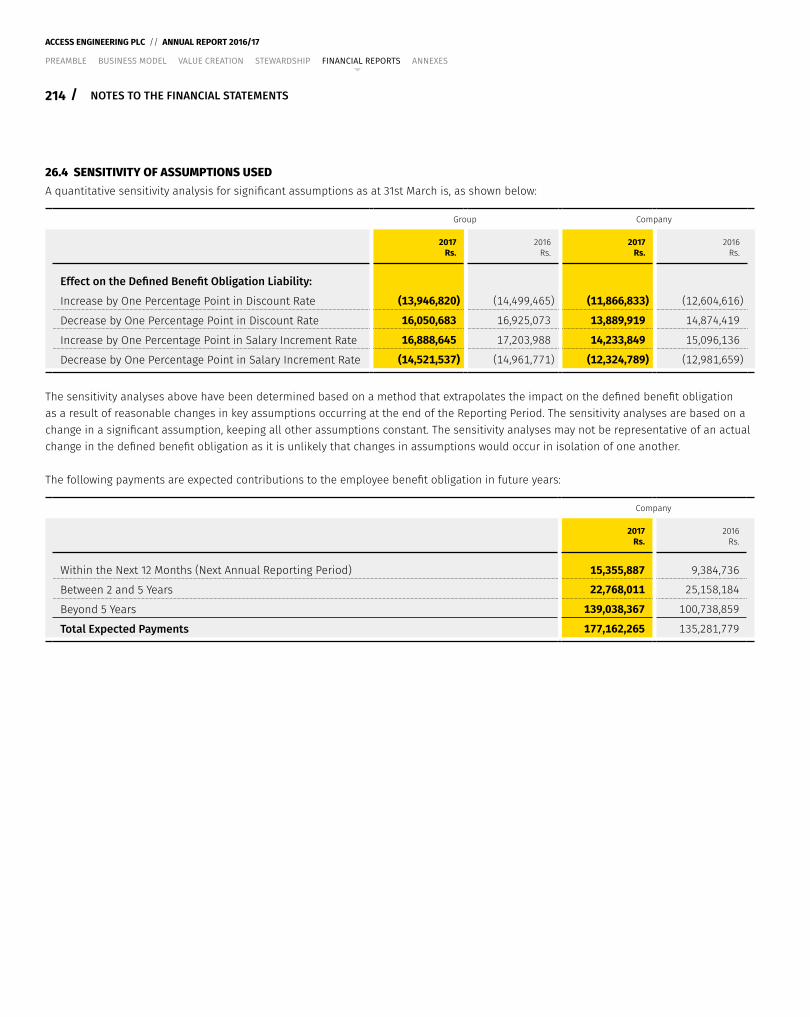
214 /
ACCESS ENGINEERING PLC // ANNUAL REPORT 2016/17
PREAMBLE BUSINESS MODEL VALUE CREATION STEWARDSHIP FINANCIAL REPORTS ANNEXES
NOTES TO THE FINANCIAL STATEMENTS
26.4 SENSITIVITY OF ASSUMPTIONS USEDA quantitative sensitivity analysis for significant assumptions as at 31st March is, as shown below:
Group Company
2017Rs.
2016Rs.
2017Rs.
2016Rs.
Effect on the Defined Benefit Obligation Liability:
Increase by One Percentage Point in Discount Rate (13,946,820) (14,499,465) (11,866,833) (12,604,616)
Decrease by One Percentage Point in Discount Rate 16,050,683 16,925,073 13,889,919 14,874,419
Increase by One Percentage Point in Salary Increment Rate 16,888,645 17,203,988 14,233,849 15,096,136
Decrease by One Percentage Point in Salary Increment Rate (14,521,537) (14,961,771) (12,324,789) (12,981,659)
The sensitivity analyses above have been determined based on a method that extrapolates the impact on the defined benefit obligation as a result of reasonable changes in key assumptions occurring at the end of the Reporting Period. The sensitivity analyses are based on a change in a significant assumption, keeping all other assumptions constant. The sensitivity analyses may not be representative of an actual change in the defined benefit obligation as it is unlikely that changes in assumptions would occur in isolation of one another.
The following payments are expected contributions to the employee benefit obligation in future years:
Company
2017Rs.
2016Rs.
Within the Next 12 Months (Next Annual Reporting Period) 15,355,887 9,384,736
Between 2 and 5 Years 22,768,011 25,158,184
Beyond 5 Years 139,038,367 100,738,859
Total Expected Payments 177,162,265 135,281,779
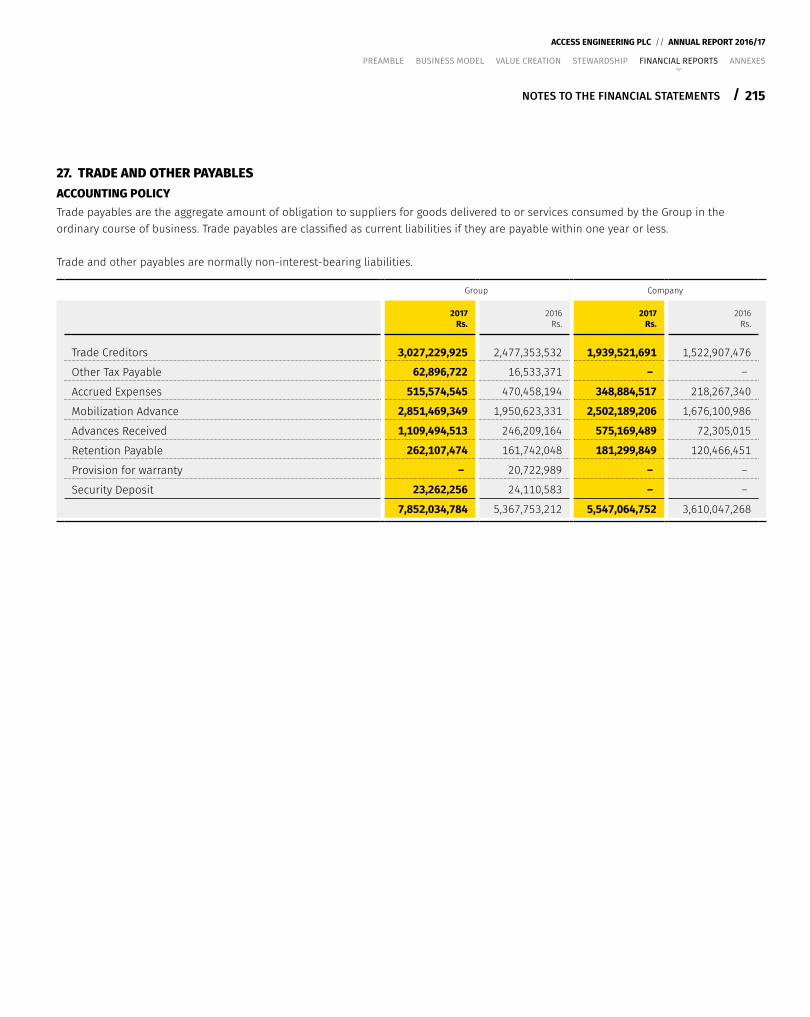
215
ACCESS ENGINEERING PLC // ANNUAL REPORT 2016/17
/
PREAMBLE BUSINESS MODEL VALUE CREATION STEWARDSHIP FINANCIAL REPORTS ANNEXES
NOTES TO THE FINANCIAL STATEMENTS
27. TRADE AND OTHER PAYABLESACCOUNTING POLICYTrade payables are the aggregate amount of obligation to suppliers for goods delivered to or services consumed by the Group in the ordinary course of business. Trade payables are classified as current liabilities if they are payable within one year or less.
Trade and other payables are normally non-interest-bearing liabilities.
Group Company
2017Rs.
2016Rs.
2017Rs.
2016Rs.
Trade Creditors 3,027,229,925 2,477,353,532 1,939,521,691 1,522,907,476
Other Tax Payable 62,896,722 16,533,371 – –
Accrued Expenses 515,574,545 470,458,194 348,884,517 218,267,340
Mobilization Advance 2,851,469,349 1,950,623,331 2,502,189,206 1,676,100,986
Advances Received 1,109,494,513 246,209,164 575,169,489 72,305,015
Retention Payable 262,107,474 161,742,048 181,299,849 120,466,451
Provision for warranty – 20,722,989 – –
Security Deposit 23,262,256 24,110,583 – –
7,852,034,784 5,367,753,212 5,547,064,752 3,610,047,268
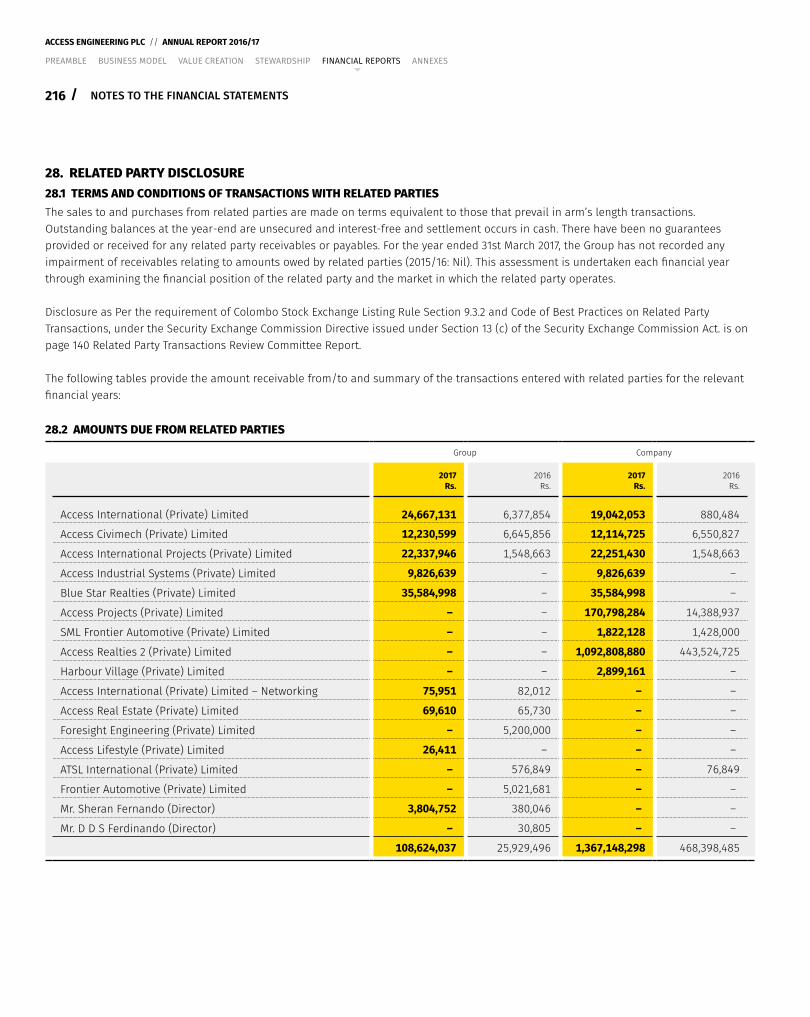
216 /
ACCESS ENGINEERING PLC // ANNUAL REPORT 2016/17
PREAMBLE BUSINESS MODEL VALUE CREATION STEWARDSHIP FINANCIAL REPORTS ANNEXES
NOTES TO THE FINANCIAL STATEMENTS
28. RELATED PARTY DISCLOSURE28.1 TERMS AND CONDITIONS OF TRANSACTIONS WITH RELATED PARTIESThe sales to and purchases from related parties are made on terms equivalent to those that prevail in arm’s length transactions. Outstanding balances at the year-end are unsecured and interest-free and settlement occurs in cash. There have been no guarantees provided or received for any related party receivables or payables. For the year ended 31st March 2017, the Group has not recorded any impairment of receivables relating to amounts owed by related parties (2015/16: Nil). This assessment is undertaken each financial year through examining the financial position of the related party and the market in which the related party operates.
Disclosure as Per the requirement of Colombo Stock Exchange Listing Rule Section 9.3.2 and Code of Best Practices on Related Party Transactions, under the Security Exchange Commission Directive issued under Section 13 (c) of the Security Exchange Commission Act. is on page 140 Related Party Transactions Review Committee Report.
The following tables provide the amount receivable from/to and summary of the transactions entered with related parties for the relevant financial years:
28.2 AMOUNTS DUE FROM RELATED PARTIES
Group Company
2017Rs.
2016Rs.
2017Rs.
2016Rs.
Access International (Private) Limited 24,667,131 6,377,854 19,042,053 880,484
Access Civimech (Private) Limited 12,230,599 6,645,856 12,114,725 6,550,827
Access International Projects (Private) Limited 22,337,946 1,548,663 22,251,430 1,548,663
Access Industrial Systems (Private) Limited 9,826,639 – 9,826,639 –
Blue Star Realties (Private) Limited 35,584,998 – 35,584,998 –
Access Projects (Private) Limited – – 170,798,284 14,388,937
SML Frontier Automotive (Private) Limited – – 1,822,128 1,428,000
Access Realties 2 (Private) Limited – – 1,092,808,880 443,524,725
Harbour Village (Private) Limited – – 2,899,161 –
Access International (Private) Limited – Networking 75,951 82,012 – –
Access Real Estate (Private) Limited 69,610 65,730 – –
Foresight Engineering (Private) Limited – 5,200,000 – –
Access Lifestyle (Private) Limited 26,411 – – –
ATSL International (Private) Limited – 576,849 – 76,849
Frontier Automotive (Private) Limited – 5,021,681 – –
Mr. Sheran Fernando (Director) 3,804,752 380,046 – –
Mr. D D S Ferdinando (Director) – 30,805 – –
108,624,037 25,929,496 1,367,148,298 468,398,485
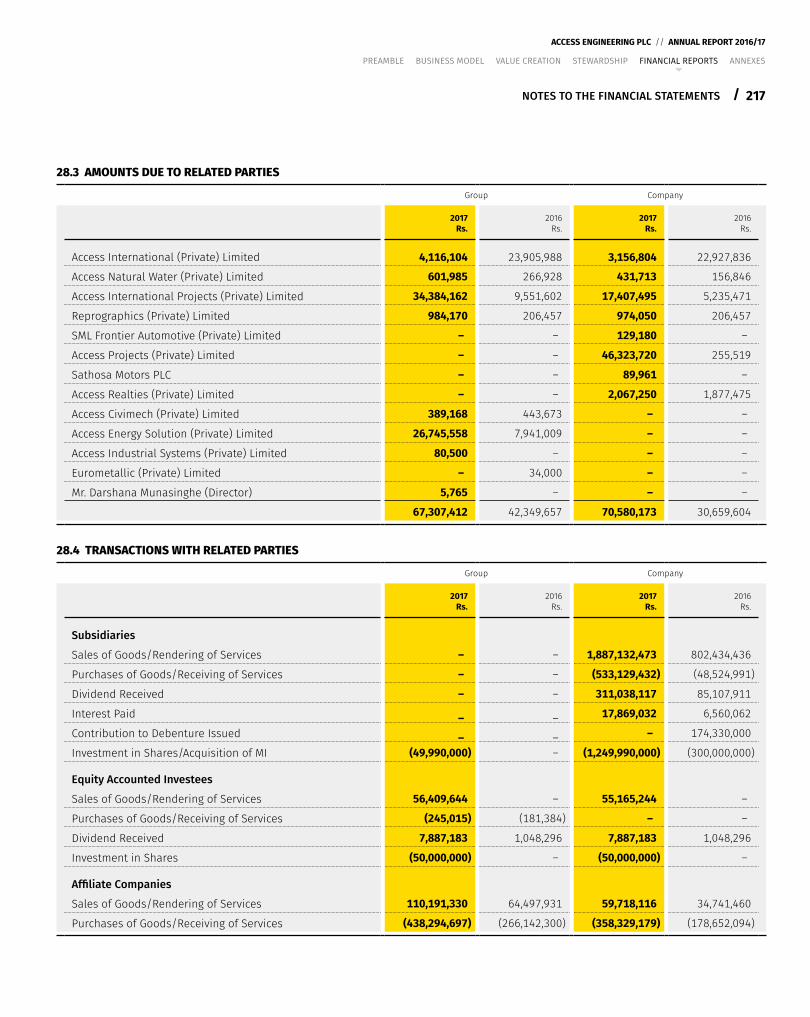
217
ACCESS ENGINEERING PLC // ANNUAL REPORT 2016/17
/
PREAMBLE BUSINESS MODEL VALUE CREATION STEWARDSHIP FINANCIAL REPORTS ANNEXES
NOTES TO THE FINANCIAL STATEMENTS
28.3 AMOUNTS DUE TO RELATED PARTIES
Group Company
2017Rs.
2016Rs.
2017Rs.
2016Rs.
Access International (Private) Limited 4,116,104 23,905,988 3,156,804 22,927,836
Access Natural Water (Private) Limited 601,985 266,928 431,713 156,846
Access International Projects (Private) Limited 34,384,162 9,551,602 17,407,495 5,235,471
Reprographics (Private) Limited 984,170 206,457 974,050 206,457
SML Frontier Automotive (Private) Limited – – 129,180 –
Access Projects (Private) Limited – – 46,323,720 255,519
Sathosa Motors PLC – – 89,961 –
Access Realties (Private) Limited – – 2,067,250 1,877,475
Access Civimech (Private) Limited 389,168 443,673 – –
Access Energy Solution (Private) Limited 26,745,558 7,941,009 – –
Access Industrial Systems (Private) Limited 80,500 – – –
Eurometallic (Private) Limited – 34,000 – –
Mr. Darshana Munasinghe (Director) 5,765 – – –
67,307,412 42,349,657 70,580,173 30,659,604
28.4 TRANSACTIONS WITH RELATED PARTIES
Group Company
2017Rs.
2016Rs.
2017Rs.
2016Rs.
Subsidiaries
Sales of Goods/Rendering of Services – – 1,887,132,473 802,434,436
Purchases of Goods/Receiving of Services – – (533,129,432) (48,524,991)
Dividend Received – – 311,038,117 85,107,911
Interest Paid _ _ 17,869,032 6,560,062
Contribution to Debenture Issued _ _ – 174,330,000
Investment in Shares/Acquisition of MI (49,990,000) – (1,249,990,000) (300,000,000)
Equity Accounted Investees
Sales of Goods/Rendering of Services 56,409,644 – 55,165,244 –
Purchases of Goods/Receiving of Services (245,015) (181,384) – –
Dividend Received 7,887,183 1,048,296 7,887,183 1,048,296
Investment in Shares (50,000,000) – (50,000,000) –
Affiliate Companies
Sales of Goods/Rendering of Services 110,191,330 64,497,931 59,718,116 34,741,460
Purchases of Goods/Receiving of Services (438,294,697) (266,142,300) (358,329,179) (178,652,094)
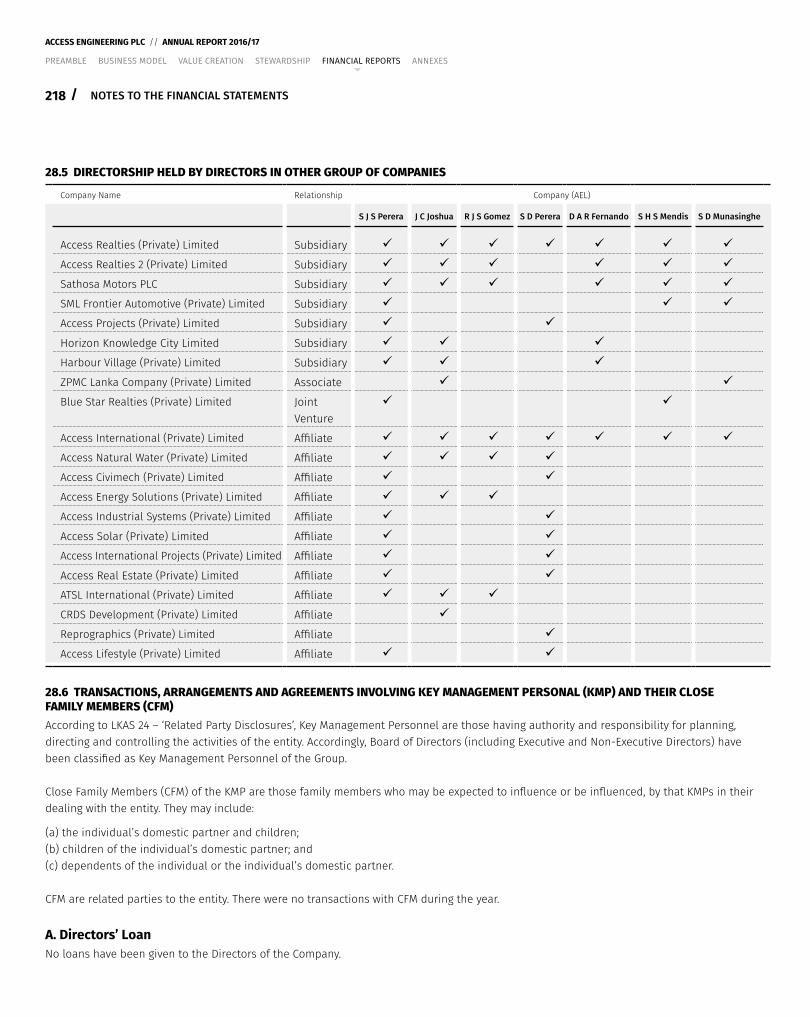
218 /
ACCESS ENGINEERING PLC // ANNUAL REPORT 2016/17
PREAMBLE BUSINESS MODEL VALUE CREATION STEWARDSHIP FINANCIAL REPORTS ANNEXES
NOTES TO THE FINANCIAL STATEMENTS
28.5 DIRECTORSHIP HELD BY DIRECTORS IN OTHER GROUP OF COMPANIES
Company Name Relationship Company (AEL)
S J S Perera J C Joshua R J S Gomez S D Perera D A R Fernando S H S Mendis S D Munasinghe
Access Realties (Private) Limited Subsidiary
Access Realties 2 (Private) Limited Subsidiary
Sathosa Motors PLC Subsidiary
SML Frontier Automotive (Private) Limited Subsidiary
Access Projects (Private) Limited Subsidiary
Horizon Knowledge City Limited Subsidiary
Harbour Village (Private) Limited Subsidiary
ZPMC Lanka Company (Private) Limited Associate
Blue Star Realties (Private) Limited Joint Venture
Access International (Private) Limited Affiliate
Access Natural Water (Private) Limited Affiliate
Access Civimech (Private) Limited Affiliate
Access Energy Solutions (Private) Limited Affiliate
Access Industrial Systems (Private) Limited Affiliate
Access Solar (Private) Limited Affiliate
Access International Projects (Private) Limited Affiliate
Access Real Estate (Private) Limited Affiliate
ATSL International (Private) Limited Affiliate
CRDS Development (Private) Limited Affiliate
Reprographics (Private) Limited Affiliate
Access Lifestyle (Private) Limited Affiliate
28.6 TRANSACTIONS, ARRANGEMENTS AND AGREEMENTS INVOLVING KEY MANAGEMENT PERSONAL (KMP) AND THEIR CLOSE FAMILY MEMBERS (CFM)According to LKAS 24 – ‘Related Party Disclosures’, Key Management Personnel are those having authority and responsibility for planning, directing and controlling the activities of the entity. Accordingly, Board of Directors (including Executive and Non-Executive Directors) have been classified as Key Management Personnel of the Group.
Close Family Members (CFM) of the KMP are those family members who may be expected to influence or be influenced, by that KMPs in their dealing with the entity. They may include:
(a) the individual’s domestic partner and children;(b) children of the individual’s domestic partner; and(c) dependents of the individual or the individual’s domestic partner.
CFM are related parties to the entity. There were no transactions with CFM during the year.
A. Directors’ LoanNo loans have been given to the Directors of the Company.
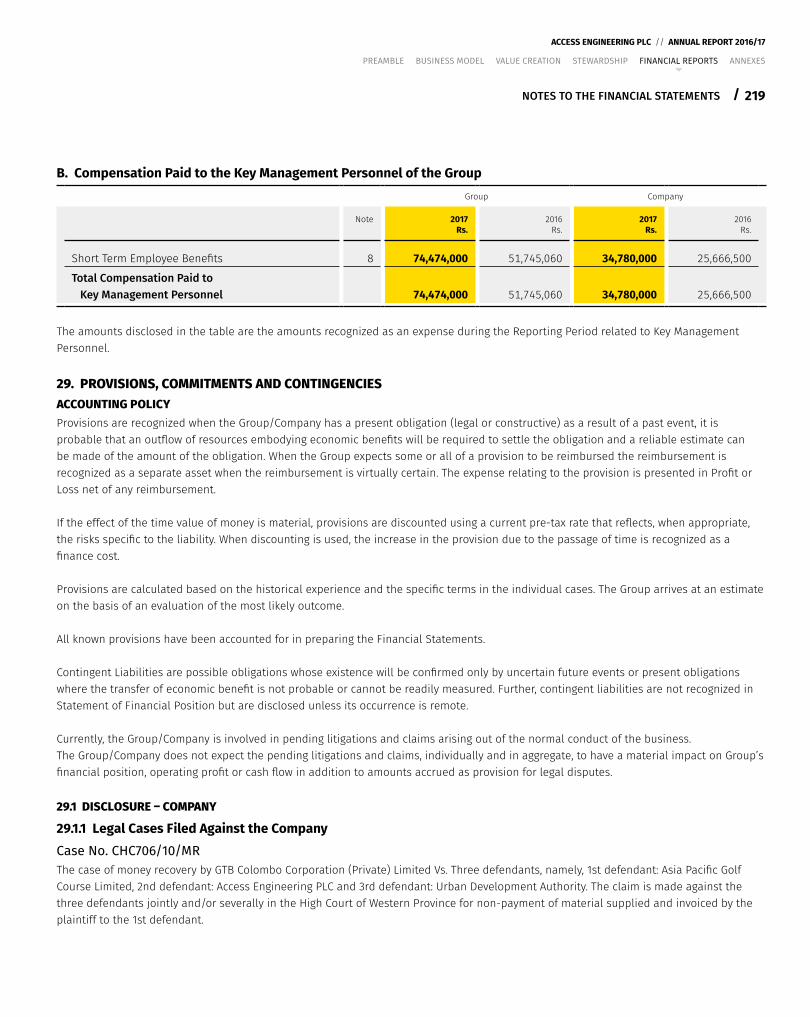
219
ACCESS ENGINEERING PLC // ANNUAL REPORT 2016/17
/
PREAMBLE BUSINESS MODEL VALUE CREATION STEWARDSHIP FINANCIAL REPORTS ANNEXES
NOTES TO THE FINANCIAL STATEMENTS
B. Compensation Paid to the Key Management Personnel of the GroupGroup Company
Note 2017Rs.
2016Rs.
2017Rs.
2016Rs.
Short Term Employee Benefits 8 74,474,000 51,745,060 34,780,000 25,666,500
Total Compensation Paid to Key Management Personnel 74,474,000 51,745,060 34,780,000 25,666,500
The amounts disclosed in the table are the amounts recognized as an expense during the Reporting Period related to Key Management Personnel.
29. PROVISIONS, COMMITMENTS AND CONTINGENCIESACCOUNTING POLICYProvisions are recognized when the Group/Company has a present obligation (legal or constructive) as a result of a past event, it is probable that an outflow of resources embodying economic benefits will be required to settle the obligation and a reliable estimate can be made of the amount of the obligation. When the Group expects some or all of a provision to be reimbursed the reimbursement is recognized as a separate asset when the reimbursement is virtually certain. The expense relating to the provision is presented in Profit or Loss net of any reimbursement.
If the effect of the time value of money is material, provisions are discounted using a current pre-tax rate that reflects, when appropriate, the risks specific to the liability. When discounting is used, the increase in the provision due to the passage of time is recognized as a finance cost.
Provisions are calculated based on the historical experience and the specific terms in the individual cases. The Group arrives at an estimate on the basis of an evaluation of the most likely outcome.
All known provisions have been accounted for in preparing the Financial Statements.
Contingent Liabilities are possible obligations whose existence will be confirmed only by uncertain future events or present obligations where the transfer of economic benefit is not probable or cannot be readily measured. Further, contingent liabilities are not recognized in Statement of Financial Position but are disclosed unless its occurrence is remote.
Currently, the Group/Company is involved in pending litigations and claims arising out of the normal conduct of the business. The Group/Company does not expect the pending litigations and claims, individually and in aggregate, to have a material impact on Group’s financial position, operating profit or cash flow in addition to amounts accrued as provision for legal disputes.
29.1 DISCLOSURE – COMPANY
29.1.1 Legal Cases Filed Against the CompanyCase No. CHC706/10/MRThe case of money recovery by GTB Colombo Corporation (Private) Limited Vs. Three defendants, namely, 1st defendant: Asia Pacific Golf Course Limited, 2nd defendant: Access Engineering PLC and 3rd defendant: Urban Development Authority. The claim is made against the three defendants jointly and/or severally in the High Court of Western Province for non-payment of material supplied and invoiced by the plaintiff to the 1st defendant.
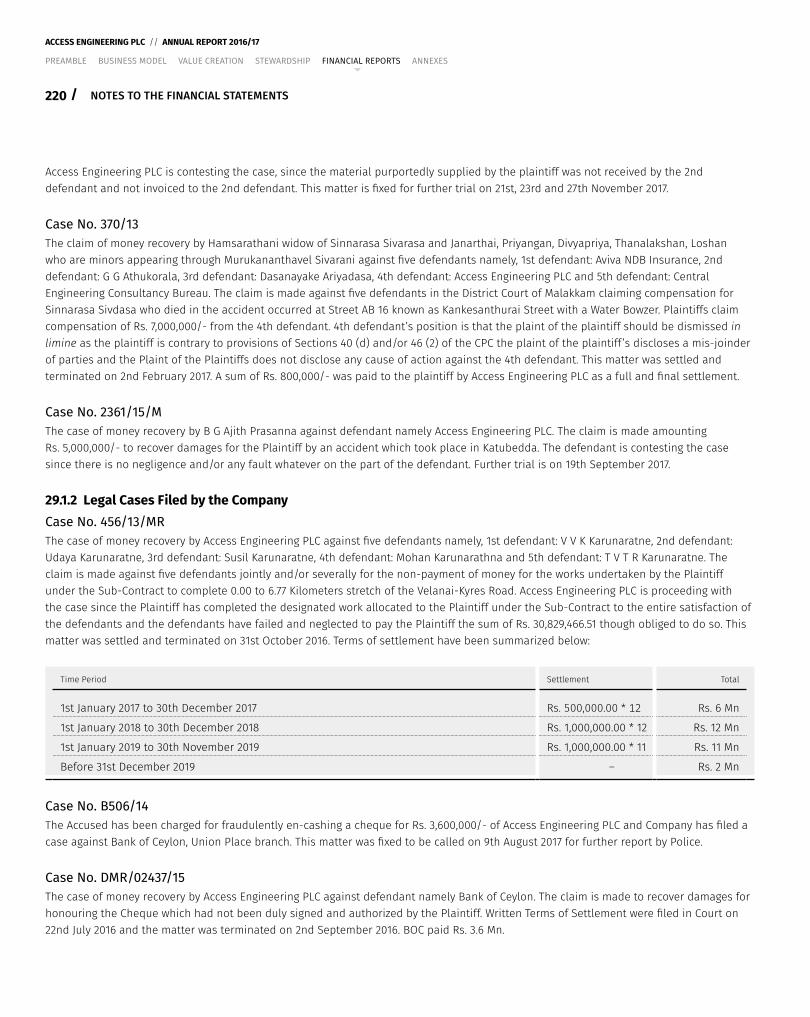
220 /
ACCESS ENGINEERING PLC // ANNUAL REPORT 2016/17
PREAMBLE BUSINESS MODEL VALUE CREATION STEWARDSHIP FINANCIAL REPORTS ANNEXES
NOTES TO THE FINANCIAL STATEMENTS
Access Engineering PLC is contesting the case, since the material purportedly supplied by the plaintiff was not received by the 2nd defendant and not invoiced to the 2nd defendant. This matter is fixed for further trial on 21st, 23rd and 27th November 2017.
Case No. 370/13The claim of money recovery by Hamsarathani widow of Sinnarasa Sivarasa and Janarthai, Priyangan, Divyapriya, Thanalakshan, Loshan who are minors appearing through Murukananthavel Sivarani against five defendants namely, 1st defendant: Aviva NDB Insurance, 2nd defendant: G G Athukorala, 3rd defendant: Dasanayake Ariyadasa, 4th defendant: Access Engineering PLC and 5th defendant: Central Engineering Consultancy Bureau. The claim is made against five defendants in the District Court of Malakkam claiming compensation for Sinnarasa Sivdasa who died in the accident occurred at Street AB 16 known as Kankesanthurai Street with a Water Bowzer. Plaintiffs claim compensation of Rs. 7,000,000/- from the 4th defendant. 4th defendant’s position is that the plaint of the plaintiff should be dismissed in limine as the plaintiff is contrary to provisions of Sections 40 (d) and/or 46 (2) of the CPC the plaint of the plaintiff’s discloses a mis-joinder of parties and the Plaint of the Plaintiffs does not disclose any cause of action against the 4th defendant. This matter was settled and terminated on 2nd February 2017. A sum of Rs. 800,000/- was paid to the plaintiff by Access Engineering PLC as a full and final settlement.
Case No. 2361/15/MThe case of money recovery by B G Ajith Prasanna against defendant namely Access Engineering PLC. The claim is made amounting Rs. 5,000,000/- to recover damages for the Plaintiff by an accident which took place in Katubedda. The defendant is contesting the case since there is no negligence and/or any fault whatever on the part of the defendant. Further trial is on 19th September 2017.
29.1.2 Legal Cases Filed by the CompanyCase No. 456/13/MRThe case of money recovery by Access Engineering PLC against five defendants namely, 1st defendant: V V K Karunaratne, 2nd defendant: Udaya Karunaratne, 3rd defendant: Susil Karunaratne, 4th defendant: Mohan Karunarathna and 5th defendant: T V T R Karunaratne. The claim is made against five defendants jointly and/or severally for the non-payment of money for the works undertaken by the Plaintiff under the Sub-Contract to complete 0.00 to 6.77 Kilometers stretch of the Velanai-Kyres Road. Access Engineering PLC is proceeding with the case since the Plaintiff has completed the designated work allocated to the Plaintiff under the Sub-Contract to the entire satisfaction of the defendants and the defendants have failed and neglected to pay the Plaintiff the sum of Rs. 30,829,466.51 though obliged to do so. This matter was settled and terminated on 31st October 2016. Terms of settlement have been summarized below:
Time Period Settlement Total
1st January 2017 to 30th December 2017 Rs. 500,000.00 * 12 Rs. 6 Mn
1st January 2018 to 30th December 2018 Rs. 1,000,000.00 * 12 Rs. 12 Mn
1st January 2019 to 30th November 2019 Rs. 1,000,000.00 * 11 Rs. 11 Mn
Before 31st December 2019 – Rs. 2 Mn
Case No. B506/14The Accused has been charged for fraudulently en-cashing a cheque for Rs. 3,600,000/- of Access Engineering PLC and Company has filed a case against Bank of Ceylon, Union Place branch. This matter was fixed to be called on 9th August 2017 for further report by Police.
Case No. DMR/02437/15The case of money recovery by Access Engineering PLC against defendant namely Bank of Ceylon. The claim is made to recover damages for honouring the Cheque which had not been duly signed and authorized by the Plaintiff. Written Terms of Settlement were filed in Court on 22nd July 2016 and the matter was terminated on 2nd September 2016. BOC paid Rs. 3.6 Mn.
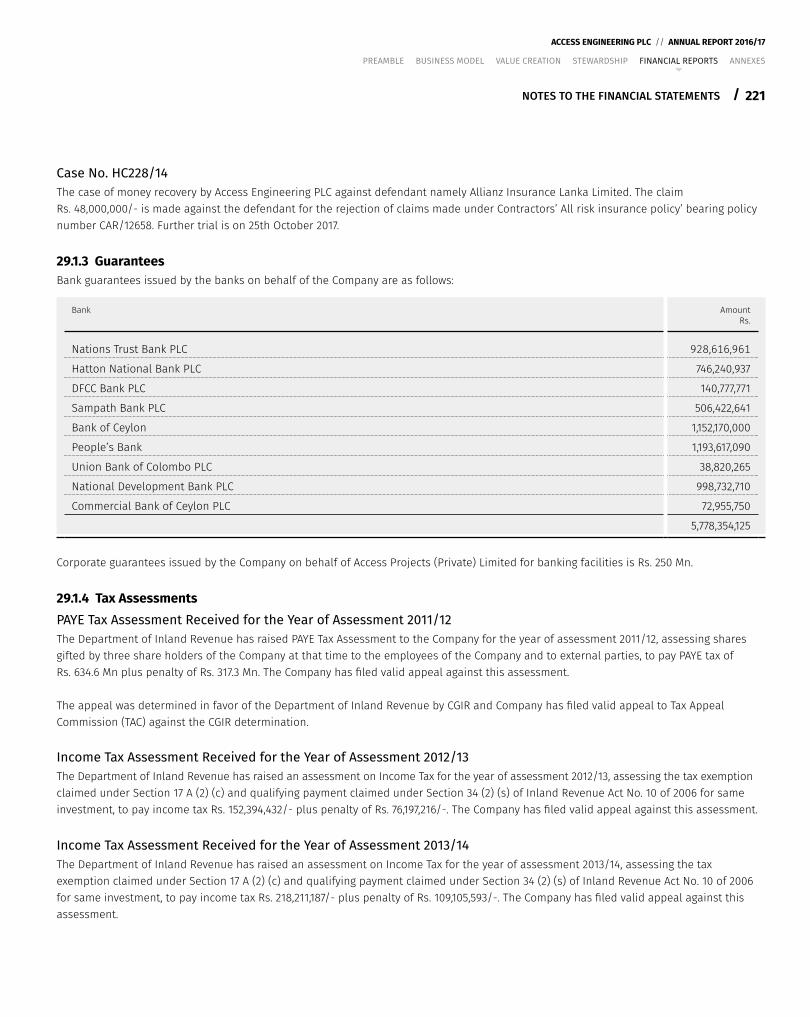
221
ACCESS ENGINEERING PLC // ANNUAL REPORT 2016/17
/
PREAMBLE BUSINESS MODEL VALUE CREATION STEWARDSHIP FINANCIAL REPORTS ANNEXES
NOTES TO THE FINANCIAL STATEMENTS
Case No. HC228/14The case of money recovery by Access Engineering PLC against defendant namely Allianz Insurance Lanka Limited. The claim Rs. 48,000,000/- is made against the defendant for the rejection of claims made under Contractors’ All risk insurance policy’ bearing policy number CAR/12658. Further trial is on 25th October 2017.
29.1.3 GuaranteesBank guarantees issued by the banks on behalf of the Company are as follows:
Bank Amount Rs.
Nations Trust Bank PLC 928,616,961
Hatton National Bank PLC 746,240,937
DFCC Bank PLC 140,777,771
Sampath Bank PLC 506,422,641
Bank of Ceylon 1,152,170,000
People’s Bank 1,193,617,090
Union Bank of Colombo PLC 38,820,265
National Development Bank PLC 998,732,710
Commercial Bank of Ceylon PLC 72,955,750
5,778,354,125
Corporate guarantees issued by the Company on behalf of Access Projects (Private) Limited for banking facilities is Rs. 250 Mn.
29.1.4 Tax AssessmentsPAYE Tax Assessment Received for the Year of Assessment 2011/12The Department of Inland Revenue has raised PAYE Tax Assessment to the Company for the year of assessment 2011/12, assessing shares gifted by three share holders of the Company at that time to the employees of the Company and to external parties, to pay PAYE tax of Rs. 634.6 Mn plus penalty of Rs. 317.3 Mn. The Company has filed valid appeal against this assessment.
The appeal was determined in favor of the Department of Inland Revenue by CGIR and Company has filed valid appeal to Tax Appeal Commission (TAC) against the CGIR determination.
Income Tax Assessment Received for the Year of Assessment 2012/13The Department of Inland Revenue has raised an assessment on Income Tax for the year of assessment 2012/13, assessing the tax exemption claimed under Section 17 A (2) (c) and qualifying payment claimed under Section 34 (2) (s) of Inland Revenue Act No. 10 of 2006 for same investment, to pay income tax Rs. 152,394,432/- plus penalty of Rs. 76,197,216/-. The Company has filed valid appeal against this assessment.
Income Tax Assessment Received for the Year of Assessment 2013/14The Department of Inland Revenue has raised an assessment on Income Tax for the year of assessment 2013/14, assessing the tax exemption claimed under Section 17 A (2) (c) and qualifying payment claimed under Section 34 (2) (s) of Inland Revenue Act No. 10 of 2006 for same investment, to pay income tax Rs. 218,211,187/- plus penalty of Rs. 109,105,593/-. The Company has filed valid appeal against this assessment.
222 /
ACCESS ENGINEERING PLC // ANNUAL REPORT 2016/17
PREAMBLE BUSINESS MODEL VALUE CREATION STEWARDSHIP FINANCIAL REPORTS ANNEXES
NOTES TO THE FINANCIAL STATEMENTS
Income Tax Assessment Received for the Year of Assessment 2014/15The Department of Inland Revenue has raised an assessment of Income Tax for the year of assessment 2014/15, assessing the tax exemption claimed under Section 17 A (2) (c) and qualifying payment claimed under Section 34 (2) (s) of Inland Revenue Act No. 10 of 2006 for same investment, to pay income tax Rs. 155,973,209/- plus penalty of Rs. 74,867,140/-. The Company has filed a valid appeal against this assessment.
29.2 DISCLOSURE – GROUP
Sathosa Motors PLCLabour Tribunal Cases against the Sathosa Motors PLCW A Siriwardane vs Sathosa Motors PLC {Ref. – Ct. 78 (25)}The above application was filed in the Labour Tribunal by an ex-employee W A Siriwardane who was a driver of the Company for terminating his services. He sought reinstatement in service, monthly salary inclusive of the relevant allowances pending reinstatement in service. The Company filed an answer on 25th June 2009. The Company is vehemently restricted the claim. After the trial and upon filing written submissions the Order was delivered on 25th August 2013 and the application of W A Siriwardane was dismissed. We have not been notified of any appeal. As regards any gratuity dues, these would be payable accordingly to law. The Applicant has now appealed to the High Court of Colombo against the said Order and the matter was called before the High Court on 29th September 2014. Parties were directed to file written submissions on 27th November 2014. On 27th November 2014 the matter re-fixed again for written submissions on 13th February 2015. On 13th February 2015 parties filed written submissions and the matter was fixed for argument on 6th May 2015. On 6th May 2015 the matter was re-fixed for argument on 27th July 2015 and again for 16th November 2015 .On 16th November 2015 the matter was taken up for argument and Counsel of both parties submitted the salient points of the matter before Hon. Manilal Waidyathilleke High Court Judge. Thereafter the matter was fixed for judgment on 25th February 2016, 1st April 2016 and 14th June 2016. On 13th July 2016 the judgement was delivered in favour of our client by dismissing the action without costs. We are not aware of any appeal having been preferred. There are no outstandings to us as at date as called for.
Tax AssessmentsNBT Assessments 2009/10 and 2010/11Revenue authorities are of the view 2/3rd disallowance is applicable for NBT paid on imports. However, the Company is claiming the position that 2/3rd disallowance is applicable for NBT paid quarterly only. Liability assessed by the revenue for the year of assessment 2009/10 is Rs. 7,350,762 and the penalty calculated Rs. 3,675,381/-. Liability assessed by the revenue for the year of assessment 2010/11 is Rs. 7,790,377 and the penalty calculated Rs. 3,895,189/-.
The Company appeal to the Court of Appeal on 16th April 2017 regarding the assessment of 2009/10 and assessment 2010/11 is being evaluated by the Tax Appeal Commission.
Having sought professional advice, the management is confident that the said 2/3rd disallowance is applicable for NBT paid quarterly only and as such no liabilities would arise. Accordingly, no provision has been made in the Financial Statements.
Corporate Guarantee Corporate Guarantees issued by Sathosa Motors PLC on behalf of SML Frontier Automotive (Private) Limited is Rs. 1,000 Mn as at Reporting Date.
30. EVENTS AFTER THE REPORTING PERIODThere have been no material events after the Reporting Period except for the following that would require adjustments to or disclosure in the Financial Statements:
223
ACCESS ENGINEERING PLC // ANNUAL REPORT 2016/17
/
PREAMBLE BUSINESS MODEL VALUE CREATION STEWARDSHIP FINANCIAL REPORTS ANNEXES
NOTES TO THE FINANCIAL STATEMENTS
30.1 COMPANY
Investment in SubsidiaryThe Company invested in the share capital in Access Realties (Private) Limited a fully-owned subsidiary, for a cash consideration of Rs. 900 Mn (17th May 2017 – Rs. 450 Mn, 30th June 2017 – Rs. 450 Mn).
30.2 GROUP
Sathosa Motors PLCPursuant to a resolution adopted on 22nd June 2017, the Board of Directors of the Company approved the payment of a final dividend of Rs. 5/- per share for the year ended 31st March 2017 (2016 Rs. 15/- per share).
Towards the end of the financial year 2016/17 Company took a strategic decision to invest, Rs. 576 Mn during the next financial year on acquiring a land in Vauxhall Street to construct a state-of-the-art building to house the Sathosa Motors PLC head office, the main vehicle showroom and a spare parts facility.
As required by Section 56 (2) of the Companies Act No. 07 of 2007, the Board of Directors has confirmed that the Company satisfies the solvency test in accordance with Section 57 of the Companies Act No. 07 of 2007, and has obtained concurrence from Auditors, prior to declaration of dividends.
In accordance with LKAS 10 – ‘Events after the Reporting Period’, this proposed dividend has not been recognized as a liability in the Financial Statements.
31. BUSINESS COMBINATIONSBUSINESS COMBINATIONS AND GOODWILLBusiness combinations are accounted for using the acquisition method. The cost of an acquisition is measured as the aggregate of the consideration transferred, which is measured at acquisition date fair value and the amount of any non-controlling interests in the acquiree. For each business combination, the Group elects whether to measure the non-controlling interests in the acquiree at fair value or at the proportionate share of the acquiree’s identifiable net assets. Acquisition-related costs are expensed as incurred and included in administrative expenses.
When the Group acquires a business, it assesses the financial assets and liabilities assumed for appropriate classification and designation in accordance with the contractual terms, economic circumstances and pertinent conditions as at the acquisition date. This includes the separation of embedded derivatives in host contracts by the acquiree.
Contingent consideration, resulting from business combinations, is valued at fair value at the acquisition date as part of the business combination. Contingent consideration classified as an asset or liability that is a financial instrument and within the scope of LKAS 39 – ‘Financial Instruments: Recognition and Measurement’, is measured at fair value with the changes in fair value recognized in the Statement of Profit or Loss.
Goodwill is initially measured at cost (being the excess of the aggregate of the consideration transferred and the amount recognized for non-controlling interests and any previous interest held over the net identifiable assets acquired and liabilities assumed). If the fair value of the net assets acquired is in excess of the aggregate consideration transferred, the Group reassesses whether it has correctly identified all of the assets acquired and all of the liabilities assumed and reviews the procedures used to measure the amounts to be recognized at the acquisition date. If the reassessment still results in an excess of the fair value of net assets acquired over the aggregate consideration transferred, then the gain is recognized in profit or loss.
After initial recognition, goodwill is measured at cost less any accumulated impairment losses. For the purpose of impairment testing, goodwill acquired in a business combination is, from the acquisition date, allocated to each of the Group’s cash-generating units that are expected to benefit from the combination, irrespective of whether other assets or liabilities of the acquiree are assigned to those units. Goodwill is tested for impairment annually (as at 31st March) and when circumstances indicate that carrying value is greater than recoverable amount.
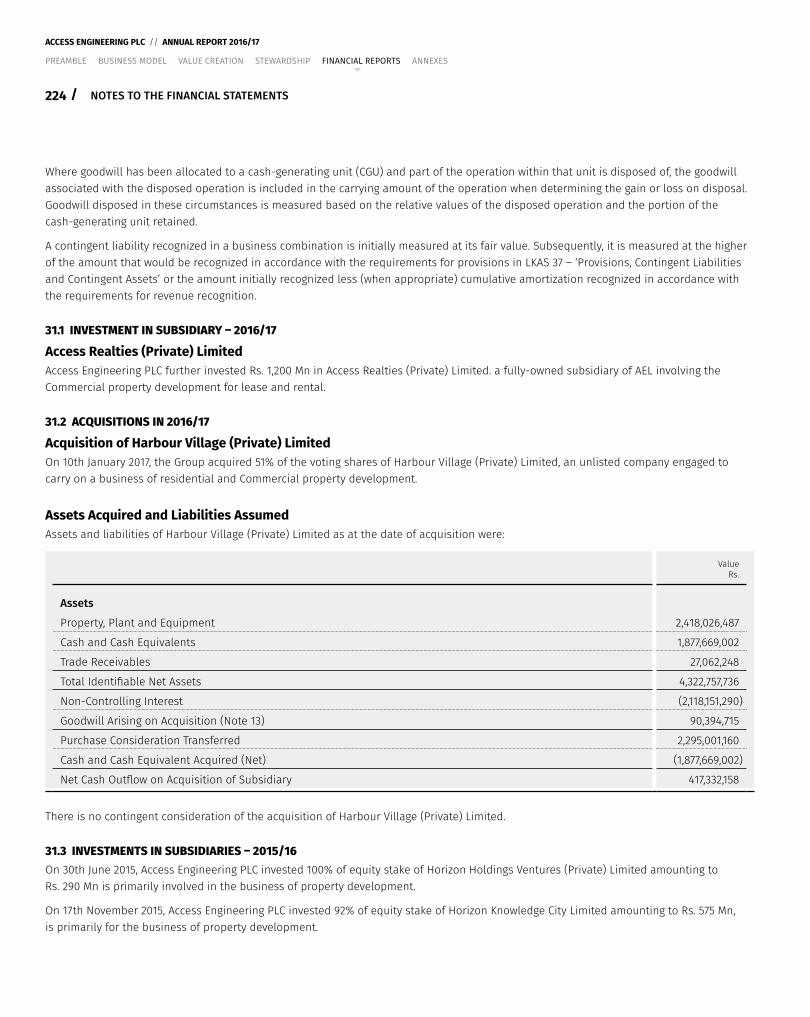
224 /
ACCESS ENGINEERING PLC // ANNUAL REPORT 2016/17
PREAMBLE BUSINESS MODEL VALUE CREATION STEWARDSHIP FINANCIAL REPORTS ANNEXES
NOTES TO THE FINANCIAL STATEMENTS
Where goodwill has been allocated to a cash-generating unit (CGU) and part of the operation within that unit is disposed of, the goodwill associated with the disposed operation is included in the carrying amount of the operation when determining the gain or loss on disposal. Goodwill disposed in these circumstances is measured based on the relative values of the disposed operation and the portion of the cash-generating unit retained.
A contingent liability recognized in a business combination is initially measured at its fair value. Subsequently, it is measured at the higher of the amount that would be recognized in accordance with the requirements for provisions in LKAS 37 – ‘Provisions, Contingent Liabilities and Contingent Assets’ or the amount initially recognized less (when appropriate) cumulative amortization recognized in accordance with the requirements for revenue recognition.
31.1 INVESTMENT IN SUBSIDIARY – 2016/17
Access Realties (Private) LimitedAccess Engineering PLC further invested Rs. 1,200 Mn in Access Realties (Private) Limited. a fully-owned subsidiary of AEL involving the Commercial property development for lease and rental.
31.2 ACQUISITIONS IN 2016/17
Acquisition of Harbour Village (Private) LimitedOn 10th January 2017, the Group acquired 51% of the voting shares of Harbour Village (Private) Limited, an unlisted company engaged to carry on a business of residential and Commercial property development.
Assets Acquired and Liabilities AssumedAssets and liabilities of Harbour Village (Private) Limited as at the date of acquisition were:
ValueRs.
Assets
Property, Plant and Equipment 2,418,026,487
Cash and Cash Equivalents 1,877,669,002
Trade Receivables 27,062,248
Total Identifiable Net Assets 4,322,757,736
Non-Controlling Interest (2,118,151,290)
Goodwill Arising on Acquisition (Note 13) 90,394,715
Purchase Consideration Transferred 2,295,001,160
Cash and Cash Equivalent Acquired (Net) (1,877,669,002)
Net Cash Outflow on Acquisition of Subsidiary 417,332,158
There is no contingent consideration of the acquisition of Harbour Village (Private) Limited.
31.3 INVESTMENTS IN SUBSIDIARIES – 2015/16On 30th June 2015, Access Engineering PLC invested 100% of equity stake of Horizon Holdings Ventures (Private) Limited amounting to Rs. 290 Mn is primarily involved in the business of property development.
On 17th November 2015, Access Engineering PLC invested 92% of equity stake of Horizon Knowledge City Limited amounting to Rs. 575 Mn, is primarily for the business of property development.
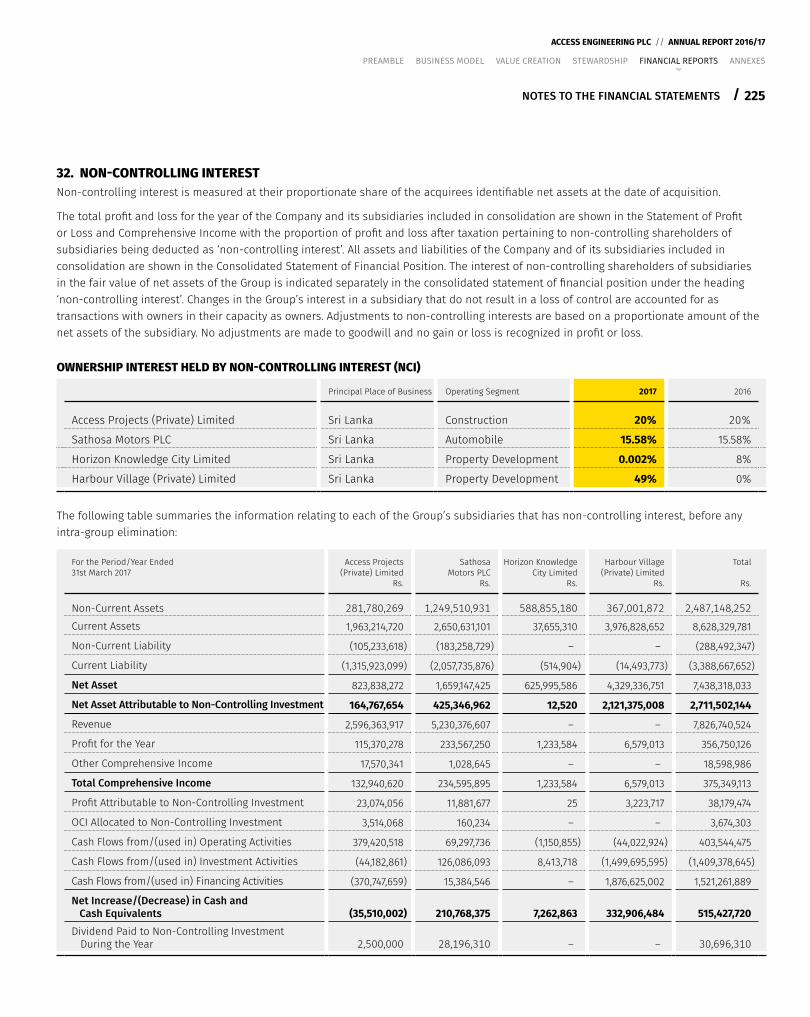
225
ACCESS ENGINEERING PLC // ANNUAL REPORT 2016/17
/
PREAMBLE BUSINESS MODEL VALUE CREATION STEWARDSHIP FINANCIAL REPORTS ANNEXES
NOTES TO THE FINANCIAL STATEMENTS
32. NON-CONTROLLING INTERESTNon-controlling interest is measured at their proportionate share of the acquirees identifiable net assets at the date of acquisition.
The total profit and loss for the year of the Company and its subsidiaries included in consolidation are shown in the Statement of Profit or Loss and Comprehensive Income with the proportion of profit and loss after taxation pertaining to non-controlling shareholders of subsidiaries being deducted as ‘non-controlling interest’. All assets and liabilities of the Company and of its subsidiaries included in consolidation are shown in the Consolidated Statement of Financial Position. The interest of non-controlling shareholders of subsidiaries in the fair value of net assets of the Group is indicated separately in the consolidated statement of financial position under the heading ‘non-controlling interest’. Changes in the Group’s interest in a subsidiary that do not result in a loss of control are accounted for as transactions with owners in their capacity as owners. Adjustments to non-controlling interests are based on a proportionate amount of the net assets of the subsidiary. No adjustments are made to goodwill and no gain or loss is recognized in profit or loss.
OWNERSHIP INTEREST HELD BY NON-CONTROLLING INTEREST (NCI)
Principal Place of Business Operating Segment 2017 2016
Access Projects (Private) Limited Sri Lanka Construction 20% 20%
Sathosa Motors PLC Sri Lanka Automobile 15.58% 15.58%
Horizon Knowledge City Limited Sri Lanka Property Development 0.002% 8%
Harbour Village (Private) Limited Sri Lanka Property Development 49% 0%
The following table summaries the information relating to each of the Group’s subsidiaries that has non-controlling interest, before any intra-group elimination:
For the Period/Year Ended 31st March 2017
Access Projects (Private) Limited
Rs.
Sathosa Motors PLC
Rs.
Horizon Knowledge City Limited
Rs.
Harbour Village (Private) Limited
Rs.
Total
Rs.
Non-Current Assets 281,780,269 1,249,510,931 588,855,180 367,001,872 2,487,148,252 Current Assets 1,963,214,720 2,650,631,101 37,655,310 3,976,828,652 8,628,329,781
Non-Current Liability (105,233,618) (183,258,729) – – (288,492,347)
Current Liability (1,315,923,099) (2,057,735,876) (514,904) (14,493,773) (3,388,667,652)
Net Asset 823,838,272 1,659,147,425 625,995,586 4,329,336,751 7,438,318,033
Net Asset Attributable to Non-Controlling Investment 164,767,654 425,346,962 12,520 2,121,375,008 2,711,502,144
Revenue 2,596,363,917 5,230,376,607 – – 7,826,740,524
Profit for the Year 115,370,278 233,567,250 1,233,584 6,579,013 356,750,126
Other Comprehensive Income 17,570,341 1,028,645 – – 18,598,986
Total Comprehensive Income 132,940,620 234,595,895 1,233,584 6,579,013 375,349,113
Profit Attributable to Non-Controlling Investment 23,074,056 11,881,677 25 3,223,717 38,179,474
OCI Allocated to Non-Controlling Investment 3,514,068 160,234 – – 3,674,303
Cash Flows from/(used in) Operating Activities 379,420,518 69,297,736 (1,150,855) (44,022,924) 403,544,475
Cash Flows from/(used in) Investment Activities (44,182,861) 126,086,093 8,413,718 (1,499,695,595) (1,409,378,645)
Cash Flows from/(used in) Financing Activities (370,747,659) 15,384,546 – 1,876,625,002 1,521,261,889
Net Increase/(Decrease) in Cash and Cash Equivalents (35,510,002) 210,768,375 7,262,863 332,906,484 515,427,720 Dividend Paid to Non-Controlling Investment During the Year 2,500,000 28,196,310 – – 30,696,310
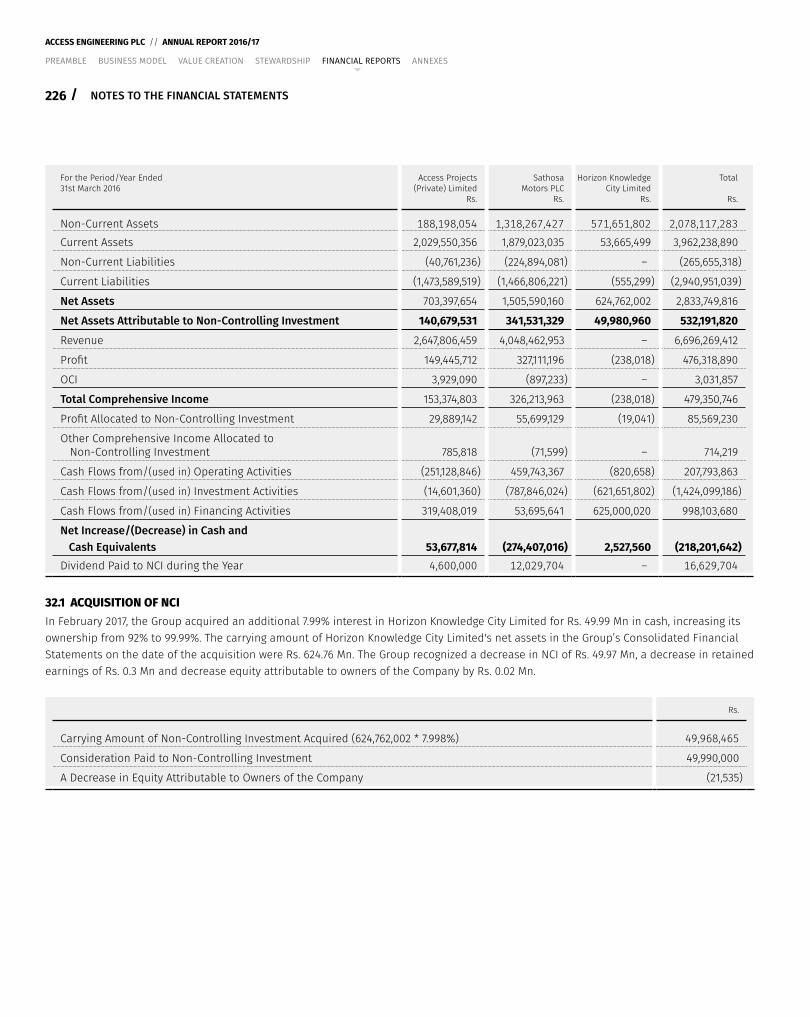
226 /
ACCESS ENGINEERING PLC // ANNUAL REPORT 2016/17
PREAMBLE BUSINESS MODEL VALUE CREATION STEWARDSHIP FINANCIAL REPORTS ANNEXES
NOTES TO THE FINANCIAL STATEMENTS
For the Period/Year Ended 31st March 2016
Access Projects (Private) Limited
Rs.
Sathosa Motors PLC
Rs.
Horizon Knowledge City Limited
Rs.
Total
Rs.
Non-Current Assets 188,198,054 1,318,267,427 571,651,802 2,078,117,283 Current Assets 2,029,550,356 1,879,023,035 53,665,499 3,962,238,890
Non-Current Liabilities (40,761,236) (224,894,081) – (265,655,318)
Current Liabilities (1,473,589,519) (1,466,806,221) (555,299) (2,940,951,039)
Net Assets 703,397,654 1,505,590,160 624,762,002 2,833,749,816
Net Assets Attributable to Non-Controlling Investment 140,679,531 341,531,329 49,980,960 532,191,820
Revenue 2,647,806,459 4,048,462,953 – 6,696,269,412
Profit 149,445,712 327,111,196 (238,018) 476,318,890
OCI 3,929,090 (897,233) – 3,031,857
Total Comprehensive Income 153,374,803 326,213,963 (238,018) 479,350,746
Profit Allocated to Non-Controlling Investment 29,889,142 55,699,129 (19,041) 85,569,230
Other Comprehensive Income Allocated to Non-Controlling Investment 785,818 (71,599) – 714,219
Cash Flows from/(used in) Operating Activities (251,128,846) 459,743,367 (820,658) 207,793,863
Cash Flows from/(used in) Investment Activities (14,601,360) (787,846,024) (621,651,802) (1,424,099,186)
Cash Flows from/(used in) Financing Activities 319,408,019 53,695,641 625,000,020 998,103,680
Net Increase/(Decrease) in Cash and Cash Equivalents 53,677,814 (274,407,016) 2,527,560 (218,201,642)Dividend Paid to NCI during the Year 4,600,000 12,029,704 – 16,629,704
32.1 ACQUISITION OF NCIIn February 2017, the Group acquired an additional 7.99% interest in Horizon Knowledge City Limited for Rs. 49.99 Mn in cash, increasing its ownership from 92% to 99.99%. The carrying amount of Horizon Knowledge City Limited's net assets in the Group’s Consolidated Financial Statements on the date of the acquisition were Rs. 624.76 Mn. The Group recognized a decrease in NCI of Rs. 49.97 Mn, a decrease in retained earnings of Rs. 0.3 Mn and decrease equity attributable to owners of the Company by Rs. 0.02 Mn.
Rs.
Carrying Amount of Non-Controlling Investment Acquired (624,762,002 * 7.998%) 49,968,465
Consideration Paid to Non-Controlling Investment 49,990,000
A Decrease in Equity Attributable to Owners of the Company (21,535)
227
ACCESS ENGINEERING PLC // ANNUAL REPORT 2016/17
/
PREAMBLE BUSINESS MODEL VALUE CREATION STEWARDSHIP FINANCIAL REPORTS ANNEXES
NOTES TO THE FINANCIAL STATEMENTS
33. FINANCIAL ASSETS AND FINANCIAL LIABILITIESA financial instrument is any contract that gives rise to a financial asset of one entity and a financial liability or equity instrument of another entity.
Financial AssetsInitial Recognition and MeasurementFinancial assets are classified, at initial recognition, as financial assets at fair value through profit or loss, loans and receivables, held-to-maturity investments, AFS financial assets or as derivatives designated as hedging instruments in an effective hedge, as appropriate.
All financial assets are recognized initially at fair value plus, in the case of financial assets not recorded at fair value through profit or loss, transaction costs that are attributable to the acquisition of the financial asset.
Purchase or sale of financial assets that require delivery of assets within a time frame established by regulation or convention in the market place (regular way trades) are recognized on the trade date, i.e., the date that the Group commits to purchase or sell the asset.
Subsequent MeasurementFor purposes of subsequent measurement, financial assets are classified into four categories:
y Financial assets at fair value through profit or loss
y Loans and receivables
y Held-to-maturity investments
y Available-for-sale (AFS) financial assets
Financial Assets at Fair Value through Profit or LossFinancial assets at fair value through profit or loss include financial assets held-for-trading and financial assets designated upon initial recognition at fair value through profit or loss. Financial assets are classified as held-for-trading if they are acquired for the purpose of selling or repurchasing in the near term. Derivatives, including separated embedded derivatives are also classified as held-for-trading unless they are designated as effective hedging instruments. Financial assets at fair value through profit and loss are carried in the Statement of Financial Position at fair value with changes in fair value recognized in the Statement of Profit or Loss.
Reassessment only occurs if there is either a change in the terms of the contract that significantly modifies the cash flows that would otherwise be required or a reclassification of a financial asset out of the fair value through profit or loss category.
Short Term investment has been classified as financial assets at fair value through profit or loss.
228 /
ACCESS ENGINEERING PLC // ANNUAL REPORT 2016/17
PREAMBLE BUSINESS MODEL VALUE CREATION STEWARDSHIP FINANCIAL REPORTS ANNEXES
NOTES TO THE FINANCIAL STATEMENTS
Loans and ReceivablesLoans and receivables are non-derivative financial assets with fixed or determinable payments that are not quoted in an active market. After initial measurement, such financial assets are subsequently measured at amortized cost using the effective interest rate (EIR) method, less impairment. Amortized cost is calculated by taking into account any discount or premium on acquisition and fees or costs that are an integral part of the EIR. The EIR amortization is included as finance income in the Statement of Profit or Loss. The losses arising from impairment are recognized in the Statement of Profit or Loss.
It has been classified the trade receivables, investment in unit trust and investment in fixed deposits as loans and receivable financial assets.
Held-to-Maturity InvestmentsNon-derivative financial assets with fixed or determinable payments and fixed maturities are classified as held-to-maturity when the Group has the positive intention and ability to hold them to maturity. After initial measurement, held-to-maturity investments are measured at amortized cost using the effective interest method, less impairment. Amortized cost is calculated by taking into account any discount or premium on acquisition and fees or costs that are an integral part of the EIR. The EIR amortization is included as finance income in the Statement of Profit or Loss. The losses arising from impairment are recognized in the Statement of Profit or Loss.
It has been classified the investment in Debenture as held-to-maturity financial assets.
AFS Financial AssetsAFS financial assets include equity investments and debt securities. Equity investments classified as available-for-sale are those, which are neither classified as held-for-trading nor designated at fair value through profit or loss. Debt securities in this category are those that are intended to be held for an indefinite period of time and that may be sold in response to needs for liquidity or in response to changes in market conditions.
After initial measurement, AFS financial assets are subsequently measured at fair value with unrealized gains or losses recognized in Other Comprehensive Income and credited in the AFS reserve until the investment is derecognized, at which time, the cumulative gain or loss is recognized in other operating income or the investment is determined to be impaired, when the cumulative loss is reclassified from the AFS reserve to the Statement of Profit or Loss in finance costs. Interest earned whilst holding AFS financial assets is reported as interest income using the EIR method.
The Group evaluates whether the ability and intention to sell its AFS financial assets in the near term is still appropriate. When, in rare circumstances, the Group is unable to trade these financial assets due to inactive markets, the Group may elect to reclassify these financial assets if the management has the ability and intention to hold the assets for foreseeable future or until maturity.
For a financial asset reclassified from the AFS category, the fair value carrying amount at the date of reclassification becomes its new amortized cost and any previous gain or loss on the asset that has been recognized in equity is amortized to profit or loss over the remaining life of the investment using the EIR. Any difference between the new amortized cost and the maturity amount is also amortized over the remaining life of the asset using the EIR. If the asset is subsequently determined to be impaired, then the amount recorded in equity is reclassified to the Statement of Profit or Loss.
229
ACCESS ENGINEERING PLC // ANNUAL REPORT 2016/17
/
PREAMBLE BUSINESS MODEL VALUE CREATION STEWARDSHIP FINANCIAL REPORTS ANNEXES
NOTES TO THE FINANCIAL STATEMENTS
DerecognitionA financial asset (or, where applicable, a part of a financial asset or part of a group of similar financial assets) is primarily derecognized (i.e., removed from the Group’s Consolidated Statement of Financial Position) when:
y The rights to receive cash flows from the asset have expired or
y The Group has transferred its rights to receive cash flows from the asset or has assumed an obligation to pay the received cash flows in full without material delay to a third party under a ‘pass-through’ arrangement and either (a) the Group has transferred substantially all the risks and rewards of the asset or (b) the Group has neither transferred nor retained substantially all the risks and rewards of the asset, but has transferred control of the asset.
When the Group has transferred its rights to receive cash flows from an asset or has entered into a pass-through arrangement, it evaluates if and to what extent, it has retained the risks and rewards of ownership. When it has neither transferred nor retained substantially all of the risks and rewards of the asset, nor transferred control of the asset, the Group continues to recognize the transferred asset to the extent of its continuing involvement. In that case, the Group also recognizes an associated liability. The transferred asset and the associated liability are measured on a basis that reflects the rights and obligations that the Group has retained.
Continuing involvement that takes the form of a guarantee over the transferred asset is measured at the lower of the original carrying amount of the asset and the maximum amount of consideration that the Group could be required to repay.
Impairment of Financial AssetsThe Group assesses, at each Reporting Date whether there is objective evidence that a financial asset or a group of financial assets is impaired. An impairment exists if one or more events that have occurred since the initial recognition of the asset (an incurred ‘loss event’), has an impact on the estimated future cash flows of the financial asset or the Group of financial assets that can be reliably estimated.
Evidence of impairment may include indications that the debtors or a group of debtors are experiencing significant financial difficulty, default or delinquency in interest or principal payments, the probability that they will enter bankruptcy or other financial reorganization and observable data indicate that there is a measurable decrease in the estimated future cash flows, such as changes in arrears or economic conditions that correlate with defaults.
Financial Assets Carried at Amortized CostFor financial assets carried at amortized cost, the Group first assesses whether impairment exists individually for financial assets that are individually significant or collectively for financial assets that are not individually significant. If the Group determines that no objective evidence of impairment exists for an individually assessed financial asset, whether significant or not, it includes the asset in a group of financial assets with similar credit risk characteristics and collectively assesses them for impairment. Assets that are individually assessed for impairment and for which an impairment loss is or continues to be, recognized are not included in a collective assessment of impairment.
The amount of any impairment loss identified is measured as the difference between the assets carrying amount and the present value of estimated future cash flows (excluding future expected credit losses that have not yet been incurred). The present value of the estimated future cash flows is discounted at the financial asset’s original EIR.
The carrying amount of the asset is reduced through the use of an allowance account and loss is recognized in the Statement of Profit or Loss. Interest income (recorded as finance income in the Statement of Profit or Loss) continues to be accrued on the reduced carrying amount using the rate of interest used to discount the future cash flows for the purpose of measuring the impairment loss. Loans, together with the associated allowance are written off when there is no realistic prospect of future recovery and all collateral has been realized or has been transferred to the Group. If, in a subsequent year, the amount of the estimated impairment loss increases or decreases because of an event occurring after the impairment was recognized, the previously recognized impairment loss is increased or reduced by adjusting the allowance account. If a write-off is later recovered, the recovery is credited to finance cost in Statement of Profit or Loss.
230 /
ACCESS ENGINEERING PLC // ANNUAL REPORT 2016/17
PREAMBLE BUSINESS MODEL VALUE CREATION STEWARDSHIP FINANCIAL REPORTS ANNEXES
NOTES TO THE FINANCIAL STATEMENTS
AFS Financial AssetsFor AFS financial assets, the Group assesses at each Reporting Date whether there is objective evidence that an investment or a group of investments is impaired.
In the case of equity investments classified as AFS, objective evidence would include a significant or prolonged decline in the fair value of the investment below its cost. When there is evidence of impairment, the cumulative loss – measured as the difference between the acquisition cost and the current fair value, less any impairment loss on that investment previously recognized in the Statement of Profit or Loss – is removed from Other Comprehensive Income and recognized in the Statement of Profit or Loss. Impairment losses on equity investments are not reversed through profit or loss; increases in their fair value after impairment are recognized in Other Comprehensive Income.
In the case of debt instruments classified as AFS, the impairment is assessed based on the same criteria as financial assets carried at amortized cost. However, the amount recorded for impairment is the cumulative loss measured as the difference between the amortized cost and the current fair value, less any impairment loss on that investment previously recognized in the Statement of Profit or Loss.
Future interest income continues to be accrued based on the reduced carrying amount of the asset, using the rate of interest used to discount future cash flows for the purpose of measuring the impairment loss. The interest income is recorded as part of finance income. If, in a subsequent year, the fair value of a debt instrument increases and the increase can be objectively related to an event occurring after the impairment loss was recognized in the Statement of Profit or Loss, the impairment loss is reversed through the Statement of Profit or Loss.
Financial LiabilitiesInitial Recognition and MeasurementFinancial liabilities are classified, at initial recognition as financial liabilities at fair value through profit or loss, loans and borrowings, payables or as derivatives designated as hedging instruments in an effective hedge, as appropriate.
All financial liabilities are recognized initially at fair value and, in the case of loans and borrowings and payables, net of directly attributable transaction costs.
The Group financial liabilities include trade and other payables, loans and borrowings including bank overdraft and financial guarantee contracts.
Subsequent MeasurementThe measurement of financial liabilities depends on their classification, as described below:
Financial Liabilities at Fair Value through Profit or LossFinancial liabilities at fair value through profit or loss incurred financial liabilities held-for-trading and financial liabilities designated upon initial recognition as at fair value through profit or loss.
Financial liabilities are classified as held-for-trading if they are incurred for the purpose of repurchasing in the near term. This category also includes derivative financial instruments entered into by the Group that are not designated as hedging instruments in hedge relationships as defined by LKAS 39. Separated embedded derivatives are also classified as held-for-trading unless they are designated as effective hedging instruments.
Gains or losses on liabilities held-for-trading are recognized in the Statement of Profit or Loss.
Financial liabilities designated upon initial recognition at fair value through profit or loss are designated at the initial date of recognition and only if the criteria in LKAS 39 are satisfied. The Group has not designated any financial liability as at fair value through profit or loss.
231
ACCESS ENGINEERING PLC // ANNUAL REPORT 2016/17
/
PREAMBLE BUSINESS MODEL VALUE CREATION STEWARDSHIP FINANCIAL REPORTS ANNEXES
NOTES TO THE FINANCIAL STATEMENTS
Loans and BorrowingsAfter initial recognition, interest-bearing loans and borrowings are subsequently measured at amortized cost using the EIR method. Gains and losses are recognized in the profit or loss when the liabilities are derecognized as well as through the EIR amortization process.
Amortized cost is calculated by taking into account any discount or premium on acquisition and fees or costs that are integral parts of the EIR. The EIR amortization is included in finance costs in the Statement of Profit or Loss.
Financial Guarantee ContractsFinancial guarantee contracts issued by the Group are those contracts that require a payment to be made to reimburse the holder for a loss it incurs because the specified debtor fails to make a payment when due in accordance with the terms of a debt instrument. Financial guarantee contracts are recognized initially as a liability at fair value, adjusted for transaction costs that are directly attributable to the issuance of the guarantee. Subsequently, the liability is measured at the higher of the best estimate of the expenditure required to settle the present obligation at the Reporting Date and the amount recognized less cumulative amortization.
DerecognitionA financial liability is derecognized when the obligation under the liability is discharged or cancelled or expires. When an existing financial liability is replaced by another from the same lender on substantially different terms or the terms of an existing liability are substantially modified, such an exchange or modification is treated as the derecognition of the original liability and the recognition of a new liability. The difference in the respective carrying amounts is recognized in the Statement of Profit or Loss.
Offsetting of Financial InstrumentsFinancial assets and financial liabilities are offset and the net amount is Reported in the Consolidated Statement of Financial Position only if there is a current enforceable legal right to offset the recognized amounts and there is an intention to settle on a net basis, to realize the assets and settle the liabilities simultaneously.
Fair Value of Financial InstrumentsThe fair value of financial instruments that are traded in active markets at each Reporting Date is determined by reference to quoted market prices or dealer price quotations (bid price for long positions and ask price for short positions), without any deduction for transaction costs.
For financial instruments not traded in an active market, the fair value is determined using appropriate valuation techniques. Such techniques may include:
y Using recent arm's length market transactions.
y Reference to the current fair value of another instrument that is substantially the same.
y A discounted cash flow analysis or other valuation models.
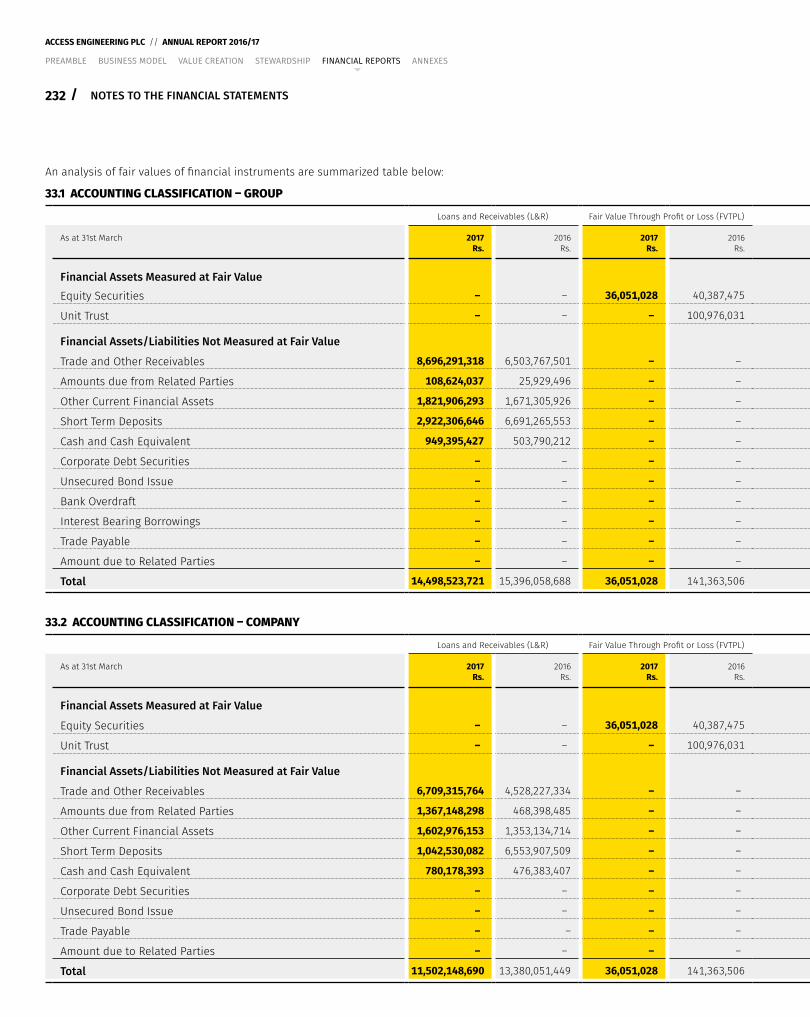
232 /
ACCESS ENGINEERING PLC // ANNUAL REPORT 2016/17
PREAMBLE BUSINESS MODEL VALUE CREATION STEWARDSHIP FINANCIAL REPORTS ANNEXES
NOTES TO THE FINANCIAL STATEMENTS
An analysis of fair values of financial instruments are summarized table below:
33.1 ACCOUNTING CLASSIFICATION – GROUP
Loans and Receivables (L&R) Fair Value Through Profit or Loss (FVTPL) Held-to-Maturity Total Other Financial Liabilities
As at 31st March 2017Rs.
2016Rs.
2017Rs.
2016Rs.
2017Rs.
2016Rs.
2017Rs.
2016Rs.
2017Rs.
2016Rs.
Financial Assets Measured at Fair ValueEquity Securities – – 36,051,028 40,387,475 – – 36,051,028 40,387,475 – –
Unit Trust – – – 100,976,031 – – – 100,976,031 – –
Financial Assets/Liabilities Not Measured at Fair Value
Trade and Other Receivables 8,696,291,318 6,503,767,501 – – – – 8,696,291,318 6,503,767,501 – –
Amounts due from Related Parties 108,624,037 25,929,496 – – – – 108,624,037 25,929,496 – –
Other Current Financial Assets 1,821,906,293 1,671,305,926 – – – – 1,821,906,293 1,671,305,926 – –
Short Term Deposits 2,922,306,646 6,691,265,553 – – – – 2,922,306,646 6,691,265,553 – –
Cash and Cash Equivalent 949,395,427 503,790,212 – – – – 949,395,427 503,790,212 – –
Corporate Debt Securities – – – – 1,425,831,563 1,358,785,866 1,425,831,563 1,358,785,866 – –
Unsecured Bond Issue – – – – – – – – 5,007,311,766 5,008,666,927
Bank Overdraft – – – – – – – – 278,198,636 412,594,547
Interest Bearing Borrowings – – – – – – – – 729,922,894 837,095,172
Trade Payable – – – – – – – – 5,000,565,435 3,417,129,881
Amount due to Related Parties – – – – – – – – 67,307,412 42,349,657
Total 14,498,523,721 15,396,058,688 36,051,028 141,363,506 1,425,831,563 1,358,785,866 15,960,406,312 16,896,208,060 11,083,306,143 9,717,836,184
33.2 ACCOUNTING CLASSIFICATION – COMPANY
Loans and Receivables (L&R) Fair Value Through Profit or Loss (FVTPL) Held-to-Maturity Total Other Financial Liabilities
As at 31st March 2017Rs.
2016Rs.
2017Rs.
2016Rs.
2017Rs.
2016Rs.
2017Rs.
2016Rs.
2017Rs.
2016Rs.
Financial Assets Measured at Fair Value
Equity Securities – – 36,051,028 40,387,475 – – 36,051,028 40,387,475 – –
Unit Trust – – – 100,976,031 – – – 100,976,031 – –
Financial Assets/Liabilities Not Measured at Fair Value
Trade and Other Receivables 6,709,315,764 4,528,227,334 – – – – 6,709,315,764 4,528,227,334 – –
Amounts due from Related Parties 1,367,148,298 468,398,485 – – – – 1,367,148,298 468,398,485 – –
Other Current Financial Assets 1,602,976,153 1,353,134,714 – – – – 1,602,976,153 1,353,134,714 – –
Short Term Deposits 1,042,530,082 6,553,907,509 – – – – 1,042,530,082 6,553,907,509 – –
Cash and Cash Equivalent 780,178,393 476,383,407 – – – – 780,178,393 476,383,407 – –
Corporate Debt Securities – – – – 973,295,205 863,166,986 973,295,205 863,166,986 – –
Unsecured Bond Issue – – – – – – – – 5,188,152,872 5,189,556,989
Trade Payable – – – – – – – – 3,044,875,547 1,933,946,283
Amount due to Related Parties – – – – – – – – 70,580,173 30,659,604
Total 11,502,148,690 13,380,051,449 36,051,028 141,363,506 973,295,205 863,166,986 12,511,494,923 14,384,581,941 8,303,608,592 7,154,162,876
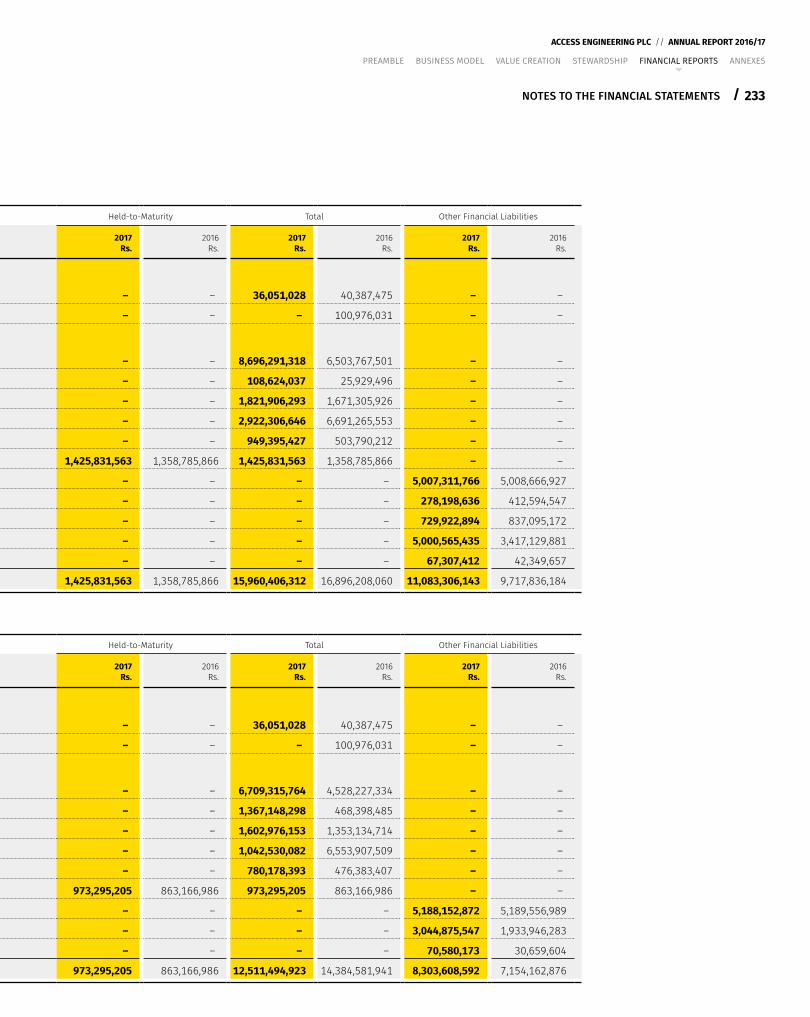
233
ACCESS ENGINEERING PLC // ANNUAL REPORT 2016/17
/
PREAMBLE BUSINESS MODEL VALUE CREATION STEWARDSHIP FINANCIAL REPORTS ANNEXES
NOTES TO THE FINANCIAL STATEMENTS
An analysis of fair values of financial instruments are summarized table below:
33.1 ACCOUNTING CLASSIFICATION – GROUP
Loans and Receivables (L&R) Fair Value Through Profit or Loss (FVTPL) Held-to-Maturity Total Other Financial Liabilities
As at 31st March 2017Rs.
2016Rs.
2017Rs.
2016Rs.
2017Rs.
2016Rs.
2017Rs.
2016Rs.
2017Rs.
2016Rs.
Financial Assets Measured at Fair ValueEquity Securities – – 36,051,028 40,387,475 – – 36,051,028 40,387,475 – –
Unit Trust – – – 100,976,031 – – – 100,976,031 – –
Financial Assets/Liabilities Not Measured at Fair Value
Trade and Other Receivables 8,696,291,318 6,503,767,501 – – – – 8,696,291,318 6,503,767,501 – –
Amounts due from Related Parties 108,624,037 25,929,496 – – – – 108,624,037 25,929,496 – –
Other Current Financial Assets 1,821,906,293 1,671,305,926 – – – – 1,821,906,293 1,671,305,926 – –
Short Term Deposits 2,922,306,646 6,691,265,553 – – – – 2,922,306,646 6,691,265,553 – –
Cash and Cash Equivalent 949,395,427 503,790,212 – – – – 949,395,427 503,790,212 – –
Corporate Debt Securities – – – – 1,425,831,563 1,358,785,866 1,425,831,563 1,358,785,866 – –
Unsecured Bond Issue – – – – – – – – 5,007,311,766 5,008,666,927
Bank Overdraft – – – – – – – – 278,198,636 412,594,547
Interest Bearing Borrowings – – – – – – – – 729,922,894 837,095,172
Trade Payable – – – – – – – – 5,000,565,435 3,417,129,881
Amount due to Related Parties – – – – – – – – 67,307,412 42,349,657
Total 14,498,523,721 15,396,058,688 36,051,028 141,363,506 1,425,831,563 1,358,785,866 15,960,406,312 16,896,208,060 11,083,306,143 9,717,836,184
33.2 ACCOUNTING CLASSIFICATION – COMPANY
Loans and Receivables (L&R) Fair Value Through Profit or Loss (FVTPL) Held-to-Maturity Total Other Financial Liabilities
As at 31st March 2017Rs.
2016Rs.
2017Rs.
2016Rs.
2017Rs.
2016Rs.
2017Rs.
2016Rs.
2017Rs.
2016Rs.
Financial Assets Measured at Fair Value
Equity Securities – – 36,051,028 40,387,475 – – 36,051,028 40,387,475 – –
Unit Trust – – – 100,976,031 – – – 100,976,031 – –
Financial Assets/Liabilities Not Measured at Fair Value
Trade and Other Receivables 6,709,315,764 4,528,227,334 – – – – 6,709,315,764 4,528,227,334 – –
Amounts due from Related Parties 1,367,148,298 468,398,485 – – – – 1,367,148,298 468,398,485 – –
Other Current Financial Assets 1,602,976,153 1,353,134,714 – – – – 1,602,976,153 1,353,134,714 – –
Short Term Deposits 1,042,530,082 6,553,907,509 – – – – 1,042,530,082 6,553,907,509 – –
Cash and Cash Equivalent 780,178,393 476,383,407 – – – – 780,178,393 476,383,407 – –
Corporate Debt Securities – – – – 973,295,205 863,166,986 973,295,205 863,166,986 – –
Unsecured Bond Issue – – – – – – – – 5,188,152,872 5,189,556,989
Trade Payable – – – – – – – – 3,044,875,547 1,933,946,283
Amount due to Related Parties – – – – – – – – 70,580,173 30,659,604
Total 11,502,148,690 13,380,051,449 36,051,028 141,363,506 973,295,205 863,166,986 12,511,494,923 14,384,581,941 8,303,608,592 7,154,162,876
234 /
ACCESS ENGINEERING PLC // ANNUAL REPORT 2016/17
PREAMBLE BUSINESS MODEL VALUE CREATION STEWARDSHIP FINANCIAL REPORTS ANNEXES
NOTES TO THE FINANCIAL STATEMENTS
34. FAIR VALUE MEASUREMENT AND RELATED FAIR VALUE DISCLOSURES34.1 FAIR VALUE MEASUREMENT The Group measures financial instruments such as derivatives and non-financial assets such as investment properties, at fair value at each Balance Sheet date. Fair-value related disclosures for financial instruments and non-financial assets that are measured at fair value or where fair values are only disclosed in this Note.
ACCOUNTING POLICYFair value is the price that would be received to sell an asset or paid to transfer a liability in an orderly transaction between market participants at the measurement date. The fair value measurement is based on the presumption that the transaction to sell the asset or transfer the liability takes place either:
In the principal market for the asset or liability;OrIn the absence of a principal market, in the most advantageous market for the asset or liability.
The principal or the most advantageous market must be accessible by the Group.
The fair value of an asset or a liability is measured using the assumptions that market participants would use when pricing the asset or liability, assuming that market participants act in their economic best interest.
A fair value measurement of a non-financial asset takes into account a market participant's ability to generate economic benefits by using the asset in its highest and best use or by selling it to another market participant that would use the asset in its highest and best use.
The Group uses valuation techniques that are appropriate in the circumstances and for which sufficient data are available to measure fair value, maximizing the use of relevant observable inputs and minimizing the use of unobservable inputs.
All assets and liabilities for which fair value is measured or disclosed in the Financial Statements are categorized within the fair value hierarchy, described as follows, based on the lowest level input that is significant to the fair value measurement as a whole:
Level 1 – Inputs that are quoted market prices (unadjusted) in active markets for identical assets or liabilities.
Level 2 – Valuation techniques for which the lowest level input that is significant to the fair value measurement is directly or indirectly observable.
Level 3 – Valuation techniques for which the lowest level input that is significant to the fair value measurement is unobservable.
For assets and liabilities that are recognized in the Financial Statements at fair value on a recurring basis, the Group determines whether transfers have occurred between levels in the hierarchy by reassessing categorization (based on the lowest level input that is significant to the fair value measurement as a whole) at the end of each Reporting Period.
Involvement of external valuers is decided upon annually by the management. Selection criteria include market knowledge, reputation, independence and whether professional standards are maintained. The management decides, after discussions with the Group’s external valuers, which valuation techniques and inputs to use for each case.
At each Reporting Date, the management analyses the movements in the values of assets and liabilities which are required to be remeasured or reassessed as per the Group’s accounting policies. For this analysis, the management verifies the major inputs applied in the latest valuation by agreeing the information in the valuation computation to contracts and other relevant documents.
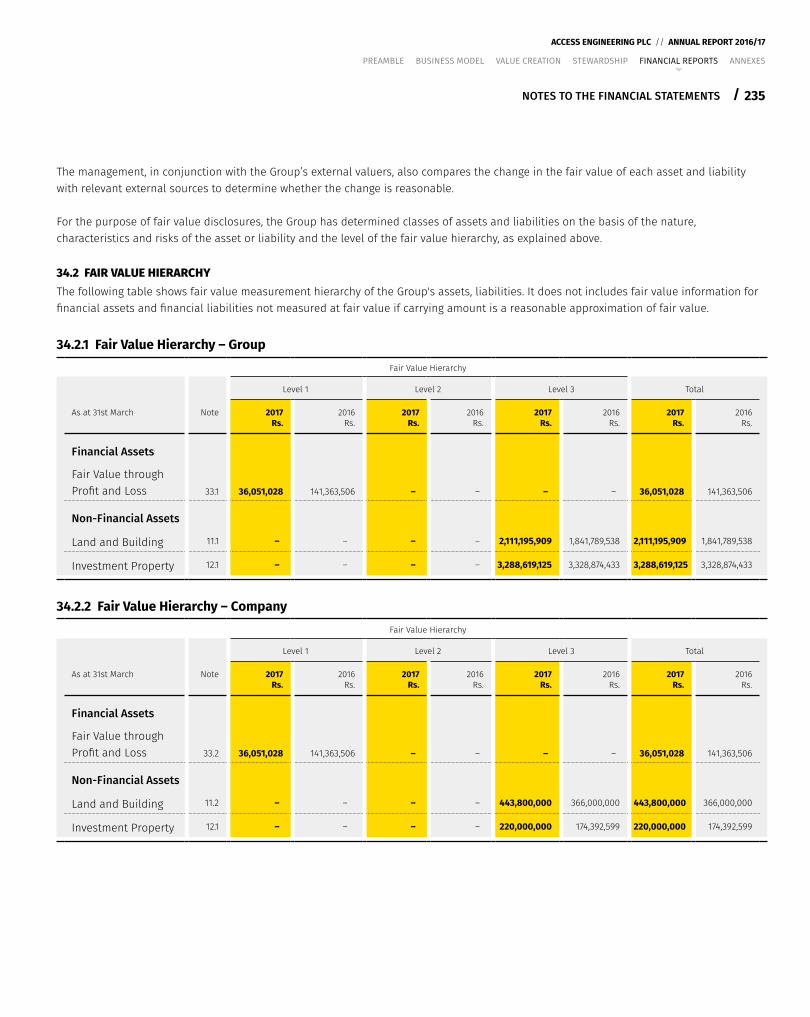
235
ACCESS ENGINEERING PLC // ANNUAL REPORT 2016/17
/
PREAMBLE BUSINESS MODEL VALUE CREATION STEWARDSHIP FINANCIAL REPORTS ANNEXES
NOTES TO THE FINANCIAL STATEMENTS
The management, in conjunction with the Group’s external valuers, also compares the change in the fair value of each asset and liability with relevant external sources to determine whether the change is reasonable.
For the purpose of fair value disclosures, the Group has determined classes of assets and liabilities on the basis of the nature, characteristics and risks of the asset or liability and the level of the fair value hierarchy, as explained above.
34.2 FAIR VALUE HIERARCHYThe following table shows fair value measurement hierarchy of the Group's assets, liabilities. It does not includes fair value information for financial assets and financial liabilities not measured at fair value if carrying amount is a reasonable approximation of fair value.
34.2.1 Fair Value Hierarchy – GroupFair Value Hierarchy
Level 1 Level 2 Level 3 Total
As at 31st March Note 2017Rs.
2016Rs.
2017Rs.
2016Rs.
2017Rs.
2016Rs.
2017Rs.
2016Rs.
Financial Assets
Fair Value through Profit and Loss 33.1 36,051,028 141,363,506 – – – – 36,051,028 141,363,506
Non-Financial Assets
Land and Building 11.1 – – – – 2,111,195,909 1,841,789,538 2,111,195,909 1,841,789,538
Investment Property 12.1 – – – – 3,288,619,125 3,328,874,433 3,288,619,125 3,328,874,433
34.2.2 Fair Value Hierarchy – CompanyFair Value Hierarchy
Level 1 Level 2 Level 3 Total
As at 31st March Note 2017Rs.
2016Rs.
2017Rs.
2016Rs.
2017Rs.
2016Rs.
2017Rs.
2016Rs.
Financial Assets
Fair Value through Profit and Loss 33.2 36,051,028 141,363,506 – – – – 36,051,028 141,363,506
Non-Financial Assets
Land and Building 11.2 – – – – 443,800,000 366,000,000 443,800,000 366,000,000
Investment Property 12.1 – – – – 220,000,000 174,392,599 220,000,000 174,392,599
236 /
ACCESS ENGINEERING PLC // ANNUAL REPORT 2016/17
PREAMBLE BUSINESS MODEL VALUE CREATION STEWARDSHIP FINANCIAL REPORTS ANNEXES
NOTES TO THE FINANCIAL STATEMENTS
35. FINANCIAL INSTRUMENTS, RISK MANAGEMENT OBJECTIVES AND POLICIESFinancial Risk Management is the practice of economic value in a firm by using financial instrument, manage exposure to risk face by the Group. The Group’s principal financial assets include loans, trade and other receivables and cash and Short Term deposits that derive directly from its operations. The major financial liabilities used by a group including debt securities, interest bearing borrowings and trade and other payables. The main purpose of these financial investments is to finance the Group’s operations and to provide guarantees to support its operations. The Board of Directors has established Group’s risk management policies to identify analyze the risk face by the Group and set appropriate risk limits and controls. Risk management policies and systems are reviewed regularly and aim to develop a disciplinary constructive control environment, in which all employees understand their roles and obligations through training, management standards and procedures.
The Group Audit Committee oversees how management monitors compliance with the Group’s risk management policies and procedures and reviews the risk management framework in relation to the risk face by the Group. The Group Audit Committee is assisted in its oversight role by Internal Audit. Internal Audit undertakes both regular and ad hoc reviews of risk management controls and procedures, the result of which are reported to the Audit Committee. The Committee reports regularly to the Board of Directors on its activities.
The group is exposed to key financial risks include Credit Risk, Liquidity Risk, Market Risk.
The Board of Directors revives, verifies, agree the policies for managing each type of risk which are summarized below:
35.1 CREDIT RISKCredit risk is the risk that counterparty will not meet its obligations under a financial instrument or customer contract, leading to a financial loss. The Group is exposed to credit risk from its operating activities (primarily trade receivables) and from its financing activities, including deposits with banks and financial institutions, foreign exchange transactions and other financial instruments.
35.1.1 Trade ReceivablesCustomer credit risk is managed by each business units subject to Group’s established polices procedures and controls relating to customer credit risk management.
The Group’s exposure to credit risk is influenced mainly by the individual characteristics of each customer. Each business units monitor the customers’ financial standing (financial insolvency). An impairment analysis is performed at each Reporting Date on an individual basis for major clients. The calculation is based on actual incurred historical data. The minimum exposure to credit risk at the Reporting Date is the carrying value of the each class of financial assets disclosed in Note 33.
The Group evaluates the concentration of risk with respect to trade receivables as low, as its customers are located in several industries and operate in largely independent markets and material payments being backed by guarantees and enters contractual agreements with clients before starting the operations.
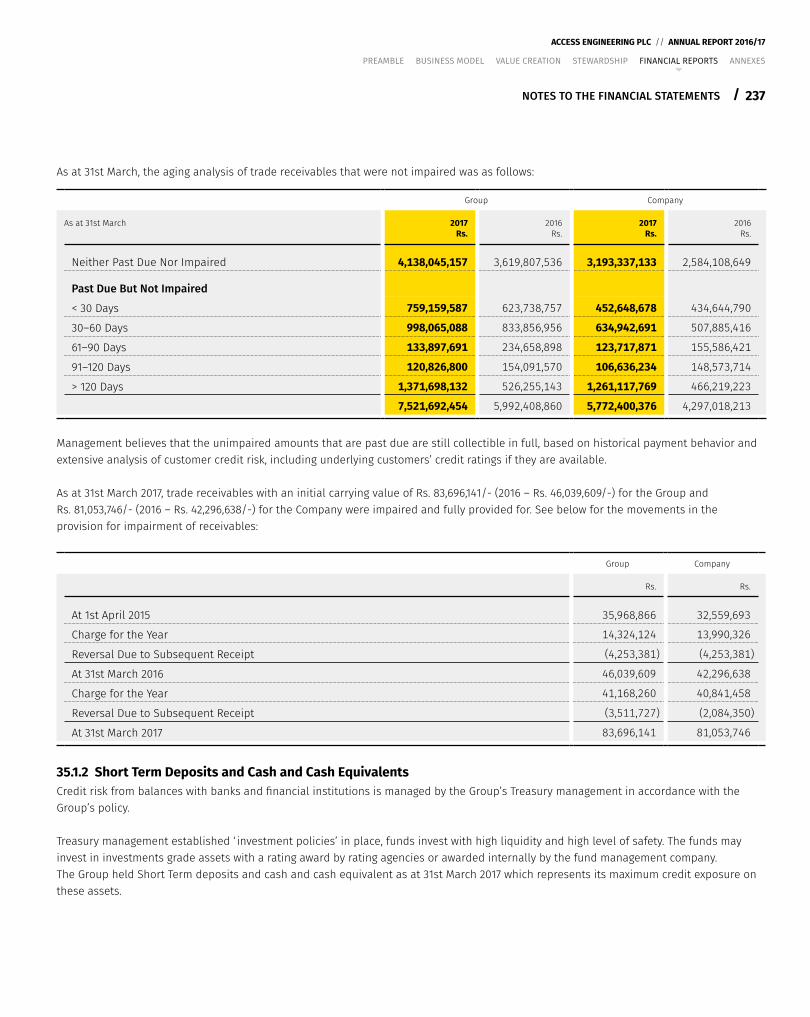
237
ACCESS ENGINEERING PLC // ANNUAL REPORT 2016/17
/
PREAMBLE BUSINESS MODEL VALUE CREATION STEWARDSHIP FINANCIAL REPORTS ANNEXES
NOTES TO THE FINANCIAL STATEMENTS
As at 31st March, the aging analysis of trade receivables that were not impaired was as follows:
Group Company
As at 31st March 2017Rs.
2016Rs.
2017Rs.
2016Rs.
Neither Past Due Nor Impaired 4,138,045,157 3,619,807,536 3,193,337,133 2,584,108,649
Past Due But Not Impaired
< 30 Days 759,159,587 623,738,757 452,648,678 434,644,790
30–60 Days 998,065,088 833,856,956 634,942,691 507,885,416
61–90 Days 133,897,691 234,658,898 123,717,871 155,586,421
91–120 Days 120,826,800 154,091,570 106,636,234 148,573,714
> 120 Days 1,371,698,132 526,255,143 1,261,117,769 466,219,223
7,521,692,454 5,992,408,860 5,772,400,376 4,297,018,213
Management believes that the unimpaired amounts that are past due are still collectible in full, based on historical payment behavior and extensive analysis of customer credit risk, including underlying customers’ credit ratings if they are available.
As at 31st March 2017, trade receivables with an initial carrying value of Rs. 83,696,141/- (2016 – Rs. 46,039,609/-) for the Group and Rs. 81,053,746/- (2016 – Rs. 42,296,638/-) for the Company were impaired and fully provided for. See below for the movements in the provision for impairment of receivables:
Group Company
Rs. Rs.
At 1st April 2015 35,968,866 32,559,693
Charge for the Year 14,324,124 13,990,326
Reversal Due to Subsequent Receipt (4,253,381) (4,253,381)
At 31st March 2016 46,039,609 42,296,638
Charge for the Year 41,168,260 40,841,458
Reversal Due to Subsequent Receipt (3,511,727) (2,084,350)
At 31st March 2017 83,696,141 81,053,746
35.1.2 Short Term Deposits and Cash and Cash EquivalentsCredit risk from balances with banks and financial institutions is managed by the Group’s Treasury management in accordance with the Group’s policy.
Treasury management established ‘ investment policies’ in place, funds invest with high liquidity and high level of safety. The funds may invest in investments grade assets with a rating award by rating agencies or awarded internally by the fund management company. The Group held Short Term deposits and cash and cash equivalent as at 31st March 2017 which represents its maximum credit exposure on these assets.
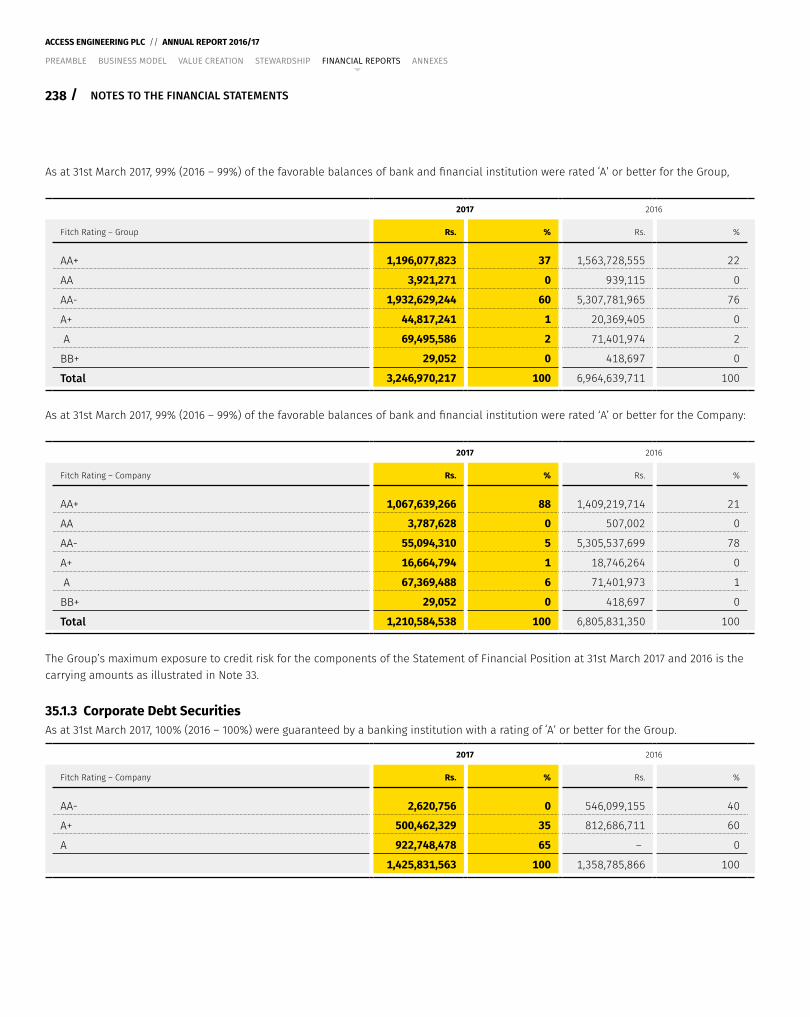
238 /
ACCESS ENGINEERING PLC // ANNUAL REPORT 2016/17
PREAMBLE BUSINESS MODEL VALUE CREATION STEWARDSHIP FINANCIAL REPORTS ANNEXES
NOTES TO THE FINANCIAL STATEMENTS
As at 31st March 2017, 99% (2016 – 99%) of the favorable balances of bank and financial institution were rated ʻAʼ or better for the Group,
2017 2016
Fitch Rating – Group Rs. % Rs. %
AA+ 1,196,077,823 37 1,563,728,555 22
AA 3,921,271 0 939,115 0
AA- 1,932,629,244 60 5,307,781,965 76
A+ 44,817,241 1 20,369,405 0
A 69,495,586 2 71,401,974 2
BB+ 29,052 0 418,697 0
Total 3,246,970,217 100 6,964,639,711 100
As at 31st March 2017, 99% (2016 – 99%) of the favorable balances of bank and financial institution were rated ‘A’ or better for the Company:
2017 2016
Fitch Rating – Company Rs. % Rs. %
AA+ 1,067,639,266 88 1,409,219,714 21
AA 3,787,628 0 507,002 0
AA- 55,094,310 5 5,305,537,699 78
A+ 16,664,794 1 18,746,264 0
A 67,369,488 6 71,401,973 1
BB+ 29,052 0 418,697 0
Total 1,210,584,538 100 6,805,831,350 100
The Group’s maximum exposure to credit risk for the components of the Statement of Financial Position at 31st March 2017 and 2016 is the carrying amounts as illustrated in Note 33.
35.1.3 Corporate Debt SecuritiesAs at 31st March 2017, 100% (2016 – 100%) were guaranteed by a banking institution with a rating of ʻAʼ or better for the Group.
2017 2016
Fitch Rating – Company Rs. % Rs. %
AA- 2,620,756 0 546,099,155 40
A+ 500,462,329 35 812,686,711 60
A 922,748,478 65 – 0
1,425,831,563 100 1,358,785,866 100
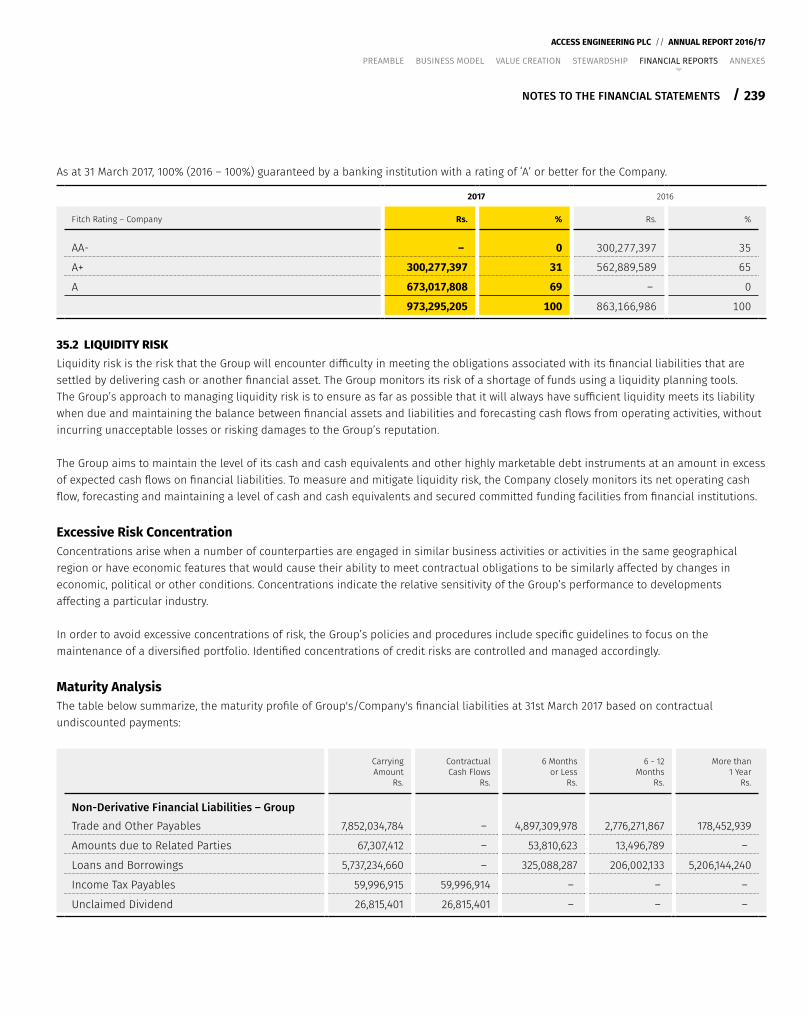
239
ACCESS ENGINEERING PLC // ANNUAL REPORT 2016/17
/
PREAMBLE BUSINESS MODEL VALUE CREATION STEWARDSHIP FINANCIAL REPORTS ANNEXES
NOTES TO THE FINANCIAL STATEMENTS
As at 31 March 2017, 100% (2016 – 100%) guaranteed by a banking institution with a rating of ʻAʼ or better for the Company.
2017 2016
Fitch Rating – Company Rs. % Rs. %
AA- – 0 300,277,397 35
A+ 300,277,397 31 562,889,589 65
A 673,017,808 69 – 0
973,295,205 100 863,166,986 100
35.2 LIQUIDITY RISKLiquidity risk is the risk that the Group will encounter difficulty in meeting the obligations associated with its financial liabilities that are settled by delivering cash or another financial asset. The Group monitors its risk of a shortage of funds using a liquidity planning tools. The Group’s approach to managing liquidity risk is to ensure as far as possible that it will always have sufficient liquidity meets its liability when due and maintaining the balance between financial assets and liabilities and forecasting cash flows from operating activities, without incurring unacceptable losses or risking damages to the Group’s reputation.
The Group aims to maintain the level of its cash and cash equivalents and other highly marketable debt instruments at an amount in excess of expected cash flows on financial liabilities. To measure and mitigate liquidity risk, the Company closely monitors its net operating cash flow, forecasting and maintaining a level of cash and cash equivalents and secured committed funding facilities from financial institutions.
Excessive Risk ConcentrationConcentrations arise when a number of counterparties are engaged in similar business activities or activities in the same geographical region or have economic features that would cause their ability to meet contractual obligations to be similarly affected by changes in economic, political or other conditions. Concentrations indicate the relative sensitivity of the Group’s performance to developments affecting a particular industry.
In order to avoid excessive concentrations of risk, the Group’s policies and procedures include specific guidelines to focus on the maintenance of a diversified portfolio. Identified concentrations of credit risks are controlled and managed accordingly.
Maturity AnalysisThe table below summarize, the maturity profile of Group's/Company's financial liabilities at 31st March 2017 based on contractual undiscounted payments:
CarryingAmount
Rs.
ContractualCash Flows
Rs.
6 Monthsor Less
Rs.
6 - 12Months
Rs.
More than1 Year
Rs.
Non-Derivative Financial Liabilities – GroupTrade and Other Payables 7,852,034,784 – 4,897,309,978 2,776,271,867 178,452,939
Amounts due to Related Parties 67,307,412 – 53,810,623 13,496,789 –
Loans and Borrowings 5,737,234,660 – 325,088,287 206,002,133 5,206,144,240
Income Tax Payables 59,996,915 59,996,914 – – –
Unclaimed Dividend 26,815,401 26,815,401 – – –
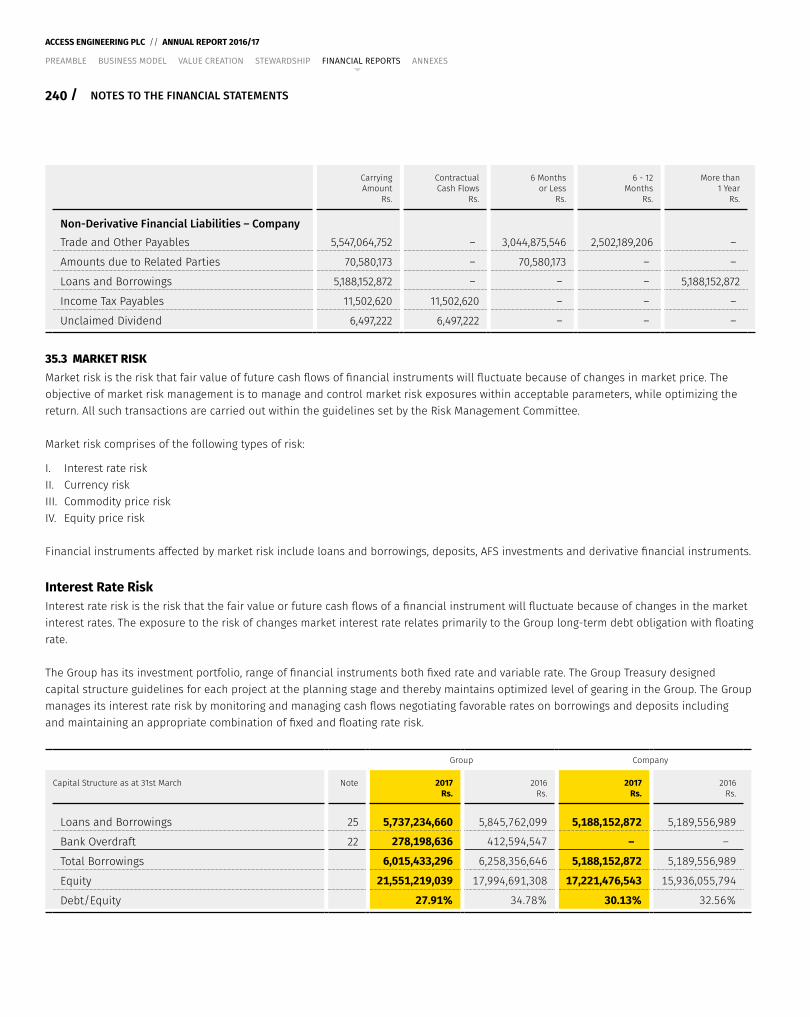
240 /
ACCESS ENGINEERING PLC // ANNUAL REPORT 2016/17
PREAMBLE BUSINESS MODEL VALUE CREATION STEWARDSHIP FINANCIAL REPORTS ANNEXES
NOTES TO THE FINANCIAL STATEMENTS
CarryingAmount
Rs.
ContractualCash Flows
Rs.
6 Monthsor Less
Rs.
6 - 12Months
Rs.
More than1 Year
Rs.
Non-Derivative Financial Liabilities – CompanyTrade and Other Payables 5,547,064,752 – 3,044,875,546 2,502,189,206 –
Amounts due to Related Parties 70,580,173 – 70,580,173 – –
Loans and Borrowings 5,188,152,872 – – – 5,188,152,872
Income Tax Payables 11,502,620 11,502,620 – – –
Unclaimed Dividend 6,497,222 6,497,222 – – –
35.3 MARKET RISKMarket risk is the risk that fair value of future cash flows of financial instruments will fluctuate because of changes in market price. The objective of market risk management is to manage and control market risk exposures within acceptable parameters, while optimizing the return. All such transactions are carried out within the guidelines set by the Risk Management Committee.
Market risk comprises of the following types of risk:
I. Interest rate riskII. Currency riskIII. Commodity price riskIV. Equity price risk
Financial instruments affected by market risk include loans and borrowings, deposits, AFS investments and derivative financial instruments.
Interest Rate RiskInterest rate risk is the risk that the fair value or future cash flows of a financial instrument will fluctuate because of changes in the market interest rates. The exposure to the risk of changes market interest rate relates primarily to the Group long-term debt obligation with floating rate.
The Group has its investment portfolio, range of financial instruments both fixed rate and variable rate. The Group Treasury designed capital structure guidelines for each project at the planning stage and thereby maintains optimized level of gearing in the Group. The Group manages its interest rate risk by monitoring and managing cash flows negotiating favorable rates on borrowings and deposits including and maintaining an appropriate combination of fixed and floating rate risk.
Group Company
Capital Structure as at 31st March Note 2017Rs.
2016Rs.
2017Rs.
2016Rs.
Loans and Borrowings 25 5,737,234,660 5,845,762,099 5,188,152,872 5,189,556,989
Bank Overdraft 22 278,198,636 412,594,547 – –
Total Borrowings 6,015,433,296 6,258,356,646 5,188,152,872 5,189,556,989
Equity 21,551,219,039 17,994,691,308 17,221,476,543 15,936,055,794
Debt/Equity 27.91% 34.78% 30.13% 32.56%
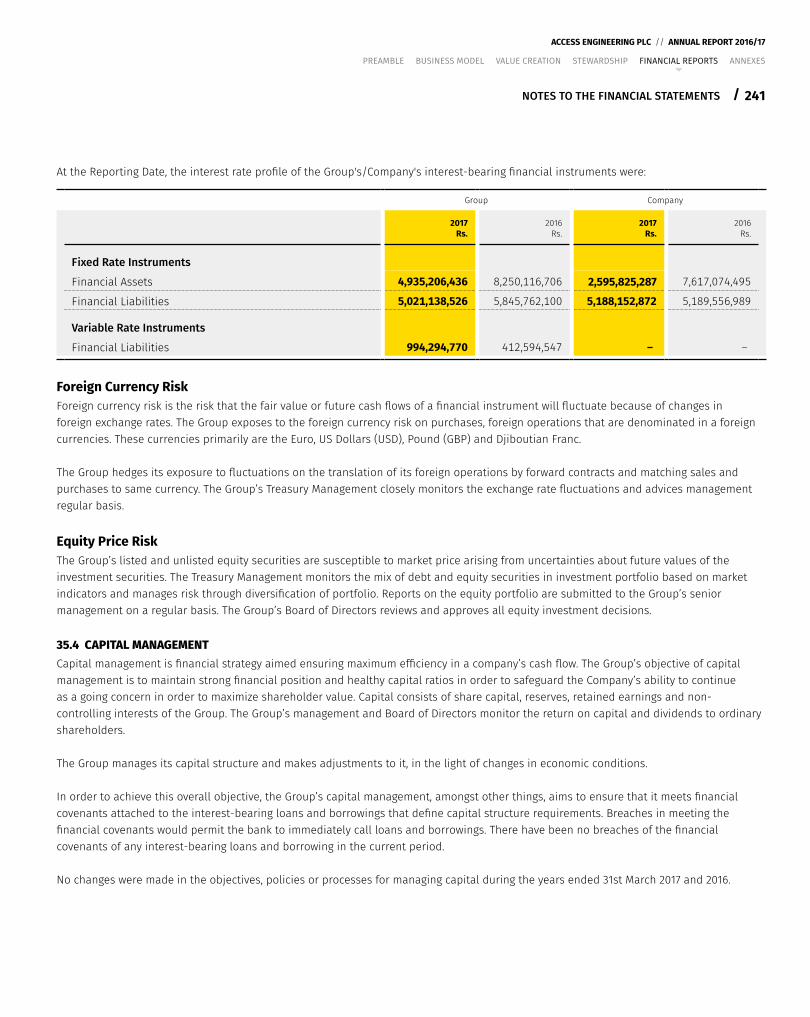
241
ACCESS ENGINEERING PLC // ANNUAL REPORT 2016/17
/
PREAMBLE BUSINESS MODEL VALUE CREATION STEWARDSHIP FINANCIAL REPORTS ANNEXES
NOTES TO THE FINANCIAL STATEMENTS
At the Reporting Date, the interest rate profile of the Group's/Company's interest-bearing financial instruments were:
Group Company
2017Rs.
2016Rs.
2017Rs.
2016Rs.
Fixed Rate Instruments
Financial Assets 4,935,206,436 8,250,116,706 2,595,825,287 7,617,074,495
Financial Liabilities 5,021,138,526 5,845,762,100 5,188,152,872 5,189,556,989
Variable Rate Instruments
Financial Liabilities 994,294,770 412,594,547 – –
Foreign Currency RiskForeign currency risk is the risk that the fair value or future cash flows of a financial instrument will fluctuate because of changes in foreign exchange rates. The Group exposes to the foreign currency risk on purchases, foreign operations that are denominated in a foreign currencies. These currencies primarily are the Euro, US Dollars (USD), Pound (GBP) and Djiboutian Franc.
The Group hedges its exposure to fluctuations on the translation of its foreign operations by forward contracts and matching sales and purchases to same currency. The Group’s Treasury Management closely monitors the exchange rate fluctuations and advices management regular basis.
Equity Price RiskThe Group’s listed and unlisted equity securities are susceptible to market price arising from uncertainties about future values of the investment securities. The Treasury Management monitors the mix of debt and equity securities in investment portfolio based on market indicators and manages risk through diversification of portfolio. Reports on the equity portfolio are submitted to the Group’s senior management on a regular basis. The Group’s Board of Directors reviews and approves all equity investment decisions.
35.4 CAPITAL MANAGEMENTCapital management is financial strategy aimed ensuring maximum efficiency in a company’s cash flow. The Group’s objective of capital management is to maintain strong financial position and healthy capital ratios in order to safeguard the Company’s ability to continue as a going concern in order to maximize shareholder value. Capital consists of share capital, reserves, retained earnings and non-controlling interests of the Group. The Group’s management and Board of Directors monitor the return on capital and dividends to ordinary shareholders.
The Group manages its capital structure and makes adjustments to it, in the light of changes in economic conditions.
In order to achieve this overall objective, the Group’s capital management, amongst other things, aims to ensure that it meets financial covenants attached to the interest-bearing loans and borrowings that define capital structure requirements. Breaches in meeting the financial covenants would permit the bank to immediately call loans and borrowings. There have been no breaches of the financial covenants of any interest-bearing loans and borrowing in the current period.
No changes were made in the objectives, policies or processes for managing capital during the years ended 31st March 2017 and 2016.
242 /
ACCESS ENGINEERING PLC // ANNUAL REPORT 2016/17
PREAMBLE BUSINESS MODEL VALUE CREATION STEWARDSHIP FINANCIAL REPORTS ANNEXES
NOTES TO THE FINANCIAL STATEMENTS
35.5 DISTRIBUTION MADE AND PROPOSEDThe Company recognizes a liability to make cash or non-cash distributions to equity holders of the parent when the distribution is authorized and the distribution is no longer at the discretion of the Company. A corresponding amount is recognized directly in equity.
Non-cash distributions are measured at the fair value of the assets to be distributed with fair value remeasurement recognized directly in equity. Upon distribution of non-cash assets, any difference between the carrying amount of the liability and the carrying amount of the assets distributed is recognized in the Statement of Profit or Loss.
Distribution made and proposed are disclosed in Note 23.3.
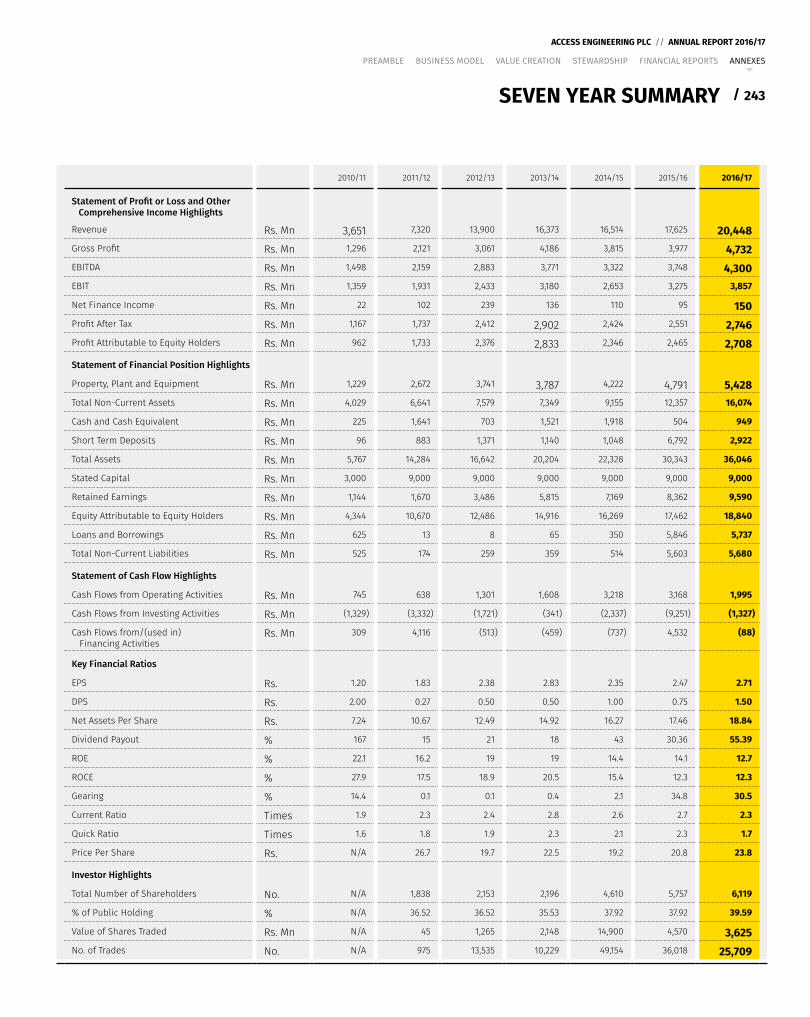
243
ACCESS ENGINEERING PLC // ANNUAL REPORT 2016/17
/
PREAMBLE BUSINESS MODEL VALUE CREATION STEWARDSHIP FINANCIAL REPORTS ANNEXES
2010/11 2011/12 2012/13 2013/14 2014/15 2015/16 2016/17
Statement of Profit or Loss and Other Comprehensive Income Highlights
Revenue Rs. Mn 3,651 7,320 13,900 16,373 16,514 17,625 20,448 Gross Profit Rs. Mn 1,296 2,121 3,061 4,186 3,815 3,977 4,732 EBITDA Rs. Mn 1,498 2,159 2,883 3,771 3,322 3,748 4,300 EBIT Rs. Mn 1,359 1,931 2,433 3,180 2,653 3,275 3,857
Net Finance Income Rs. Mn 22 102 239 136 110 95 150 Profit After Tax Rs. Mn 1,167 1,737 2,412 2,902 2,424 2,551 2,746 Profit Attributable to Equity Holders Rs. Mn 962 1,733 2,376 2,833 2,346 2,465 2,708
Statement of Financial Position Highlights
Property, Plant and Equipment Rs. Mn 1,229 2,672 3,741 3,787 4,222 4,791 5,428 Total Non-Current Assets Rs. Mn 4,029 6,641 7,579 7,349 9,155 12,357 16,074
Cash and Cash Equivalent Rs. Mn 225 1,641 703 1,521 1,918 504 949
Short Term Deposits Rs. Mn 96 883 1,371 1,140 1,048 6,792 2,922
Total Assets Rs. Mn 5,767 14,284 16,642 20,204 22,328 30,343 36,046
Stated Capital Rs. Mn 3,000 9,000 9,000 9,000 9,000 9,000 9,000
Retained Earnings Rs. Mn 1,144 1,670 3,486 5,815 7,169 8,362 9,590
Equity Attributable to Equity Holders Rs. Mn 4,344 10,670 12,486 14,916 16,269 17,462 18,840
Loans and Borrowings Rs. Mn 625 13 8 65 350 5,846 5,737
Total Non-Current Liabilities Rs. Mn 525 174 259 359 514 5,603 5,680
Statement of Cash Flow Highlights
Cash Flows from Operating Activities Rs. Mn 745 638 1,301 1,608 3,218 3,168 1,995
Cash Flows from Investing Activities Rs. Mn (1,329) (3,332) (1,721) (341) (2,337) (9,251) (1,327)
Cash Flows from/(used in) Financing Activities
Rs. Mn 309 4,116 (513) (459) (737) 4,532 (88)
Key Financial Ratios
EPS Rs. 1.20 1.83 2.38 2.83 2.35 2.47 2.71
DPS Rs. 2.00 0.27 0.50 0.50 1.00 0.75 1.50
Net Assets Per Share Rs. 7.24 10.67 12.49 14.92 16.27 17.46 18.84
Dividend Payout % 167 15 21 18 43 30.36 55.39
ROE % 22.1 16.2 19 19 14.4 14.1 12.7
ROCE % 27.9 17.5 18.9 20.5 15.4 12.3 12.3
Gearing % 14.4 0.1 0.1 0.4 2.1 34.8 30.5
Current Ratio Times 1.9 2.3 2.4 2.8 2.6 2.7 2.3
Quick Ratio Times 1.6 1.8 1.9 2.3 2.1 2.3 1.7
Price Per Share Rs. N/A 26.7 19.7 22.5 19.2 20.8 23.8
Investor Highlights
Total Number of Shareholders No. N/A 1,838 2,153 2,196 4,610 5,757 6,119
% of Public Holding % N/A 36.52 36.52 35.53 37.92 37.92 39.59
Value of Shares Traded Rs. Mn N/A 45 1,265 2,148 14,900 4,570 3,625No. of Trades No. N/A 975 13,535 10,229 49,154 36,018 25,709
SEVEN YEAR SUMMARY
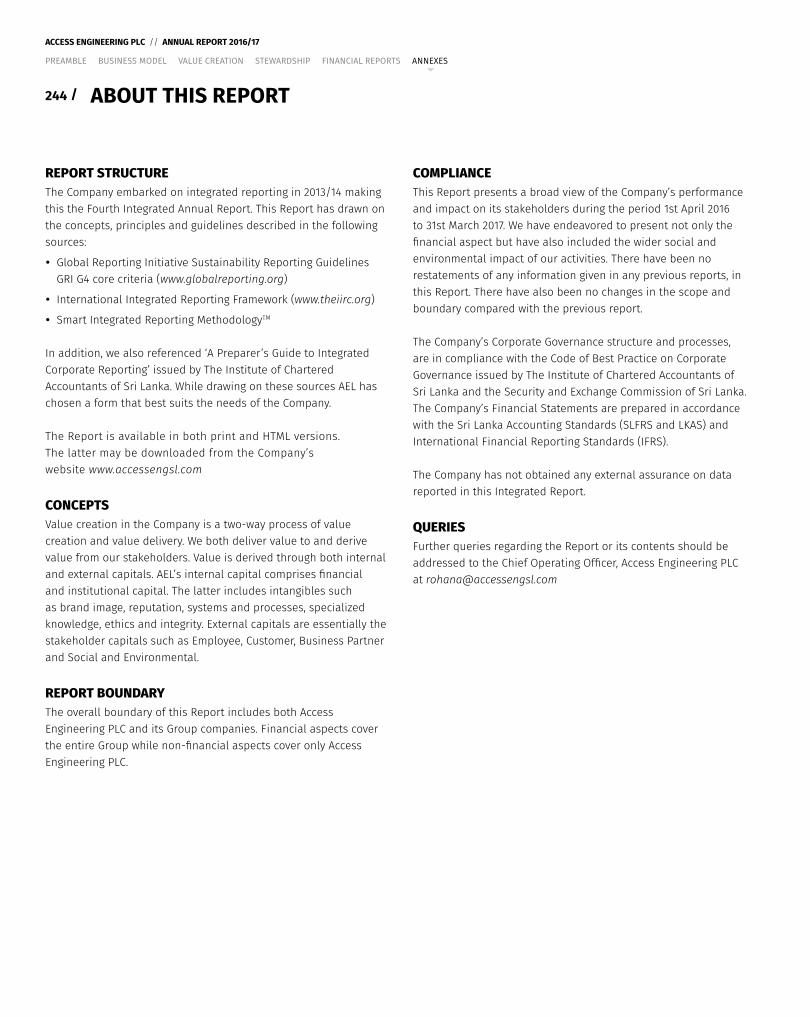
244 /
ACCESS ENGINEERING PLC // ANNUAL REPORT 2016/17
PREAMBLE BUSINESS MODEL VALUE CREATION STEWARDSHIP FINANCIAL REPORTS ANNEXES
ABOUT THIS REPORT
REPORT STRUCTUREThe Company embarked on integrated reporting in 2013/14 making this the Fourth Integrated Annual Report. This Report has drawn on the concepts, principles and guidelines described in the following sources:
y Global Reporting Initiative Sustainability Reporting Guidelines GRI G4 core criteria (www.globalreporting.org)
y International Integrated Reporting Framework (www.theiirc.org)
y Smart Integrated Reporting MethodologyTM
In addition, we also referenced ‘A Preparer’s Guide to Integrated Corporate Reporting’ issued by The Institute of Chartered Accountants of Sri Lanka. While drawing on these sources AEL has chosen a form that best suits the needs of the Company.
The Report is available in both print and HTML versions. The latter may be downloaded from the Company’s website www.accessengsl.com
CONCEPTSValue creation in the Company is a two-way process of value creation and value delivery. We both deliver value to and derive value from our stakeholders. Value is derived through both internal and external capitals. AEL’s internal capital comprises financial and institutional capital. The latter includes intangibles such as brand image, reputation, systems and processes, specialized knowledge, ethics and integrity. External capitals are essentially the stakeholder capitals such as Employee, Customer, Business Partner and Social and Environmental.
REPORT BOUNDARYThe overall boundary of this Report includes both Access Engineering PLC and its Group companies. Financial aspects cover the entire Group while non-financial aspects cover only Access Engineering PLC.
COMPLIANCEThis Report presents a broad view of the Company’s performance and impact on its stakeholders during the period 1st April 2016 to 31st March 2017. We have endeavored to present not only the financial aspect but have also included the wider social and environmental impact of our activities. There have been no restatements of any information given in any previous reports, in this Report. There have also been no changes in the scope and boundary compared with the previous report.
The Company’s Corporate Governance structure and processes, are in compliance with the Code of Best Practice on Corporate Governance issued by The Institute of Chartered Accountants of Sri Lanka and the Security and Exchange Commission of Sri Lanka. The Company’s Financial Statements are prepared in accordance with the Sri Lanka Accounting Standards (SLFRS and LKAS) and International Financial Reporting Standards (IFRS).
The Company has not obtained any external assurance on data reported in this Integrated Report.
QUERIESFurther queries regarding the Report or its contents should be addressed to the Chief Operating Officer, Access Engineering PLC at [email protected]
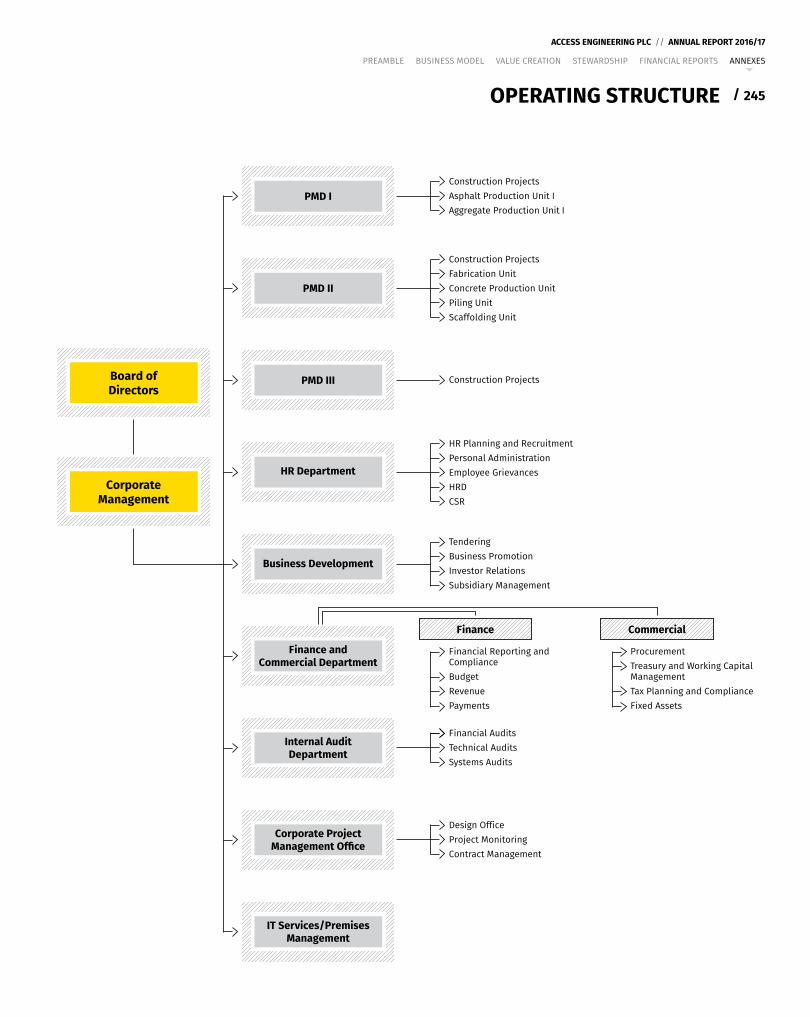
245
ACCESS ENGINEERING PLC // ANNUAL REPORT 2016/17
/
PREAMBLE BUSINESS MODEL VALUE CREATION STEWARDSHIP FINANCIAL REPORTS ANNEXES
OPERATING STRUCTURE
PMD I
PMD II
PMD III
Corporate ProjectManagement Office
Internal AuditDepartment
Finance andCommercial Department
Business Development
HR Department
IT Services/PremisesManagement
HR Planning and Recruitment
Personal Administration
Employee Grievances
HRD
CSR
Tendering
Business Promotion
Investor Relations
Subsidiary Management
Finance Commercial
Financial Reporting andCompliance
Budget
Revenue
Payments
Procurement
Treasury and Working CapitalManagement
Tax Planning and Compliance
Fixed Assets
Construction Projects
Fabrication Unit
Concrete Production Unit
Piling Unit
Scaffolding Unit
Construction Projects
Asphalt Production Unit I
Aggregate Production Unit I
Design Office
Project Monitoring
Contract Management
Construction Projects
Financial Audits
Technical Audits
Systems Audits
CorporateManagement
Board ofDirectors
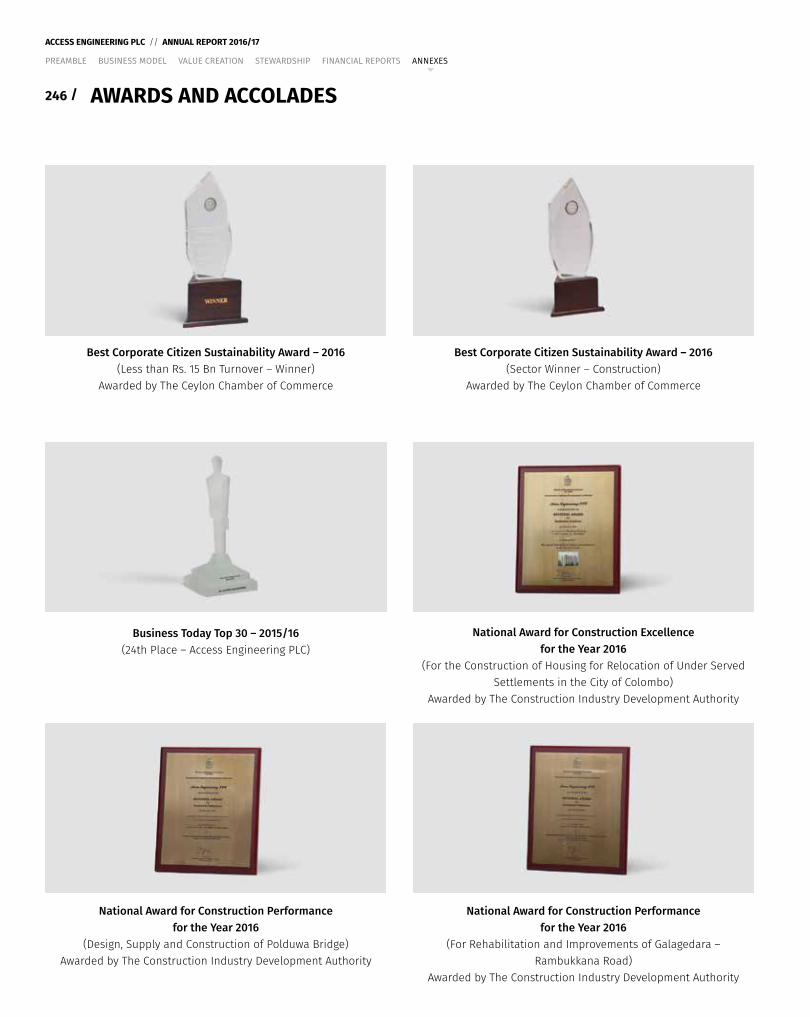
246 /
ACCESS ENGINEERING PLC // ANNUAL REPORT 2016/17
PREAMBLE BUSINESS MODEL VALUE CREATION STEWARDSHIP FINANCIAL REPORTS ANNEXES
AWARDS AND ACCOLADES
National Award for Construction Performancefor the Year 2016
(Design, Supply and Construction of Polduwa Bridge)Awarded by The Construction Industry Development Authority
National Award for Construction Performancefor the Year 2016
(For Rehabilitation and Improvements of Galagedara – Rambukkana Road)
Awarded by The Construction Industry Development Authority
Best Corporate Citizen Sustainability Award – 2016(Less than Rs. 15 Bn Turnover – Winner)
Awarded by The Ceylon Chamber of Commerce
Best Corporate Citizen Sustainability Award – 2016(Sector Winner – Construction)
Awarded by The Ceylon Chamber of Commerce
Business Today Top 30 – 2015/16(24th Place – Access Engineering PLC)
National Award for Construction Excellencefor the Year 2016
(For the Construction of Housing for Relocation of Under Served Settlements in the City of Colombo)
Awarded by The Construction Industry Development Authority
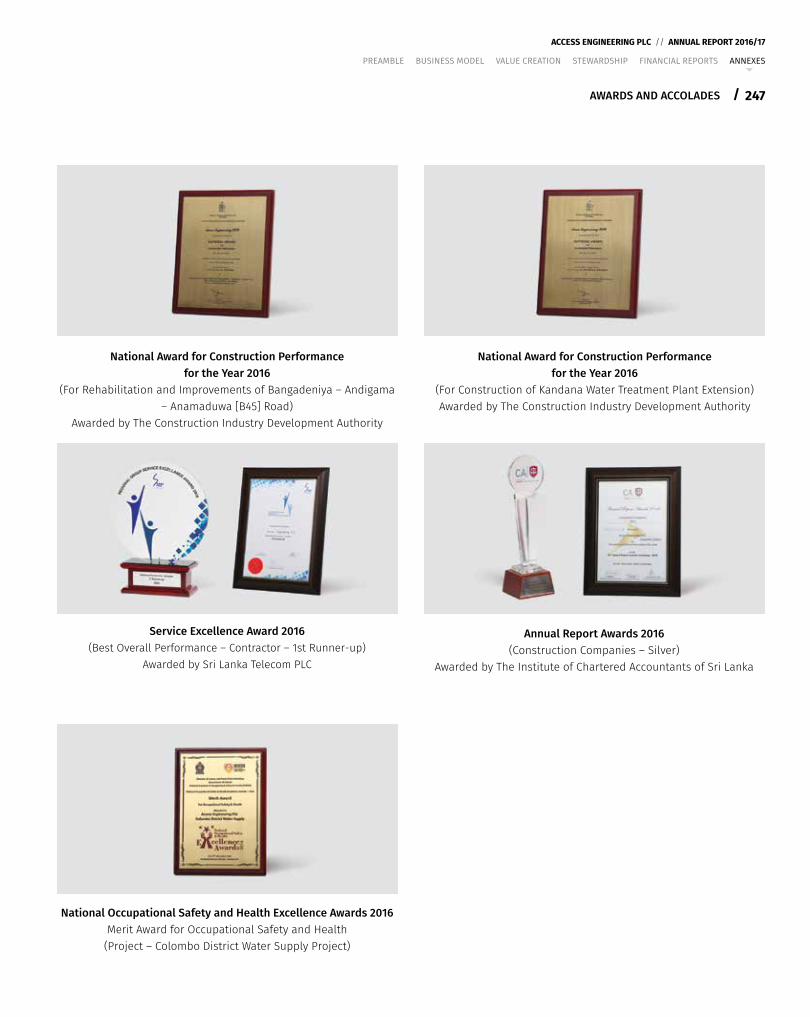
247
ACCESS ENGINEERING PLC // ANNUAL REPORT 2016/17
/
PREAMBLE BUSINESS MODEL VALUE CREATION STEWARDSHIP FINANCIAL REPORTS ANNEXES
National Occupational Safety and Health Excellence Awards 2016Merit Award for Occupational Safety and Health (Project – Colombo District Water Supply Project)
National Award for Construction Performancefor the Year 2016
(For Rehabilitation and Improvements of Bangadeniya – Andigama – Anamaduwa [B45] Road)
Awarded by The Construction Industry Development Authority
National Award for Construction Performancefor the Year 2016
(For Construction of Kandana Water Treatment Plant Extension)Awarded by The Construction Industry Development Authority
Service Excellence Award 2016(Best Overall Performance – Contractor – 1st Runner-up)
Awarded by Sri Lanka Telecom PLC
Annual Report Awards 2016 (Construction Companies – Silver)
Awarded by The Institute of Chartered Accountants of Sri Lanka
AWARDS AND ACCOLADES
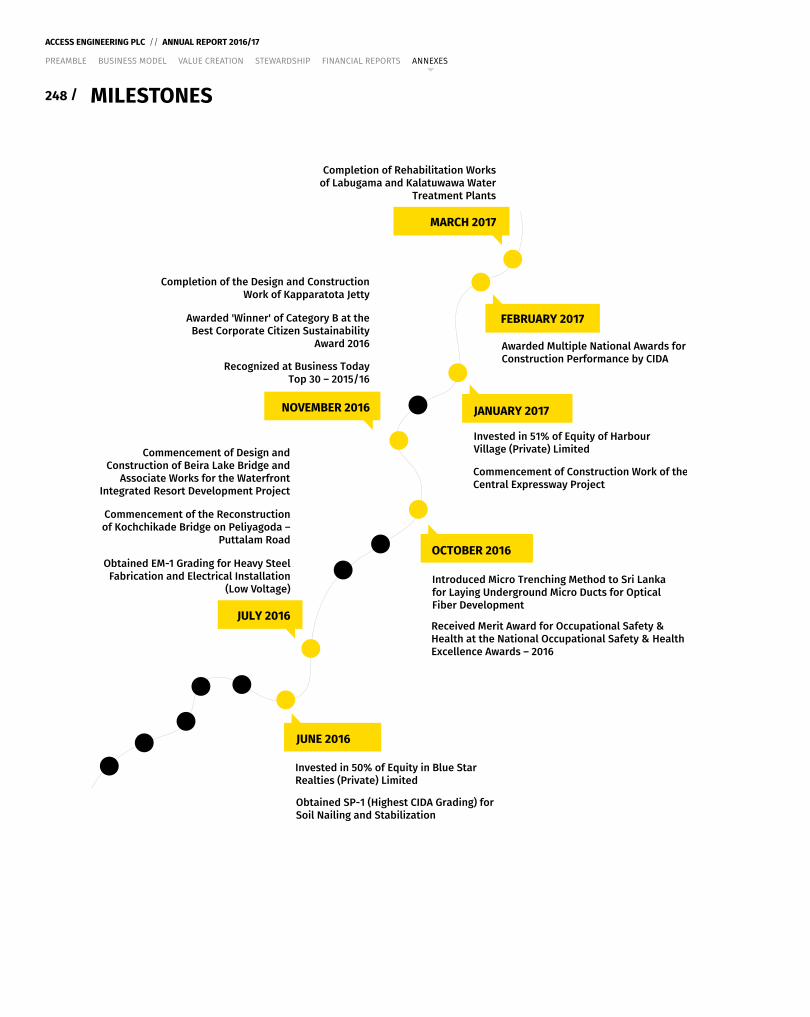
248 /
ACCESS ENGINEERING PLC // ANNUAL REPORT 2016/17
PREAMBLE BUSINESS MODEL VALUE CREATION STEWARDSHIP FINANCIAL REPORTS ANNEXES
MILESTONES
Invested in 50% of Equity in Blue StarRealties (Private) Limited
Obtained SP-1 (Highest CIDA Grading) forSoil Nailing and Stabilization
Commencement of Design andConstruction of Beira Lake Bridge and
Associate Works for the WaterfrontIntegrated Resort Development Project
Commencement of the Reconstructionof Kochchikade Bridge on Peliyagoda –
Puttalam Road
Obtained EM-1 Grading for Heavy SteelFabrication and Electrical Installation
(Low Voltage)Introduced Micro Trenching Method to Sri Lankafor Laying Underground Micro Ducts for OpticalFiber Development
Received Merit Award for Occupational Safety &Health at the National Occupational Safety & HealthExcellence Awards – 2016
Completion of the Design and ConstructionWork of Kapparatota Jetty
Awarded 'Winner' of Category B at theBest Corporate Citizen Sustainability
Award 2016
Recognized at Business TodayTop 30 – 2015/16
Invested in 51% of Equity of HarbourVillage (Private) Limited
Commencement of Construction Work of theCentral Expressway Project
Awarded Multiple National Awards forConstruction Performance by CIDA
Completion of Rehabilitation Worksof Labugama and Kalatuwawa Water
Treatment Plants
JUNE 2016
JULY 2016
OCTOBER 2016
NOVEMBER 2016 JANUARY 2017
FEBRUARY 2017
MARCH 2017
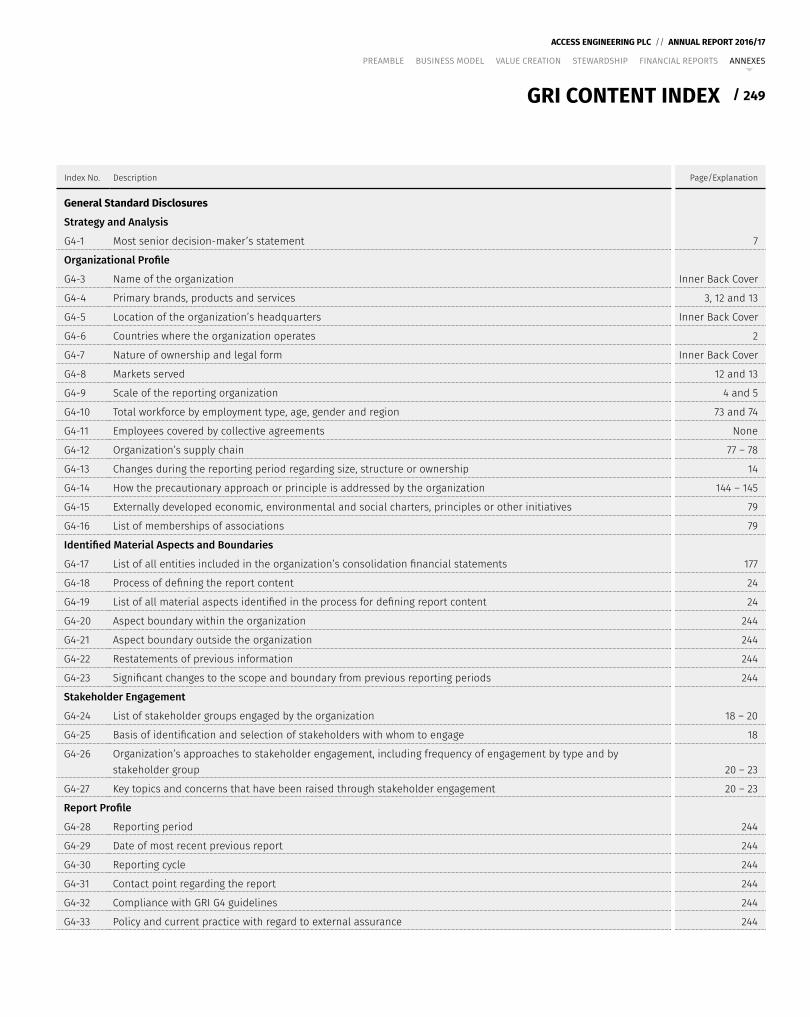
249
ACCESS ENGINEERING PLC // ANNUAL REPORT 2016/17
/
PREAMBLE BUSINESS MODEL VALUE CREATION STEWARDSHIP FINANCIAL REPORTS ANNEXES
GRI CONTENT INDEX
Index No. Description Page/Explanation
General Standard Disclosures
Strategy and Analysis
G4-1 Most senior decision-maker’s statement 7
Organizational Profile
G4-3 Name of the organization Inner Back Cover
G4-4 Primary brands, products and services 3, 12 and 13
G4-5 Location of the organization’s headquarters Inner Back Cover
G4-6 Countries where the organization operates 2
G4-7 Nature of ownership and legal form Inner Back Cover
G4-8 Markets served 12 and 13
G4-9 Scale of the reporting organization 4 and 5
G4-10 Total workforce by employment type, age, gender and region 73 and 74
G4-11 Employees covered by collective agreements None
G4-12 Organization’s supply chain 77 – 78
G4-13 Changes during the reporting period regarding size, structure or ownership 14
G4-14 How the precautionary approach or principle is addressed by the organization 144 – 145
G4-15 Externally developed economic, environmental and social charters, principles or other initiatives 79
G4-16 List of memberships of associations 79
Identified Material Aspects and Boundaries
G4-17 List of all entities included in the organization’s consolidation financial statements 177
G4-18 Process of defining the report content 24
G4-19 List of all material aspects identified in the process for defining report content 24
G4-20 Aspect boundary within the organization 244
G4-21 Aspect boundary outside the organization 244
G4-22 Restatements of previous information 244
G4-23 Significant changes to the scope and boundary from previous reporting periods 244
Stakeholder Engagement
G4-24 List of stakeholder groups engaged by the organization 18 – 20
G4-25 Basis of identification and selection of stakeholders with whom to engage 18
G4-26 Organization’s approaches to stakeholder engagement, including frequency of engagement by type and by stakeholder group 20 – 23
G4-27 Key topics and concerns that have been raised through stakeholder engagement 20 – 23
Report Profile
G4-28 Reporting period 244
G4-29 Date of most recent previous report 244
G4-30 Reporting cycle 244
G4-31 Contact point regarding the report 244
G4-32 Compliance with GRI G4 guidelines 244
G4-33 Policy and current practice with regard to external assurance 244
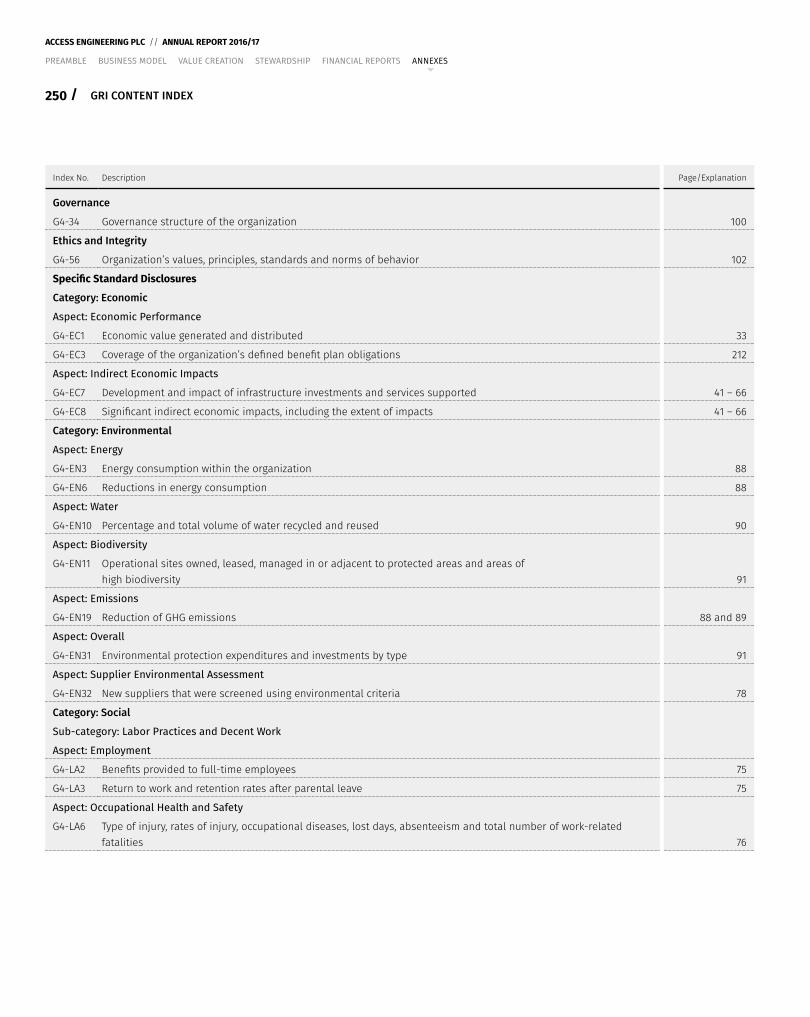
250 /
ACCESS ENGINEERING PLC // ANNUAL REPORT 2016/17
PREAMBLE BUSINESS MODEL VALUE CREATION STEWARDSHIP FINANCIAL REPORTS ANNEXES
Index No. Description Page/Explanation
Governance
G4-34 Governance structure of the organization 100
Ethics and Integrity
G4-56 Organization’s values, principles, standards and norms of behavior 102
Specific Standard Disclosures
Category: Economic
Aspect: Economic Performance
G4-EC1 Economic value generated and distributed 33
G4-EC3 Coverage of the organization’s defined benefit plan obligations 212
Aspect: Indirect Economic Impacts
G4-EC7 Development and impact of infrastructure investments and services supported 41 – 66
G4-EC8 Significant indirect economic impacts, including the extent of impacts 41 – 66
Category: Environmental
Aspect: Energy
G4-EN3 Energy consumption within the organization 88
G4-EN6 Reductions in energy consumption 88
Aspect: Water
G4-EN10 Percentage and total volume of water recycled and reused 90
Aspect: Biodiversity
G4-EN11 Operational sites owned, leased, managed in or adjacent to protected areas and areas of high biodiversity 91
Aspect: Emissions
G4-EN19 Reduction of GHG emissions 88 and 89
Aspect: Overall
G4-EN31 Environmental protection expenditures and investments by type 91
Aspect: Supplier Environmental Assessment
G4-EN32 New suppliers that were screened using environmental criteria 78
Category: Social
Sub-category: Labor Practices and Decent Work
Aspect: Employment
G4-LA2 Benefits provided to full-time employees 75
G4-LA3 Return to work and retention rates after parental leave 75
Aspect: Occupational Health and Safety
G4-LA6 Type of injury, rates of injury, occupational diseases, lost days, absenteeism and total number of work-related fatalities 76
GRI CONTENT INDEX
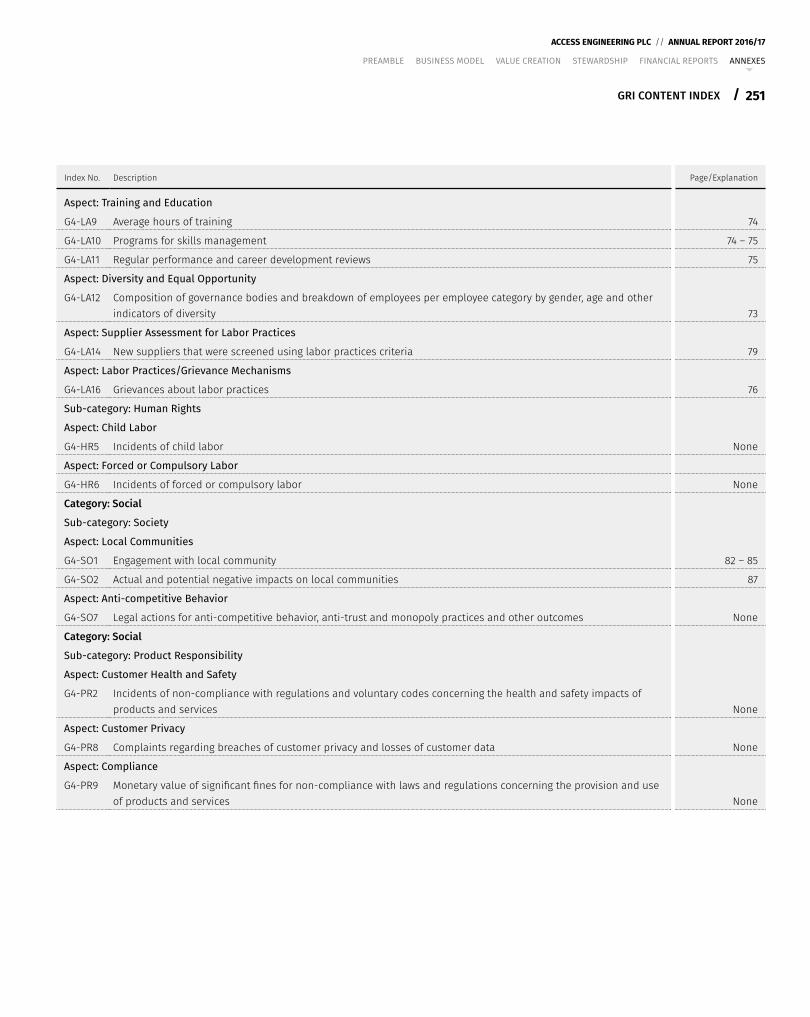
251
ACCESS ENGINEERING PLC // ANNUAL REPORT 2016/17
/
PREAMBLE BUSINESS MODEL VALUE CREATION STEWARDSHIP FINANCIAL REPORTS ANNEXES
Index No. Description Page/Explanation
Aspect: Training and Education
G4-LA9 Average hours of training 74
G4-LA10 Programs for skills management 74 – 75
G4-LA11 Regular performance and career development reviews 75
Aspect: Diversity and Equal Opportunity
G4-LA12 Composition of governance bodies and breakdown of employees per employee category by gender, age and other indicators of diversity 73
Aspect: Supplier Assessment for Labor Practices
G4-LA14 New suppliers that were screened using labor practices criteria 79
Aspect: Labor Practices/Grievance Mechanisms
G4-LA16 Grievances about labor practices 76
Sub-category: Human Rights
Aspect: Child Labor
G4-HR5 Incidents of child labor None
Aspect: Forced or Compulsory Labor
G4-HR6 Incidents of forced or compulsory labor None
Category: Social
Sub-category: Society
Aspect: Local Communities
G4-SO1 Engagement with local community 82 – 85
G4-SO2 Actual and potential negative impacts on local communities 87
Aspect: Anti-competitive Behavior
G4-SO7 Legal actions for anti-competitive behavior, anti-trust and monopoly practices and other outcomes None
Category: Social
Sub-category: Product Responsibility
Aspect: Customer Health and Safety
G4-PR2 Incidents of non-compliance with regulations and voluntary codes concerning the health and safety impacts of products and services None
Aspect: Customer Privacy
G4-PR8 Complaints regarding breaches of customer privacy and losses of customer data None
Aspect: Compliance
G4-PR9 Monetary value of significant fines for non-compliance with laws and regulations concerning the provision and use of products and services None
GRI CONTENT INDEX
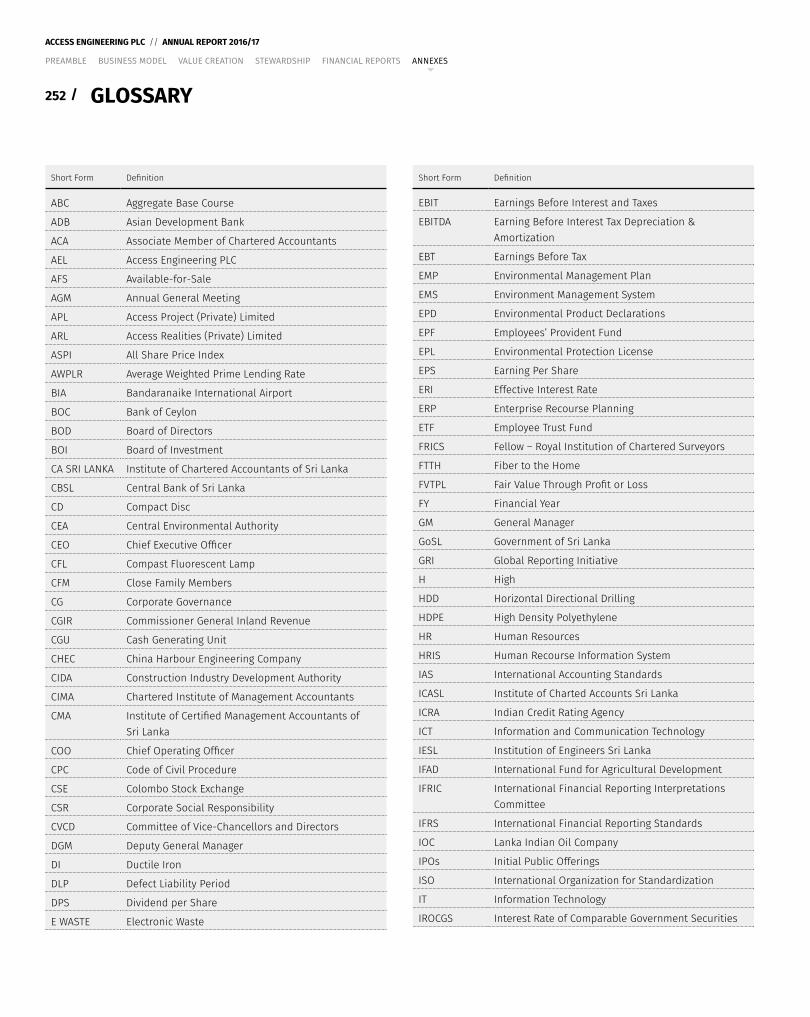
252 /
ACCESS ENGINEERING PLC // ANNUAL REPORT 2016/17
PREAMBLE BUSINESS MODEL VALUE CREATION STEWARDSHIP FINANCIAL REPORTS ANNEXES
GLOSSARY
Short Form Definition
ABC Aggregate Base Course
ADB Asian Development Bank
ACA Associate Member of Chartered Accountants
AEL Access Engineering PLC
AFS Available-for-Sale
AGM Annual General Meeting
APL Access Project (Private) Limited
ARL Access Realities (Private) Limited
ASPI All Share Price Index
AWPLR Average Weighted Prime Lending Rate
BIA Bandaranaike International Airport
BOC Bank of Ceylon
BOD Board of Directors
BOI Board of Investment
CA SRI LANKA Institute of Chartered Accountants of Sri Lanka
CBSL Central Bank of Sri Lanka
CD Compact Disc
CEA Central Environmental Authority
CEO Chief Executive Officer
CFL Compast Fluorescent Lamp
CFM Close Family Members
CG Corporate Governance
CGIR Commissioner General Inland Revenue
CGU Cash Generating Unit
CHEC China Harbour Engineering Company
CIDA Construction Industry Development Authority
CIMA Chartered Institute of Management Accountants
CMA Institute of Certified Management Accountants of Sri Lanka
COO Chief Operating Officer
CPC Code of Civil Procedure
CSE Colombo Stock Exchange
CSR Corporate Social Responsibility
CVCD Committee of Vice-Chancellors and Directors
DGM Deputy General Manager
DI Ductile Iron
DLP Defect Liability Period
DPS Dividend per Share
E WASTE Electronic Waste
Short Form Definition
EBIT Earnings Before Interest and Taxes
EBITDA Earning Before Interest Tax Depreciation & Amortization
EBT Earnings Before Tax
EMP Environmental Management Plan
EMS Environment Management System
EPD Environmental Product Declarations
EPF Employees’ Provident Fund
EPL Environmental Protection License
EPS Earning Per Share
ERI Effective Interest Rate
ERP Enterprise Recourse Planning
ETF Employee Trust Fund
FRICS Fellow – Royal Institution of Chartered Surveyors
FTTH Fiber to the Home
FVTPL Fair Value Through Profit or Loss
FY Financial Year
GM General Manager
GoSL Government of Sri Lanka
GRI Global Reporting Initiative
H High
HDD Horizontal Directional Drilling
HDPE High Density Polyethylene
HR Human Resources
HRIS Human Recourse Information System
IAS International Accounting Standards
ICASL Institute of Charted Accounts Sri Lanka
ICRA Indian Credit Rating Agency
ICT Information and Communication Technology
IESL Institution of Engineers Sri Lanka
IFAD International Fund for Agricultural Development
IFRIC International Financial Reporting Interpretations Committee
IFRS International Financial Reporting Standards
IOC Lanka Indian Oil Company
IPOs Initial Public Offerings
ISO International Organization for Standardization
IT Information Technology
IROCGS Interest Rate of Comparable Government Securities
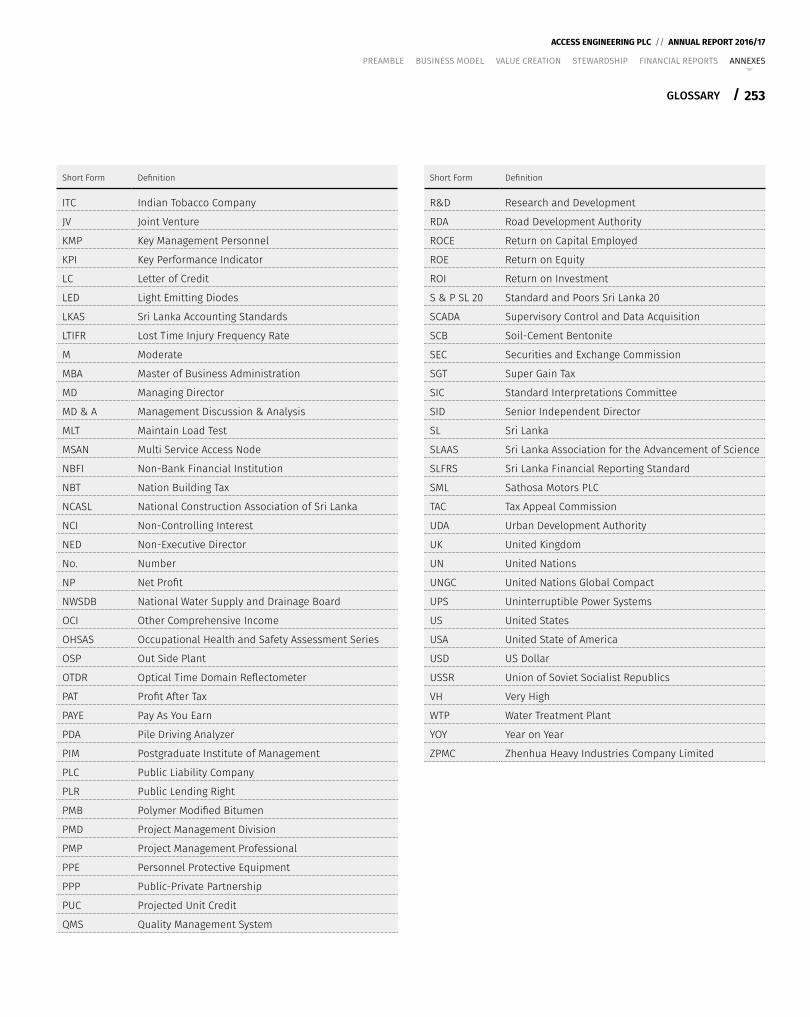
253
ACCESS ENGINEERING PLC // ANNUAL REPORT 2016/17
/
PREAMBLE BUSINESS MODEL VALUE CREATION STEWARDSHIP FINANCIAL REPORTS ANNEXES
Short Form Definition
ITC Indian Tobacco Company
JV Joint Venture
KMP Key Management Personnel
KPI Key Performance Indicator
LC Letter of Credit
LED Light Emitting Diodes
LKAS Sri Lanka Accounting Standards
LTIFR Lost Time Injury Frequency Rate
M Moderate
MBA Master of Business Administration
MD Managing Director
MD & A Management Discussion & Analysis
MLT Maintain Load Test
MSAN Multi Service Access Node
NBFI Non-Bank Financial Institution
NBT Nation Building Tax
NCASL National Construction Association of Sri Lanka
NCI Non-Controlling Interest
NED Non-Executive Director
No. Number
NP Net Profit
NWSDB National Water Supply and Drainage Board
OCI Other Comprehensive Income
OHSAS Occupational Health and Safety Assessment Series
OSP Out Side Plant
OTDR Optical Time Domain Reflectometer
PAT Profit After Tax
PAYE Pay As You Earn
PDA Pile Driving Analyzer
PIM Postgraduate Institute of Management
PLC Public Liability Company
PLR Public Lending Right
PMB Polymer Modified Bitumen
PMD Project Management Division
PMP Project Management Professional
PPE Personnel Protective Equipment
PPP Public-Private Partnership
PUC Projected Unit Credit
QMS Quality Management System
Short Form Definition
R&D Research and Development
RDA Road Development Authority
ROCE Return on Capital Employed
ROE Return on Equity
ROI Return on Investment
S & P SL 20 Standard and Poors Sri Lanka 20
SCADA Supervisory Control and Data Acquisition
SCB Soil-Cement Bentonite
SEC Securities and Exchange Commission
SGT Super Gain Tax
SIC Standard Interpretations Committee
SID Senior Independent Director
SL Sri Lanka
SLAAS Sri Lanka Association for the Advancement of Science
SLFRS Sri Lanka Financial Reporting Standard
SML Sathosa Motors PLC
TAC Tax Appeal Commission
UDA Urban Development Authority
UK United Kingdom
UN United Nations
UNGC United Nations Global Compact
UPS Uninterruptible Power Systems
US United States
USA United State of America
USD US Dollar
USSR Union of Soviet Socialist Republics
VH Very High
WTP Water Treatment Plant
YOY Year on Year
ZPMC Zhenhua Heavy Industries Company Limited
GLOSSARY
254 /
ACCESS ENGINEERING PLC // ANNUAL REPORT 2016/17
PREAMBLE BUSINESS MODEL VALUE CREATION STEWARDSHIP FINANCIAL REPORTS ANNEXES
NOTICE OF MEETING
NOTICE IS HEREBY GIVEN that the Sixth Annual General Meeting of Access Engineering PLC will be held at the National Chamber of Commerce of Sri Lanka, No. 450, D R Wijewardena Mawatha, Colombo 10, on Wednesday, 30th August 2017 at 3.00 p.m. and the business to be brought before the Meeting will be:
1. To receive and consider the Annual Report of the Board of Directors on the affairs of the Company and the Financial Statements for the year ended 31st March 2017 and the Report of the Auditors’ thereon.
2. To re-elect as a Director Mr. N D Gunaratne who retires by rotation in terms of Article 88 (i) of the Articles of Association of the Company.
3. To authorize the Directors to determine donations for the ensuing year.
4. To reappoint Messrs KPMG, Chartered Accountants as Auditors of the Company and to authorize the Directors to determine their remuneration.
By Order of the Board,Access Engineering PLC
P W CORPORATE SECRETARIAL (PRIVATE) LIMITEDDirector/Secretaries
30th June 2017Colombo
Notes:
1. A member entitled to attend and vote at the Meeting is entitled to appoint a Proxy to attend and vote instead of him/her.
2. A Proxy need not be a member of the Company.
3. A Form of Proxy is enclosed for this purpose.
4. The completed Form of Proxy should be deposited at the Registered Office of the Company, No. 278, Union Place, Colombo 2, not less than thirty-six (36) hours before the time fixed for the commencement of the Meeting.
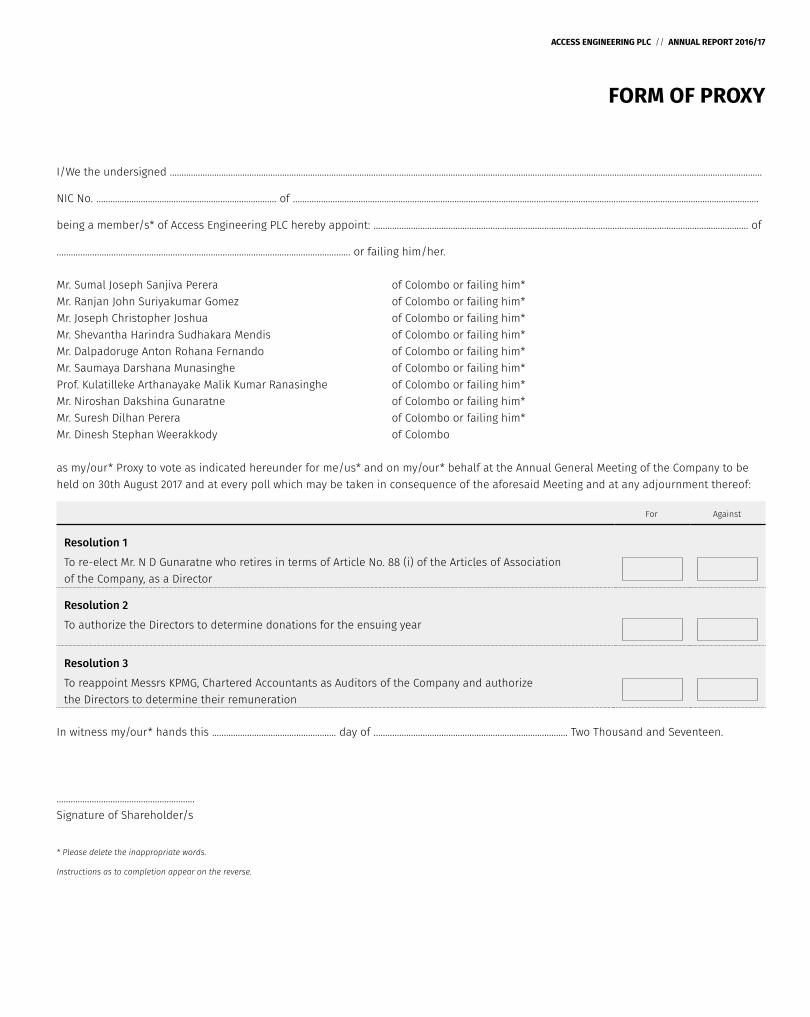
ACCESS ENGINEERING PLC // ANNUAL REPORT 2016/17
FORM OF PROXY
I/We the undersigned ...................................................................................................................................................................................................................................................……....
NIC No. ….......................................................................... of ...................................................................................................................................................................................................….
being a member/s* of Access Engineering PLC hereby appoint: .............................................................................................…………….................................................... of
……………………………………………………………………………………….…………………… or failing him/her.
Mr. Sumal Joseph Sanjiva Perera of Colombo or failing him*Mr. Ranjan John Suriyakumar Gomez of Colombo or failing him*Mr. Joseph Christopher Joshua of Colombo or failing him*Mr. Shevantha Harindra Sudhakara Mendis of Colombo or failing him*Mr. Dalpadoruge Anton Rohana Fernando of Colombo or failing him*Mr. Saumaya Darshana Munasinghe of Colombo or failing him*Prof. Kulatilleke Arthanayake Malik Kumar Ranasinghe of Colombo or failing him*Mr. Niroshan Dakshina Gunaratne of Colombo or failing him*Mr. Suresh Dilhan Perera of Colombo or failing him*Mr. Dinesh Stephan Weerakkody of Colombo
as my/our* Proxy to vote as indicated hereunder for me/us* and on my/our* behalf at the Annual General Meeting of the Company to be held on 30th August 2017 and at every poll which may be taken in consequence of the aforesaid Meeting and at any adjournment thereof:
For Against
Resolution 1
To re-elect Mr. N D Gunaratne who retires in terms of Article No. 88 (i) of the Articles of Association of the Company, as a Director
Resolution 2
To authorize the Directors to determine donations for the ensuing year
Resolution 3
To reappoint Messrs KPMG, Chartered Accountants as Auditors of the Company and authorize the Directors to determine their remuneration
In witness my/our* hands this ..................................................... day of ................................................................................... Two Thousand and Seventeen.
...........................................................Signature of Shareholder/s
* Please delete the inappropriate words.
Instructions as to completion appear on the reverse.
ACCESS ENGINEERING PLC // ANNUAL REPORT 2016/17
FORM OF PROXY
INSTRUCTIONS AS TO COMPLETION1. This Form of Proxy must be deposited at No. 278, Union Place, Colombo 2, not less than thirty-six (36) hours before the time fixed for
the Meeting.
2. In perfecting the Form of Proxy please ensure that all details are legible.
3. If you wish to appoint a person other than a Director of the Company as your proxy, please insert the relevant details in the space provided.
4. Please indicate with an ‘X’ in the space provided, how your Proxy is to vote on the resolution. If no indication is given, the Proxy in his discretion will vote as he thinks fit.
5. In the case of a Company/Corporation, the Proxy must be under its Common Seal, which should be affixed and attested in the manner prescribed by its Articles of Association.
6. In the case of a Proxy signed by an Attorney, the Power of Attorney must be deposited at The Secretaries’ Office [i.e. P W Corporate Secretarial (Private) Limited, No. 3/17, Kynsey Road, Colombo 08] for registration.
7. In the case of joint holders the Form of Proxy must be signed by the first holder.
Name of CompanyAccess Engineering PLC
Registered OfficeAccess Engineering PLCAccess Towers,278, Union Place, Colombo 02.Sri Lanka.Tel: +94 11 7606606 Fax: +94 11 7606605Web: www.accessengsl.com E-mail: [email protected]
Legal FormA public limited liability company incorporated in Sri Lanka on 31st July 2001 under the Companies Act No. 17 of 1982 and Re-registered under the Companies Act No. 07 of 2007 on 6th February 2008.
Ordinary Voting Shares are listed on the Main Board of the Colombo Stock Exchange.
Rated Senior Unsecured Redeemable Debentures are listed on the Colombo Stock Exchange.
Company Registration NumberPB 200 PQ
Board of DirectorsS J S PereraJ C JoshuaD A R FernandoS H S MendisS D MunasingheR J S GomezProf. K A M K RanasingheN D GunaratneS D Perera D S Weerakkody
Audit Committee N D Gunaratne – ChairmanProf. K A M K RanasingheD S WeerakkodyS D Perera
Remuneration CommitteeD S Weerakkody – ChairmanProf. K A M K Ranasinghe N D GunaratneS D Perera
Related Party Transactions Review CommitteeN D Gunaratne – ChairmanProf. K A M K RanasingheD S WeerakkodyD A R Fernando
Strategic Planning CommitteeS J S Perera – ChairmanJ C JoshuaD A R FernandoProf. K A M K Ranasinghe
Bankers Bank of CeylonNations Trust Bank PLCSampath Bank PLCHatton National Bank PLCCommercial Bank of Ceylon PLCPeopleʼs BankDFCC Bank PLCNational Development Bank PLCUnion Bank of Colombo PLCCargills Bank LimitedCAC International BankInternational Commercial Bank
Secretaries P W Corporate Secretarial (Private) Limited3/17, Kynsey Road,Colombo 08,Sri Lanka.Tel: +94 11 4640360Fax: +94 11 4740588
AuditorsMessrs KPMG Chartered Accountants32 A, Sir Mohamed Macan Markar Mawatha,Colombo 03,Sri Lanka.Tel: +94 11 2426426Fax: +94 11 2445872
CORPORATE INFORMATION

ACCESS ENGINEERING PLCAccess Towers
278, Union Place, Colombo 02Sri Lanka
Phone : +94 11 7606606 Fax : +94 11 7606605 www.accessengsl.com [email protected]