Embed Size (px)
Citation preview

Bulgarians in Spain according to 2011 census
Facing the unemployment: resilience strategies of economic migrants in Spain
Mikolaj StanekCentre of Social Studies, University of CoimbraSpanish National Research Centre CSIC, Madrid
Conference on international migrationSofia, 14th February 2014

My objective is twofold.
(1) Present some data on Bulgarian migration and migrants – taking advantage of recently released Spanish Census 2011 micro-data (last week)
(2) Describe labour-market situation of migrants in Spain in the most recent years (2007-2012) focusing on
resilience strategies to deal with the crisis on individual and household level.he scale and nature of this new Southern European emigration and its socio-economic integration in Northern European destination countries.

Some basic data on Bulgarians in Spain according to the Spanish Census 2011
www.ine.es

Principal countries of origin – Census 2011
Source: National Statistical Office. Census 2011
MOROCCO 716.687 12,7%ROMANIA 690.503 12,2%ECUADOR 412.382 7,3%COLOMBIA 379.399 6,7%UNITED KINGDOM 296.219 5,2%ARGENTINA 281.116 5,0%FRANCE 199.348 3,5%GERMANY 195.248 3,5%BOLIVIA 187.884 3,3%PERU 184.838 3,3%VENEZUELA 143.668 2,5%BULGARIA 122.132 2,2%DOMINICAN REPUBLIC 119.491 2,1%CUBA 110.120 1,9%BRASIL 101.641 1,8%OTHER COUNTRIES 1.508.508 26,7%TOTAL 5.649.185 100,0%

Evolution of 4 main origin countries and BL
160,157168,124165,668163,550159,993150,742120,151100,76392,971
70,36453,39130,21012,4133,268
0
100,000
200,000
300,000
400,000
500,000
600,000
700,000
800,000
900,000
2000 2001 2002 2003 2004 2005 2006 2007 2008 2009 2010 2011 2012 2013
Bulgaria United Kingdom Romania Morocco Ecuador
Source: National Statistics Institute. Municipal Register 2000-2013

Considerable differences between Census 2011 and Municipal Register 2011
Bulgarians
Census 2011= 122.132
Register 2011= 165.668

Distribution by age
8.3 11.05.3
10.2 11.0 9.7
16.816.4
5.1
15.420.7
13.7
22.9
31.3
5.7
24.724.2
23.3
27.2
26.8
13.3
24.0
25.6
24.8
17.1
10.5
14.9
14.4
13.7
14.9
7.9 3.9
55.7
11.34.9
13.6
0%
10%
20%
30%
40%
50%
60%
70%
80%
90%
100%
BULGARIA ROMANIA UK MOROCCO ECUADOR TOTAL FOREIGN
0-14 15-24 25-34 35-44 45-54 >54
Source: National Statistical Office. Census 2011
Avrage age: 35 (14,281) Avrage age: 31 (12,916) Avrage age: 53 (18,953) Avrage age: 35 (16,156) Avrage age: 31 (13,551) Avrage age: 35 (16,346)

Avarage=27 (13,838)
Age at migration: Morocco and Bulgaria
Avarage=22 (13,173)

Avarage=41 (20,693)) Avarage=23 (12,977)
Age at migration: UK and Ecuador

Age at migration: Romania
Avarage=25 (12,455))

Age at migration: total foreign born
Avarage=25 (15,633)
Source: National Statistical Office. Census 2011
Avarage=29 (18,275)

Distribution by educational level
Source: National Statistical Office. Census 2011
BULGARIA ROMANIA UK MOROCCO ECUADOR TOTAL FOREIGN0%
10%
20%
30%
40%
50%
60%
70%
80%
90%
100%
11.7% 14.4% 12.9%
52.3%
22.1% 20.9%
24.2%
31.8% 32.1%
23.7%
32.6%
25.7%
41.8%
40.9%
26.5%
14.8%
35.4%
29.8%
22.4%
12.8%
28.6%
9.2% 10.0%
23.6%
No studies finished Primary education Secondary education Tertiary education

Activity rates
Source: National Statistical Office. Census 2011

Unemployment rates
Source: National Statistical Office. Census 2011
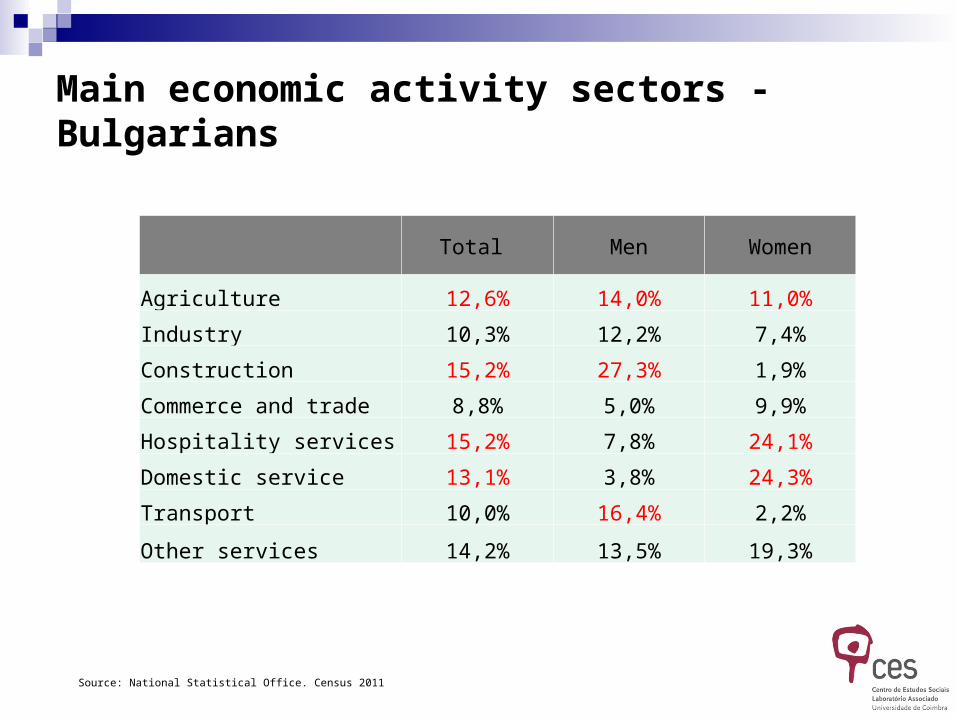
Main economic activity sectors - Bulgarians
Source: National Statistical Office. Census 2011
Total Men Women
Agriculture 12,6% 14,0% 11,0%
Industry 10,3% 12,2% 7,4%
Construction 15,2% 27,3% 1,9%
Commerce and trade 8,8% 5,0% 9,9%
Hospitality services 15,2% 7,8% 24,1%
Domestic service 13,1% 3,8% 24,3%
Transport 10,0% 16,4% 2,2%
Other services 14,2% 13,5% 19,3%

Resilience strategies in the context of economic crisis in Spain

Real GDP growth rate total 2008-2013 - Spain

Evolution of unemployment rate by origin 2006-2012
25,6%
30,4%
36,8%
17,4%
8,6% 7,8%8,7%
15,1%
17,9%19,2%
20,5%
31,2%
24,3%
13,5%11,4%
8,3%
15,2%13,1%
12,9%
30,1%33,2%
32,6%
21,4%22,9% 24,4%
8,5%9,1%
9,7%
0,0%
5,0%
10,0%
15,0%
20,0%
25,0%
30,0%
35,0%
40,0%
2006 2007 2008 2009 2010 2011 2012
Spanish cit. born in Spain
EU born abroad
non-EU born abroad
Total population
Source: National Statistical Office. Labour Force Survey 2006-2012

Unemployment by sex 2006-2012
38,7%
21,1%
6,3%10,5%
19,8%
11,8%
15,7%
34,6%
0%
5%
10%
15%
20%
25%
30%
35%
40%
45%
2006 2007 2008 2009 2010 2011 2012
Men SP born Spain Men non-EU Women SP born Spain Women non-EU
Source: National Statistical Office. Labour Force Survey 2006-2012

817 095
934 318
702 178
476 084441 194 427 998
121 025
198 738233 500
289 612334 850 319 972 380 000
416 000
0
100 000
200 000
300 000
400 000
500 000
600 000
700 000
800 000
900 000
1 000 000
2006 2007 2008 2009 2010 2011 2012
immigrantion
emmigration
Outflows and inflows of the foreign-born population in Spain 2000-2012
Source: National Statistics Institute. Residential Variation Statistics 2000-2011

Explorative analysis (still preliminary stage)
Research questions: Are there significant changes in behaviour
regarding the access to the labour market during the economic crisis?
Are there any differences between natives and non-EU migrants?

Added worker effectRelative increment in the women’s labour force participation by their partners labour force status (2007 and 2012 compared)
0% 5% 10% 15% 20% 25%
non-EU migrants
Spain
Out of the labour force Unemployed Employed
Source: National Statistical Office. Labour Force Survey 2007 & 2012

Procentage of self-employed in total occupied population
Source: National Statistical Office. Labour Force Survey 2006-20121
16,8%
8,9%
17,4%
5,3%
0,0%
2,0%
4,0%
6,0%
8,0%
10,0%
12,0%
14,0%
16,0%
18,0%
20,0%
2006 2007 2008 2009 2010 2011 2012

Participation in education
Source: National Statistical Office. Labour Force Survey 2006-20121
11,01%10,21%
12,16%12,83%
13,49% 13,63%14,01%
6,00% 5,94% 6,11%6,50%6,23%
5,70%5,89%
0%
1%
2%
3%
4%
5%
6%
7%
8%
9%
10%
11%
12%
13%
14%
15%
2006 2007 2008 2009 2010 2011 2012
Spanish non-EU
16,12%15,26%
16,07%16,92% 16,99% 16,88% 17,01%
8,64% 8,52%9,01%
9,72%
7,90%7,66%6,74%
0%1%2%3%4%5%6%7%8%9%
10%11%12%13%14%15%16%17%18%19%20%
2006 2007 2008 2009 2010 2011 2012
Spanish cit. born in Spain non-EU born abroad
Occupied
Unemployed

Some conclusions
• Longitudinal analysis of data shows that broadly understood Spanish society has undertaken several strategies in order to cope with the economic hardships.
• However there are clear differences between migrants and natives. In several aspects migrants are more active in searching solution or alternatives for unemployment compared to Spaniards.
• On the other hand, at least in case of human capital investment and added worker effect migrants seem to undertake more reactive
strategies while Spaniard are more proactive. This may be related to the differences in availablity of economic and social resources.

THANK YOU