Embed Size (px)
Citation preview
DOE/MC/30171 -- 5267 (DE960 1 1343)
Bulk Solids Feed System - Task 1.3.2
Topical Report October 1993 - January 1996
July 1996
Work Performed Under Contract No.: DE-AC21-93MC30171
U.S. Department of Energy Office of Environmental Management Office of Technology Development Washington, DC
BY Molten Metal Technology, Inc. 400-2 Totten Pond Road Waltham, Massachussetts, 02 154
For U.S. Department of Energy Office of Fossil Energy Morgantown Energy Technology Center Morgantown, West Virginia
DISCLAIMER
Portions of this document may be illegible in electronic image products. Images are produced from the best available original document.
Disclaimer
This report was prepared as an account of work sponsored by an agency of the United States Government. Neither the United States Government nor any agency thereof, nor any of their employees, makes any warranty, express or implied, or assumes any legal liability or responsibility for the accuracy, completeness, or use- fulness of any information, apparatus, product, or process disclosed, or represents that its use would not infringe privately owned rights. Reference herein to any specific commercial product, process, or service by trade name, trademark, manufacturer, or otherwise does not necessarily constitute or imply its endorsement, recommendation, or favoring by the United States Government or any agency thereof. The views and opinions of authors expressed herein do not necessarily state or reflect those of the United States Government or any agency thereof.
DOE/MC/30171 -- 5267 (DE9601 1343)
Bulk Solids Feed System - Task 1.3.2
Topical Report October 1993 - January 1996
Work Performed Under Contract No.: DE-AC21-93MC30171
U.S. Dep rtme For
t of Energy U.S. Department of Energy Office of Fossil Energy Morgantown Energy Technology Center P.O. Box 880 Morgantown, West Virginia 26507-0880
Office oAf Environmental Management Office of Technology Development 1000 Independence Avenue Washington, DC 20585
BY Molten Metal Technology, Inc.
400-2 Totten Pond Road Waltham, Massachussetts 02 1 54
July 1996
I I I I I I I I I I 8 1 I I I I I 1 I
TABLE OF CONTENTS 1 . INTRODUCTION ..................................................................................................................................... 1
2 . BULK SOLIDS FEEDING SYSTEM DESIGN AND EVALUATION .................................................. 2
2.1. DISSOLUTIONNOLATILIZATION ZONE CHARACTERIZATION STUDIES FOR THE TREATMENT OF BULK SOLIDS ........................................................................................................................................................... 2
2.1.1. Theoretical Background .................................................................................................................. 2 2.1.2. Experimental Test Program ............................................................................................................ 3 2.1.3. Zone 1 Reactor Design Strategy And Application To DOE Surrogate Waste ............................... 4
2.2. SLURRY SYSTEM DESIGN ....................................................................................................................... 5 2.2.1. Background ..................................................................................................................................... 5 2.2.2. Experimental Plan ........................................................................................................................... 6 2.2.3. Slurry Skid Tests ............................................................................................................................. 8 2.2.4. Sampling ....................................................................................................................................... 10 2.2.5. Slurry Feed Preparation Grinder Skid Program ............................................................................ 10
2.3. BOTTOM TAPPING PILOT STUDIES ........................................................................................................ 12 2.3.1. Background And Objectives ......................................................................................................... 12 2.3.2. Apparatus ...................................................................................................................................... 13 2.3.3. Tapping Procedure ........................................................................................................................ 14 2.3.4. Discussion ..................................................................................................................................... 15
2.4. ENERGY ADDITION SYSTEMS ............................................................................................................... 16 2.4.1. Objectives ..................................................................................................................................... 16 2.4.2. Experimental ................................................................................................................................. 16
2.5. BULK SOLIDS FEED SYSTEM CONCLUSIONS ........................................................................................ 24
FIGURES
Figure 1 Operability Limits for a Mass Transfer Controlled Process .......................................................... 4 Figure 2 Slurry System Development Module Piping & Instrument Diagram .......................................... 12 Figure 3 Sketch showing the bottom tapping valve on the pilot-scale reactor ........................................... 14 Figure 4 Plasma Torch Test Unit ................................................................................................................ 17 Figure 5 Generic Torch Operating Map ...................................................................................................... 18 Figure 6 Plasma Arc Torch ......................................................................................................................... 19 Figure 7 Double Arcing ............................................................................................................................... 21 Figure 8 Generic Torch Operating Map ...................................................................................................... 22
TABLES
Table 1 Typical DOE Surrogate Waste Components ................................................................................... 5 Table 2 Expected Information from the Bench-Scale Slurry Tests .............................................................. 6 Table 3 Feed Slate ........................................................................................................................................ 7 Table 4 List of Assumptions and the Rationale ............................................................................................ 7 Table 5 Grinder Pump Experiments ............................................................................................................ 11
This report is submitted under Government Contract Number DE-AC21-93MC30171 and is releasable in accordance with the terms and conditions of that contract .
11
1. Introduction
1 I I I I I I I 1 I I I I I I I 1 I
This Bulk Solids Feed System Topical Report is submitted in accordance with Task 1.3.2 of the statement of work. It summarizes work pertaining to bulk solids processing performed under Task 1.3 of the statement of work.
This report is submitted under Government Contract Number DE-AC21-93MC3017l and is releasable in accordance with the terms and conditions of that contract. I 1
I I I I I I I I 1 I I 1 1 I I I I I I
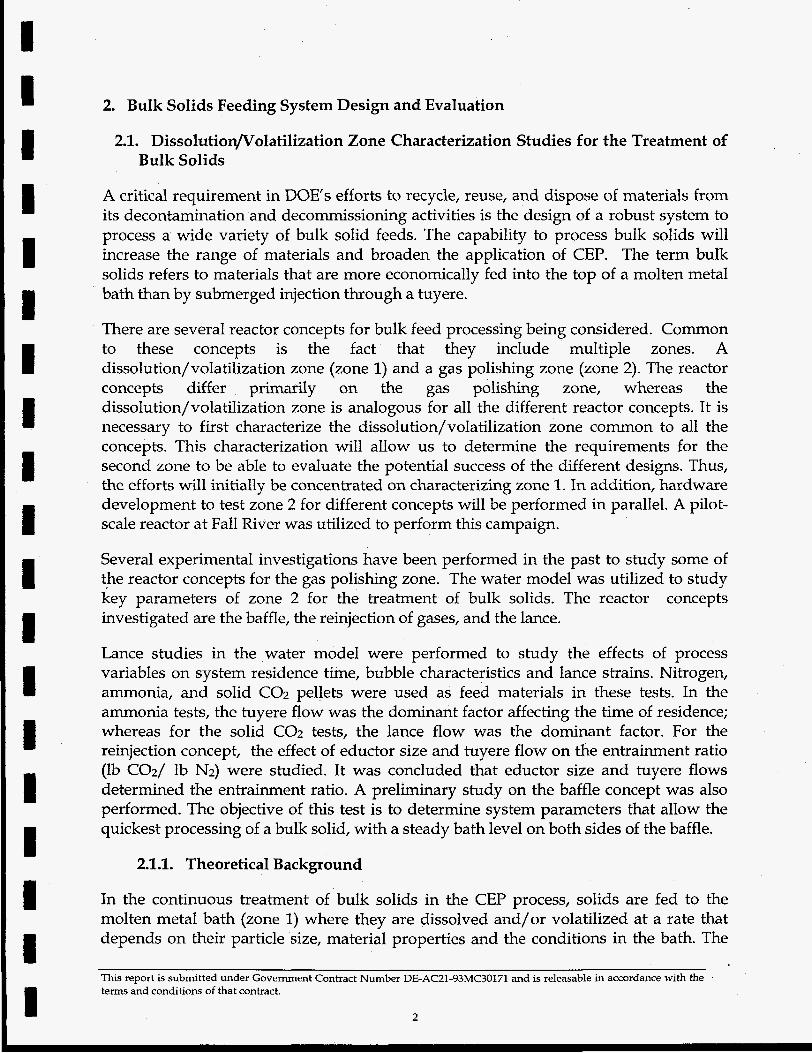
2. Bulk Solids Feeding System Design and Evaluation
2.1. Dissolutioflolatilization Zone Characterization Studies for the Treatment of Bulk Solids
A critical requirement in DOES efforts to recycle, reuse, and dispose of materials from its decontamination and decommissioning activities is the design of a robust system to process a wide variety of bulk solid feeds. The capability to process bulk solids will increase the range of materials and broaden the application of CEP. The term bulk solids refers to materials that are more economically fed into the top of a molten metal bath than by submerged injection through a tuyere.
There are several reactor concepts for bulk feed processing being considered. Common to these concepts is the fact that they include multiple zones. A dissolution/volatilization zone (zone 1) and a gas polishing zone (zone 2). The reactor concepts differ primarily on the gas polishing zone, whereas the dissolution/volatilization zone is analogous for all the different reactor concepts. It is necessary to first characterize the dissolution/volatilization zone common to all the concepts. This characterization will allow us to determine the requirements for the second zone to be able to evaluate the potential success of the different designs. Thus, the efforts will initially be concentrated on characterizing zone 1. In addition, hardware development to test zone 2 for different concepts will be performed in parallel. A pilot- scale reactor at Fall River was utilized to perform this campaign.
Several experimental investigations have been performed in the past to study some of the reactor concepts for the gas polishing zone. The water model was utilized to study key parameters of zone 2 for the treatment of bulk solids. The reactor concepts investigated are the baffle, the reinjection of gases, and the lance.
Lance studies in the water model were performed to study the effects of process variables on system residence time, bubble characteristics and lance strains. Nitrogen, ammonia, and solid C O 2 pellets were used as feed materials in these tests. In the ammonia tests, the tuyere flow was the dominant factor affecting the time of residence; whereas for the solid C02 tests, the lance flow was the dominant factor. For the reinjection concept, the effect of eductor size and tuyere flow on the entrainment ratio (lb C 0 2 / lb N2) were studied. It was concluded that eductor size and tuyere flows determined the entrainment ratio. A preliminary study on the baffle concept was also performed. The objective of this test is to determine system parameters that allow the quickest processing of a bulk solid, with a steady bath level on both sides of the baffle.
2.1.1. Theoretical Background
In the continuous treatment of bulk solids in the CEP process, solids are fed to the molten metal bath (zone 1) where they are dissolved and/or volatilized at a rate that depends on their particle size, material properties and the conditions in the bath. The
This report is submitted under Government Contract Number DE-AC21-93MC30171 and is releasable in accordance with the tern= and conditions of that contract.
L
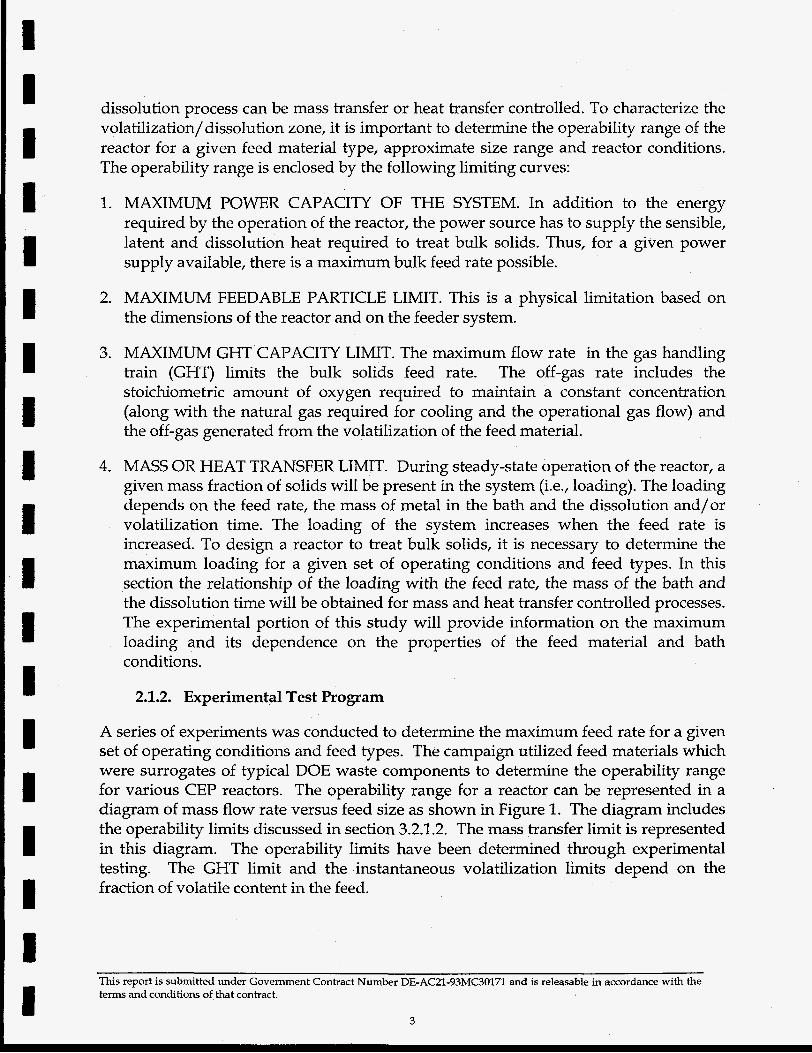
dissolution process can be mass transfer or heat transfer controlled. To characterize the volatilization/ dissolution zone, it is important to determine the operability range of the reactor for a given feed material type, approximate size range and reactor conditions. The operability range is enclosed by the following limiting curves:
1.
2.
3.
4.
MAXIMUM POWER CAPACITY OF THE SYSTEM. In addition to the energy required by the operation of the reactor, the power source has to supply the sensible, latent and dissolution heat required to treat bulk solids. Thus, for a given power supply available, there is a maximum bulk feed rate possible.
MAXIMUM FEEDABLE PARTICLE LIMIT. This is a physical limitation based on the dimensions of the reactor and on the feeder system.
MAXIMUM GHT CAPACITY LIMIT. The maximum flow rate in the gas handling train (GHT) limits the bulk solids feed rate. The off-gas rate includes the stoichiometric amount of oxygen required to maintain a constant concentration (along with the natural gas required for cooling and the operational gas flow) and the off-gas generated from the volatilization of the feed material.
MASS OR HEAT TRANSFER LIMIT. During steady-state operation of the reactor, a given mass fraction of solids will be present in the system (i.e., loading). The loading depends on the feed rate, the mass of metal in the bath and the dissolution and/or volatilization time. The loading of the system increases when the feed rate is increased. To design a reactor to treat bulk solids, it is necessary to determine the maximum loading for a given set of operating conditions and feed types. In this section the relationship of the loading with the feed rate, the mass of the bath and the dissolution time will be obtained for mass and heat transfer controlled processes. The experimental portion of this study will provide information on the maximum loading and its dependence on the properties of the feed material and bath conditions.
2.1.2. Experimental Test Program
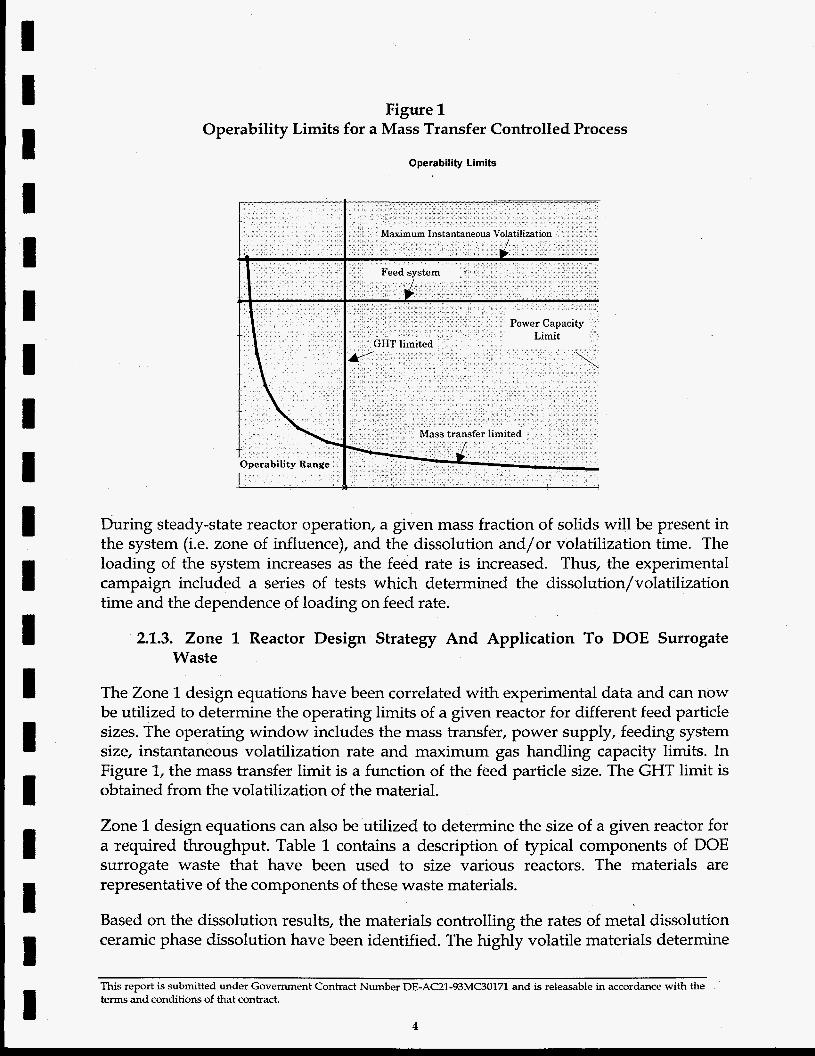
A series of experiments was conducted to determine the maximum feed rate for a given set of operating conditions and feed types. The campaign utilized feed materials which were surrogates of typical DOE waste components to determine the operability range for various CEP reactors. The operability range for a reactor can be represented in a diagram of mass flow rate versus feed size as shown in Figure 1. The diagram includes the operability limits discussed in section 3.2.1.2. The mass transfer limit is represented in this diagram. The operability limits have been determined through experimental testing. The GHT limit and the instantaneous volatilization limits depend on the fraction of volatile content in the feed.
This report is submitted under Government Contract Number DE-AC21-93MC30171 and is releasable in accordance with the terms and conditions of.that contract.
3
I 1 I 1 I I 1 I I I I I I I I I I 1 I
Figure 1 Operability Limits for a Mass Transfer Controlled Process
Operability Limits
Mass transfer limited
During steady-state reactor operation, a given mass fraction of solids will be present in the system (i.e. zone of influence), and the dissolution and/or volatilization time. The loading of the system increases as the feed rate is increased. Thus, the experimental campaign included a series of tests which determined the dissolution/volatilization time and the dependence of loading on feed rate.
2.1.3. Zone 1 Reactor Design Strategy And Application To DOE Surrogate Waste
The Zone 1 design equations have been correlated with experimental data and can now be utilized to determine the operating limits of a given reactor for different feed particle sizes. The operating window includes the mass transfer, power supply, feeding system size, instantaneous volatilization rate and maximum gas handling capacity limits. In Figure 1, the mass transfer limit is a function of the feed particle size. The GHT limit is obtained from the volatilization of the material.
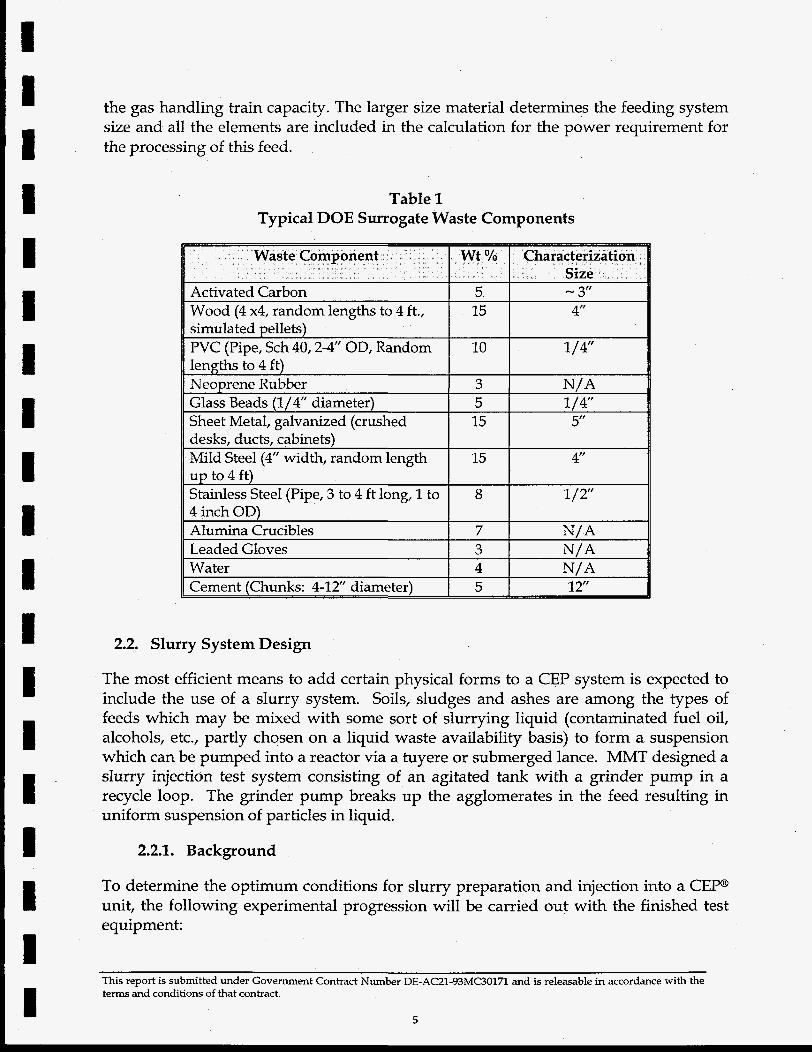
Zone 1 design equations can also be utilized to determine the size of a given reactor for a required throughput. Table 1 contains a description of typical components of DOE surrogate waste that have been used to size various reactors. The materials are representative of the components of these waste materials.
Based on the dissolution results, the materials controlling the rates of metal dissolution ceramic phase dissolution have been identified. The highly volatile materials determine
This report is submitted under Government Contract Number DE-AC21-93MC3017l and is releasable in accordance with the terms and conditions of that contract.
4
i 1 I 1 I 1 I I I 1 I
the gas handling train capacity. The larger size material determines the feeding system size and all the elements are included in the calculation for the power requirement for the processing of this feed.
Table 1 Typical DOE Surrogate Waste Components
2.2. Slurry System Design
The most efficient means to add certain physical forms to a CEP system is expected to include the use of a slurry system. Soils, sludges and ashes are among the types of feeds which may be mixed with some sort of slurrying liquid (contaminated fuel oil, alcohols, etc., partly chosen on a liquid waste availability basis) to form a suspension which can be pumped into a reactor via a tuyere or submerged lance. MMT designed a slurry injection test system consisting of an agitated tank with a grinder pump in a recycle loop. The grinder pump breaks up the agglomerates in the feed resulting in uniform suspension of particles in liquid.
2.2.1. Background
To determine the optimum conditions for slurry preparation and injection into a C E P unit, the following experimental progression will be carried out with the finished test equipment:
This report is submitted under Government Contract Number DE-AC21-93MC3017l and is releasable in accordance with the terms and conditions of that contract.
I I I I. I I I I I I I I I I I I I I 1
Grinding pump tests
Hot metal tests
Bench scale slurry preparation tests
2.2.2. Experimental Plan
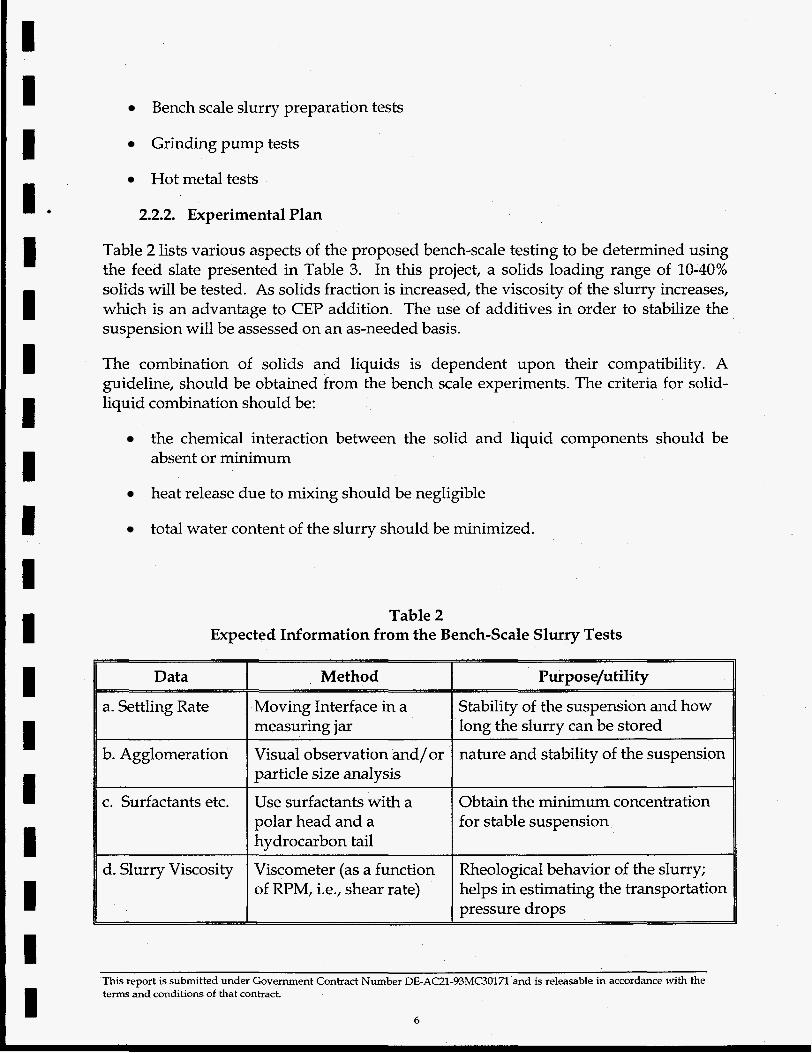
Table 2 lists various aspects of the proposed bench-scale testing to be determined using the feed slate presented in Table 3. In this project, a solids loading range of 10-40% solids will be tested. As solids fraction is increased, the viscosity of the slurry increases, which is an advantage to CEP addition. The use of additives in order to stabilize the suspension will be assessed on an as-needed basis.
The combination of solids and liquids is dependent upon their compatibility. A guideline, should be obtained from the bench scale experiments. The criteria for solid- liquid combination should be:
the chemical interaction between the solid and liquid components should be absent or minimum
heat release due to mixing should be negligible
total water content of the slurry should be minimized.
Table 2 Expected Information from the Bench-Scale Slurry Tests
II Data
a. Settling Rate I b. Agglomeration I
d. Slurry Viscosity I
Method
Moving Interface in a measuring jar
Visual observation and/or particle size analysis
Use surfactants with a polar head and a hydrocarbon tail
Viscometer (as a function of RPM, i.e., shear rate)
Purpose/utility
Stability of the suspension and how long the slurry can be stored
nature and stability of the suspension
~
Obtain the minimum concentration for stable suspension
Rheological behavior of the slurry; helps in estimating the transportation pressure drops
This report is submitted under Government Contract Number DE-AC21-93MC30171 and is releasable in accordance with the terms and conditions of that contract.
6
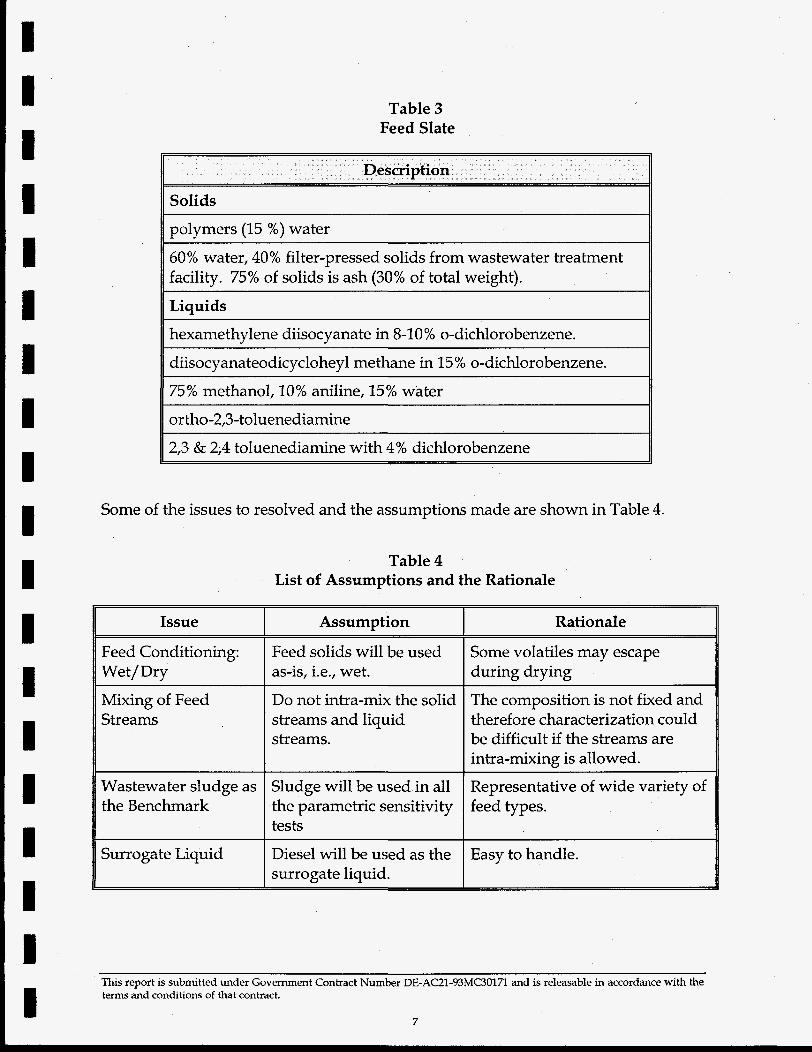
Table 3 Feed Slate
I I I I I I I I I 1 I I I I I I
Solids
polymers (15 %) water
60% water, 40% filter-pressed solids from wastewater treatment facility. 75% of solids is ash (30% of total weight).
Liquids II hexamethylene diisocyanate in 8-10% o-dichlorobenzene. II diisocyanateodicycloheyl methane in 15% o-dichlorobenzene. 11 75% methanol, 10% aniline, 15% water I1
~ ~~ ~~~
ortho-2,3-toluenediamine
2,3 & 2;4 toluenediamine with 4% dichlorobenzene
Some of the issues to resolved and the assumptions made are shown in Table 4.
Table 4 List of Assumptions and the Rationale
Issue
Feed Conditioning: Wet/ Dry
Mixing of Feed Streams
Wastewater sludge as the Benchmark
Surrogate Liquid
Assumption
Feed solids will be used as-is, i.e., wet.
Do not intra-mix the solid streams and liquid streams.
Sludge will be used in all the parametric sensitivity tests
Diesel will be used as the surrogate liquid.
Rationale
Some volatiles may escape during drying
The composition is not fixed and therefore characterization could be difficult if the streams are intra-mixing is allowed.
Representative of wide variety of feed types.
Easy to handle.
This report is submitted under Government Contract Number DE-AC21-93MC30171 and is releasable in accordance with the terms and conditions of that contract.
7
m
I I I , I I I I I I I I 1 I 1 I I I I 1
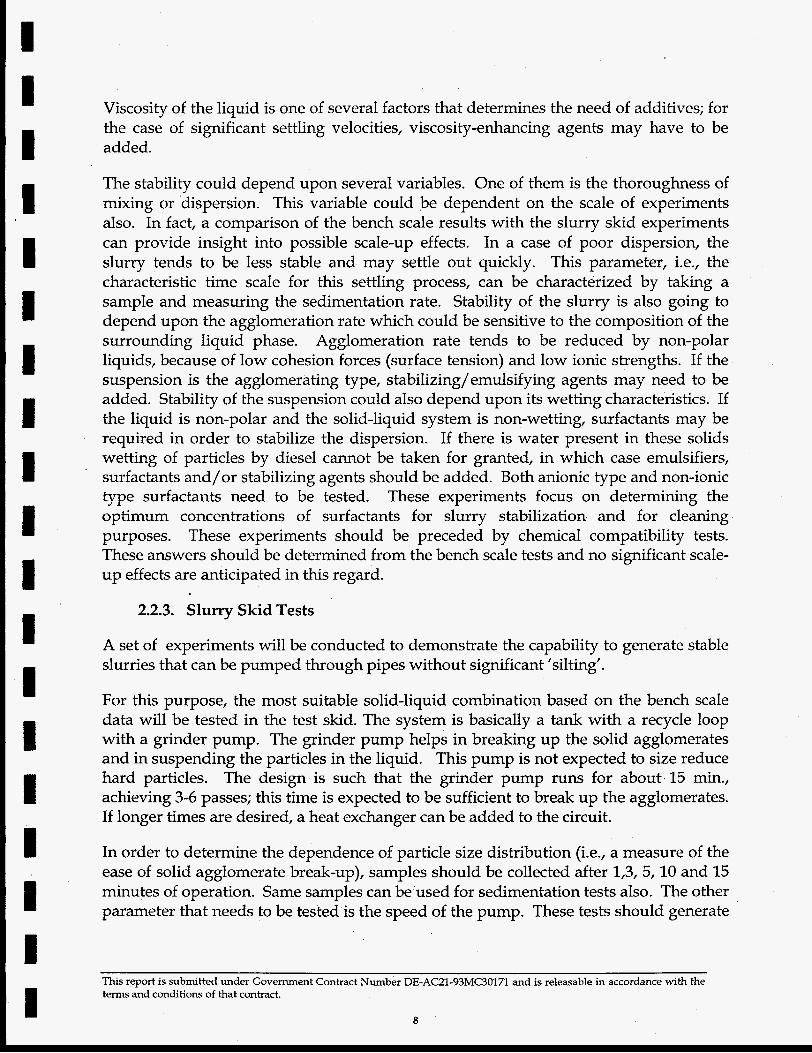
Viscosity of the liquid is one of several factors that determines the need of additives; for the case of significant settling velocities, viscosity-enhancing agents may have to be added.
The stability could depend upon several variables. One of them is the thoroughness of mixing or dispersion. This variable could be dependent on the scale of experiments also. In fact, a comparison of the bench scale results with the slurry skid experiments can provide insight into possible scale-up effects. In a case of poor dispersion, the slurry tends to be less stable and may settle out quickly. This parameter, i.e., the characteristic time scale for this settling process, can be characterized by taking a sample and measuring the sedimentation rate. Stability of the slurry is also going to depend upon the agglomeration rate which could be sensitive to the composition of the surrounding liquid phase. Agglomeration rate tends to be reduced by non-polar liquids, because of low cohesion forces (surface tension) and low ionic strengths. If the suspension is the agglomerating type, stabilizing/ emulsifying agents may need to be added. Stability of the suspension could also depend upon its wetting characteristics. If the liquid is non-polar and the solid-liquid system is non-wetting, surfactants may be required in order to stabilize the dispersion. If there is water present in these solids wetting of particles by diesel cannot be taken for granted, in which case emulsifiers, surfactants and/or stabilizing agents should be added. Both anionic type and non-ionic type surfactants need to be tested. These experiments focus on determining the optimum concentrations of surfactants for slurry stabilization and for cleaning purposes. These experiments should be preceded by chemical compatibility tests. These answers should be determined from the bench scale tests and no significant scale- up effects are anticipated in this regard.
2.2.3. Slurry Skid Tests
A set of experiments will be conducted to demonstrate the capability to generate stable slurries that can be pumped through pipes without significant 'silting'.
For this purpose, the most suitable solid-liquid combination based on the bench scale data will be tested in the test skid. The system is basically a tank with a recycle loop with a grinder pump. The grinder pump helps in breaking up the solid agglomerates and in suspending the particles in the liquid. This pump is not expected to size reduce hard particles. The design is such that the grinder pump runs for about 15 min., achieving 3-6 passes; this time is expected to be sufficient to break up the agglomerates. If longer times are desired, a heat exchanger can be added to the circuit.
In order to determine the dependence of particle size distribution (i.e., a measure of the ease of solid agglomerate break-up), samples should be collected after 1,3, 5,lO and 15 minutes of operation. Same samples can be used for sedimentation tests also. The other parameter that needs to be tested is the speed of the pump. These tests should generate
This report is submitted under Government Contract Number DE-ACU-93MC3017l and is releasable in accordance with the terms and conditions of that contract.
8
I I I I 1 I I I 1 I I I I I I I
a experimental data.
particle loading-grinding time-RPM-particle size-sedimentation rate matrix of
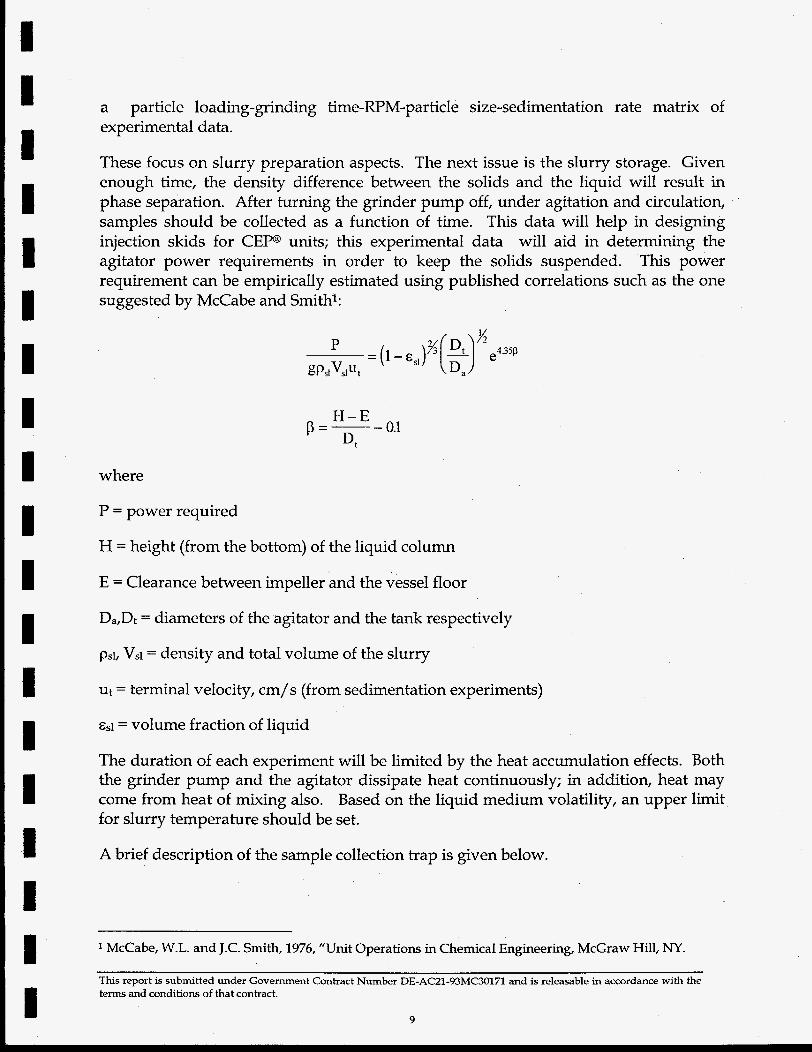
These focus on slurry preparation aspects. The next issue is the slurry storage. Given enough time, the density difference between the solids and the liquid will result in phase separation. After turning the grinder pump off, under agitation and circulation, samples should be collected as a function of time. This data will help in designing injection skids for C E P units; this experimental data will aid in determining the agitator power requirements in order to keep the solids suspended. This power requirement can be empirically estimated using published correlations such as the one suggested by McCabe and Smithx:
H-E p=-- 0.1 Dt
where
P = power required
H = height (from the bottom) of the liquid column
E = Clearance between impeller and the vessel floor
Da,Dt = diameters of the agitator and the tank respectively
psi, VSi = density and total volume of the slurry
ut = terminal velocity, cm/s (from sedimentation experiments)
= volume fraction of liquid
The duration of each experiment will be limited by the heat accumulation effects. Both the grinder pump and the agitator dissipate heat continuously; in addition, heat may come from heat of mixing also. Based on the liquid medium volatility, an upper limit for slurry temperature should be set.
A brief description of the sample collection trap is given below.
* McCabe, W.L. and J.C. Smith, 1976, "Unit Operations in Chemical Engineering, McGraw Hill, NY.
This report is submitted under Government Contract Number DE-AC21-93MC30171 and is releasable in accordance with the terms and conditions of that contract.
0
2.2.4. Sampling
To understand the stability of the suspension and to obtain particle size distribution data, samples of the slurry need to be taken at various stages of the batch preparation process. For this, an on-line, simple trap design has been adopted; the sample collecting trap is basically a 2” pipe section of 50 cm length with two swagelokm fittings at each end. This trap is provided with two leak-tight quick-connects. A part of this sample will be sent for particle size analysis and the remaining will be used in settling tests. The data obtained will be compared with the data obtained from the bench-scale experiments described in the previous section.
The diameter of the trap should be such that particle deposition should be negligible. The two parameters that control this phenomenon are the residence time and the diameter of the trap. These parameters should be adjusted such that the settling length (Vt.tr), based on the particle deposition velocity, should be much smaller than the trap diameter: D/( VtTr) - 100. The settling velocity measured for feed particles is < 2 mm/min. in a medium of 0.05 g/cm-s viscosity. Based on a flow rate of 2 gpm, the diameter is 1.35 cm.
2.2.5. Slurry Feed Preparation Grinder Skid Program
The CEP system is designed to feed a wide range of heterogeneous waste materials. Liquid feeds can be injected via tuyere; solid materials, that can be milled into powders, have been pneumatically conveyed with an inert gas (nitrogen) for simplicity. Both methods have been successfully demonstrated on the commercial-scale CEP in Fall River Recycling-Research and Development Center for the variety of feeds.
Although pneumatic conveyance of solids is effective, MMT’s experience has shown that tuyere-feeding of solids in a liquid slurry provides the most reliable syngas delivery. Previous injection trials at the MEFOS development facility in Sweden proved that MMT tuyeres are well-suited for reliable commercial-scale throughputs of slurries. The objective of this program is to demonstrate the commercial-scale preparation of slurries for tuyere injection into a CPU. The injectibility of the slurries will be verified by hot tuyeres injections into the Tuyere Testing Unit (TTU).
The solids selected for this test include:
sludge (filter-pressed solids from wastewater treatment facility that are 60% water, 30% soil components, and 10% organic matter).
toluene diisocyanate residue (polymer urea with 15 % water)
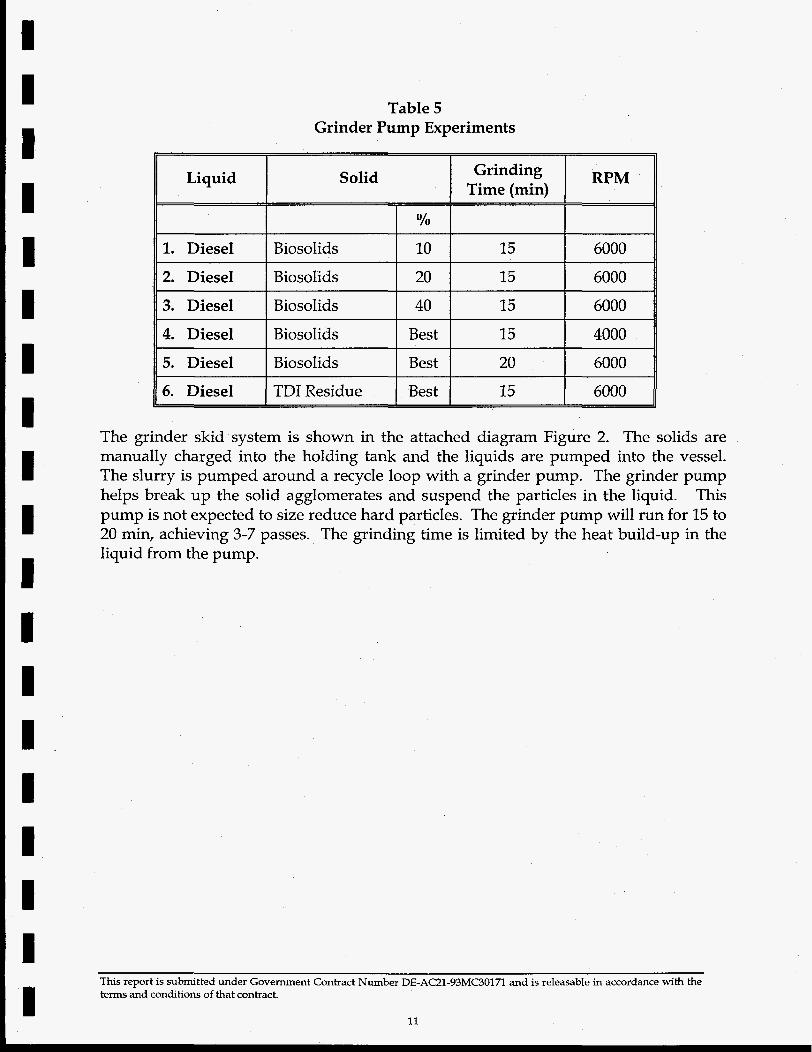
Diesel will be used in these tests as a surrogate for blendable hydrocarbon liquid wastes. Table 5 summarizes the grinder skid experimental plan aimed at optimizing slurry preparation conditions.
This report is submitted under Government Contract Number DE-AC21-93MC3017l and is releasable in accordance with the terms and conditions of that contract.
10
I I I I I I I I
I I I I I I I
Liquid
~~
1. Diesel
2. Diesel
3. Diesel
4. Diesel
5. Diesel
6. Diesel
Table 5 Grinder Pump Experiments
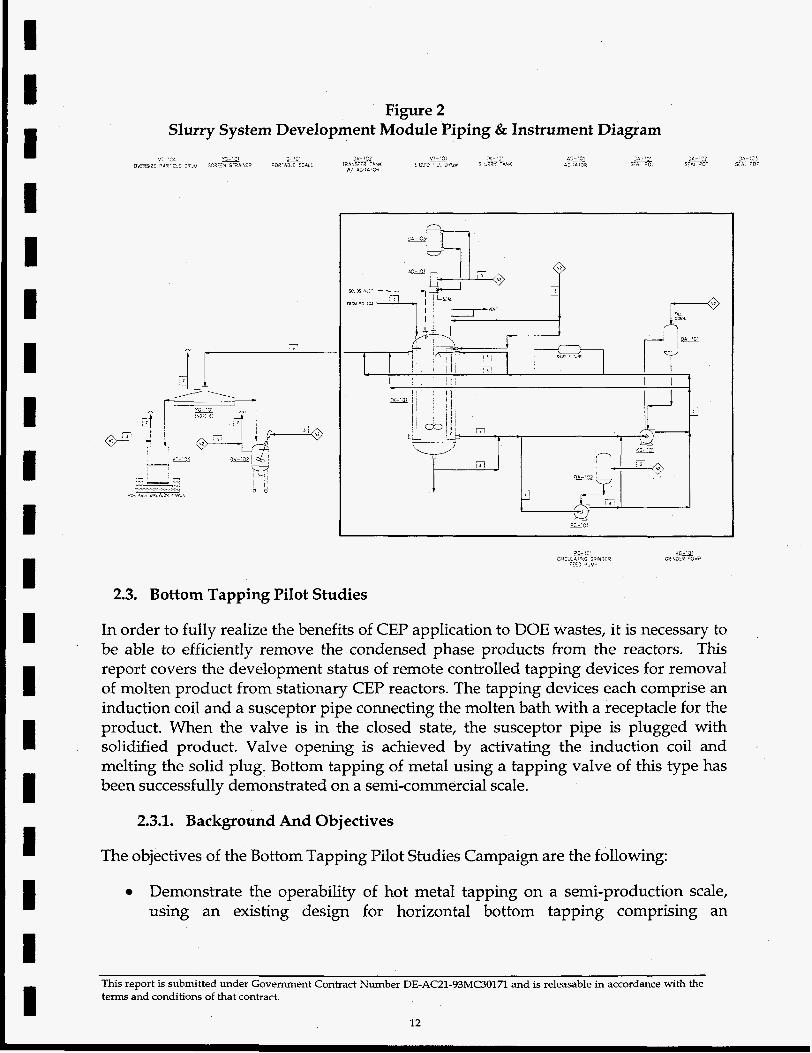
The grinder skid system is shown in the attached diagram Figure 2. The solids are manually charged into the holding tank and the liquids are pumped into the vessel. The slurry is pumped around a recycle loop with a grinder pump. The grinder pump helps break up the solid agglomerates and suspend the particles in the liquid. This pump is not expected to size reduce hard particles. The grinder pump will run for 15 to 20 min, achieving 3-7 passes. The grinding time is limited by the heat build-up in the liquid from the pump.
This report is submitted under Government Contract Number DE-AC21-93MWOlTl and is releasable in accordance with the terms and conditions of that contract.
11
I I 1 I I I I I I I I I I I I I I I I
Figure 2 Slurry System Development Module Piping & Instrument Diagram
3 114 W/
4
-
'i I
2.3. Bottom Tapping Pilot Studies
In order to fully realize the benefits of CEP application to DOE wastes, it is necessary to be able to efficiently remove the condensed phase products from the reactors. This report covers the development status of remote controlled tapping devices for removal of molten product from stationary CEP reactors. The tapping devices each comprise an induction coil and a susceptor pipe connecting the molten bath with a receptacle for the product. When the valve is in the closed state, the susceptor pipe is plugged with solidified product. Valve opening is achieved by activating the induction coil and melting the solid plug. Bottom tapping of metal using a tapping valve of this type has been successfully demonstrated on a semi-commercial scale.
2.3.1. Background And Objectives
The objectives of the Bottom Tapping Pilot Studies Campaign are the following:
Demonstrate the operability of hot metal tapping on a semi-production scale, using an existing design for horizontal bottom tapping comprising an
This report is submitted under Government Contract Number DE-AC21-93MC30171 and is releasable in accordance with the terms and conditions of that contract.
12
1 I I I I I I I I I I 1 I I I 1
Th~s report IS submtted under Government Contract Number DE-AC21-93MC30171 and IS releasable m accordance with the terms and conditions of that contract.
13
inductively heated susceptor pipe containing a metal plug mounted horizontally at the bottom of the reactor.
0 Provide tapping valve characteristics - timing and power - for the specific design.
Provide data for tapping at various bath temperatures.
The intention was to demonstrate complete metal drain capability through the bottom valve mounted on the pilot scale reactor in a first phase. The results obtained in this phase of the work, comprising complete bottom drain of an 800 lb bath at 2,990"F and a 300 lb bath at 2,700"F are discussed below.
Based on the first phase work, the next step will be to demonstrate intermittent tapping of ceramic phase horizontally and metallic phase vertically on the pilot-scale reactor. The reactor will be equipped with two tapping valves allowing the reactor to be operated in the vertical position with a bottom drain capability and intermittent horizontal ceramic phase tapping capability. Tapping will be interrupted by using a slide gate system on the upper tapping valve. Placing the reactor in the horizontal position will allow testing of intermittent vertical metal tapping. This will provide characterization of valve-to-OPEN and valve-to-CLOSED transients for both valves.
2.3.2. Apparatus
The current-design bottom tapping valve installation is shown in Figure 3. The existing Fall River pilot-scale reactor design and bottom clearance dimensions are such that vertical bottom tapping is undesirable. The experimental valve was installed horizontally, which requires that the tapping pipe penetrate the APU-1 reactor main coil. This also led to the selection of a short coil and thus a low coillpipe length ratio. The pipe extends through an eyebrow arrangement in the water cooled main reactor coil, creating a cold spot in the pipe and plug between the coil and the bath. The amount of power required to open the valve was precalculated and the procedure for opening the valve at the chosen bath temperature was established based on these calculations. The tapping pipe was equipped with six thermocouples as shown in Figure 3. The thermocouples were intended to provide on-line information on the temperature development from the steady state temperature profile to valve OPEN status.

Figure 3 Sketch showing the bottom tapping valve on the pilot-scale reactor.
I I I I I I I I I I I
2.3.3. Tapping Procedure
The first run had two objectives. First, to verify findings from the 80 lb. Bottom Tapping Unit (BTU) on a scale of 800 lb. of molten metal (iron bath at 2,800°F, 3% carbon); second, to obtain data on the valve performance as a function of time and power applied to the valve induction coil.
The procedure for opening the valve was based on sequential activation of the valve coil. The susceptor pipe was slowly brought dose to its maximum operating temperature of 3,200°F, at which point the power was switched off to allow the
This report is submitted under Government Contract Number DE-AC21-93MC30171 and is releasable in accordance with the terms and conditions of that contract.
14
I I 1 I I I I 1
I I I I I
generated heat to dissipate axially before the next coil activation. The relatively slow heating was intended to protect the thermocouples.
The experimentally critical temperature readings were given by TC-2B located at the hottest point under the induction coil and TC-3B which provided reliable readings and gave information on the steady state temperature profile in the absence of accurate readings from TC-4B and TC3B. The latter thermocouples were expected to monitor the coldest temperatures along the pipe but, owing to the thermal conductivity of the grout used to secure the pipe in place, in reality reflected the cooling effects of the main reactor coil.
Bottom tapping was accomplished after four heating cycles at a bath temperature of 1570°C. The metal was completely drained, leaving no residue in the reactor. The valve assembly and the seals between the crucible and tapping pipe were inspected after the run and found to be intact.
The second run aimed to verify that the tapping valve could be opened at a lower bath temperature and that the reactor could be fully drained starting from a lower metal level. The reactor was charged with 300 Ibs of iron, 3% carbon, and tapping was initiated at a bath temperature of 1460°C. Based on heat transfer calculations, this bath temperature represented the lower bound for successful tapping, given the induction heating limitations and estimated thermal losses of the system. It was estimated that tapping could be achieved at a temperature 70 degrees below the metal liquidus temperature in the coldest portion of the pipe.
The induction coil was fired at full power, in five on/off cycles. Immediately after the fifth burst of power, hot metal started trickling out, indicating that the entire plug was molten and communicated the pressure differential to the pipe opening. The stopper was retracted and the 300 lbs of metal completely drained from the reactor. The tapping pipe was clean and free of metal after the tap.
The power delivered to the coil during the runs was estimated following two different routes. Estimate I was based on calculations of expected coil performance at assumed current levels ranging from 400 to 700A, the known useful energy delivered and estimated thermal losses. Estimate I1 was based on calculation of heat flows under the coil based on linearized approximations of dT/dt in the susceptor pipe during the power ON/OFF cycles.
2.3.4. Discussion
The pilot scale bottom tapping tests were successfully carried out at two bath temperatures and two metal charge weights. Remotely controlled bottom tapping of liquid metal without tilting the reactor was demonstrated on a pilot scale. In-house experience in the design and operation of induction heated tapping valves has been established.
This report is submitted under Government Contract Number DE-AC21-93MC30171 and is releasable in accordance with the terms and conditions of that contract.
I I 1 I 1 I I I I I I I 1 1 I I I I I
2.4. Energy Addition Systems
The standard method of energy addition to CEP reactors has relied exclusively on induction heating. In addition to being a non-contact source of energy, induction heating has been found to offer controllability and efficiency. Gas burners and resistance heaters have also been used for pre-injection operations such as pre-heating and initial metal charge melting. These systems have been optimized for use in R&D purposes, and thus may not prove to be the most economical in a commercial environment. A preliminary literature survey and analysis of energy addition systems have revealed the suitability of alternative sources of energy for specific CEP applications.
Plasma arc torches have been considered to offer an alternative heating method for CEP, but have not yet been developed. Potential uses of the plasma torch include primary heating of metal bath charges, pre-heating of the refractory brick materials, and the addition of supplemental heating to the horizontal extension section of a multi-zone CEP reactor. Before they can be applied to CEP systems, plasma arc torches have to be characterized with respect to controllability, efficiency, electrode component lifetime, and effect on refractory wear.
2.4.1. Objectives
The primary goals of the initial phase of the test plan are as follows:
1) Install a plasma arc torch system on a testing unit and complete hardware shakedown tests. The electrical, cooling, and torch gas systems will be installed, in addition to control logic and software development;
2) Define the operating envelope of the plasma torch system using nitrogen working gas. The impact of varying furnace conditions on the torch operating envelopes will be determined to improve its operability and controllability; and
3) Perform characterization and optimization tests after establishing the operability of the plasma torch. The goal of these tests will be to define how the torch should be operated to maximize operational stability and overall heating efficiency, while minimizing flow rate and excessive localized heating.
2.4.2. Experimental
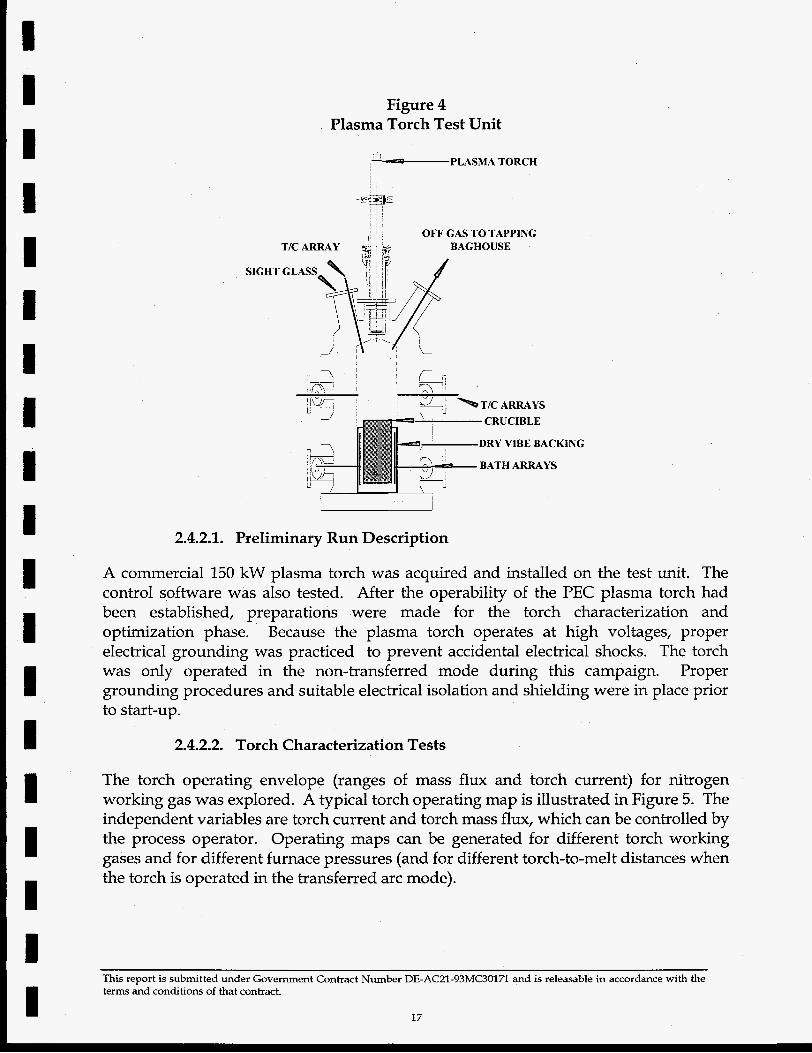
Figure 4 shows the plasma torch test unit. The plasma torch was mounted vertically and aimed into a crucible containing a suitable metal charge to be melted. The off gas is from the test unit is directed to the tap/ceramic baghouse.
This report is submitted under Government Contract Number DE-AC21-93MC30171 and is releasable in accordance with the terms and conditions of that contract.
16
I I I 1 I 1 1 I 1 I I 1 I I 1 I I I I
SIGHT
Figure 4 Plasma Torch Test Unit
PLASMA TORCH
OFF GAS TO TAPPING TIC ARRAY BAGHOUSE
' GLASS
CRUCIBLE
DRY VIBE BACKING
BATH ARRAYS
2.4.2.1. Preliminary Run Description
A commercia1 150 kW plasma torch was acquired and installed on the test unit. The control software was also tested. After the operability of the PEC plasma torch had been established, preparations were made for the torch characterization and optimization phase. Because the plasma torch operates at high voltages, proper electrical grounding was practiced to prevent accidental electrical shocks. The torch was only operated in the non-transferred mode during this campaign. Proper grounding procedures and suitable electrical isolation and shielding were in place prior to start-up.
2.4.2.2. Torch Characterization Tests
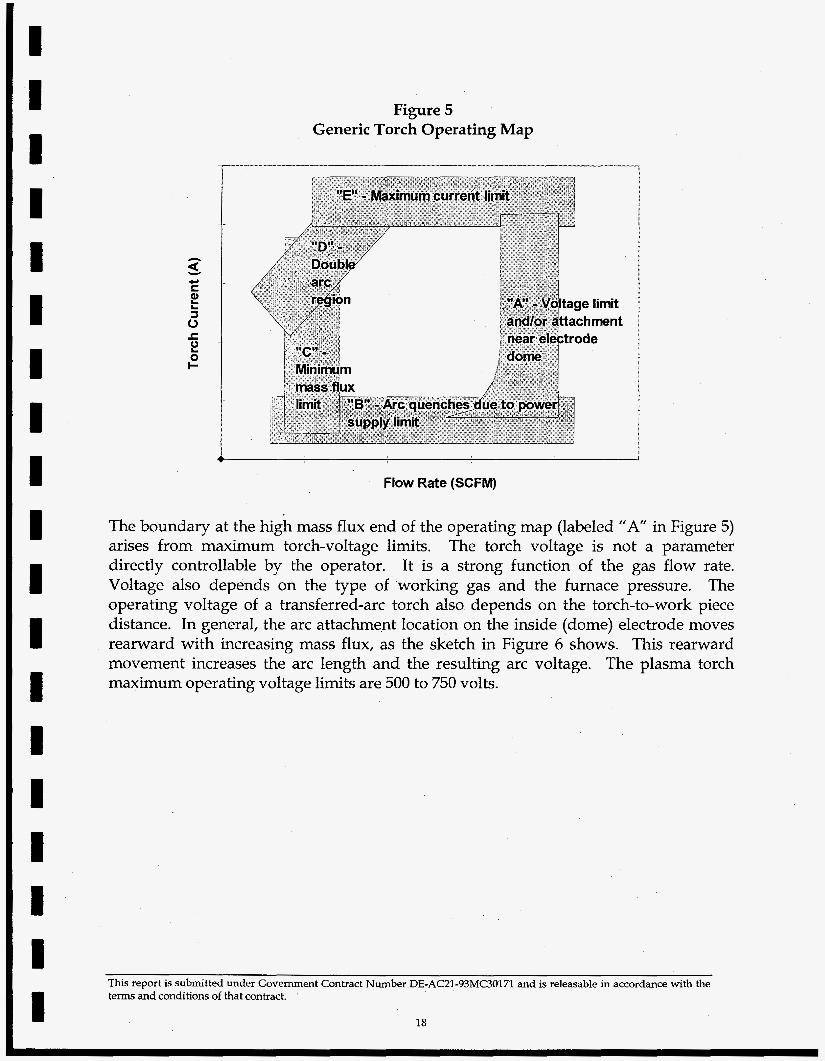
The torch operating envelope (ranges of mass flux and torch current) for nitrogen working gas was explored. A typical torch operating map is illustrated in Figure 5. The independent variables are torch current and torch mass flux, which can be controlled by the process operator. Operating maps can be generated for different torch working gases and for different furnace pressures (and for different torch-to-melt distances when the torch is operated in the transferred arc mode).
This report is submitted under Government Contract Number DE-ACZl-93MC3017l and is releasable in accordance with the terms and conditions of that contract.
17
I I I I I I I I I I I I I I I I I I 1
Figure 5 Generic Torch Operating Map
i Flow Rate (SCFM)
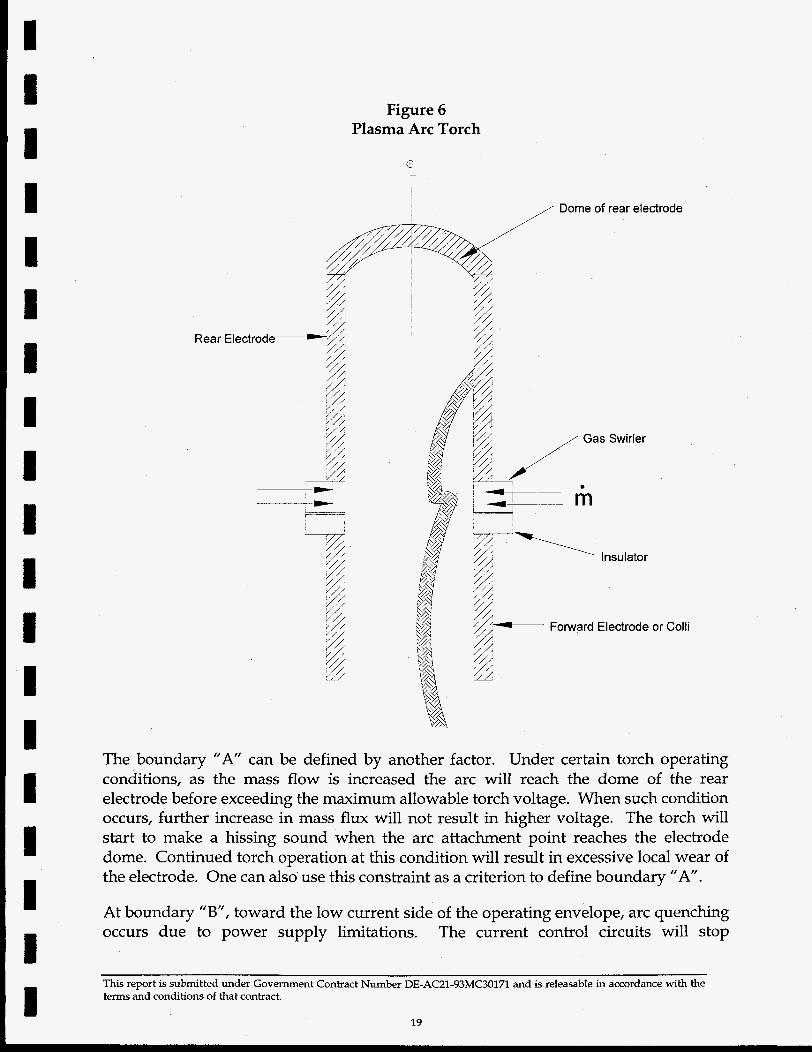
The boundary at the high mass flux end of the operating map (labeled " A in Figure 5) arises from maximum torch-voltage limits. The torch voltage is not a parameter directly controllable by the operator. It is a strong function of the gas flow rate. Voltage also depends on the type of working gas and the furnace pressure. The operating voltage of a transferred-arc torch also depends on the torch-to-work piece distance. In general, the arc attachment location on the inside (dome) electrode moves rearward with increasing mass flux, as the sketch in Figure 6 shows. This rearward movement increases the arc Iength and the resulting arc voltage. The plasma torch maximum operating voltage limits are 500 to 750 volts.
This report is submitted under Government Contract Number DE-AC21-93MC30171 and is releasable in accordance with the terms and conditions of that contract.
18
II I I I I I i I I I I I I I
Rear Electrode
Figure 6 Plasma Arc Torch
c -
,,,/ Dome of rear electrode
/ Gas Swirler
1 - . m
tnsulator
?&< b’Q ?d;- Forward Electrode or Colli
The boundary “A” can be defined by another factor. Under certain torch operating conditions, as the mass flow is increased the arc will reach the dome of the rear electrode before exceeding the maximum allowable torch voltage. When such condition occurs, further increase in mass flux will not result in higher voltage. The torch will start to make a hissing sound when the arc attachment point reaches the electrode dome. Continued torch operation at this condition will result in excessive local wear of the electrode. One can also use this constraint as a criterion to define boundary ”A”.
At boundary “B”, toward the low current side of the operating envelope, arc quenching occurs due to power supply limitations. The current control circuits will stop
I 1 I I
This report is submitted under Government Contract Number DE-AC21-93MC3017l and is releasable in accordance with the terms and conditions of that contract. I 19
I 1 1
I I I
i
I I
1 I - I I I I 1 1
functioning at low currents and/or power. This boundary is horizontal if the limit is set for minimum current, while minimum power limit will result in a sloping boundary in Figure 5 and Figure 6.
The boundary "C," at the low mass flux side of the torch operating envelope, arises from constraints set by the torch developer. The manufacturer limits the mass flux in the 150 kW torches to no less than 2 sf31min. This constraint is necessary to prevent the arc-to-rear electrode attachment points from being situated too close to the gas swirler (see Figure 6 for torch geometry). This situation is undesirable for several reasons. First, the intense heating from the arc foot can damage the nearby "O-rings, as well as the gas swirler itself. Second, this can complicate the maintenance and disassembly of the torch. During torch disassembly, a special wrench is inserted into the electrode bore for unscrewing the rear electrode from the electrode holder. The grip of this wrench is not adequate for electrode removal if there is excessive material wear near the lip of the electrode.
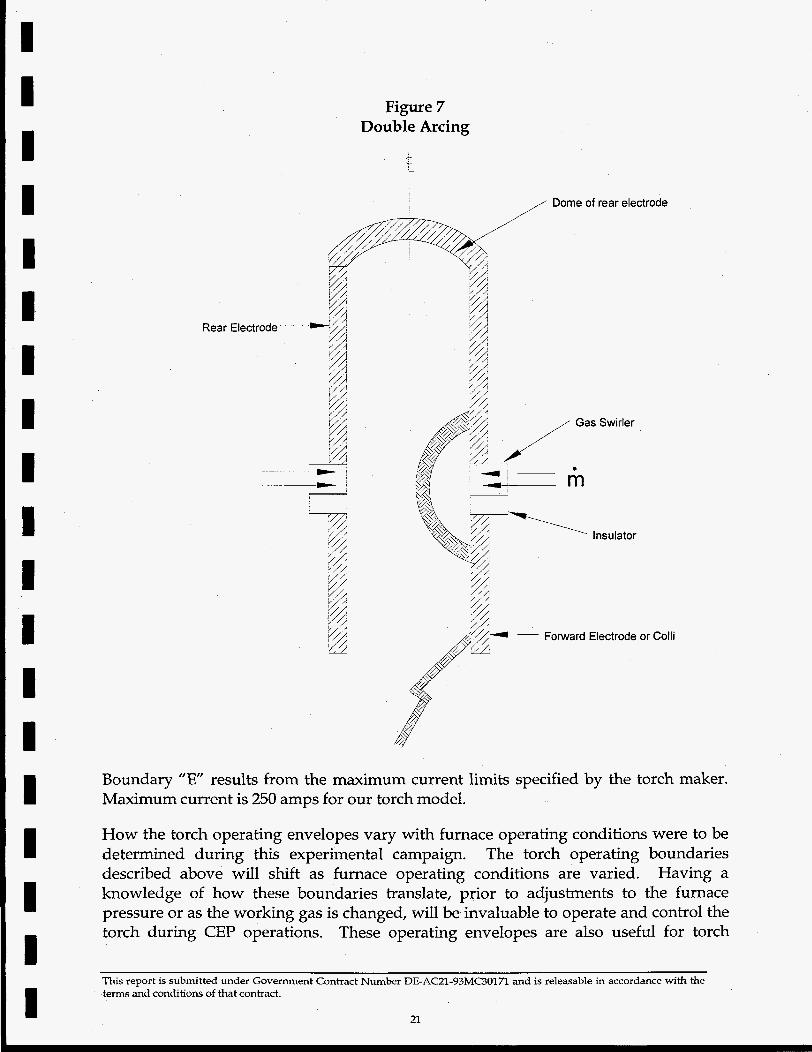
Torch operation at high current and low mass flux condition will increase the risk of double arcing. Increasing the arc current increases the diameter of the arc channel, the current-carrying part of the plasma gas. The arc channel is shielded from the metal segments of the torch by the outer (and colder) region of the swirling plasma. The thickness of this gas shroud is reduced at lower mass flow rates. Upon coming closer to the metal segments of the torch, the arc might find it energetically preferable to short-circuit through the torch body, as shown in Figure 7. Such double arcing usually destroys the torch elements. Boundary "D" in Figure 5 is used to prevent such double arcs from occurring during torch operations.
This report is submitted under Government Contract Number DE-AC21-93MC3017l and is releasable in accordance with the terms and conditions of that contract.
20
I I I I I I I I I I I I I I I I I I I
Figure 7 Double Arcing
,,,/ Dome of rear electrode
Rear Electrode-
Boundary " E results from the maximum current limits specified by the torch maker. Maximum current is 250 amps for our torch model.
How the torch operating envelopes vary with furnace operating conditions were to be determined during this experimental campaign. The torch operating boundaries described above will shift as furnace operating conditions are varied. Having a knowledge of how these boundaries translate, prior to adjustments to the furnace pressure or as the working gas is changed, will be invaluable to operate and control the torch during CEP operations. These operating envelopes are also useful for torch
This report is submitted under Government Contract Number DE-AC21-93MC30171 and is releasable in accordance with the temw and conditions of that contract.
21
I I I I I I I I I I I I I I I I I I I
ignition. Arc ignition can occur only under a certain combination of conditions and within a certain range of operating variables. Torch maps can provide the operators with such start-up information.
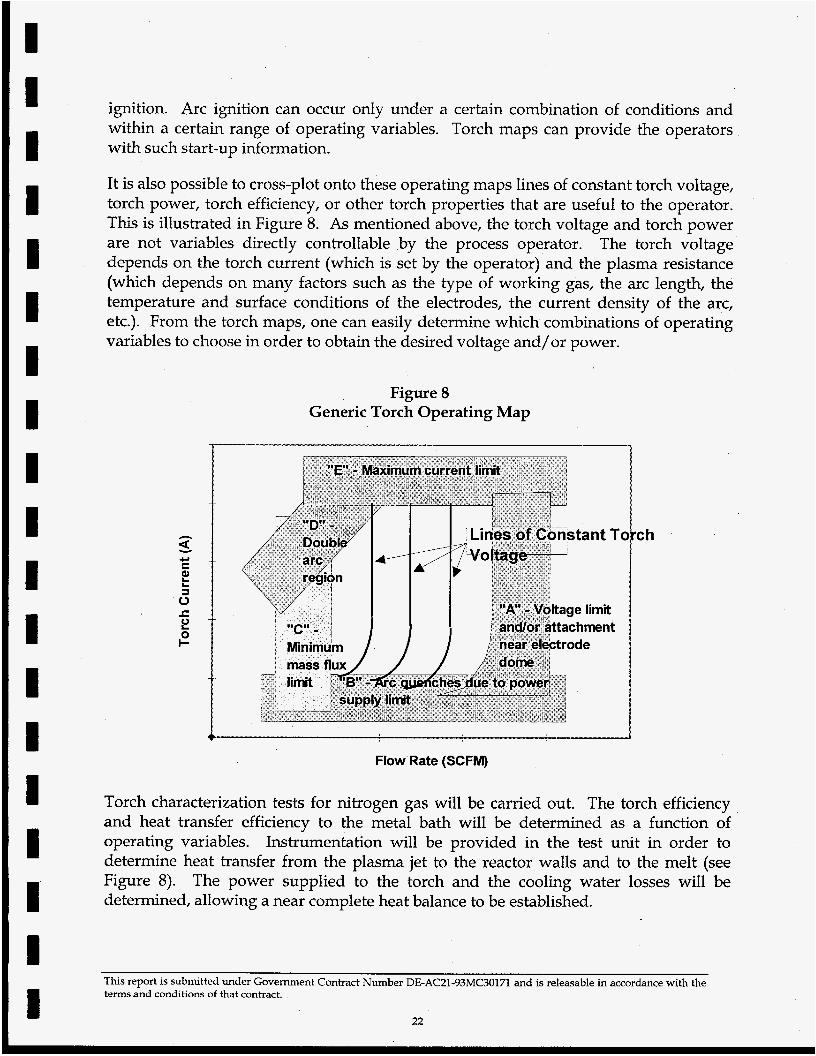
It is also possible to cross-plot onto these operating maps lines of constant torch voltage, torch power, torch efficiency, or other torch properties that are useful to the operator. This is illustrated in Figure 8. As mentioned above, the torch voltage and torch power are not variables directly controllable by the process operator. The torch voltage depends on the torch current (which is set by the operator) and the plasma resistance (which depends on many factors such as the type of working gas, the arc length, the temperature and surface conditions of the electrodes, the current density of the arc, etc.). From the torch maps, one can easily determine which combinations of operating variables to choose in order to obtain the desired voltage and/or power.
Figure 8 Generic Torch Operating Map
rc h
Flow Rate (SCFM)
Torch characterization tests for nitrogen gas will be carried out. The torch efficiency and heat transfer efficiency to the metal bath will be determined as a function of operating variables. Instrumentation will be provided in the test unit in order to determine heat transfer from the plasma jet to the reactor walls and to the melt (see Figure 8). The power supplied to the torch and the cooling water losses will be determined, allowing a near complete heat balance to be established.
This report is submitted under Government Contract Number DE-AC21-93MC30171 and is releasable in accordance with the terms and conditions of that contract.
22
I I 1 1 I I I I I I I I I I I I I I I
2.4.2.3. Optimizing Dilution Gas Flow
The optimum dilution gas flow will be determined for maximum overall heat transfer to the bath while minimizing localized heating. Special attention will be made to determine the surface temperature distribution on the refractory near the torch exit, as a function of the amount of dilution gas. Dilution gas is required to lower the torch gas temperature. Otherwise, radiation from the plasma jet may cause excessive localized heating. If too much dilution gas is used, then this limits the temperature differential between the gas and the metal bath will be limited, resulting in a lower overall heating efficiency. Excessive gas flow also lowers the gas residence time within the reactor, further reducing the heating efficiency.
2.4.2.4. Torch Efficiency
The factors that influence the torch efficiency will be identified. The torch efficiency (in the non-transferred arc mode) is expected to increase by elongating the arc length. This can be done by increasing the mass flow rate. The length of the rear electrode cavity can be increased and the swirler configuration can be changed.
The tangential component of the injected flow, which is a function of the swirler configuration, can have important influence on the torch efficiency. One of the effects of the swirl flow is to gradually mix cooler gas in with the body of the arc column. This provides a moderately high voltage gradient per unit arc length and tends to increase the total arc length. The vendor typically recommends different swirler configurations for different torch gases. The number of injector holes and the injector cross-section areas are different on the various injector designs to optimize the overall torch efficiency. Based on the manufacturer’s recommendations, testing with alternate swirler configurations may be conducted.
Torch efficiency is also expected to decrease with increasing pressure. The sensitivity of torch efficiency to pressure will be addressed after the results from the initial tests at atmospheric pressure are completed
2.4.2.5. Other Torch Operation Issues
The feasibility of introducing powdered ceramic formers into the swirling dilution gas will be determined. Since plasma torches are very effective at heating powders, injecting finely divided ceramic formers into the plasma jet stream will help increase the heating efficiency of this material. In addition, the presence of particulates in the torch exhaust gas will help increase the radiative component of heat transfer to both the reactor bricks and to the crucible. Tests involving transfer arc mode of torch operation are not suitable for the proposed test unit. Torch tests with CO/H:! as the working gas are planned for future trials.
This report is submitted under Government Contract Number DE-AC21-93MC30171 and is releasable in accordance with the terms and conditions of that contract.
23
2.5. Bulk Solids Feed System Conclusions
MMT has characterized CEP’s ability to process bulk solid feed materials and has achieved significant growth in the size of bulk solid particles compatible with Catalytic Extraction Processing. Parametric experimental studies using various feed materials representative of the components of various DOE waste streams have validated design models which establish the reactor operating range as a function of feed material, mass flow rate, and particle size. MMT is investigating the use of a slurry system for bulk solid addition as it is the most efficient means for injecting soils, sludges, and similar physical forms into a catalytic processing unit. Experiments will demonstrate the capability to generate stable slurries that can be pumped through piping systems to a tuyere and/or feed tube without significant “silting”. MMT is continuing to evaluate condensed phase product removal systems and alternative energy addition sources to enhance the operating efficiency of bulk solids CEP units. A condensed phase product removal system capable of on-demand product removal has been successfully demonstrated. MMT is also investigating the use of a plasma arc torch to provide supplemental heating during bulk solids processing. This comprehensive approach to bulk solids processing is expected to further improve overall process efficiency prior to the deployment of CEP for the recycle, reuse, and disposal of materials from DOE decontamination and decommissioning activities.
This report is submitted under Government Contract Number DE-AC21-93MC30171 and is releasable in accordance with the terms and conditions of that contract. I 24