Embed Size (px)
Citation preview
1
DISSERTATION
Titel der Dissertation
Psychological and Physiological Response during the Treatment of Fear of Flying
Verfasserin
Mag. Margit Burger
angestrebter akademischer Grad
Doktorin der Naturwissenschaften
Wien, im Mai 2011
Studienkennzahl lt. Studienblatt: 9108534
Dissertationsgebiet lt. Studienblatt. Psychologie
Betreuer: a.o. Univ. Professor Dr. Michael Trimmel

2
3
Acknowledgements
I wish to express my special thanks to my Professor Dr. Michael Trimmel, who
accepted my proposed thesis and gave me advice and help in realizing the
project. His experience and all the valuable discussions furthered it step by
step. He encouraged me to take on my tasks and showed full understanding
throughout the project.
I also wish to express my sincere thanks to Austrian Airlines for their
cooperation in this project, especially Dr. Robert Wolfger as leader of the fear of
flying seminars, to Captain Wolfauer and his crew for looking after us so well on
the flights and for being willing to accept any inconvenience related to the study.
I want to express my special thanks to the participants of the seminar, for their
readiness to contribute to this study, and to the employees of Austrian Airlines
who gave up their free time for this project.
Many, many thanks go to my husband Friedrich, who has always believed in my
project. His moral help and understanding from the beginning to the end have
been a great source of encouragement.
And finally I thank my children Sarah and Clemens, who had to have
compassion for their mother’s additional occupation, which was not always
easy. They have grown up with this project, they have made me very happy and
I wish them all the best for their own future.

4
5
Table of Contents
1 Introduction ....................................................................................................... 9
1.1 Motivation of this study........................................................................................ 9
1.2 Fear of flying as a common problem................................................................... 9
1.2.1 Safety factor of flying .......................................................................... 10
1.2.2 Relevance of fear of flying .................................................................. 11
1.2.3 Prevalence of fear of flying ................................................................. 12
1.2.4 Problems of altitude during flights....................................................... 13
1.2.5 Diagnosis and subtypes of fear of flying ............................................. 14
1.2.6 Treatment of fear of flying................................................................... 16
1.2.7 Treatment programs and efficacy ....................................................... 18
1.2.8 Virtual reality exposure treatment ....................................................... 20
1.3 Etiology and acquaintance of fear of flying........................................................ 22
1.3.1 Etiology on the basis of emotion......................................................... 22
1.3.2 Etiology on the basis of personality .................................................... 23
1.3.3 Acquaintance through learning and conditioning ................................ 24
1.3.3.1 Conditioning................................................................................. 24
1.3.3.2 Vicarious exposure ...................................................................... 25
1.3.3.3 Transmission of information and instruction ................................ 25
1.3.4 Studies on etiology and acquaintance of fear of flying........................ 26
1.4 Biological processes in anxiety ......................................................................... 27
1.4.1 Autonomic nervous system and anxiety ............................................. 28
1.4.2 Heart rate variability............................................................................ 30
1.4.3 Assessment and calculation of HRV................................................... 32
1.4.4 Stress and HRV.................................................................................. 35
1.4.5 Cortisol release................................................................................... 36
1.5 Response patterns............................................................................................ 37
1.5.1 Anxiety and physiological response patterns in general ..................... 37
1.5.1.1 Chronic anxiety............................................................................ 37
1.5.1.2 Panic disorder.............................................................................. 39
1.5.1.3 Phobia ......................................................................................... 41
1.5.2 Fear of flying and physiological response patterns............................. 43

6
1.5.2.1 Treatment studies including physiology without flights.................43
1.5.2.2 Treatment studies including physiology and virtual flights............44
1.5.2.3 Treatment studies including physiology and real flights ...............46
1.5.3 Inconsistencies between psychological/physiological patterns ...........49
1.6 Regulation of the ANS.......................................................................................51
1.6.1 Fight-or-flight response .......................................................................51
1.6.2 The polyvagal theory...........................................................................51
1.6.3 Model of autonomic flexibility and adaptivity .......................................52
1.6.4 Autonomic flexibility-neurovisceral integration model..........................52
1.6.5 Homeostatic versus allostatic regulation .............................................53
1.7 Model of autonomic space by Berntson.............................................................53
1.7.1 The traditional concept of ANS regulation...........................................53
1.7.2 Criticism on the traditional autonomic balance control ........................54
1.7.3 Description of the model by Berntson .................................................55
1.7.3.1 Principles of the model of autonomic space.................................59
1.7.3.2 Practicability of the model of autonomic space ............................60
1.8 Research hypotheses........................................................................................62
2 Material and methods......................................................................................63
2.1 Design ...............................................................................................................63
2.2 Subjects.............................................................................................................64
2.3 Feasibility check of study...................................................................................64
2.4 Procedure and protocol of treatment seminar ...................................................67
2.4.1 First day of seminar.............................................................................68
2.4.2 Second day of seminar .......................................................................68
2.4.3 Third day of seminar ...........................................................................69
2.5 Recordings and equipment................................................................................71
2.5.1 Electrocardiogram...............................................................................71
2.5.2 Fingertip pulse oximeter......................................................................72
2.5.3 Salivary cortisol ...................................................................................72
2.5.4 Blood pressure....................................................................................72
2.6 Data reduction ...................................................................................................72
2.6.1 Definition of specific epochs................................................................72
7
2.6.2 Analyzed parameters.......................................................................... 74
2.7 Self-report questionnaires ................................................................................. 74
2.7.1 Flight Anxiety Situations (FAS) questionnaire..................................... 75
2.7.2 Flight Anxiety Modality (FAM) questionnaire ...................................... 75
2.7.3 State-Trait Anxiety Inventory (STAI) ................................................... 75
2.7.4 Anxiety questionnaire: body sensation, cognitions, and avoidance .... 75
2.7.5 Anxiety and mood (Appendix 9.19)..................................................... 76
2.8 Method of data analysis .................................................................................... 77
3 Results ............................................................................................................. 77
3.1 Physiological parameters of people with fear of flying ...................................... 77
3.1.1 Mean heart rate .................................................................................. 78
3.1.2 Heart rate variability............................................................................ 80
3.1.3 Arterial oxygen saturation (SpO2) ....................................................... 88
3.2 Psychological ratings during 3-day seminar...................................................... 89
3.3 Anxiety before and after seminar ...................................................................... 92
3.3.1 Flight Anxiety Situations (FAS) questionnaire..................................... 93
3.3.2 Flight Anxiety Modality (FAM) questionnaire ...................................... 94
3.3.3 State–Trait Anxiety Inventory (STAI) .................................................. 95
3.3.4 Anxiety questionnaires: body sensation, cognition, avoidance ........... 96
3.4 Physiological response during real flights ......................................................... 98
3.4.1 Mean heart rate during real flights ...................................................... 99
3.4.2 Heart rate variability during real flights.............................................. 101
3.4.3 Arterial oxygen saturation during real flights..................................... 109
3.4.4 Cortisol concentration during flights.................................................. 109
3.5 Psychological ratings during real flights .......................................................... 110
3.6 Exploration based on the model of autonomic space...................................... 113
3.6.1 Classification of sympathetic and parasympathetic changes............ 113
3.6.2 Definition of autonomic modes after Berntson .................................. 114
4 Discussion..................................................................................................... 120
4.1 Discussion of Hypothesis 1 – Response modes ............................................. 120
4.1.1 Behavioral Response........................................................................ 120
4.1.2 Physiological response ..................................................................... 120
8
4.1.3 Parameters indicating sympathetic activity .......................................122
4.1.4 Parameters indicating parasympathetic activity ................................125
4.1.5 Oxygen saturation and cortisol..........................................................128
4.1.6 Psychological response before, during, and after the seminar..........129
4.1.7 Integration of multiple response ........................................................131
4.2 Discussion of Hypothesis 2 - Autonomic Space ..............................................132
5 Conclusion.....................................................................................................134
5.1 Strengths of this study.....................................................................................135
5.2 Limitations of this study ...................................................................................136
6 Abstract..........................................................................................................138
7 Zusammenfassung........................................................................................140
8 Literature........................................................................................................143
9 Annexes .........................................................................................................162
9.1 Table 10. Mean heart rate ...............................................................................162
9.2 Table 11. SDNN ..............................................................................................163
9.3 Table 12. PNN50.............................................................................................164
9.4 Table 13. RMSSD ...........................................................................................165
9.5 Table 14. LFnorm ............................................................................................166
9.6 Table 15. HFnorm ...........................................................................................167
9.7 Table 16. Log LF/HF........................................................................................168
9.8 Table 17. SpO2 ................................................................................................169
9.9 Table 18. Physiological sensation ...................................................................169
9.10 Table 19. Diffuse fear ......................................................................................170
9.11 Table 20. Cognitive fear ..................................................................................170
9.12 Table 21. Unconfident/Joyless ........................................................................171
9.13 Table 22. Classification of change in LFnorm..................................................172
9.14 Table 23. Classification of change in HFnorm.................................................173
9.15 Table 24. Total Power .....................................................................................174
9.16 Table 25. VLF..................................................................................................175
9.17 Table 26. LF ....................................................................................................176
9.18 Table 27. HF....................................................................................................177
9.19 Anxiety and mood............................................................................................178

9
1 Introduction
1.1 Motivation of this study
Flying like a bird has always been a dream of mankind and is still fascinating.
Daedalos and Ikarus of the antique mythology stand for the temptation of being
able to fly. Leonardo DaVinci experimented years, but could not find a way
allowing human beings to fly. The Wright brothers in 1903 were the first ones
who succeeded in flying with an airplane, and only since 1958 it has been
possible to fly non-stop over the Atlantic. Although flying has become a reality
with technical support, the dream of flying like a bird by oneself does not work.
The former exclusive position of airline business has changed; traveling by air
has become a commodity affordable by the general public, and the globalization
of the world demands more flexibility from people, including a higher degree of
mobility. Mobility stands for life quality, which is important for professional as
well as for leisure reasons. However, increased mobility has also aggravated
the problem for people suffering from fear of flying.
Studies investigating autonomic response and psychological response during a
professional treatment program, which includes real flights and a control group,
are very rare. There are numerous laboratory studies in connection with anxiety
and evoked fear reactions, but the onset of fear is not comparable to real
exposure studies.
1.2 Fear of flying as a common problem
Fear of flying is common, it ranks high on the list of fears afflicting people today
and with which people have to cope (van Gerwen, Diekstra, Arondeus, &
Wolfger, 2004). Fear of flying seems to be a heterogeneous problem of diverse
nature and ethnology. The problem concerns not only the individuals but also
corresponding economic sectors like civilian and military airlines, tourism, and
business travel. Common coping mechanisms of passengers like consumption
of alcohol or taking pharmaceuticals are helpful only in the short term. The
10
growing relevance of fear of flying results in more people being forced to find
treatment (Reinecker, 1993) and consequently the choice of treatment
programs is increasing worldwide. Since the 1980s, Austrian Airlines has
arranged treatment seminars where people learn to manage efficiently to get rid
of their fears or learn to cope with them.
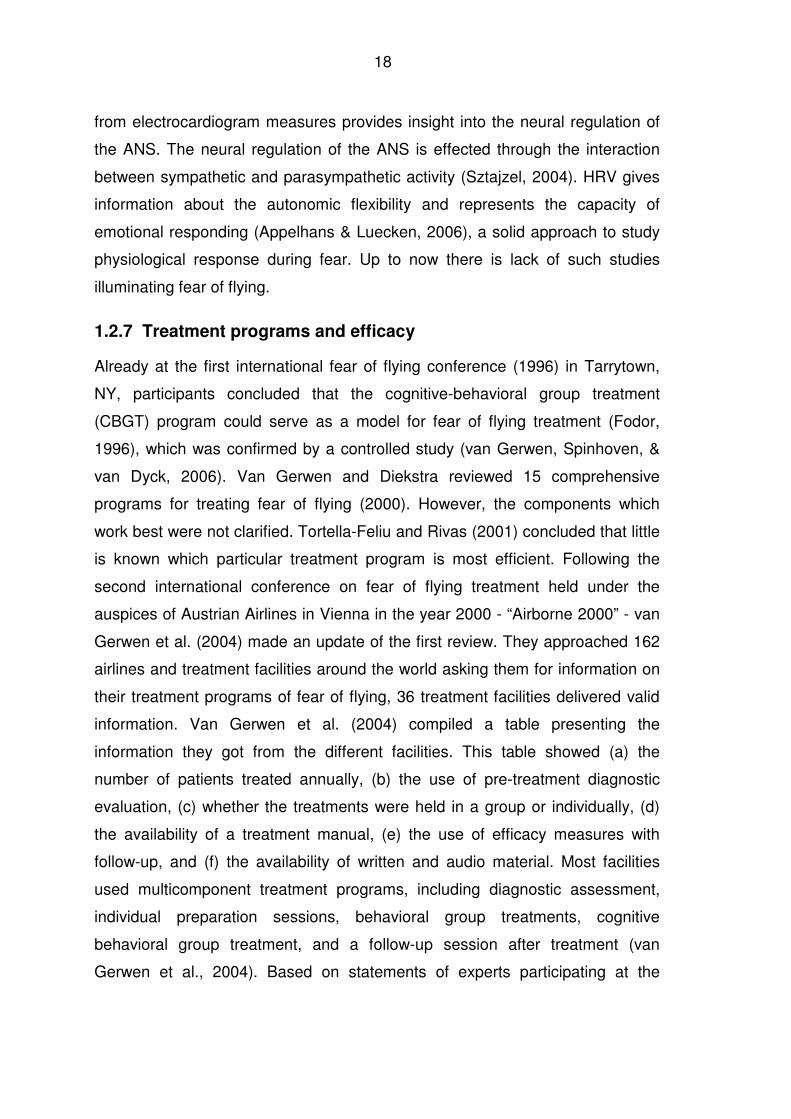
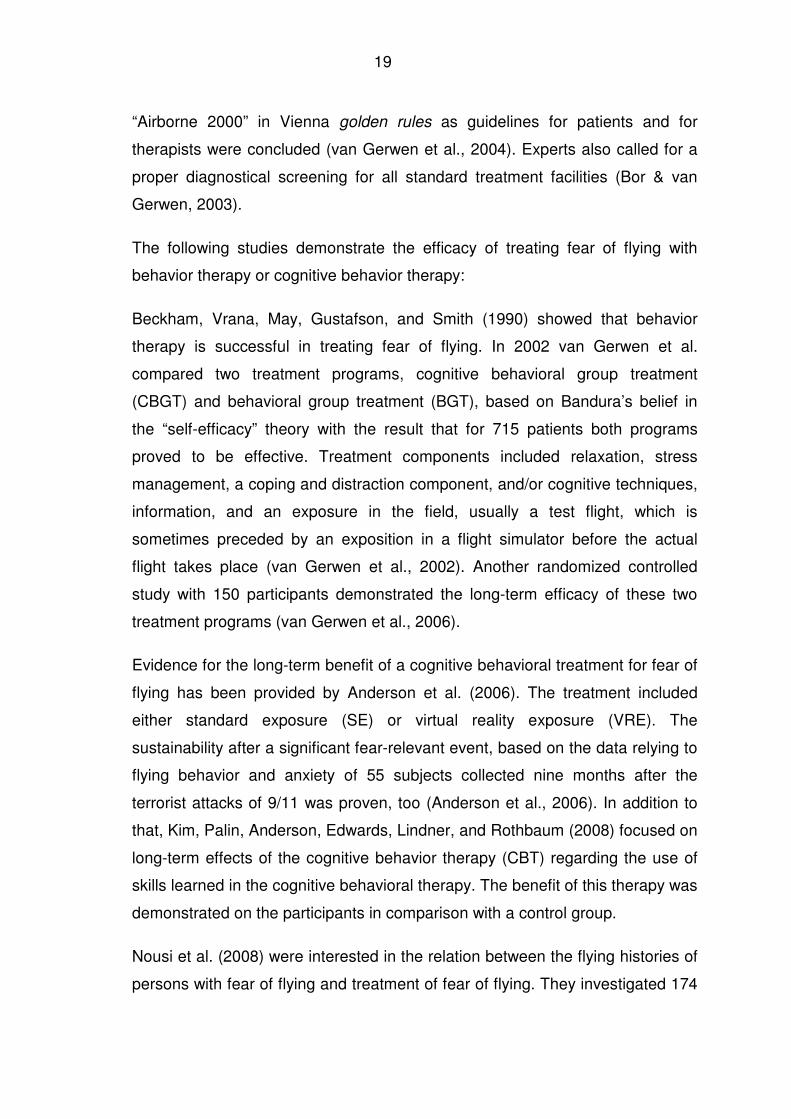
1.2.1 Safety factor of flying
Although statistics demonstrate that flying has become safer during the last
decades, knowledge about the mathematical risk does not affect fear of flying
(McLean in Bor & Van Gerwen, 2003). Facts regarding safety are therefore not
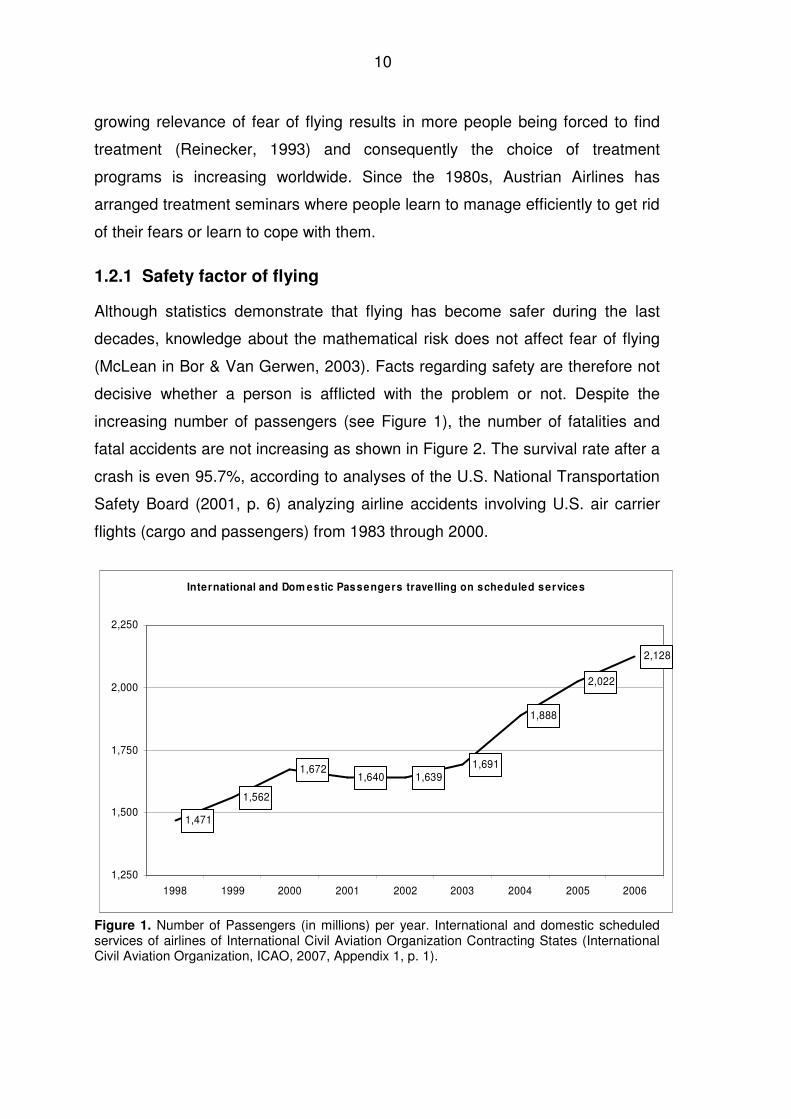
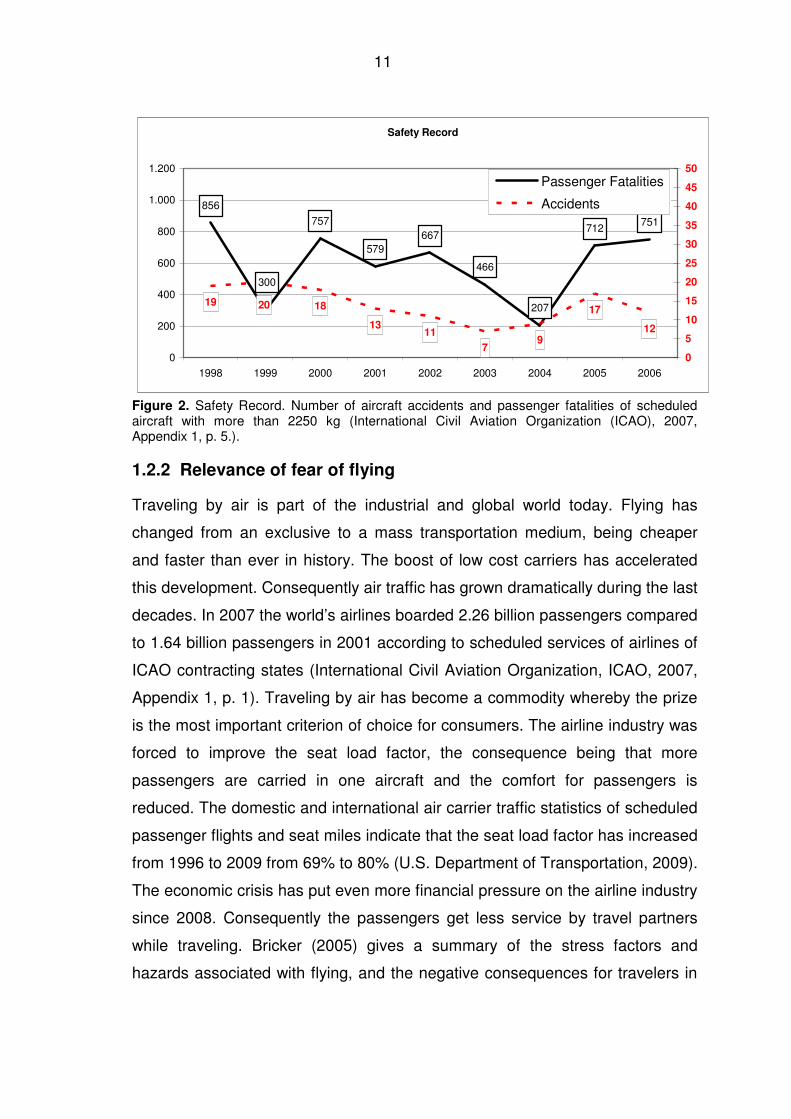
decisive whether a person is afflicted with the problem or not. Despite the
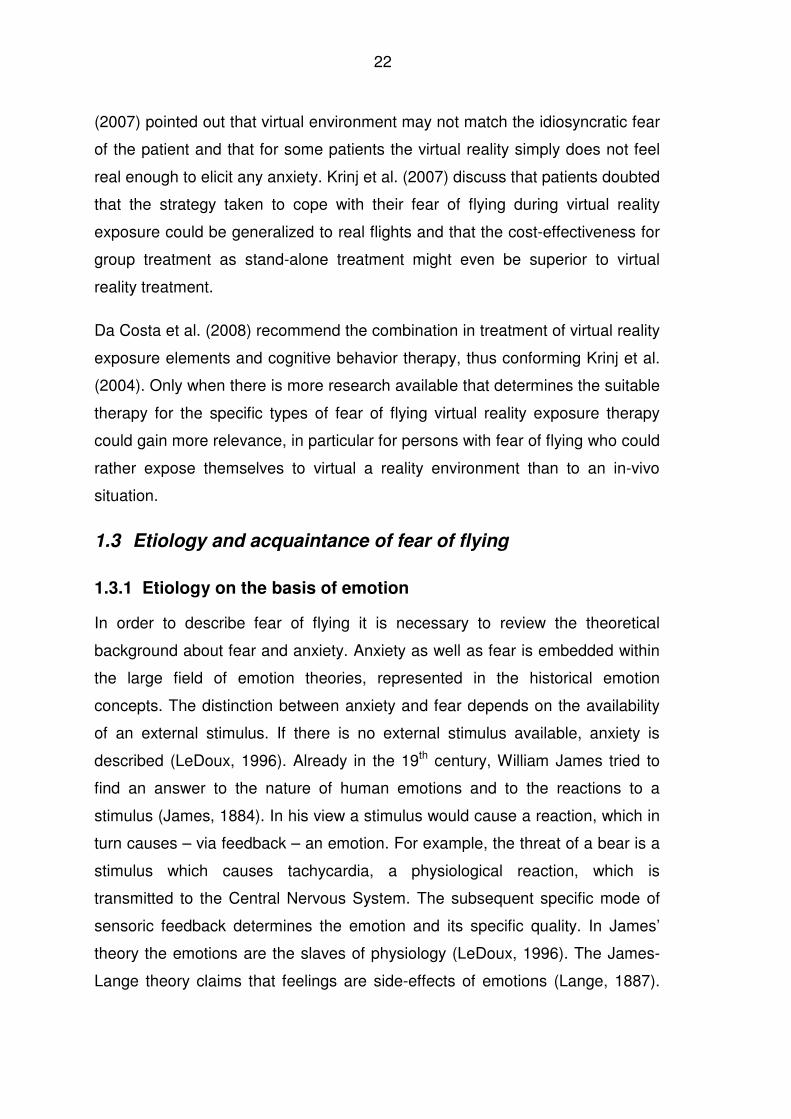
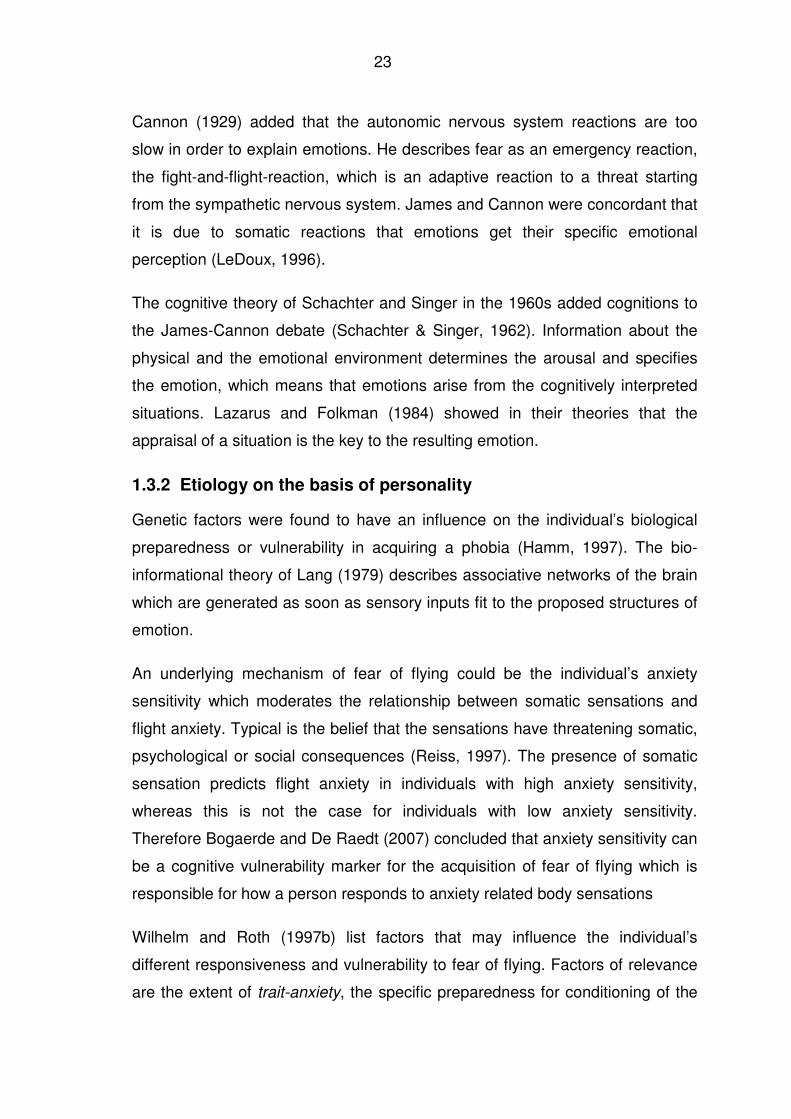
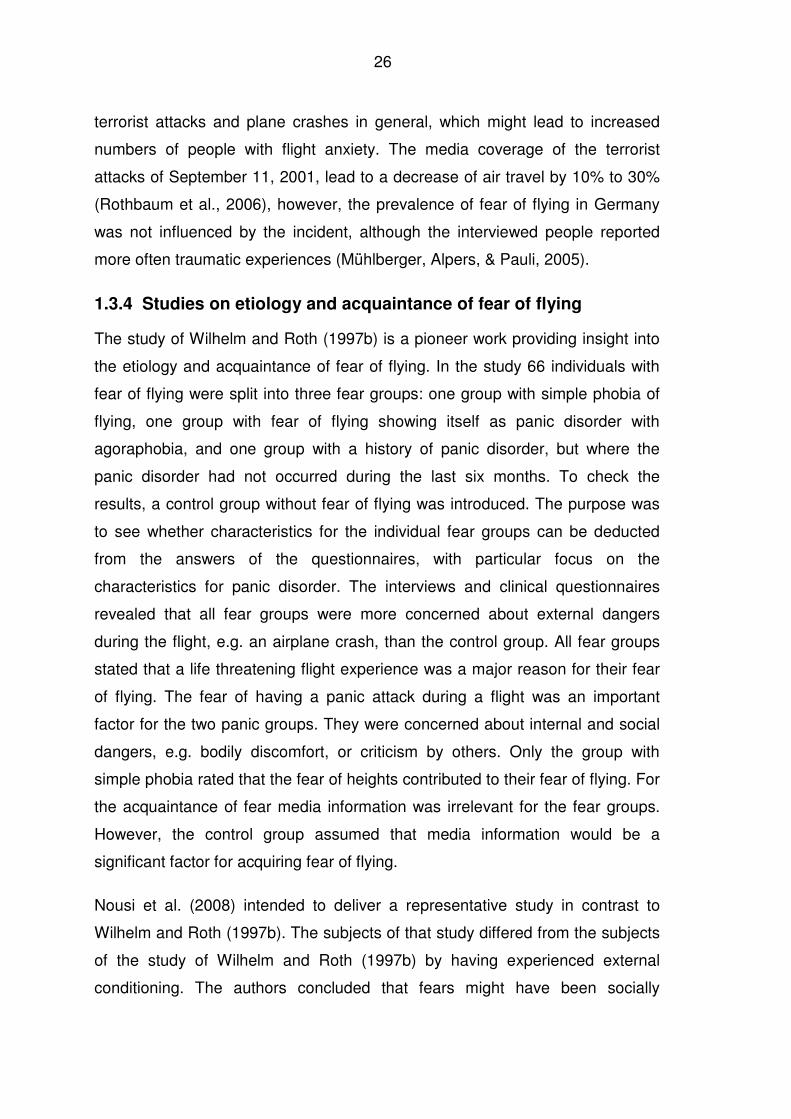
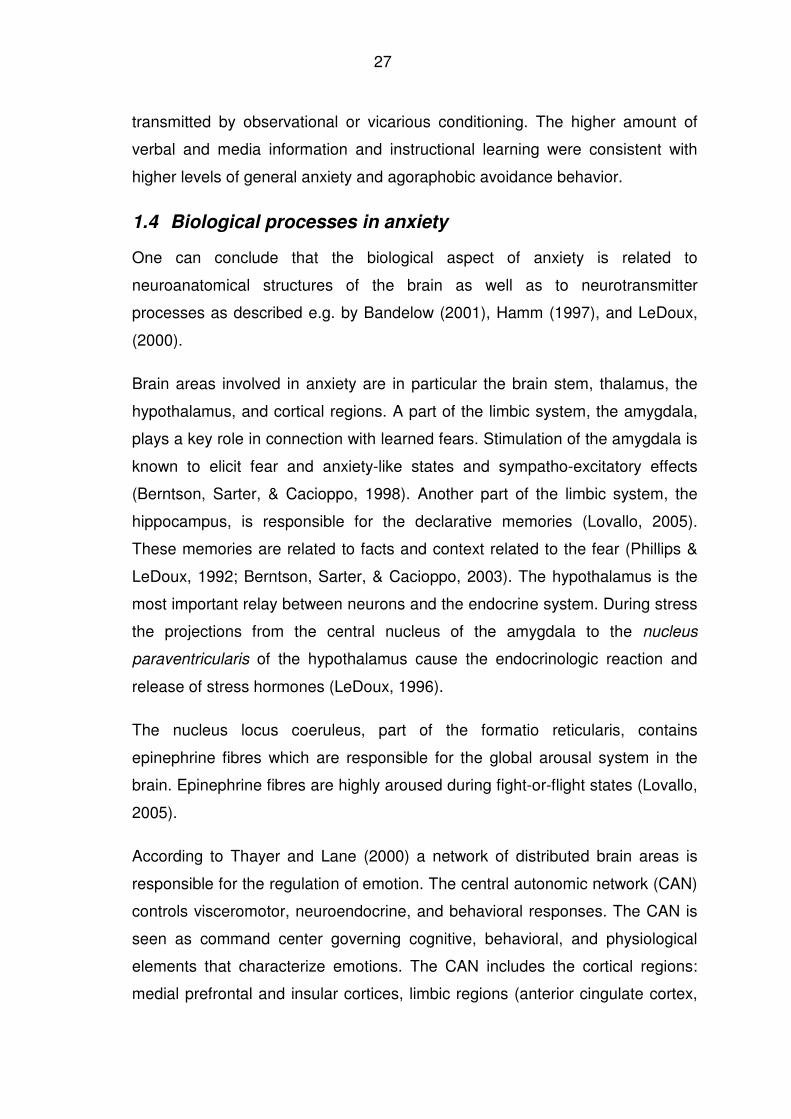
increasing number of passengers (see Figure 1), the number of fatalities and
fatal accidents are not increasing as shown in Figure 2. The survival rate after a
crash is even 95.7%, according to analyses of the U.S. National Transportation
Safety Board (2001, p. 6) analyzing airline accidents involving U.S. air carrier
flights (cargo and passengers) from 1983 through 2000.
International and Dom estic Passengers trave lling on scheduled services
1,471
1,562
1,6721,640 1,639
1,691
1,888
2,022
2,128
1,250
1,500
1,750
2,000
2,250
1998 1999 2000 2001 2002 2003 2004 2005 2006
Figure 1. Number of Passengers (in millions) per year. International and domestic scheduled services of airlines of International Civil Aviation Organization Contracting States (International Civil Aviation Organization, ICAO, 2007, Appendix 1, p. 1).
11
Safety Record
856
757
579667
466
207
712751
300
19 18
1311
79
17
12
20
0
200
400
600
800
1.000
1.200
1998 1999 2000 2001 2002 2003 2004 2005 2006
0
5
10
15
20
25
30
35
40
45
50
Passenger Fatalities
Accidents
Figure 2. Safety Record. Number of aircraft accidents and passenger fatalities of scheduled aircraft with more than 2250 kg (International Civil Aviation Organization (ICAO), 2007, Appendix 1, p. 5.).
1.2.2 Relevance of fear of flying
Traveling by air is part of the industrial and global world today. Flying has
changed from an exclusive to a mass transportation medium, being cheaper
and faster than ever in history. The boost of low cost carriers has accelerated
this development. Consequently air traffic has grown dramatically during the last
decades. In 2007 the world’s airlines boarded 2.26 billion passengers compared
to 1.64 billion passengers in 2001 according to scheduled services of airlines of
ICAO contracting states (International Civil Aviation Organization, ICAO, 2007,
Appendix 1, p. 1). Traveling by air has become a commodity whereby the prize
is the most important criterion of choice for consumers. The airline industry was
forced to improve the seat load factor, the consequence being that more
passengers are carried in one aircraft and the comfort for passengers is
reduced. The domestic and international air carrier traffic statistics of scheduled
passenger flights and seat miles indicate that the seat load factor has increased
from 1996 to 2009 from 69% to 80% (U.S. Department of Transportation, 2009).
The economic crisis has put even more financial pressure on the airline industry
since 2008. Consequently the passengers get less service by travel partners
while traveling. Bricker (2005) gives a summary of the stress factors and
hazards associated with flying, and the negative consequences for travelers in
12
connection with the large and still growing number of air travelers around the
globe.
The extended mobility and growing passenger traffic discriminates those people
already excluded from traveling due to their fear of flying even more. The
disorder fear of flying is a problem for individuals who suffer from it, by affecting
various life areas like professional, social, and family life, regardless whether
experienced to a mild, moderate or high degree (van Gerwen, Spinhoven,
Diekstra, & van Dyck, 2002). In addition, the disorder has an effect on military
and civilian organizations that operate aircraft (Krijn, Emmelkamp, Olafsson,
Bouwman, van Gerwen, & Spinhoven, 2007). During the International
Conference on Fear of Flying (June 2008) hosted by ICAO in Montreal,
renowned experts came together and revealed the implications of fear of flying
for air transport worldwide. Participants assumed that anxiety can threaten the
safety of a flight as well as the passengers and the crew (Nousi, Haringsma,
van Gerwen, & Spinhoven, 2008).
1.2.3 Prevalence of fear of flying
The prevalence of varying degrees of fear of flying of the general population in
industrialized countries was asserted by van Gerwen et al. (2004) with 10% to
40% based on previous research (Agras, Sylvester, & Oliveau, 1969; Dean &
Whitaker, 1982; Ekeberg, Seeberg, & Ellertsen, 1989; Haug et al., 1987). Data
using random sample and screening criteria of the Diagnostic and Statistical
Manual of Mental Disorders (American Psychiatric Association, 1994) show a
2.6% point prevalence of air travel phobia in the general population with the
disorder being nearly twice as common in women as in men (Fredrikson,
Annas, Fischer, & Wik, 1996). In the Dutch general population the lifetime
prevalence is stated with 6.9% (Depla, ten Have, van Balkom, & de Graaf,
2008). According to Curtis, Magee, Eaton, Wittchen, and Kessler (1998) there is
a prevalence of 13.2% of the general population suffering from fear of flying and
10% avoid flying definitely (Capafons, Sosa, & Vina, 1999); about 20% of all
passengers depend on alcohol or sedatives to reduce anxiety symptoms during
flights. Furthermore, every fifth passenger suffers from massive anxiety which is
13
not recognized by the crew (Reinecker, 1993). More current studies on the
epidemiology of fear of flying are required (van Gerwen et al., 2004).
The number of people with fear of flying is going to increase with threats of
terrorist acts and the spreading of epidemic diseases like SARS (van Gerwen et
al., 2004). The stresses of air travel like hassle, long airport security lines,
threats of hijackings or bombings, result in air travel anxiety, air travel anger and
lack of trust in airlines and airport safety (Bricker, 2008).
1.2.4 Problems of altitude during flights
The cruising altitude of a normal commercial airplane is 39,000 ft (11,887 m) or
more (Humphreys, Deyermond, Bali, Stevenson, & Fee, 2005). The high
cruising altitude of aircraft and the rapid ascent lead to a reduction of oxygen
and may be the reason why passengers suffer from hypoxia (Harding & Mills,
1983; Roth, Gomolla, Meuret, Alpers, Handke, & Wilhelm, 2002). Hypoxia is
described as oxygen-deficiency in blood, cells, and tissues (Bogaerde & De
Raedt, 2007). Related symptoms are increased ventilation, accompanied by a
feeling of breathlessness, increased heart rate, and dizziness (Jaffe, 2005).
US-regulations demand that the air pressure within the cabin has to be kept at
air pressure at an altitude of 8,000 ft (2,440 m) or lower at the maximum
operating altitude of the airplane. This regulation protects passengers and crew
(Federal Aviation Administration, 1996). Gruen et al. (2008) pointed out that
even in pressurized aircraft cabins a decrease of oxygen saturation in the
arterial blood flow is evident. Studies show that this causes troubles for anemic
passengers or passengers with coronary, pulmonary, or cerebrovascular
diseases (Aerospace Medical Association, 2003).
A relation between anxiety and low air pressure with reduced oxygen content in
the airplane was shown by Roth et al. (2002). Their findings showed that 54% of
all passengers had only 94% or less SpO2 at cruising altitude compared to an
oxygen saturation of 97% at sea level. A comparable reduction of SpO2 was
found by Humphreys et al. (2005) during short and long commercial flights.
Roth et al. (2002) pointed out that the environment in aircraft during flights may
14
confront some travelers with symptomatic stress related to adaptation to the
altitude which may cause an increase in anxiety, especially in persons suffering
from anxiety disorders. The authors compared the psychological and
physiological responses while adjusting to the altitudes with the psychological
and physiological response during panic attacks. Reduced arterial oxygen
saturation evokes responses that might be misinterpreted as signs for a
pending panic attack by persons suffering from anxiety disorders. That could
start a vicious cycle of panic attacks, being in congruence with the cognitive
misinterpretation model of Clark (1999). Aversive conditioning provoked through
hypoxia of high altitude was found to being related to fear of flying, anxiety
sensitivity was found to be a vulnerability marker (Bogaerde & De Raedt, 2007).
In individuals with high anxiety sensitivity the physical symptoms induced by
hypoxia may promote the flight-anxiety (Bogaerde & De Raedt, 2011).
1.2.5 Diagnosis and subtypes of fear of flying
The expressions “fear of flying”, “flight anxiety”, “avia phobia”, and “flight phobia”
are used synonymously in literature (Marcinkowski, 1993). In the Diagnostic and
Statistical Manual of Mental Disorders (DSM-IV, American Psychiatric
Association, 1994) fear of flying is included within the category specific phobia
under the subtype of situational phobia. The specific phobia is related to the
situation of flying with the effect that flying is avoided or only tolerated under
considerable stress. It is characteristic that people with fear of flying know that
their excessive fears are unreasonable. The fear can involve the anticipatory
anxiety, but related situations to flying can also cause intense distress and
suffering (Möller, Nortje, & Helders, 1998).
In general, specific phobias are described as most intensive and persistent fear
reactions which are evoked by the feared situation or the feared objects,
accompanied by the compulsory wish to leave the situation or to avoid it
(Hamm, 1997).
The categorization of fear of flying under specific phobias in the DSM-IV
(American Psychiatric Association, 1994) does not take into account that fear of
15
flying might be the expression of several subtypes of phobias and a composition
of one or more other phobias like fear of crashing, fear of heights, confinement,
claustrophobia, and instability (van Gerwen, Spinhoven, Diekstra, & van Dyck,
1997). The fear is further supposed to be the result of generalization of one or
more natural environment phobias, such as fear of heights, fear of falling, fear
of storms, fear of water, instability, and others (Cleiren, van Gerwen, Diekstra,
van Dyck, Spinhoven, & Brinkhuysen, 1994). The loss of control and the high
need to have control over a situation are also very important. About 45% of the
people with flight phobia are afraid of a plane crash (Howard, Murphy, & Clarke,
1983), whereas 27% are afraid of being enclosed and 25% are afraid of heights
(Hamm, 2006). Also common in fear of flying is agoraphobia, a worry about
having a panic attack during the flight (Da Costa, Sardinha, & Nardi, 2008).
Wilhelm and Roth (2001) commented that the DSM-IV (American Psychiatric
Association, 1994) relies only on self-reports, which should be enriched by
physiological measurements, since many anxiety symptoms have plausible
physiological origins.
Ekeberg, Kjeldsen, Greenwood, and Enger (1990) suggested to divide the flight
phobics into three different groups: One group that does not fly at all, one that
restricts flying to an absolute minimum and one that experiences continuous
mild or moderate apprehension of flying but does not avoid it.
More details about the differences of flight phobics regarding sociodemographic
and clinical characteristics are delivered in the study of van Gerwen et al.
(1997). The 419 participants - self-referred patients seeking treatment for fear of
flying - were asked about their flight history and filled in questionnaires about
the kind and extent of fear of flying. Persons with a high generalized flight
anxiety level were probably not included as they did not look for treatment.
Subjects stated fear of crashing followed by claustrophobia, need for control,
acrophobia, and loss of control or social anxiety as main reasons for their fear
of flying. The following typologies of fear of flying were explored: (1) Patients
with a relatively low to intermediate flight anxiety and no panic attack symptoms.
They were under 35 years old and their complaints were not closely related to
16
any other phobic complaint. They were described as being sensitive to sounds
and movements of the plane provoking anxiety. They feared an aircraft accident
and wanted to be in control over the situation. (2) Patients with fear of loss of
control over themselves or with social anxiety. This group consisted mostly of
women, also younger than 35 years. They gave a great deal of attention to the
somatic reactions. (3) Patients with high anxiety regarding airplanes and having
fear of water and/or claustrophobia and agoraphobia. They reported panic
attacks in the anticipation of flights, during flights, and in relation to stimuli in
association with flights. (4) Patients with acrophobia contained more men than
the other subgroups. They showed medium to high flight anxiety and they
wanted to overcome their fear of height experienced in a plane. Van Gerwen et
al. (1997) considered that the detection of those subtypes was supposed to
improve diagnosis and matching treatment.
1.2.6 Treatment of fear of flying
Twenty percent of all flight passengers depend on alcohol or sedatives to
reduce anxiety symptoms during flights (Howard et al., 1983; Botella, Osma,
Garcia-Palacios, Quero, & Baños, 2004). Günther, Haller, and Kinzl (2002)
presume that pharmacological self-medication is rather common as well as
consumption of alcohol to battle the fear, but reliable studies are rare.
One study conducted by Wilhelm and Roth (1997a) showed that the anxiolytic
effect of alprazolam tested in individuals with flight phobia could not be
maintained on the second flight, when individuals had no medication, indeed the
opposite was the case, medication increased physiological activation and had a
negative influence on the therapeutic effects of exposure therapy. Subjects took
1 mg alprazolam 1.5 hours before the first flight, so that the level of plasma
concentration was right at take-off time. As the delayed drug effect was also of
interest, one week later the subjects were tested without having taken any
medication. The authors discussed that one reason for the inefficiency of
medication might have been that only fully triggered emotions can be modified
(Foa & Kozak, 1986) and that anxiolytics may only stop propositional fear
networks.
17
Van Gerwen et al. (2004) pointed out that treatment of fear of flying has very
good prognoses. Based on their review of treatment programs offered
worldwide, several methods and programs were confirmed to be effective. Most
flight programs work without medication (van Gerwen et al., 2004). This is also
the case in the program of Austrian Airlines, which is the basis for the present
study.
Referring to Wilhelm and Roth (1998), a truly successful treatment will be
comprehensive in effects when modifying all three emotional response systems
namely cognition, behavior, and physiology. For an efficient treatment of anxiety
the underlying fear associated with the phobic stimulus needs to be delineated
(Kormos, 2003).
Wilhelm and Roth (1997b) pointed out that treatment of flight phobias requires
the exposure to the external stimuli, for both people with panic disorder and
people without panic disorder. According to Peñate, Pitt, Bethencourt, Fuente,
and Gracia (2008) the aim in treating phobias is the reprocessing of information
derived from the phobic stimuli in an adaptive way, which also demands
exposure-based treatment. In-vivo exposure is superior to imagination
especially in treatment of specific phobias (Reinecker, 1993). In-vivo exposure
as part of the cognitive behavior therapy as well as the recent concepts of
virtual reality therapy (Anderson, Jacobs, & Rothbaum, 2004) are based on the
emotional processing theory (Foa & Kozak, 1986; Foa, Steketee, & Rothbaum,
1989). The theory points out that in order to cope with a fear the fear structure
needs to be activated and corrective information incompatible with the
pathological elements of the fear structure must be available. Foa and Kozak
(1998) mentioned three indicators to be relevant for a successful treatment
outcome, (1) activation of fear structure, (2) within-session decrease in fear, and
(3) across-session fear reduction.
When studying fear or anxiety and its treatment, it is indispensable to consider
physiological changes in response to fear (Birbaumer, 1973; Hamm, 1997;
Lang, 1971) in order to show the extent and effectiveness of treatment.
Particularly the wide approach of analyzing heart rate variability (HRV) derived
18
from electrocardiogram measures provides insight into the neural regulation of
the ANS. The neural regulation of the ANS is effected through the interaction
between sympathetic and parasympathetic activity (Sztajzel, 2004). HRV gives
information about the autonomic flexibility and represents the capacity of
emotional responding (Appelhans & Luecken, 2006), a solid approach to study
physiological response during fear. Up to now there is lack of such studies
illuminating fear of flying.
1.2.7 Treatment programs and efficacy
Already at the first international fear of flying conference (1996) in Tarrytown,
NY, participants concluded that the cognitive-behavioral group treatment
(CBGT) program could serve as a model for fear of flying treatment (Fodor,
1996), which was confirmed by a controlled study (van Gerwen, Spinhoven, &
van Dyck, 2006). Van Gerwen and Diekstra reviewed 15 comprehensive
programs for treating fear of flying (2000). However, the components which
work best were not clarified. Tortella-Feliu and Rivas (2001) concluded that little
is known which particular treatment program is most efficient. Following the
second international conference on fear of flying treatment held under the
auspices of Austrian Airlines in Vienna in the year 2000 - “Airborne 2000” - van
Gerwen et al. (2004) made an update of the first review. They approached 162
airlines and treatment facilities around the world asking them for information on
their treatment programs of fear of flying, 36 treatment facilities delivered valid
information. Van Gerwen et al. (2004) compiled a table presenting the
information they got from the different facilities. This table showed (a) the
number of patients treated annually, (b) the use of pre-treatment diagnostic
evaluation, (c) whether the treatments were held in a group or individually, (d)
the availability of a treatment manual, (e) the use of efficacy measures with
follow-up, and (f) the availability of written and audio material. Most facilities
used multicomponent treatment programs, including diagnostic assessment,
individual preparation sessions, behavioral group treatments, cognitive
behavioral group treatment, and a follow-up session after treatment (van
Gerwen et al., 2004). Based on statements of experts participating at the
19
“Airborne 2000” in Vienna golden rules as guidelines for patients and for
therapists were concluded (van Gerwen et al., 2004). Experts also called for a
proper diagnostical screening for all standard treatment facilities (Bor & van
Gerwen, 2003).
The following studies demonstrate the efficacy of treating fear of flying with
behavior therapy or cognitive behavior therapy:
Beckham, Vrana, May, Gustafson, and Smith (1990) showed that behavior
therapy is successful in treating fear of flying. In 2002 van Gerwen et al.
compared two treatment programs, cognitive behavioral group treatment
(CBGT) and behavioral group treatment (BGT), based on Bandura’s belief in
the “self-efficacy” theory with the result that for 715 patients both programs
proved to be effective. Treatment components included relaxation, stress
management, a coping and distraction component, and/or cognitive techniques,
information, and an exposure in the field, usually a test flight, which is
sometimes preceded by an exposition in a flight simulator before the actual
flight takes place (van Gerwen et al., 2002). Another randomized controlled
study with 150 participants demonstrated the long-term efficacy of these two
treatment programs (van Gerwen et al., 2006).
Evidence for the long-term benefit of a cognitive behavioral treatment for fear of
flying has been provided by Anderson et al. (2006). The treatment included
either standard exposure (SE) or virtual reality exposure (VRE). The
sustainability after a significant fear-relevant event, based on the data relying to
flying behavior and anxiety of 55 subjects collected nine months after the
terrorist attacks of 9/11 was proven, too (Anderson et al., 2006). In addition to
that, Kim, Palin, Anderson, Edwards, Lindner, and Rothbaum (2008) focused on
long-term effects of the cognitive behavior therapy (CBT) regarding the use of
skills learned in the cognitive behavioral therapy. The benefit of this therapy was
demonstrated on the participants in comparison with a control group.
Nousi et al. (2008) were interested in the relation between the flying histories of
persons with fear of flying and treatment of fear of flying. They investigated 174
20
people who had never flown before, 1712 people who had flown before and
reported uneventful flights, and 115 people who had flown before and
experienced eventful or even traumatic flights. Regardless of the nature of fear
of flying, both treatment conditions, one-day behavioral group treatment and
two-day cognitive behavioral group treatment, were effective in decreasing
symptoms measured with the following standardized questionnaires: the Flight
Anxiety Situations (FAS) questionnaire (van Gerwen, Spinhoven, van Dyck, &
Diekstra, 1999), the Flight Anxiety Modality (FAM) questionnaire (van Gerwen
et al., 1999) and the Visual Analogue Flight Anxiety Scale-VAFAS (van Gerwen
et al., 1999). Those persons who had never flown before profited more than
those who had experienced an eventful or traumatic flight.
1.2.8 Virtual reality exposure treatment
The treatment efficacy of fear of flying with virtual reality exposure is not as
undisputed as real exposure therapy. The methods’ advantages and
disadvantages are described in the following.
The review of Da Costa et al. (2008) showed that virtual reality is an important
technique to be used in treatment programs of fear of flying, although the
methodological differences in studies prevent a definitive conclusion about the
effectiveness. The virtual reality exposure therapy may be considered as
another form of behavioral therapy; the aim is to induce in-vivo exposure based
on the assumption that a virtual environment could elicit fear and provoke the
anxiety (Krijn, Emmelkamp, Olafsson, & Biemond, 2004). Patients get
confronted in a gradual manner with real anxiety-provoking stimuli. The
technique for immersing participants in the computer generated virtual
environment is described by Krijn et al. (2004). One possibility is a head
mounted display, which is just for individual use. The patient is standing or
sitting in a room wearing the special display with screens inside the glasses and
speakers near the ears. The sight is focused on computer-generated images on
the screens. The other technique in use is the so-called computer automatic
virtual environment, which is a multi user, projection-based virtual reality
system, where patient and therapist are surrounded by computer-generated
21
images on four to six sides and are wearing shutter glasses that lighten and
darken with devices generating a correct perspective view. The patient can
move through the installation. Both techniques use further visual and auditory
stimuli and some body-tracking devices and tactile stimuli (Krinj et al., 2004).
One of the positive aspects of virtual reality exposure treatment is that it
improves the confidence of patients (Krijn et al., 2007), since it may be easier
for people to take the first step to confront their fear of flying in a virtual world.
The graded exposure does not imply an all-or-nothing decision as in-vivo
exposures do (Mühlberger, Herrmann, Wiedemann, Ellgring, & Pauli, 2001).
Compared to standard exposure therapy it provides greater control for the
patient, offering greater convenience, easy repetition of components, and
prolongation of exposure (Anderson et al., 2004).
Virtual reality exposure treatment was approved to be as efficient as traditional
cognitive-behavior treatments ensuring treatment gains for at least one year
(Maltby, Kirsch, Mayers, & Allen, 2002; Mühlberger et al., 2001; Mühlberger,
Wiedemann, & Pauli, 2003; Rothbaum et al., 2006). Even in the long-term, the
treatment efficiency with virtual reality has been proved (Rothbaum, Hodges,
Anderson, Price, & Smith, 2000; Botella et al., 2004). Treatment gains like
reduction of anxiety symptoms as well as the persons’ ability to actually take a
flight could be shown after one year.
Limitations to the positive aspects mentioned above are that studies refer to
small sample sizes, e.g. Botella et al. (2004) included only nine individuals and
three patients dropped out in the assessment phase before starting the
treatment. The small sample size (n=24) applies to the study of Rothbaum et al.
(2002), too. Their study also showed that 73% participants of the virtual reality
exposure training reported in the 12-months follow-up to being more likely to
use medication or alcohol to overcome their anxiety on subsequent flights. In
comparison only 30% participants of the in-vivo exposure group reported that.
The efficacy of virtual reality is unclear as treatment methods compared are
overlapping and little is known about who is likely to benefit from virtual reality
(Rothbaum et al., 2006). In addition, Anderson et al. (2004) and Krinj et al.
22
(2007) pointed out that virtual environment may not match the idiosyncratic fear
of the patient and that for some patients the virtual reality simply does not feel
real enough to elicit any anxiety. Krinj et al. (2007) discuss that patients doubted
that the strategy taken to cope with their fear of flying during virtual reality
exposure could be generalized to real flights and that the cost-effectiveness for
group treatment as stand-alone treatment might even be superior to virtual
reality treatment.
Da Costa et al. (2008) recommend the combination in treatment of virtual reality
exposure elements and cognitive behavior therapy, thus conforming Krinj et al.
(2004). Only when there is more research available that determines the suitable
therapy for the specific types of fear of flying virtual reality exposure therapy
could gain more relevance, in particular for persons with fear of flying who could
rather expose themselves to virtual a reality environment than to an in-vivo
situation.
1.3 Etiology and acquaintance of fear of flying
1.3.1 Etiology on the basis of emotion
In order to describe fear of flying it is necessary to review the theoretical
background about fear and anxiety. Anxiety as well as fear is embedded within
the large field of emotion theories, represented in the historical emotion
concepts. The distinction between anxiety and fear depends on the availability
of an external stimulus. If there is no external stimulus available, anxiety is
described (LeDoux, 1996). Already in the 19th century, William James tried to
find an answer to the nature of human emotions and to the reactions to a
stimulus (James, 1884). In his view a stimulus would cause a reaction, which in
turn causes – via feedback – an emotion. For example, the threat of a bear is a
stimulus which causes tachycardia, a physiological reaction, which is
transmitted to the Central Nervous System. The subsequent specific mode of
sensoric feedback determines the emotion and its specific quality. In James’
theory the emotions are the slaves of physiology (LeDoux, 1996). The James-
Lange theory claims that feelings are side-effects of emotions (Lange, 1887).
23
Cannon (1929) added that the autonomic nervous system reactions are too
slow in order to explain emotions. He describes fear as an emergency reaction,
the fight-and-flight-reaction, which is an adaptive reaction to a threat starting
from the sympathetic nervous system. James and Cannon were concordant that
it is due to somatic reactions that emotions get their specific emotional
perception (LeDoux, 1996).
The cognitive theory of Schachter and Singer in the 1960s added cognitions to
the James-Cannon debate (Schachter & Singer, 1962). Information about the
physical and the emotional environment determines the arousal and specifies
the emotion, which means that emotions arise from the cognitively interpreted
situations. Lazarus and Folkman (1984) showed in their theories that the
appraisal of a situation is the key to the resulting emotion.
1.3.2 Etiology on the basis of personality
Genetic factors were found to have an influence on the individual’s biological
preparedness or vulnerability in acquiring a phobia (Hamm, 1997). The bio-
informational theory of Lang (1979) describes associative networks of the brain
which are generated as soon as sensory inputs fit to the proposed structures of
emotion.
An underlying mechanism of fear of flying could be the individual’s anxiety
sensitivity which moderates the relationship between somatic sensations and
flight anxiety. Typical is the belief that the sensations have threatening somatic,
psychological or social consequences (Reiss, 1997). The presence of somatic
sensation predicts flight anxiety in individuals with high anxiety sensitivity,
whereas this is not the case for individuals with low anxiety sensitivity.
Therefore Bogaerde and De Raedt (2007) concluded that anxiety sensitivity can
be a cognitive vulnerability marker for the acquisition of fear of flying which is
responsible for how a person responds to anxiety related body sensations
Wilhelm and Roth (1997b) list factors that may influence the individual’s
different responsiveness and vulnerability to fear of flying. Factors of relevance
are the extent of trait-anxiety, the specific preparedness for conditioning of the
24
stimulus of flight, life events or unusual stressors occurring at the same time
when the phobia sets up (Menzies & Clarke, 1995), personality traits such as
external locus of control, physiological dysfunction, or misinformation regarding
facts about flying and air travel. The individual’s danger expectancy or an
attentional bias might negatively influence the cognitive processing of
information (Ehlers, Margraf, Davies, & Roth, 1988). McLean (2003) considers
that the individual’s perception of risk and threat contributes to the development
of fear of flying.
1.3.3 Acquaintance through learning and conditioning
Conditioning and learning are listed as pathways to specific phobia, e.g. the
aversive learning experience, learning by model, learning by information, and
lack of learned coping strategies in early childhood (Hamm, 2006). Hamm’s
classification is in line with Rachman (1977). The author distinguished three
pathways how fears can be acquired, (1) conditioning, (2) vicarious exposure,
and (3) the transmission of information and instruction.
1.3.3.1 Conditioning
According to Sigmund Freud’s works and according to the conditioning theories,
LeDoux (1996, p. 253) concludes that anxiety or fear is the result of traumatic
experience. Both external dangers as well as internal dangers are relevant
when setting up a phobia, although half of all persons with phobias are not able
to remember the direct aversive stimulus (Öst, 1987). The classical conditioning
model of phobias gives an explanation why persons react with subjective and
physiological fear when they are exposed to a phobic conditioned stimulus, the
aversive classical conditioning represented by Watson’s and Rayner’s Little
Albert study (Watson & Rayner, 1920) is one example. Mowrer’s two-stage
theory (Mowrer, 1960) gives an explanation for the conditioned avoidance
behavior. The person learns that fear responses to the conditioned stimulus can
be reduced by avoiding it, the reduction in fear levels following the avoidance
reinforces this behavior, and avoidance finally becomes part of the phobia
(Merckelbach, de Jong, Muris, & van Den Hout, 1996). Since traditional
conditioning approach often failed and was therefore criticized in the past, the
25
latter theories were orientated on biology and cognitive modification, e.g. the
stress emotion coping theory (Lazarus, 1993) or the self efficacy theory
(Bandura, 1977).
Wilhelm and Roth (1997b) described that classical conditioning could be
involved in flying phobia in three ways. First, certain stimuli occurring during
flying can be unconditioned stimuli for classical conditioning, they referred to
Watson (1924) when describing the conditioning stimuli like “sudden loss of
support (airplane drops during turbulence), loud noises (take-off), and under
some circumstances pain (middle ear pain form air pressure changes)”.
Second, some situations function as prepared stimuli during a flight and can
easily cause fear response, as for example intense accelerating forces in three
dimensions and tilting (Öhman, 1986; Seligman, 1971). And third, typical
agoraphobic stimuli like cramped quarters and the loss of control can lead to
conditioned avoidance of people with fear of flying. When somebody had had a
panic attack in the past, the panic attack could be a traumatic experience and
function as conditioning effect (McNally & Lukach, 1992). Panic attacks may be
regarded as trigger for a conditioning event, as suggested by Klein (1980).
1.3.3.2 Vicarious exposure
Nousi et al. (2008) pointed out that, besides direct conditioning caused by
external aversive events during flights, there must be other conditioning stimuli
that cause fear of flying. Fears may be transmitted by observation or vicarious
conditioning or by verbal or instructional learning, respectively. This is even
more likely for persons showing higher levels of general anxiety and
agoraphobic avoidance (Nousi et al., 2008).
1.3.3.3 Transmission of information and instruction
Negative media coverage of airline incidents and accidents influence the
prevalence of fear of flying by reinforcing the conviction of people concerned
(McLean, 2003). For those who have never flown before, the transmission of
threatening information seems to be more relevant (Bogaerde & De Raedt,
2007). Kraaij, Garnefski, and van Gerwen (2003) mention the influence of
26
terrorist attacks and plane crashes in general, which might lead to increased
numbers of people with flight anxiety. The media coverage of the terrorist
attacks of September 11, 2001, lead to a decrease of air travel by 10% to 30%
(Rothbaum et al., 2006), however, the prevalence of fear of flying in Germany
was not influenced by the incident, although the interviewed people reported
more often traumatic experiences (Mühlberger, Alpers, & Pauli, 2005).
1.3.4 Studies on etiology and acquaintance of fear of flying
The study of Wilhelm and Roth (1997b) is a pioneer work providing insight into
the etiology and acquaintance of fear of flying. In the study 66 individuals with
fear of flying were split into three fear groups: one group with simple phobia of
flying, one group with fear of flying showing itself as panic disorder with
agoraphobia, and one group with a history of panic disorder, but where the
panic disorder had not occurred during the last six months. To check the
results, a control group without fear of flying was introduced. The purpose was
to see whether characteristics for the individual fear groups can be deducted
from the answers of the questionnaires, with particular focus on the
characteristics for panic disorder. The interviews and clinical questionnaires
revealed that all fear groups were more concerned about external dangers
during the flight, e.g. an airplane crash, than the control group. All fear groups
stated that a life threatening flight experience was a major reason for their fear
of flying. The fear of having a panic attack during a flight was an important
factor for the two panic groups. They were concerned about internal and social
dangers, e.g. bodily discomfort, or criticism by others. Only the group with
simple phobia rated that the fear of heights contributed to their fear of flying. For
the acquaintance of fear media information was irrelevant for the fear groups.
However, the control group assumed that media information would be a
significant factor for acquiring fear of flying.
Nousi et al. (2008) intended to deliver a representative study in contrast to
Wilhelm and Roth (1997b). The subjects of that study differed from the subjects
of the study of Wilhelm and Roth (1997b) by having experienced external
conditioning. The authors concluded that fears might have been socially
27
transmitted by observational or vicarious conditioning. The higher amount of
verbal and media information and instructional learning were consistent with
higher levels of general anxiety and agoraphobic avoidance behavior.
1.4 Biological processes in anxiety
One can conclude that the biological aspect of anxiety is related to
neuroanatomical structures of the brain as well as to neurotransmitter
processes as described e.g. by Bandelow (2001), Hamm (1997), and LeDoux,
(2000).
Brain areas involved in anxiety are in particular the brain stem, thalamus, the
hypothalamus, and cortical regions. A part of the limbic system, the amygdala,
plays a key role in connection with learned fears. Stimulation of the amygdala is
known to elicit fear and anxiety-like states and sympatho-excitatory effects
(Berntson, Sarter, & Cacioppo, 1998). Another part of the limbic system, the
hippocampus, is responsible for the declarative memories (Lovallo, 2005).
These memories are related to facts and context related to the fear (Phillips &
LeDoux, 1992; Berntson, Sarter, & Cacioppo, 2003). The hypothalamus is the
most important relay between neurons and the endocrine system. During stress
the projections from the central nucleus of the amygdala to the nucleus
paraventricularis of the hypothalamus cause the endocrinologic reaction and
release of stress hormones (LeDoux, 1996).
The nucleus locus coeruleus, part of the formatio reticularis, contains
epinephrine fibres which are responsible for the global arousal system in the
brain. Epinephrine fibres are highly aroused during fight-or-flight states (Lovallo,
2005).
According to Thayer and Lane (2000) a network of distributed brain areas is
responsible for the regulation of emotion. The central autonomic network (CAN)
controls visceromotor, neuroendocrine, and behavioral responses. The CAN is
seen as command center governing cognitive, behavioral, and physiological
elements that characterize emotions. The CAN includes the cortical regions:
medial prefrontal and insular cortices, limbic regions (anterior cingulate cortex,
28
hypothalamus, central nucleus of the amygdala, bed nucleus of the stria
terminalis), and brainstem regions (periaquaductal gray matter, ventrolateral
medulla, parabrachial nucleus, nucleus of the solitary tract). The CAN regulates
autonomic influences on the heart rate (Appelhans & Luecken, 2006).
Ascending visceral information of vagal afferents has an impact on cognitive
processing and behavior as well. Both noradrenergic and cholinergic routes
transmit the visceral information, involving a network of aminergic nuclei. The
nucleus tractus solitarius (NTS) serves as the first visceral relay station in the
brainstem, from there direct projections lead to the forebrain areas as the
amygdala and the basal forebrain cortical cholinergic system (Berntson et al.,
2003). The basal forebrain cholinergic system has been considered to play a
crucial role between cortical processing substrates which are likely to be
involved in the cognitive aspects of anxiety, and subcortical systems involved in
anxiety and autonomic regulation (Bernston et al., 1998). Cortical–cognitive
processing mechanisms are capable of inducing fear and anxiety in the
absence of the relevant environmental fear stimulus (Berntson et al., 1998).
LeDoux (2000) explains the cortical processes related to fear as follows. An
emotional stimulus activates the sensory thalamus, and a short connection
directly to the amygdala evokes emotional response, whereas the hippocampus
is responsible for the fear-related memories. The cognitive processing via the
sensory cortex, the long route, determines the severity and appraisal of fear
reaction.
1.4.1 Autonomic nervous system and anxiety
The autonomic nervous system (ANS) controls the vital organs by way of three
anatomically and functionally distinct branches: the sympathetic nervous system
(SNS), the parasympathetic nervous system (PNS), and the enteric nervous
system (ENS) (Lovallo, 2005). The SNS is considered to have an excitatory
role, whereas the PNS is described by an inhibitory function. SNS and PNS
often interact antagonistically to produce varying degrees of physiological
29
arousal (Appelhans & Luecken, 2006). The ENS is controlled by the SNS and
the PNS (Lovallo, 2005).
Actions of the ANS are considered to be without conscious awareness or
voluntary control in contrast to those of the sensory-somatic system. The ANS
regulates individual organ functions like the function of the cardiac muscle,
glands, and smooth muscles such as those of the digestive system, respiratory
system, and skin. The ANS is responsible for a constant inner milieu in
response to environmental changes or varying metabolic conditions (Birbaumer,
1973).
During physical or psychological stress, activity of the SNS becomes dominant
with the aim of adapting to the challenge, which is characterized e.g. by
increased pulse or heart rate. The PNS is characterized by a lower degree of
physiological arousal resulting in a decreased heart rate, it is dominant during
periods of relative safety and stability (Appelhans & Luecken, 2006).
Anxiety and the ANS are closely related to each other (Kelly, Brown, & Schaffer,
1970; Thayer, Friedman, & Borkovec, 1996). “Anxiety can be conceptualized as
a biological warning system that prepares the body to react mentally and
physically to potentially dangerous situations. To be able to respond to the
threatening situation, the body prepares itself for fight or flight.” (Hoehn-Saric &
McLeod, 2000, p, 217). The autonomic stimulations during anxiety are similar to
those during severe stress situations as for instance the reactivity during
parachute jumping (Ursin, 1978, cited in Hoehn-Saric & McLeod, 2000).
Moderate anxiety was found to be useful as reaction to become vigilant and to
produce motivating coping behavior, but severe anxiety may provoke
counterproductive reactions (Hoehn-Saric & McLeod, 2000). Anxiety is
generally associated with a variety of somatic symptom patterns, primarily
reflecting autonomic nervous system activity. Anxiety can be defined, just like
stress, as a state of helplessness accompanied by strong physiological or
somatic reactions (Lovallo, 2005). Anxiety and fear are emotions that are
associated with fight-or-flight response (Lovallo, 2005). The ANS depends on
30
emotions that humans experience while interacting with their environment
resulting in varying degrees of physiological arousal (Appelhans & Luecken,
2006) while autonomic rigidity reduces the possibility to respond flexibly to
changes in the environment and is considered a deficit.
Birbaumer (1973) described the close relation between the level of fear and the
autonomic arousal with an interaction-stress-stereotypy and concluded that any
method aimed at reducing anxiety involves the learning of a middle arousal
level for both subjective and physiological arousals. Dimensions of valence
(aversive versus appetitive) and arousal represent the control parameters that
guide the organization of emotional response through physiological, cognitive,
and behavioral subsystems (Appelhans & Luecken, 2006).
The following paragraphs address parameters which are used to measure the
autonomic response in combination with fear of flying. Heart rate variability
(HRV) is supposed to be ideal for the insight into the autonomic functioning of
the nervous system (Appelhans & Luecken, 2006; Parati & Mancia, 2006; Stein
& Kleiger, 1999).
1.4.2 Heart rate variability
The analysis of heart rate variability (HRV) allows insight into the autonomic
nervous system – which is of specific interest in anxiety research – by
distinguishing sympathetic versus parasympathetic (vagal) activation. HRV is
supposed to be a dynamic marker of load due to its responsiveness and
sensitivity to acute stress (Berntson et al., 1997), which is important for flexible
adaptation of the organism to changing environmental demands. Hence HRV is
a measure of autonomic homeostasis and adaptability. “Research and theory
support the utility of HRV as a noninvasive, objective index of the brain’s ability
to organize regulated emotional responses through the ANS and as a marker of
individual difference in emotion regulatory capacity.” (Appelhans & Luecken,
2006, p. 237).
Thayer and Lane (2000) summarized that HRV serves to quantify the ability of
self-regulation, since cardiac variability may be related to both attentional and
31
affective processes. Non-observable alterations in HRV – like inflexibility – give
information about cardiovascular risk or disease (Friedman & Thayer, 1998a;
Friedman et al., 1993; Horsten et al., 1999; McCraty, Atkinson, Tomasino, &
Stuppy, 2001; Piccirillo et al., 1997; van Ravenswaaij-Arts, Kollee, Hopman,
Stoelinga, & van Geijn, 1993). High vagal tone promotes greater flexibility and
adaptability to a changing environment, while low vagal tone is associated with
poor self-regulation. A consistently depressed vagal tone reflects poor
homeostasis and causes neurophysiological vulnerability to the deleterious
effects of stress (Friedman, 2007).
Appelhans and Luecken (2006) list two main factors which influence HRV in
particular: Firstly, they mention the influence of the ANS on cardiac activity. The
sympathetic and parasympathetic branches of the ANS innervate the heart and
have a regulatory influence on the heart rate (HR) by influencing the activity of
the sinoatrial node. The sinoatrial node generates action potentials that
characterize a heartbeat. The two autonomic branches regulate the lengths of
time between consecutive heartbeats, also called the interbeat intervals. Faster
heart rates are related to shorter interbeat intervals and vice versa. Sympathetic
influence on cardiac functioning is slower than parasympathetic influence; it is
mediated by the neurotransmission of norepinephrine. A change in heart rate
due to sympathetic activation has its peak effect after 4 s with a return to
baseline after 20 s. Parasympathetic influence is mediated by the
neurotransmitter acetylcholine and has a short latency of response. A change in
heart rate due to parasympathetic activation has been observed already after
0.5 s with peak effect and a return to baseline within 1 s (Appelhans and
Luecken, 2006). The other factor influencing HRV is the CAN, a network of
central autonomic brain areas as mentioned in chapter 1.4. The CAN reflects an
individual’s capacity in generating regulated physiological responses in the
context of an emotional expression (Thayer et al., 1996; Thayer & Lane, 2000).
Studies and clinical data indicate that decreased HRV is a predictor for cardiac
and/or arrhythmic diseases or at least a risk factor (Sztajzel, 2004). Low HRV is
generally described as pathological in many studies and as a predictor for heart
32
disease or even increased risk for sudden death (Anderson et al., 2006; Ori,
Monir, Weiss, Sayhouni, & Singer, 1992; Terathongkum & Pickler, 2004).
“Decreased HRV could then be conceptualized as a lack of ability to respond by
physiological variability and complexity, making the individual physiologically
rigid and, therefore, more vulnerable.” (Horsten et al., 1999, p. 50) For
MacArthur and MacArthur (2000) decreased HRV is associated with stress,
anxiety, and panic disorder.
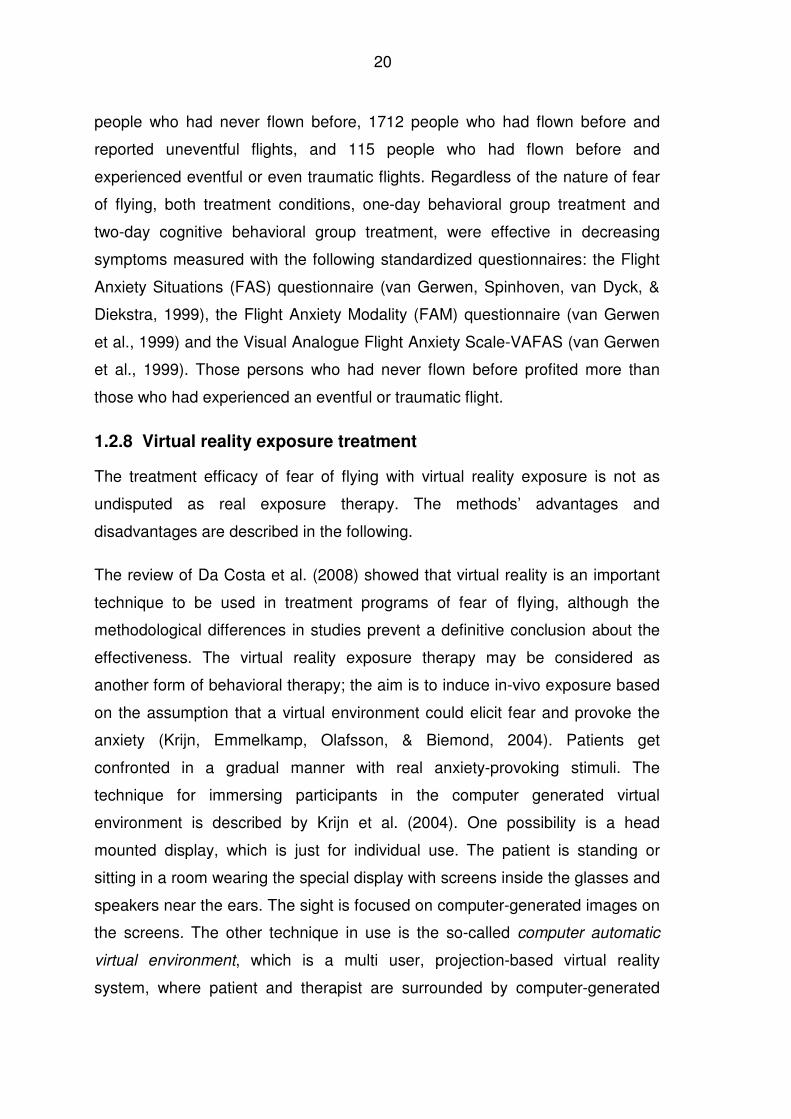
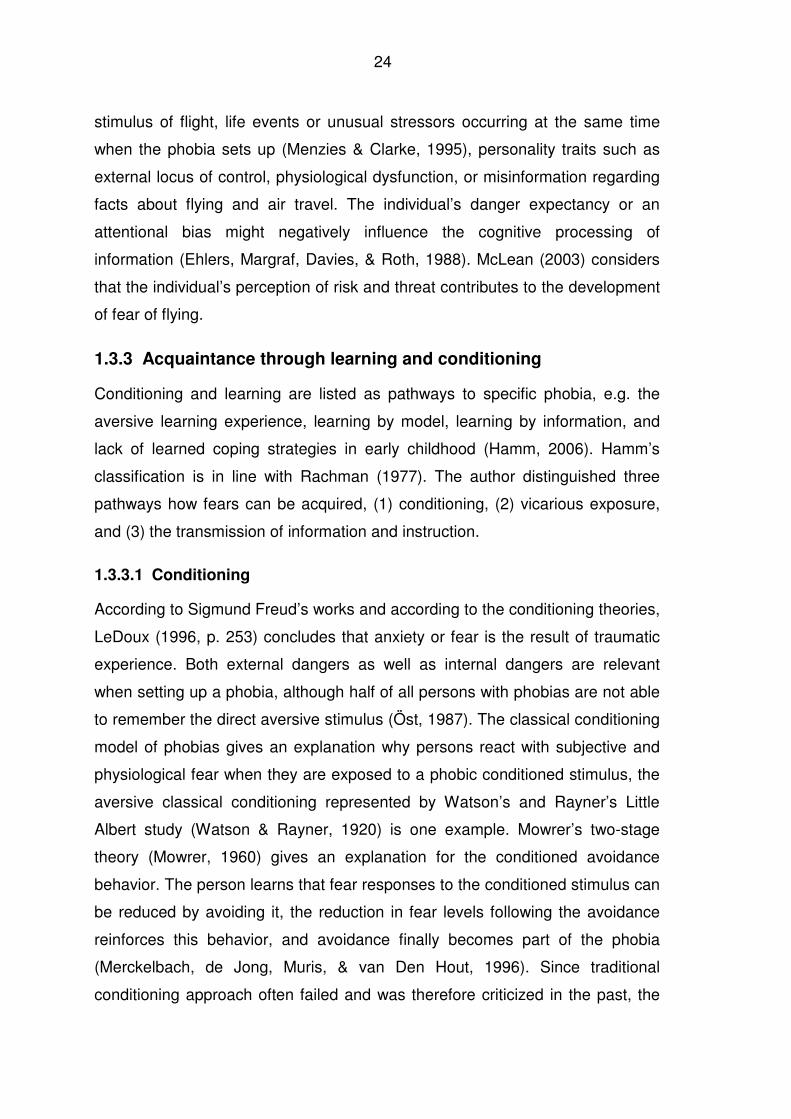
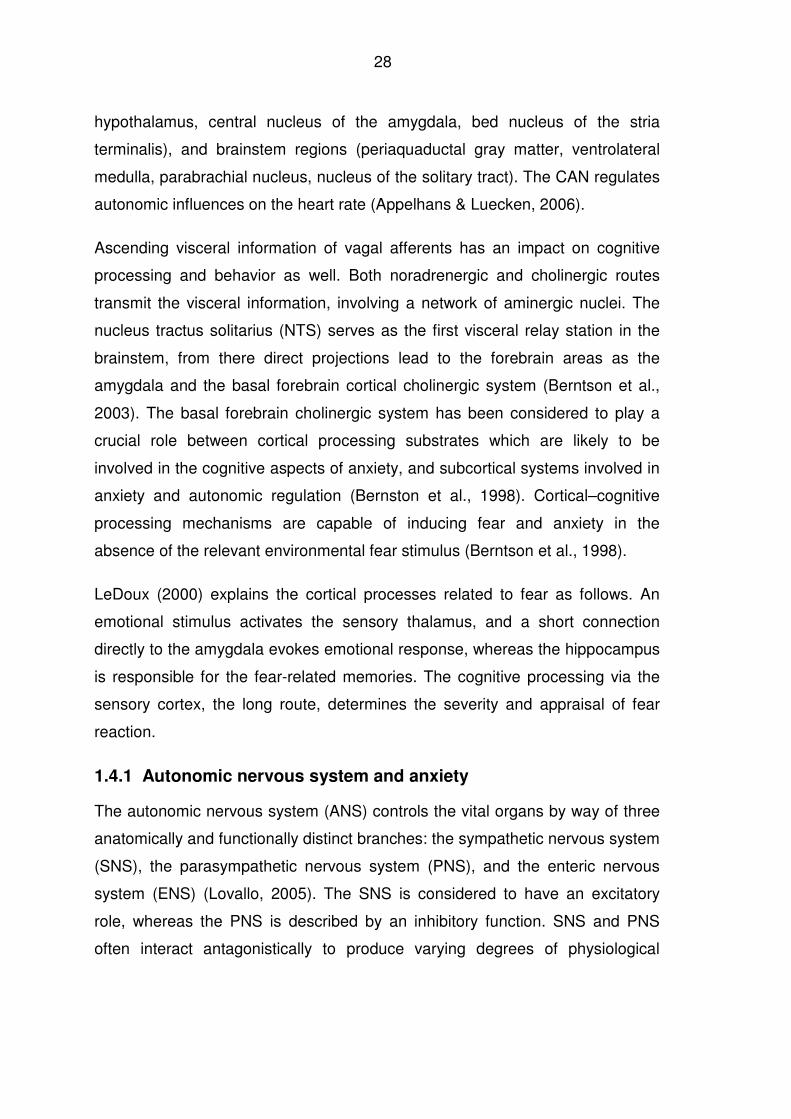
1.4.3 Assessment and calculation of HRV
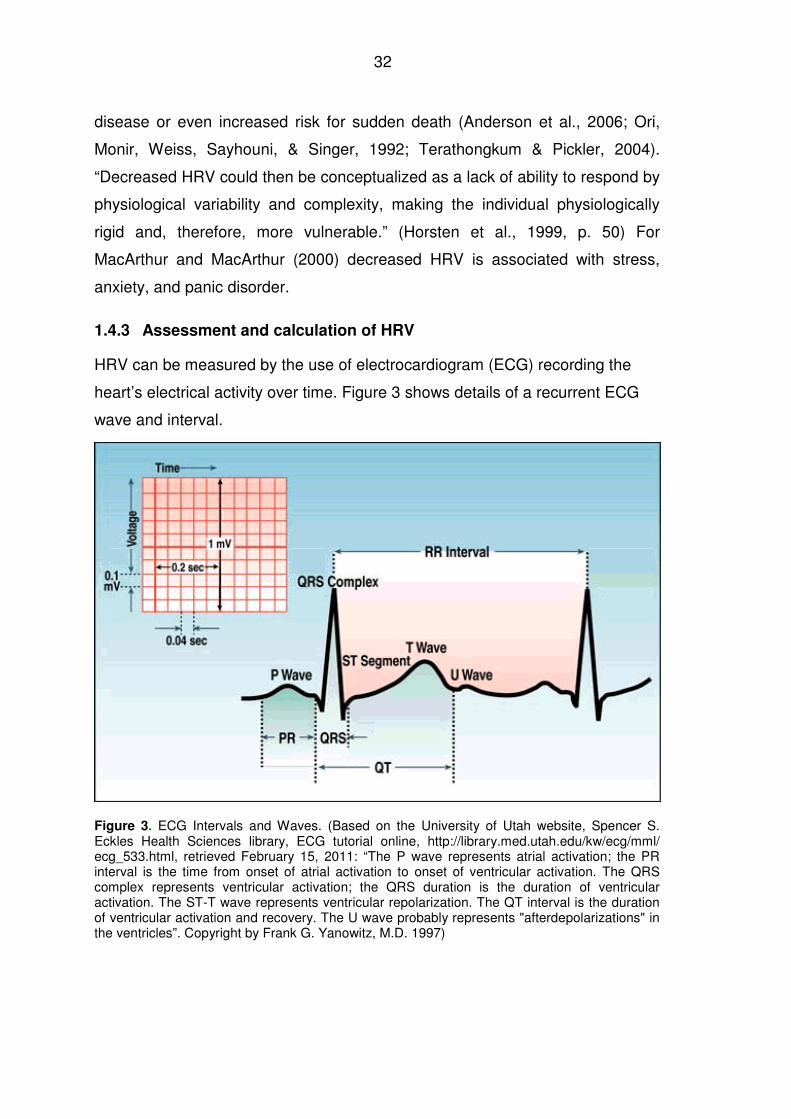
HRV can be measured by the use of electrocardiogram (ECG) recording the
heart’s electrical activity over time. Figure 3 shows details of a recurrent ECG
wave and interval.
Figure 3. ECG Intervals and Waves. (Based on the University of Utah website, Spencer S. Eckles Health Sciences library, ECG tutorial online, http://library.med.utah.edu/kw/ecg/mml/ ecg_533.html, retrieved February 15, 2011: “The P wave represents atrial activation; the PR interval is the time from onset of atrial activation to onset of ventricular activation. The QRS complex represents ventricular activation; the QRS duration is the duration of ventricular activation. The ST-T wave represents ventricular repolarization. The QT interval is the duration of ventricular activation and recovery. The U wave probably represents "afterdepolarizations" in the ventricles”. Copyright by Frank G. Yanowitz, M.D. 1997)
33
The Task Force of the European Society of Cardiology and the North American
Society of Pacing and Electrophysiology issued guidelines referring to
measurement methods, analysis, interpretation, and clinical use of ECG
recordings (Task Force, 1996). This Task Force differentiates between time
domain and frequency domain analyses indicating the most frequently
employed methods when analyzing HRV. Time domain measures refer to the
determination of instantaneous HR and the time between two consecutive R-
waves of the QRS complex. This time is called RR interval or NN interval
(normal to normal). The following selected time domain indices are described by
Task Force (1996). The standard deviation of the normal to normal (SDNN)
intervals reflecting all the cyclic components responsible for the variability
during the period of recording. SDNN encompasses both short-term and long-
term variations in milliseconds (ms). The comparison of adjacent cycle lengths
are reflected by the square root of mean squared differences (RMSSD) of
successive normal to normal intervals and the proportion derived by dividing NN
intervals greater than 50 ms by the total number of NN intervals (pNN50).
RMSSD and pNN50 are thought to reflect short-term variations and estimate
high frequency variations in heart rate, indicating vagal modulation, and are
thought to be highly correlated (Kleiger et al., 1991; Malik, 1998; Task Force,
1996).
Frequency domain methods refer to the power spectral density providing
information on how power distributes as a function of frequency (Task Force,
1996). Differences in latencies of action, i.e. the oscillations of the HR produced
by sympathetic and parasympathetic activation occurring at different speeds or
frequencies, are the basis for the frequency based HRV analyses. The unit for
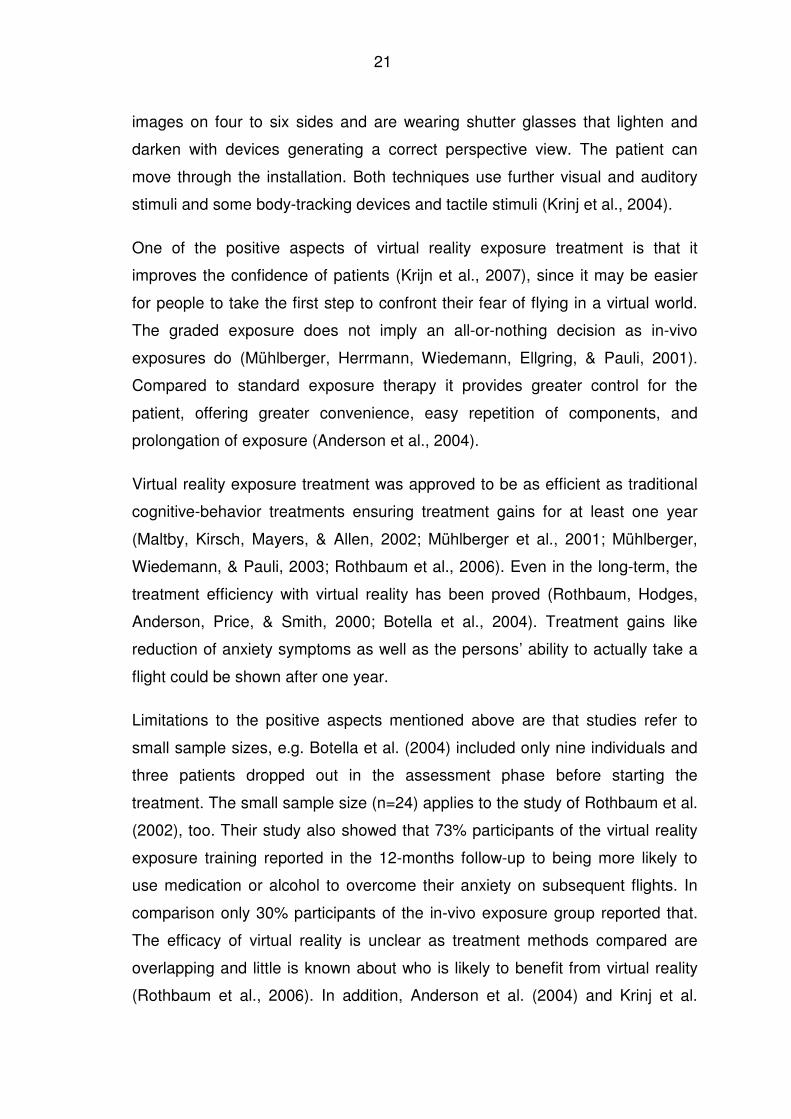
power is ms2/Hz. Power spectral analysis can be performed by nonparametric
methods like the fast Fourier transform or by parametric methods like the
autoregressive approach (Malliani, Pagani, & Lombardi, 1994; Mainardi,
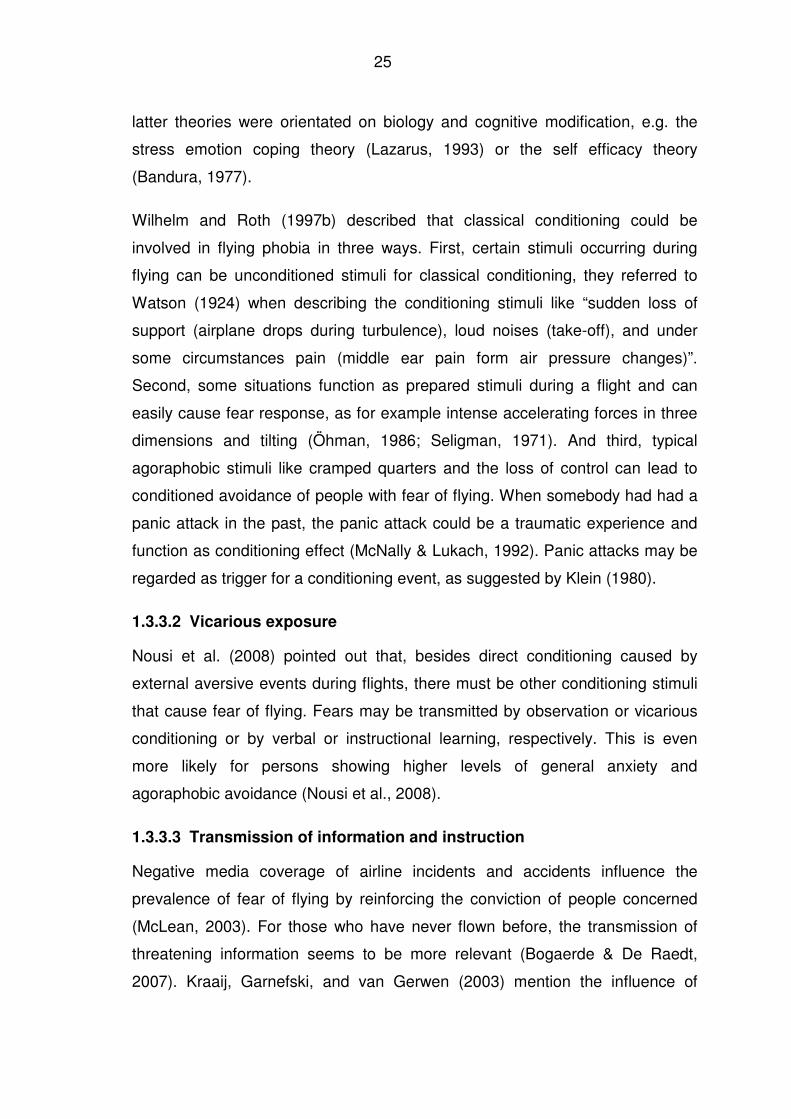
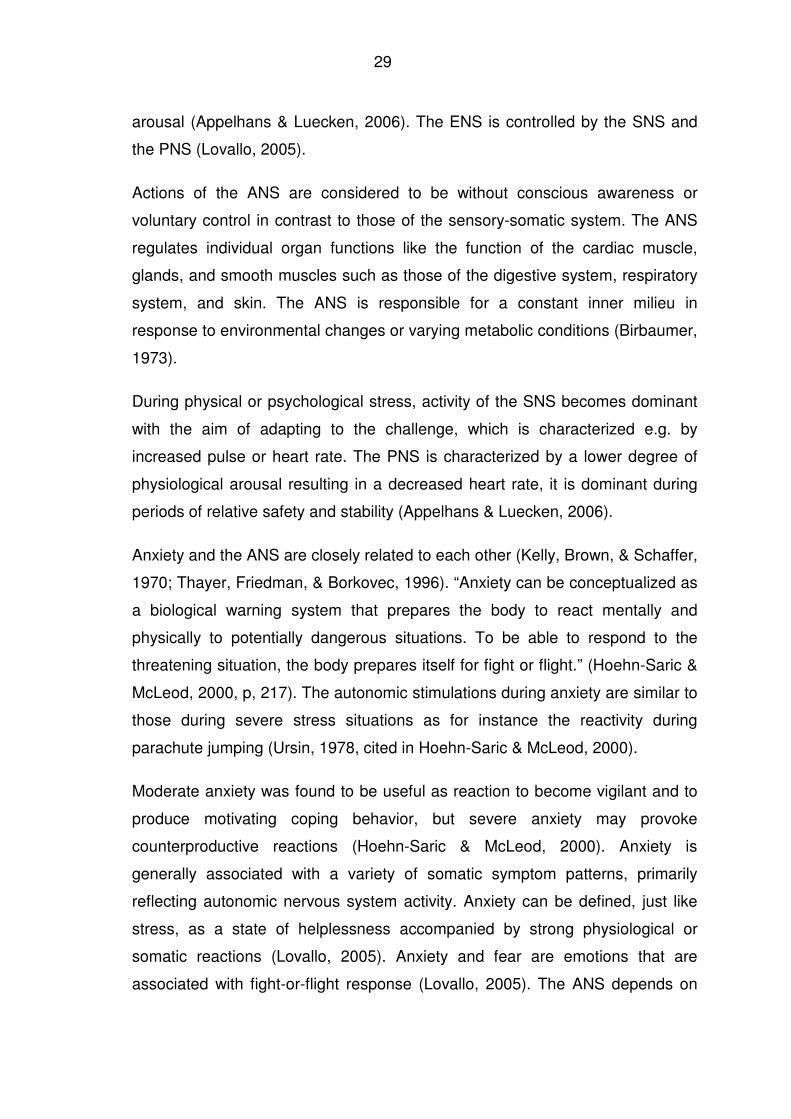
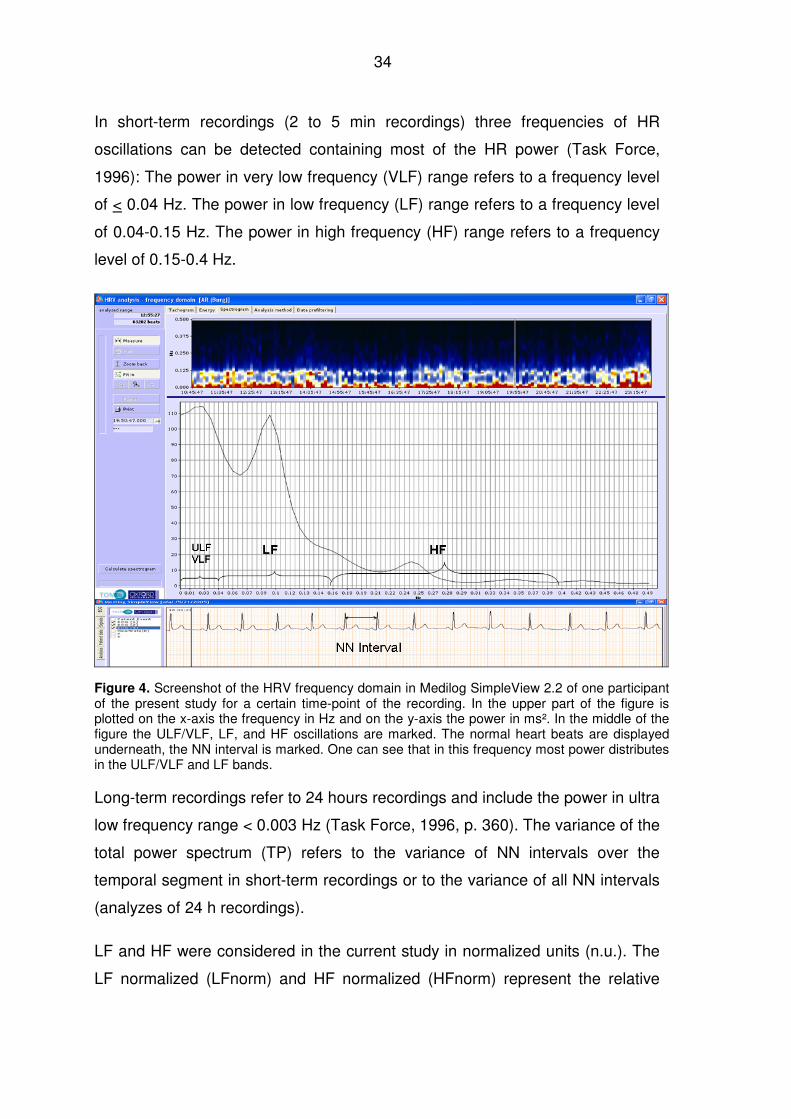
Bianchi, & Cerutti, 2002). Figure 4 depicts a frequency analyze by Medilog
SimpleView program.
34
In short-term recordings (2 to 5 min recordings) three frequencies of HR
oscillations can be detected containing most of the HR power (Task Force,
1996): The power in very low frequency (VLF) range refers to a frequency level
of < 0.04 Hz. The power in low frequency (LF) range refers to a frequency level
of 0.04-0.15 Hz. The power in high frequency (HF) range refers to a frequency
level of 0.15-0.4 Hz.
Figure 4. Screenshot of the HRV frequency domain in Medilog SimpleView 2.2 of one participant of the present study for a certain time-point of the recording. In the upper part of the figure is plotted on the x-axis the frequency in Hz and on the y-axis the power in ms². In the middle of the figure the ULF/VLF, LF, and HF oscillations are marked. The normal heart beats are displayed underneath, the NN interval is marked. One can see that in this frequency most power distributes in the ULF/VLF and LF bands.
Long-term recordings refer to 24 hours recordings and include the power in ultra
low frequency range < 0.003 Hz (Task Force, 1996, p. 360). The variance of the
total power spectrum (TP) refers to the variance of NN intervals over the
temporal segment in short-term recordings or to the variance of all NN intervals
(analyzes of 24 h recordings).
LF and HF were considered in the current study in normalized units (n.u.). The
LF normalized (LFnorm) and HF normalized (HFnorm) represent the relative
35
value of each power component in proportion to the total power minus the VLF
component (Pagani et al., 1986; Malliani, Pagani, Lombardi, & Cerutti, 1991).
The formula for LFnorm is LF/(Total Power-VLF) × 100 and for HFnorm
HF/(Total Power-VLF) × 100 (Task Force, 1996).
HF is considered to be modulated by the parasympathetic (vagal) branch of the
ANS (Horsten et al., 1999; Pagani et al., 1986). The so called respiratory sinus
arrhythmia (RSA) is considered to be a major contributor to the HF component
of HR, it ranges normally from 0.15 Hz to 0.4 Hz and is considered as index of
cardiac parasympathetic control (Acharya, Kannathal, Sing, Ping, & Chua,
2004; Appelhans & Luecken, 2006; Berntson, Cacioppo & Quigley., 1993a;
Grossman, Wilhelm, & Spoerle, 2004).
The interpretation of LF band is more controversial (Task Force, 1996). LF,
especially when expressed in normalized units, is supposed to represent
sympathetic modulation (Malliani et al., 1991; Montano et al., 1984)., others
consider LF to be influenced by the sympathetic and the parasympathetic
system (Akselrod et al., 1985; Pagani et al., 1986).
The LF/HF ratio is discussed to be an index of the sympathovagal balance
(Malliani et al., 1991), but this is questioned by Eckberg (1997).
1.4.4 Stress and HRV
The relation between stress and cardiovascular response is similar to the
relation between anxiety and autonomic response (Lovallo, 2005). The cardiac
response pattern of stress depends on the severity of the stressors. During
severe levels of stress, sympathetic influences totally override vagal activation.
During moderate stress, however, vagal and sympathetic tone interact
antagonistically (Hoehn-Saric & McLeod, 2000). The HR, increased by
moderate stressors, can be reduced by vagal stimulation caused by slowed
breathing (Grossman, 1983). This fact is of interest when focusing the
autonomic response pattern related to flight anxiety.
36
Stress-related alterations of the cardiac response pattern were shown in the
study of Hjortskov et al. (2004). Twelve females were exposed to work-related
mental stressors at the computer and consequently their parasympathetic
activity decreased, whereas the sympathetic activity increased. The study of
Ottaviani, Shapiro, Davydov, and Goldstein (2008) showed that different
stressors evoke specific patterns of cardiac autonomic activity. In a laboratory
study, 16 males and 29 females were exposed to stressors, such as a handgrip
exercise, a mirror-tracing task, a computerized logical-mathematical task, and a
rumination task, in order to find out the response patterns. ECG was recorded
and blood pressure was taken. An increase of sympathetic activation and a
decrease of parasympathetic activation were related to active coping
processes, as observed during the logical-mathematical task. Passive coping
however evokes an increase in both, sympathetic and parasympathetic
activation, as observed during the mirror-tracing and the handgrip exercise.
Rumination, a mixed-adrenergic task, evoked a mixed pattern of responses.
The SNS and PNS response of individuals were more stable during recovery,
suggesting a link between the autonomic profile of an individual and ambulatory
HRV.
1.4.5 Cortisol release
Acute psychological stress in humans leads to a cascade of hormonal changes
regulated by the hypothalamic-pituitary- adrenocortical (HPA) axis. As frequent
consequence to this, an increase in cortisol is measured (Alpers, Abelson,
Wilhelm, & Roth, 2003). The investigation of Bandelow et al. (2000) suggested
augmented cortisol levels in subjects during acute panic attacks especially in a
naturalistic settings which was not evidenced by provoking the panic attack in a
laboratory setting. Other studies related to HPA regulation and anxiety disorders
have produced mixed results. For example, the effect size for cortisol was low
compared to HR in phobic anxiety (Nesse et al., 1985), where phobic anxiety
was the stressor. A relationship between change of cortisol levels and stress
indices was shown with the study of Vedhara et al. (2003), provocation of stress
37
has also been found being related to increased cortisol levels in normal
individuals (Kirschbaum, Scherer, & Strasburger, 1994).
The reason for the increase of cortisol concentration during panic attacks might
be the additional experience of stress, or the dysregulation of the HPA axis
function (Bandelow et al., 2000). Fear of flying as stressful event for those who
suffer from it may be accompanied by increased cortisol level in order to help
the body to adapt to the stress. Till now cortisol has not been considered in
studies regarding fear of flying.
1.5 Response patterns
1.5.1 Anxiety and physiological response patterns in general
Historically, anxiety research has focused on sympathetic activation and has
rather neglected parasympathetic information (Roth et al., 1986). The heart rate
(HR) is considered as a good indicator for anxiety (Nesse et al., 1985; Roth et
al., 1986; Wilhelm & Roth, 1998). The cardiac vagal tone is seen as dominating
the heart rate (Stein & Kleiger, 1999), and it is supposed to function as an
arousal and emotional index (Porges, 1995). High vagal tone is linked to high
heart rate variability (Malliani et al., 1994; Stein & Asmundson, 1994), which
provides flexibility and adaptability to meet environmental demands necessary
for health (Berntson, Norman, Hawkley, & Cacioppo, 2008a; McEwen &
Wingfield, 2003).
Autonomic response patterns are related to the situational response specificity
and the individual response specificity of a person (Blechert, Lajtman, Michael,
Margraf, & Wilhelm, 2006). In his review on heart rate variability, cardiac vagal
tone, and their relation to anxiety Friedman (2007) summarized that anxiety
disorders may be characterized by decreased vagally mediated HRV and/or by
decreased chaotic dynamics.
1.5.1.1 Chronic anxiety
There are some characteristic autonomic response patterns of individuals with
chronic anxiety disorder or with high scores of trait-anxiety, and also an
38
association to biological dysfunctions. Individuals suffering from fear of flying
may show comparable patterns, considering the heterogeneity of the disorder,
as already shown by van Gerwen et al. (2004) and Wilhelm and Roth (1997b).
Piccirillo et al. (1997) examined whether chronic anxiety is associated with
biological dysfunction expressed by sympathetic hyperarousal or
parasympathetic decrease. Three groups, a control group of 36 individuals
having no anxiety symptoms, 36 individuals with a single anxiety symptom, and
49 individuals with two or more anxiety symptoms were compared in a
laboratory investigation with ECG recordings in supine and tilt positions. The
study showed that there were already differences in the baseline between
individuals with anxiety and the control group. Individuals with two or more
anxiety symptoms had lower resting HRV, higher LF/HF ratio, and lower values
for all frequency domain measures than those in the control group. Stress (tilt)
did not cause further increase of sympathetic activity for anxious people. That is
in contrast to parasympathetic activity, which has altered in reaction to tilt. Tilt
induced decrease in total power of heart rate frequency, in very low frequency
and high frequency in the control group and in very anxious individuals. Tilt
caused an increase in LF/HF ratio only in the control group.
Hoehn-Saric and McLeod (2000) pointed out that the majority of individuals with
chronic anxiety under non-specific laboratory stress showed rigid and less
efficient autonomic responses but no autonomic hyperarousal. Patients showed
a strong physiological response in comparison to a control group only when
exposed to the specific stimuli that corresponded to the pathological fear.
The relation between reduced vagal control and the level of trait-anxiety was
shown by Watkins, Grossman, Krishnan, and Sherwood (1998). ECG
recordings were taken from 93 healthy individuals lying in a supine position.
Results indicated that trait-anxiety was negatively correlated with baroreflex
control of heart rate. People with high levels of trait-anxiety showed reduced
vagal control indicated by respiratory sinus arrhythmia. Anxiety and vagal
control of HR differentiated between individuals with low or high trait-anxiety.
39
Vagal control of HR was significantly lower in individuals with trait-anxiety in the
highest quartiles.
It can be concluded that in people with chronic anxiety symptoms or with high
scores of trait-anxiety a supposed biological dysfunction is associated with a
reduction of the HRV. This reduction is expressed by reduced vagal tone. The
response pattern will be of relevance when exploring the physiological response
pattern of individuals in fear of flying as well.
1.5.1.2 Panic disorder
Empirical evidence shows that panic contributes to a pathophysiological
autonomic functioning (Albert, Chae, Rexrode, Manson, & Kawachi, 2005;
Kawachi, Sparrow, Vokonas, & Weiss, 1994; van Ravenswaaij-Arts et al.,
1993).
The occurrence of panic attacks may have an influence in acquiring fear of
flying through conditioning as suggested by Klein (1980). Symptoms of hypoxia
are similar to panic attacks which also play a role for acquiring fear of flying
(Roth et al., 2002) as outlined in chapter 1.2.4. The following studies address
either the basal biological pattern of individuals having panic disorder (Klein,
Cnaani, Harel, Braun, & Ben-Haim, 1995; Yeragani et al., 1998; Wilhelm,
Trabert, & Roth, 2001) or the physiological response pattern during
experimentally evoked panic attacks (Asmundson & Stein, 1994; George et al.,
1989; Ito et al., 1999).
In a study of Klein et al. (1995) 10 individuals with panic disorder and 14
individuals of the control group were examined in a laboratory setting in order to
find out whether the panic disorder is a result of alterations within the central
nervous system or a result of the anticipation of the panic reaction (viscous
circle) and the awareness of somatic and physiological alterations. ECG
recordings were taken in a resting supine position. Results showed differences
between groups. Firstly, HF oscillations were only found in the control group,
but not in individuals with panic disorder. Secondly, patients with panic disorder
had a higher HR and higher resting LF/HF ratio than the control group. Klein et
40
al. (1995) interpreted the increase in basal HR in patients with panic disorder
concurrent with a reduction in parasympathetic control as an expression of tonic
inhibition during panic. They concluded that the parasympathetic system plays a
more dominant role in determination HR than assumed.
In a study of Yeragani et al. (1998) holter ECG recordings over a 24-hour period
were taken from a control group of 23 individuals and 29 individuals with panic
disorder. The results showed decreased total power of power spectrum and of
absolute ULF in individuals with panic disorder supporting that panic disorder is
related to alterations in autonomic functioning of individuals.
Another study on physiologic instability in panic disorder and generalized
anxiety was conducted by Wilhelm et al. (2001). They placed 16 individuals with
panic disorder, 15 individuals with generalized anxiety disorder and a control
group in front of a computer for 30 min (sitting quietly) in a laboratory
experiment. The results showed no group differences in cardiovascular
response or electrodermal activity (EDA), but all respiratory measures showed
differences, indicating a less stable physiological control of individuals with
panic disorder.
Asmundson and Stein (1994) investigated the effect of hyperventilation and
other manipulations of respiratory pace on parasympathetic nervous system
function and subjective reactivity, in order to differentiate individuals with panic
disorder from individuals with social phobia and from the control group. The
laboratory tasks included hyperventilation, normoventilation, and
hypoventilation. The incidence and severity of panic attacks were observed as
well as physiological response. Vagal activity decreased only during panic
attacks. It was concluded that the parasympathetic nervous system functions
normally during epochs without panic attacks, but during the attacks alterations
occur.
This is consistent with the findings of George et al. (1989) that panic disorders
could be related to the reduced parasympathetic tone. George et al. (1989)
evoked panic attacks by administering sodium lactate and provoking
41
hyperventilation in healthy volunteers. With those experiments they showed that
not only sympathetic activations but also decrease of parasympathetic activity
may contribute to the experience of panic attacks.
Ito et al. (1999) exposed eight individuals with panic disorder and 13 individuals
of a control group to a head-up tilt intending to provoke a panic attack. Results
showed that individuals with panic disorder differed from the control group
during tilt. Individuals with panic disorder had higher LF and unexpectedly
higher HF compared to the control group, however, LF/HF ratio and HR did not
differ. In the resting position there were no differences in HR, HF, LF, or LF/HF
ratio.
The studies above show a discrepancy in the autonomic pattern of panic
disorder: Referring to the basal autonomic pattern of individuals with panic
disorder the results vary from diminished total power (Yeragani et al., 1998), to
disappearance of parasympathetic activity (HF oscillations) combined with an
increase of sympathetic activity (HR, LF/HF ratio) (Klein et al., 1995), and
respiratory instability (Wilhelm et al., 2001). When panic attacks are evoked the
pattern of autonomic response reveals that either both sympathetic and
parasympathetic activity (LF, HF) increase (Ito et al., 1999), or parasympathetic
activity diminishes (George et al., 1989; Asmundson & Stein, 1994).
Concluding, there are no clearly defined autonomic patterns for panic attacks.
Thus, individuals suffering from fear of flying describing their fear as showing as
a panic attack or who had suffered from panic attacks in the past are also
expected to show heterogeneous autonomic responses.
1.5.1.3 Phobia
Fear of flying is listed under specific phobias in the DSM-IV (American
Psychiatric Association, 1994). The following studies cover the autonomic
response patterns of different phobias, focusing on whether a certain cardiac
pattern can be observed during a panic attack.
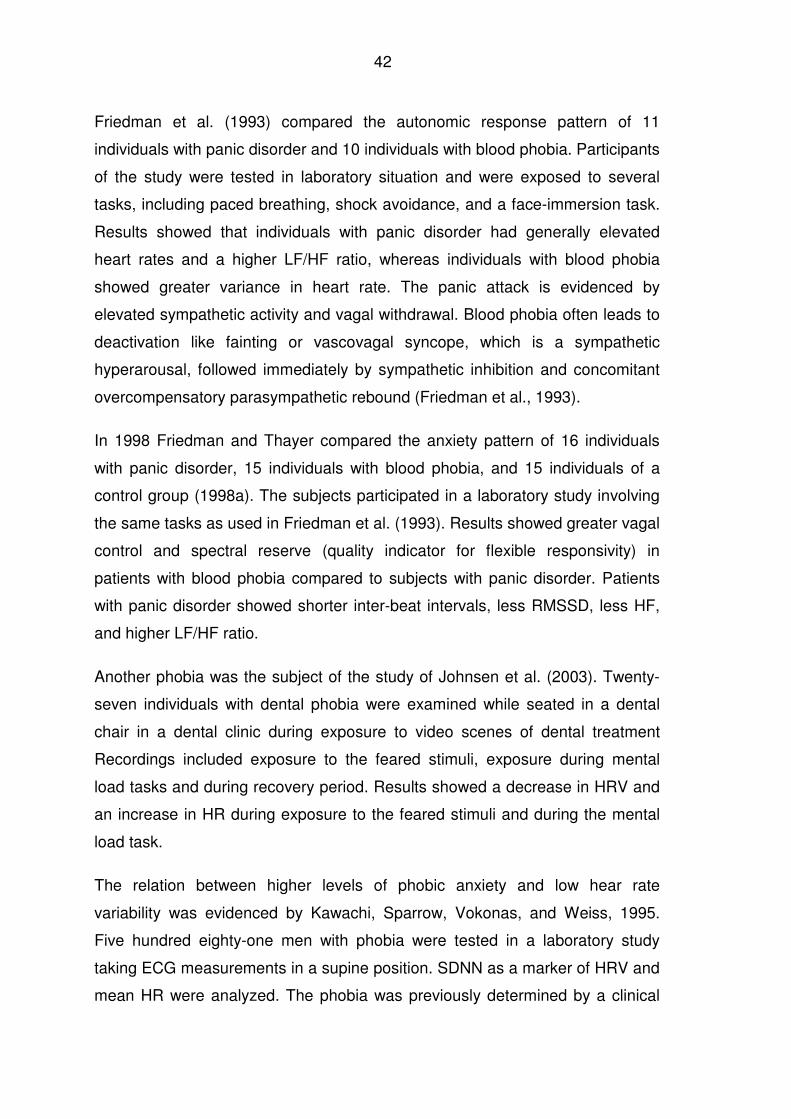
42
Friedman et al. (1993) compared the autonomic response pattern of 11
individuals with panic disorder and 10 individuals with blood phobia. Participants
of the study were tested in laboratory situation and were exposed to several
tasks, including paced breathing, shock avoidance, and a face-immersion task.
Results showed that individuals with panic disorder had generally elevated
heart rates and a higher LF/HF ratio, whereas individuals with blood phobia
showed greater variance in heart rate. The panic attack is evidenced by
elevated sympathetic activity and vagal withdrawal. Blood phobia often leads to
deactivation like fainting or vascovagal syncope, which is a sympathetic
hyperarousal, followed immediately by sympathetic inhibition and concomitant
overcompensatory parasympathetic rebound (Friedman et al., 1993).
In 1998 Friedman and Thayer compared the anxiety pattern of 16 individuals
with panic disorder, 15 individuals with blood phobia, and 15 individuals of a
control group (1998a). The subjects participated in a laboratory study involving
the same tasks as used in Friedman et al. (1993). Results showed greater vagal
control and spectral reserve (quality indicator for flexible responsivity) in
patients with blood phobia compared to subjects with panic disorder. Patients
with panic disorder showed shorter inter-beat intervals, less RMSSD, less HF,
and higher LF/HF ratio.
Another phobia was the subject of the study of Johnsen et al. (2003). Twenty-
seven individuals with dental phobia were examined while seated in a dental
chair in a dental clinic during exposure to video scenes of dental treatment
Recordings included exposure to the feared stimuli, exposure during mental
load tasks and during recovery period. Results showed a decrease in HRV and
an increase in HR during exposure to the feared stimuli and during the mental
load task.
The relation between higher levels of phobic anxiety and low hear rate
variability was evidenced by Kawachi, Sparrow, Vokonas, and Weiss, 1995.
Five hundred eighty-one men with phobia were tested in a laboratory study
taking ECG measurements in a supine position. SDNN as a marker of HRV and
mean HR were analyzed. The phobia was previously determined by a clinical
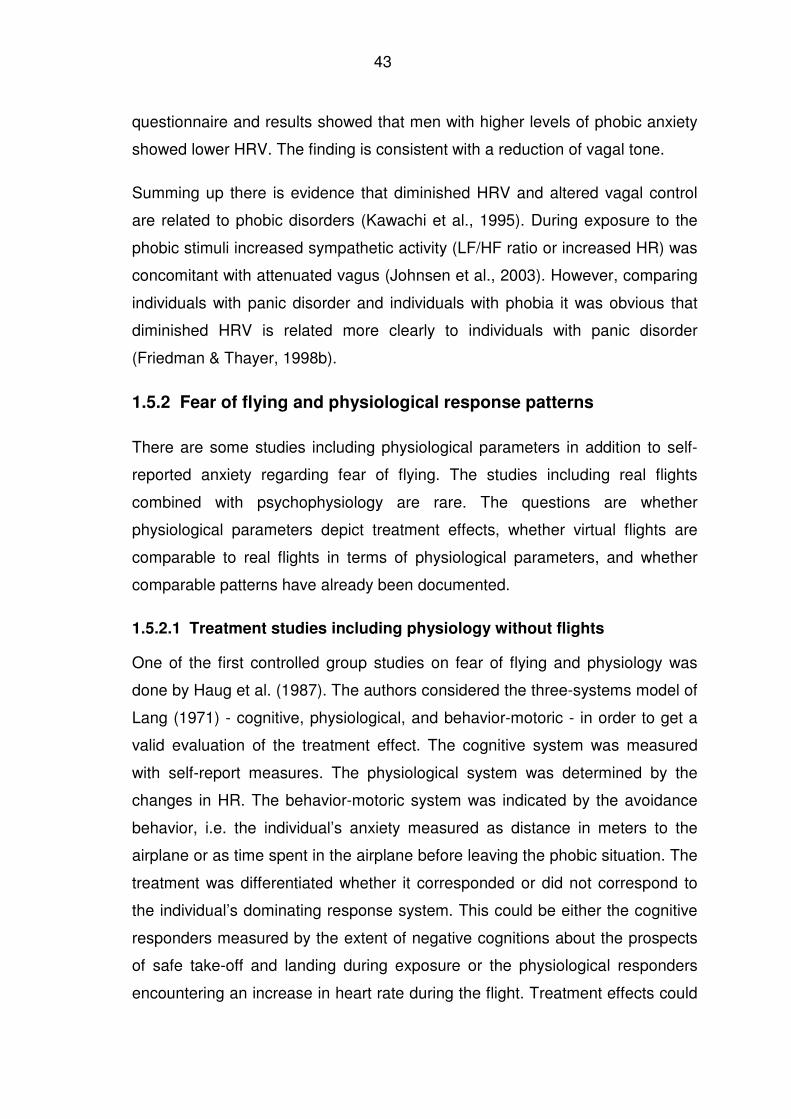
43
questionnaire and results showed that men with higher levels of phobic anxiety
showed lower HRV. The finding is consistent with a reduction of vagal tone.
Summing up there is evidence that diminished HRV and altered vagal control
are related to phobic disorders (Kawachi et al., 1995). During exposure to the
phobic stimuli increased sympathetic activity (LF/HF ratio or increased HR) was
concomitant with attenuated vagus (Johnsen et al., 2003). However, comparing
individuals with panic disorder and individuals with phobia it was obvious that
diminished HRV is related more clearly to individuals with panic disorder
(Friedman & Thayer, 1998b).
1.5.2 Fear of flying and physiological response patterns
There are some studies including physiological parameters in addition to self-
reported anxiety regarding fear of flying. The studies including real flights
combined with psychophysiology are rare. The questions are whether
physiological parameters depict treatment effects, whether virtual flights are
comparable to real flights in terms of physiological parameters, and whether
comparable patterns have already been documented.
1.5.2.1 Treatment studies including physiology without flights
One of the first controlled group studies on fear of flying and physiology was
done by Haug et al. (1987). The authors considered the three-systems model of
Lang (1971) - cognitive, physiological, and behavior-motoric - in order to get a
valid evaluation of the treatment effect. The cognitive system was measured
with self-report measures. The physiological system was determined by the
changes in HR. The behavior-motoric system was indicated by the avoidance
behavior, i.e. the individual’s anxiety measured as distance in meters to the
airplane or as time spent in the airplane before leaving the phobic situation. The
treatment was differentiated whether it corresponded or did not correspond to
the individual’s dominating response system. This could be either the cognitive
responders measured by the extent of negative cognitions about the prospects
of safe take-off and landing during exposure or the physiological responders
encountering an increase in heart rate during the flight. Treatment effects could
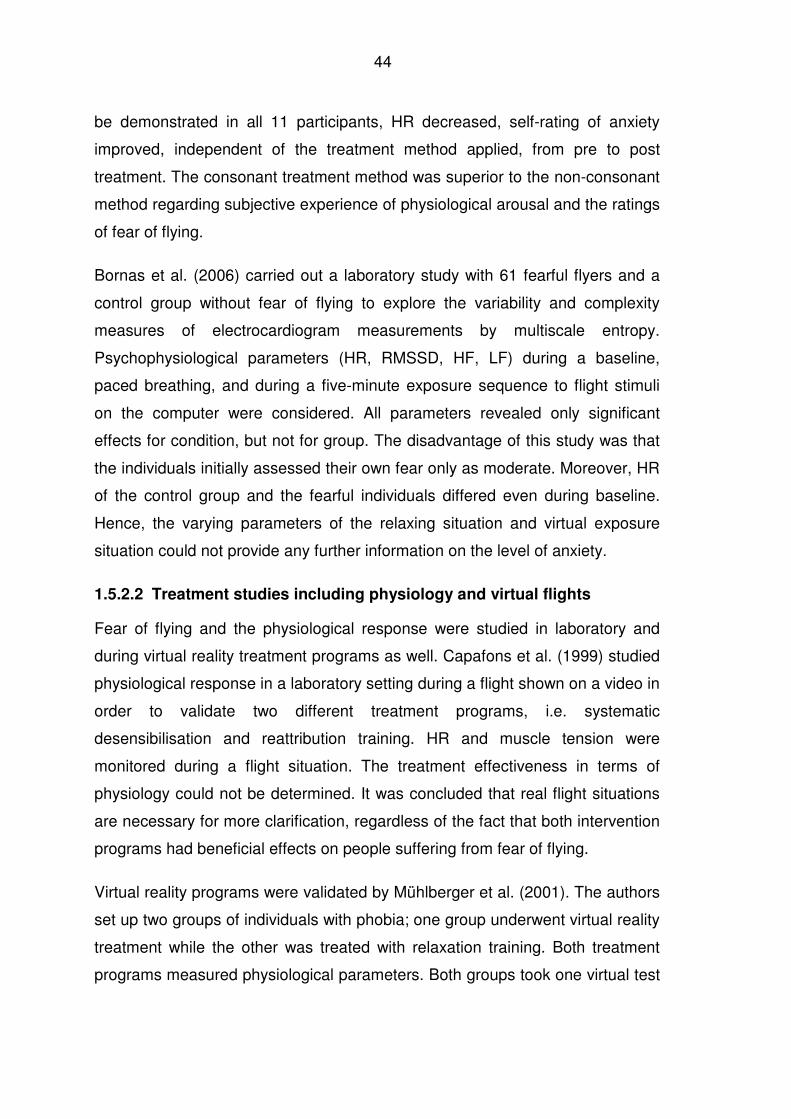
44
be demonstrated in all 11 participants, HR decreased, self-rating of anxiety
improved, independent of the treatment method applied, from pre to post
treatment. The consonant treatment method was superior to the non-consonant
method regarding subjective experience of physiological arousal and the ratings
of fear of flying.
Bornas et al. (2006) carried out a laboratory study with 61 fearful flyers and a
control group without fear of flying to explore the variability and complexity
measures of electrocardiogram measurements by multiscale entropy.
Psychophysiological parameters (HR, RMSSD, HF, LF) during a baseline,
paced breathing, and during a five-minute exposure sequence to flight stimuli
on the computer were considered. All parameters revealed only significant
effects for condition, but not for group. The disadvantage of this study was that
the individuals initially assessed their own fear only as moderate. Moreover, HR
of the control group and the fearful individuals differed even during baseline.
Hence, the varying parameters of the relaxing situation and virtual exposure
situation could not provide any further information on the level of anxiety.
1.5.2.2 Treatment studies including physiology and virtual flights
Fear of flying and the physiological response were studied in laboratory and
during virtual reality treatment programs as well. Capafons et al. (1999) studied
physiological response in a laboratory setting during a flight shown on a video in
order to validate two different treatment programs, i.e. systematic
desensibilisation and reattribution training. HR and muscle tension were
monitored during a flight situation. The treatment effectiveness in terms of
physiology could not be determined. It was concluded that real flight situations
are necessary for more clarification, regardless of the fact that both intervention
programs had beneficial effects on people suffering from fear of flying.
Virtual reality programs were validated by Mühlberger et al. (2001). The authors
set up two groups of individuals with phobia; one group underwent virtual reality
treatment while the other was treated with relaxation training. Both treatment
programs measured physiological parameters. Both groups took one virtual test
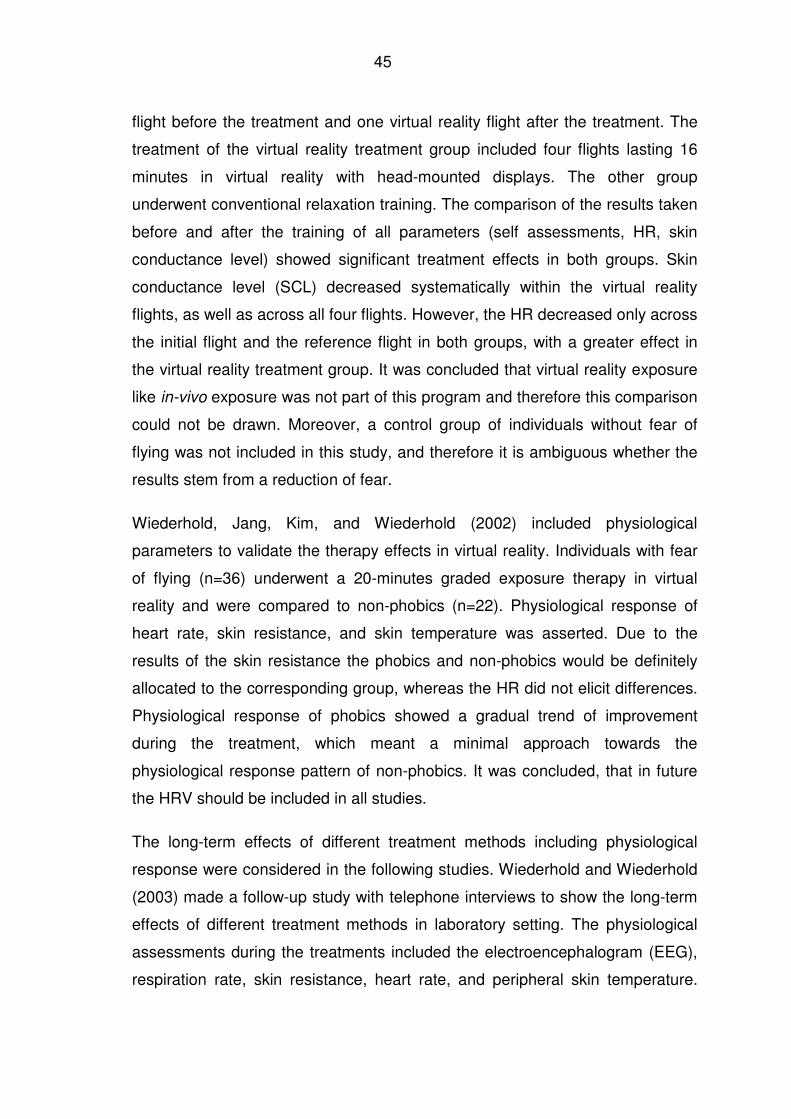
45
flight before the treatment and one virtual reality flight after the treatment. The
treatment of the virtual reality treatment group included four flights lasting 16
minutes in virtual reality with head-mounted displays. The other group
underwent conventional relaxation training. The comparison of the results taken
before and after the training of all parameters (self assessments, HR, skin
conductance level) showed significant treatment effects in both groups. Skin
conductance level (SCL) decreased systematically within the virtual reality
flights, as well as across all four flights. However, the HR decreased only across
the initial flight and the reference flight in both groups, with a greater effect in
the virtual reality treatment group. It was concluded that virtual reality exposure
like in-vivo exposure was not part of this program and therefore this comparison
could not be drawn. Moreover, a control group of individuals without fear of
flying was not included in this study, and therefore it is ambiguous whether the
results stem from a reduction of fear.
Wiederhold, Jang, Kim, and Wiederhold (2002) included physiological
parameters to validate the therapy effects in virtual reality. Individuals with fear
of flying (n=36) underwent a 20-minutes graded exposure therapy in virtual
reality and were compared to non-phobics (n=22). Physiological response of
heart rate, skin resistance, and skin temperature was asserted. Due to the
results of the skin resistance the phobics and non-phobics would be definitely
allocated to the corresponding group, whereas the HR did not elicit differences.
Physiological response of phobics showed a gradual trend of improvement
during the treatment, which meant a minimal approach towards the
physiological response pattern of non-phobics. It was concluded, that in future
the HRV should be included in all studies.
The long-term effects of different treatment methods including physiological
response were considered in the following studies. Wiederhold and Wiederhold
(2003) made a follow-up study with telephone interviews to show the long-term
effects of different treatment methods in laboratory setting. The physiological
assessments during the treatments included the electroencephalogram (EEG),
respiration rate, skin resistance, heart rate, and peripheral skin temperature.
46
The graded exposure in virtual reality in combination with visual feedback of the
patient’s physiology, i.e. breathing retraining, was concluded to have an
influence on the long-term effect and was considered a solid treatment. The
three-year follow-up demonstrated that individuals of this group were still able to
fly without medication or alcohol, which was not the case for those subjects who
had undergone virtual reality graded exposure treatment or imaginary exposure
therapy with physiological monitoring without visual feedback.
1.5.2.3 Treatment studies including physiology and real flights
The effect of a self-guided treatment program, stress inoculation training, which
was applied to 14 individuals compared to 14 individuals of a control group
without treatment, was studied by Beckham et al. (1990). The treated
individuals and the control group attended a 60 minute flight, during which self-
report questionnaires and heart rate were assessed at five different periods,
namely arrival at terminal, seating, after take-off, before landing, and on the
ground after landing. Treated individuals and the control group did not differ in
HR and reported anxiety during the flight. However, results showed that more
individuals with treatment were able to take the flight compared to the control
group (nine individuals versus five). HR and subjective report of anxiety over
time demonstrated high levels of concordance and synchrony. It is relevant that
physiological indicators of emotional processing were related to subsequent
flight behavior. A high level of fear memory activation defines emotional
processing and enables modification and reduction of fear (Foa & Kozak, 1986).
Subjects with flight phobia are particularly suitable for studies on physiological
responses to psychological stress (Ekeberg et al., 1990). The relation between
the subjective level of anxiety rated by self-assessments and anxiety inventories
and physiological variables like blood pressure, heart rate, plasma adrenaline,
and plasma noradrenalin was compared by Ekeberg et al. (1990). Twenty-three
subjects with flight phobia were exposed to the acute mental stress of two real
flights, each a duration of 30 minutes. The study is an example of the relative
independence of autonomic indices and low correlations with subjective and
behavioral responses. Physiology was the same before and after the flight,
47
during the flights, however, plasma adrenaline, heart rate, and blood pressure
increased significantly. Results showed a high sensitivity for a direct relationship
between the physiological and psychological stress during the flight. This
demonstrates the relevance of several measures being taken during a flight.
The psychological self-assessments of anxiety were, like the physiological
parameters, highest during the flight. The psychological ratings were lower after
the flights than before the flights, indicating that after exposure the subjective
anxiety level is reduced. It was unexpected that the physiological parameters
did not change from pre to post flight-situations. In hindsight, this outcome might
have resulted from the fact that all individuals had taken placebos and were
individually accompanied by a doctor or psychologist. These factors interfere
considerably with the psychological and physiological parameters, which is why
this modus operandi must be questioned.
The importance of including physiological parameters to assess anxiety was
underlined Wilhelm and Roth (1998). They demonstrated that ambulatory
recording of multiple anxiety measures during a real flight situation was feasible.
In addition to self-report data, HRV, electrodermal activity, and respiratory
activity were chosen to represent physiological parameters. Motility effects and
outside temperature were considered as well. The cardiovascular analyses
were supposed to distinguish contributions from the sympathetic and
parasympathetic branches of the autonomic nervous system. Fifteen flight
phobic women were individually tested and compared with individuals without
fear during a pre-flight baseline, during four minutes of flight out of a twelve-
minutes lasting commercial flight, and during a post flight baseline. The
complete 16 minutes analyses were part of a cognitive-behavioral treatment
program investigating the effects of benzodiazepine administration. Participants
received a placebo during the study. The authors concluded that controls and
phobics had different response patterns during the flight situation, as people
with fear of flying reported more anxiety symptoms in combination with
additional HR and increased HR during exposure. Skin conductance
fluctuations, respiratory rate and ventilation cycles per minute were indicators
for excitement, which is a responding pattern that did not differ between phobic
48
individuals and control group. RSA showed a unique pattern in phobic
individuals; RSA was lower during the flight. There was no change between pre
and post flight in HR, SCL and RSA. Due to the results of the self-report
measures of the phobic individuals and the cognitive group the individuals could
be definitely allocated to the corresponding group. However, the results of
physiological parameters were not so explicit.
The study on fear of flying and physiological parameters of Wilhelm, Pfaltz,
Grossmann and Roth (2006) tried to distinguish physiological dysregulation or
emotion effects from physical activity in natural environments. They assumed
that investigations of emotions in natural environments could be misleading
since physical activity might mask the real emotion. The experiment was set up
in three different situations, i.e. sitting quietly, exercising physically, and taking a
flight. In this study 14 flight phobic individuals and 14 individuals of a control
group were compared. ECG, EDA, calibrated respiration pattern, and skin
temperature were recorded. Based on the outcome of these measures four
patterns of variables were classified according to the sensitivity of the
individuals to emotional and physical activation. The clusters identified that HR,
RSA, and the skin conductance level and its fluctuations were highly non-
specific markers of physical and emotional activity, since they were responding
to both emotional and physiological activation. Only the parameter respiratory
volume was particularly responsive to exercise. This highlights that context
information is important and necessary for identifying physical activation from
emotion.
It is difficult to draw conclusions about a dominant physiological response
pattern related to fear of flying in the studies mentioned above. That is because
the studies differed in their target, e.g. showing the effectiveness of a certain
treatment method backed up by physiological parameters (Beckham et al.,
1990; Haug et al., 1987), proving the feasibility of ambulatory recoding (Wilhelm
& Roth, 1998), comparing subjective and physiological parameters during
exposure (Ekeberg et al., 1990), or determining the sensitivity of parameters
reflecting emotional or physical activation (Wilhelm et al., 2006). According to
49
the different targets of the studies the composition of the designs differs, e.g.
selected time event of recording, duration of recording, or selection of subjects
and control group, respectively.
All of those studies included at least HR to represent physiology. The studies
showed that HR is a sensitive indicator for physiological response in studies of
fear of flying referring to real exposure. Only Wilhelm and Roth (1998), Wilhelm
et al. (2006), and Bornas et al. (2006) included HRV, but continuous recording
during flights are not available.
The current study will bring new light in this field since the autonomic response
pattern during real flight flights along with a control group of individuals without
fear of flying has been unexplored so far.
1.5.3 Inconsistencies between psychological/physiological patterns
When implementing the three-system approach to emotion (Lang, 1971)
including cognitive, behavioral, and physiological-motoric response, the
concordance in these measures is ambiguous. However, according to Cook,
Melamed, Cuthbert, MacNeil, and Lang (1988) the response of people with a
simple phobia is more concordant than in people with other anxiety disorders.
Literature has largely reported discrepancy concerning subjective ratings
indicating the extent of anxiety in comparison to changes in physiology or
behavior (Barlow, 2000; Hoehn-Saric & McLeod, 2000; Nesse et al., 1985).
Studies on fear of flying implementing the three-system approach provided
inconsistent results, too (Wilhelm and Roth, 1998; Wilhelm and Roth, 2001).
The relationship between various measures of fear (self-report and physiology)
across a number of individuals was expected to be concordant (Hodgson &
Rachman, 1974; Rachman & Hodgson, 1974). According to Lang (1971) and
Rachman (1977) anxiety manifests itself in three independent systems of
response, namely cognitive, behavioral and physiological-motoric response.
However, these three systems are not always covarying (Barlow, 2000).
Wilhelm and Roth (2001) pointed out the discordance between and even within
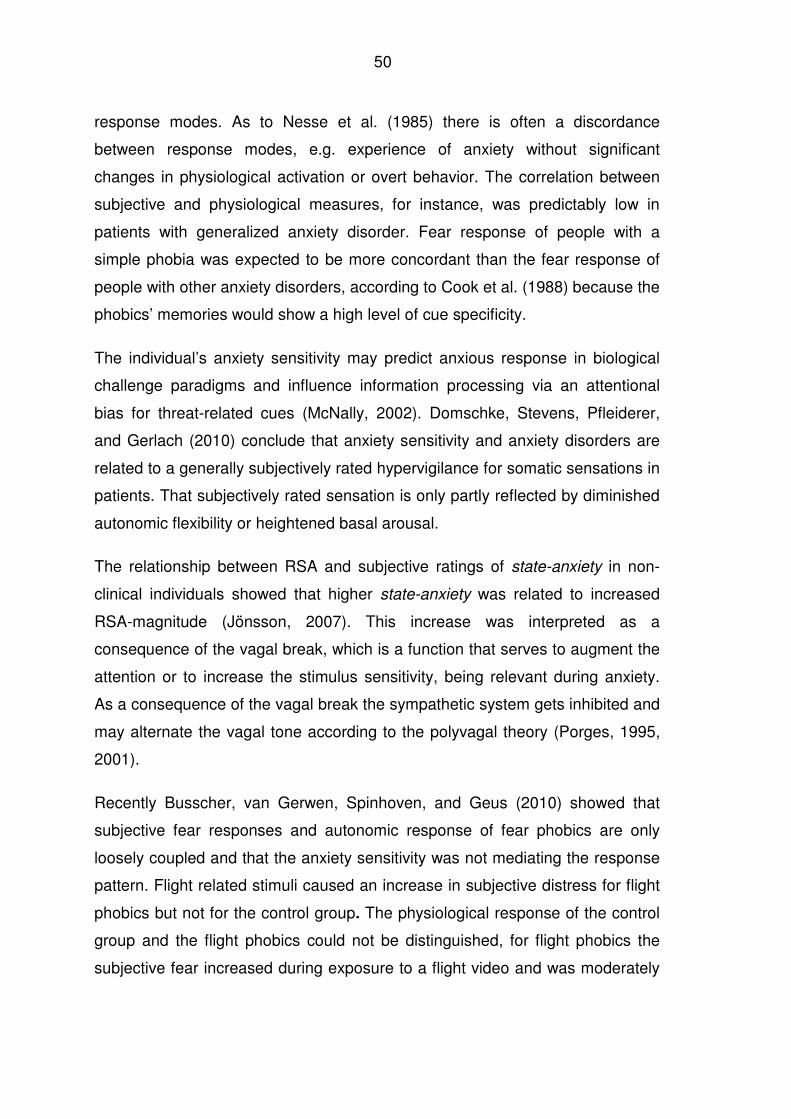
50
response modes. As to Nesse et al. (1985) there is often a discordance
between response modes, e.g. experience of anxiety without significant
changes in physiological activation or overt behavior. The correlation between
subjective and physiological measures, for instance, was predictably low in
patients with generalized anxiety disorder. Fear response of people with a
simple phobia was expected to be more concordant than the fear response of
people with other anxiety disorders, according to Cook et al. (1988) because the
phobics’ memories would show a high level of cue specificity.
The individual’s anxiety sensitivity may predict anxious response in biological
challenge paradigms and influence information processing via an attentional
bias for threat-related cues (McNally, 2002). Domschke, Stevens, Pfleiderer,
and Gerlach (2010) conclude that anxiety sensitivity and anxiety disorders are
related to a generally subjectively rated hypervigilance for somatic sensations in
patients. That subjectively rated sensation is only partly reflected by diminished
autonomic flexibility or heightened basal arousal.
The relationship between RSA and subjective ratings of state-anxiety in non-
clinical individuals showed that higher state-anxiety was related to increased
RSA-magnitude (Jönsson, 2007). This increase was interpreted as a
consequence of the vagal break, which is a function that serves to augment the
attention or to increase the stimulus sensitivity, being relevant during anxiety.
As a consequence of the vagal break the sympathetic system gets inhibited and
may alternate the vagal tone according to the polyvagal theory (Porges, 1995,
2001).
Recently Busscher, van Gerwen, Spinhoven, and Geus (2010) showed that
subjective fear responses and autonomic response of fear phobics are only
loosely coupled and that the anxiety sensitivity was not mediating the response
pattern. Flight related stimuli caused an increase in subjective distress for flight
phobics but not for the control group. The physiological response of the control
group and the flight phobics could not be distinguished, for flight phobics the
subjective fear increased during exposure to a flight video and was moderately
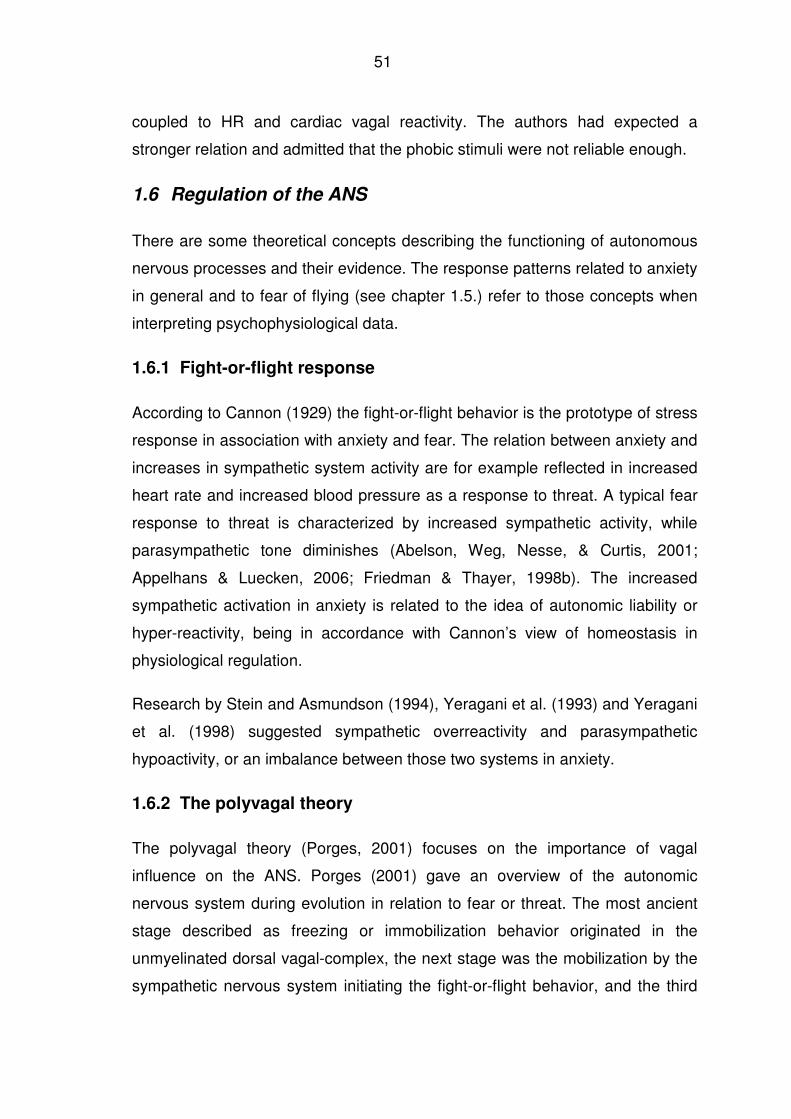
51
coupled to HR and cardiac vagal reactivity. The authors had expected a
stronger relation and admitted that the phobic stimuli were not reliable enough.
1.6 Regulation of the ANS
There are some theoretical concepts describing the functioning of autonomous
nervous processes and their evidence. The response patterns related to anxiety
in general and to fear of flying (see chapter 1.5.) refer to those concepts when
interpreting psychophysiological data.
1.6.1 Fight-or-flight response
According to Cannon (1929) the fight-or-flight behavior is the prototype of stress
response in association with anxiety and fear. The relation between anxiety and
increases in sympathetic system activity are for example reflected in increased
heart rate and increased blood pressure as a response to threat. A typical fear
response to threat is characterized by increased sympathetic activity, while
parasympathetic tone diminishes (Abelson, Weg, Nesse, & Curtis, 2001;
Appelhans & Luecken, 2006; Friedman & Thayer, 1998b). The increased
sympathetic activation in anxiety is related to the idea of autonomic liability or
hyper-reactivity, being in accordance with Cannon’s view of homeostasis in
physiological regulation.
Research by Stein and Asmundson (1994), Yeragani et al. (1993) and Yeragani
et al. (1998) suggested sympathetic overreactivity and parasympathetic
hypoactivity, or an imbalance between those two systems in anxiety.
1.6.2 The polyvagal theory
The polyvagal theory (Porges, 2001) focuses on the importance of vagal
influence on the ANS. Porges (2001) gave an overview of the autonomic
nervous system during evolution in relation to fear or threat. The most ancient
stage described as freezing or immobilization behavior originated in the
unmyelinated dorsal vagal-complex, the next stage was the mobilization by the
sympathetic nervous system initiating the fight-or-flight behavior, and the third
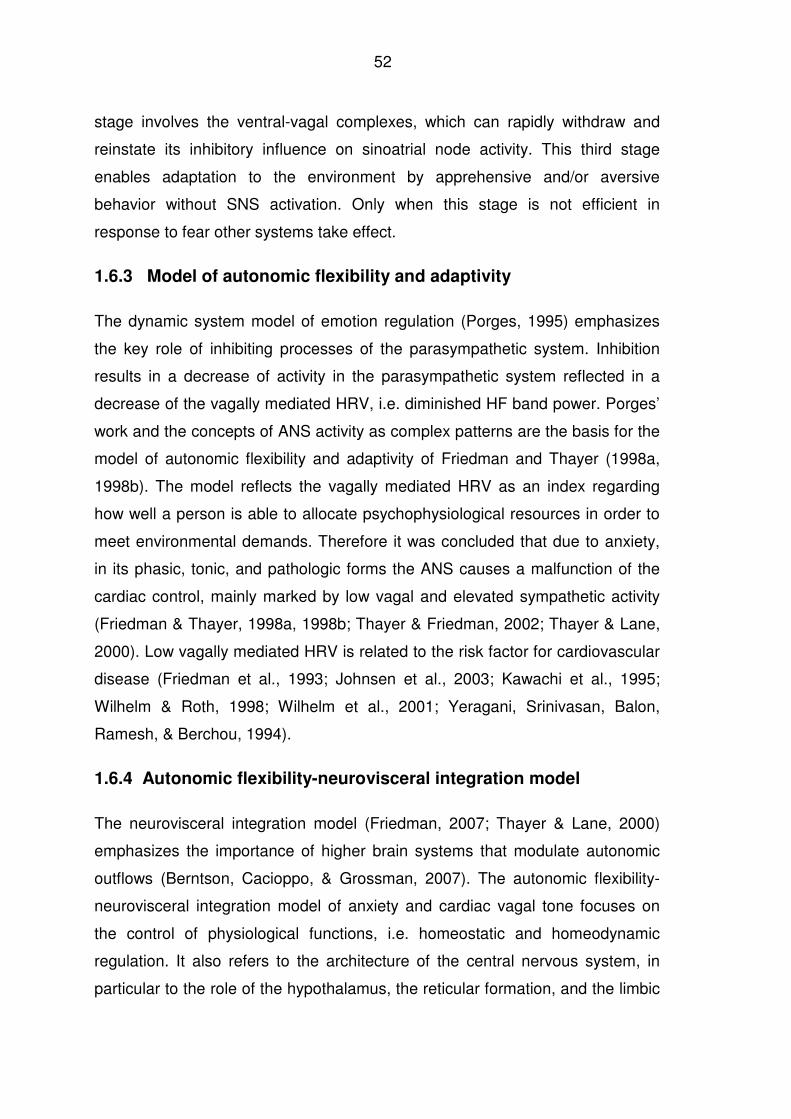
52
stage involves the ventral-vagal complexes, which can rapidly withdraw and
reinstate its inhibitory influence on sinoatrial node activity. This third stage
enables adaptation to the environment by apprehensive and/or aversive
behavior without SNS activation. Only when this stage is not efficient in
response to fear other systems take effect.
1.6.3 Model of autonomic flexibility and adaptivity
The dynamic system model of emotion regulation (Porges, 1995) emphasizes
the key role of inhibiting processes of the parasympathetic system. Inhibition
results in a decrease of activity in the parasympathetic system reflected in a
decrease of the vagally mediated HRV, i.e. diminished HF band power. Porges’
work and the concepts of ANS activity as complex patterns are the basis for the
model of autonomic flexibility and adaptivity of Friedman and Thayer (1998a,
1998b). The model reflects the vagally mediated HRV as an index regarding
how well a person is able to allocate psychophysiological resources in order to
meet environmental demands. Therefore it was concluded that due to anxiety,
in its phasic, tonic, and pathologic forms the ANS causes a malfunction of the
cardiac control, mainly marked by low vagal and elevated sympathetic activity
(Friedman & Thayer, 1998a, 1998b; Thayer & Friedman, 2002; Thayer & Lane,
2000). Low vagally mediated HRV is related to the risk factor for cardiovascular
disease (Friedman et al., 1993; Johnsen et al., 2003; Kawachi et al., 1995;
Wilhelm & Roth, 1998; Wilhelm et al., 2001; Yeragani, Srinivasan, Balon,
Ramesh, & Berchou, 1994).
1.6.4 Autonomic flexibility-neurovisceral integration model
The neurovisceral integration model (Friedman, 2007; Thayer & Lane, 2000)
emphasizes the importance of higher brain systems that modulate autonomic
outflows (Berntson, Cacioppo, & Grossman, 2007). The autonomic flexibility-
neurovisceral integration model of anxiety and cardiac vagal tone focuses on
the control of physiological functions, i.e. homeostatic and homeodynamic
regulation. It also refers to the architecture of the central nervous system, in
particular to the role of the hypothalamus, the reticular formation, and the limbic
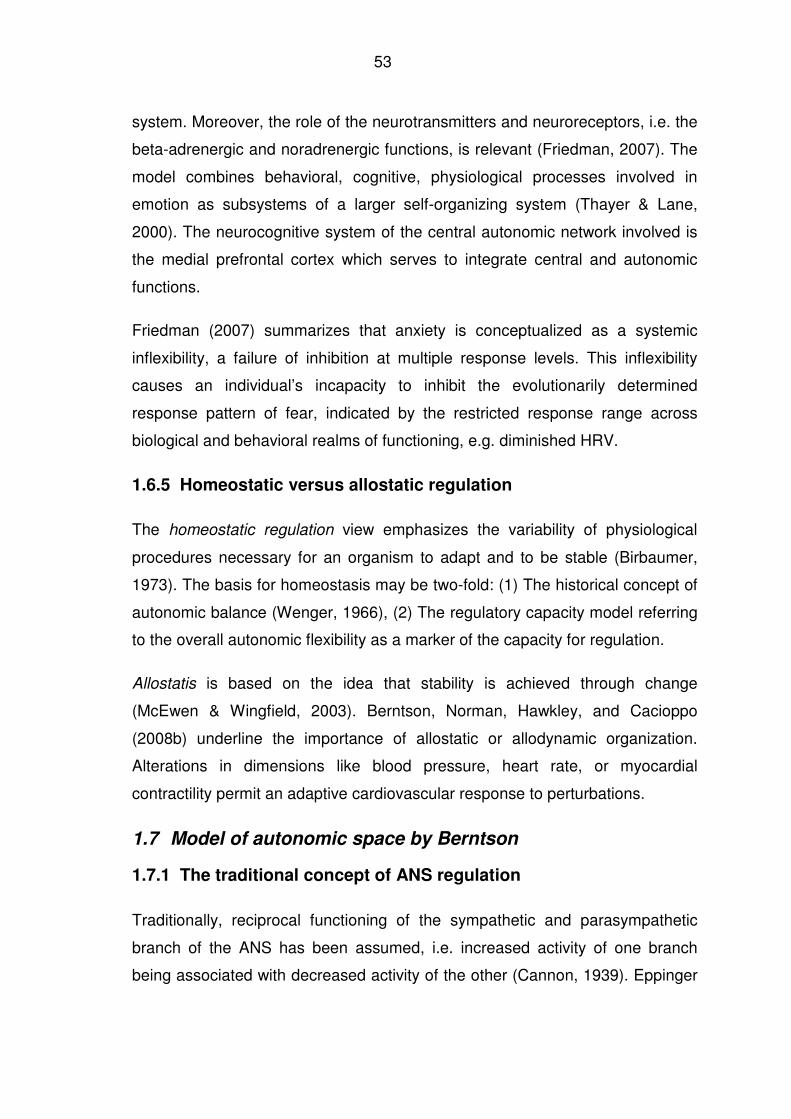
53
system. Moreover, the role of the neurotransmitters and neuroreceptors, i.e. the
beta-adrenergic and noradrenergic functions, is relevant (Friedman, 2007). The
model combines behavioral, cognitive, physiological processes involved in
emotion as subsystems of a larger self-organizing system (Thayer & Lane,
2000). The neurocognitive system of the central autonomic network involved is
the medial prefrontal cortex which serves to integrate central and autonomic
functions.
Friedman (2007) summarizes that anxiety is conceptualized as a systemic
inflexibility, a failure of inhibition at multiple response levels. This inflexibility
causes an individual’s incapacity to inhibit the evolutionarily determined
response pattern of fear, indicated by the restricted response range across
biological and behavioral realms of functioning, e.g. diminished HRV.
1.6.5 Homeostatic versus allostatic regulation
The homeostatic regulation view emphasizes the variability of physiological
procedures necessary for an organism to adapt and to be stable (Birbaumer,
1973). The basis for homeostasis may be two-fold: (1) The historical concept of
autonomic balance (Wenger, 1966), (2) The regulatory capacity model referring
to the overall autonomic flexibility as a marker of the capacity for regulation.
Allostatis is based on the idea that stability is achieved through change
(McEwen & Wingfield, 2003). Berntson, Norman, Hawkley, and Cacioppo
(2008b) underline the importance of allostatic or allodynamic organization.
Alterations in dimensions like blood pressure, heart rate, or myocardial
contractility permit an adaptive cardiovascular response to perturbations.
1.7 Model of autonomic space by Berntson
1.7.1 The traditional concept of ANS regulation
Traditionally, reciprocal functioning of the sympathetic and parasympathetic
branch of the ANS has been assumed, i.e. increased activity of one branch
being associated with decreased activity of the other (Cannon, 1939). Eppinger
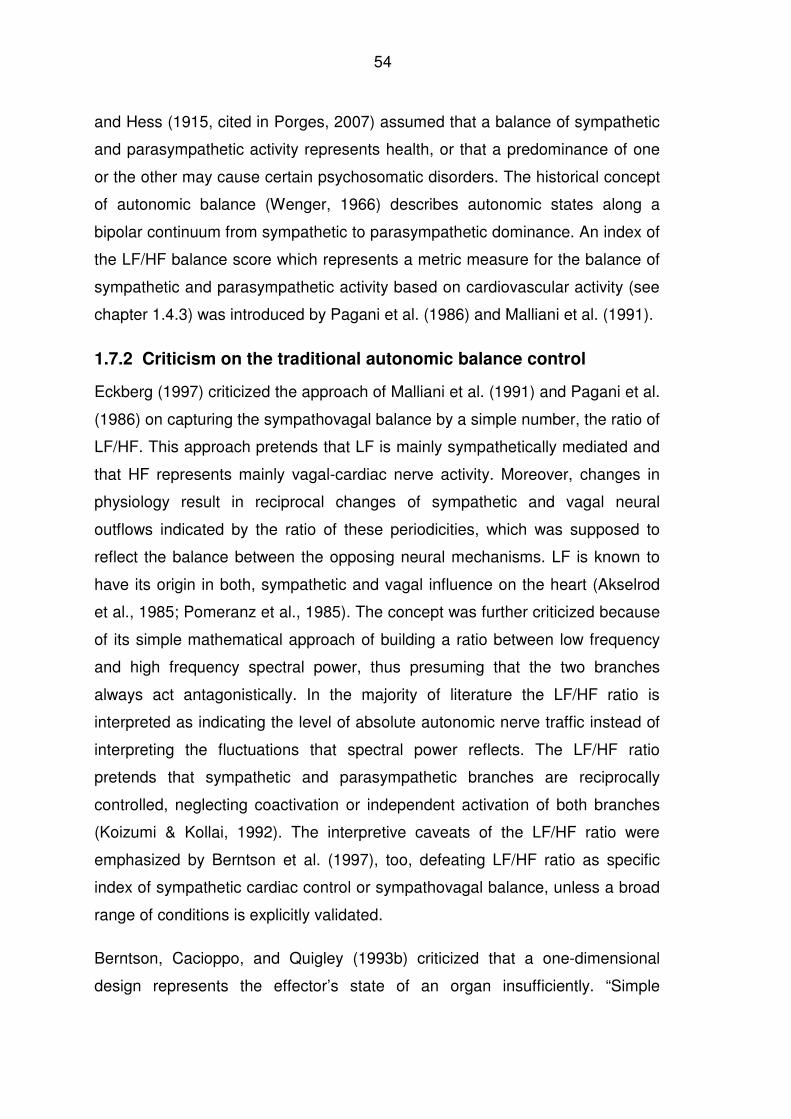
54
and Hess (1915, cited in Porges, 2007) assumed that a balance of sympathetic
and parasympathetic activity represents health, or that a predominance of one
or the other may cause certain psychosomatic disorders. The historical concept
of autonomic balance (Wenger, 1966) describes autonomic states along a
bipolar continuum from sympathetic to parasympathetic dominance. An index of
the LF/HF balance score which represents a metric measure for the balance of
sympathetic and parasympathetic activity based on cardiovascular activity (see
chapter 1.4.3) was introduced by Pagani et al. (1986) and Malliani et al. (1991).
1.7.2 Criticism on the traditional autonomic balance control
Eckberg (1997) criticized the approach of Malliani et al. (1991) and Pagani et al.
(1986) on capturing the sympathovagal balance by a simple number, the ratio of
LF/HF. This approach pretends that LF is mainly sympathetically mediated and
that HF represents mainly vagal-cardiac nerve activity. Moreover, changes in
physiology result in reciprocal changes of sympathetic and vagal neural
outflows indicated by the ratio of these periodicities, which was supposed to
reflect the balance between the opposing neural mechanisms. LF is known to
have its origin in both, sympathetic and vagal influence on the heart (Akselrod
et al., 1985; Pomeranz et al., 1985). The concept was further criticized because
of its simple mathematical approach of building a ratio between low frequency
and high frequency spectral power, thus presuming that the two branches
always act antagonistically. In the majority of literature the LF/HF ratio is
interpreted as indicating the level of absolute autonomic nerve traffic instead of
interpreting the fluctuations that spectral power reflects. The LF/HF ratio
pretends that sympathetic and parasympathetic branches are reciprocally
controlled, neglecting coactivation or independent activation of both branches
(Koizumi & Kollai, 1992). The interpretive caveats of the LF/HF ratio were
emphasized by Berntson et al. (1997), too, defeating LF/HF ratio as specific
index of sympathetic cardiac control or sympathovagal balance, unless a broad
range of conditions is explicitly validated.
Berntson, Cacioppo, and Quigley (1993b) criticized that a one-dimensional
design represents the effector’s state of an organ insufficiently. “Simple
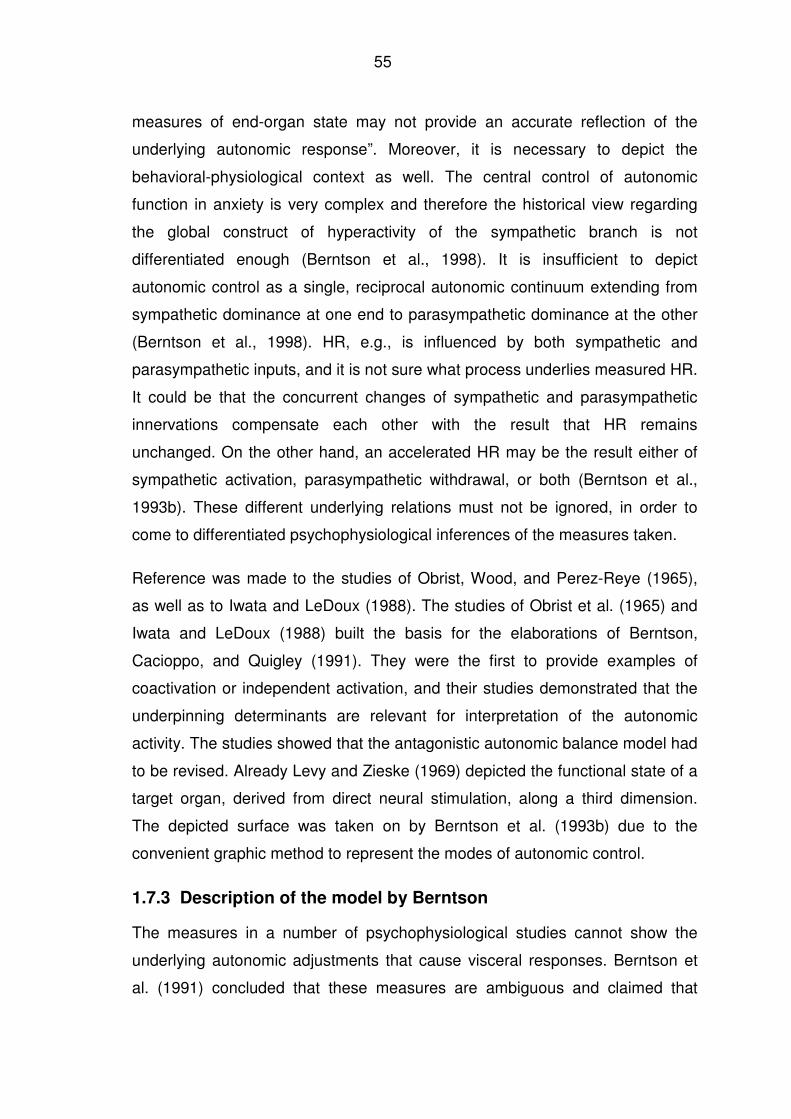
55
measures of end-organ state may not provide an accurate reflection of the
underlying autonomic response”. Moreover, it is necessary to depict the
behavioral-physiological context as well. The central control of autonomic
function in anxiety is very complex and therefore the historical view regarding
the global construct of hyperactivity of the sympathetic branch is not
differentiated enough (Berntson et al., 1998). It is insufficient to depict
autonomic control as a single, reciprocal autonomic continuum extending from
sympathetic dominance at one end to parasympathetic dominance at the other
(Berntson et al., 1998). HR, e.g., is influenced by both sympathetic and
parasympathetic inputs, and it is not sure what process underlies measured HR.
It could be that the concurrent changes of sympathetic and parasympathetic
innervations compensate each other with the result that HR remains
unchanged. On the other hand, an accelerated HR may be the result either of
sympathetic activation, parasympathetic withdrawal, or both (Berntson et al.,
1993b). These different underlying relations must not be ignored, in order to
come to differentiated psychophysiological inferences of the measures taken.
Reference was made to the studies of Obrist, Wood, and Perez-Reye (1965),
as well as to Iwata and LeDoux (1988). The studies of Obrist et al. (1965) and
Iwata and LeDoux (1988) built the basis for the elaborations of Berntson,
Cacioppo, and Quigley (1991). They were the first to provide examples of
coactivation or independent activation, and their studies demonstrated that the
underpinning determinants are relevant for interpretation of the autonomic
activity. The studies showed that the antagonistic autonomic balance model had
to be revised. Already Levy and Zieske (1969) depicted the functional state of a
target organ, derived from direct neural stimulation, along a third dimension.
The depicted surface was taken on by Berntson et al. (1993b) due to the
convenient graphic method to represent the modes of autonomic control.
1.7.3 Description of the model by Berntson
The measures in a number of psychophysiological studies cannot show the
underlying autonomic adjustments that cause visceral responses. Berntson et
al. (1991) concluded that these measures are ambiguous and claimed that
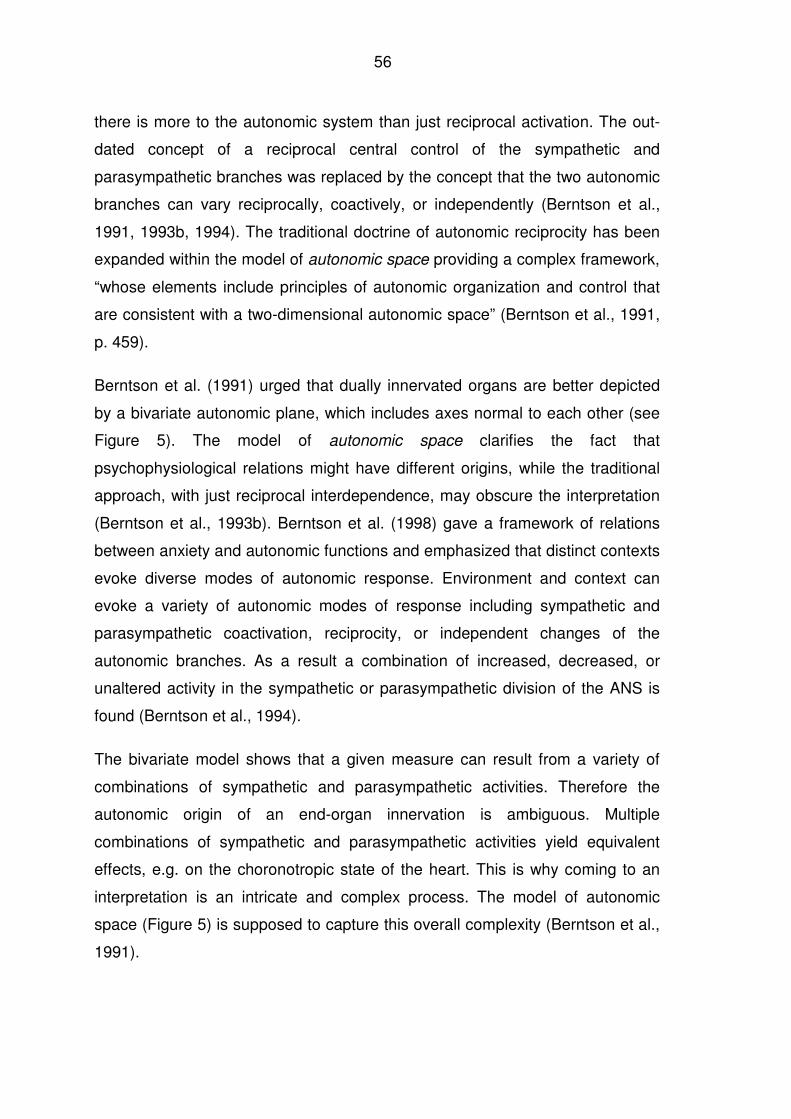
56
there is more to the autonomic system than just reciprocal activation. The out-
dated concept of a reciprocal central control of the sympathetic and
parasympathetic branches was replaced by the concept that the two autonomic
branches can vary reciprocally, coactively, or independently (Berntson et al.,
1991, 1993b, 1994). The traditional doctrine of autonomic reciprocity has been
expanded within the model of autonomic space providing a complex framework,
“whose elements include principles of autonomic organization and control that
are consistent with a two-dimensional autonomic space” (Berntson et al., 1991,
p. 459).
Berntson et al. (1991) urged that dually innervated organs are better depicted
by a bivariate autonomic plane, which includes axes normal to each other (see
Figure 5). The model of autonomic space clarifies the fact that
psychophysiological relations might have different origins, while the traditional
approach, with just reciprocal interdependence, may obscure the interpretation
(Berntson et al., 1993b). Berntson et al. (1998) gave a framework of relations
between anxiety and autonomic functions and emphasized that distinct contexts
evoke diverse modes of autonomic response. Environment and context can
evoke a variety of autonomic modes of response including sympathetic and
parasympathetic coactivation, reciprocity, or independent changes of the
autonomic branches. As a result a combination of increased, decreased, or
unaltered activity in the sympathetic or parasympathetic division of the ANS is
found (Berntson et al., 1994).
The bivariate model shows that a given measure can result from a variety of
combinations of sympathetic and parasympathetic activities. Therefore the
autonomic origin of an end-organ innervation is ambiguous. Multiple
combinations of sympathetic and parasympathetic activities yield equivalent
effects, e.g. on the choronotropic state of the heart. This is why coming to an
interpretation is an intricate and complex process. The model of autonomic
space (Figure 5) is supposed to capture this overall complexity (Berntson et al.,
1991).
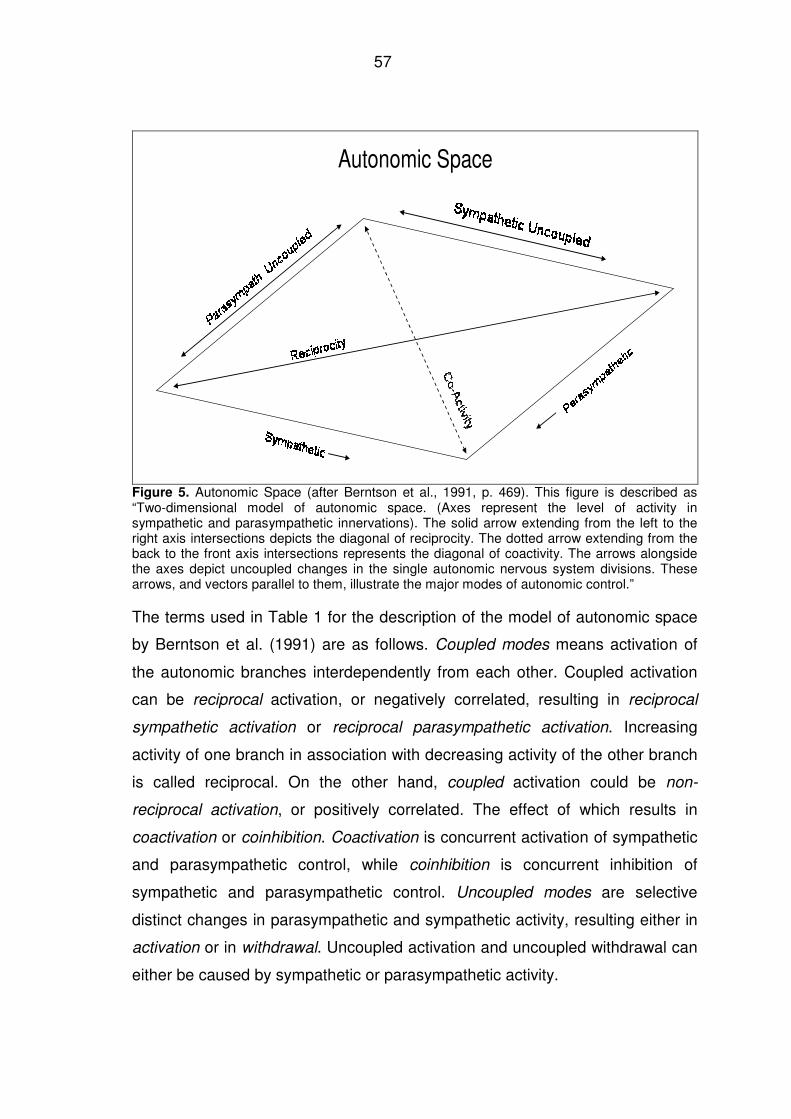
57
Autonomic Space
Figure 5. Autonomic Space (after Berntson et al., 1991, p. 469). This figure is described as “Two-dimensional model of autonomic space. (Axes represent the level of activity in sympathetic and parasympathetic innervations). The solid arrow extending from the left to the right axis intersections depicts the diagonal of reciprocity. The dotted arrow extending from the back to the front axis intersections represents the diagonal of coactivity. The arrows alongside the axes depict uncoupled changes in the single autonomic nervous system divisions. These arrows, and vectors parallel to them, illustrate the major modes of autonomic control.”
The terms used in Table 1 for the description of the model of autonomic space
by Berntson et al. (1991) are as follows. Coupled modes means activation of
the autonomic branches interdependently from each other. Coupled activation
can be reciprocal activation, or negatively correlated, resulting in reciprocal
sympathetic activation or reciprocal parasympathetic activation. Increasing
activity of one branch in association with decreasing activity of the other branch
is called reciprocal. On the other hand, coupled activation could be non-
reciprocal activation, or positively correlated. The effect of which results in
coactivation or coinhibition. Coactivation is concurrent activation of sympathetic
and parasympathetic control, while coinhibition is concurrent inhibition of
sympathetic and parasympathetic control. Uncoupled modes are selective
distinct changes in parasympathetic and sympathetic activity, resulting either in
activation or in withdrawal. Uncoupled activation and uncoupled withdrawal can
either be caused by sympathetic or parasympathetic activity.
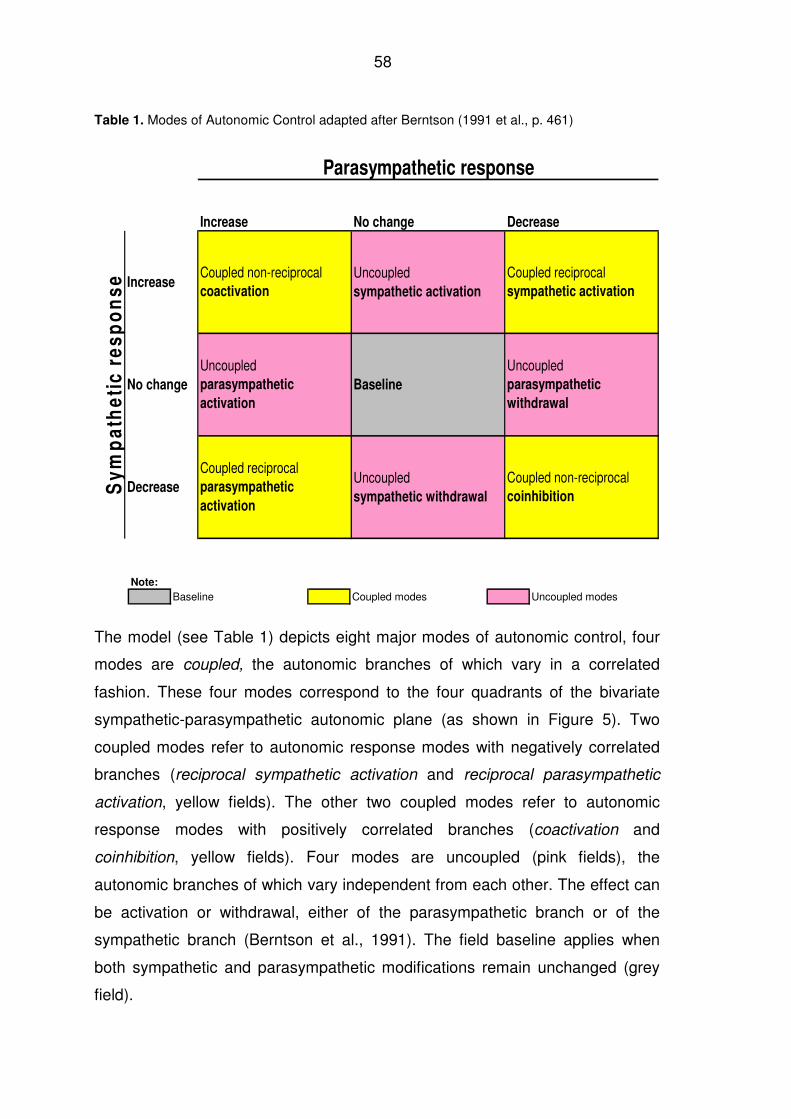
58
Table 1. Modes of Autonomic Control adapted after Berntson (1991 et al., p. 461)
Parasympathetic response
Increase No change Decrease
Sy
mp
ath
eti
c r
es
po
ns
e Increase
No change
Decrease
Coupled non-reciprocal coactivation
Coupled non-reciprocal coinhibition
Baseline
Uncoupled parasympathetic
withdrawal
Uncoupled sympathetic withdrawal
Coupled reciprocal parasympathetic
activation
Uncoupled sympathetic activation
Coupled reciprocal sympathetic activation
Uncoupled parasympathetic
activation
Note:
Baseline Coupled modes Uncoupled modes
The model (see Table 1) depicts eight major modes of autonomic control, four
modes are coupled, the autonomic branches of which vary in a correlated
fashion. These four modes correspond to the four quadrants of the bivariate
sympathetic-parasympathetic autonomic plane (as shown in Figure 5). Two
coupled modes refer to autonomic response modes with negatively correlated
branches (reciprocal sympathetic activation and reciprocal parasympathetic
activation, yellow fields). The other two coupled modes refer to autonomic
response modes with positively correlated branches (coactivation and
coinhibition, yellow fields). Four modes are uncoupled (pink fields), the
autonomic branches of which vary independent from each other. The effect can
be activation or withdrawal, either of the parasympathetic branch or of the
sympathetic branch (Berntson et al., 1991). The field baseline applies when
both sympathetic and parasympathetic modifications remain unchanged (grey
field).
59
Below there are examples for the different categories of autonomic control
mentioned by Berntson et al. (1991).
Coupled reciprocal mode: The baroreflex control of heart circulation represents
a typical coupled reciprocal functioning (Koizumi, Terui, & Kollai, 1983).
Coupled non-reciprocal mode: Coactivation or coinhibition can occur when two
different organs are involved in the sympathetic and parasympathetic activation.
During a strong fear reaction in accordance to Cannon (1939) the sympathetic
arousal would increase the heart rate and, simultaneously, increase the
parasympathetic activation in the bladder, resulting in emptying the bladder. In
this case two organs are concurrently activated. The concurrent activation of
one organ by the sympathetic and parasympathetic branch is another form of a
coupled nonreciprocal mode. Evidence for this was given in animal studies
where stress evoked coactivity of both sympathetic and vagal activity over the
same target organ, e.g. pancreatic secretions (Gellhorn, Cortell, & Feldman,
1941).
Uncoupled mode: Pupillary light and accommodation reflexes are mentioned to
be mediated by variations in parasympathetic control only, which is considered
as uncoupled parasympathetic activation (Berntson et al., 1991). The change of
heart rate response during a reaction time was found to be an uncoupled
sympathetic activation when activated by sympathetic input only (Pollak &
Obrist, 1988).
1.7.3.1 Principles of the model of autonomic space
For the model of autonomic space three formal principles are nominated by
Berntson et al. (1991):
(1) The principle of dual innervation is subsumed under innervation, that
means that visceral organs may be innervated one by one or by the
sympathetic as well as the parasympathetic branch.
60
(2) The principal of functional antagonism of sympathetic and
parasympathetic activity will be replaced by a conjoint action, therefore
both antagonism and synergism of the branches can be found.
(3) The principal of reciprocal control is replaced by multiple modes, that
means that the control over sympathetic and parasympathetic
innervation may be reciprocal, nonreciprocal, or uncoupled.
In addition to these principles, there are some regularities concluded from the
model of autonomic space (Berntson et al., 1991):
(1) Directional stability: as soon as the reciprocal mode is given, it is
irrelevant whether parasympathetic or sympathetic activation changes;
the direction of change remains the same.
(2) For nonreciprocal modes, i.e. coactivation and coinhibiton, the
direction of change is extremely variable. It could also be that there is no
change of direction at all, when changes of sympathetic and
parasympathetic activation equal each other.
(3) For uncoupled modes the direction of change is unidirectional, as is
the case with reciprocal modes.
1.7.3.2 Practicability of the model of autonomic space
According to Cacioppo and Berntson (1992) the behavioral context can evoke a
wide range of autonomic response modes. Different modes of autonomic
control in dependence of the kind of stress were shown by Berntson, Cacioppo,
and Fieldstone (1996). The autonomic response was determined with the
following non-invasive indices: sympathetic activity by pre-ejection period (PEP)
of heart period and parasympathetic activity by RSA. In addition,
pharmacological blockades were done, to find out the individual’s intrinsic heart
period. Berntson et al. (1996) showed that tasks with minimal cognitive demand
(visual illusion) evoked vagal dominance in the absence of sympathetic
reactivity, though considerable attentional stimuli were evoked through that
task. In comparison to a mental arithmetic task which was supposed to be
61
cognitive demanding the latter task showed a reciprocal pattern, sympathetic
activation and vagal withdrawal. Neither PEP nor RSA responses were
correlated across the illusion and arithmetic tasks. Thus, the bivariate model of
Berntson et al. (1991) allows an accurate mapping between psychological
processes and autonomic responding. Only through the wider range of
autonomic modes including uncoupled modes, besides bipolar modes, the
autonomic patterns dependent on the specific task become apparent.
In the study of Berntson et al. (1994) the reactive autonomic control of the heart
was compared in individuals who were exposed to an orthostatic stress and
confronted with stress tasks like speech stress, mental arithmetic, and a
reaction time task. Sympathetic and parasympathetic innervation was
determined by pharmacological blockades. On the group effect the orthostatic
and psychological stressors reflected a similar pattern, i.e. sympathetic
activation and parasympathetic withdrawal. But during psychological stress,
individual’s differences within the patterns of autonomic response were
remarkably different. The individual’s different response patterns were
consistent across the stress situations. Only the sensitivity of the model of
autonomic space combined with the calculations of the blockade data made the
sensitive distinction between stressors and individual’s autonomic response
patterns possible.
The animal study of Iwata and LeDoux (1988) showed that psychological
variables - the different learning history of fear - have an impact on the
autonomic reaction. When only considering the HR measures no difference in
learning history was apparent. Berntson et al. (1993b) showed through
pharmacological selective blockade the underlying mechanism that led to the
same HR in conditioned and pseudoconditioned animals. Pseudoconditioning
stands for nonassociative learning, when the aversive stimulus is
unsystematically paired with the conditioned stimulus, without involving the
central networks of the brain. Only specific pharmacological blockades with
propanolol and atropine indicated that the pseudoconditioning was initiated
through a selective sympathetic activation. The classical conditioning, however,
62
was initiated by sympathetic and parasympathetic coactivation. The method of
conditioning permitted a differentiation of groups. Conditioned aversive stimuli
evoked the mode uncoupled coactivity. That might be of importance for the
explanation of different tachycardiac, brachycardiac or biphasic autonomic
responses (Berntson et al., 1993b). Only the model of autonomic space showed
the relation between different psychological variables and the depending
autonomic pattern.
1.8 Research hypotheses
The following hypotheses are formed:
Hypothesis 1
Behavioral, physiological, and psychological stress reaction will change during
the fear of flying seminar (Beckham et al., 1990; Ekeberg et al., 1990, Haug et
al., 1987; Kraaij et al., 2003; Krinj et al., 2007; van Gerwen et al., 2006; Wilhelm
& Roth, 1998). This hypothesis can be endorsed in detail:
• Participants of the fear of flying seminar change their avoidance behavior
and will take part in the real flights despite their fear of flying.
• Context, situation, and physical environment during the seminar affect the
physiological and psychological response patterns of individuals
differently.
• Increased sympathetic activity accompanied by reduced parasympathetic
cardiac activation is expected for people with fear of flying as described by
Wilhelm and Roth (1998). HR during the flight serves as a valid indicator
for anxiety during specific threatening situations, as described by Haug et
al. (1987). Anxiety is accompanied by decreased range of heart rate
variability (HRV) and reduced vagal tone (e.g. Friedman & Thayer, 1998b;
Porges, 1995, 2007; Yeragani et al., 1998).
63
• Psychological ratings taken before and after the treatment seminar mirror
the efficiency of the seminar.
• The salivary cortisol level is expected to be higher in individuals with fear
of flying in a real flight situation compared to individuals who have no fear
of flying in accordance to the findings referring to panic attacks in
naturalistic settings (Bandelow et al., 2000).
• During the flights reduced oxygen saturation levels are observed in
individuals, as also has been observed by Humphreys et al. (2005). There
is a relation between reduced oxygen saturation level and the level of
anxiety sensitivity according to Bogaerde and De Raedt (2007).
Hypothesis 2
The model of autonomic space as described by Berntson at al. (1991) gives
additional information concerning the sympathetic and the parasympathetic
autonomic activation related to fear of flying, considering multiple cardiac
modes rather than reciprocal modes.
2 Material and methods
2.1 Design
The investigation followed a 2/3 × 55/24/14/6/2 quasi experimental design with
the factors Group and Time on Task (as a repeated factor; varying by the
number of levels according to the dependent variable to be analyzed). Two
groups (low and high anxiety persons) were included in the entire recording
period (including seminar days), and 3 groups (by adding a control group) for
the real flights. Time on Task for physiological recordings were 55 time points
for the whole physiological recording period and 24 time points for the real flight
recordings. Time on Task for questionnaire data were 14 time points for the
whole recording period and 6 time points for the real flight epoch, and 2 time
points (pre vs. post seminar) for anxiety questionnaires.
64
2.2 Subjects
Twenty-four participants (15 female, 9 male) with ages ranging from 29 to 52
years from three Austrian Airlines’ Fear of Flying Seminars agreed to participate
voluntarily and unpaid in the study. Participants of the seminar were grouped
into Moderate-Anxious and High-Anxious according to their score on the
subscale generalized flight anxiety of the Flight Anxiety Situations (FAS)
questionnaire (van Gerwen et al., 1999). This scale was chosen as group
discriminator because according to van Gerwen et al. (1999) it reflects the
extent to which flight anxiety is generalized or has become strongly conditioned.
The scores of the scale range from 0 = no generalized anxiety to 28 = extreme
generalized anxiety. The raw scores of the subjects of the present study ranged
from 7 to 26 with an average score of 13.5 serving as group discriminator; 15
Moderate-Anxious persons and 9 High-Anxious persons formed the groups.
The control group was formed by 9 office employees (4 female, 5 male, with
ages ranging from 22 to 43 years) of Austrian Airlines on a flight in their leisure
time. As can be seen in Table 2 all groups had different flying histories
regarding the number of flights, extent of fear during the last flights, and
interventions during the past. All participants were physically healthy and had
not taken any psycho-pharmacological medication before the treatment seminar
started or during the seminar. Demographic variables of subjects are shown in
Table 2.
2.3 Feasibility check of study
In order to prove the feasibility of conducting the comprehensive research and
collecting questioning data during fear of flying seminar without disturbing the
intervention several pre-tests including flights were conducted. These pre-tests
were the basis for the assessment of the procedure and were intended that the
organizer and staff of the fear of flying seminar would get involved and familiar
with the kind of research, including measuring instruments and including the
technical understanding of the measuring.
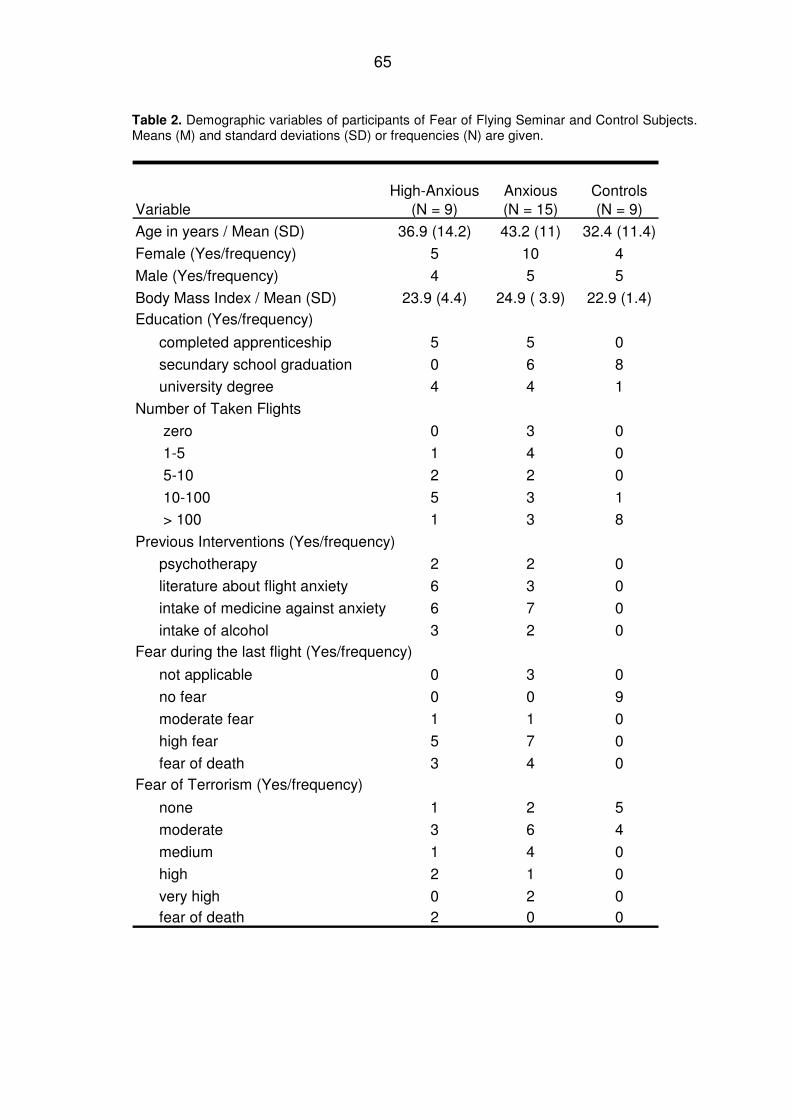
65
Table 2. Demographic variables of participants of Fear of Flying Seminar and Control Subjects. Means (M) and standard deviations (SD) or frequencies (N) are given.
VariableHigh-Anxious
(N = 9)Anxious (N = 15)
Controls (N = 9)
Age in years / Mean (SD) 36.9 (14.2) 43.2 (11) 32.4 (11.4)
Female (Yes/frequency) 5 10 4
Male (Yes/frequency) 4 5 5
Body Mass Index / Mean (SD) 23.9 (4.4) 24.9 ( 3.9) 22.9 (1.4)Education (Yes/frequency)
completed apprenticeship 5 5 0
secundary school graduation 0 6 8
university degree 4 4 1
Number of Taken Flights
zero 0 3 0
1-5 1 4 0
5-10 2 2 0
10-100 5 3 1
> 100 1 3 8
Previous Interventions (Yes/frequency)
psychotherapy 2 2 0
literature about flight anxiety 6 3 0
intake of medicine against anxiety 6 7 0
intake of alcohol 3 2 0Fear during the last flight (Yes/frequency)
not applicable 0 3 0
no fear 0 0 9
moderate fear 1 1 0
high fear 5 7 0
fear of death 3 4 0Fear of Terrorism (Yes/frequency)
none 1 2 5
moderate 3 6 4
medium 1 4 0
high 2 1 0
very high 0 2 0fear of death 2 0 0
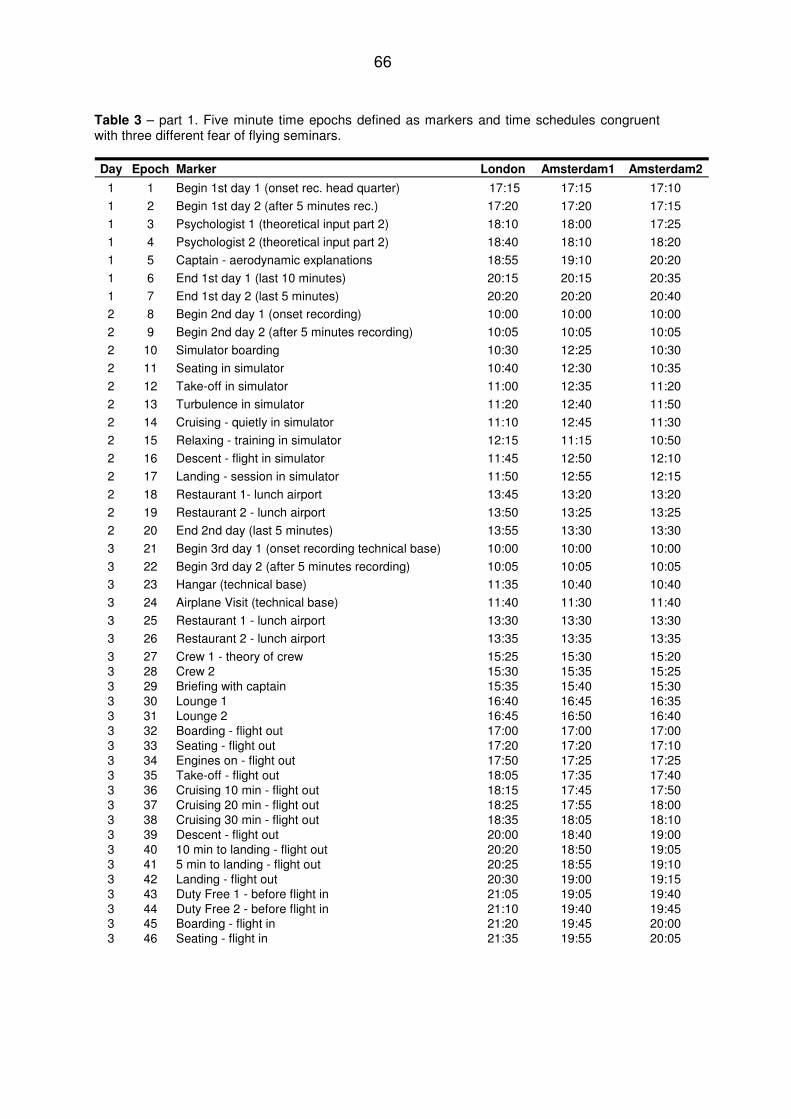
66
Table 3 – part 1. Five minute time epochs defined as markers and time schedules congruent with three different fear of flying seminars.
Day Epoch Marker London Amsterdam1 Amsterdam2
1 1 Begin 1st day 1 (onset rec. head quarter) 17:15 17:15 17:10
1 2 Begin 1st day 2 (after 5 minutes rec.) 17:20 17:20 17:15
1 3 Psychologist 1 (theoretical input part 2) 18:10 18:00 17:25
1 4 Psychologist 2 (theoretical input part 2) 18:40 18:10 18:20
1 5 Captain - aerodynamic explanations 18:55 19:10 20:20
1 6 End 1st day 1 (last 10 minutes) 20:15 20:15 20:35
1 7 End 1st day 2 (last 5 minutes) 20:20 20:20 20:40
2 8 Begin 2nd day 1 (onset recording) 10:00 10:00 10:00
2 9 Begin 2nd day 2 (after 5 minutes recording) 10:05 10:05 10:05
2 10 Simulator boarding 10:30 12:25 10:30
2 11 Seating in simulator 10:40 12:30 10:35
2 12 Take-off in simulator 11:00 12:35 11:20
2 13 Turbulence in simulator 11:20 12:40 11:50
2 14 Cruising - quietly in simulator 11:10 12:45 11:30
2 15 Relaxing - training in simulator 12:15 11:15 10:50
2 16 Descent - flight in simulator 11:45 12:50 12:10
2 17 Landing - session in simulator 11:50 12:55 12:15
2 18 Restaurant 1- lunch airport 13:45 13:20 13:20
2 19 Restaurant 2 - lunch airport 13:50 13:25 13:25
2 20 End 2nd day (last 5 minutes) 13:55 13:30 13:30
3 21 Begin 3rd day 1 (onset recording technical base) 10:00 10:00 10:00
3 22 Begin 3rd day 2 (after 5 minutes recording) 10:05 10:05 10:05
3 23 Hangar (technical base) 11:35 10:40 10:40
3 24 Airplane Visit (technical base) 11:40 11:30 11:40
3 25 Restaurant 1 - lunch airport 13:30 13:30 13:30
3 26 Restaurant 2 - lunch airport 13:35 13:35 13:35
3 27 Crew 1 - theory of crew 15:25 15:30 15:203 28 Crew 2 15:30 15:35 15:253 29 Briefing with captain 15:35 15:40 15:303 30 Lounge 1 16:40 16:45 16:353 31 Lounge 2 16:45 16:50 16:403 32 Boarding - flight out 17:00 17:00 17:003 33 Seating - flight out 17:20 17:20 17:103 34 Engines on - flight out 17:50 17:25 17:253 35 Take-off - flight out 18:05 17:35 17:403 36 Cruising 10 min - flight out 18:15 17:45 17:503 37 Cruising 20 min - flight out 18:25 17:55 18:003 38 Cruising 30 min - flight out 18:35 18:05 18:103 39 Descent - flight out 20:00 18:40 19:003 40 10 min to landing - flight out 20:20 18:50 19:053 41 5 min to landing - flight out 20:25 18:55 19:103 42 Landing - flight out 20:30 19:00 19:153 43 Duty Free 1 - before flight in 21:05 19:05 19:403 44 Duty Free 2 - before flight in 21:10 19:40 19:453 45 Boarding - flight in 21:20 19:45 20:003 46 Seating - flight in 21:35 19:55 20:05
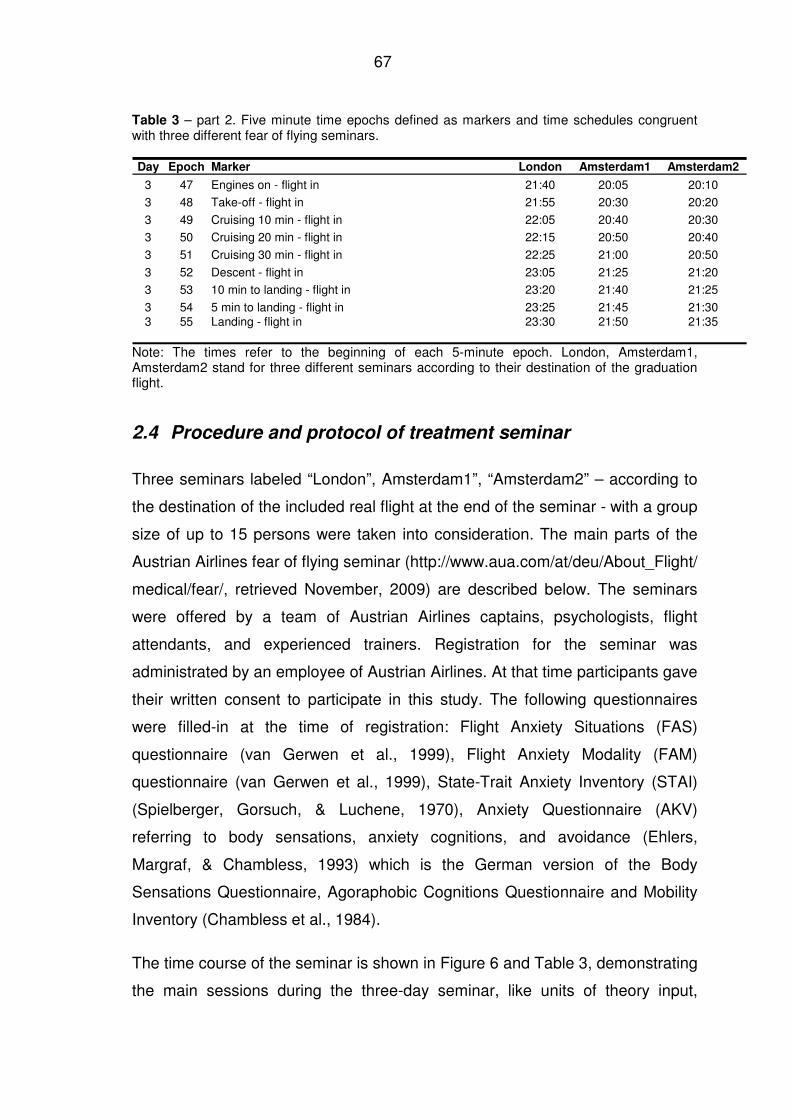
67
Table 3 – part 2. Five minute time epochs defined as markers and time schedules congruent with three different fear of flying seminars.
Day Epoch Marker London Amsterdam1 Amsterdam2
3 47 Engines on - flight in 21:40 20:05 20:10
3 48 Take-off - flight in 21:55 20:30 20:20
3 49 Cruising 10 min - flight in 22:05 20:40 20:30
3 50 Cruising 20 min - flight in 22:15 20:50 20:40
3 51 Cruising 30 min - flight in 22:25 21:00 20:50
3 52 Descent - flight in 23:05 21:25 21:20
3 53 10 min to landing - flight in 23:20 21:40 21:25
3 54 5 min to landing - flight in 23:25 21:45 21:303 55 Landing - flight in 23:30 21:50 21:35
Note: The times refer to the beginning of each 5-minute epoch. London, Amsterdam1, Amsterdam2 stand for three different seminars according to their destination of the graduation flight.
2.4 Procedure and protocol of treatment seminar
Three seminars labeled “London”, Amsterdam1”, “Amsterdam2” – according to
the destination of the included real flight at the end of the seminar - with a group
size of up to 15 persons were taken into consideration. The main parts of the
Austrian Airlines fear of flying seminar (http://www.aua.com/at/deu/About_Flight/
medical/fear/, retrieved November, 2009) are described below. The seminars
were offered by a team of Austrian Airlines captains, psychologists, flight
attendants, and experienced trainers. Registration for the seminar was
administrated by an employee of Austrian Airlines. At that time participants gave
their written consent to participate in this study. The following questionnaires
were filled-in at the time of registration: Flight Anxiety Situations (FAS)
questionnaire (van Gerwen et al., 1999), Flight Anxiety Modality (FAM)
questionnaire (van Gerwen et al., 1999), State-Trait Anxiety Inventory (STAI)
(Spielberger, Gorsuch, & Luchene, 1970), Anxiety Questionnaire (AKV)
referring to body sensations, anxiety cognitions, and avoidance (Ehlers,
Margraf, & Chambless, 1993) which is the German version of the Body
Sensations Questionnaire, Agoraphobic Cognitions Questionnaire and Mobility
Inventory (Chambless et al., 1984).
The time course of the seminar is shown in Figure 6 and Table 3, demonstrating
the main sessions during the three-day seminar, like units of theory input,
68
simulator, and real flights. A detailed description of the specific epochs is given
in chapter 2.6.1.
2.4.1 First day of seminar
Participants met at the Austrian Airlines head office, in Vienna, Austria. The
session lasted approximately 3.5 hours and aimed at providing information
about relevant psychological factors involved in fear and anxiety, to introduce
models of panic and anxiety, to describe personal fear experiences in group
atmosphere, and to give information about the aerodynamics of flying.
Participants of this study had to arrive an hour in advance to get familiar with
the physiological devices and the ECG recorder was attached. The
experimenter, a clinical psychologist, collected the questionnaires. She
explained (a) the handling of the pulse-oximeter, (b) the filling in of measured
values of oxygen saturation and pulse in a form sheet, (c) the ratings of fear and
mood during the proceeding seminar, and (d) how to check whether the
electrodes were properly adjusted to ensure proper ECG recordings. At the end
of the first seminar day electrodes were detached. Data readout and clearance
of memory chip of the ECG recorder followed during the night. The
experimenter noted the time schedule of the seminar and the specific epochs,
time epochs 1 through 7 from Table 3 were selected for comparison.
2.4.2 Second day of seminar
Locations were the Airbus-simulator (a realistic model of an aircraft cabin) at the
technical base station, the crew training centre, the restaurant, and air-traffic
control, all at Schwechat Airport, Austria. The session lasted approximately
seven hours. The aims were confrontation and familiarization with flight
situations in a simulated flight, the learning of relaxation techniques, cognitive
restructuring, training of coping skills, building confidence in aircraft-crew, and
to show the security of air-traffic control management.
After preparing and attaching the measuring equipment the training sequence
started in the flight simulator, where a flight attendant explained announcements
69
and the safety system of the flight crew. Two flights were simulated including
turbulences and instructions of cabin crew. A video-system monitored an
environment during take-off and landing. Participants learned techniques to deal
with their fear including relaxation techniques. Lunch was taken at the airport
restaurant with panoramic view to the runway, the captain joined the group, and
together with the trainer of the course apprehensions toward flying were
outlined. In the afternoon a visit to the air-traffic control tower followed. Data
readout was undertaken during night. Time epochs 8 through 20 from Table 3
were selected for comparison.
2.4.3 Third day of seminar
Locations were all around the airport, Schwechat, Austria, i.e. technical base,
hangar, restaurant, crew-building, terminal, lounge, airplane, and duty free
zone. This session lasted approximately 13 hours altogether and aimed at
providing technical and aerodynamic information, the desensibilisation of fear,
the training in a simulator, affirmation of safety in air-traffic, confidence in
professionalism of staff concerned with air-travel business, in-vivo
implementation of learned cognitive behavioral techniques, and revision of
positive management of handling fear. After preparing and attaching measuring
equipment, the training sequence started with a lecture held by an aircraft
technician and a guided tour through the hangar of the airport followed by
explaining an aircraft which was there for maintenance. First the technician
responded to any questions and fears of participants, that was followed by
sitting in the cockpit and the introduction of instruments, and trying out different
seating sections. Psychological interventions were repeated and retrained. The
seminar continued with having lunch in the panoramic restaurant together with
the captain, the co-pilot, and the senior flight attendant of the imminent flight.
Afterwards participants entered the crew building and had lectures about the job
description and requirements of flight attendants and their professional training.
After repeating relaxation techniques, participants entered the captain’s briefing
area where they were informed about several flight preparations. The group
moved on to the departure area, checked in, passed the security-check with a
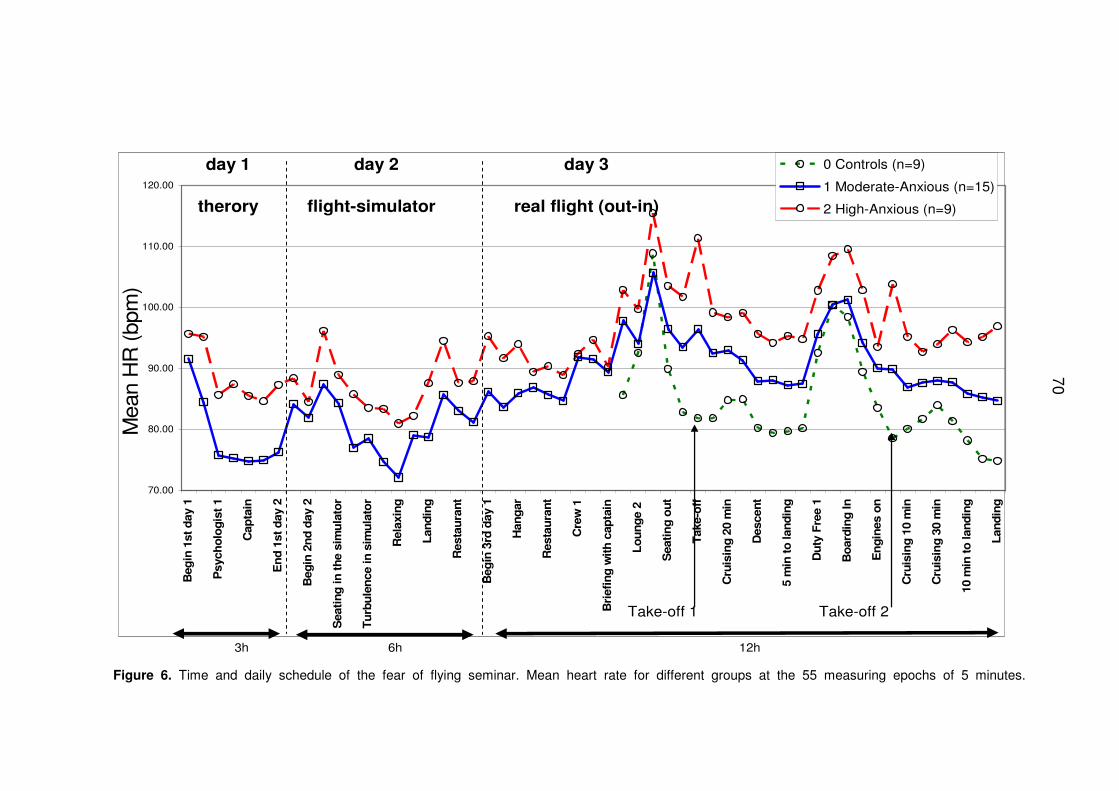
70
3h 6h 12h
70.00
80.00
90.00
100.00
110.00
120.00B
eg
in 1
st
day 1
Psych
olo
gis
t 1
Cap
tain
En
d 1
st
day 2
Beg
in 2
nd
day 2
Seati
ng
in
th
e s
imu
lato
r
Tu
rbu
len
ce in
sim
ula
tor
Rela
xin
g
Lan
din
g
Resta
ura
nt
Beg
in 3
rd d
ay 1
Han
gar
Resta
ura
nt
Cre
w 1
Bri
efi
ng
wit
h c
ap
tain
Lo
un
ge 2
Seati
ng
ou
t
Take-o
ff
Cru
isin
g 2
0 m
in
Descen
t
5 m
in t
o lan
din
g
Du
ty F
ree 1
Bo
ard
ing
In
En
gin
es o
n
Cru
isin
g 1
0 m
in
Cru
isin
g 3
0 m
in
10 m
in t
o lan
din
g
Lan
din
g
0 Controls (n=9)
1 Moderate-Anxious (n=15)
2 High-Anxious (n=9)
Mea
n H
R (
bpm
)
day 1
therory
Take-off 1 Take-off 2
day 3
real flight (out-in)
day 2
flight-simulator
Figure 6. Time and daily schedule of the fear of flying seminar. Mean heart rate for different groups at the 55 measuring epochs of 5 minutes.
70
71
special security allowance for ECG-devices, and gathered in the lounge shortly
before the flight. The selected time epochs were 21 to 31 from Table 3. At that
time the control subjects joined the fear of flying seminar group and met with the
experimenter (time epochs 30, 31), who fixed the ECG recording equipment.
Seminar participants and controls followed the same further procedure of
seminar, boarding an airbus A 320 for the commercial flight to Amsterdam or
London depending on the respective Seminar (see Table 3). After arrival at the
flight destination participants walked around in the duty free shopping area and
re-boarded for the return trip to Vienna. After landing, certificates for the
graduation flight were distributed and all recording devices and rating forms
were collected. The participants were asked to rate their anxiety and fear of
flying again on the next day and to return their ratings to the experimenter by
mail. Finally the group was seen off. Time epochs related to the flight were 32
through 55 as described in Table 3.
2.5 Recordings and equipment
2.5.1 Electrocardiogram
Continuous ambulatory recordings of electrocardiogram (ECG; a holter ECG
MK3 Scientific TOM Medical, Austria) with a total recording time of 26 hours (3
hours on the first seminar day, 6 hours on the second seminar day and 12
hours on the third seminar day) were conducted. Data of ECG recordings were
recorded on a compact flash memory card (ScanDisk Inc.) in the portable ECG
recorder and stored on a personal computer.
The skin was cleaned with alcohol, 3M one way Ag/AgCl electrodes were used
for all recordings. Settings of TOM for data prefiltering before calculation of N to
N intervals were from 300 ms to 2000 ms, interval decrease maximum 30%,
increase maximum 30%, HR beats per minute minimum 30, maximum 200,
respiration frequency recordings were set valid for 6 to 20 cycles per minute,
window size was 5 min, digitalization and pre-processing of N to N intervals was
done with a digitalization rate of 4 kHz.
72
2.5.2 Fingertip pulse oximeter
Peripheral oxygen saturation of arterial haemoglobin and pulse rate were
measured by pulse-oximeter, Nonin Onyx Model 9500. The spot measurements
of oxygen saturation (SpO2) were taken through participants’ fingers at 10
different time points, namely 1, 6, 8, 14, 21, 30, 36, 39, 49, 52 (see Table 3 and
the chapter on data reduction for more details).
2.5.3 Salivary cortisol
Saliva samples of cortisol were collected with cotton swabs in tubes from two
real flights out of Vienna during descent flight (epoch 39), and were collected at
the same time of day in all flights considering circadian variations. Samples
were refrigerated and concentration in ng/ml was analyzed at the laboratory of
the Institute for Environmental Hygiene of the Medical University of Vienna.
2.5.4 Blood pressure
Arterial pressure was intended to be analyzed as well, but the pre-tests had
shown that taking the measurements was too laborious in a natural environment
and would disturb the ongoing seminar since participants would focus their
attention to their measured values and would be distracted.
2.6 Data reduction
2.6.1 Definition of specific epochs
The 26 hours of continuous ECG recordings were reduced by defining relevant
time epochs for the analysis. The seminar procedure was explored by
preliminary investigations including the attendance of three seminars. The
procedure was known, although the sequence of particular procedures could
vary. Fifty-five time epochs of 5 minutes each were chosen in advance following
a standard protocol, resulting in 7 epochs on the first day, 13 epochs on the
second day during confrontation in the simulator, and 35 epochs on the third
day. Mean values were computed for each of the 5-minute epochs
73
corresponding to specific situations as presented in Table 3. Epochs 1, 2, 8, 9,
21, and 22 represent the individual onset-time of recording of each seminar day.
The description of the 55 epochs in detail: (1) first five minutes of recording on
the first day, (2) second five minutes of recording on the first day, (3) theoretical
input of psychologist, (4) second part of theoretical input of psychologist, (5)
explanation by the captain, (6) 10 minutes before end of seminar to 5 minutes
before end of seminar on the first day, (7) last five minutes of seminar on the
first day, (8) first five minutes of recording on the second day, (9) second five
minutes of recording on the second day, (10) approaching and boarding the
flight simulator, (11) seating and buckling up in the simulator, (12) take-off in the
simulator, (13) turbulence in simulator, (14) cruising quietly in simulator, (15)
relaxation training in simulator, (16) descent flight in simulator, (17) landing in
simulator, (18) first five-minutes sequence during lunch together with
psychologist and the crew at the airport restaurant with view to the runway, (19)
second five-minutes sequence during lunch together with psychologist and the
crew at the airport restaurant with view to the runway, (20) last five minutes of
seminar on the second day, (21) first five minutes of recording on the third day,
(22) second five minutes of recording on the third day, (23) explanations by a
technician at the aircraft hangar, (24) visit of an aircraft on ground, (25) first five-
minute sequence during lunch with psychologist, captain, and crew at the
airport restaurant (26) second five-minute sequence during lunch with
psychologist, captain, and crew at the airport restaurant, (27) aerodynamic
information of crew at the crew building, (28) information about training and job
requirements of crew members at the crew building, (29) briefing by the captain
by explaining preparations before the flight at the briefing hall, (30) first five
minutes in the lounge before boarding, (31) second five minutes staying in the
lounge before boarding, (32) boarding the aircraft for the flight out of Vienna,
(33) seating and buckling up in the aircraft, (34) engines on, (35) take-off, (36)
cruising 10 minutes after take off, (37) cruising 20 minutes after take off, (38)
cruising 30 minutes after take off, (39) descent flight, (40) 10 minutes to landing,
(41) 5 minutes to landing, (42) landing in Amsterdam or London, (43) first five-
minute sequence when walking in the duty free shopping area, (44) second five-
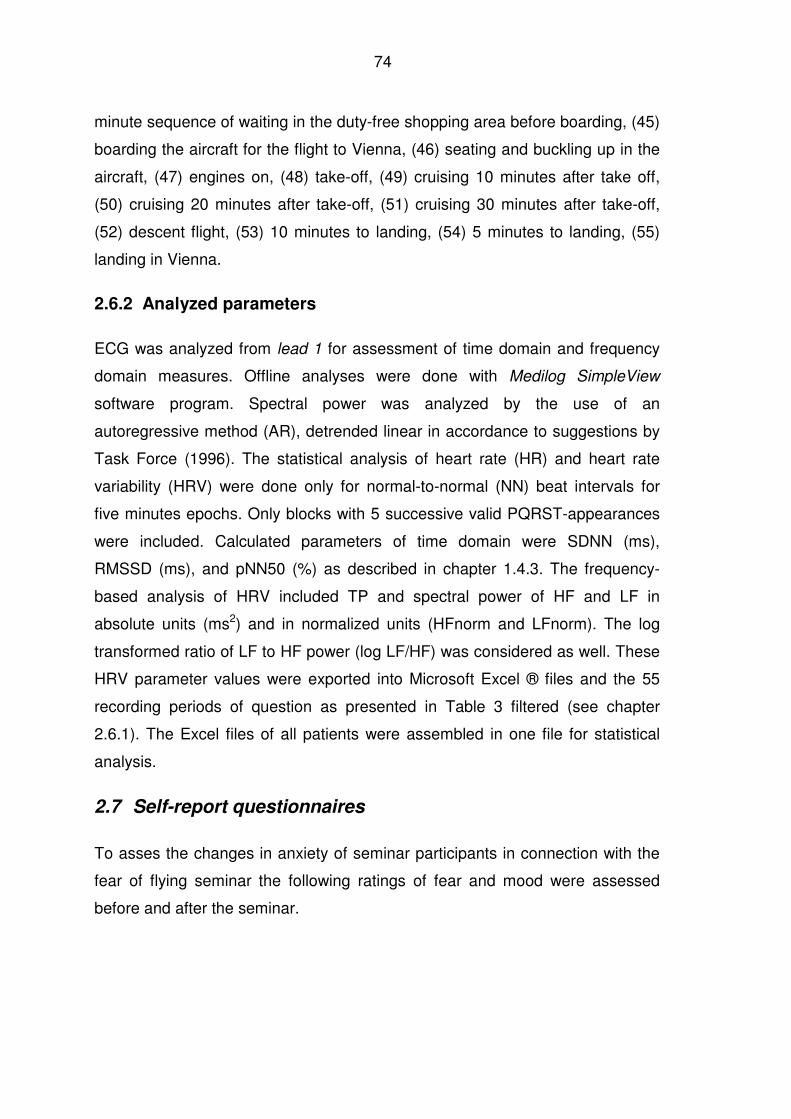
74
minute sequence of waiting in the duty-free shopping area before boarding, (45)
boarding the aircraft for the flight to Vienna, (46) seating and buckling up in the
aircraft, (47) engines on, (48) take-off, (49) cruising 10 minutes after take off,
(50) cruising 20 minutes after take-off, (51) cruising 30 minutes after take-off,
(52) descent flight, (53) 10 minutes to landing, (54) 5 minutes to landing, (55)
landing in Vienna.
2.6.2 Analyzed parameters
ECG was analyzed from lead 1 for assessment of time domain and frequency
domain measures. Offline analyses were done with Medilog SimpleView
software program. Spectral power was analyzed by the use of an
autoregressive method (AR), detrended linear in accordance to suggestions by
Task Force (1996). The statistical analysis of heart rate (HR) and heart rate
variability (HRV) were done only for normal-to-normal (NN) beat intervals for
five minutes epochs. Only blocks with 5 successive valid PQRST-appearances
were included. Calculated parameters of time domain were SDNN (ms),
RMSSD (ms), and pNN50 (%) as described in chapter 1.4.3. The frequency-
based analysis of HRV included TP and spectral power of HF and LF in
absolute units (ms2) and in normalized units (HFnorm and LFnorm). The log
transformed ratio of LF to HF power (log LF/HF) was considered as well. These
HRV parameter values were exported into Microsoft Excel ® files and the 55
recording periods of question as presented in Table 3 filtered (see chapter
2.6.1). The Excel files of all patients were assembled in one file for statistical
analysis.
2.7 Self-report questionnaires
To asses the changes in anxiety of seminar participants in connection with the
fear of flying seminar the following ratings of fear and mood were assessed
before and after the seminar.
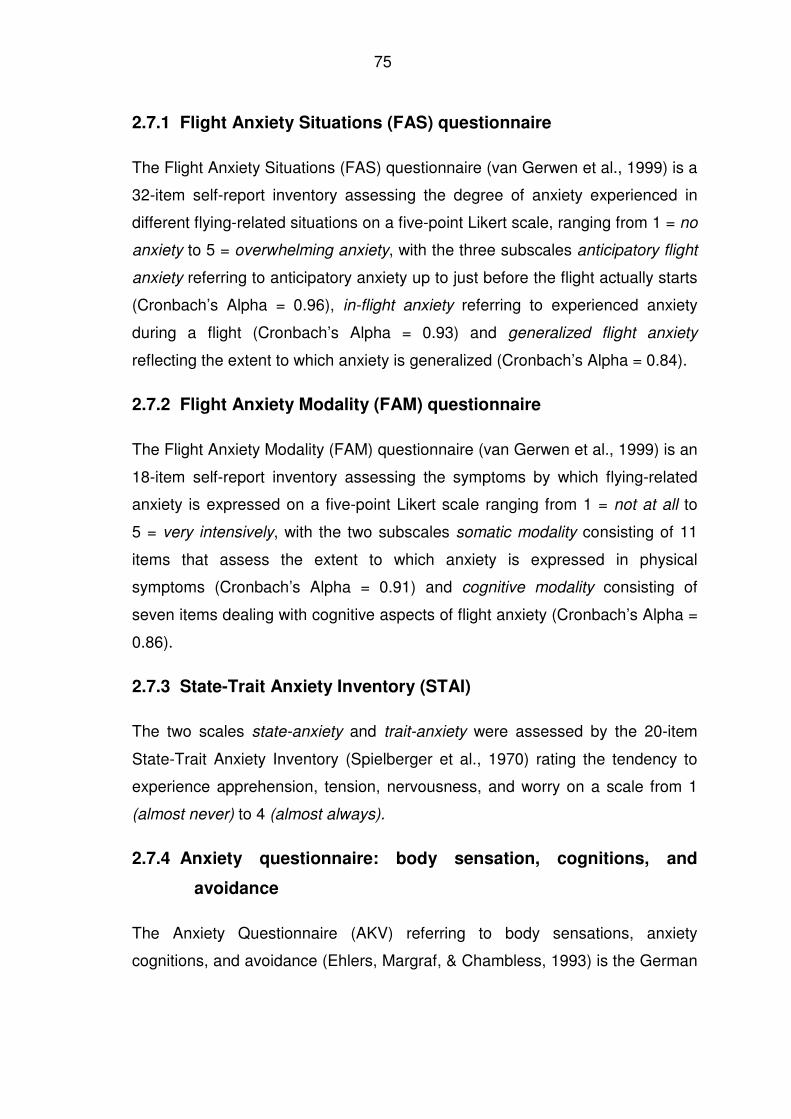
75
2.7.1 Flight Anxiety Situations (FAS) questionnaire
The Flight Anxiety Situations (FAS) questionnaire (van Gerwen et al., 1999) is a
32-item self-report inventory assessing the degree of anxiety experienced in
different flying-related situations on a five-point Likert scale, ranging from 1 = no
anxiety to 5 = overwhelming anxiety, with the three subscales anticipatory flight
anxiety referring to anticipatory anxiety up to just before the flight actually starts
(Cronbach’s Alpha = 0.96), in-flight anxiety referring to experienced anxiety
during a flight (Cronbach’s Alpha = 0.93) and generalized flight anxiety
reflecting the extent to which anxiety is generalized (Cronbach’s Alpha = 0.84).
2.7.2 Flight Anxiety Modality (FAM) questionnaire
The Flight Anxiety Modality (FAM) questionnaire (van Gerwen et al., 1999) is an
18-item self-report inventory assessing the symptoms by which flying-related
anxiety is expressed on a five-point Likert scale ranging from 1 = not at all to
5 = very intensively, with the two subscales somatic modality consisting of 11
items that assess the extent to which anxiety is expressed in physical
symptoms (Cronbach’s Alpha = 0.91) and cognitive modality consisting of
seven items dealing with cognitive aspects of flight anxiety (Cronbach’s Alpha =
0.86).
2.7.3 State-Trait Anxiety Inventory (STAI)
The two scales state-anxiety and trait-anxiety were assessed by the 20-item
State-Trait Anxiety Inventory (Spielberger et al., 1970) rating the tendency to
experience apprehension, tension, nervousness, and worry on a scale from 1
(almost never) to 4 (almost always).
2.7.4 Anxiety questionnaire: body sensation, cognitions, and
avoidance
The Anxiety Questionnaire (AKV) referring to body sensations, anxiety
cognitions, and avoidance (Ehlers, Margraf, & Chambless, 1993) is the German
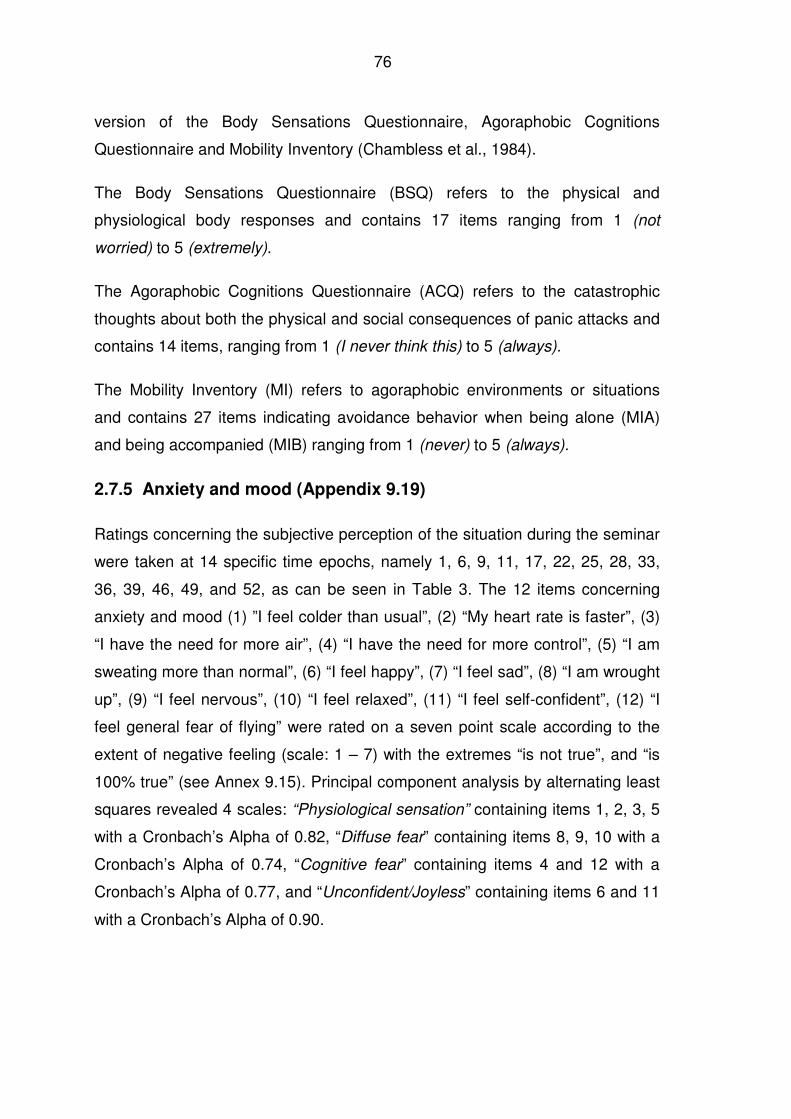
76
version of the Body Sensations Questionnaire, Agoraphobic Cognitions
Questionnaire and Mobility Inventory (Chambless et al., 1984).
The Body Sensations Questionnaire (BSQ) refers to the physical and
physiological body responses and contains 17 items ranging from 1 (not
worried) to 5 (extremely).
The Agoraphobic Cognitions Questionnaire (ACQ) refers to the catastrophic
thoughts about both the physical and social consequences of panic attacks and
contains 14 items, ranging from 1 (I never think this) to 5 (always).
The Mobility Inventory (MI) refers to agoraphobic environments or situations
and contains 27 items indicating avoidance behavior when being alone (MIA)
and being accompanied (MIB) ranging from 1 (never) to 5 (always).
2.7.5 Anxiety and mood (Appendix 9.19)
Ratings concerning the subjective perception of the situation during the seminar
were taken at 14 specific time epochs, namely 1, 6, 9, 11, 17, 22, 25, 28, 33,
36, 39, 46, 49, and 52, as can be seen in Table 3. The 12 items concerning
anxiety and mood (1) ”I feel colder than usual”, (2) “My heart rate is faster”, (3)
“I have the need for more air”, (4) “I have the need for more control”, (5) “I am
sweating more than normal”, (6) “I feel happy”, (7) “I feel sad”, (8) “I am wrought
up”, (9) “I feel nervous”, (10) “I feel relaxed”, (11) “I feel self-confident”, (12) “I
feel general fear of flying” were rated on a seven point scale according to the
extent of negative feeling (scale: 1 – 7) with the extremes “is not true”, and “is
100% true” (see Annex 9.15). Principal component analysis by alternating least
squares revealed 4 scales: “Physiological sensation” containing items 1, 2, 3, 5
with a Cronbach’s Alpha of 0.82, “Diffuse fear” containing items 8, 9, 10 with a
Cronbach’s Alpha of 0.74, “Cognitive fear” containing items 4 and 12 with a
Cronbach’s Alpha of 0.77, and “Unconfident/Joyless” containing items 6 and 11
with a Cronbach’s Alpha of 0.90.
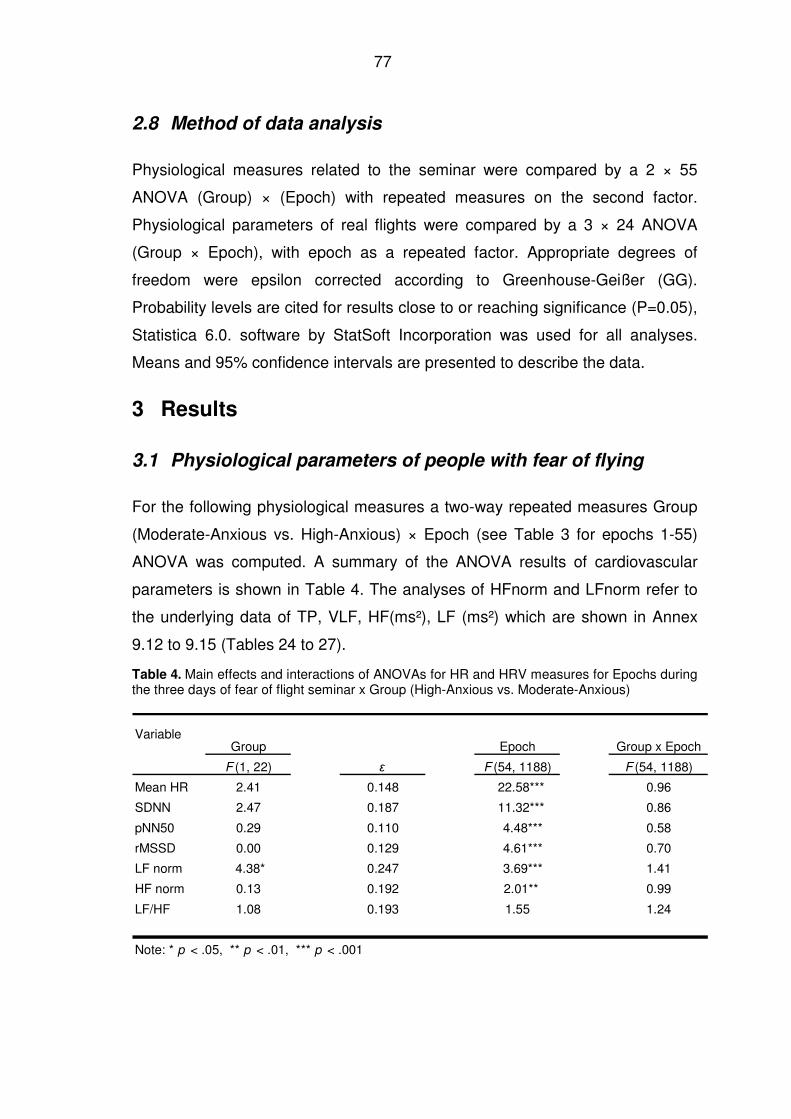
77
2.8 Method of data analysis
Physiological measures related to the seminar were compared by a 2 × 55
ANOVA (Group) × (Epoch) with repeated measures on the second factor.
Physiological parameters of real flights were compared by a 3 × 24 ANOVA
(Group × Epoch), with epoch as a repeated factor. Appropriate degrees of
freedom were epsilon corrected according to Greenhouse-Geißer (GG).
Probability levels are cited for results close to or reaching significance (P=0.05),
Statistica 6.0. software by StatSoft Incorporation was used for all analyses.
Means and 95% confidence intervals are presented to describe the data.
3 Results
3.1 Physiological parameters of people with fear of flying
For the following physiological measures a two-way repeated measures Group
(Moderate-Anxious vs. High-Anxious) × Epoch (see Table 3 for epochs 1-55)
ANOVA was computed. A summary of the ANOVA results of cardiovascular
parameters is shown in Table 4. The analyses of HFnorm and LFnorm refer to
the underlying data of TP, VLF, HF(ms²), LF (ms²) which are shown in Annex
9.12 to 9.15 (Tables 24 to 27).
Table 4. Main effects and interactions of ANOVAs for HR and HRV measures for Epochs during the three days of fear of flight seminar x Group (High-Anxious vs. Moderate-Anxious)
Group Epoch Group x Epoch
F (1, 22) ε F (54, 1188) F (54, 1188)
Mean HR 2.41 0.148 22.58*** 0.96
SDNN 2.47 0.187 11.32*** 0.86
pNN50 0.29 0.110 4.48*** 0.58
rMSSD 0.00 0.129 4.61*** 0.70
LF norm 4.38* 0.247 3.69*** 1.41
HF norm 0.13 0.192 2.01** 0.99
LF/HF 1.08 0.193 1.55 1.24
Note: * p < .05, ** p < .01, *** p < .001
Variable
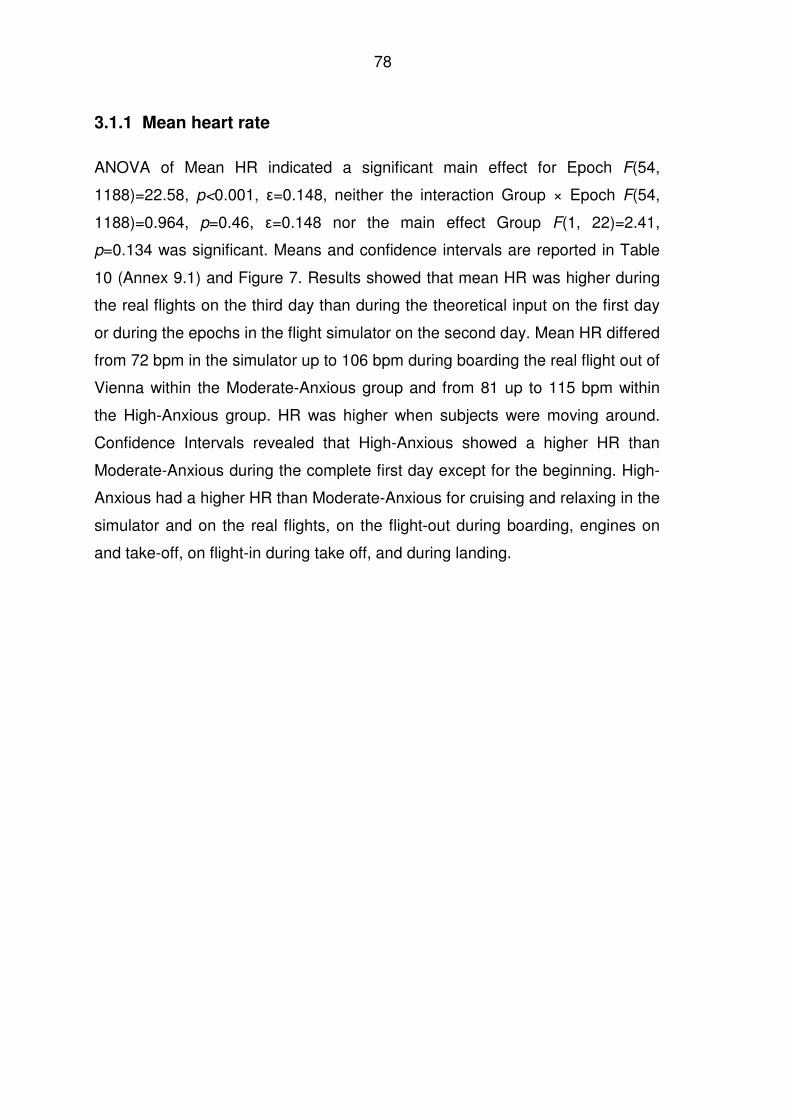
78
3.1.1 Mean heart rate
ANOVA of Mean HR indicated a significant main effect for Epoch F(54,
1188)=22.58, p<0.001, ε=0.148, neither the interaction Group × Epoch F(54,
1188)=0.964, p=0.46, ε=0.148 nor the main effect Group F(1, 22)=2.41,
p=0.134 was significant. Means and confidence intervals are reported in Table
10 (Annex 9.1) and Figure 7. Results showed that mean HR was higher during
the real flights on the third day than during the theoretical input on the first day
or during the epochs in the flight simulator on the second day. Mean HR differed
from 72 bpm in the simulator up to 106 bpm during boarding the real flight out of
Vienna within the Moderate-Anxious group and from 81 up to 115 bpm within
the High-Anxious group. HR was higher when subjects were moving around.
Confidence Intervals revealed that High-Anxious showed a higher HR than
Moderate-Anxious during the complete first day except for the beginning. High-
Anxious had a higher HR than Moderate-Anxious for cruising and relaxing in the
simulator and on the real flights, on the flight-out during boarding, engines on
and take-off, on flight-in during take off, and during landing.
79
Beg
in 1
st d
ay 1
Beg
in 1
st d
ay 2
Psy
chol
ogis
t 1P
sych
olog
ist 2
Cap
tain
End
1st
day
1E
nd 1
st d
ay 2
Beg
in 2
nd d
ay 1
Beg
in 2
nd d
ay 2
Sim
ulat
or b
oard
ing
Sea
ting
Tak
e-of
fT
urbu
lenc
eC
ruis
ing
Rel
axin
gD
esce
ntLa
ndin
gR
esta
uran
t 1R
esta
uran
t 2E
nd 2
nd d
ayB
egin
3rd
day
1B
egin
3rd
day
2H
anga
rA
irpla
ne V
isit
Res
taur
ant 1
Res
taur
ant 2
Cre
w 1
Cre
w 2
Brie
fing
Loun
ge 1
Loun
ge 2
Boa
rdin
g ou
tS
eatin
g ou
tE
ngin
es o
nT
ake-
off
Cru
isin
g 10
min
Cru
isin
g 20
min
Cru
isin
g 30
min
Des
cent
10 m
in to
land
ing
5 m
in to
land
ing
Land
ing
Dut
y F
ree
1D
uty
Fre
e 2
Boa
rdin
g In
Sea
ting
InE
ngin
es o
nT
ake-
off
Cru
isin
g 10
min
Cru
isin
g 20
min
Cru
isin
g 30
min
Des
cent
10 m
in to
land
ing
5 m
in to
land
ing
Land
ing
60
70
80
90
100
110
120
130
140M
ea
n H
R (
bp
m)
Moderate-Anxious High-Anxious
Figure 7. Mean heart rate (HR) of 55 time epochs of the three-day lasting fear of flying seminar for two groups of subjects with flight anxiety. Means +/-95% confidence intervals
79
80
3.1.2 Heart rate variability
ANOVA of SDNN showed a significant main effect for Epoch F(54, 1188)=11.321,
p<.001, ε=0.187. The main effect for Group was not significant F(1, 22)=2.47,
p=0.130, neither was the interaction Group × Epoch F(54, 1188)=0.861, p=0.753,
ε=0.187. For means and confidence intervals see Table 11 (Annex 9.2) and Figure
8. SDNN was higher for boarding and sitting in the simulator and for visiting the
parked airplane in the hangar compared to the real flights: 82 ms (Moderate-
Anxious), 94 ms (High-Anxious) compared to 40 ms (Moderate-Anxious) and 41
ms (High-Anxious) for boarding the flight-out. Confidence intervals revealed that
High-Anxious showed a higher SDNN than Moderate-Anxious for epochs in the
simulator during boarding, seating, take-off, and turbulence, and on the real flight-
out during seating, cruising 20 min, landing, on the flight-in for the epoch engines
on.
ANOVA of pNN50 showed a significant main effect for Epoch F(54, 1188)=4.475,
p<0.001, ε=0.110, no significant effect for Group F(1, 22)=0.287, p=0.598, nor for
interaction Group × Epoch F(54, 1188)=0.581, p=0.742, ε=0.110. PNN50 showed
higher values in the simulator compared to the real flights. Moderate-Anxious and
High-Anxious showed reduced pNN50 patterns during the whole time course of
seminar and pNN50 was lowest before take-off for the real flights (0.04 for High-
Anxious and 0.03 for Moderate-Anxious). For means and confidence intervals see
Table 12 (Annex 9.3) and Figure 9.
ANOVA of RMMSD showed a significant main effect for Epoch F(54, 1188)=4.608,
p<0.001, ε=0.129. No difference was found between Moderate-Anxious and High-
Anxious F(1, 22)<0.001, p=0.985, ε=0.129 and no interaction was found between
Group and Epoch F(54, 1188)=0.702, p=0.670. On the first day, mean RMMSD of
Moderate-Anxious (maximum 32.46) and of High-Anxious (maximum 29.31) was
lower than on the second day in the simulator (maximum 35.76 and 40.02
respectively). Shortly before the real flights and during the flight situations after
take-off RMSSD was lower compared to the simulator. For means and confidence
intervals see Table 13 (Annex 9.4) and Figure 10.
81
ANOVA of LFnorm showed a significant Group effect for Moderate-Anxious and
High-Anxious F(1, 22)=4.386, p=0.048. The main effect Epoch was significant
F(54, 1188)=3.689, p<0.001, ε=0.251, no interaction Group × Epoch was found
F(54, 1188)=1.414, p=0.15, ε=0.247. The confidence intervals (see Table 14,
Annex 9.5, and Figure 11) indicated higher LF power in High-Anxious than in
Moderate-Anxious at the beginning, during the input of the captain, and at the end
of the first seminar day. The seminar training in the simulator showed similar
LFnorm for Moderate-Anxious and High-Anxious. Differences between High-
Anxious and Moderate-Anxious were evident during the third day at the beginning,
during visiting the hangar, and during the real flights. High-Anxious showed higher
LF proportion than Moderate-Anxious on the flight-out during cruising and landing
and almost continuously on the flight-in, except engines-on, descent, and shortly
before landing.
ANOVA of HFnorm showed a significant effect for Epoch F(54, 1188)=2.012,
p=0.03, ε=0.192, no main effect for Group F(1, 22)=0,132, p=0.723, and no
interaction Group × Epoch F(54, 1188)=0.995, p=0.44, ε=0.192. The confidence
intervals (see Table 15, Annex 9.6, and Figure 12) differed from 21 to 8 in High-
Anxious and from 19 to 7 in Moderate-Anxious during the seminar. During take-off
on the flight-in to Vienna Moderate-Anxious reached higher HFnorm than High-
Anxious, as well as shortly before landing.
ANOVA of log LF/HF indicated a statistical trend (one-tailed p=0.061) effect for
Epoch F(54, 1188)=1.546, p=0.121, ε=0.193. There was neither a significant
group effect F(1, 22)=1,077, p=0.311 nor an interaction Group × Epoch F(54,
1188)=1,239, p=0.265, ε=0.193. The confidence intervals as shown in Table 16
(Annex 9.7) and Figure 13 indicated differences between Moderate-Anxious and
High-Anxious as at the beginning of the seminar at the first day, at the second day
in the simulator for landing and for the real flights in and out during cruising, and
for the flight-in shortly before landing showing higher log LF/HF for High-Anxious
compared to Moderate-Anxious.
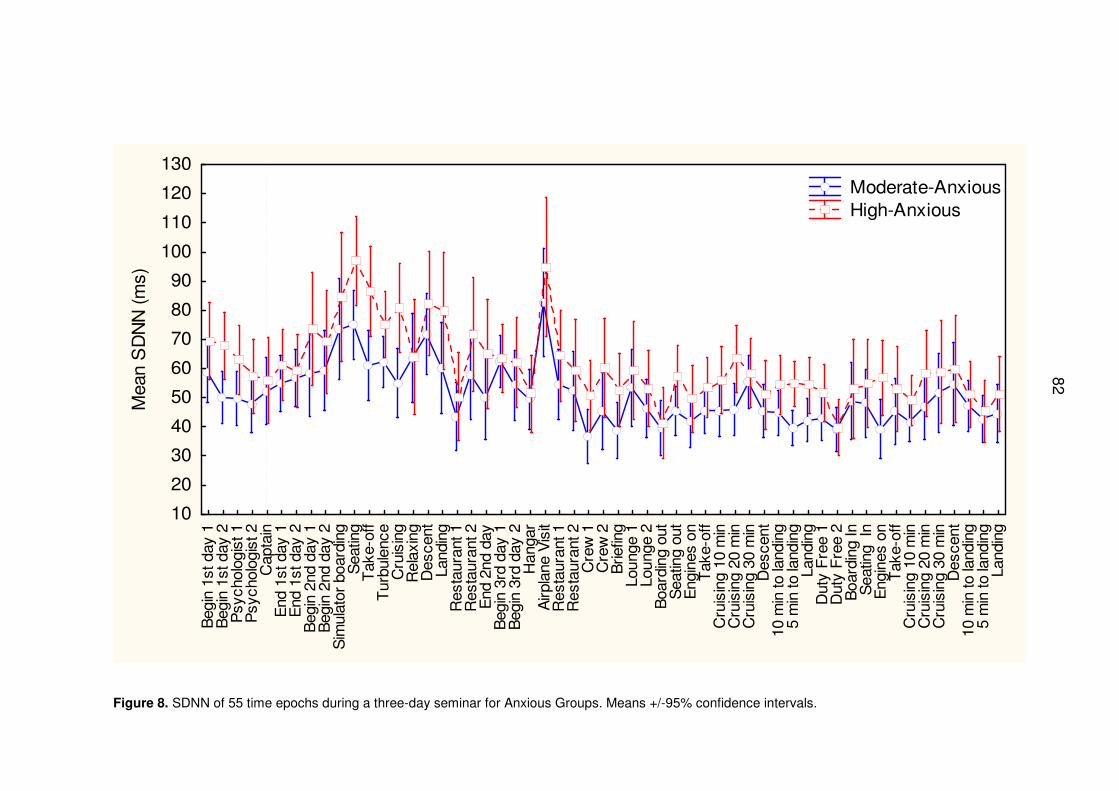
82
Beg
in 1
st d
ay 1
Beg
in 1
st d
ay 2
Psy
chol
ogis
t 1P
sych
olog
ist 2
Cap
tain
End
1st
day
1E
nd 1
st d
ay 2
Beg
in 2
nd d
ay 1
Beg
in 2
nd d
ay 2
Sim
ulat
or b
oard
ing
Sea
ting
Tak
e-of
fT
urbu
lenc
eC
ruis
ing
Rel
axin
gD
esce
ntLa
ndin
gR
esta
uran
t 1R
esta
uran
t 2E
nd 2
nd d
ayB
egin
3rd
day
1B
egin
3rd
day
2H
anga
rA
irpla
ne V
isit
Res
taur
ant 1
Res
taur
ant 2
Cre
w 1
Cre
w 2
Brie
fing
Loun
ge 1
Loun
ge 2
Boa
rdin
g ou
tS
eatin
g ou
tE
ngin
es o
nT
ake-
off
Cru
isin
g 10
min
Cru
isin
g 20
min
Cru
isin
g 30
min
Des
cent
10 m
in to
land
ing
5 m
in to
land
ing
Land
ing
Dut
y F
ree
1D
uty
Fre
e 2
Boa
rdin
g In
Sea
ting
InE
ngin
es o
nT
ake-
off
Cru
isin
g 10
min
Cru
isin
g 20
min
Cru
isin
g 30
min
Des
cent
10 m
in to
land
ing
5 m
in to
land
ing
Land
ing
10
20
30
40
50
60
70
80
90
100
110
120
130M
ean
SD
NN
(m
s)
Moderate-Anxious High-Anxious
Figure 8. SDNN of 55 time epochs during a three-day seminar for Anxious Groups. Means +/-95% confidence intervals.
82
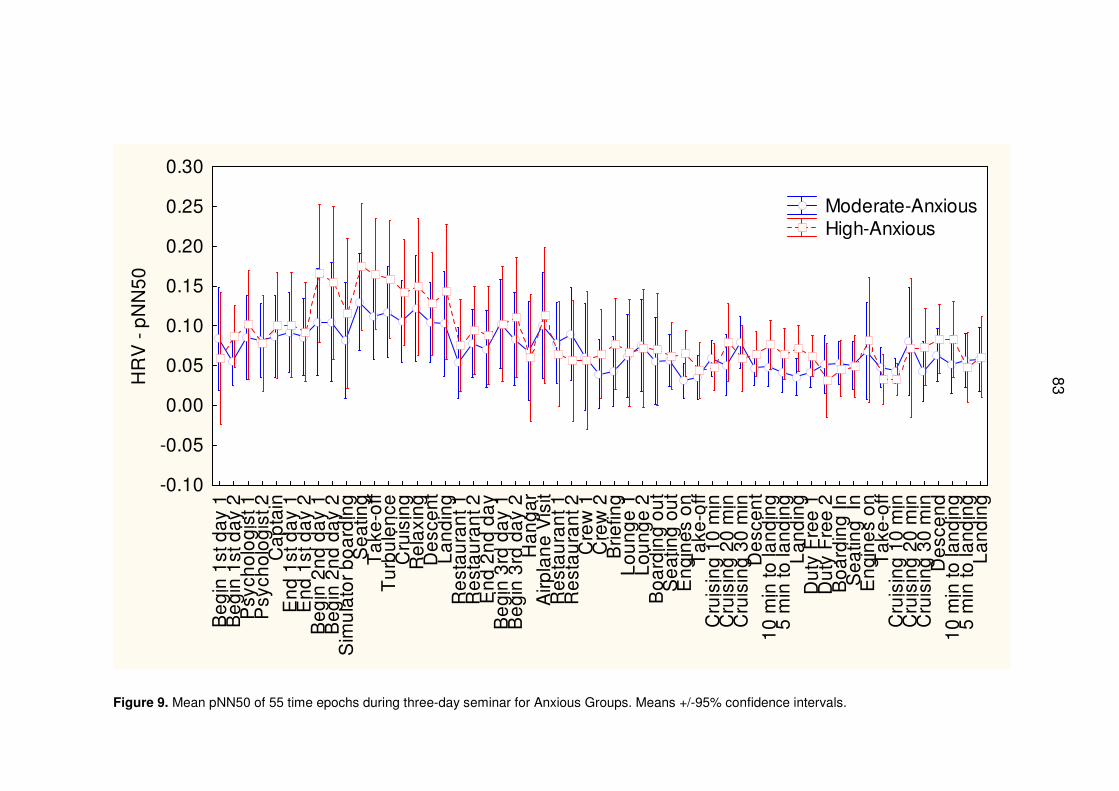
83
Be
gin
1st
da
y 1
Be
gin
1st
da
y 2
Psy
cho
log
ist 1
Psy
cho
log
ist 2
Ca
pta
inE
nd
1st
da
y 1
En
d 1
st d
ay
2B
eg
in 2
nd
da
y 1
Be
gin
2n
d d
ay
2S
imu
lato
r b
oa
rdin
gS
ea
ting
Ta
ke-o
ffT
urb
ule
nce
Cru
isin
gR
ela
xin
gD
esc
en
tL
an
din
gR
est
au
ran
t 1R
est
au
ran
t 2E
nd
2n
d d
ay
Be
gin
3rd
da
y 1
Be
gin
3rd
da
y 2
Ha
ng
ar
Airp
lan
e V
isit
Re
sta
ura
nt 1
Re
sta
ura
nt 2
Cre
w 1
Cre
w 2
Brie
fing
Lo
un
ge
1L
ou
ng
e 2
Bo
ard
ing
ou
tS
ea
ting
ou
tE
ng
ine
s o
nT
ake
-off
Cru
isin
g 1
0 m
inC
ruis
ing
20
min
Cru
isin
g 3
0 m
inD
esc
en
t1
0 m
in to
lan
din
g5
min
to la
nd
ing
La
nd
ing
Du
ty F
ree
1D
uty
Fre
e 2
Bo
ard
ing
InS
ea
ting
In
En
gin
es
on
Ta
ke-o
ffC
ruis
ing
10
min
Cru
isin
g 2
0 m
inC
ruis
ing
30
min
De
sce
nd
10
min
to la
nd
ing
5 m
in to
lan
din
gL
an
din
g
-0.10
-0.05
0.00
0.05
0.10
0.15
0.20
0.25
0.30
HR
V -
pN
N5
0
Moderate-Anxious High-Anxious
Figure 9. Mean pNN50 of 55 time epochs during three-day seminar for Anxious Groups. Means +/-95% confidence intervals.
83
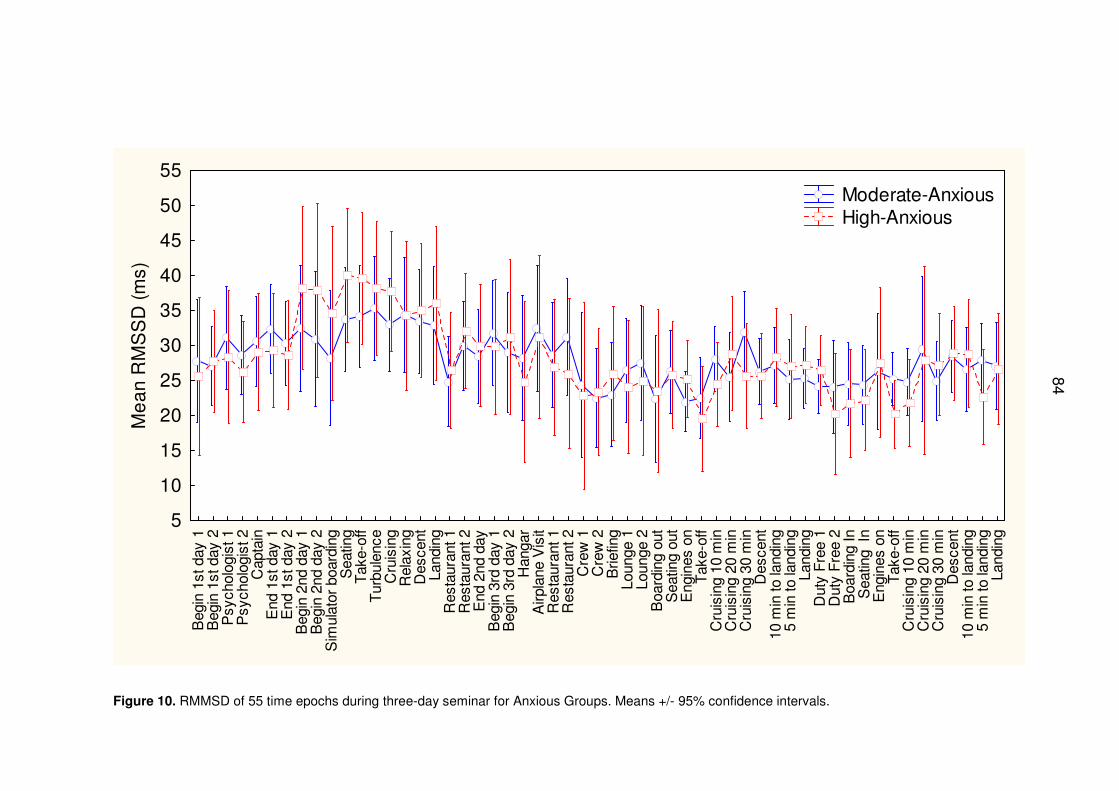
84
Beg
in 1
st d
ay 1
Beg
in 1
st d
ay 2
Psy
chol
ogis
t 1P
sych
olog
ist 2
Cap
tain
End
1st
day
1E
nd 1
st d
ay 2
Beg
in 2
nd d
ay 1
Beg
in 2
nd d
ay 2
Sim
ulat
or b
oard
ing
Sea
ting
Tak
e-of
fT
urbu
lenc
eC
ruis
ing
Rel
axin
gD
esce
ntLa
ndin
gR
esta
uran
t 1R
esta
uran
t 2E
nd 2
nd d
ayB
egin
3rd
day
1B
egin
3rd
day
2H
anga
rA
irpla
ne V
isit
Res
taur
ant 1
Res
taur
ant 2
Cre
w 1
Cre
w 2
Brie
fing
Loun
ge 1
Loun
ge 2
Boa
rdin
g ou
tS
eatin
g ou
tE
ngin
es o
nT
ake-
off
Cru
isin
g 10
min
Cru
isin
g 20
min
Cru
isin
g 30
min
Des
cent
10 m
in to
land
ing
5 m
in to
land
ing
Land
ing
Dut
y F
ree
1D
uty
Fre
e 2
Boa
rdin
g In
Sea
ting
InE
ngin
es o
nT
ake-
off
Cru
isin
g 10
min
Cru
isin
g 20
min
Cru
isin
g 30
min
Des
cent
10 m
in to
land
ing
5 m
in to
land
ing
Land
ing
5
10
15
20
25
30
35
40
45
50
55
Me
an
RM
SS
D (
ms)
Moderate-Anxious High-Anxious
Figure 10. RMMSD of 55 time epochs during three-day seminar for Anxious Groups. Means +/- 95% confidence intervals.
84
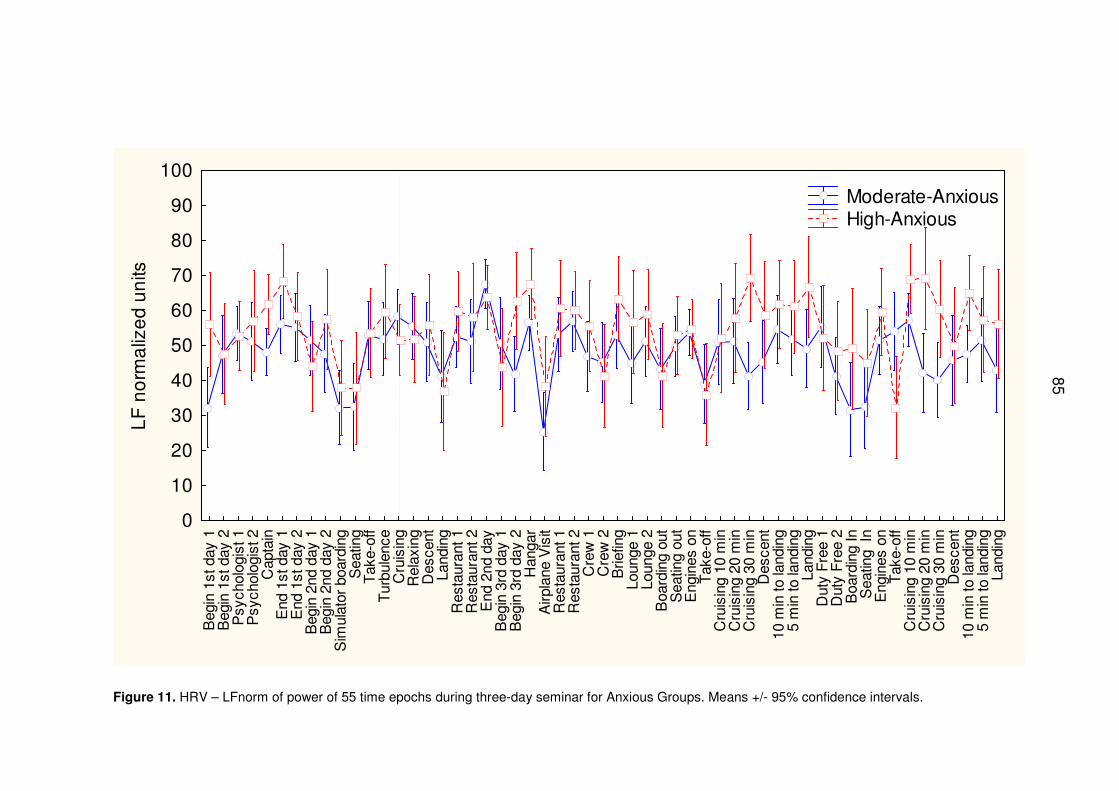
85
Beg
in 1
st d
ay 1
Beg
in 1
st d
ay 2
Psy
chol
ogis
t 1P
sych
olog
ist 2
Cap
tain
End
1st
day
1E
nd 1
st d
ay 2
Beg
in 2
nd d
ay 1
Beg
in 2
nd d
ay 2
Sim
ulat
or b
oard
ing
Sea
ting
Tak
e-of
fT
urbu
lenc
eC
ruis
ing
Rel
axin
gD
esce
ntLa
ndin
gR
esta
uran
t 1R
esta
uran
t 2E
nd 2
nd d
ayB
egin
3rd
day
1B
egin
3rd
day
2H
anga
rA
irpla
ne V
isit
Res
taur
ant 1
Res
taur
ant 2
Cre
w 1
Cre
w 2
Brie
fing
Loun
ge 1
Loun
ge 2
Boa
rdin
g ou
tS
eatin
g ou
tE
ngin
es o
nT
ake-
off
Cru
isin
g 10
min
Cru
isin
g 20
min
Cru
isin
g 30
min
Des
cent
10 m
in to
land
ing
5 m
in to
land
ing
Land
ing
Dut
y F
ree
1D
uty
Fre
e 2
Boa
rdin
g In
Sea
ting
InE
ngin
es o
nT
ake-
off
Cru
isin
g 10
min
Cru
isin
g 20
min
Cru
isin
g 30
min
Des
cent
10 m
in to
land
ing
5 m
in to
land
ing
Land
ing
0
10
20
30
40
50
60
70
80
90
100
LF
no
rma
lize
d u
nits
Moderate-Anxious High-Anxious
Figure 11. HRV – LFnorm of power of 55 time epochs during three-day seminar for Anxious Groups. Means +/- 95% confidence intervals.
85
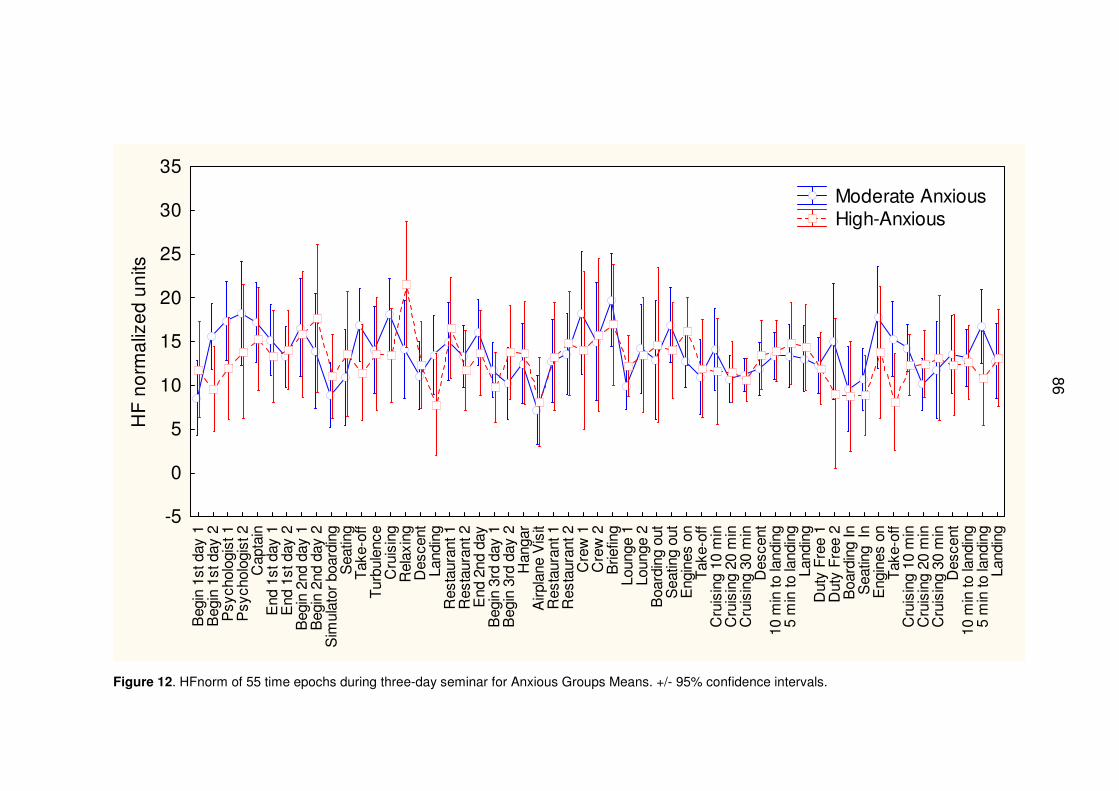
86
Beg
in 1
st d
ay 1
Beg
in 1
st d
ay 2
Psy
chol
ogis
t 1P
sych
olog
ist 2
Cap
tain
End
1st
day
1E
nd 1
st d
ay 2
Beg
in 2
nd d
ay 1
Beg
in 2
nd d
ay 2
Sim
ulat
or b
oard
ing
Sea
ting
Tak
e-of
fT
urbu
lenc
eC
ruis
ing
Rel
axin
gD
esce
ntLa
ndin
gR
esta
uran
t 1R
esta
uran
t 2E
nd 2
nd d
ayB
egin
3rd
day
1B
egin
3rd
day
2H
anga
rA
irpla
ne V
isit
Res
taur
ant 1
Res
taur
ant 2
Cre
w 1
Cre
w 2
Brie
fing
Loun
ge 1
Loun
ge 2
Boa
rdin
g ou
tS
eatin
g ou
tE
ngin
es o
nT
ake-
off
Cru
isin
g 10
min
Cru
isin
g 20
min
Cru
isin
g 30
min
Des
cent
10 m
in to
land
ing
5 m
in to
land
ing
Land
ing
Dut
y F
ree
1D
uty
Fre
e 2
Boa
rdin
g In
Sea
ting
InE
ngin
es o
nT
ake-
off
Cru
isin
g 10
min
Cru
isin
g 20
min
Cru
isin
g 30
min
Des
cent
10 m
in to
land
ing
5 m
in to
land
ing
Land
ing
-5
0
5
10
15
20
25
30
35
HF
no
rma
lize
d u
nits
Moderate Anxious High-Anxious
Figure 12. HFnorm of 55 time epochs during three-day seminar for Anxious Groups Means. +/- 95% confidence intervals.
86
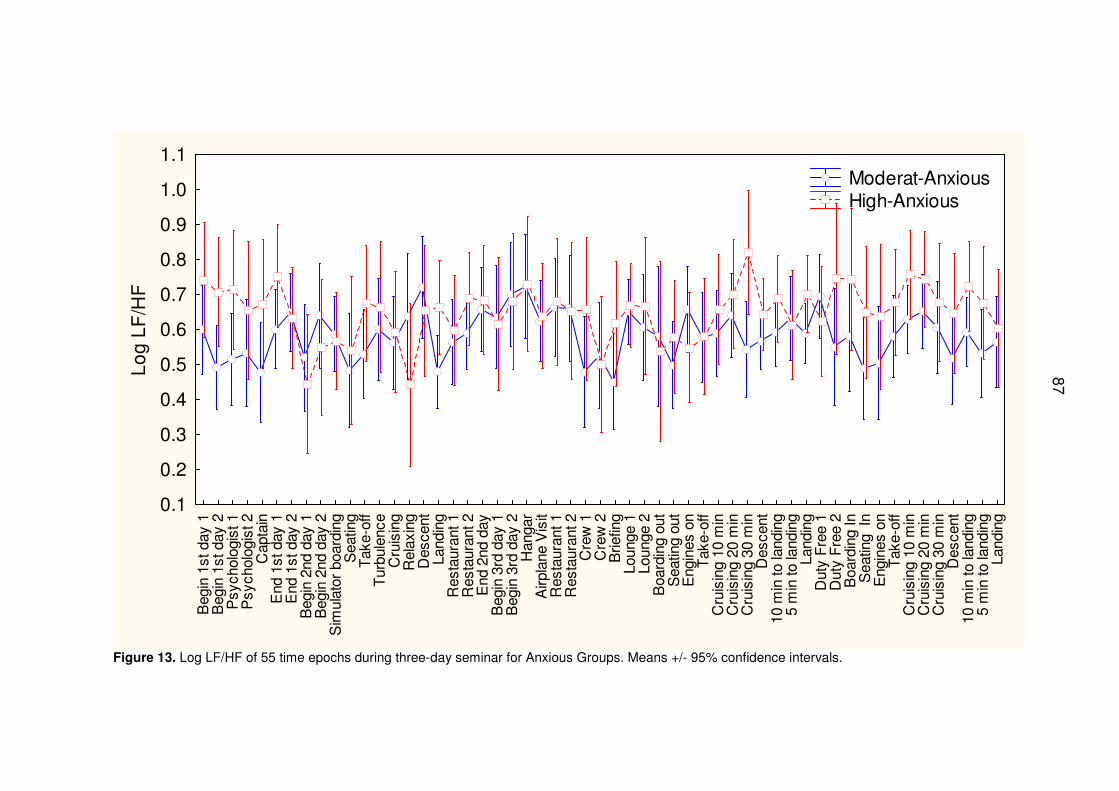
87
Beg
in 1
st d
ay 1
Beg
in 1
st d
ay 2
Psy
chol
ogis
t 1P
sych
olog
ist 2
Cap
tain
End
1st
day
1E
nd 1
st d
ay 2
Beg
in 2
nd d
ay 1
Beg
in 2
nd d
ay 2
Sim
ulat
or b
oard
ing
Sea
ting
Tak
e-of
fT
urbu
lenc
eC
ruis
ing
Rel
axin
gD
esce
ntLa
ndin
gR
esta
uran
t 1R
esta
uran
t 2E
nd 2
nd d
ayB
egin
3rd
day
1B
egin
3rd
day
2H
anga
rA
irpla
ne V
isit
Res
taur
ant 1
Res
taur
ant 2
Cre
w 1
Cre
w 2
Brie
fing
Loun
ge 1
Loun
ge 2
Boa
rdin
g ou
tS
eatin
g ou
tE
ngin
es o
nT
ake-
off
Cru
isin
g 10
min
Cru
isin
g 20
min
Cru
isin
g 30
min
Des
cent
10 m
in to
land
ing
5 m
in to
land
ing
Land
ing
Dut
y F
ree
1D
uty
Fre
e 2
Boa
rdin
g In
Sea
ting
InE
ngin
es o
nT
ake-
off
Cru
isin
g 10
min
Cru
isin
g 20
min
Cru
isin
g 30
min
Des
cent
10 m
in to
land
ing
5 m
in to
land
ing
Land
ing
0.1
0.2
0.3
0.4
0.5
0.6
0.7
0.8
0.9
1.0
1.1L
og
LF
/HF
Moderat-Anxious High-Anxious
Figure 13. Log LF/HF of 55 time epochs during three-day seminar for Anxious Groups. Means +/- 95% confidence intervals.
87
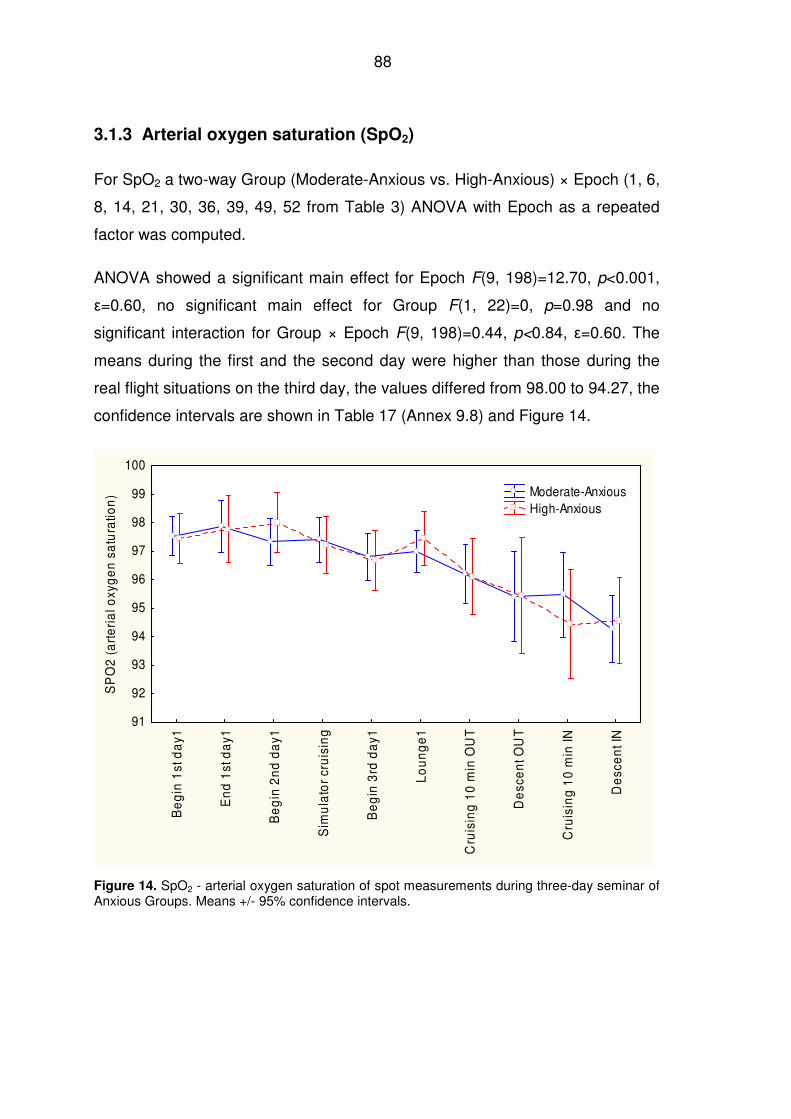
88
3.1.3 Arterial oxygen saturation (SpO2)
For SpO2 a two-way Group (Moderate-Anxious vs. High-Anxious) × Epoch (1, 6,
8, 14, 21, 30, 36, 39, 49, 52 from Table 3) ANOVA with Epoch as a repeated
factor was computed.
ANOVA showed a significant main effect for Epoch F(9, 198)=12.70, p<0.001,
ε=0.60, no significant main effect for Group F(1, 22)=0, p=0.98 and no
significant interaction for Group × Epoch F(9, 198)=0.44, p<0.84, ε=0.60. The
means during the first and the second day were higher than those during the
real flight situations on the third day, the values differed from 98.00 to 94.27, the
confidence intervals are shown in Table 17 (Annex 9.8) and Figure 14.
Be
gin
1st
da
y1
En
d 1
st d
ay1
Be
gin
2n
d d
ay1
Sim
ula
tor
cru
isin
g
Be
gin
3rd
da
y1
Lo
un
ge
1
Cru
isin
g 1
0 m
in O
UT
De
sce
nt O
UT
Cru
isin
g 1
0 m
in IN
De
sce
nt I
N
91
92
93
94
95
96
97
98
99
100
SP
O2
(a
rte
ria
l oxy
ge
n s
atu
ratio
n) Moderate-Anxious
High-Anxious
Figure 14. SpO2 - arterial oxygen saturation of spot measurements during three-day seminar of Anxious Groups. Means +/- 95% confidence intervals.
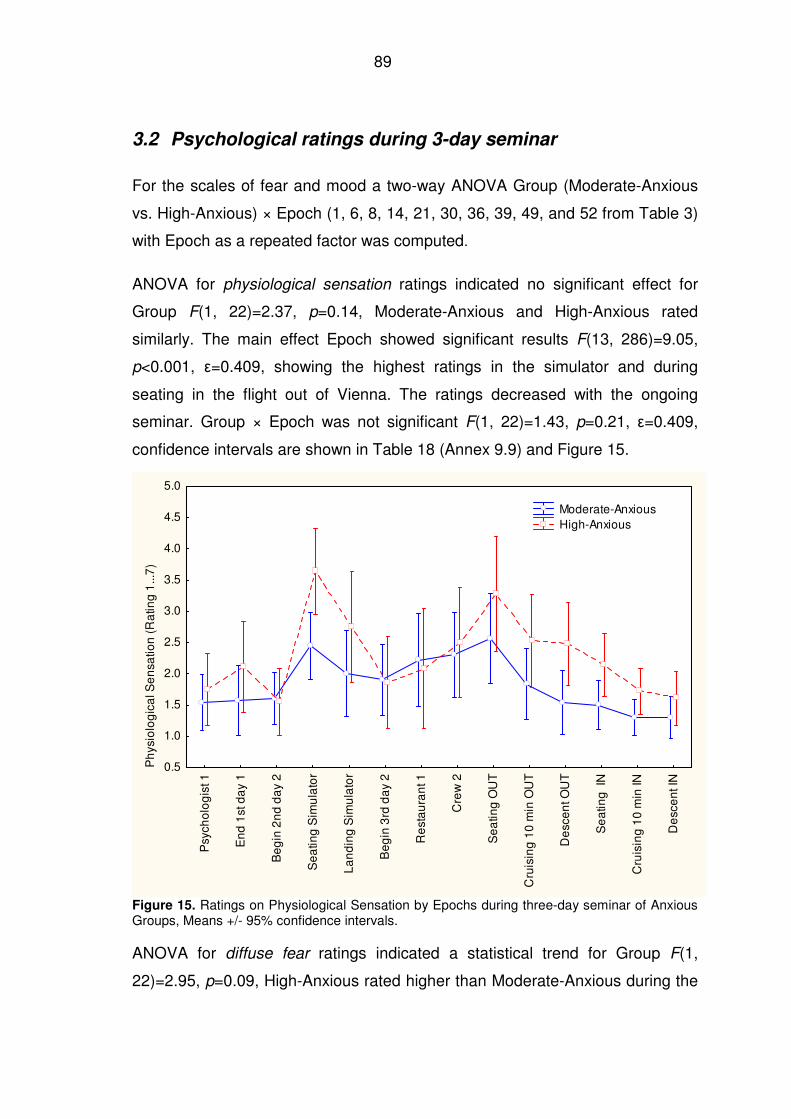
89
3.2 Psychological ratings during 3-day seminar
For the scales of fear and mood a two-way ANOVA Group (Moderate-Anxious
vs. High-Anxious) × Epoch (1, 6, 8, 14, 21, 30, 36, 39, 49, and 52 from Table 3)
with Epoch as a repeated factor was computed.
ANOVA for physiological sensation ratings indicated no significant effect for
Group F(1, 22)=2.37, p=0.14, Moderate-Anxious and High-Anxious rated
similarly. The main effect Epoch showed significant results F(13, 286)=9.05,
p<0.001, ε=0.409, showing the highest ratings in the simulator and during
seating in the flight out of Vienna. The ratings decreased with the ongoing
seminar. Group × Epoch was not significant F(1, 22)=1.43, p=0.21, ε=0.409,
confidence intervals are shown in Table 18 (Annex 9.9) and Figure 15.
Psy
cho
log
ist 1
En
d 1
st d
ay
1
Be
gin
2n
d d
ay
2
Se
atin
g S
imu
lato
r
La
nd
ing
Sim
ula
tor
Be
gin
3rd
da
y 2
Re
sta
ura
nt 1
Cre
w 2
Se
atin
g O
UT
Cru
isin
g 1
0 m
in O
UT
De
sce
nt O
UT
Se
atin
g I
N
Cru
isin
g 1
0 m
in IN
De
sce
nt I
N
0.5
1.0
1.5
2.0
2.5
3.0
3.5
4.0
4.5
5.0
Ph
ysio
log
ica
l Se
nsa
tion
(R
atin
g 1
...7
)
Moderate-Anxious High-Anxious
Figure 15. Ratings on Physiological Sensation by Epochs during three-day seminar of Anxious Groups, Means +/- 95% confidence intervals.
ANOVA for diffuse fear ratings indicated a statistical trend for Group F(1,
22)=2.95, p=0.09, High-Anxious rated higher than Moderate-Anxious during the
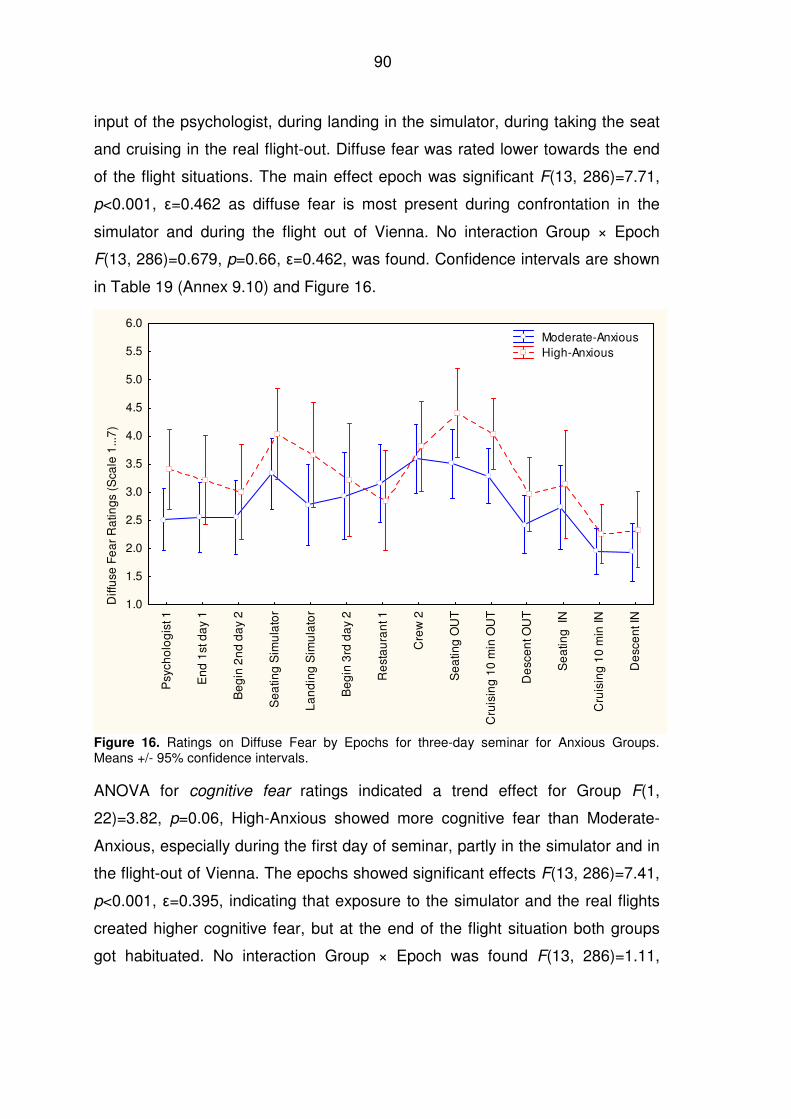
90
input of the psychologist, during landing in the simulator, during taking the seat
and cruising in the real flight-out. Diffuse fear was rated lower towards the end
of the flight situations. The main effect epoch was significant F(13, 286)=7.71,
p<0.001, ε=0.462 as diffuse fear is most present during confrontation in the
simulator and during the flight out of Vienna. No interaction Group × Epoch
F(13, 286)=0.679, p=0.66, ε=0.462, was found. Confidence intervals are shown
in Table 19 (Annex 9.10) and Figure 16.
Psy
cho
log
ist 1
En
d 1
st d
ay
1
Be
gin
2n
d d
ay
2
Se
atin
g S
imu
lato
r
La
nd
ing
Sim
ula
tor
Be
gin
3rd
da
y 2
Re
sta
ura
nt 1
Cre
w 2
Se
atin
g O
UT
Cru
isin
g 1
0 m
in O
UT
De
sce
nt O
UT
Se
atin
g I
N
Cru
isin
g 1
0 m
in IN
De
sce
nt I
N
1.0
1.5
2.0
2.5
3.0
3.5
4.0
4.5
5.0
5.5
6.0
Diff
use
Fe
ar
Ra
ting
s (S
cale
1...
7)
Moderate-Anxious High-Anxious
Figure 16. Ratings on Diffuse Fear by Epochs for three-day seminar for Anxious Groups. Means +/- 95% confidence intervals.
ANOVA for cognitive fear ratings indicated a trend effect for Group F(1,
22)=3.82, p=0.06, High-Anxious showed more cognitive fear than Moderate-
Anxious, especially during the first day of seminar, partly in the simulator and in
the flight-out of Vienna. The epochs showed significant effects F(13, 286)=7.41,
p<0.001, ε=0.395, indicating that exposure to the simulator and the real flights
created higher cognitive fear, but at the end of the flight situation both groups
got habituated. No interaction Group × Epoch was found F(13, 286)=1.11,
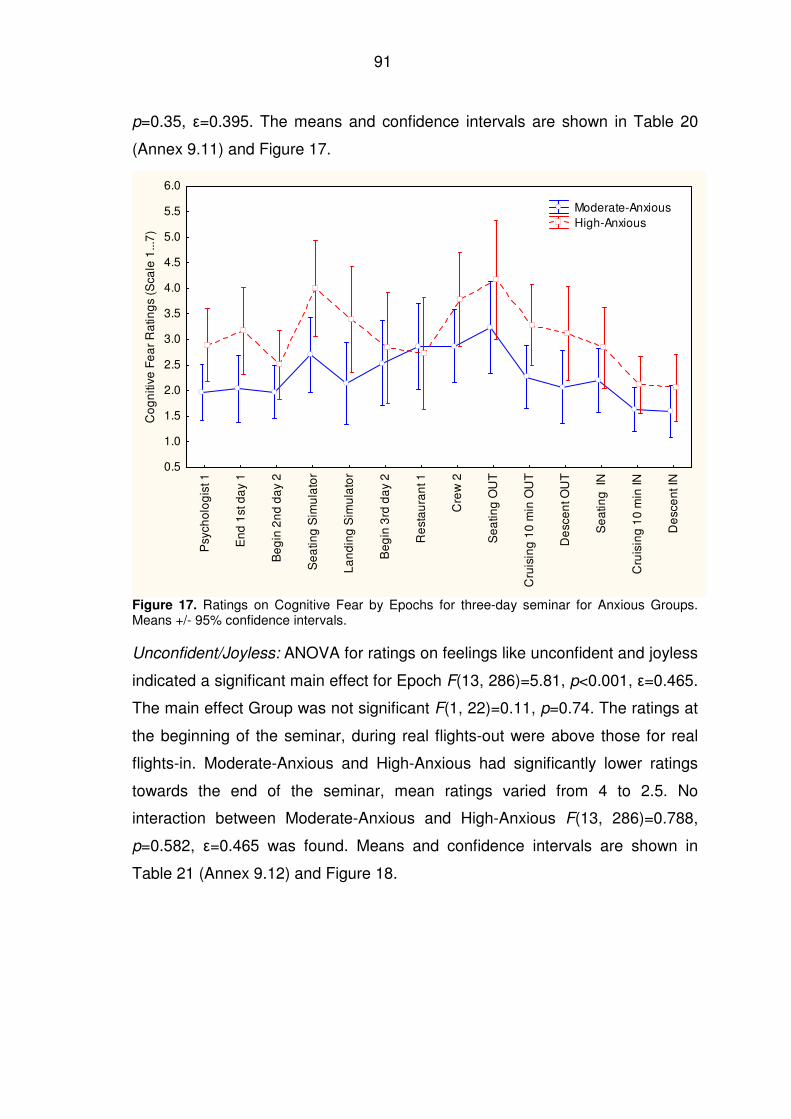
91
p=0.35, ε=0.395. The means and confidence intervals are shown in Table 20
(Annex 9.11) and Figure 17.
Psy
cho
log
ist 1
En
d 1
st d
ay
1
Be
gin
2n
d d
ay
2
Se
atin
g S
imu
lato
r
La
nd
ing
Sim
ula
tor
Be
gin
3rd
da
y 2
Re
sta
ura
nt 1
Cre
w 2
Se
atin
g O
UT
Cru
isin
g 1
0 m
in O
UT
De
sce
nt O
UT
Se
atin
g I
N
Cru
isin
g 1
0 m
in IN
De
sce
nt I
N
0.5
1.0
1.5
2.0
2.5
3.0
3.5
4.0
4.5
5.0
5.5
6.0
Co
gn
itive
Fe
ar
Ra
ting
s (S
cale
1...
7)
Moderate-Anxious High-Anxious
Figure 17. Ratings on Cognitive Fear by Epochs for three-day seminar for Anxious Groups. Means +/- 95% confidence intervals.
Unconfident/Joyless: ANOVA for ratings on feelings like unconfident and joyless
indicated a significant main effect for Epoch F(13, 286)=5.81, p<0.001, ε=0.465.
The main effect Group was not significant F(1, 22)=0.11, p=0.74. The ratings at
the beginning of the seminar, during real flights-out were above those for real
flights-in. Moderate-Anxious and High-Anxious had significantly lower ratings
towards the end of the seminar, mean ratings varied from 4 to 2.5. No
interaction between Moderate-Anxious and High-Anxious F(13, 286)=0.788,
p=0.582, ε=0.465 was found. Means and confidence intervals are shown in
Table 21 (Annex 9.12) and Figure 18.
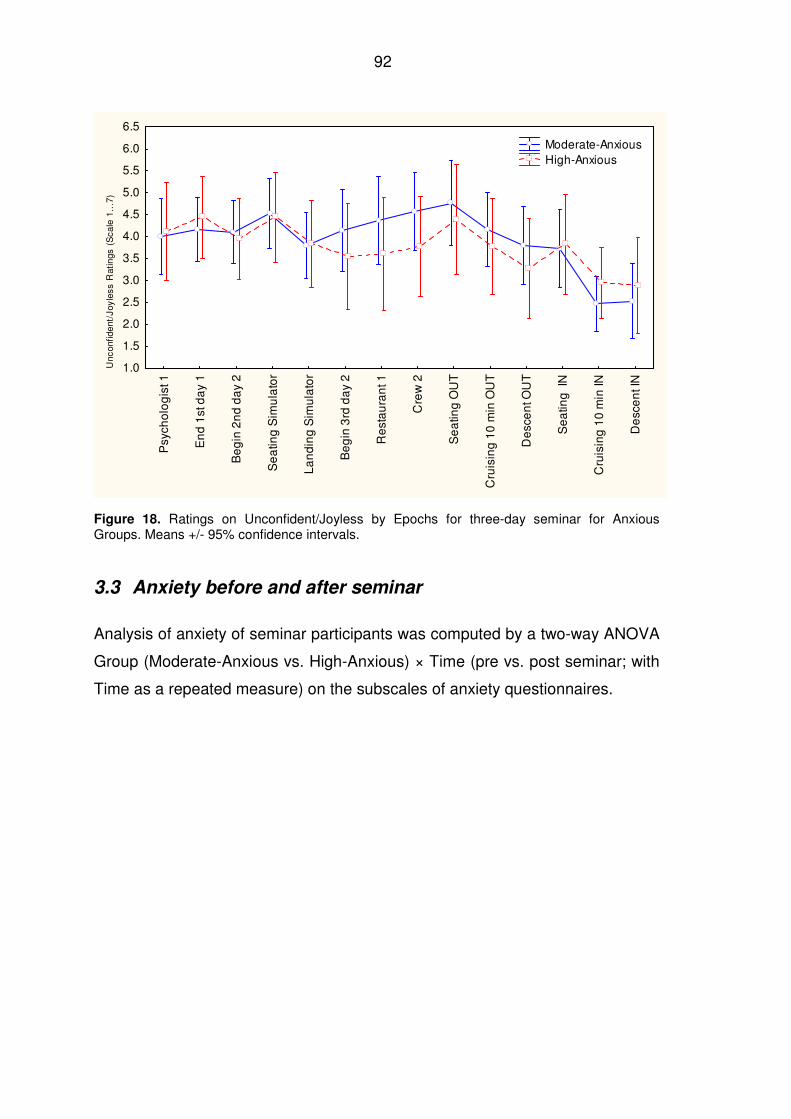
92
Psy
cho
log
ist 1
En
d 1
st d
ay
1
Be
gin
2n
d d
ay
2
Se
atin
g S
imu
lato
r
La
nd
ing
Sim
ula
tor
Be
gin
3rd
da
y 2
Re
sta
ura
nt 1
Cre
w 2
Se
atin
g O
UT
Cru
isin
g 1
0 m
in O
UT
De
sce
nt O
UT
Se
atin
g I
N
Cru
isin
g 1
0 m
in IN
De
sce
nt I
N
1.0
1.5
2.0
2.5
3.0
3.5
4.0
4.5
5.0
5.5
6.0
6.5
Unc
onfid
ent
/Joy
less
Rat
ings
(S
cale
1..
.7)
Moderate-Anxious High-Anxious
Figure 18. Ratings on Unconfident/Joyless by Epochs for three-day seminar for Anxious Groups. Means +/- 95% confidence intervals.
3.3 Anxiety before and after seminar
Analysis of anxiety of seminar participants was computed by a two-way ANOVA
Group (Moderate-Anxious vs. High-Anxious) × Time (pre vs. post seminar; with
Time as a repeated measure) on the subscales of anxiety questionnaires.
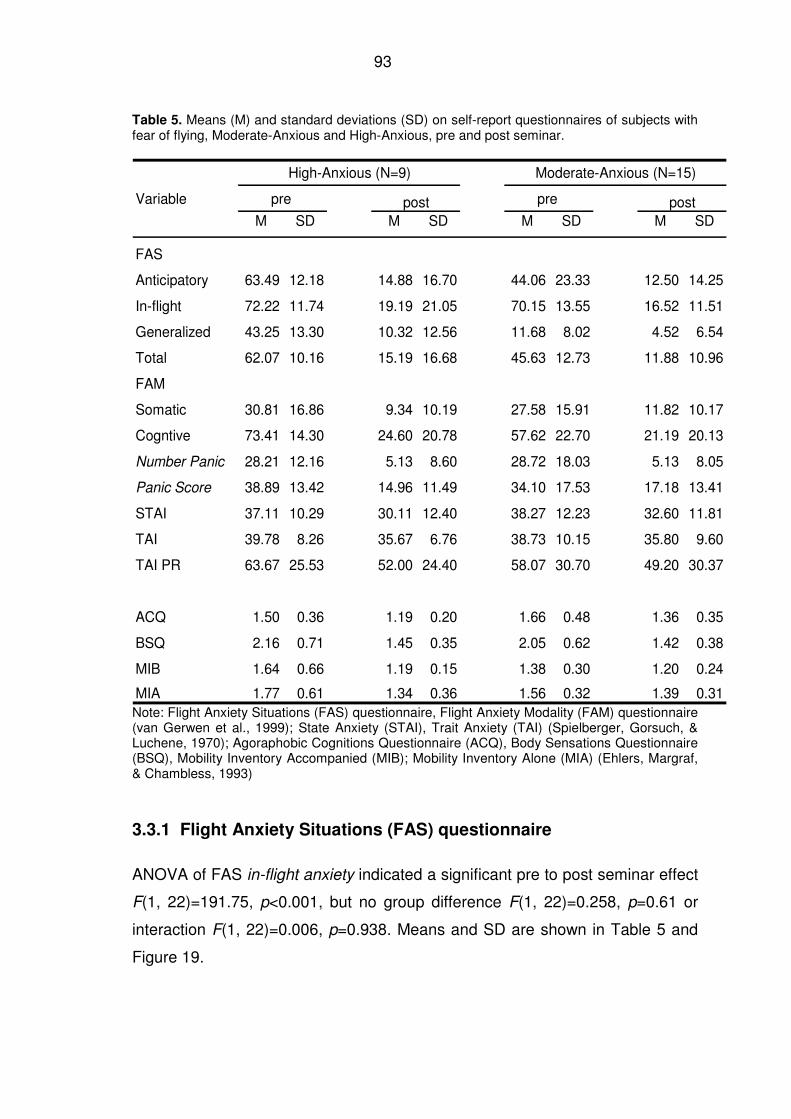
93
Table 5. Means (M) and standard deviations (SD) on self-report questionnaires of subjects with fear of flying, Moderate-Anxious and High-Anxious, pre and post seminar.
High-Anxious (N=9) Moderate-Anxious (N=15)
pre post pre postM SD M SD M SD M SD
FAS
Anticipatory 63.49 12.18 14.88 16.70 44.06 23.33 12.50 14.25
In-flight 72.22 11.74 19.19 21.05 70.15 13.55 16.52 11.51
Generalized 43.25 13.30 10.32 12.56 11.68 8.02 4.52 6.54
Total 62.07 10.16 15.19 16.68 45.63 12.73 11.88 10.96
FAM
Somatic 30.81 16.86 9.34 10.19 27.58 15.91 11.82 10.17
Cogntive 73.41 14.30 24.60 20.78 57.62 22.70 21.19 20.13
Number Panic 28.21 12.16 5.13 8.60 28.72 18.03 5.13 8.05
Panic Score 38.89 13.42 14.96 11.49 34.10 17.53 17.18 13.41
STAI 37.11 10.29 30.11 12.40 38.27 12.23 32.60 11.81
TAI 39.78 8.26 35.67 6.76 38.73 10.15 35.80 9.60
TAI PR 63.67 25.53 52.00 24.40 58.07 30.70 49.20 30.37
ACQ 1.50 0.36 1.19 0.20 1.66 0.48 1.36 0.35
BSQ 2.16 0.71 1.45 0.35 2.05 0.62 1.42 0.38
MIB 1.64 0.66 1.19 0.15 1.38 0.30 1.20 0.24
MIA 1.77 0.61 1.34 0.36 1.56 0.32 1.39 0.31
Variable
Note: Flight Anxiety Situations (FAS) questionnaire, Flight Anxiety Modality (FAM) questionnaire (van Gerwen et al., 1999); State Anxiety (STAI), Trait Anxiety (TAI) (Spielberger, Gorsuch, & Luchene, 1970); Agoraphobic Cognitions Questionnaire (ACQ), Body Sensations Questionnaire (BSQ), Mobility Inventory Accompanied (MIB); Mobility Inventory Alone (MIA) (Ehlers, Margraf, & Chambless, 1993)
3.3.1 Flight Anxiety Situations (FAS) questionnaire
ANOVA of FAS in-flight anxiety indicated a significant pre to post seminar effect
F(1, 22)=191.75, p<0.001, but no group difference F(1, 22)=0.258, p=0.61 or
interaction F(1, 22)=0.006, p=0.938. Means and SD are shown in Table 5 and
Figure 19.
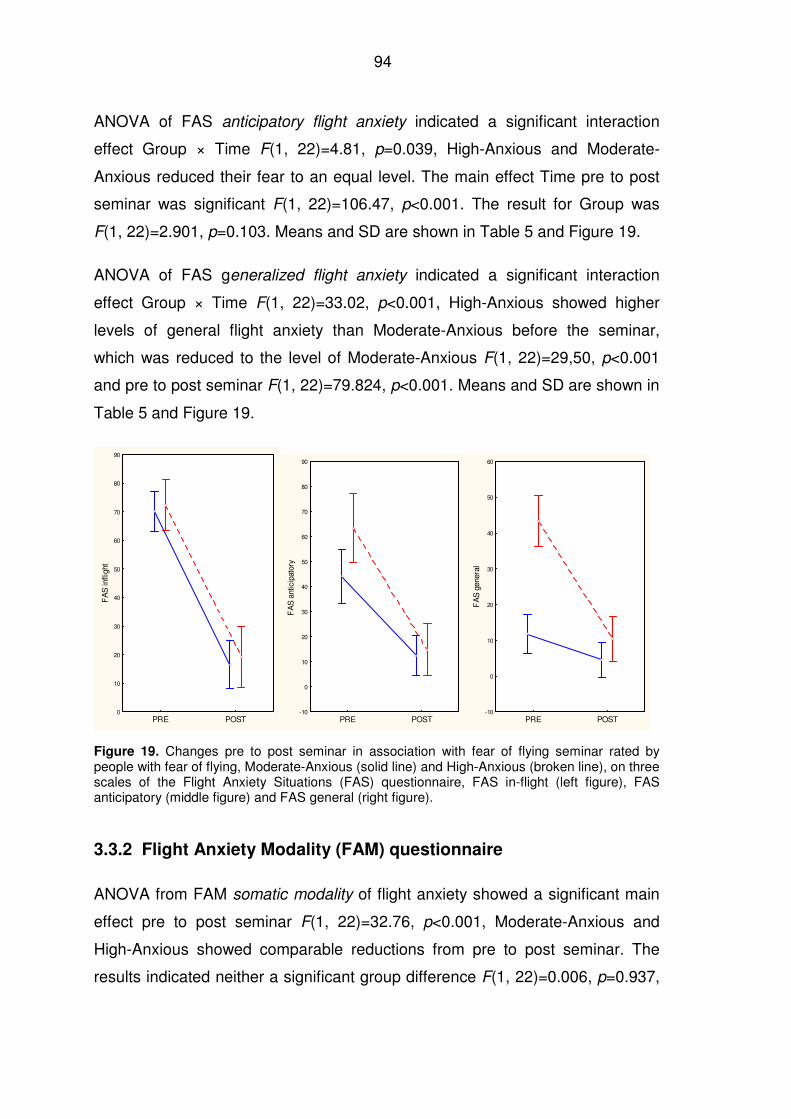
94
ANOVA of FAS anticipatory flight anxiety indicated a significant interaction
effect Group × Time F(1, 22)=4.81, p=0.039, High-Anxious and Moderate-
Anxious reduced their fear to an equal level. The main effect Time pre to post
seminar was significant F(1, 22)=106.47, p<0.001. The result for Group was
F(1, 22)=2.901, p=0.103. Means and SD are shown in Table 5 and Figure 19.
ANOVA of FAS generalized flight anxiety indicated a significant interaction
effect Group × Time F(1, 22)=33.02, p<0.001, High-Anxious showed higher
levels of general flight anxiety than Moderate-Anxious before the seminar,
which was reduced to the level of Moderate-Anxious F(1, 22)=29,50, p<0.001
and pre to post seminar F(1, 22)=79.824, p<0.001. Means and SD are shown in
Table 5 and Figure 19.
PRE POST0
10
20
30
40
50
60
70
80
90
FA
S in
fligh
t
PRE POST-10
0
10
20
30
40
50
60
70
80
90
FA
S a
ntic
ipat
ory
PRE POST-10
0
10
20
30
40
50
60
FA
S g
ener
al
Figure 19. Changes pre to post seminar in association with fear of flying seminar rated by people with fear of flying, Moderate-Anxious (solid line) and High-Anxious (broken line), on three scales of the Flight Anxiety Situations (FAS) questionnaire, FAS in-flight (left figure), FAS anticipatory (middle figure) and FAS general (right figure).
3.3.2 Flight Anxiety Modality (FAM) questionnaire
ANOVA from FAM somatic modality of flight anxiety showed a significant main
effect pre to post seminar F(1, 22)=32.76, p<0.001, Moderate-Anxious and
High-Anxious showed comparable reductions from pre to post seminar. The
results indicated neither a significant group difference F(1, 22)=0.006, p=0.937,
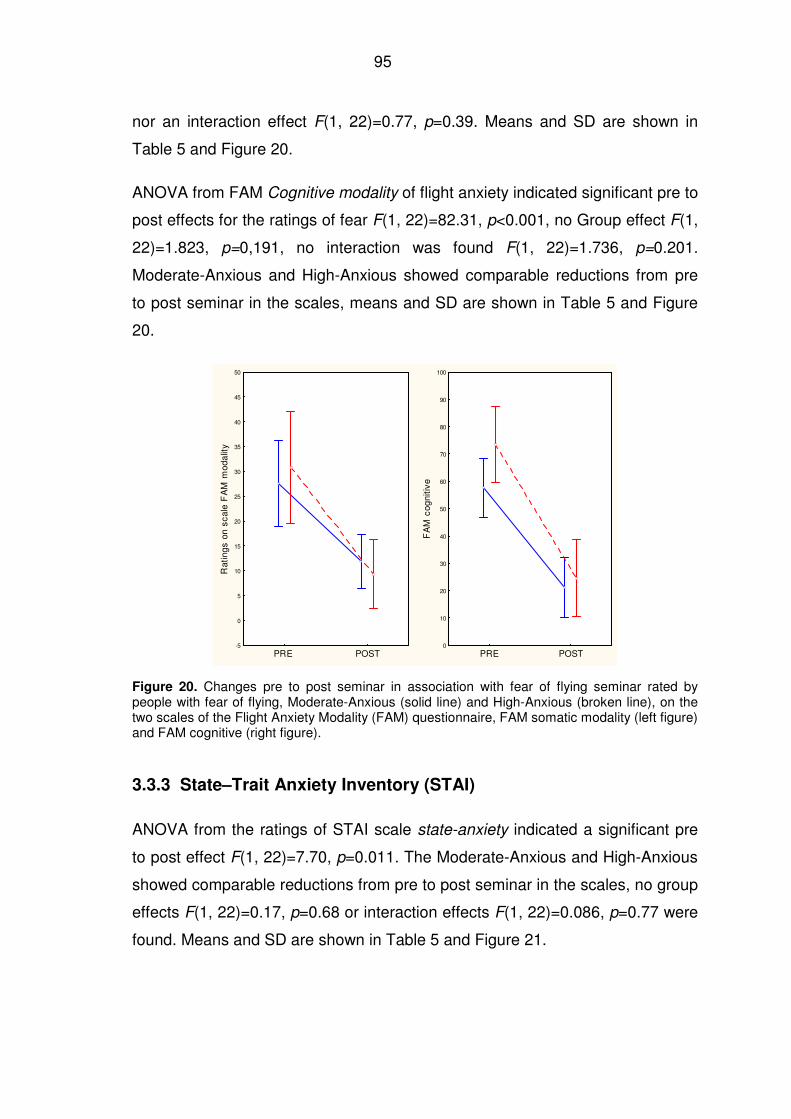
95
nor an interaction effect F(1, 22)=0.77, p=0.39. Means and SD are shown in
Table 5 and Figure 20.
ANOVA from FAM Cognitive modality of flight anxiety indicated significant pre to
post effects for the ratings of fear F(1, 22)=82.31, p<0.001, no Group effect F(1,
22)=1.823, p=0,191, no interaction was found F(1, 22)=1.736, p=0.201.
Moderate-Anxious and High-Anxious showed comparable reductions from pre
to post seminar in the scales, means and SD are shown in Table 5 and Figure
20.
PRE POST-5
0
5
10
15
20
25
30
35
40
45
50
Rat
ing
s on
sca
le F
AM
mod
alit
y
PRE POST0
10
20
30
40
50
60
70
80
90
100
FA
M c
ogni
tive
Figure 20. Changes pre to post seminar in association with fear of flying seminar rated by people with fear of flying, Moderate-Anxious (solid line) and High-Anxious (broken line), on the two scales of the Flight Anxiety Modality (FAM) questionnaire, FAM somatic modality (left figure) and FAM cognitive (right figure).
3.3.3 State–Trait Anxiety Inventory (STAI)
ANOVA from the ratings of STAI scale state-anxiety indicated a significant pre
to post effect F(1, 22)=7.70, p=0.011. The Moderate-Anxious and High-Anxious
showed comparable reductions from pre to post seminar in the scales, no group
effects F(1, 22)=0.17, p=0.68 or interaction effects F(1, 22)=0.086, p=0.77 were
found. Means and SD are shown in Table 5 and Figure 21.
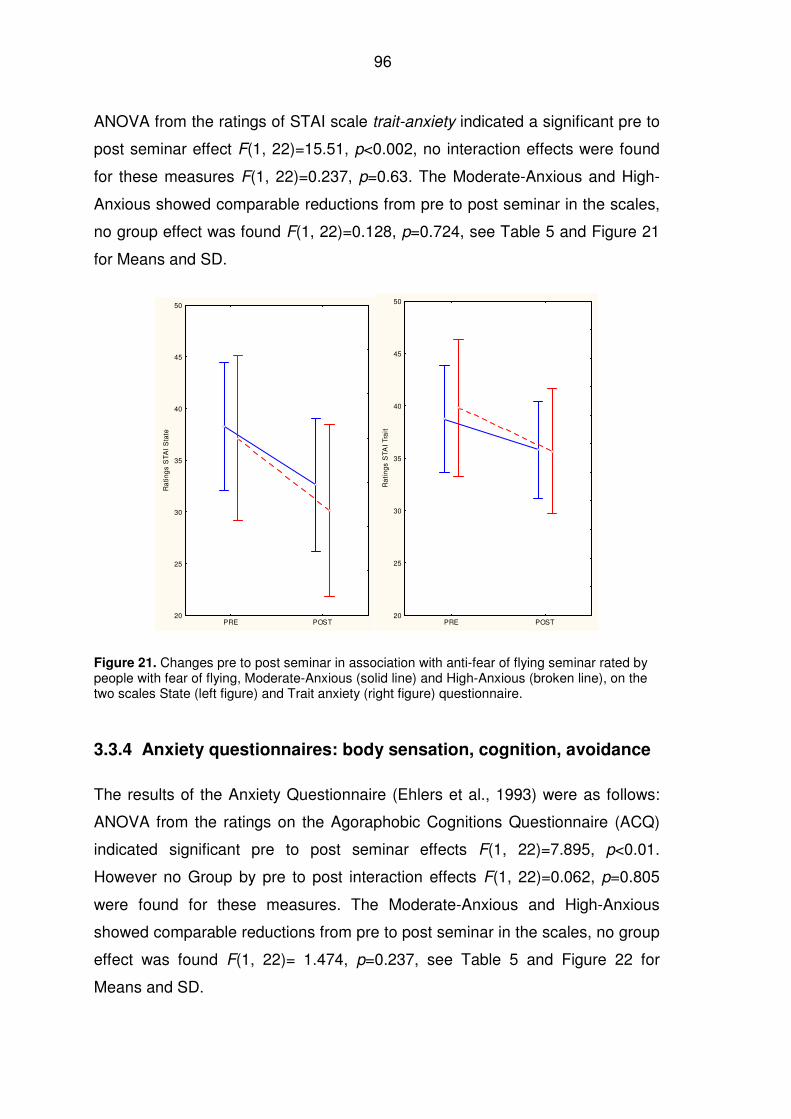
96
ANOVA from the ratings of STAI scale trait-anxiety indicated a significant pre to
post seminar effect F(1, 22)=15.51, p<0.002, no interaction effects were found
for these measures F(1, 22)=0.237, p=0.63. The Moderate-Anxious and High-
Anxious showed comparable reductions from pre to post seminar in the scales,
no group effect was found F(1, 22)=0.128, p=0.724, see Table 5 and Figure 21
for Means and SD.
PRE POST20
25
30
35
40
45
50
Ra
ting
s S
TA
I S
tate
PRE POST20
25
30
35
40
45
50
Ra
tin
gs
STA
I T
rait
Figure 21. Changes pre to post seminar in association with anti-fear of flying seminar rated by people with fear of flying, Moderate-Anxious (solid line) and High-Anxious (broken line), on the two scales State (left figure) and Trait anxiety (right figure) questionnaire.
3.3.4 Anxiety questionnaires: body sensation, cognition, avoidance
The results of the Anxiety Questionnaire (Ehlers et al., 1993) were as follows:
ANOVA from the ratings on the Agoraphobic Cognitions Questionnaire (ACQ)
indicated significant pre to post seminar effects F(1, 22)=7.895, p<0.01.
However no Group by pre to post interaction effects F(1, 22)=0.062, p=0.805
were found for these measures. The Moderate-Anxious and High-Anxious
showed comparable reductions from pre to post seminar in the scales, no group
effect was found F(1, 22)= 1.474, p=0.237, see Table 5 and Figure 22 for
Means and SD.
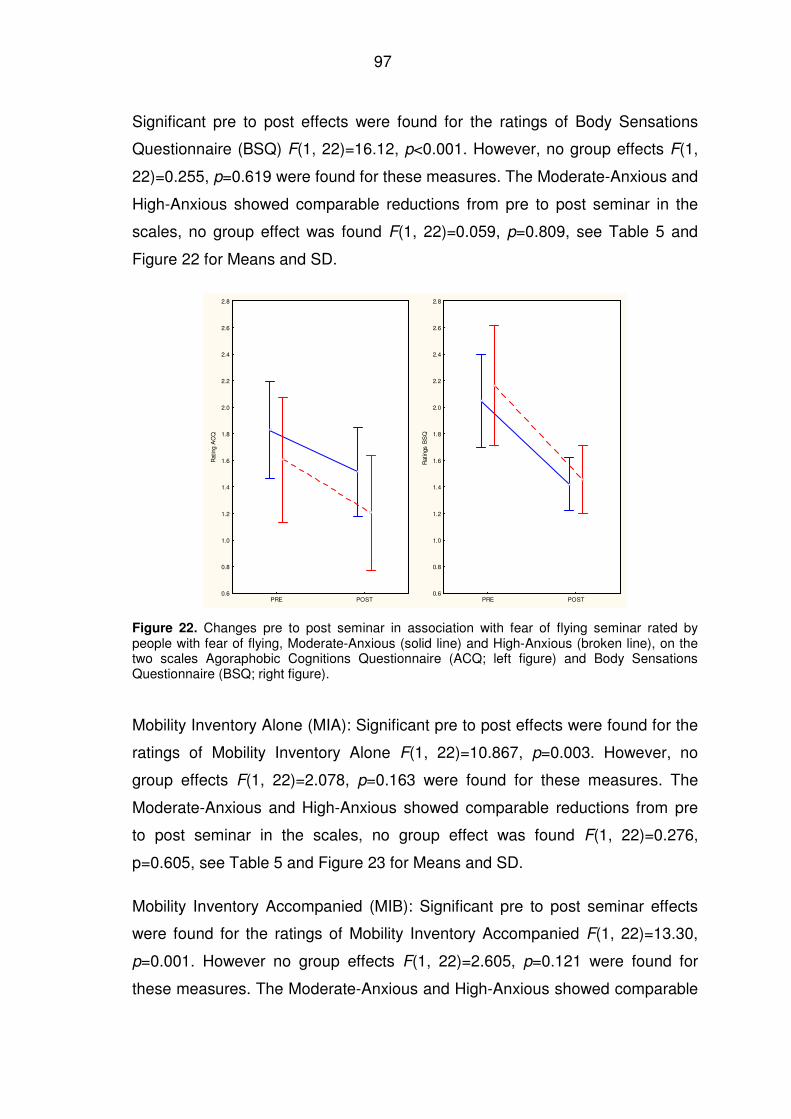
97
Significant pre to post effects were found for the ratings of Body Sensations
Questionnaire (BSQ) F(1, 22)=16.12, p<0.001. However, no group effects F(1,
22)=0.255, p=0.619 were found for these measures. The Moderate-Anxious and
High-Anxious showed comparable reductions from pre to post seminar in the
scales, no group effect was found F(1, 22)=0.059, p=0.809, see Table 5 and
Figure 22 for Means and SD.
PRE POST0.6
0.8
1.0
1.2
1.4
1.6
1.8
2.0
2.2
2.4
2.6
2.8
Rat
ing
AC
Q
PRE POST0.6
0.8
1.0
1.2
1.4
1.6
1.8
2.0
2.2
2.4
2.6
2.8
Rat
ings
BS
Q
Figure 22. Changes pre to post seminar in association with fear of flying seminar rated by people with fear of flying, Moderate-Anxious (solid line) and High-Anxious (broken line), on the two scales Agoraphobic Cognitions Questionnaire (ACQ; left figure) and Body Sensations Questionnaire (BSQ; right figure).
Mobility Inventory Alone (MIA): Significant pre to post effects were found for the
ratings of Mobility Inventory Alone F(1, 22)=10.867, p=0.003. However, no
group effects F(1, 22)=2.078, p=0.163 were found for these measures. The
Moderate-Anxious and High-Anxious showed comparable reductions from pre
to post seminar in the scales, no group effect was found F(1, 22)=0.276,
p=0.605, see Table 5 and Figure 23 for Means and SD.
Mobility Inventory Accompanied (MIB): Significant pre to post seminar effects
were found for the ratings of Mobility Inventory Accompanied F(1, 22)=13.30,
p=0.001. However no group effects F(1, 22)=2.605, p=0.121 were found for
these measures. The Moderate-Anxious and High-Anxious showed comparable
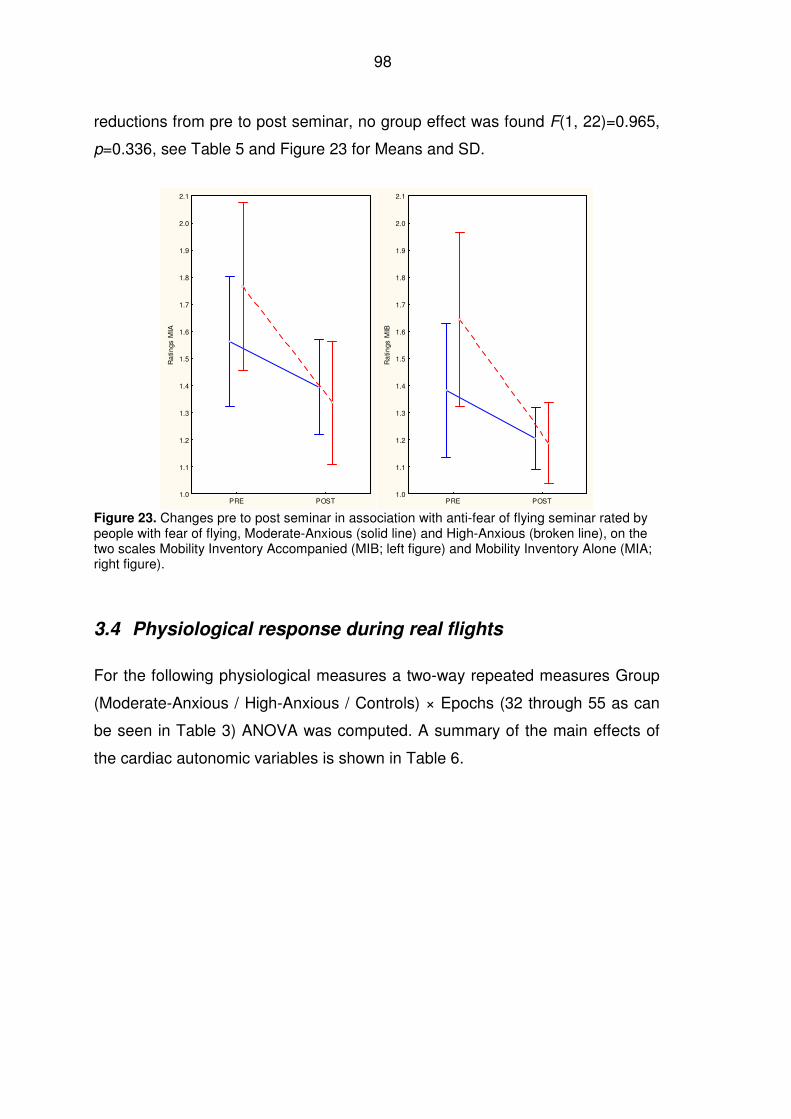
98
reductions from pre to post seminar, no group effect was found F(1, 22)=0.965,
p=0.336, see Table 5 and Figure 23 for Means and SD.
PRE POST1.0
1.1
1.2
1.3
1.4
1.5
1.6
1.7
1.8
1.9
2.0
2.1
Ra
tings
MIA
PRE POST1.0
1.1
1.2
1.3
1.4
1.5
1.6
1.7
1.8
1.9
2.0
2.1
Ra
tings
MIB
Figure 23. Changes pre to post seminar in association with anti-fear of flying seminar rated by people with fear of flying, Moderate-Anxious (solid line) and High-Anxious (broken line), on the two scales Mobility Inventory Accompanied (MIB; left figure) and Mobility Inventory Alone (MIA; right figure).
3.4 Physiological response during real flights
For the following physiological measures a two-way repeated measures Group
(Moderate-Anxious / High-Anxious / Controls) × Epochs (32 through 55 as can
be seen in Table 3) ANOVA was computed. A summary of the main effects of
the cardiac autonomic variables is shown in Table 6.
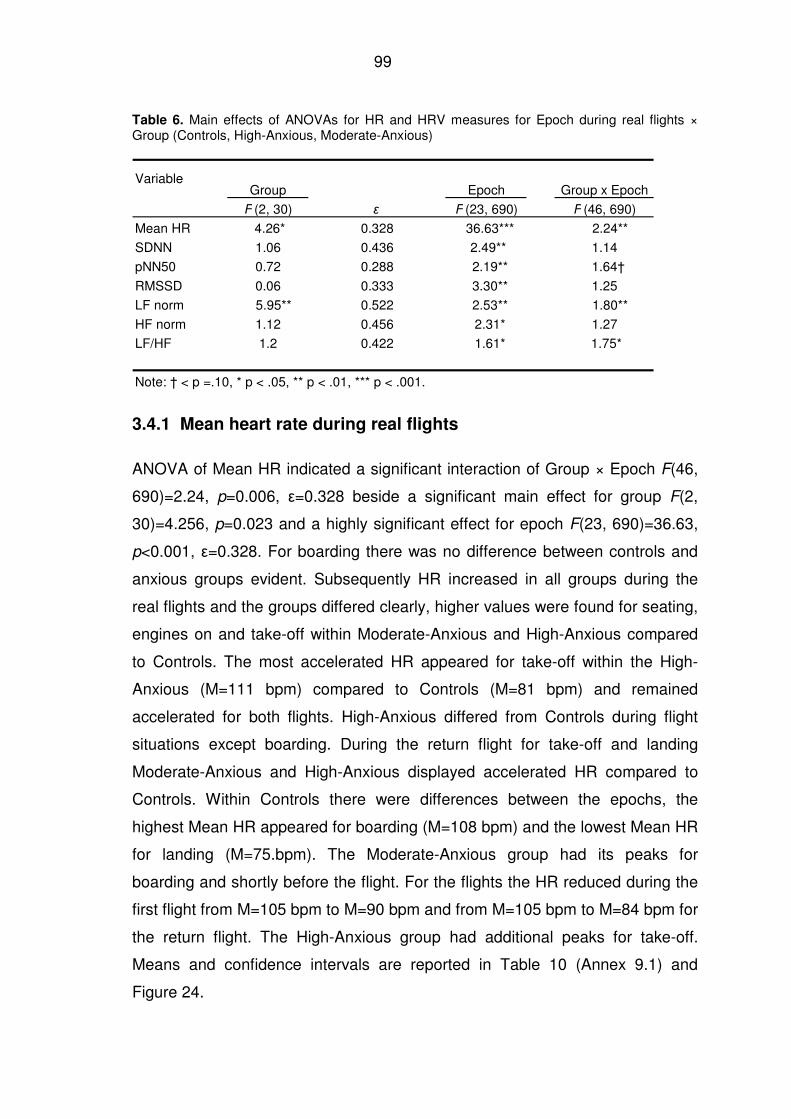
99
Table 6. Main effects of ANOVAs for HR and HRV measures for Epoch during real flights × Group (Controls, High-Anxious, Moderate-Anxious)
Group Epoch Group x Epoch
F (2, 30) ε F (23, 690) F (46, 690)
Mean HR 4.26* 0.328 36.63*** 2.24**
SDNN 1.06 0.436 2.49** 1.14
pNN50 0.72 0.288 2.19** 1.64†
RMSSD 0.06 0.333 3.30** 1.25
LF norm 5.95** 0.522 2.53** 1.80**
HF norm 1.12 0.456 2.31* 1.27
LF/HF 1.2 0.422 1.61* 1.75*
Note: † < p =.10, * p < .05, ** p < .01, *** p < .001.
Variable
3.4.1 Mean heart rate during real flights
ANOVA of Mean HR indicated a significant interaction of Group × Epoch F(46,
690)=2.24, p=0.006, ε=0.328 beside a significant main effect for group F(2,
30)=4.256, p=0.023 and a highly significant effect for epoch F(23, 690)=36.63,
p<0.001, ε=0.328. For boarding there was no difference between controls and
anxious groups evident. Subsequently HR increased in all groups during the
real flights and the groups differed clearly, higher values were found for seating,
engines on and take-off within Moderate-Anxious and High-Anxious compared
to Controls. The most accelerated HR appeared for take-off within the High-
Anxious (M=111 bpm) compared to Controls (M=81 bpm) and remained
accelerated for both flights. High-Anxious differed from Controls during flight
situations except boarding. During the return flight for take-off and landing
Moderate-Anxious and High-Anxious displayed accelerated HR compared to
Controls. Within Controls there were differences between the epochs, the
highest Mean HR appeared for boarding (M=108 bpm) and the lowest Mean HR
for landing (M=75.bpm). The Moderate-Anxious group had its peaks for
boarding and shortly before the flight. For the flights the HR reduced during the
first flight from M=105 bpm to M=90 bpm and from M=105 bpm to M=84 bpm for
the return flight. The High-Anxious group had additional peaks for take-off.
Means and confidence intervals are reported in Table 10 (Annex 9.1) and
Figure 24.
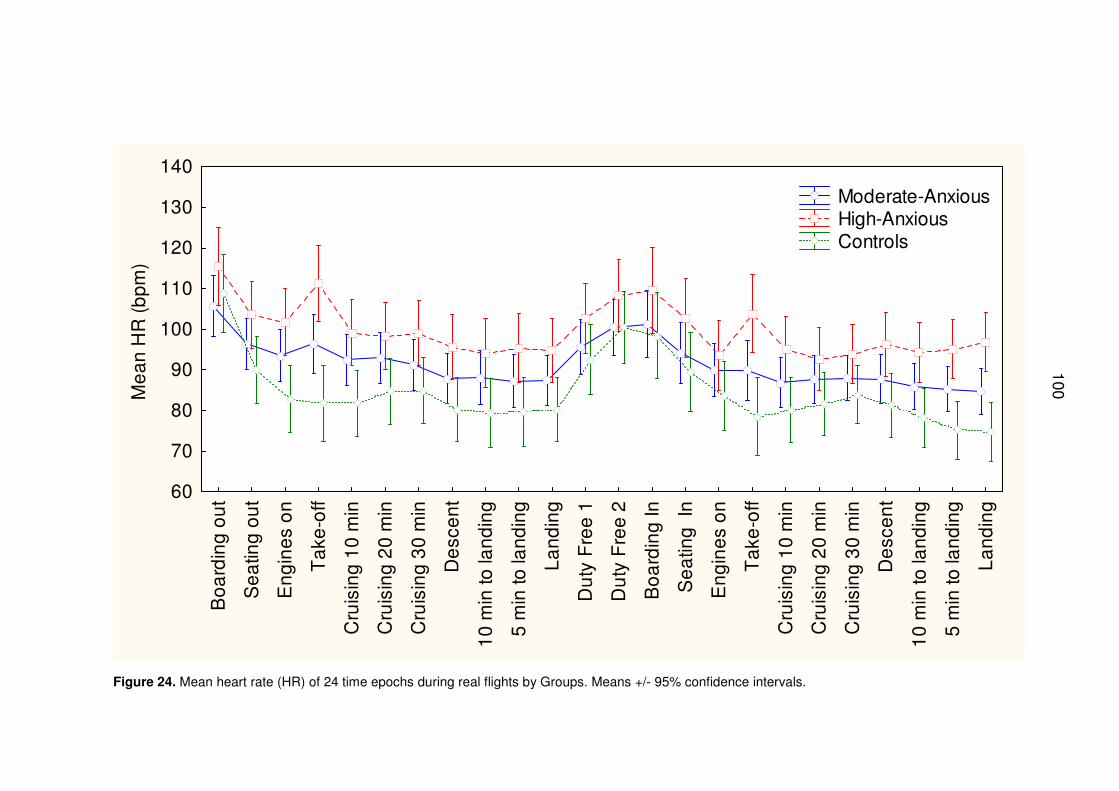
100
Bo
ard
ing
ou
t
Se
atin
g o
ut
En
gin
es
on
Ta
ke-o
ff
Cru
isin
g 1
0 m
in
Cru
isin
g 2
0 m
in
Cru
isin
g 3
0 m
in
De
sce
nt
10
min
to la
nd
ing
5 m
in to
lan
din
g
La
nd
ing
Du
ty F
ree
1
Du
ty F
ree
2
Bo
ard
ing
In
Se
atin
g I
n
En
gin
es
on
Ta
ke-o
ff
Cru
isin
g 1
0 m
in
Cru
isin
g 2
0 m
in
Cru
isin
g 3
0 m
in
De
sce
nt
10
min
to la
nd
ing
5 m
in to
lan
din
g
La
nd
ing
60
70
80
90
100
110
120
130
140
Me
an
HR
(b
pm
)
Moderate-Anxious High-Anxious Controls
Figure 24. Mean heart rate (HR) of 24 time epochs during real flights by Groups. Means +/- 95% confidence intervals.
100
101
3.4.2 Heart rate variability during real flights
ANOVA of SDNN indicated a significant main effect for Epoch F(23,
690)=2.488, p=0.006, ε=0.436. The main effect Group was not significant F(2,
30)=1.058, p=0.359, the interaction Group × Epoch was not significant either
F(46, 690)=1.136, p=0.31, ε=0.436. Controls showed similar SDNN as Anxious
Groups, except High-Anxious, who showed a higher SDNN for cruising
according the confidence intervals. Moderate-Anxious displayed the lowest
values especially before landing during the first flight. While staying in the duty
free zone the values decreased for Moderate-Anxious and High-Anxious to 40,
whereas during the flights High-Anxious had their peaks at 60. Controls showed
means of 60 on the return-flight during landing. Means and confidence intervals
are reported in Table 11 (Annex 9.2) and Figure 25.
ANOVA of pNN50 indicated a statistical trend effect regarding interaction of
Group × Epoch F(46, 690)=1.641, p=0.075, ε=0.288, besides an obvious main
effect for Epoch F(23, 690)=2.191, p=0.03, ε=0.288, the main effect Group was
not significant F(2, 30)=0.72, p=0.495. The confidence intervals indicated
significant differences for Epochs, especially during boarding both flights.
Controls displayed only a pNN50-value of 0.001; the values went up within the
flights to peaks of 0.15 for landing on the return-flight. Means and confidence
intervals are reported in Table 12 (Annex 9.3) and Figure 26.
ANOVA of RMSSD indicated a significant main effect of Epoch F(23,
690)=3.295, p=0.002, ε=0.333. The main effect Group was not significant F(2,
30)=0.06, p=0.941, the interaction Group × Epoch was not significant F(46,
690)=1.251, p=0.23, ε=0.333. Confidence intervals indicated differences
between High-Anxious and Controls for take-off on the flight-out and on the
flight-in. For landing during the flight-in the Controls had higher means
(M=33.60) than High-Anxious (M=22.7) and Moderate-Anxious (M=27.9).
Means and confidence intervals are reported in Table 13 (Annex 9.4) and
Figure 25.
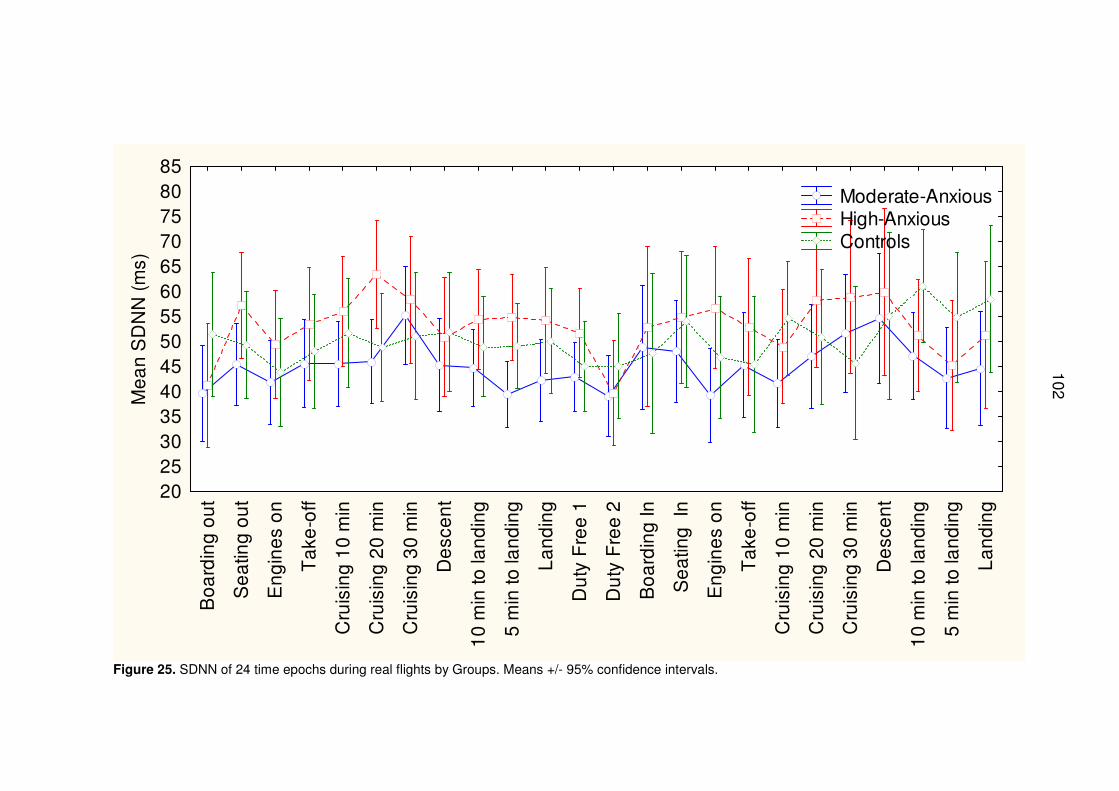
102
Bo
ard
ing
ou
t
Se
atin
g o
ut
En
gin
es
on
Ta
ke-o
ff
Cru
isin
g 1
0 m
in
Cru
isin
g 2
0 m
in
Cru
isin
g 3
0 m
in
De
sce
nt
10
min
to la
nd
ing
5 m
in to
lan
din
g
La
nd
ing
Du
ty F
ree
1
Du
ty F
ree
2
Bo
ard
ing
In
Se
atin
g I
n
En
gin
es
on
Ta
ke-o
ff
Cru
isin
g 1
0 m
in
Cru
isin
g 2
0 m
in
Cru
isin
g 3
0 m
in
De
sce
nt
10
min
to la
nd
ing
5 m
in to
lan
din
g
La
nd
ing
2025303540455055606570758085
Me
an
SD
NN
(m
s)
Moderate-Anxious High-Anxious Controls
Figure 25. SDNN of 24 time epochs during real flights by Groups. Means +/- 95% confidence intervals.
102
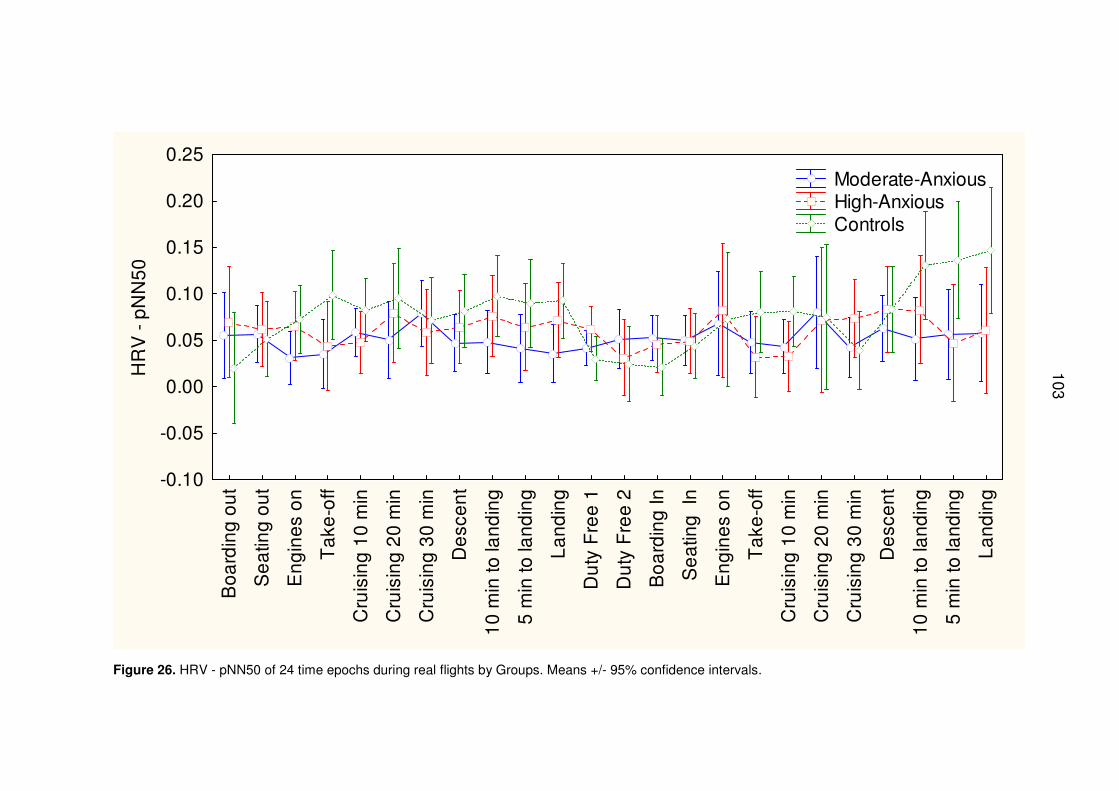
103
Bo
ard
ing
ou
t
Se
atin
g o
ut
En
gin
es
on
Ta
ke-o
ff
Cru
isin
g 1
0 m
in
Cru
isin
g 2
0 m
in
Cru
isin
g 3
0 m
in
De
sce
nt
10
min
to la
nd
ing
5 m
in to
lan
din
g
La
nd
ing
Du
ty F
ree
1
Du
ty F
ree
2
Bo
ard
ing
In
Se
atin
g I
n
En
gin
es
on
Ta
ke-o
ff
Cru
isin
g 1
0 m
in
Cru
isin
g 2
0 m
in
Cru
isin
g 3
0 m
in
De
sce
nt
10
min
to la
nd
ing
5 m
in to
lan
din
g
La
nd
ing
-0.10
-0.05
0.00
0.05
0.10
0.15
0.20
0.25H
RV
- p
NN
50
Moderate-Anxious High-Anxious Controls
Figure 26. HRV - pNN50 of 24 time epochs during real flights by Groups. Means +/- 95% confidence intervals.
103
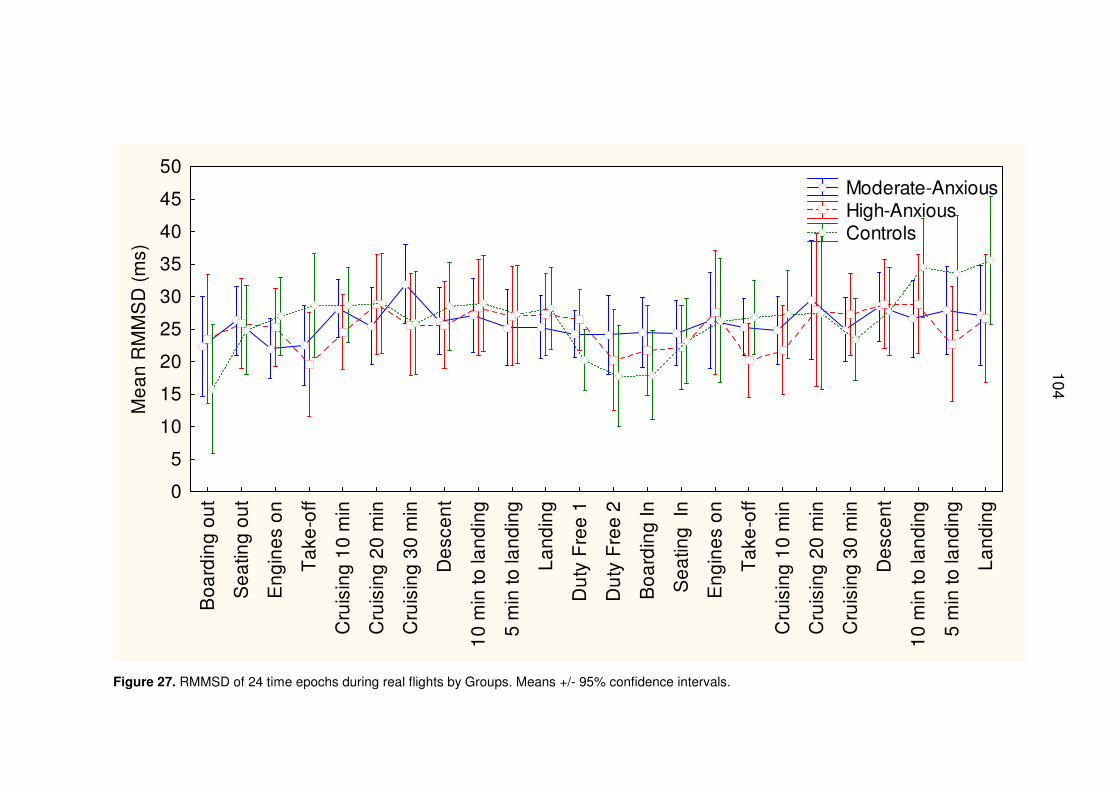
104
Bo
ard
ing
ou
t
Se
atin
g o
ut
En
gin
es
on
Ta
ke-o
ff
Cru
isin
g 1
0 m
in
Cru
isin
g 2
0 m
in
Cru
isin
g 3
0 m
in
De
sce
nt
10
min
to la
nd
ing
5 m
in to
lan
din
g
La
nd
ing
Du
ty F
ree
1
Du
ty F
ree
2
Bo
ard
ing
In
Se
atin
g I
n
En
gin
es
on
Ta
ke-o
ff
Cru
isin
g 1
0 m
in
Cru
isin
g 2
0 m
in
Cru
isin
g 3
0 m
in
De
sce
nt
10
min
to la
nd
ing
5 m
in to
lan
din
g
La
nd
ing
0
5
10
15
20
25
30
35
40
45
50
Me
an
RM
MS
D (
ms)
Moderate-Anxious High-Anxious Controls
Figure 27. RMMSD of 24 time epochs during real flights by Groups. Means +/- 95% confidence intervals.
104
105
ANOVA of LFnorm indicated a significant interaction of Group × Epoch F(46,
690)=1.804, p=0.001, ε=0.522, besides a significant main effect for Group F(2,
30)=5.95, p=0.003 and significant for Epoch F(23, 690)=2.532, p=0.003,
ε=0.522. According to the confidence intervals Controls had higher LFnorm than
Moderate-Anxious and High-Anxious for engines on and for take-off on the
flight-out. The Moderate-Anxious showed less LFnorm than Controls and High-
Anxious for all situations. During the return-flight High-Anxious showed the
lowest LFnorm at take-off and the highest LFnorm at cruising. The lowest
values were found in all groups during moving around in the duty free zone.
Means and confidence intervals are reported in Table 14 (Annex 9.5) and
Figure 28.
ANOVA of HFnorm indicated a significant effect for Epoch F(23, 690)=2.314,
p=0.01, ε=0.456. The main effect Group was not significant F(2, 30)=1.12,
p=0.341, the interaction Group × Epoch was not significant either F(46,
690)=1.27, p=0.19, ε=0.456. Controls showed higher HFnorm than that of
Moderate-Anxious and High-Anxious during the flight-out for take-off and during
the flight-in for landing. The means of all groups were equivalent for boarding on
the return flight, and for duty free zone, where the HFnorm of Controls was as
low as that of Moderate-Anxious and High-Anxious. Means and confidence
intervals are reported in Table 15 (Annex 9.6) and Figure 29.
ANOVA of the log LF/HF-balance score indicated a significant interaction of
Group × Epoch F(46, 690)=1.717, p=0.03, ε=0.422, besides a trend effect for
Epoch F(23, 690)=1.613, p=0.105, ε=0.422. The main effect Group was not
significant F(2, 30)=1.195, p=0.317. The confidence intervals indicated that for
boarding the flight-out the Controls showed higher log LF/HF ratio than during
the flight situations. The Moderate-Anxious showed lower means during duty
free with a minimum value shortly before the return-flight. High-Anxious showed
peaks for flight situations, and higher values for cruising on the flight-out and 10
minutes before landing on the flight-in. Means and confidence intervals are
reported in Table 16 (Annex 9.7) and Figure 30.
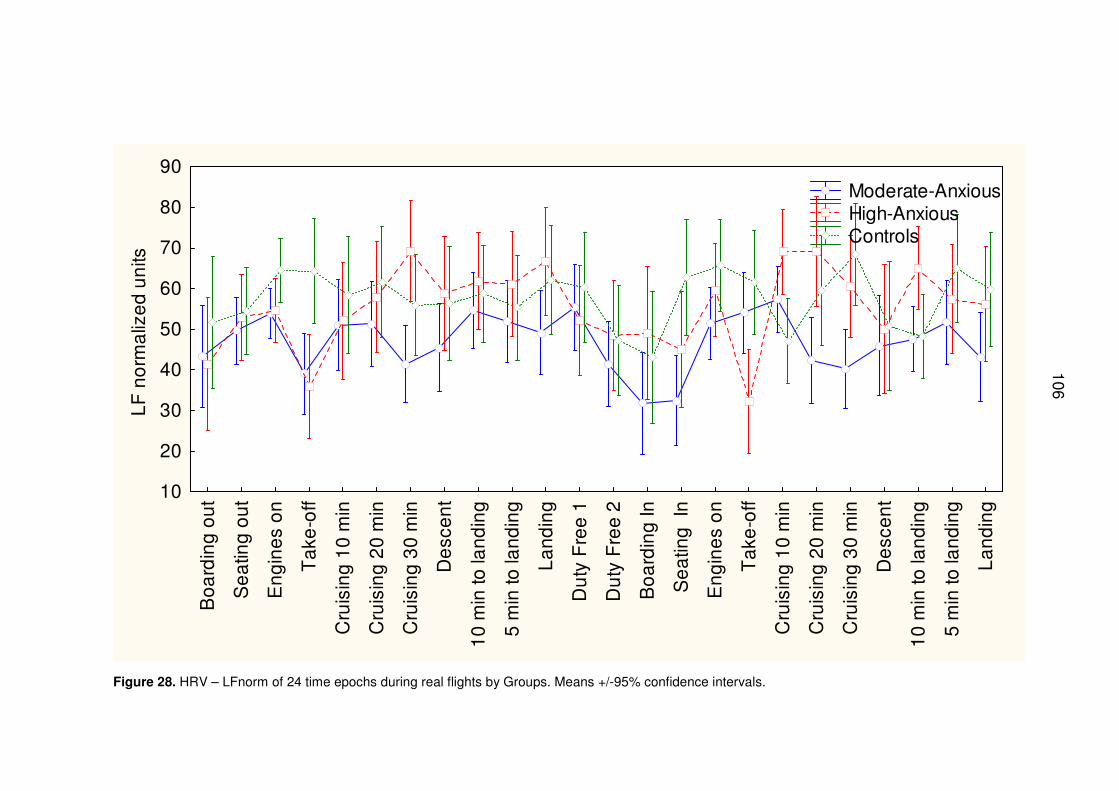
106
Bo
ard
ing
ou
t
Se
atin
g o
ut
En
gin
es
on
Ta
ke-o
ff
Cru
isin
g 1
0 m
in
Cru
isin
g 2
0 m
in
Cru
isin
g 3
0 m
in
De
sce
nt
10
min
to la
nd
ing
5 m
in to
lan
din
g
La
nd
ing
Du
ty F
ree
1
Du
ty F
ree
2
Bo
ard
ing
In
Se
atin
g I
n
En
gin
es
on
Ta
ke-o
ff
Cru
isin
g 1
0 m
in
Cru
isin
g 2
0 m
in
Cru
isin
g 3
0 m
in
De
sce
nt
10
min
to la
nd
ing
5 m
in to
lan
din
g
La
nd
ing
10
20
30
40
50
60
70
80
90
LF
no
rma
lize
d u
nits
Moderate-Anxious High-Anxious Controls
Figure 28. HRV – LFnorm of 24 time epochs during real flights by Groups. Means +/-95% confidence intervals.
106
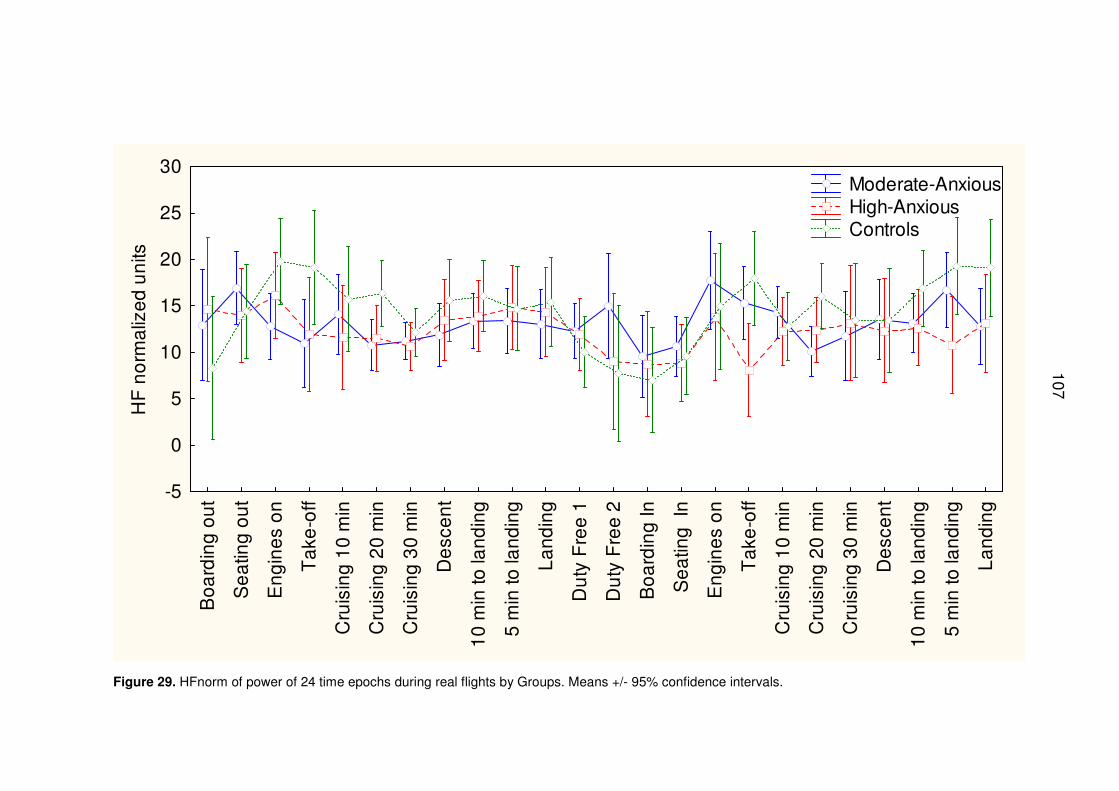
107
Bo
ard
ing
ou
t
Se
atin
g o
ut
En
gin
es
on
Ta
ke-o
ff
Cru
isin
g 1
0 m
in
Cru
isin
g 2
0 m
in
Cru
isin
g 3
0 m
in
De
sce
nt
10
min
to la
nd
ing
5 m
in to
lan
din
g
La
nd
ing
Du
ty F
ree
1
Du
ty F
ree
2
Bo
ard
ing
In
Se
atin
g I
n
En
gin
es
on
Ta
ke-o
ff
Cru
isin
g 1
0 m
in
Cru
isin
g 2
0 m
in
Cru
isin
g 3
0 m
in
De
sce
nt
10
min
to la
nd
ing
5 m
in to
lan
din
g
La
nd
ing
-5
0
5
10
15
20
25
30
HF
no
rma
lize
d u
nits
Moderate-Anxious High-Anxious Controls
Figure 29. HFnorm of power of 24 time epochs during real flights by Groups. Means +/- 95% confidence intervals.
107
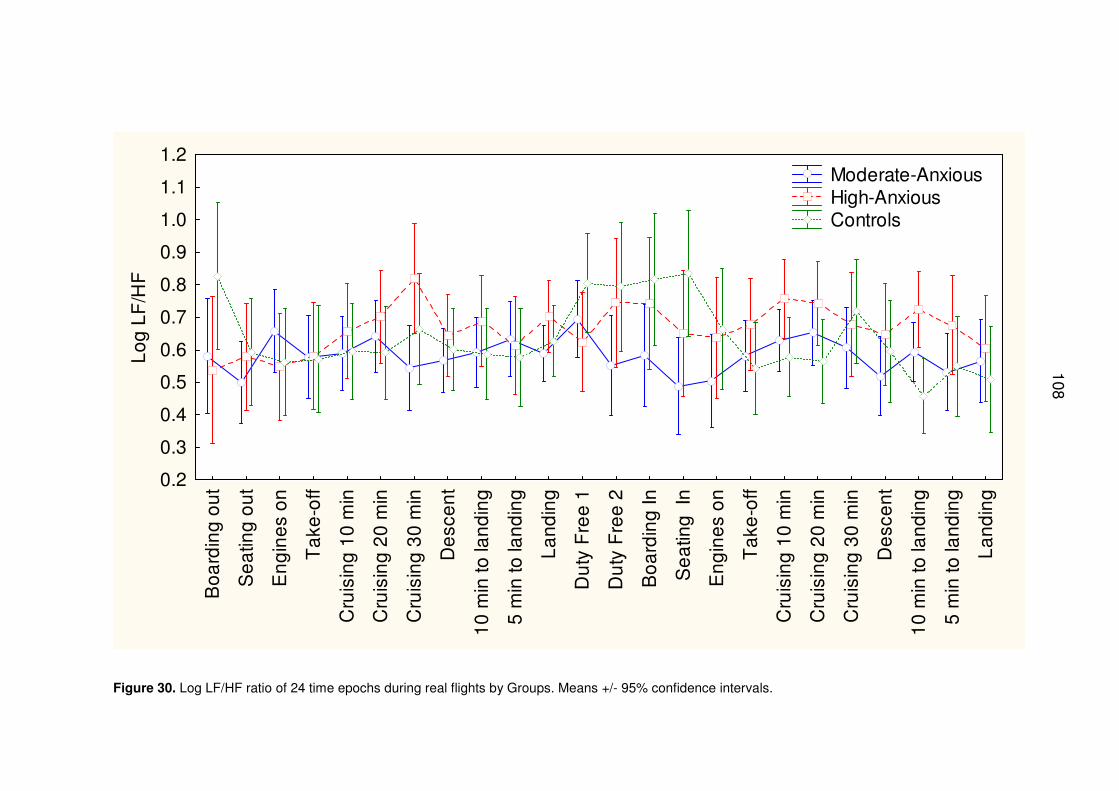
108
Bo
ard
ing
ou
t
Se
atin
g o
ut
En
gin
es
on
Ta
ke-o
ff
Cru
isin
g 1
0 m
in
Cru
isin
g 2
0 m
in
Cru
isin
g 3
0 m
in
De
sce
nt
10
min
to la
nd
ing
5 m
in to
lan
din
g
La
nd
ing
Du
ty F
ree
1
Du
ty F
ree
2
Bo
ard
ing
In
Se
atin
g I
n
En
gin
es
on
Ta
ke-o
ff
Cru
isin
g 1
0 m
in
Cru
isin
g 2
0 m
in
Cru
isin
g 3
0 m
in
De
sce
nt
10
min
to la
nd
ing
5 m
in to
lan
din
g
La
nd
ing
0.2
0.3
0.4
0.5
0.6
0.7
0.8
0.9
1.0
1.1
1.2L
og
LF
/HF
Moderate-Anxious High-Anxious Controls
Figure 30. Log LF/HF ratio of 24 time epochs during real flights by Groups. Means +/- 95% confidence intervals.
108
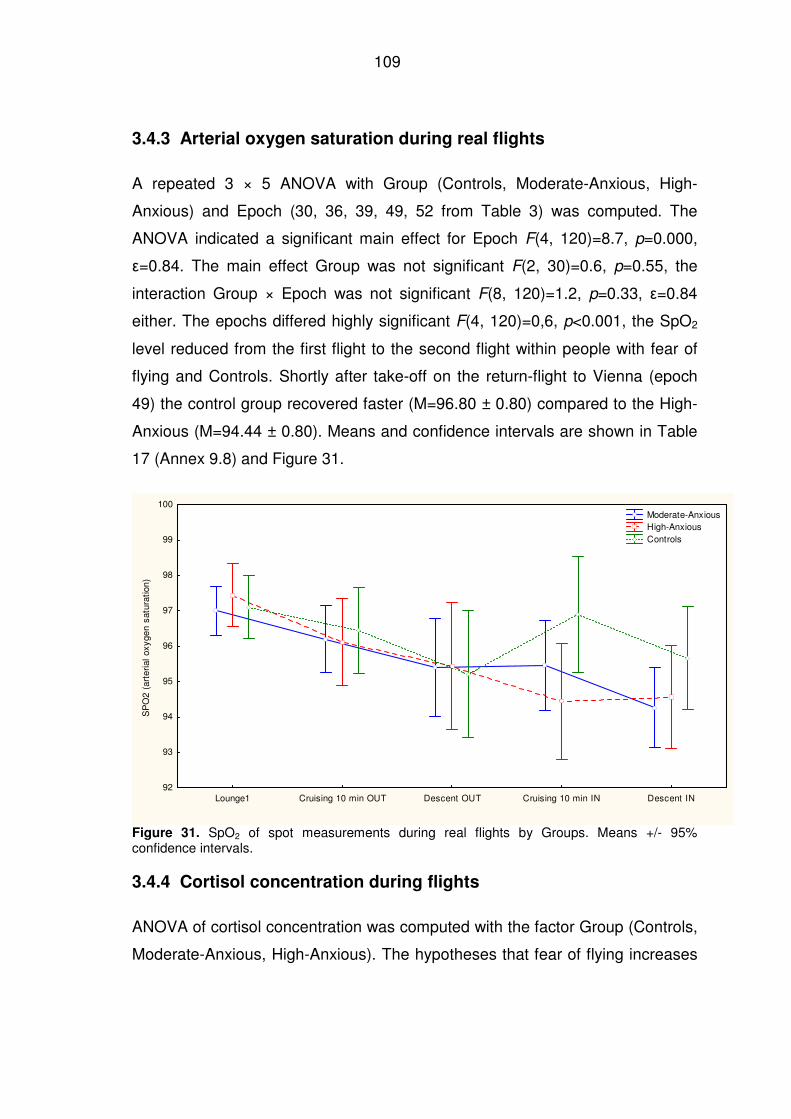
109
3.4.3 Arterial oxygen saturation during real flights
A repeated 3 × 5 ANOVA with Group (Controls, Moderate-Anxious, High-
Anxious) and Epoch (30, 36, 39, 49, 52 from Table 3) was computed. The
ANOVA indicated a significant main effect for Epoch F(4, 120)=8.7, p=0.000,
ε=0.84. The main effect Group was not significant F(2, 30)=0.6, p=0.55, the
interaction Group × Epoch was not significant F(8, 120)=1.2, p=0.33, ε=0.84
either. The epochs differed highly significant F(4, 120)=0,6, p<0.001, the SpO2
level reduced from the first flight to the second flight within people with fear of
flying and Controls. Shortly after take-off on the return-flight to Vienna (epoch
49) the control group recovered faster (M=96.80 ± 0.80) compared to the High-
Anxious (M=94.44 ± 0.80). Means and confidence intervals are shown in Table
17 (Annex 9.8) and Figure 31.
Lounge1 Cruising 10 min OUT Descent OUT Cruising 10 min IN Descent IN92
93
94
95
96
97
98
99
100
SP
O2
(art
eria
l ox
yge
n sa
tura
tion
)
Moderate-Anxious High-Anxious Controls
Figure 31. SpO2 of spot measurements during real flights by Groups. Means +/- 95% confidence intervals.
3.4.4 Cortisol concentration during flights
ANOVA of cortisol concentration was computed with the factor Group (Controls,
Moderate-Anxious, High-Anxious). The hypotheses that fear of flying increases
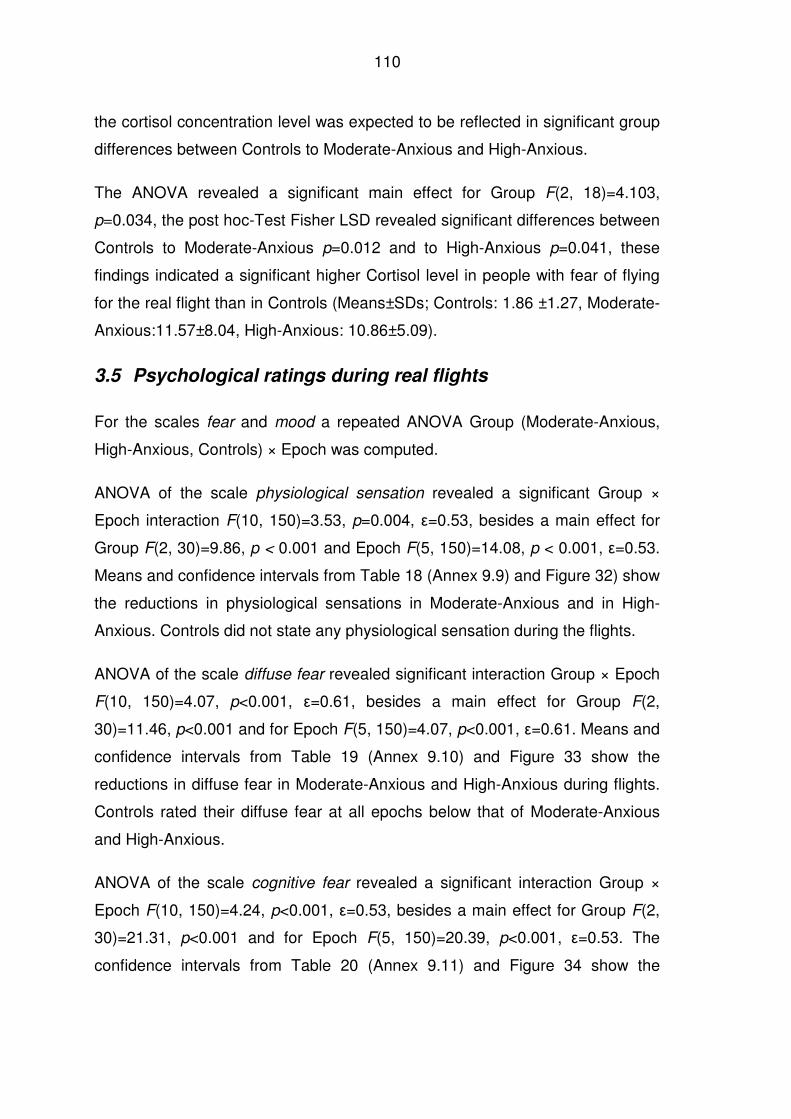
110
the cortisol concentration level was expected to be reflected in significant group
differences between Controls to Moderate-Anxious and High-Anxious.
The ANOVA revealed a significant main effect for Group F(2, 18)=4.103,
p=0.034, the post hoc-Test Fisher LSD revealed significant differences between
Controls to Moderate-Anxious p=0.012 and to High-Anxious p=0.041, these
findings indicated a significant higher Cortisol level in people with fear of flying
for the real flight than in Controls (Means±SDs; Controls: 1.86 ±1.27, Moderate-
Anxious:11.57±8.04, High-Anxious: 10.86±5.09).
3.5 Psychological ratings during real flights
For the scales fear and mood a repeated ANOVA Group (Moderate-Anxious,
High-Anxious, Controls) × Epoch was computed.
ANOVA of the scale physiological sensation revealed a significant Group ×
Epoch interaction F(10, 150)=3.53, p=0.004, ε=0.53, besides a main effect for
Group F(2, 30)=9.86, p < 0.001 and Epoch F(5, 150)=14.08, p < 0.001, ε=0.53.
Means and confidence intervals from Table 18 (Annex 9.9) and Figure 32) show
the reductions in physiological sensations in Moderate-Anxious and in High-
Anxious. Controls did not state any physiological sensation during the flights.
ANOVA of the scale diffuse fear revealed significant interaction Group × Epoch
F(10, 150)=4.07, p<0.001, ε=0.61, besides a main effect for Group F(2,
30)=11.46, p<0.001 and for Epoch F(5, 150)=4.07, p<0.001, ε=0.61. Means and
confidence intervals from Table 19 (Annex 9.10) and Figure 33 show the
reductions in diffuse fear in Moderate-Anxious and High-Anxious during flights.
Controls rated their diffuse fear at all epochs below that of Moderate-Anxious
and High-Anxious.
ANOVA of the scale cognitive fear revealed a significant interaction Group ×
Epoch F(10, 150)=4.24, p<0.001, ε=0.53, besides a main effect for Group F(2,
30)=21.31, p<0.001 and for Epoch F(5, 150)=20.39, p<0.001, ε=0.53. The
confidence intervals from Table 20 (Annex 9.11) and Figure 34 show the
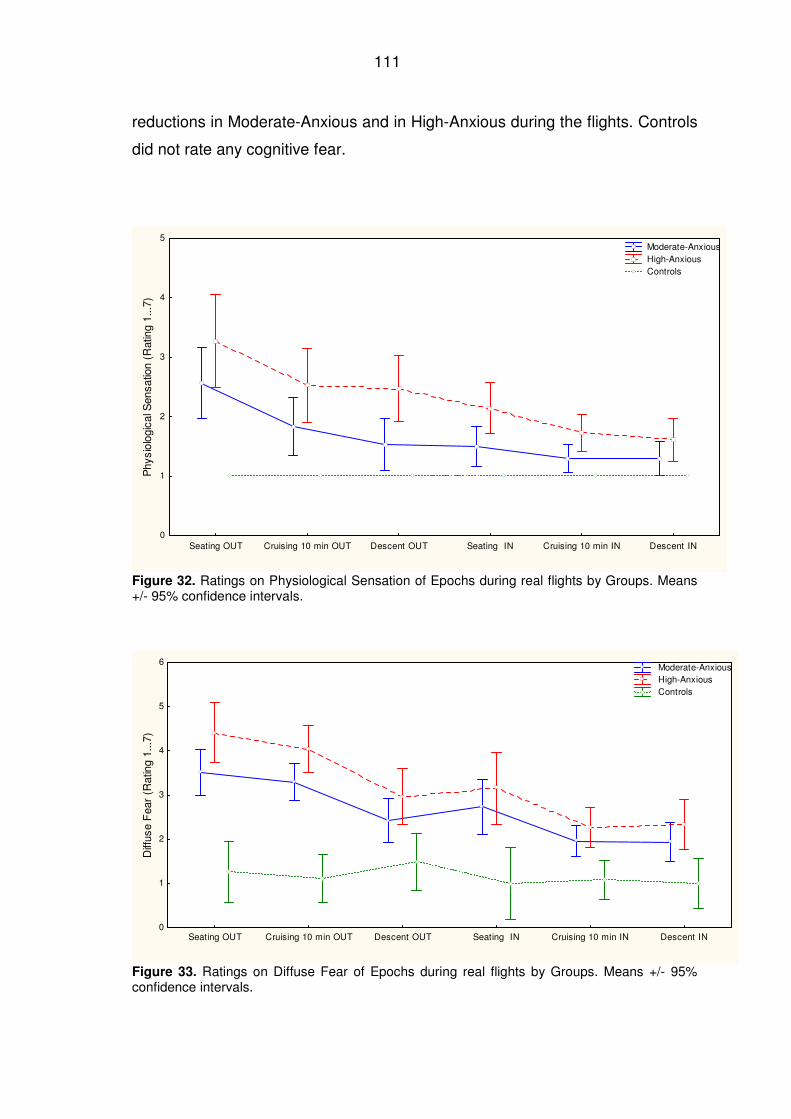
111
reductions in Moderate-Anxious and in High-Anxious during the flights. Controls
did not rate any cognitive fear.
Seating OUT Cruising 10 min OUT Descent OUT Seating IN Cruising 10 min IN Descent IN0
1
2
3
4
5
Phy
siol
ogic
al S
ensa
tion
(Rat
ing
1...7
)
Moderate-Anxious High-Anxious Controls
Figure 32. Ratings on Physiological Sensation of Epochs during real flights by Groups. Means +/- 95% confidence intervals.
Seating OUT Cruising 10 min OUT Descent OUT Seating IN Cruising 10 min IN Descent IN0
1
2
3
4
5
6
Diff
use
Fea
r (R
atin
g 1.
..7)
Moderate-Anxious High-Anxious Controls
Figure 33. Ratings on Diffuse Fear of Epochs during real flights by Groups. Means +/- 95% confidence intervals.
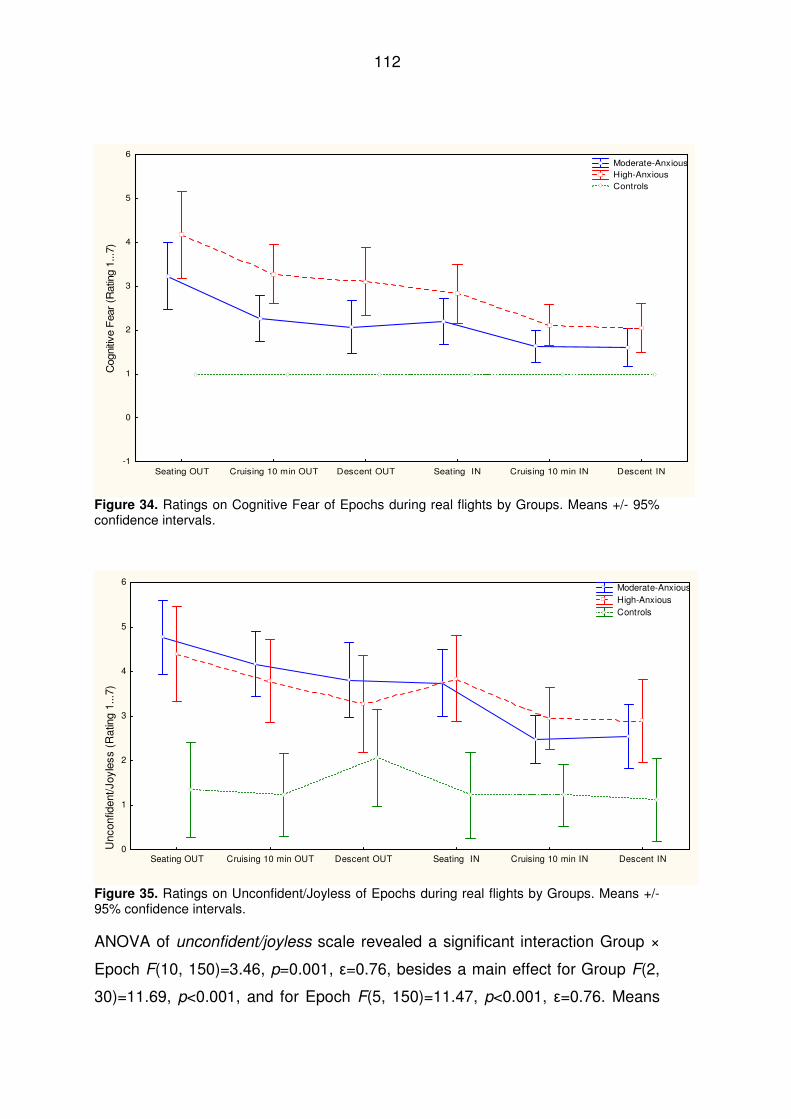
112
Seating OUT Cruising 10 min OUT Descent OUT Seating IN Cruising 10 min IN Descent IN-1
0
1
2
3
4
5
6
Cog
nitiv
e F
ear
(Rat
ing
1...7
)
Moderate-Anxious High-Anxious Controls
Figure 34. Ratings on Cognitive Fear of Epochs during real flights by Groups. Means +/- 95% confidence intervals.
Seating OUT Cruising 10 min OUT Descent OUT Seating IN Cruising 10 min IN Descent IN0
1
2
3
4
5
6
Unc
onfid
ent/J
oyle
ss (
Rat
ing
1...7
)
Moderate-Anxious High-Anxious Controls
Figure 35. Ratings on Unconfident/Joyless of Epochs during real flights by Groups. Means +/- 95% confidence intervals.
ANOVA of unconfident/joyless scale revealed a significant interaction Group ×
Epoch F(10, 150)=3.46, p=0.001, ε=0.76, besides a main effect for Group F(2,
30)=11.69, p<0.001, and for Epoch F(5, 150)=11.47, p<0.001, ε=0.76. Means
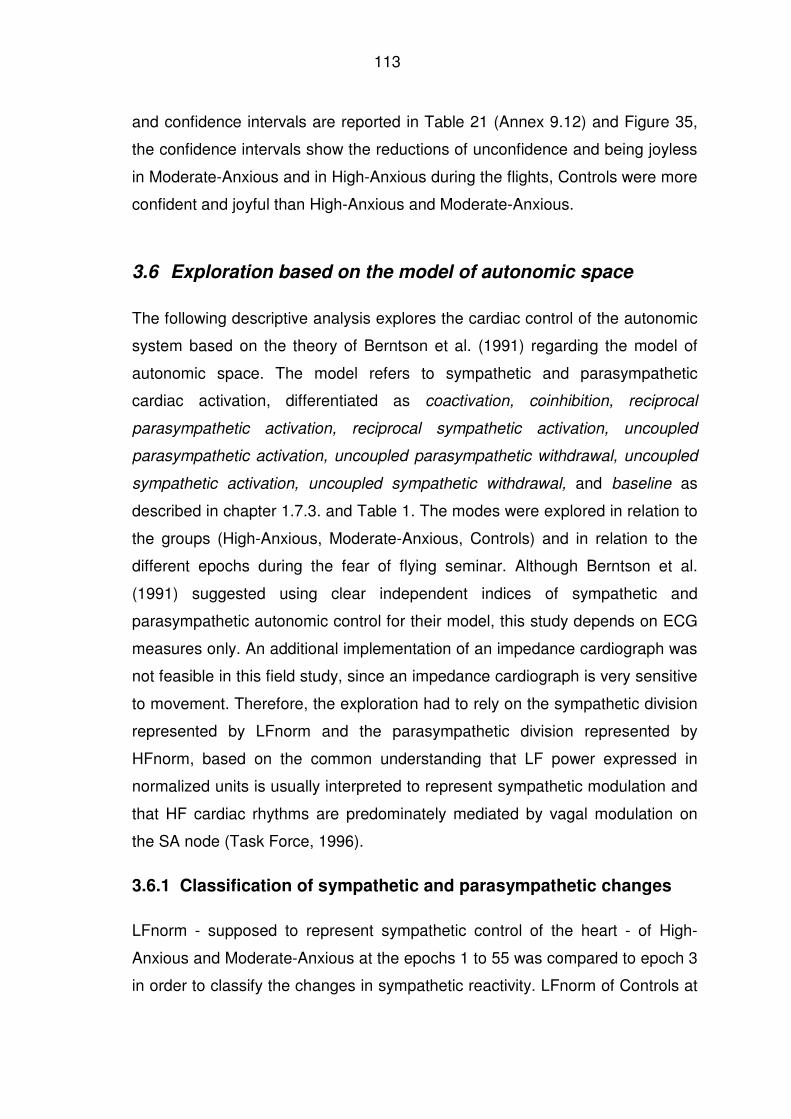
113
and confidence intervals are reported in Table 21 (Annex 9.12) and Figure 35,
the confidence intervals show the reductions of unconfidence and being joyless
in Moderate-Anxious and in High-Anxious during the flights, Controls were more
confident and joyful than High-Anxious and Moderate-Anxious.
3.6 Exploration based on the model of autonomic space
The following descriptive analysis explores the cardiac control of the autonomic
system based on the theory of Berntson et al. (1991) regarding the model of
autonomic space. The model refers to sympathetic and parasympathetic
cardiac activation, differentiated as coactivation, coinhibition, reciprocal
parasympathetic activation, reciprocal sympathetic activation, uncoupled
parasympathetic activation, uncoupled parasympathetic withdrawal, uncoupled
sympathetic activation, uncoupled sympathetic withdrawal, and baseline as
described in chapter 1.7.3. and Table 1. The modes were explored in relation to
the groups (High-Anxious, Moderate-Anxious, Controls) and in relation to the
different epochs during the fear of flying seminar. Although Berntson et al.
(1991) suggested using clear independent indices of sympathetic and
parasympathetic autonomic control for their model, this study depends on ECG
measures only. An additional implementation of an impedance cardiograph was
not feasible in this field study, since an impedance cardiograph is very sensitive
to movement. Therefore, the exploration had to rely on the sympathetic division
represented by LFnorm and the parasympathetic division represented by
HFnorm, based on the common understanding that LF power expressed in
normalized units is usually interpreted to represent sympathetic modulation and
that HF cardiac rhythms are predominately mediated by vagal modulation on
the SA node (Task Force, 1996).
3.6.1 Classification of sympathetic and parasympathetic changes
LFnorm - supposed to represent sympathetic control of the heart - of High-
Anxious and Moderate-Anxious at the epochs 1 to 55 was compared to epoch 3
in order to classify the changes in sympathetic reactivity. LFnorm of Controls at
114
the epochs 32 to 55 was compared to epoch 38. A change was counted if the
actual value exceeded the average SD per group. The average SD of LFnorm
was computed in Table 14. Not changed (N) applied when the difference was
less than the average SD, decreased (D) LFnorm applied when the change was
higher than the average SD and the direction of change was negative.
Increased (I) LFnorm applied when the change was higher than the average SD
and when the direction of change was positive. Classification is shown in Table
22 under column class.
HFnorm - supposed to represent parasympathetic control of the heart - of High-
Anxious and Moderate-Anxious at the epochs 1 to 55 was compared to epoch 3
in order to classify the changes of parasympathetic reactivity. HFnorm of
Controls at the epochs 32 to 55 was compared to epoch 38. A change was
counted if the actual value exceeded the average SD per group. The average
SD of HFnorm is computed in Table 15. Not changed (N) applied when the
difference value was less than the average SD, decreased (D) HFnorm applied
when the value of change was higher than average SD and negative. Increased
(I) LFnorm applied when the change was higher than the average SD and when
the direction of change was positive. Classification is shown in Table 23 under
column class.
3.6.2 Definition of autonomic modes after Berntson
Following the classification of change of cardiac reactivity at different time
points in LFnorm and HFnorm (Tables 22, 23, Appendix 9.13 and 9.14) the
combination of changes resulted in the specification of the related modes in
accordance to the theory of Berntson et al. (1991). The procedure is depicted in
Table 7.
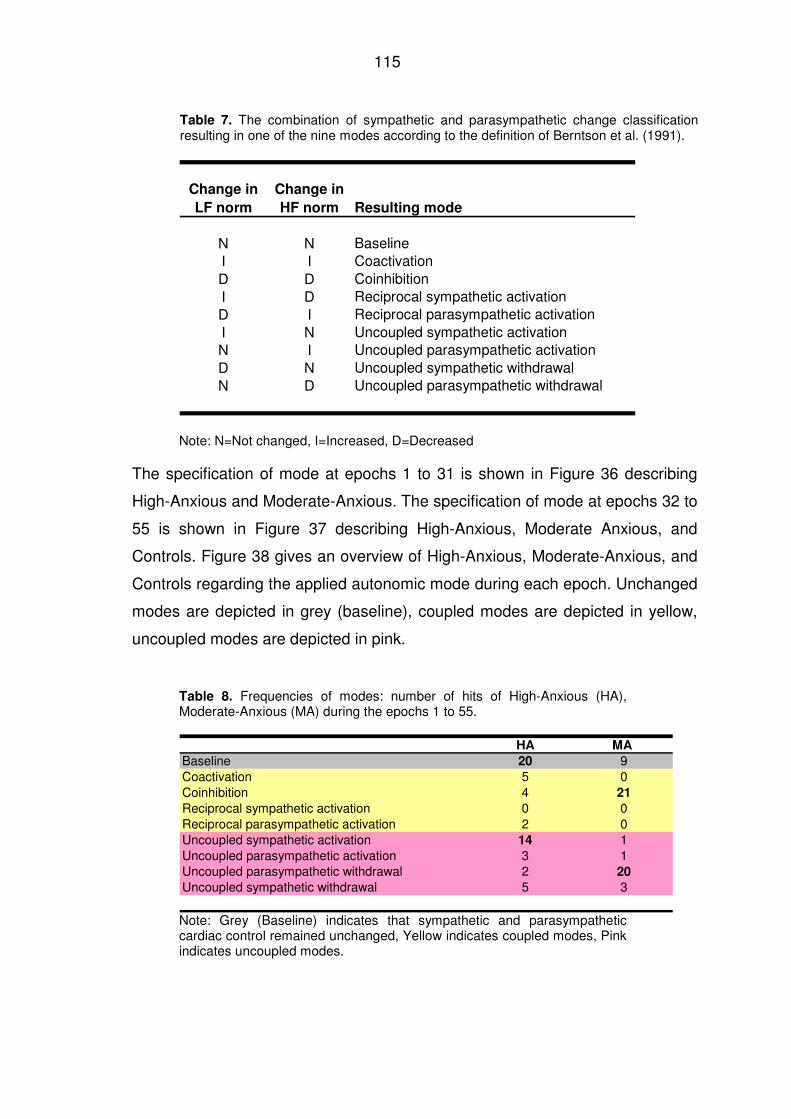
115
Table 7. The combination of sympathetic and parasympathetic change classification resulting in one of the nine modes according to the definition of Berntson et al. (1991).
Change in
LF norm
Change in
HF norm Resulting mode
N N BaselineI I CoactivationD D CoinhibitionI D Reciprocal sympathetic activationD I Reciprocal parasympathetic activationI N Uncoupled sympathetic activationN I Uncoupled parasympathetic activationD N Uncoupled sympathetic withdrawalN D Uncoupled parasympathetic withdrawal
Note: N=Not changed, I=Increased, D=Decreased
The specification of mode at epochs 1 to 31 is shown in Figure 36 describing
High-Anxious and Moderate-Anxious. The specification of mode at epochs 32 to
55 is shown in Figure 37 describing High-Anxious, Moderate Anxious, and
Controls. Figure 38 gives an overview of High-Anxious, Moderate-Anxious, and
Controls regarding the applied autonomic mode during each epoch. Unchanged
modes are depicted in grey (baseline), coupled modes are depicted in yellow,
uncoupled modes are depicted in pink.
Table 8. Frequencies of modes: number of hits of High-Anxious (HA), Moderate-Anxious (MA) during the epochs 1 to 55.
HA MA
Baseline 20 9Coactivation 5 0Coinhibition 4 21
Reciprocal sympathetic activation 0 0Reciprocal parasympathetic activation 2 0Uncoupled sympathetic activation 14 1Uncoupled parasympathetic activation 3 1Uncoupled parasympathetic withdrawal 2 20
Uncoupled sympathetic withdrawal 5 3
Note: Grey (Baseline) indicates that sympathetic and parasympathetic cardiac control remained unchanged, Yellow indicates coupled modes, Pink indicates uncoupled modes.
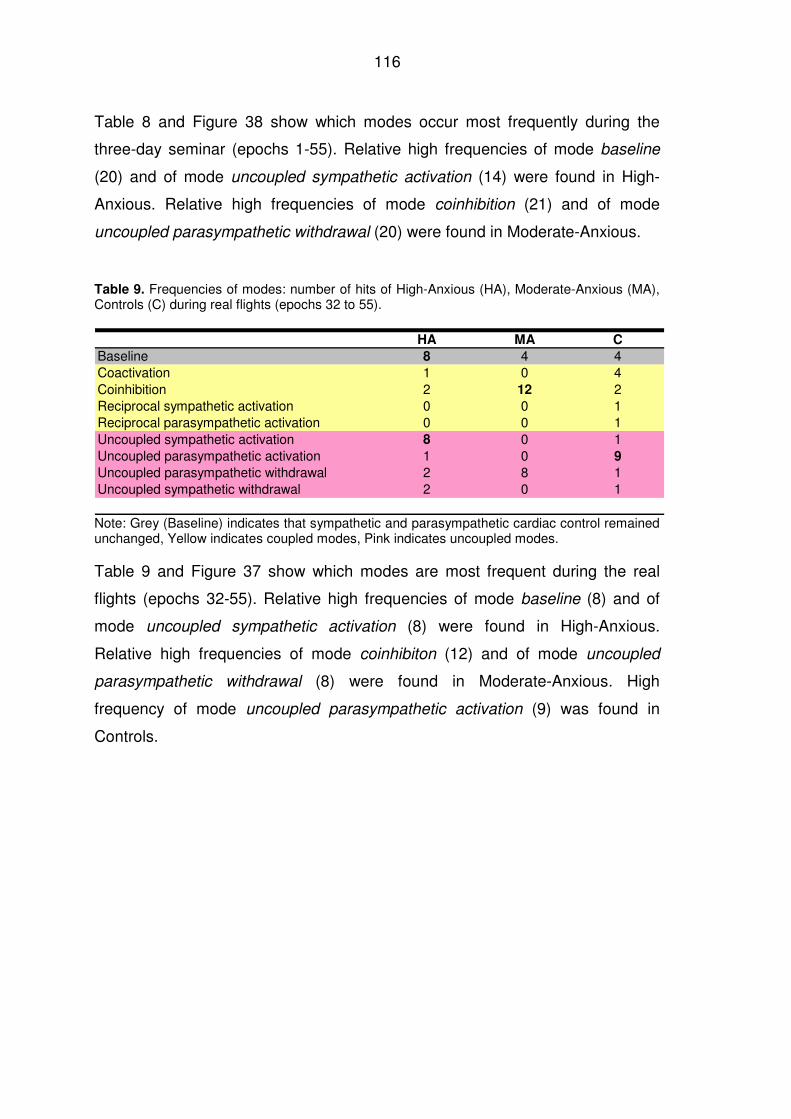
116
Table 8 and Figure 38 show which modes occur most frequently during the
three-day seminar (epochs 1-55). Relative high frequencies of mode baseline
(20) and of mode uncoupled sympathetic activation (14) were found in High-
Anxious. Relative high frequencies of mode coinhibition (21) and of mode
uncoupled parasympathetic withdrawal (20) were found in Moderate-Anxious.
Table 9. Frequencies of modes: number of hits of High-Anxious (HA), Moderate-Anxious (MA), Controls (C) during real flights (epochs 32 to 55).
HA MA C
Baseline 8 4 4Coactivation 1 0 4Coinhibition 2 12 2Reciprocal sympathetic activation 0 0 1Reciprocal parasympathetic activation 0 0 1Uncoupled sympathetic activation 8 0 1Uncoupled parasympathetic activation 1 0 9
Uncoupled parasympathetic withdrawal 2 8 1Uncoupled sympathetic withdrawal 2 0 1
Note: Grey (Baseline) indicates that sympathetic and parasympathetic cardiac control remained unchanged, Yellow indicates coupled modes, Pink indicates uncoupled modes.
Table 9 and Figure 37 show which modes are most frequent during the real
flights (epochs 32-55). Relative high frequencies of mode baseline (8) and of
mode uncoupled sympathetic activation (8) were found in High-Anxious.
Relative high frequencies of mode coinhibiton (12) and of mode uncoupled
parasympathetic withdrawal (8) were found in Moderate-Anxious. High
frequency of mode uncoupled parasympathetic activation (9) was found in
Controls.
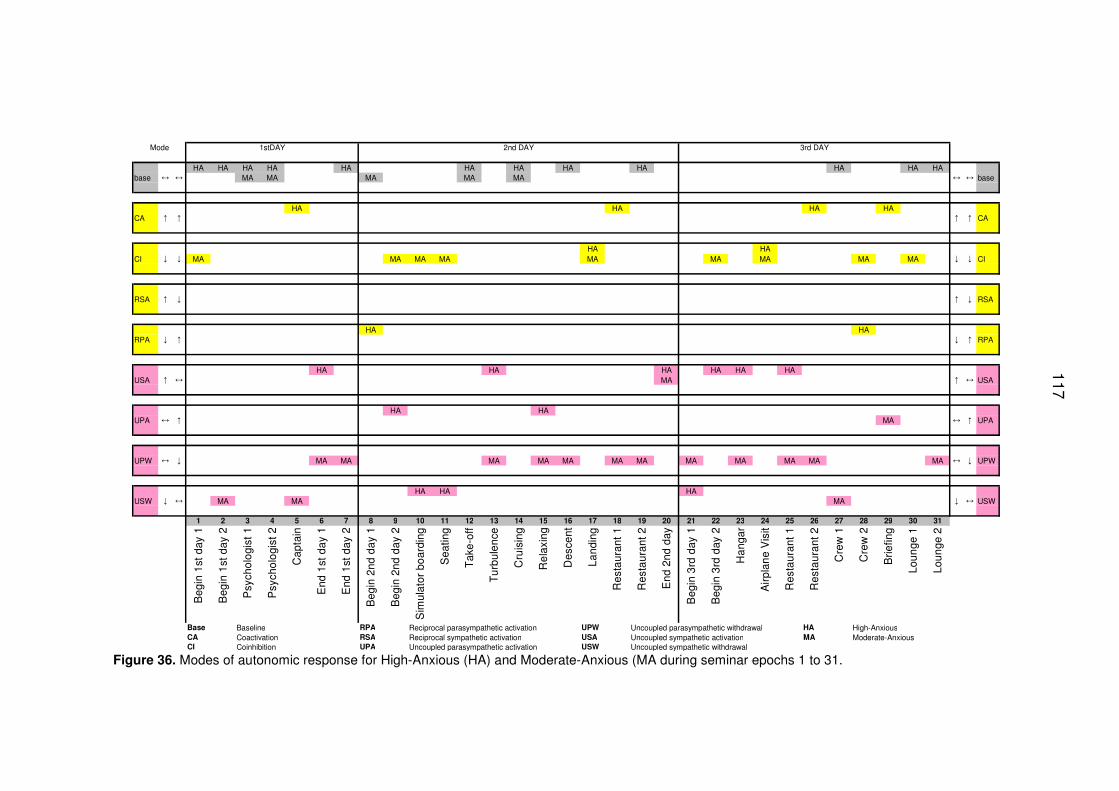
117
Mode 1stDAY 2nd DAY 3rd DAY
HA HA HA HA HA HA HA HA HA HA HA HAbase MA MA MA MA MA base
HA HA HA HACA CA
HA HACI MA MA MA MA MA MA MA MA MA CI
RSA RSA
HA HARPA RPA
HA HA HA HA HA HAUSA MA USA
HA HAUPA MA UPA
UPW MA MA MA MA MA MA MA MA MA MA MA MA UPW
HA HA HAUSW MA MA MA USW
1 2 3 4 5 6 7 8 9 10 11 12 13 14 15 16 17 18 19 20 21 22 23 24 25 26 27 28 29 30 31
Beg
in 1
st d
ay 1
Beg
in 1
st d
ay 2
Psy
chol
ogi
st 1
Psy
chol
ogi
st 2
Cap
tain
End
1st
da
y 1
End
1st
da
y 2
Beg
in 2
nd d
ay
1
Beg
in 2
nd d
ay
2
Sim
ulat
or b
oar
ding
Sea
ting
Tak
e-o
ff
Tu
rbul
enc
e
Cru
isin
g
Re
laxi
ng
Des
cent
Land
ing
Res
taur
ant
1
Res
taur
ant
2
End
2nd
day
Beg
in 3
rd d
ay 1
Beg
in 3
rd d
ay 2
Ha
ngar
Air
plan
e V
isit
Res
taur
ant
1
Res
taur
ant
2
Cre
w 1
Cre
w 2
Brie
fing
Loun
ge 1
Loun
ge 2
Base Baseline RPA Reciprocal parasympathetic activation UPW Uncoupled parasympathetic withdrawal HA High-AnxiousCA Coactivation RSA Reciprocal sympathetic activation USA Uncoupled sympathetic activation MA Moderate-AnxiousCI Coinhibition UPA Uncoupled parasympathetic activation USW Uncoupled sympathetic withdrawal
↓
↔
↑
↓
↓
↑
↔
↑
↓
↔
↓
↑
↔
↔
↔
↑
↓
↑
↑
↔
↓
↔ ↔
↑ ↑
↓
↓
↓
↑
↔
↑
↔
↓
↔
↑
↓
Figure 36. Modes of autonomic response for High-Anxious (HA) and Moderate-Anxious (MA during seminar epochs 1 to 31.
117
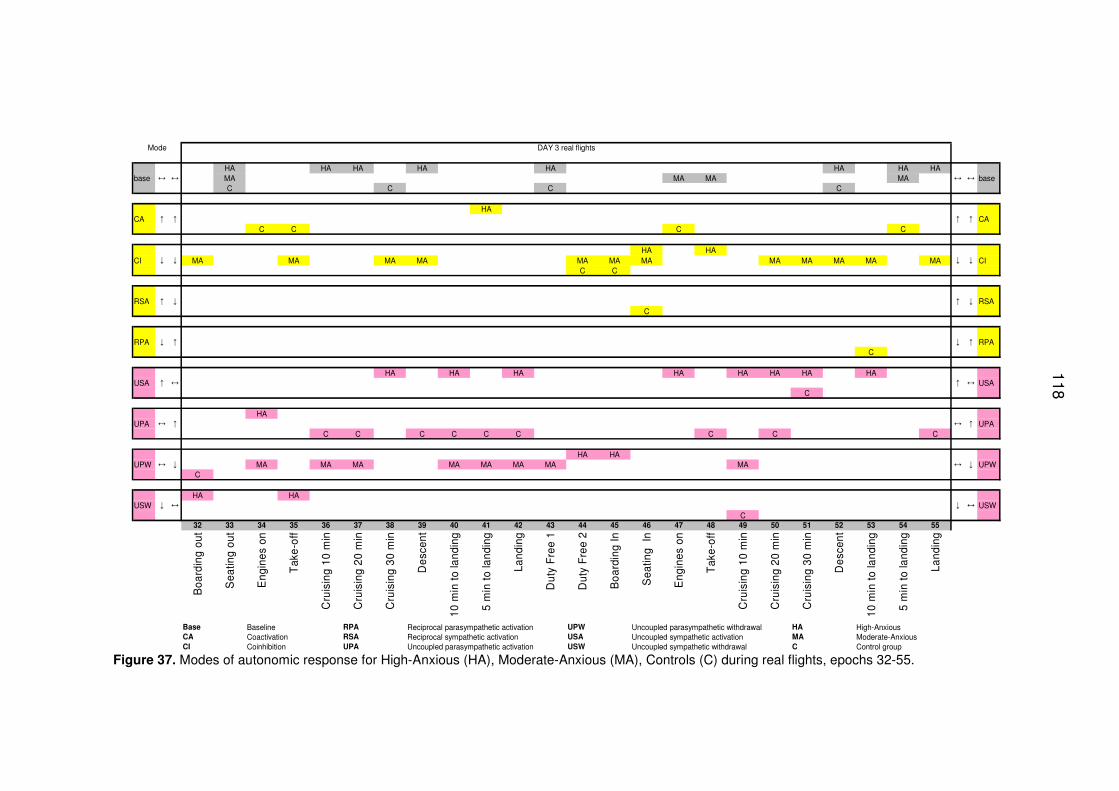
118
Mode DAY 3 real flights
HA HA HA HA HA HA HA HAbase MA MA MA MA base
C C C C
HACA CA
C C C C
HA HACI MA MA MA MA MA MA MA MA MA MA MA MA CI
C C
RSA RSAC
RPA RPAC
HA HA HA HA HA HA HA HAUSA USA
C
HAUPA UPA
C C C C C C C C C
HA HAUPW MA MA MA MA MA MA MA MA UPW
C
HA HAUSW USW
C32 33 34 35 36 37 38 39 40 41 42 43 44 45 46 47 48 49 50 51 52 53 54 55
Boa
rdin
g ou
t
Sea
ting
out
Eng
ines
on
Tak
e-of
f
Cru
isin
g 10
min
Cru
isin
g 20
min
Cru
isin
g 30
min
Des
cent
10 m
in t
o la
ndin
g
5 m
in t
o la
ndin
g
Land
ing
Dut
y F
ree
1
Dut
y F
ree
2
Boa
rdin
g In
Sea
ting
In
Eng
ines
on
Tak
e-of
f
Cru
isin
g 10
min
Cru
isin
g 20
min
Cru
isin
g 30
min
Des
cent
10 m
in t
o la
ndin
g
5 m
in t
o la
ndin
g
Land
ing
Base Baseline RPA Reciprocal parasympathetic activation UPW Uncoupled parasympathetic withdrawal HA High-AnxiousCA Coactivation RSA Reciprocal sympathetic activation USA Uncoupled sympathetic activation MA Moderate-AnxiousCI Coinhibition UPA Uncoupled parasympathetic activation USW Uncoupled sympathetic withdrawal C Control group
↓ ↔
↔ ↑
↔ ↓
↓ ↑
↑ ↔
↓
↓
↔ ↔
↑ ↑
↓ ↓
↑ ↓
↓
↑
↔
↔
↔
↑
↓
↑
↔
↑
↓
↑
↔
↑
↔
↓
Figure 37. Modes of autonomic response for High-Anxious (HA), Moderate-Anxious (MA), Controls (C) during real flights, epochs 32-55.
118
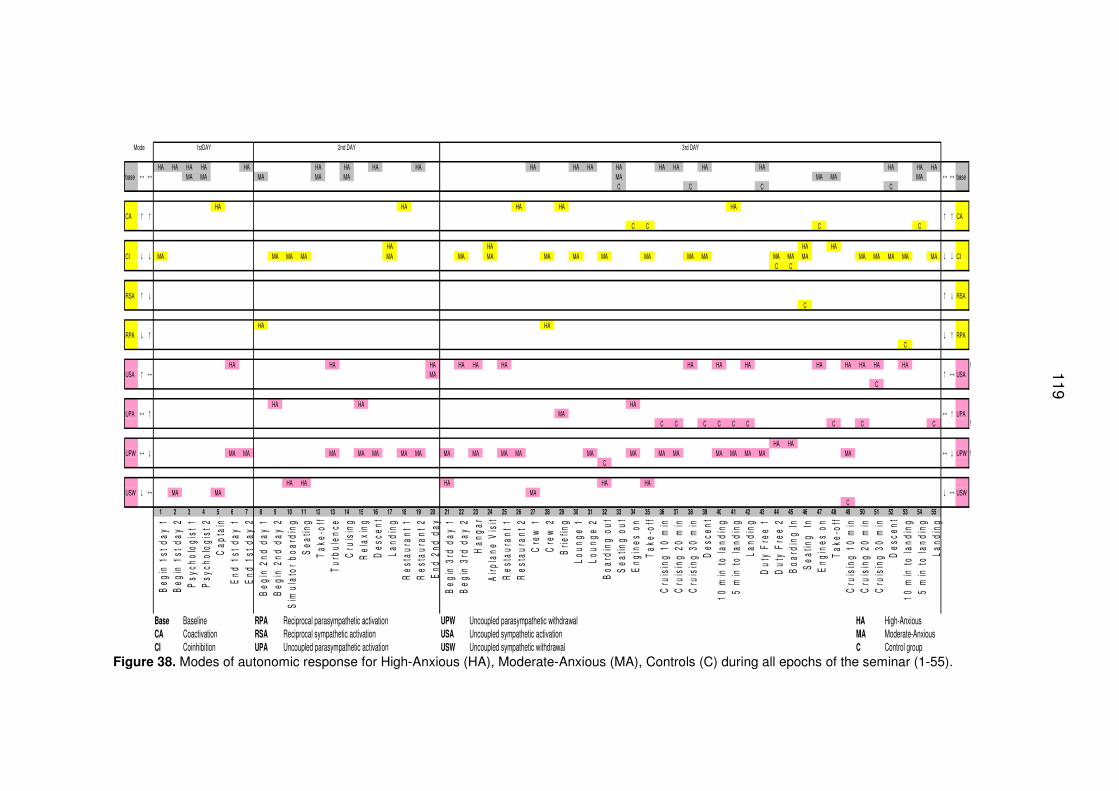
119
Mode 1stDAY 2nd DAY 3rd DAY
HA HA HA HA HA HA HA HA HA HA HA HA HA HA HA HA HA HA HA HAbase MA MA MA MA MA MA MA MA MA base
C C C C
HA HA HA HA HACA CA
C C C C
HA HA HA HACI MA MA MA MA MA MA MA MA MA MA MA MA MA MA MA MA MA MA MA MA MA CI
C C
RSA RSAC
HA HARPA RPA
C
HA HA HA HA HA HA HA HA HA HA HA HA HA HA !USA MA USA
C
HA HA HAUPA MA UPA
C C C C C C C C C !
HA HAUPW MA MA MA MA MA MA MA MA MA MA MA MA MA MA MA MA MA MA MA MA UPW !
C
HA HA HA HA HAUSW MA MA MA USW
C1 2 3 4 5 6 7 8 9 10 11 12 13 14 15 16 17 18 19 20 21 22 23 24 25 26 27 28 29 30 31 32 33 34 35 36 37 38 39 40 41 42 43 44 45 46 47 48 49 50 51 52 53 54 55
Beg
in 1
st d
ay 1
Beg
in 1
st d
ay 2
Psy
chol
ogis
t 1P
sych
olog
ist 2
Cap
tain
End
1st
day
1E
nd 1
st d
ay 2
Beg
in 2
nd d
ay 1
Beg
in 2
nd d
ay 2
Sim
ulat
or b
oard
ing
Sea
ting
Tak
e-of
fT
urbu
lenc
eC
ruis
ing
Rel
axin
gD
esce
ntLa
ndin
gR
esta
uran
t 1R
esta
uran
t 2E
nd 2
nd d
ayB
egin
3rd
day
1B
egin
3rd
day
2H
anga
r A
irpla
ne V
isit
Res
taur
ant 1
R
esta
uran
t 2C
rew
1C
rew
2B
riefin
gLo
unge
1Lo
unge
2
Boa
rdin
g ou
tS
eatin
g ou
tE
ngin
es o
n T
ake-
off
Cru
isin
g 10
min
Cru
isin
g 20
min
C
ruis
ing
30 m
inD
esce
nt
10 m
in to
land
ing
5 m
in to
land
ing
Land
ing
Dut
y F
ree
1D
uty
Fre
e 2
Boa
rdin
g In
S
eatin
g In
Eng
ines
on
Tak
e-of
fC
ruis
ing
10 m
in
Cru
isin
g 20
min
Cru
isin
g 30
min
Des
cent
10
min
to la
ndin
g5
min
to la
ndin
gLa
ndin
g
Base Baseline RPA Reciprocal parasympathetic activation UPW Uncoupled parasympathetic withdrawal HA High-AnxiousCA Coactivation RSA Reciprocal sympathetic activation USA Uncoupled sympathetic activation MA Moderate-AnxiousCI Coinhibition UPA Uncoupled parasympathetic activation USW Uncoupled sympathetic withdrawal C Control group
↓
↔
↑
↓
↓
↑
↔
↑
↓
↔
↓
↑
↔
↔
↔
↑
↓
↑
↑
↔
↓
↔ ↔
↑ ↑
↓
↓
↓
↑
↔
↑
↔
↓
↔
↑
↓
Figure 38. Modes of autonomic response for High-Anxious (HA), Moderate-Anxious (MA), Controls (C) during all epochs of the seminar (1-55).
119
120
4 Discussion
An overview of the relevant analyses arranged according to the different levels
of responses related to fear of flying, taking into consideration the behavioral,
physiological, and psychological systems as proposed by Lang (1971), is shown
in Figure 39.
4.1 Discussion of Hypothesis 1 – Response modes
4.1.1 Behavioral Response
The fear of flying seminar enabled all participants to overcome their avoidance
behavior and to successfully complete their “graduate flight”. The treatment
components included relaxation, stress management, coping, cognitive
techniques, information, and several different exposures, and were effective in
treating the fear of flying, as was shown by van Gerwen et al. (2004). That can
be attributed by the changed attitudes of the participants and by their changed
cognitions towards fear of flying. The newly learned coping mechanisms helped
to overcome the fear: cognitive modifications regarding the ability to control and
to evaluate the feared situations lead to toleration and acceptance of the
autonomic response. Exposure is the core component for the effective
treatment as has been suggested by Öst (1987), van Gerwen et al. (2002), and
Barlow (2000). The behavioral change was confirmed by the psychological
ratings comparing measurements taken before and after the seminar.
4.1.2 Physiological response
Figure 39 shows that the physiological parameters did not change during the
seminar in a common direction: no absolute decrease or absolute increase of
neither sympathetic (HR, LFnorm) nor parasympathetic activity (HFnorm,
pNN50) can be observed from the beginning to the end of recordings during the
fear of flying seminar. Changes in physiology depend much more on the
context, the situation, and whether the persons are High-Anxious or Moderate-
Anxious.
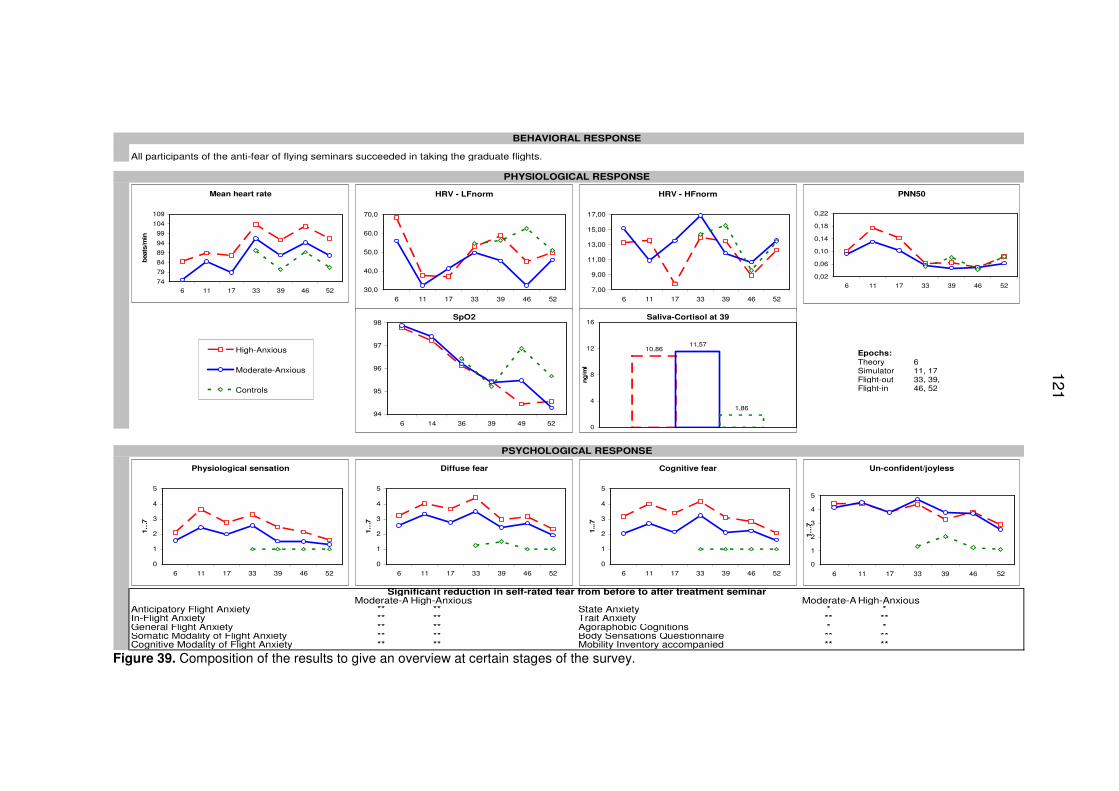
121
BEHAVIORAL RESPONSE
PHYSIOLOGICAL RESPONSE
Epochs:Theory 6Simulator 11, 17Flight-out 33, 39,Flight-in 46, 52
PSYCHOLOGICAL RESPONSE
Moderate-AnxiousHigh-Anxious Moderate-AnxiousHigh-AnxiousAnticipatory Flight Anxiety ** ** State Anxiety * *In-Flight Anxiety ** ** Trait Anxiety ** **General Flight Anxiety ** ** Agoraphobic Cognitions * *Somatic Modality of Flight Anxiety ** ** Body Sensations Questionnaire ** **Cognitive Modality of Flight Anxiety ** ** Mobility Inventory accompanied ** **
Significant reduction in self-rated fear from before to after treatment seminar
All participants of the anti-fear of flying seminars succeeded in taking the graduate flights.
Mean heart rate
74
79
84
89
94
99
104
109
6 11 17 33 39 46 52
beats
/min
HRV - HFnorm
7,00
9,00
11,00
13,00
15,00
17,00
6 11 17 33 39 46 52
HRV - LFnorm
30,0
40,0
50,0
60,0
70,0
6 11 17 33 39 46 52
PNN50
0,02
0,06
0,10
0,14
0,18
0,22
6 11 17 33 39 46 52
Physiological sensation
0
1
2
3
4
5
6 11 17 33 39 46 52
1…
7
Cognitive fear
0
1
2
3
4
5
6 11 17 33 39 46 52
1...7
Diffuse fear
0
1
2
3
4
5
6 11 17 33 39 46 52
1…
7
Un-confident/joyless
0
1
2
3
4
5
6 11 17 33 39 46 52
1…
7
SpO2
94
95
96
97
98
6 14 36 39 49 52
Saliva-Cortisol at 39
10,8611,57
1,86
0
4
8
12
16
ng/m
l
High-Anxious
Moderate-Anxious
Controls
Figure 39. Composition of the results to give an overview at certain stages of the survey.
121
122
4.1.3 Parameters indicating sympathetic activity
HR shows no absolute decrease during the seminar, the differences between
High-Anxious and Moderate-Anxious remained throughout the seminar.
Alterations of HR are evident (Figure 7) in different contexts and situations like
comparing real flights with other seminar situations during the three-day-
seminar.
For both High-Anxious and Moderate-Anxious the exposure in real flights
caused a much higher HR than a flight in the simulator. This is indicated by the
mean HR (confidence intervals), as can be seen in Table 10 (Annex 9.1)
despite the success of the ongoing treatment seminar. Given that HR increase
expresses fear, this finding suggests that the simulated flight does not evoke
the same level of fear as real flights in physiology. The reactivity of simulated
flights seem to show a comparable reactivity as virtual flights, also virtual flights
did not evoke as much fear as real flights according to Krinj et al. (2007). The
fact that real flights evoke higher emotional awareness has been discussed by
Bornas et al. (2006), Busscher et al. (2010), and Krinj et al. (2007). The high
response expressed in HR during real flights may underline the high emotional
awareness of anxiety, which is an important requirement for any efficient
treatment (Foa & Kozak, 1986).
The increased HR, especially during the real flights, may be related not only to
anxiety but also to the physical and environmental impacts of the situation like
low air pressure in the airplane, which are not the case in simulated flights.
Taking a control group into consideration during real flights brings additional
information, people with fear of flying, both Moderate-Anxious and High-
Anxious, show a higher HR than Controls, confirming the view that anxiety
provokes sympathetic activation expressed in higher HR (Nesse et al., 1985).
Sympathetic overactivity as proposed by Hoehn-Saric and McLeod (2000) and
Lovallo (2005) seems to be characteristic for fear of flying during highly feared
situations as e.g. take-off. In the out-going flights during seating, take-off, and
123
landing, and in the in-coming flights during take-off and landing differences in
the HR between all three groups were found, but no differences were observed
in pNN50, which is supposed to be an indicator of parasympathetic activity.
Differences in HR between subjects with fear of flying and control subjects did
not decrease over the time although desensitization and habituation occurred
after exposure in the flight-simulator and in the aircraft parked in the hangar.
That means that although exposure in real flights caused significant alterations
in HR, the intervention caused no adaptation to the level of Controls in High-
Anxious or Moderate-Anxious.
The HR during real flights corresponds to the findings of Ekeberg et al. (1990)
reporting an increased HR during two real flights of persons with flight phobia
compared to a baseline taken during pre-flight. However, in that study only one
measurement was taken in-flight and subjects took part in a pharmaceutical
study, probably interfering the findings, The mean HR of those subjects is
M=83±2.6 during flight, compared to the measurements of this study with a
mean HR during take-off in the out-going flight of M=111±15 in High-Anxious
and M=96±15 in Moderate-Anxious and on the in-coming flight of M=104±16 in
High-Anxious and M=90±15 in Moderate-Anxious. In the present study take-off
evoked the highest HR reaction, while during the ongoing flight situations HR
decreases in both flights (Figures 7 and 24). The highest values showed High-
Anxious during boarding (M=115 bpm) and during take-off (M=111 bpm).
The findings of Beckham et al. (1990) showed that HR of subjects with flight
phobia during exposure in a real flight does not differ between treated and
untreated persons, as is also shown in the studies of Howard et al. (1983).
Those two studies demonstrated the effectiveness of treatment intervention only
in anxiety ratings but not in HR. That corresponds to the findings in the present
study, indicating that treatment does not have an immediate and significant
influence on the HR but on anxiety ratings. In contrast to that, treatment with
virtual reality (Wiederhold et al., 2002) indicates HR reduction within a virtual
treatment flight.
124
The response of LFnorm indicating sympathetic influence (Malliani et al., 1994;
Malliani et al., 1991) shows differences between High-Anxious and Moderate-
Anxious during specific situations and confirms the influence of anxiety on the
sympathetic nervous system. Looking at the first three epochs on the beginning
of the recordings of the seminar-days (the first minutes of a seminar-day), only
recordings of the first day and third day showed differences between High-
Anxious and Moderate-Anxious, thus probably indicating additional anticipatory
anxiety and alertness for High-Anxious. Just like the values of mean HR, the
simulator does not evoke a sympathetic activation for High-Anxious in LFnorm
at the same level as the real flights. Differences in LFnorm between High-
Anxious and Moderate-Anxious are evident in the hangar on the third day when
visiting an airplane. Remarkable is that Moderate-Anxious showed lower
LFnorm than High-Anxious and Controls on the out-going flight during cruising
and on the in-coming flight during cruising (Figure 11 and 28). This might be an
indication for the better adaptiveness of Moderate-Anxious within the real flight
situation. However, the response of LFnorm of Controls does not confirm the
relation between augmented LFnorm and the influence of anxiety because
LFnorm of High-Anxious does not differ from Controls except during one or two
situations as take-off, cruising. The response pattern of Controls suggests that
LFnorm depends on emotion, on physical stressors and physical activation.
Above finding emphasizes the importance of including Controls in studies of
fear of flying with real flights in order to avoid false interpretations.
Differences between High-Anxious and Moderate-Anxious are also evident in
the LF/HF balance score during specific situations. The response of log LF/HF
reflects the dominant sympathetic activation of High-Anxious on the first day
during 4 of the 6 situations, during landing in the simulator on the second day,
and during the out-going flight after cruising for 30 minutes, and during the in-
coming flight during cruising and before landing, on the third day. At the
beginning of the second day log LF/HF of High-Anxious was significantly lower
than at the beginning of the first day, indicating that the experience of the first
day resulted in anxiety reduction for the High-Anxious.
125
However, boarding the first real flight involves for Controls a higher LFnorm and
a higher log LF/HF ratio (see Figure 30), Controls may have interpreted the
onset of ECG recording as stress, in addition to the overall hassle on airports,
as reported by Bricker (2008). Also of interest is the fact that Controls show a
high LF/HF ratio similar to High-Anxious when moving around, which suggests
confirmation of the study of Wilhelm et al. (2006). That study proposes that
physical activation may mask the emotion and that context information would be
necessary when interpreting physiological response. The present study,
however, can rely on clear comparisons of autonomic response related to
anxiety by having taken physiological measurements when all subjects had
been seated and had put on the seat belts, excluding any artifacts caused by
moving.
Taken together, HR is, in accordance to arousal models, a potential indicator for
fear of flying as postulated before (Abelson et al., 2001; Haug et al., 1987;
Kawachi et al., 1995; Nesse et al., 1995; Roth et al., 1986; Wilhelm & Roth,
1998). The sympathetic driven reactions are expressed by the HR pattern
during the overall seminar while the sympathetic driven reactions expressed by
LFnorm and log LF/HF balance score are evident only during critical situations.
The findings are in accordance to previous studies (Abelson et al., 2001;
Hoehn-Saric & McLeod, 2000; Nesse et al., 1985; Roth et al., 1986) but give
much more information on time course. The consideration of Controls shows
that sympathetic reaction is not only related to anxiety.
4.1.4 Parameters indicating parasympathetic activity
Parasympathetic activity indicated by pNN50, RMSSD and HFnorm reflects the
adaptability and sensitivity of the nervous system as proposed by Grossman
(1983) and by Saul (1990). Studies regarding anxiety response patterns
emphasize the dominant vagal role in anxiety (Albert et al., 2005; Ito et al.,
1999; Hoehn-Saric & McLeod, 2000; Piccirillo et al., 1997; Watkins et al., 1998).
The attenuated vagal influence is commonly interpreted as behavioral
126
inflexibility, poor attentional control, and ineffective emotional regulation
(Friedman & Thayer, 1998a).
Already on the first seminar-day, shortly after the beginning, Moderate-Anxious
show higher HFnorm than High-Anxious, combined with a decrease in HR. That
is an indication that Moderate-Anxious have more compensation skills from the
beginning of the seminar on (see Figures 7 and 12). It seems that Moderate-
Anxious benefit from the seminar and the repeated exposure, because their
HFnorm is higher than that of High-Anxious during take-off and before landing
on the flight-in. During these two situations HFnorm of Moderate-Anxious does
not differ from Controls.
HFnorm and pNN50 of High-Anxious and Moderate-Anxious do not differ during
the simulator, except during landing, when High-Anxious are probably more
afraid as indicated by reduced HFnorm. The increase of HFnorm during
relaxation indicates that High-Anxious are able to adapt quickly and confirms
the effective respiratory alteration during Jacobson progressive muscle
relaxation.
The expected vagal withdrawal expressed in HFnorm during the flight-out
during take-off and cruising, and during the flight-in during landing (Figure 29),
The vagal withdrawal expressed in pNN50 of High-Anxious and Moderate-
Anxious compared to Controls was evident during the flight-out during take-off
and during the flight-in during cruising after 10 minutes and before landing
(Figure 26). This is in accordance with Lovallo (2005) that vagal inhibition is
related to anxiety, or that vagal inhibition has an influence on the anxiety pattern
of people with fear of flying compared to control subjects. This is also in
conformity with anxiety models based on vagal tone as an indicator for
autonomic flexibility and adaptability (Friedman, 2007; Friedman & Thayer,
1998b; Kawachi et al., 1995; Klein et al., 1995; Thayer & Lane, 2000; Yeragani
et al., 1993; Yeragani et al., 1994).
All three groups showed comparable pNN50 values during the in-coming flight
after cruising for 20 minutes, an indication of what may be interpreted as coping
127
and adaptability of High-Anxious and Moderate-Anxious, whereas HR still
differed throughout the flight between the groups.
During walking around in the duty free area there is no difference between the
three groups neither expressed in pNN50 nor in HR.
The higher autonomic flexibility and adaptability of Controls compared to High-
Anxious and Moderate-Anxious is demonstrated by their complex cardiac
variability of HR. During boarding Controls are evidently stressed, as is shown
by diminished parasympathetic and increased sympathetic activity (LF/HF).
However, Controls adapt already during take-off by reaching higher vagal
controlled values in HRV (pNN50, HF) compared to High-Anxious and
Moderate-Anxious. Such an autonomic response of non-anxious subjects was
also described by Hoehn-Saric and McLeod (1988). Hoehn-Saric and McLeod
(2000) report that non-anxious individuals respond to stressors with a strong
initial response but show a relatively quick return to baseline levels expressing
adaptation when conditions seem to be under control. The results go conform
with the polyvagal theory (Porges, 2001) that considers the vagally mediated
HRV as an index showing how well a person is able to allocate
psychophysiological resources in order to meet environmental demands.
The reduced vagal activity as indication of anxiety was shown in High-Anxious
at the beginning of the first day (HFnorm), during the flight-out during take-off
(HFnorm, pNN50, RMSSD), cruising (HFnorm. pNN50), landing and during the
flight-in during take-off (HFnorm, pNN50), cruising (pNN50), and landing
(HFnorm, pNN50, RMSSD).
SDNN has a close relation to the total frequency power, see Figures 8, 25, and
Tables 11, 24, (Annex 9.2 and 9.15), herewith being an unspecific parameter.
An increase of SDNN was evident for High-Anxious and Moderate-Anxious
while boarding the simulator and while visiting the airplane in the hangar, in
contrast to boarding the real flights, when SDNN shows the lowest values. Up to
now SDNN has not yet been included in the studies regarding fear of flying but
128
in this case it might be associated with stress experienced by individuals with
flight anxiety when boarding real-flights.
4.1.5 Oxygen saturation and cortisol
The measurement of oxygen saturation (SpO2) shows no difference between
High-Anxious and Moderate-Anxious, differences are only visible in connection
with different epochs. When comparing SpO2 of the real flights with the SpO2 at
170 m sea level oxygen saturation levels are reduced during the real flights,
which has also been described by Gruen et al. (2008) and Roth et al. (2002) as
an normal adaptive response of passengers. The response of oxygen saturation
decreases equally in High-Anxious, Moderate-Anxious, and in Controls during
real flights, confirming a relationship to lowered air pressure with reduced
oxygen content in high altitudes. In addition to that, the present study shows
that after take-off on the second real flight individuals with fear of flying show
lower oxygen saturation values than Controls. This effect, which is even more
remarkable due to the small group size, gives a hint that there could be a
relation between anxiety and SpO2. Similarly, hyperventilation during panic may
cause the differences in SpO2 (Roth et al., 2002). The sensitivity for suffocation
signals may induce panic respiration, which in turn is related to decreased
oxygen saturation. A relation between anxiety sensitivity and reduced level
oxygen saturation was suggested by Bogaerde and De Raedt (2007). One
might suspect that anxiety sensitivity which is, according to Bogaerde and De
Raedt (2011), of relevance in people with fear regarding their somatic
sensations. It can be assumed that this makes a person more vulnerable to
adapt to high-altitudes. Not only adapting but also recovering might influence
SpO2 level, at least the results in the current study could be a hint that
individuals with fear of flying are not as good as control persons without fear in
adapting their oxygen saturation level to usual ground level of 97%, only
Controls seem to succeed in this.
The hypothesed augmented cortisol level during exposure in real flight can be
compared to the study of Bandelow et al. (2000), i.e. there is an increase of
129
cortisol level in persons with acute panic disorder during a naturally evoked
panic attack. Bandelow et al. (2000) underlined the importance of a naturalistic
setting for the observed increase of cortisol level. For the flight phobics in the
current study the exposure to the flight is a naturalistic setting related to their
phobia and the exposure to a real flight might either provoke panic or contribute
to the increase of cortisol. In accordance with Kirschbaum et al. (1994) an
increase of experienced stress during the flight may cause the increase of
cortisol level. Flight phobics experience more stress during the real flight that
could be a reason why High-Anxious and Moderate-Anxious were characterized
by significant higher levels of cortisol in comparison to the Control group.
4.1.6 Psychological response before, during, and after the seminar
Fear of flying is often assessed by considering psychological responses only
(e.g. Tortella-Feliu & Rivas., 2001; van Gerwen et al., 2004). Up to now studies
mainly compared measurements taken either before or after a real-flight, or
considered only one measurement during flight. The present study depicts the
time course of the psychological changes during the treatment at 14 situations
including real-flights.
At the beginning of the seminar High-Anxious and Moderate-Anxious show
differences in their source of anxiety. High-Anxious are characterized by higher
anticipatory anxiety (FAS) and cognitive anxiety (FAM) as shown in Table 5.
However, the differences disappear after completion of the seminar (Figures 19
and 20). Items related to in-flight anxiety (FAS) and items related to physical
symptoms somatic modality (FAM) do not differ between High-Anxious and
Moderate-Anxious. Anticipatory flight anxiety, in-flight anxiety and generalized
flight anxiety (FAS) decreased significantly in High-Anxious and Moderate-
Anxious (Figure 19). The ratings of somatic troubles (modality) as well as the
ratings of fearful cognitions (cognitive) of the Flight Anxiety Modality (FAM)
questionnaire (van Gerwen et al., 1999) are also significantly reduced in High-
Anxious and Moderate-Anxious, as shown in Figure 20.
130
The scores of the Body Sensations Questionnaire (BSQ) and of the
Agoraphobic Cognitions Questionnaire (ACQ) were significantly reduced in
High-Anxious and Moderate-Anxious when pre to post ratings were compared
(Figure 22). The self-rated mobility with or without a companion increases in
High-Anxious and Moderate-Anxious from pre to post seminar, which can be
seen in Figure 23.
State-anxiety and trait-anxiety (STAI) decreased in High-Anxious as well as in
Moderate-Anxious from pre to post seminar (Figure 21).
Ratings of mood and anxiety showed that High-Anxious were characterized by
more cognitive fear than Moderate-Anxious during the simulator session and
during both real flights. During the simulator session the cognitive fear of High-
Anxious was at nearly the same level as during the first flight, whereas in
Moderate-Anxious the cognitive fear was lower during the simulator session.
During the second flight cognitive fear attenuated in both anxiety groups
(Moderate-Anxious and High-Anxious). Controls rated anxiety only during flights
and showed no cognitive fear.
People with fear of flying consider themselves more confident and joyful the
longer the seminar went on, but still less confident and joyful than Controls. The
ratings on confidence and joy increased during the second flight only, and that
was comparable in Moderate-Anxious and High-Anxious.
The displeasing physiological sensations decreased with the duration of the
seminar, but did not reach the low level of Controls. During the second flight
Moderate-Anxious and High-Anxious also reduced their diffuse fear.
Summarizing the ratings of anxiety and mood, a significant drop in anxiety can
be observed, subjective ratings of fear (physiological sensation, diffuse fear,
cognitive fear) were reduced, and confidence (unconfidence/joyless) has
increased. The results confirm the hypothesis that subjective ratings mirror the
efficiency of the treatment seminar. Cognitions and valence of fear of flying
have been modified.
131
4.1.7 Integration of multiple response
The psychological ratings regarding fearful cognitions, diffuse fear, physiological
sensation related to anxiety, and confidence mirror the improvement in
association with the seminar very clearly. But there is no conclusion which
parameter of HRV goes conform to subjective ratings. The time course of
subjective ratings regarding fearful cognitions is comparable with the
differences in HR between High-Anxious, Moderate-Anxious, and Controls.
High-Anxious are characterized by higher HR and higher self reported anxiety
cognitions. However, it is remarkable that the cognition change, thus showing a
benefit from the seminar, is not evident in cardiac response patterns.
The real flights obviously showed higher autonomic response than the
simulated flight (HR, LFnorm, pNN50) although the simulated flight was the first
exposure to the feared situation during the three-day seminar. This is in
opposition to the subjective ratings expressed by physiological sensation. The
ratings on the scale physiological sensation differed between High-Anxious and
Moderate-Anxious during the simulator most and also during the real flights,
when High-Anxious describe more physiological sensations related to anxiety
(Figure 15).
Diffuse fear was higher in High-Anxious at the beginning of the seminar and
during the first real flight than in Moderate-Anxious (Figure 16). The increase of
joy and confidence at the completion of the seminar may also influence the
autonomic response pattern and deliver an explanation for the increased
LFnorm in High-Anxious (Figure 28) during the second flight, especially during
landing. The discordance between subjective ratings and the autonomic
responding pattern was also described by Bornas et al. (2006), Nesse et al.
(1985), Wilhelm and Roth (2001), and Busscher et al. (2010). Wilhelm and Roth
(2001) reported only little concordance between HR and self-reported measure
of heart pounding, they suggested that fear of flying subsumes a variety of
anxiety disorders, that the measuring might have been not adequate, and that
self-rated feelings might be memory biased.
132
The results of this study are conform with the study of Wilhelm and Roth (1998)
regarding the HR responses of subjects with fear of flying and of control
subjects without fear of flying. HR increases in fearful subjects during the real
flights and remains high from pre to post flight, in contrast to self-reported
anxiety. However, the results of this study differ in regard to vagal activation. In
Wilhelm and Roth’s (1998) study the vagal activation (RSA) diminishes during
anxiety situations within individuals with fear of flying compared to control
subjects. In the present study, diminished vagus as proposed by Friedman and
Thayer (1998a), Kawachi et al. (1995), Piccirillo et al. (1997), Prigatano and
Johnson (1974), and Thayer and Lane (2000) shows only in few critical
situations, namely take-off, cruising of the first flight and landing of the second
flight. During these situations the parasympathetic activity (pNN50, HFnorm),
was reduced in both anxious groups differing from control group.
4.2 Discussion of Hypothesis 2 - Autonomic Space
HR is a leading index in anxiety research (Nesse et al., 1985; Kawachi et al.,
1995). Berntson et al. (1991) emphasized with their model of autonomic space
that end-point measures like the HR are ambiguous in respect to the functional
state of the heart. Thus, according to their theory, the underlying modes of
autonomic response have to be considered for psycho-physiological
interpretations and the combinations of sympathetic and parasympathetic
activities have to be considered in a bivariate form. The usefulness of the model
of autonomic space has been proven in several laboratory studies with human
subjects (Berntson et al., 1993b, 1994, 1996).
The descriptive exploration of HRV, LFnorm, and HFnorm representing
sympathetic and parasympathetic modes of autonomic control in High-Anxious,
Moderate-Anxious, and Controls during the fear of flying seminar is considered
as an approach to the model of autonomic space. That exploration showed that
there is an association between groups and frequency of prevailing patterns of
cardiovascular activity, i.e. autonomic modes.
133
The main mode in High-Anxious was baseline indicating no remarkable change
neither in LFnorm nor in HFnorm during 20 of 55 epochs, followed by the mode
uncoupled sympathetic activity during 14 of 55 epochs as shown in Figure 38
and Table 8. Baseline occurred almost constantly on the first day, less
frequently on the second day, and frequently on the third day (Figure 37). The
noticeably frequent occurrence of baseline for High-Anxious on the third day
during real flights may be an indication that the anxiety pattern of High-Anxious
remains stable and is not influenced by the seminar compared to Moderate
Anxious. The frequent occurrence of the mode uncoupled sympathetic activity
during the real flights (cruising and landing) suggests that High-Anxious
undergo strong fear which is dominated by sympathetic influence.
The main mode in Moderate-Anxious was coinhibition during 21 of 55 epochs,
in particular during the return-flight (see Figures 37 and 38). This might be an
indication that Moderate-Anxious manage the fear and are able to adapt to the
feared situation during the return-flight. Moderate-Anxious also fulfilled the
mode uncoupled parasympathetic withdrawal during 20 epochs, mainly during
the flight-out. That mode emphasizes the close relation between anxiety and
diminished vagal influence as described by Friedman (2007), Friedman and
Thayer (1998b), Kawachi et al., (1995), Klein et al., (1995), Thayer and Lane,
(2000), and Yeragani et al. (1993), and supports the polyvagal theory of Porges
(2001).
The main mode in Controls was uncoupled parasympathetic activation in 9 of
23 epochs, whereas this mode applied only during three epochs for High-
Anxious and during one epoch for Moderate-Anxious. This might confirm the
importance of vagal influence on the autonomic control, high vagal capacity
being related to cardiac autonomic regulatory capacity as a sign of positive
health benefit (Berntson et. al, 2008a; Malliani et al., 1991; Stein & Kleiger,
1999) in opposition to a higher vulnerability of individuals paired with reduced
vagal control (Horsten et al., 1999).
The reciprocal modes seem to have no influence in relation to anxiety or in
Controls. That fact seems to be relevant since it underlines the principles of the

134
model of Berntson et al. (1991) that multiple modes have more influence than
reciprocal modes. The functional antagonism of sympathetic and
parasympathetic activity is replaced by joined activity, emphasizing the fact that
the reciprocal concept of autonomic balance is not sufficient to explain psycho-
physiological processes.
The exploration of the autonomic modes after Berntson et al. (1991)
emphasizes the different autonomic response patterns of High-Anxious,
Moderate-Anxious, and Controls, which is not that clearly shown when only
considering the output measurements HR or HRV. Though the usefulness of
HR as indicator for fear is confirmed, the underlying activation puts additional
light on the sympathetic and parasympathetic influence.
5 Conclusion
This study is a multi-system approach to the problem of fear of flying and was
conducted in a natural environment. In reference to the literature that cognition,
behavior, and physiology are relevant for the efficient treatment of anxiety
(Wilhelm & Roth, 1998), the results in this study support the efficiency of the
fear of flying seminar held by Austrian Airlines, since all three levels have
improved. The seminar helps effectively to overcome the fear of flying since all
participants took the graduate flight.
There is only very little research with ambulatory studies and in the past the
analysis of HRV in connection with fear of flying was rare. Most of the studies
included mainly HR as an indicator for physiological response (see chapter
1.5.2), which does not allow the systematic differentiation between sympathetic
and parasympathetic activation as HRV analyses allow.
The analyses in this study of HRV support both the sympathetic reactivity
theories and the vagal influence for fear of flying. The increase in sympathetic
activation (HR, LFnorm) as well as the inhibition or withdrawal of vagal
activation could be confirmed during some critical situations. Increase of HR
and LFnorm during critical situations especially in High-Anxious underline the
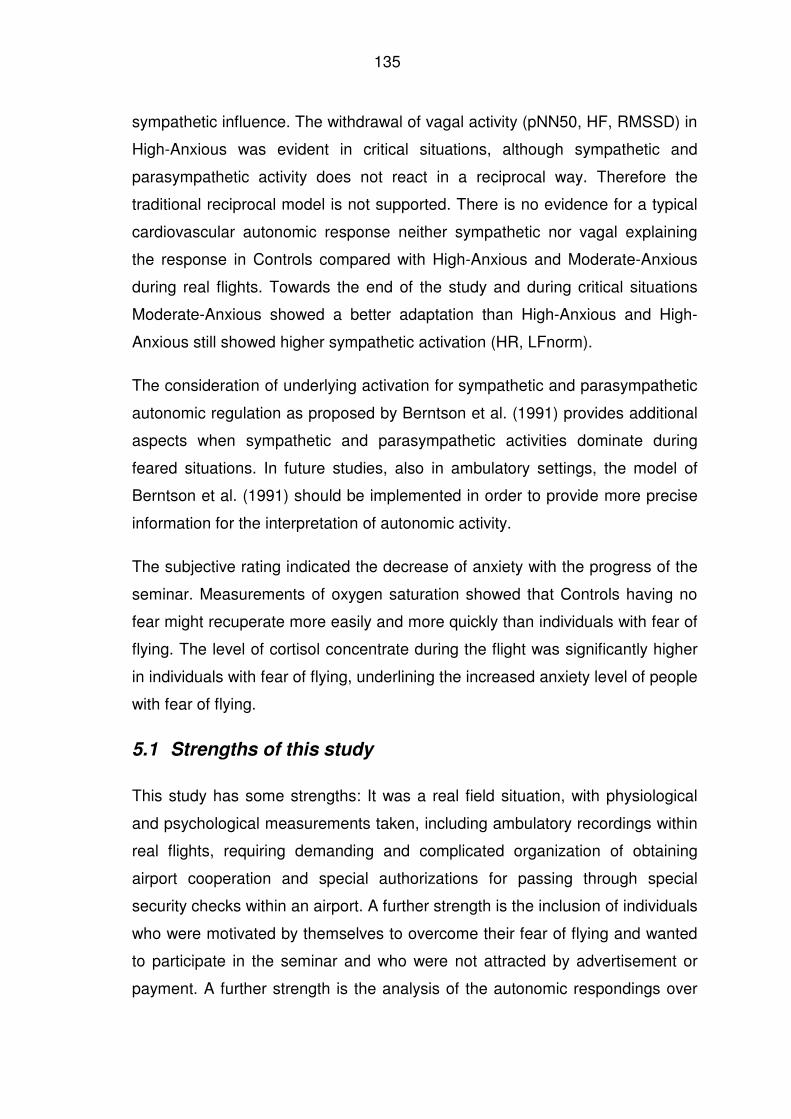
135
sympathetic influence. The withdrawal of vagal activity (pNN50, HF, RMSSD) in
High-Anxious was evident in critical situations, although sympathetic and
parasympathetic activity does not react in a reciprocal way. Therefore the
traditional reciprocal model is not supported. There is no evidence for a typical
cardiovascular autonomic response neither sympathetic nor vagal explaining
the response in Controls compared with High-Anxious and Moderate-Anxious
during real flights. Towards the end of the study and during critical situations
Moderate-Anxious showed a better adaptation than High-Anxious and High-
Anxious still showed higher sympathetic activation (HR, LFnorm).
The consideration of underlying activation for sympathetic and parasympathetic
autonomic regulation as proposed by Berntson et al. (1991) provides additional
aspects when sympathetic and parasympathetic activities dominate during
feared situations. In future studies, also in ambulatory settings, the model of
Berntson et al. (1991) should be implemented in order to provide more precise
information for the interpretation of autonomic activity.
The subjective rating indicated the decrease of anxiety with the progress of the
seminar. Measurements of oxygen saturation showed that Controls having no
fear might recuperate more easily and more quickly than individuals with fear of
flying. The level of cortisol concentrate during the flight was significantly higher
in individuals with fear of flying, underlining the increased anxiety level of people
with fear of flying.
5.1 Strengths of this study
This study has some strengths: It was a real field situation, with physiological
and psychological measurements taken, including ambulatory recordings within
real flights, requiring demanding and complicated organization of obtaining
airport cooperation and special authorizations for passing through special
security checks within an airport. A further strength is the inclusion of individuals
who were motivated by themselves to overcome their fear of flying and wanted
to participate in the seminar and who were not attracted by advertisement or
payment. A further strength is the analysis of the autonomic respondings over
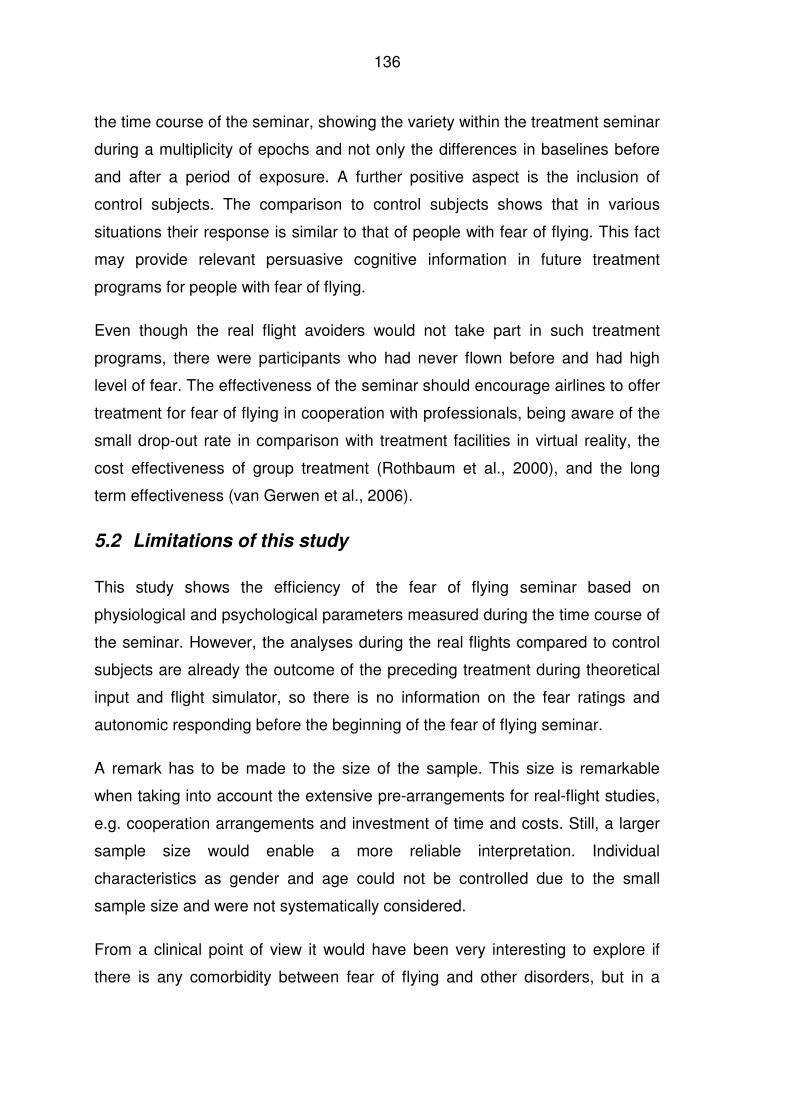
136
the time course of the seminar, showing the variety within the treatment seminar
during a multiplicity of epochs and not only the differences in baselines before
and after a period of exposure. A further positive aspect is the inclusion of
control subjects. The comparison to control subjects shows that in various
situations their response is similar to that of people with fear of flying. This fact
may provide relevant persuasive cognitive information in future treatment
programs for people with fear of flying.
Even though the real flight avoiders would not take part in such treatment
programs, there were participants who had never flown before and had high
level of fear. The effectiveness of the seminar should encourage airlines to offer
treatment for fear of flying in cooperation with professionals, being aware of the
small drop-out rate in comparison with treatment facilities in virtual reality, the
cost effectiveness of group treatment (Rothbaum et al., 2000), and the long
term effectiveness (van Gerwen et al., 2006).
5.2 Limitations of this study
This study shows the efficiency of the fear of flying seminar based on
physiological and psychological parameters measured during the time course of
the seminar. However, the analyses during the real flights compared to control
subjects are already the outcome of the preceding treatment during theoretical
input and flight simulator, so there is no information on the fear ratings and
autonomic responding before the beginning of the fear of flying seminar.
A remark has to be made to the size of the sample. This size is remarkable
when taking into account the extensive pre-arrangements for real-flight studies,
e.g. cooperation arrangements and investment of time and costs. Still, a larger
sample size would enable a more reliable interpretation. Individual
characteristics as gender and age could not be controlled due to the small
sample size and were not systematically considered.
From a clinical point of view it would have been very interesting to explore if
there is any comorbidity between fear of flying and other disorders, but in a
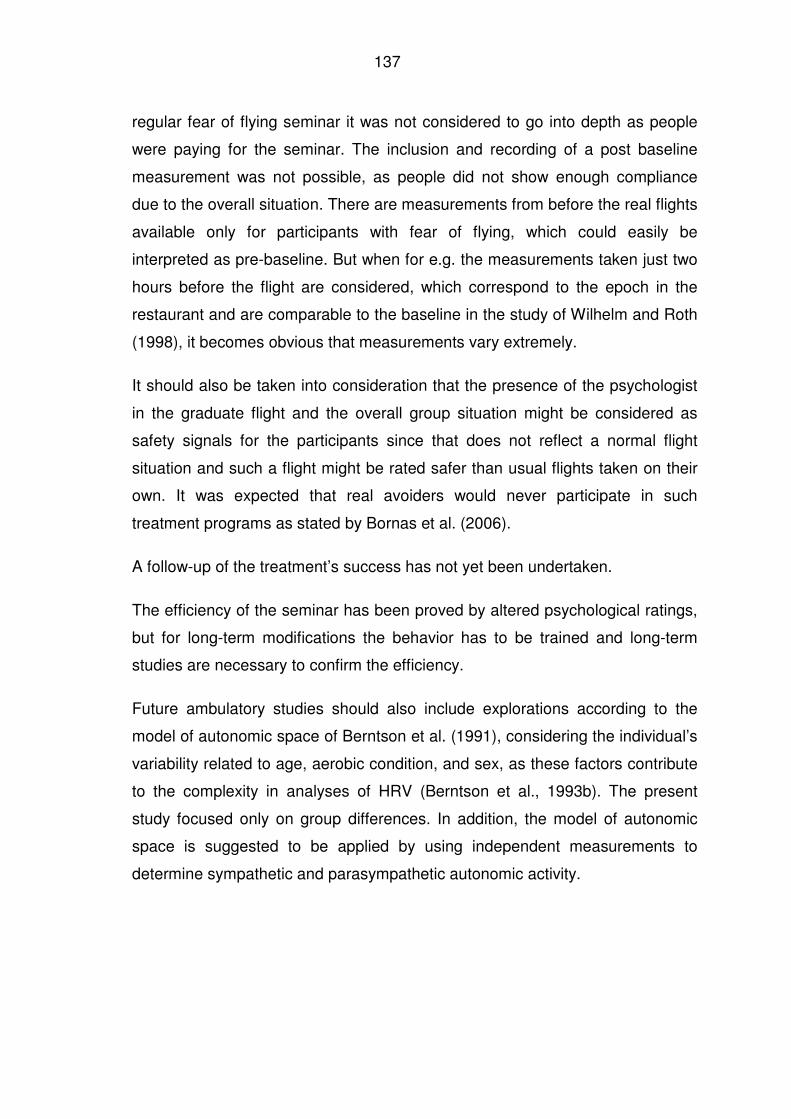
137
regular fear of flying seminar it was not considered to go into depth as people
were paying for the seminar. The inclusion and recording of a post baseline
measurement was not possible, as people did not show enough compliance
due to the overall situation. There are measurements from before the real flights
available only for participants with fear of flying, which could easily be
interpreted as pre-baseline. But when for e.g. the measurements taken just two
hours before the flight are considered, which correspond to the epoch in the
restaurant and are comparable to the baseline in the study of Wilhelm and Roth
(1998), it becomes obvious that measurements vary extremely.
It should also be taken into consideration that the presence of the psychologist
in the graduate flight and the overall group situation might be considered as
safety signals for the participants since that does not reflect a normal flight
situation and such a flight might be rated safer than usual flights taken on their
own. It was expected that real avoiders would never participate in such
treatment programs as stated by Bornas et al. (2006).
A follow-up of the treatment’s success has not yet been undertaken.
The efficiency of the seminar has been proved by altered psychological ratings,
but for long-term modifications the behavior has to be trained and long-term
studies are necessary to confirm the efficiency.
Future ambulatory studies should also include explorations according to the
model of autonomic space of Berntson et al. (1991), considering the individual’s
variability related to age, aerobic condition, and sex, as these factors contribute
to the complexity in analyses of HRV (Berntson et al., 1993b). The present
study focused only on group differences. In addition, the model of autonomic
space is suggested to be applied by using independent measurements to
determine sympathetic and parasympathetic autonomic activity.
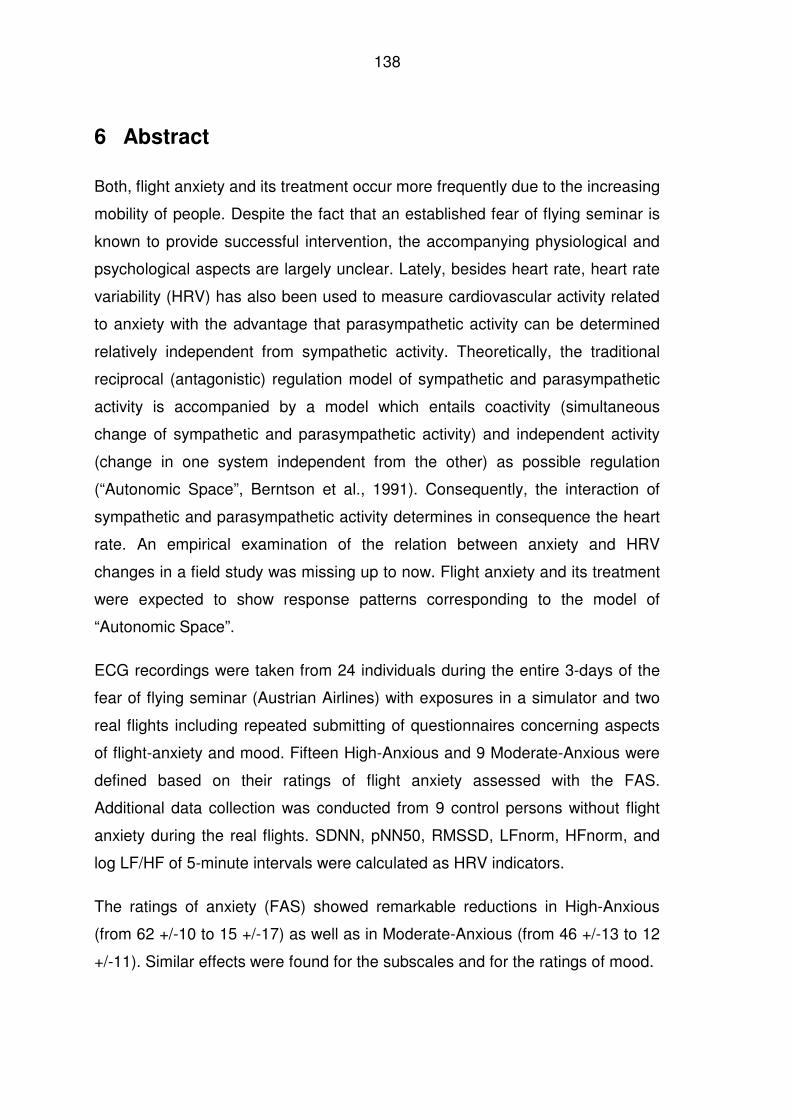
138
6 Abstract
Both, flight anxiety and its treatment occur more frequently due to the increasing
mobility of people. Despite the fact that an established fear of flying seminar is
known to provide successful intervention, the accompanying physiological and
psychological aspects are largely unclear. Lately, besides heart rate, heart rate
variability (HRV) has also been used to measure cardiovascular activity related
to anxiety with the advantage that parasympathetic activity can be determined
relatively independent from sympathetic activity. Theoretically, the traditional
reciprocal (antagonistic) regulation model of sympathetic and parasympathetic
activity is accompanied by a model which entails coactivity (simultaneous
change of sympathetic and parasympathetic activity) and independent activity
(change in one system independent from the other) as possible regulation
(“Autonomic Space”, Berntson et al., 1991). Consequently, the interaction of
sympathetic and parasympathetic activity determines in consequence the heart
rate. An empirical examination of the relation between anxiety and HRV
changes in a field study was missing up to now. Flight anxiety and its treatment
were expected to show response patterns corresponding to the model of
“Autonomic Space”.
ECG recordings were taken from 24 individuals during the entire 3-days of the
fear of flying seminar (Austrian Airlines) with exposures in a simulator and two
real flights including repeated submitting of questionnaires concerning aspects
of flight-anxiety and mood. Fifteen High-Anxious and 9 Moderate-Anxious were
defined based on their ratings of flight anxiety assessed with the FAS.
Additional data collection was conducted from 9 control persons without flight
anxiety during the real flights. SDNN, pNN50, RMSSD, LFnorm, HFnorm, and
log LF/HF of 5-minute intervals were calculated as HRV indicators.
The ratings of anxiety (FAS) showed remarkable reductions in High-Anxious
(from 62 +/-10 to 15 +/-17) as well as in Moderate-Anxious (from 46 +/-13 to 12
+/-11). Similar effects were found for the subscales and for the ratings of mood.
139
Physiological data showed that heart rate increased in all groups during the real
flights. However, significant differences between High-Anxious and Control
persons were found for most of the flight time and between all groups during
take-off. High-Anxious showed the highest values during boarding (M=115 bpm)
and during take-off (M=111 bpm). LFnorm showed higher values for High-
Anxious than for Moderate-Anxious, though the autonomic balance indicator
(log LF/HF) showed no significant differences between the groups. Vagal
activity (RMSSD, pNN50, HFnorm) showed no difference between groups.
In a further step the prevailing patterns of cardiovascular activity were analyzed
and compared to baseline values. The results showed that cardiovascular
activity during anxiety did not correspond to the traditional reciprocal model but
the results could be interpreted according to the autonomic space model. In
High-Anxious the patterns found were either not changed (“stable baseline”) or
sympathetic activation was accompanied by no parasympathetic activity
(uncoupled sympathetic activation). In Moderate-Anxious mainly two patterns
were found, a decrease of both parasympathetic and sympathetic activity
(coinhibiton) and a decrease of parasympathetic activity in combination with no
change in sympathetic activity (uncoupled parasympathetic withdrawal). Control
persons mainly showed parasympathetic activity combined with unchanged
sympathetic activity (uncoupled parasympathetic activation), whereas that
pattern that was found only once in anxious groups.
Summing up, it can be said that as all participants succeeded in taking 2 real
flights and showed a remarkable decrease of anxiety, the fear of flying seminar
provides an efficient intervention both on behavioral response as well as
towards subjective ratings. The accompanying cardiovascular activity shows,
depending on the degree of anxiety, different response patterns in sympathetic
and parasympathetic activity and therefore requires a more differentiated
consideration in order to be related to anxiety.
140
7 Zusammenfassung
Sowohl Flugangst als auch deren Behandlung tritt mit zunehmender Mobilität
der Menschen vermehrt auf. Obwohl ein etabliertes Flugangstseminar eine sehr
erfolgreiche Intervention darstellt, sind die begleitenden physiologischen und
zum Teil psychologischen Aspekte weithin unklar. Neben der Herzrate wird in
letzter Zeit auch die Herzratenvariabilität (HRV) zur Messung kardiovaskulärer
Aktivität in Zusammenhang mit Angst eingesetzt, weil sie den Vorzug bietet,
parasympathische Aktivität relativ unabhängig von der sympathischen erfassen
zu können. Theoretisch stehen sich das traditionelle „Gegenregulationsmodell“
von sympathischer und parasympathischer Aktivität und die Erweiterung des
Modells, wonach auch eine „Koaktivierung“ (simultane Veränderung von
Sympathikus- und Parasympathikusaktivität), aber auch eine unabhängige
Aktivierung (Veränderung in einem System bei unverändertem anderen)
möglich sei („Autonomic Space“; Berntson et al., 1991), gegenüber. Das
Zusammenspiel beider Aktivitäten bestimmt dann die Herzrate. Eine empirische
Prüfung des Zusammenhangs von Angst und der HRV Veränderungen im
Feldversuch stand bis jetzt aus. Am Modell von Flugangst und deren
Behandlung wurde erwartet, dass sich Reaktionsmuster entsprechend dem
„Autonomic Space“ beobachten lassen.
Im Rahmen von drei 3-tägigen Flugangstseminaren (angeboten von Austrian
Airlines) mit Simulatorexposition und zwei Realflügen wurde von 24 Personen
während des gesamten Seminars das EKG aufgezeichnet und es wurden
wiederholt Fragebögen zu Aspekten der Flugangst und dem Befinden
vorgegeben. Aufgrund der generalisierten Flugangst (FAS) wurden 15
Hochängstliche und 9 Moderatängstliche identifiziert. Bei den Realflügen
erfolgte zusätzlich eine Datenerhebung an 9 Kontrollpersonen ohne Flugangst.
Als Indikatoren der HRV wurden SDNN, pNN50, RMSSD, LFnorm, HFnorm und
log LF/HF von 5-Minutenintervallen berechnet.
Die Skalierungen der Angst (FAS) zeigten sowohl bei Hochängstlichen (von 62
+/-10 auf 15 +/-17) als auch bei Moderatängstlichen (von 46 +/-13 auf 12 +/-11)
141
eine deutliche Reduktion. Vergleichbare Effekte wurden auch in den Subskalen
und in den Skalierungen des Befindens gefunden.
Die physiologischen Daten zeigten, dass die Herzrate bei den Realflügen zwar
bei allen Gruppen anstieg, aber dennoch signifikante Unterschiede zwischen
Hochängstlichen und Kontrollpersonen über die meiste Zeit der Flüge und
zwischen allen Gruppen beim Take-off auftraten. Die höchsten Werte hatten
Hochängstliche während des Boardings (M = 115 bpm) und beim Take-Off (M =
111 bpm). Die LFnorm zeigte höhere Werte bei den Hochängstlichen als den
Moderatängstlichen, dennoch fand sich im Indikator der autonomen Balance
(log LF/HF) zwischen den Gruppen kein signifikanter Unterschied. Auch in der
vagalen Aktivität (RMSSD, pNN50, HFnorm) fanden sich keine
Gruppenunterschiede.
In einem weiteren Analyseschritt wurden die vorherrschenden Muster der
kardiovaskulären Aktivierungen während des Fluges mit Ausgangswerten
verglichen. Die Ergebnisse zeigen, dass die kardiovaskuläre Aktivität unter
Angst dem traditionellen Gegenregulationsmodell nicht entspricht, aber die
Ergebnisse nach dem „Autonomic Space“ Modell interpretierbar sind. Bei
Hochängstlichen findet sich vorwiegend entweder keine Veränderungen
(„stabil“) oder eine sympathische Aktivierung verbunden mit keiner
parasympathischen Veränderung (uncoupled sympathetic activation). Bei
Moderatängstlichen zeigten sich vorwiegend zwei Muster, eine Abnahme der
parasympathischen und der sympathischen Aktivierung (coinhibition) bzw. eine
Abnahme der parasympathischen Aktivierung und keine Veränderung in der
sympathischen Aktivierung (uncoupled parasympathetic withdrawal). Bei
Kontrollpersonen zeigte sich vorwiegend eine parasympathische Aktivierung
verbunden mit einer unveränderte sympathische Aktivierung (uncoupled
parasympathic activation), ein Muster, das bei Ängstlichen nur einmal auftrat.
Zusammenfassend lässt sich feststellen, dass das Flugangstseminar sowohl
auf Verhaltensebene (alle Teilnehmer absolvierten 2 Realflüge) als auch im
Empfinden (starke Reduktion der Angst) eine sehr wirksame Intervention
darstellt. Die begleitende kardiovaskuläre Aktivierung zeigt je nach

142
Angstausmaß unterschiedliche Reaktionsmuster in sympathischer und
parasympathischer Aktivität und bedarf somit einer differenzierteren
Betrachtung, um mit Angst in einen Zusammenhang gebracht werden zu
können.
143
8 Literature
Abelson, J. L., Weg, J. G., Nesse, R. M., & Curtis, G. C. (2001). Persistent
respiratory irregularity in patients with panic disorder. Biological
Psychiatry, 49(7), 588-595.
Acharya, R. U., Kannathal, N., Sing, O., Ping, L., & Chua, T. (2004). Heart rate
analysis in normal subjects of various age groups. BioMedical
Engineering OnLine, 3(1), 24.
Aerospace Medical Association (2003). Medical Guidelines for Airline Travel,
2nd Edition. Aviation, space and environmental medicine, 74,(5)IIS.
Retrieved December 16, 2010, from the aerospace medical association
website: http://www.asma.org/pdf/publications/medguid.pdf
Agras, S. Sylvester, D., & Oliveau, D. (1969). The epidemiology of common
fears and phobias. Comprehensive Psychiatry, 10(2), 151-156.
Akselrod, S., Gordon, D., Madwed, J.B., Snidman, N., Shannon, D., & Cohen,
R. (1985). Hemodynamic regulation: investigation by spectral analysis.
American Journal of Physiology, 249, H867-H875.
Albert, C. M., Chae, C. U., Rexrode, K. M., Manson, J. E., & Kawachi, I. (2005).
Phobic anxiety and risk of coronary heart disease and sudden cardiac
death among women. Circulation, 111(4), 480-487.
Alpers, G. W., Abelson, J. L., Wilhelm, F. H., & Roth, W. T. (2003). Salivary
cortisol response during exposure treatment in driving phobics.
Psychosomatic Medicine, 65(4), 679-687.
American Psychiatric Association. (1994). Diagnostic and Statistical Manual of
Mental Disorders (4th ed.). Washington, DC: American Psychiatric
Association.
Anderson, P., Jacobs, C. H., Lindner, G. K., Edwards, S., Zimand, E., Hodges,
L. F., & Rothbaum, B. O. (2006). Cognitive behavior therapy for fear of
flying: Sustainability of treatment gains after September 11. Behavior
Therapy, 37(1), 91-97.
144
Anderson, P., Jacobs, C., & Rothbaum, B. (2004). Computer-supported
cognitive behavioral treatment of anxiety disorders. Journal of Clinical
Psychology, 60(3), 253-267.
Appelhans, B. M., & Luecken, L. J. (2006). Heart rate variability as an index of
regulated emotional responding. Review of General Psychology, 10(3),
229-240.
Asmundson, G. J., & Stein, M. B. (1994). Vagal attenuation in panic disorder: an
assessment of parasympathetic nervous system function and subjective
reactivity to respiratory manipulations. Psychosomatic Medicine, 56(3),
187-193.
Bandelow, B., Wedekind, D., Pauls, J., Broocks, A., Hajak, G., & Rüther, E.
(2000). Salivary cortisol in panic attacks. American Journal of Psychiatry,
157(3), 454-456.
Bandelow, B. (2001). Panik und Agoraphobie. Diagnose, Ursachen,
Behandlung. Wien: Springer.
Bandura, A. (1977). Self-efficacy: Toward a unifying theory of behavioral
change. Psychological Review, 84(2), 191-215.
Barlow, D. H. (2000). Unraveling the mysteries of anxiety and its disorders from
the perspective of emotion theory. American Psychologist, 55(11), 1247-
1263.
Beckham, J. C., Vrana, S. R., May, J. G., Gustafson, D. J., & Smith, G. R.
(1990). Emotional processing and fear measurement synchrony as
indicators of treatment outcome in fear of flying. Journal of Behavior
Therapy and Experimental Psychiatry, 21(3), 153-162.
Berntson, G. G., Bigger, J. T. J., Eckberg, D. L., Grossman, P., Kaufmann, P.
G., Malik, M., Nagaraja, H., Porges, S., Saul, P., Stone, P., & van der
Molen, M. (1997). Heart rate variability: Origins, methods, and
interpretive caveats. Psychophysiology, 34(6), 623-648.
Berntson, G. G., Cacioppo, J. T., Binkley, P. F., Uchino, B. N., Quigley, K. S., &
Fieldstone, A. (1994). Autonomic cardiac control III. Psychological stress
and cardiac response in autonomic space as revealed by
pharmacological blockades. Psychophysiology, 31, 599-608.
145
Berntson, G. G., Cacioppo, J. T., & Fieldstone, A. (1996). Illusions, arithmetic,
and the bidirectional modulation of vagal control of the heart. Biological
Psychology, 44(1), 1-17.
Berntson, G. G., Cacioppo, J. T., & Grossman, P. (2007). Whither vagal tone.
Biological Psychology, 74, 295-300.
Berntson, G. G., Cacioppo, J. T., & Quigley, K. S. (1991). Autonomic
determinism: The modes of autonomic control, the doctrine of autonomic
space, and the laws of autonomic constraints. Psychological Review,
98(4), 459-487.
Berntson, G. G., Cacioppo, J. T., & Quigley, K. S. (1993a). Respiratory sinus
arrhythmia: autonomic origins, physiological mechanisms, and
psychophysiological implications. Psychophysiology, 30(2), 183-196.
Berntson, G. G., Cacioppo, J. T., & Quigley, K. S. (1993b). Cardiac
psychophysiology and autonomic space in humans: Empirical
perspectives and conceptual implications. Psychological Bulletin, 114(2),
296-322.
Berntson, G. G., Norman, G. J., Hawkley, L. C., & Cacioppo, J. T. (2008a).
Spirituality and autonomic cardiac control. Annals of Behavioral
Medicine, 35(2), 198-208.
Berntson, G. G., Norman, G. J., Hawkley, L. C., & Cacioppo, J. T. (2008b).
Cardiac autonomic balance versus cardiac regulatory capacity.
Psychophysiology, 45(4), 643-652.
Berntson, G. G., Sarter, M., & Cacioppo, J. T. (1998). Anxiety and
cardiovascular reactivity: the basal forebrain cholinergic link. Behavioural
Brain Research, 94(2), 225-248.
Berntson, G. G., Sarter, M., & Cacioppo, J. T. (2003). Ascending visceral
regulation of cortical affective information processing. European Journal
of Neuroscience, 18(8), 2103-2109.
Birbaumer, N. (1973). Neurospsychologie der Angst, Fortschritte der Klinischen
Psychologie. München: Urban & Schwarzenberg.
Blechert, J., Lajtman, M., Michael, T., Margraf, J., & Wilhelm, F. (2006).
Identifying anxiety states using broad sampling and advanced processing
146
of peripheral physiological information. Biomedical Sciences
Instrumentation, 42, 136-141.
Bogaerde, A. V., & De Raedt, R. (2007). Cognitive vulnerability in fear of flying:
the role of anxiety sensitivity. Depression and Anxiety, 23(9), 768-773.
Bogaerde. A. V., & De Raedt, R. (2011). The moderational role of anxiety
sensitivity in flight phobia. Journal of Anxiety Disorders, 25(3), 422-426.
Bor, R. & van Gerwen, L. (2003). Psychological Perspectives on Fear of Flying.
Hampshire: Ashgate.
Bornas, X., Llabres, J., Noguera, M., Lopez, A. M., Gelabert, J. M., & Vila, I.
(2006). Fear induced complexity loss in the electrocardiogram of flight
phobics: a multiscale entropy analysis. Biological Psychology, 73(3),
272-279.
Botella, C., Osma, J., Garcia-Palacios, A., Quero, R., & Baños, R. (2004).
Treatment of flying phobia using virtual reality: data from a 1-year follow-
up using a multiple baseline design. Clinical Psychology &
Psychotherapy, 11(5), 311-323.
Bricker, J. B. (2005). Development and evaluation of the air travel stress scale.
Journal of Counseling Psychology, 52(4), 615-628.
Bricker, J. B. (2008). Who has air travel stress? Demographic differences in air
travel stress. International Journal of Applied Aviation Studies, 8(1), 20-
35. Retrieved April 02, 2010, from http://www.faa.gov/about/office_org/
headquarters_offices/arc/programs/academy/journal/pdf/
Summer_2008.pdf
Busscher, B., van Gerwen, L., Spinhoven, P., & Geus, E. (2010). Physiological
reactivity to phobic stimuli in people with fear of flying. Journal of
Psychosomatic Research, 69(3), 309-317.
Cacioppo, J. T., & Berntson, G. G. (1992). Social psychological contributions to
the decade of the brain: Doctrine of multilevel analysis. American
Psychologist, 47, 1019-1028.
Cannon, W. B. (1929). Bodily changes in pain, hunger, fear and rage. New
York: D. Appleton & Co.
Cannon, W. B. (1939). The wisdom of the body. New York: Norton.
147
Capafons, J. I., Sosa, C. D., & Vina, C. M. (1999). A reattributional training
program as a therapeutic strategy for fear of flying. Journal of Behavior
Therapy and Experimental Psychiatry, 30(4), 259-272.
Chambless, D. L., Caputo, G. C., Bright, P., & Gallagher, R. (1984).
Assessment of fear in agoraphobics: The body sensations questionnaire
and the agoraphobic cognitions questionnaire. Journal of Consulting &
Clinical Psychology, 52(6), 1090-1097.
Clark, D. M. (1999). Anxiety disorders: why they persist and how to treat them.
Behaviour Research and Therapy, 37(Supplement 1), S5-S27.
Cleiren, M., van Gerwen, L. J., Diekstra, R. F. W., van Dyck, R., Spinhoven, P.,
& Brinkhuysen, P. (Eds.). (1994). No more fear of flying: An evaluation of
the VALK therapy program. Leiden University.
Cook, E., Melamed, B., Cuthbert, B., McNeil, D., & Lang, P. (1988). Emotional
imagery and the differential diagnosis of anxiety. Journal of Consulting
and Clinical Psychology, 56, 734-740.
Curtis, G. C., Magee, W. J., Eaton, W. W., Wittchen, H. U., & Kessler, R. C.
(1998). Specific fears and phobias. Epidemiology and classification. The
British Journal of Psychiatry, 173(3), 212-217.
Dean, R., & Whitaker, K. (1982). Fear of flying: Impact on the U.S. air travel
industry. Journal of Travel Research, 21, 7-17.
Da Costa, R. T., Sardinha, A., & Nardi, A. E. (2008). Virtual reality exposure in
the treatment of fear of flying. Aviation, Space & Environmental Medicine,
79(9), 899-903.
Depla, M., ten Have, M., van Balkom, A., & de Graaf, R. (2008). Specific fears
and phobias in the general population: Results from the Netherlands
Mental Health Survey and Incidence Study (NEMESIS). Social
Psychiatry and Psychiatric Epidemiology, 43(3), 200-208.
Domschke, K., Stevens, S., Pfleiderer, B., & Gerlach, A. L. (2010). Interoceptive
sensitivity in anxiety and anxiety disorders: An overview and integration
of neurobiological findings. Clinical Psychology Review, 30(1), 1-11.
Eckberg, D. L. (1997). Sympathovagal balance: A critical appraisal. Circulation,
96(9), 3224-3232.
148
Ehlers, A., Margraf, J., & Chambless, D. (1993). Fragebogen zu
körperbezogenen Ängsten, Kognitionen und Vermeidung (AKV).
Unpublished manuscript, Weinheim.
Ehlers., A., Margraf, J., Davies, S., & Roth, W. (1988). Selective processing of
threat cues in subjects with panic attacks. Cognition and Emotion, 2,
201-219.
Ekeberg, O., Seeberg, I., & Ellertsen, B. (1989). The prevalence of flight anxiety
in Norway. Norsk Psykiatrisk Tidsskrist, 43, 443-448.
Ekeberg, O., Kjeldsen, S. E., Greenwood, D. T., & Enger, E. (1990).
Correlations between psychological and physiological responses to acute
flight phobia stress. Scandinavian Journal of Clinical and Laboratory
Investigation, 50(6), 671-677.
Eppinger, H., & Hess, L. (1915). Vagotonia: A Clinical Study in Vegetative
Neurology. The Nervous and Mental Disease Publishing Co., New York,
cited in Porges, 2007.
Federal Aviation Administration (FAA): Code of Federal Regulation, Sec.
25.841, Part 25. Amdt. 25-87, Eff. 7/5/96. Washington DC: US
Government Printing Office, 1986. Retrieved November 15, 2010, from
http://rgl.faa.gov/Regulatory_and_Guidance_Library/rgFAR.nsf/0/
FED94F31539484AB852566720051AA5D?OpenDocument&Highlight=
cabin%20pressure
Foa, E. B., & Kozak, M. J. (1986). Emotional processing of fear: Exposure to
corrective information. Psychological Bulletin, 99(1), 20-35.
Foa, E. B., & Kozak, M. J. (1998). Clinical applications of bioinformational
theory: Understanding anxiety and its treatment. Behavior Therapy, 29,
675-690.
Foa, E. B., Steketee, G., & Rothbaum, B. O. (1989). Behavioral/cognitive
conceptualizations of post-traumatic stress disorder. Behavior Therapy,
20(2), 155-176.
Fodor, O. (1996). Minutes. First fear of flying conference. Tarrytown, New York.
149
Fredrikson, M., Annas, P., Fischer, H., & Wik, G. (1996). Gender and age
differences in the prevalence of specific fears and phobias. Behaviour
Research and Therapy, 34(1), 33-39.
Friedman, B. H. (2007). An autonomic flexibility-neurovisceral integration model
of anxiety and cardiac vagal tone. Biological Psychology, 74(2), 185-199.
Friedman, B. H., & Thayer, J. F. (1998a). Anxiety and autonomic flexibility: a
cardiovascular approach. Biological Psychology, 49(3), 303-323.
Friedman, B. H., & Thayer, J. F. (1998b). Autonomic balance revisited: Panic
anxiety and heart rate variability. Journal of Psychosomatic Research,
44(1), 133-151.
Friedman, B. H., Thayer, J. F., Borkovec, T. D., Tyrell, R. A., Johnson, B.-H., &
Columbo, R. (1993). Autonomic characteristics of nonclinical panic and
blood phobia. Biological Psychiatry, 34(5), 298-310.
Gellhorn, El. Cortell, R., & Feldman, J. (1941). The effect of emotion, sham rage
and hypothalamic stimulation on the vago-insulin response. American
Journal of Physiology, 132, 532-541.
George, D., Nutt, D., Walker, W., Porges, S., Adinoff, B., & Linnoila, M. (1989).
Lactate and hyperventilation substantially attenuate vagal tone in normal
volunteers. Archives of General Psychiatry, 46(2), 153-156.
Grossman, P. (1983). Respiration, stress, and cardiovascular function.
Psychophysiology, 20(3), 284-300.
Grossman, P., Wilhelm, F. H., & Spoerle, M. (2004). Respiratory sinus
arrhythmia, cardiac vagal control, and daily activity. American Journal of
Physiology: Heart and Circulatory Physiology, 287(2), H728-734.
Gruen, G., Holm, A., Luks, N., Malone-Lee, J., Trimmel, M., Schreiber, R.,
Mellert, V., Kos, J., & Hofbauer, W. (2008). Impact of cabin pressure on
aspects of the well-being of aircraft passengers – a laboratory study. in
Proceedings of the 26th International congress of the aeronautical
sciences, 402, 26th ICAS Congress, Anchorage, Alaska, USA.
Günther, V., Haller, C., & Kinzl, J. (2002). Therapie der Flugangst. Wiener
Medizinische Wochenschrift, 152(17-18), 441-444.
150
Hamm, A. (1997). Furcht und Phobien: psychophysiologische Grundlagen und
klinische Anwendungen. Göttingen: Hogrefe.
Hamm, A. (2006). Spezifische Phobien. Göttingen: Hogrefe.
Harding, R. M., & Mills, F. J. (1983). Aviation medicine. Problems of altitude I:
hypoxia and hyperventilation. British Medical Journal (BMJ) (Clinical
Research Edition), 286(6375), 1408-1410.
Haug, T., Berntzen, D., Götestam, K.-G., Brenne, L., Johnsen, B. H., &
Hugdahl, K. (1987). A three-systems analysis of fear of flying: A
comparison of a consonant vs a non-consonant treatment method.
Behaviour Research and Therapy, 25(3), 187-194.
Hjortskov, N., Rissén, D., Blangsted, A., Fallentin, N., Lundberg, U., & Søgaard,
K. (2004). The effect of mental stress on heart rate variability and blood
pressure during computer work. European Journal of Applied Physiology,
92(1), 84-89.
Hoehn-Saric, R., & McLeod, D. (1988). The peripheral sympathetic nervous
system. Its role in normal and pathologic anxiety. The Psychiatric Clinics
of North America, 11, 375-386.
Hoehn-Saric, R., & McLeod, D. (2000). Anxiety and arousal: physiological
changes and their perception. Journal of Affective Disorders, 61(3), 217-
224.
Hodgson, R. & Rachman, S. (1974). Desynchrony in measures of fear.
Behaviour Research and Therapy, 12, 319-326.
Horsten, M., Ericson, M., Perski, A., Wamala, S. P., Schenck-Gustafsson, K., &
Orth-Gomer, K. (1999). Psychosocial factors and heart rate variability in
healthy women. Psychosomatic Medicine, 61(1), 49-57.
Howard, W. A., Murphy, S. M., & Clarke, J. C. (1983). The nature and treatment
of fear of flying: A controlled investigation. Behavior Therapy, 14(4), 557-
567.
Humphreys, S., Deyermond, R., Bali, I., Stevenson, M., & Fee, J. (2005). The
effect of high altitude commercial air travel on oxygen saturation.
Anaesthesia, 60, 458-460.
151
International Civil Aviation Organization (ICAO). (2007). Annual report of the
council. Montreal, Quebeck, Canada. Retrieved August 30, 2009, from
ICAO website: http://www.icao.int/icaonet/dcs/9898/9898_en.pdf
Ito, T., Inoue, Y., Sugihara, T., Yamada, H., Katayama, S., & Kawahara, R.
(1999). Autonomic function in the early stage of panic disorder: Power
spectral analysis of heart rate variability. Psychiatry and Clinical
Neurosciences, 53(6), 667-672.
Iwata, J., & LeDoux, J. E. (1988). Dissociation of associative and
nonassociative concommitants of classical fear conditioning in the freely
behaving rat. Behavioral Neuroscience, 102(1), 66-76.
Jaffee, M. S. (2005). The neurology of aviation, underwater and space
environments. Neurologic Clinics, 23, 541-552.
James, W. (1884). What is emotion. Mind, 19, 188-205.
Johnsen, B. H., Thayer, J. F., Laberg, J. C., Wormnes, B., Raadal, M., Skaret,
E., Kvale, G., & Berg, E. (2003). Attentional and physiological
characteristics of patients with dental anxiety. Journal of Anxiety
Disorders, 17(1), 75-87.
Jönsson, P. (2007). Respiratory sinus arrhythmia as a function of state anxiety
in healthy individuals. International Journal of Psychophysiology, 63,
48-58.
Kawachi, I., Sparrow, D., Vokonas, P. S., & Weiss, S. T. (1994). Symptoms of
anxiety and risk of coronary heart disease. The normative aging study.
Circulation, 90(5), 2225-2229.
Kawachi, I., Sparrow, D., Vokonas, P. S., & Weiss, S. T. (1995). Decreased
heart rate variability in men with phobic anxiety (data from the normative
aging study). American Journal of Cardiology, 75(14), 882-885.
Kelly, D., Brown, C., & Schaffer, J. (1970). A comparison of physiological
measurements on anxious patients and normal controls.
Psychophysiology, 6(4), 429-441.
Kim, S., Palin, F., Anderson, P., Edwards, S., Lindner, G., & Rothbaum, B. O.
(2008). Use of skills learned in CBT for fear of flying: Managing flying
152
anxiety after September 11th. Journal of Anxiety Disorders, 22(2), 301-
309.
Kirschbaum, C., Scherer, G., Strasburger, C. (1994). Pituitary and adrenal
hormone response to pharmacological, physical, and psychological
stimulation in habitual smokers and nonsmokers. Journal of Molecular
Medicine, 72(10), 804-810.
Kleiger, R. E., Bigger, J. T., Bosner, M. S., Chung, M. K., Cook, J. R., Rolnitzky,
L. M., et al. (1991). Stability over time of variables measuring heart rate
variability in normal subjects. American Journal of Cardiology, 68(6),
626-630.
Klein, D. F. (1980). Anxiety reconceptualized. Comprehensive Psychiatry, 21,
411-427.
Klein, E., Cnaani, E., Harel, T., Braun, S., & Ben-Haim, S. A. (1995). Altered
heart rate variability in panic disorder patients. Biological Psychiatry,
37(1), 18-24.
Koizumi, K., & Kollai, M. (1992). Multiple modes of operation of cardiac
autonomic control: development of the ideas from Cannon and Brooks to
the present. Journal of the Autonomic Nervous System, 41, 19-30.
Koizumi, K., Terui, N., & Kollai, M. (1983). Neural control of the heart:
significance of double innervation re-examined. Journal of the Autonomic
Nervous System, 7, 279-294.
Kormos, T. C. (2003). Behavioral treatment for fear of flying. Journal of the
American Psychiatric Nurses Association, 9(5), 145-150.
Kraaij, V., Garnefski, N., & van Gerwen, L.J. (2003). Cognitive coping and
anxiety symptoms among people who seek help for fear of flying.
Aviation, Space & Environmental Medicine, 74(3), 273-277.
Krijn, M., Emmelkamp, P. M. G., Olafsson, R. P., & Biemond, R. (2004). Virtual
reality exposure therapy of anxiety disorders: A review. Clinical
Psychology Review, 24(3), 259-281.
Krijn, M., Emmelkamp, P. M. G., Olafsson, R. P., Bouwman, M., van Gerwen, L.
J., Spinhoven, P., et al. (2007). Fear of flying treatment methods: Virtual
153
reality exposure vs. cognitive behavioral therapy. Aviation, Space &
Environmental Medicine, 78, 121-128.
Lang, P. G. (1971). The application of psychophysiological methods to the study
of psychotherapy and behavior change (Handbook of Psychotherapy and
Behaviour Change: An Empirical Analysis ed.). New York: Wiley.
Lang, P. G. (1979). A bio-informational theory of emotional imagery.
Psychophysiology, 16(6), 495-512.
Lange, C. G. (1887). Über Gemütsbewegungen. Leipzig.
Lazarus, R. S. (1993). From psychological stress to the emotions: A history of
changing outlooks. Annual Review of Psychology, 44(1), 1-22.
Lazarus, R. S., & Folkman, S. (1984). Stress, appraisal and coping. New York:
Springer.
LeDoux, J. E. (2000). Emotion circuits in the brain. Annual Review of
Neuroscience, 23(1), 155-184.
LeDoux, J. E. (1996). The emotional brain. The mysterious underpinnings of
emotional life. New York: Simon and Schuster.
Levy, M. N., & Zieske, H. (1969). Autonomic control of cardiac pacemaker
activity and atrioventricular transmission. Journal of Applied Physiology,
27, 465-470.
Lovallo, W. R. (2005). Stress and health: Biological and psychological
interactions. Thousand Oaks: Sage Publications.
MacArthur, J. D., & MacArthur, C. T. (2000). Heart rate variability. Retrieved
January 17, 2009, from University of California Web site:
http://www.macses.ucsf.edu/research/allostatic/heartrate.php
Mainardi, L. T., Bianchi, A. M., & Cerutti, S. (2002). Time-Frequency and Time-
Varying analysis for assessing the dynamic responses of cardiovascular
control. Critical Reviews in Biomedical Engineering, 30(1-3), 175-217.
Malik, M. (1998). Heart rate variability. Current Opinion in Cardiology, 13, 36-44.
Malliani, A., Pagani, M., & Lombardi, F. (1994). Physiology and clinical
implications of variability of cardiovascular parameters with focus on
heart rate and blood pressure. American Journal of Cardiology, 73(10),
C3-C9.
154
Malliani, A., Pagani, M., Lombardi, F., & Cerutti, S. (1991). Cardiovascular
neural regulation explored in the frequency domain. Circulation, 84(2),
482-492.
Marcinkowski, B. (1993). Flugangst. Psychomed, 5, 63-66.
Maltby, N., Kirsch, I., Mayers, M., & Allen, G. (2002). Virtual reality exposure
therapy for the treatment of fear of flying: a controlled investigation.
Journal of Consulting and Clinical Psychology, 70(5), 1112-1118.
McCraty, R., Atkinson, M., Tomasino, D., & Stuppy, W. P. (2001). Analysis of
twenty-four hour heart rate variability in patients with panic disorder.
Biological Psychology, 56(2), 131-150.
McEwen, B. S., & Wingfield, J. C. (2003). The concept of allostasis in biology
and biomedicine. Hormones and Behavior, 43(1), 2-15.
McLean, N. (2003). The influence of the media on perception of risk associated
with flying. In R. Bor & L. van Gerwen (Eds.), Psychological perspectives
on fear of flying (p 19). Burlington, USA: Ashgate.
McNally, R. J., & Lukach, B. M. (1992). Are panic attacks traumatic stressors?
American Journal of Psychiatry, 149, 824-826.
McNally, R. (2002). Anxiety sensitivity and panic disorder. Biological Psychiatry,
52(10), 938-946.
Menzies, R., & Clarke, J. (1995). The etiology of phobias: A nonassociative
account. Clinical Psychology Review, 15, 23-48.
Merckelbach, H., de Jong, P. J., Muris, P., & van Den Hout, M. A. (1996). The
etiology of specific phobias: A review. Clinical Psychology Review, 16(4),
337-361.
Montano, N., Gnecchi, R., Porta, A., Lombardi, f., Pagani, M., & Mallani, A.
(1984). A power spectrum analysis of heart rate variability to assess the
changes in sympathovagal balance during graded orthostatic tilt.
Circulation, 1984, 90, 1826-1831.
Möller, A., Nortje, C., & Helders, S. B. (1998). Irrational cognitions and the fear
of flying. Journal of Rational-Emotive & Cognitive-Behavior Therapy,
16(2), 135-148.
Mowrer, O. (1960). Learning theory and behaviour. New York: Wiley.

155
Mühlberger, A., Alpers, G. W., & Pauli, P. (2005). Fear of flying in the wake of
September 11: No evidence for an increase in a German sample.
Anxiety, Stress & Coping, 18(4), 343-349.
Mühlberger, A., Herrmann, M. J., Wiedemann, G., Ellgring, H., & Pauli, P.
(2001). Repeated exposure of flight phobics to flights in virtual reality.
Behaviour Research and Therapy, 39(9), 1033-1050.
Mühlberger, A., Wiedemann, G., Pauli, P. (2003). Efficacy of a one-session
virtual reality expsoure treatment for fear of fyling. Psychotherapy
Research, 13(3), 323-336.
Nesse, R. M., Curtis, G. C., Thyer, B. A., McCann, D. S., Huber-Smith, M. J., &
Knopf, R. F. (1985). Endocrine and cardiovascular responses during
phobic anxiety. Psychosomatic Medicine, 47(4), 320-332.
Nousi, A., Haringsma, R., van Gerwen, L., & Spinhoven, P. (2008). Different
Flying Histories in Flying Phobics: Association with Psychopathology and
Treatment Outcome. Aviation, Space & Environmental Medicine, 79,
953-959.
Nousi, A., van Gerwen, L., & Spinhoven, P. (2008). The flight anxiety situations
questionnaire and the flight anxiety modality questionnaire: Norms for
people with fear of flying. Travel Medicine and Infectious Disease, 6(5),
305-310.
Öhman, A. (1986). Face the beast and fear the face: Animal and social fears as
prototypes for evolutionary analyses of emotion. Psychophysiology,
23(2), 123-145.
Obrist, P., Wood, D., & Perez-Reyes, M. (1965). Heart rate during conditioning
in humans: effects of UCS intensity, vagal blockade, and adrenergic
block of vasomotor activity. Journal of Experimental Psychology, 70(1),
32-42.
Ori, Z. F., Monir, G., Weiss, J., Sayhouni, X., & Singer, D. H. (1992). Heart rate
variability. Frequency domain analysis. Cardiology Clinics, 10(3), 499-
537.
Öst, L.(1987). Age of onset in different phobias. Journal of Abnormal
Psychology, 96(3), 223-229.

156
Ottaviani, C., Shapiro, D., Davydov, D. M., & Goldstein, I. B. (2008). Autonomic
stress response modes and ambulatory heart rate level and variability.
Journal of Psychophysiology, 22(1), 28-40.
Pagani, M., Lombardi, F., Guzzetti, S., Rimoldi, O., Furlan, R., Pizzinelli, P., et
al. (1986). Power spectral analysis of heart rate and arterial pressure
variabilities as a marker of sympatho-vagal interaction in man and
conscious dog. Circulation Research, 59(2), 178-193.
Parati, G., & Mancia, G. (2006). Point: Counterpoint: Cardiovascular variability
is/is not an index of autonomic control of circulation. Journal of Applied
Physiology, 101(2), 676-682.
Peñate, W., Pitti, C. T., Bethencourt, J. M., Fuente, J., & Gracia, R. (2008). The
effects of a treatment based on the use of virtual reality exposure and
cognitive-behavioral therapy applied to patients with agoraphobia.
International Journal of Clinical and Health Psychology, 8(1), 5-22.
Phillips, R. G., & LeDoux, J. E. (1992). Differential contribution of amygdala and
hippocampus to cued and contextual fear conditioning. Behavioral
Neuroscience, 106(2), 274-285
Piccirillo, G., Elvira, S., Bucca, C., Viola, E., Cacciafesta, M., & Marigliano, V.
(1997). Abnormal passive head-up tilt test in subjects with symptoms of
anxiety power spectral analysis study of heart rate and blood pressure.
International Journal of Cardiology, 60(2), 121-131.
Pollak, M. H., & Obrist, P. A. (1988). Effects of autonomic blockade on heart
rate response to reaction time and sustained handgrip tasks.
Psychophysiology, 25, 689-695.
Pomeranz, B., Macaulay, R. J., Caudill, M. A., Kutz, I., Adam, D., Gordon, D., et
al. (1985). Assessment of autonomic function in humans by heart rate
spectral analysis. American Journal of Physiology: Heart and Circulatory
Physiology, 248(1), H151-153.
Porges, S. W. (1995). Cardiac vagal tone: A physiological index of stress.
Neuroscience & Biobehavioral Reviews, 19(2), 225-233.
157
Porges, S. W. (2001). The polyvagal theory: phylogenetic substrates of a social
nervous system. International Journal of Psychophysiology, 42(2), 123-
146.
Porges, S. W. (2007). The polyvagal perspective. Biological psychology, 74,
116-143.
Prigatano, G. P., & Johnson, H. J. (1974). Autonomic nervous system changes
associated with a spider phobic reaction. Journal of Abnormal
Psychology, 83(2), 169-177.
Rachman, S., & Hodgson, R. (1974). Synchrony and desynchrony in fear and
avoidance. Behaviour Research and Therapy, 12, 311-318.
Rachman, S. (1977). The conditioning theory of fear acquisition: A critical
examination. Behaviour Research and Therapy, 15(5), 375-387.
Reinecker, H. (1993). Phobien: Agoraphobien, soziale und spezifische Phobien.
Göttingen: Hogrefe.
Reiss, S. (1997). Trait anxiety: It's not what you think it is. Journal of Anxiety
Disorders, 11(2), 201-214.
Roth, W. T., Gomolla, A., Meuret, A. E., Alpers, G. W., Handke, E. M., &
Wilhelm, F. H. (2002). High altitudes, anxiety, and panic attacks: is there
a relationship? Depression and Anxiety, 16(2), 51-58.
Roth, W. T., Telch, M. J., Taylor, C. B., Sachitano, J. A., Gallen, C. C., Kopell,
M. L., et al. (1986). Autonomic characteristics of agoraphobia with panic
attacks. Biological Psychiatry, 21(12), 1133-1154.
Rothbaum, B. O., Anderson, P., Zimand, E., Hodges, L., Lang, D., & Wilson, J.
(2006). Virtual reality exposure therapy and standard (in vivo) exposure
therapy in the treatment of fear of flying. Behavior Therapy, 37(1), 80-90.
Rothbaum, B. O., Hodges, L., Anderson, P. L., Price, L., & Smith, S. (2002).
Twelve-month follow-up of virtual reality and standard exposure
therapies for the fear of flying. Journal of Consulting & Clinical
Psychology, 70(2), 428-432.
Rothbaum, B. O., Hodges, L., Smith, S., Lee, J. H., & Price, L. (2000). A
controlled study of virtual reality exposure therapy for the fear of flying.
Journal of Consulting & Clinical Psychology, 68(6), 1020-1026.
158
Saul, J. (1990). Beat-to-beat variations of heart rate reflect modulation of
cardiac autonomic outflow. News in Physiological Sciences, 5(1), 32-37.
Schachter, S., & Singer, J. (1962). Cognitive, social, and physiological
determinants of emotional state. Psychological Review, 69(5), 379-399.
Seligman, M. E. P. (1971). Phobias and preparedness. Behavior Therapy, 2(3),
307-320.
Spielberger, C. C., Gorsuch, R. L., & Luchene, R. E. (1970). Stait-Trait Anxiety
Inventory (STAI). Palo Alto, CA: Consulting Psychology Press.
Stein, M. B., & Asmundson, G. J. C. (1994). Autonomic function in panic
disorder: cardiorespiratory and plasma catecholamine responsivity to
multiple challenges of the autonomic nervous system. Biological
Psychiatry, 36(8), 548-558.
Stein, P., & Kleiger, R. E. (1999). Insights from the study of heart rate variability.
Annual Review of Medicine, 50(1), 249-261.
Sztajzel, J. (2004). Heart rate variability: a noninvasive electrocardiographic
method to measure the autonomic nervous system. Swiss Medical
Weekly, 134, 514-522.
Task Force of the European Society of Cardiology (ESC) and the North
American Society of Pacing Electrophysiology (NASPE). (1996). Heart
rate variability: Standards of measurement, physiological interpretation,
and clinical use. European Heart Journal, 17(354-381).
Terathongkum, S. & Pickler, R. (2004). Relationships among heart rate
variability, hypertension, and relaxation techniques. Journal of Vascular
Nursing, 22(3), 78-82.
Thayer, J. F., & Friedman, B. H. (2002). Stop that! Inhibition, sensitization, and
their neurovisceral concomitants. Scandinavian Journal of Psychology,
43(2), 123-130.
Thayer, J. F., Friedman, B. H., & Borkovec, T. D. (1996). Autonomic
characteristics of generalized anxiety disorder and worry. Biological
Psychiatry, 39(4), 255-266.
159
Thayer, J. F., & Lane, R. D. (2000). A model of neurovisceral integration in
emotion regulation and dysregulation. Journal of Affective Disorders,
61(3), 201-216.
Tortella-Feliu, M., & Rivas, M. (2001). Treatment for the fear of flying: a review.
International Journal of Clinical and Health Psychology, 1(3), 547-569.
University of Utah. ECG Intervals and Waves. Retrieved February 15, 2011,
from University of Utah Spencer S. Eckles Health Sciences Library Web
site http://library.med.utah.edu/kw/ecg/mml/ecg_533.html
Ursin, H., Baade, E., & Levine, S. (1978). Psychobiology of stress: a study of
coping men. New York: Academic Press (cited in Hoehn-Saric et al.,
2000).
U.S. Department of Transportation. (2009). Research and Innovative
Technology Administration. Bureau of Transportation Statistics. 2009. Air
Carrier Traffic Statistics. Revenue Aircraft Miles Flown (Jan 1996 - Aug
2009), Retrieved December 11, 2009, from U.S. Department of
Transportation Web site: http://www.bts.gov/xml/air_traffic/src/
datadisp.xml
U.S. National Transportation Safety Board. (2001). Safety report. Survivability of
accidents involving Part 121 U.S. Air Carrier Operations, 1983 through
2000. Retrieved September 9, 2009, from U.S. National Transportation
Safety Board Web site: htpp//:www.ntsb.gov/publictn/2001/sR0101.pdf
Van Gerwen, L., & Diekstra, R. F. W. (2000). Fear of flying treatment programs
for passengers: An international review. Aviation, Space & Environmental
Medicine, 71(4), 430-437.
Van Gerwen, L., Diekstra, R. F. W., Arondeus, J. M., & Wolfger, R. (2004). Fear
of flying treatment programs for passengers: an international update.
Travel Medicine and Infectious Disease, 2(1), 27-35.
Van Gerwen, L. J., Spinhoven, P., Diekstra, R. F. W., & van Dyck, R. (1997).
People who seek help for fear of flying: Typology of flying phobics.
Behavior Therapy, 28(2), 237-251.
Van Gerwen, L., Spinhoven, P., Diekstra, R. F. W., & van Dyck, R. (2002).
Multicomponent standardized treatment programs for fear of flying:
160
Description and effectiveness. Cognitive and Behavioral Practice, 9(2),
138-149.
Van Gerwen, L., Spinhoven, P., & van Dyck, R. (2006). Behavioral and
cognitive group treatment for fear of flying: A randomized controlled trial.
Journal of Behavior Therapy and Experimental Psychiatry, 37(4), 358-
371.
Van Gerwen, L., Spinhoven, P., van Dyck, R., & Diekstra, R. F. W. (1999).
Construction and Psychometric Characteristics of Two Self-Report
Questionnaires for the Assessment of Fear of Flying. Psychological
Assessment, 11(2), 146-158.
Van Ravenswaaij-Arts, C. M. A., Kollee, L. A. A., Hopman, J. C. W., Stoelinga,
G. B. A., & van Geijn, H. P. (1993). Heart rate variability. Annals of
Internal Medicine, 118(6), 436-447.
Vedhara, K., Miles, J., Bennett, P., Plummer, S., Tallon, D., Brooks, E., et al.
(2003). An investigation into the relationship between salivary cortisol,
stress,anxiety and depression. Biological Psychology, 62, 89-96.
Watkins, L. L., Grossman, P., Krishnan, R., & Sherwood, A. (1998). Anxiety and
vagal control of heart rate. Psychosomatic Medicine, 60(4), 498-502.
Watson, J. B. (1924). Behaviorism. New York: Norton.
Watson, J. B., & Rayner, R. (1920). Conditioned emotional reactions. Journal of
Experimental Psychology: General, 3(1), 1-14.
Wenger, M. A. (1966). Studies of autonomic balance: A summary.
Psychophysiology, 2, 173-186.
Wiederhold, B. K., Jang, D. P., Kim, S. I., & Wiederhold, M. D. (2002).
Physiological monitoring as an objective tool in virtual reality therapy.
CyberPsychology & Behavior, 5(1), 77-82.
Wiederhold, B. K., & Wiederhold, M. D. (2003). Three-Year Follow-Up for virtual
reality exposure for fear of flying. CyberPsychology & Behavior, 6(4),
441-445.
Wilhelm, F. H., Pfaltz, M., Grossman, P., & Roth, W. (2006). Distinguishing
emotional from physical activation in ambulatory psychophysiological
monitoring. Biomedical Sciences Instrumentation, 42, 458-463.
161
Wilhelm, F. H., & Roth, W. T. (1997a). Acute and delayed effects of alprazolam
on flight phobics during exposure. Behaviour Research and Therapy,
35(9), 831-841.
Wilhelm, F. H., & Roth, W. T. (1997b). Clinical characteristics of Flight Phobia.
Journal of Anxiety Disorders, 11(3), 241-261.
Wilhelm, F. H., & Roth, W. T. (1998). Taking the laboratory to the skies:
Ambulatory assessment of self-report, autonomic, and respiratory
responses in flying phobia. Psychophysiology, 35, 596-606.
Wilhelm, F. H., & Roth, W. T. (2001). The somatic symptom paradox in DSM-IV
anxiety disorders: suggestions for a clinical focus in psychophysiology.
Biological Psychology, 57(1-3), 105-140.
Wilhelm, F. H., Trabert, W., & Roth, W. T. (2001). Physiologic instability in panic
disorder and generalized anxiety disorder. Biological Psychiatry, 49(7),
596-605.
Wolpe, J., & Rachman, S. (1960). Psychoanalytic "Evidence": A critique based
on Freud's case of Little Hans. The Journal of Nervous and Mental
Disease, 130(8), 135-148.
Yeragani, V. K., Pohl, R., Berger, R., Balon, R., Ramesh, C., Glitz, D., et al.
(1993). Decreased heart rate variability in panic disorder patients: A
study of power-spectral analysis of heart rate. Psychiatry Research,
46(1), 89-103.
Yeragani, V. K., Sobolewski, E., Igel, G., Johnson, C., Jampala, V. C., Kay, J.,
et al. (1998). Decreased heart-period variability in patients with panic
disorder: a study of Holter ECG records. Psychiatry Research, 78(1-2),
89-99.
Yeragani, V. K., Srinivasan, K., Balon, R., Ramesh, C., & Berchou, R. (1994).
Lactate sensitivity and cardiac cholinergic function in panic disorder.
American Journal of Psychiatry, 151(8), 1226-1228.
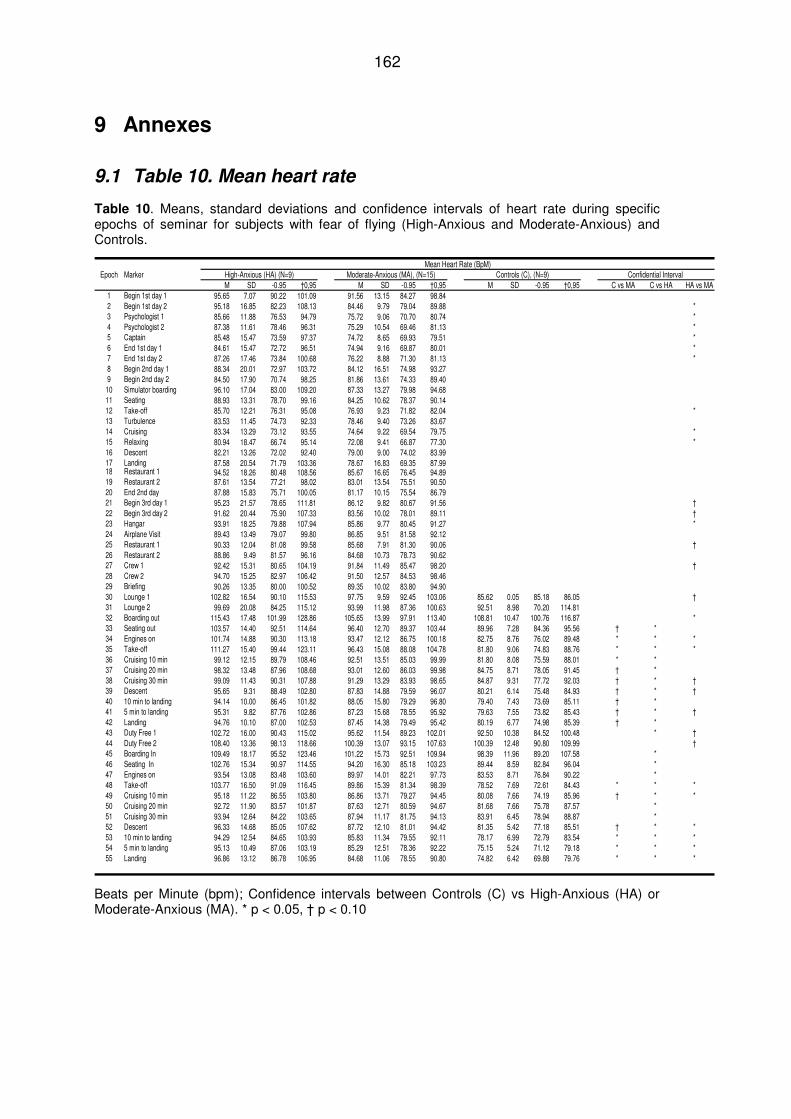
162
9 Annexes
9.1 Table 10. Mean heart rate
Table 10. Means, standard deviations and confidence intervals of heart rate during specific epochs of seminar for subjects with fear of flying (High-Anxious and Moderate-Anxious) and Controls.
Mean Heart Rate (BpM)Epoch Marker Moderate-Anxious (MA), (N=15) Controls (C), (N=9) Confidential Interval
M SD -0.95 †0,95 M SD -0.95 †0,95 M SD -0.95 †0,95 C vs MA C vs HA HA vs MA1 Begin 1st day 1 95.65 7.07 90.22 101.09 91.56 13.15 84.27 98.842 Begin 1st day 2 95.18 16.85 82.23 108.13 84.46 9.79 79.04 89.88 *3 Psychologist 1 85.66 11.88 76.53 94.79 75.72 9.06 70.70 80.74 *4 Psychologist 2 87.38 11.61 78.46 96.31 75.29 10.54 69.46 81.13 *5 Captain 85.48 15.47 73.59 97.37 74.72 8.65 69.93 79.51 *6 End 1st day 1 84.61 15.47 72.72 96.51 74.94 9.16 69.87 80.01 *7 End 1st day 2 87.26 17.46 73.84 100.68 76.22 8.88 71.30 81.13 *8 Begin 2nd day 1 88.34 20.01 72.97 103.72 84.12 16.51 74.98 93.279 Begin 2nd day 2 84.50 17.90 70.74 98.25 81.86 13.61 74.33 89.40
10 Simulator boarding 96.10 17.04 83.00 109.20 87.33 13.27 79.98 94.6811 Seating 88.93 13.31 78.70 99.16 84.25 10.62 78.37 90.1412 Take-off 85.70 12.21 76.31 95.08 76.93 9.23 71.82 82.04 *13 Turbulence 83.53 11.45 74.73 92.33 78.46 9.40 73.26 83.6714 Cruising 83.34 13.29 73.12 93.55 74.64 9.22 69.54 79.75 *15 Relaxing 80.94 18.47 66.74 95.14 72.08 9.41 66.87 77.30 *16 Descent 82.21 13.26 72.02 92.40 79.00 9.00 74.02 83.9917 Landing 87.58 20.54 71.79 103.36 78.67 16.83 69.35 87.9918 Restaurant 1 94.52 18.26 80.48 108.56 85.67 16.65 76.45 94.8919 Restaurant 2 87.61 13.54 77.21 98.02 83.01 13.54 75.51 90.5020 End 2nd day 87.88 15.83 75.71 100.05 81.17 10.15 75.54 86.7921 Begin 3rd day 1 95.23 21.57 78.65 111.81 86.12 9.82 80.67 91.56 †22 Begin 3rd day 2 91.62 20.44 75.90 107.33 83.56 10.02 78.01 89.11 †23 Hangar 93.91 18.25 79.88 107.94 85.86 9.77 80.45 91.27 *24 Airplane Visit 89.43 13.49 79.07 99.80 86.85 9.51 81.58 92.1225 Restaurant 1 90.33 12.04 81.08 99.58 85.68 7.91 81.30 90.06 †26 Restaurant 2 88.86 9.49 81.57 96.16 84.68 10.73 78.73 90.6227 Crew 1 92.42 15.31 80.65 104.19 91.84 11.49 85.47 98.20 †28 Crew 2 94.70 15.25 82.97 106.42 91.50 12.57 84.53 98.4629 Briefing 90.26 13.35 80.00 100.52 89.35 10.02 83.80 94.9030 Lounge 1 102.82 16.54 90.10 115.53 97.75 9.59 92.45 103.06 85.62 0.05 85.18 86.05 †31 Lounge 2 99.69 20.08 84.25 115.12 93.99 11.98 87.36 100.63 92.51 8.98 70.20 114.8132 Boarding out 115.43 17.48 101.99 128.86 105.65 13.99 97.91 113.40 108.81 10.47 100.76 116.87 *33 Seating out 103.57 14.40 92.51 114.64 96.40 12.70 89.37 103.44 89.96 7.28 84.36 95.56 † *34 Engines on 101.74 14.88 90.30 113.18 93.47 12.12 86.75 100.18 82.75 8.76 76.02 89.48 * * *35 Take-off 111.27 15.40 99.44 123.11 96.43 15.08 88.08 104.78 81.80 9.06 74.83 88.76 * * *36 Cruising 10 min 99.12 12.15 89.79 108.46 92.51 13.51 85.03 99.99 81.80 8.08 75.59 88.01 * *37 Cruising 20 min 98.32 13.48 87.96 108.68 93.01 12.60 86.03 99.98 84.75 8.71 78.05 91.45 † *38 Cruising 30 min 99.09 11.43 90.31 107.88 91.29 13.29 83.93 98.65 84.87 9.31 77.72 92.03 † * †39 Descent 95.65 9.31 88.49 102.80 87.83 14.88 79.59 96.07 80.21 6.14 75.48 84.93 † * †40 10 min to landing 94.14 10.00 86.45 101.82 88.05 15.80 79.29 96.80 79.40 7.43 73.69 85.11 † *41 5 min to landing 95.31 9.82 87.76 102.86 87.23 15.68 78.55 95.92 79.63 7.55 73.82 85.43 † * †42 Landing 94.76 10.10 87.00 102.53 87.45 14.38 79.49 95.42 80.19 6.77 74.98 85.39 † *43 Duty Free 1 102.72 16.00 90.43 115.02 95.62 11.54 89.23 102.01 92.50 10.38 84.52 100.48 * †44 Duty Free 2 108.40 13.36 98.13 118.66 100.39 13.07 93.15 107.63 100.39 12.48 90.80 109.99 †45 Boarding In 109.49 18.17 95.52 123.46 101.22 15.73 92.51 109.94 98.39 11.96 89.20 107.58 *46 Seating In 102.76 15.34 90.97 114.55 94.20 16.30 85.18 103.23 89.44 8.59 82.84 96.04 *47 Engines on 93.54 13.08 83.48 103.60 89.97 14.01 82.21 97.73 83.53 8.71 76.84 90.22 *48 Take-off 103.77 16.50 91.09 116.45 89.86 15.39 81.34 98.39 78.52 7.69 72.61 84.43 * * *49 Cruising 10 min 95.18 11.22 86.55 103.80 86.86 13.71 79.27 94.45 80.08 7.66 74.19 85.96 † * *50 Cruising 20 min 92.72 11.90 83.57 101.87 87.63 12.71 80.59 94.67 81.68 7.66 75.78 87.57 *51 Cruising 30 min 93.94 12.64 84.22 103.65 87.94 11.17 81.75 94.13 83.91 6.45 78.94 88.87 *52 Descent 96.33 14.68 85.05 107.62 87.72 12.10 81.01 94.42 81.35 5.42 77.18 85.51 † * *53 10 min to landing 94.29 12.54 84.65 103.93 85.83 11.34 79.55 92.11 78.17 6.99 72.79 83.54 * * *54 5 min to landing 95.13 10.49 87.06 103.19 85.29 12.51 78.36 92.22 75.15 5.24 71.12 79.18 * * *55 Landing 96.86 13.12 86.78 106.95 84.68 11.06 78.55 90.80 74.82 6.42 69.88 79.76 * * *
High-Anxious (HA) (N=9)
Beats per Minute (bpm); Confidence intervals between Controls (C) vs High-Anxious (HA) or Moderate-Anxious (MA). * p < 0.05, † p < 0.10
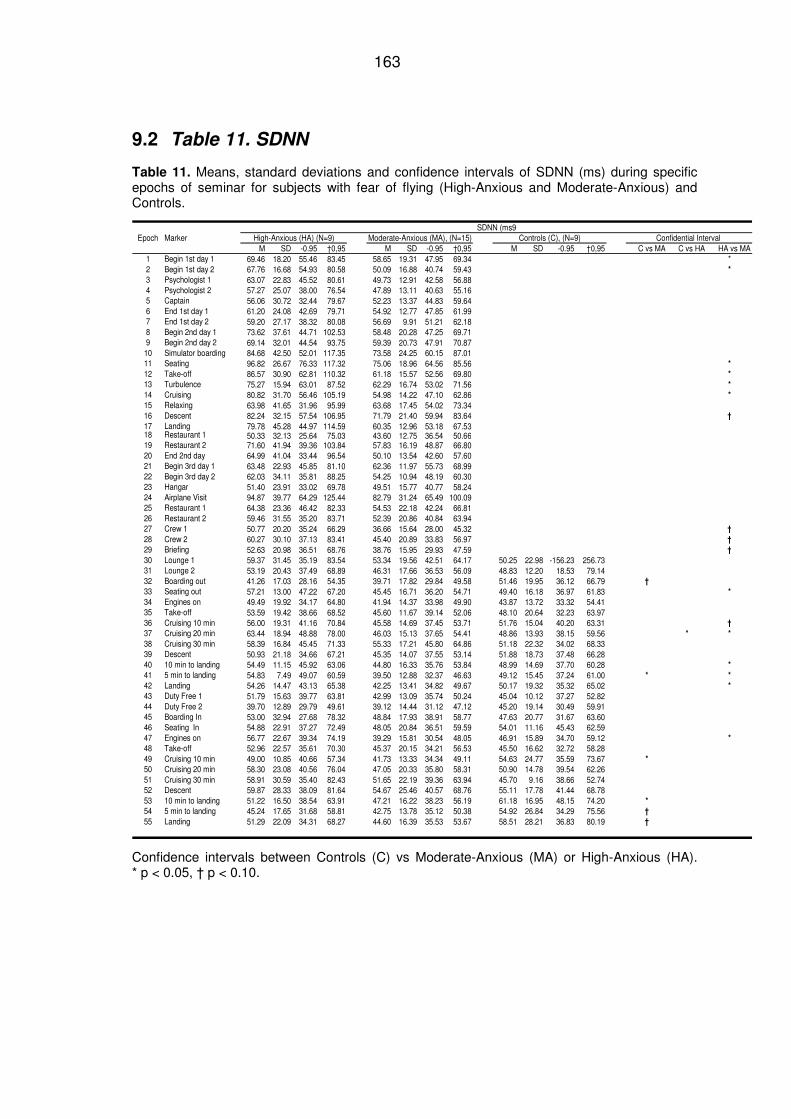
163
9.2 Table 11. SDNN
Table 11. Means, standard deviations and confidence intervals of SDNN (ms) during specific epochs of seminar for subjects with fear of flying (High-Anxious and Moderate-Anxious) and Controls.
SDNN (ms9Epoch Marker High-Anxious (HA) (N=9) Moderate-Anxious (MA), (N=15) Controls (C), (N=9) Confidential Interval
M SD -0.95 †0,95 M SD -0.95 †0,95 M SD -0.95 †0,95 C vs MA C vs HA HA vs MA1 Begin 1st day 1 69.46 18.20 55.46 83.45 58.65 19.31 47.95 69.34 *2 Begin 1st day 2 67.76 16.68 54.93 80.58 50.09 16.88 40.74 59.43 *
3 Psychologist 1 63.07 22.83 45.52 80.61 49.73 12.91 42.58 56.884 Psychologist 2 57.27 25.07 38.00 76.54 47.89 13.11 40.63 55.165 Captain 56.06 30.72 32.44 79.67 52.23 13.37 44.83 59.646 End 1st day 1 61.20 24.08 42.69 79.71 54.92 12.77 47.85 61.997 End 1st day 2 59.20 27.17 38.32 80.08 56.69 9.91 51.21 62.188 Begin 2nd day 1 73.62 37.61 44.71 102.53 58.48 20.28 47.25 69.719 Begin 2nd day 2 69.14 32.01 44.54 93.75 59.39 20.73 47.91 70.87
10 Simulator boarding 84.68 42.50 52.01 117.35 73.58 24.25 60.15 87.0111 Seating 96.82 26.67 76.33 117.32 75.06 18.96 64.56 85.56 *
12 Take-off 86.57 30.90 62.81 110.32 61.18 15.57 52.56 69.80 *
13 Turbulence 75.27 15.94 63.01 87.52 62.29 16.74 53.02 71.56 *
14 Cruising 80.82 31.70 56.46 105.19 54.98 14.22 47.10 62.86 *
15 Relaxing 63.98 41.65 31.96 95.99 63.68 17.45 54.02 73.3416 Descent 82.24 32.15 57.54 106.95 71.79 21.40 59.94 83.64 †
17 Landing 79.78 45.28 44.97 114.59 60.35 12.96 53.18 67.5318 Restaurant 1 50.33 32.13 25.64 75.03 43.60 12.75 36.54 50.6619 Restaurant 2 71.60 41.94 39.36 103.84 57.83 16.19 48.87 66.8020 End 2nd day 64.99 41.04 33.44 96.54 50.10 13.54 42.60 57.6021 Begin 3rd day 1 63.48 22.93 45.85 81.10 62.36 11.97 55.73 68.9922 Begin 3rd day 2 62.03 34.11 35.81 88.25 54.25 10.94 48.19 60.3023 Hangar 51.40 23.91 33.02 69.78 49.51 15.77 40.77 58.2424 Airplane Visit 94.87 39.77 64.29 125.44 82.79 31.24 65.49 100.0925 Restaurant 1 64.38 23.36 46.42 82.33 54.53 22.18 42.24 66.8126 Restaurant 2 59.46 31.55 35.20 83.71 52.39 20.86 40.84 63.9427 Crew 1 50.77 20.20 35.24 66.29 36.66 15.64 28.00 45.32 †
28 Crew 2 60.27 30.10 37.13 83.41 45.40 20.89 33.83 56.97 †
29 Briefing 52.63 20.98 36.51 68.76 38.76 15.95 29.93 47.59 †
30 Lounge 1 59.37 31.45 35.19 83.54 53.34 19.56 42.51 64.17 50.25 22.98 -156.23 256.7331 Lounge 2 53.19 20.43 37.49 68.89 46.31 17.66 36.53 56.09 48.83 12.20 18.53 79.1432 Boarding out 41.26 17.03 28.16 54.35 39.71 17.82 29.84 49.58 51.46 19.95 36.12 66.79 †
33 Seating out 57.21 13.00 47.22 67.20 45.45 16.71 36.20 54.71 49.40 16.18 36.97 61.83 *
34 Engines on 49.49 19.92 34.17 64.80 41.94 14.37 33.98 49.90 43.87 13.72 33.32 54.4135 Take-off 53.59 19.42 38.66 68.52 45.60 11.67 39.14 52.06 48.10 20.64 32.23 63.9736 Cruising 10 min 56.00 19.31 41.16 70.84 45.58 14.69 37.45 53.71 51.76 15.04 40.20 63.31 †
37 Cruising 20 min 63.44 18.94 48.88 78.00 46.03 15.13 37.65 54.41 48.86 13.93 38.15 59.56 * *
38 Cruising 30 min 58.39 16.84 45.45 71.33 55.33 17.21 45.80 64.86 51.18 22.32 34.02 68.3339 Descent 50.93 21.18 34.66 67.21 45.35 14.07 37.55 53.14 51.88 18.73 37.48 66.2840 10 min to landing 54.49 11.15 45.92 63.06 44.80 16.33 35.76 53.84 48.99 14.69 37.70 60.28 *
41 5 min to landing 54.83 7.49 49.07 60.59 39.50 12.88 32.37 46.63 49.12 15.45 37.24 61.00 * *
42 Landing 54.26 14.47 43.13 65.38 42.25 13.41 34.82 49.67 50.17 19.32 35.32 65.02 *
43 Duty Free 1 51.79 15.63 39.77 63.81 42.99 13.09 35.74 50.24 45.04 10.12 37.27 52.8244 Duty Free 2 39.70 12.89 29.79 49.61 39.12 14.44 31.12 47.12 45.20 19.14 30.49 59.9145 Boarding In 53.00 32.94 27.68 78.32 48.84 17.93 38.91 58.77 47.63 20.77 31.67 63.6046 Seating In 54.88 22.91 37.27 72.49 48.05 20.84 36.51 59.59 54.01 11.16 45.43 62.5947 Engines on 56.77 22.67 39.34 74.19 39.29 15.81 30.54 48.05 46.91 15.89 34.70 59.12 *
48 Take-off 52.96 22.57 35.61 70.30 45.37 20.15 34.21 56.53 45.50 16.62 32.72 58.2849 Cruising 10 min 49.00 10.85 40.66 57.34 41.73 13.33 34.34 49.11 54.63 24.77 35.59 73.67 *
50 Cruising 20 min 58.30 23.08 40.56 76.04 47.05 20.33 35.80 58.31 50.90 14.78 39.54 62.2651 Cruising 30 min 58.91 30.59 35.40 82.43 51.65 22.19 39.36 63.94 45.70 9.16 38.66 52.7452 Descent 59.87 28.33 38.09 81.64 54.67 25.46 40.57 68.76 55.11 17.78 41.44 68.7853 10 min to landing 51.22 16.50 38.54 63.91 47.21 16.22 38.23 56.19 61.18 16.95 48.15 74.20 *
54 5 min to landing 45.24 17.65 31.68 58.81 42.75 13.78 35.12 50.38 54.92 26.84 34.29 75.56 †
55 Landing 51.29 22.09 34.31 68.27 44.60 16.39 35.53 53.67 58.51 28.21 36.83 80.19 †
Confidence intervals between Controls (C) vs Moderate-Anxious (MA) or High-Anxious (HA). * p < 0.05, † p < 0.10.
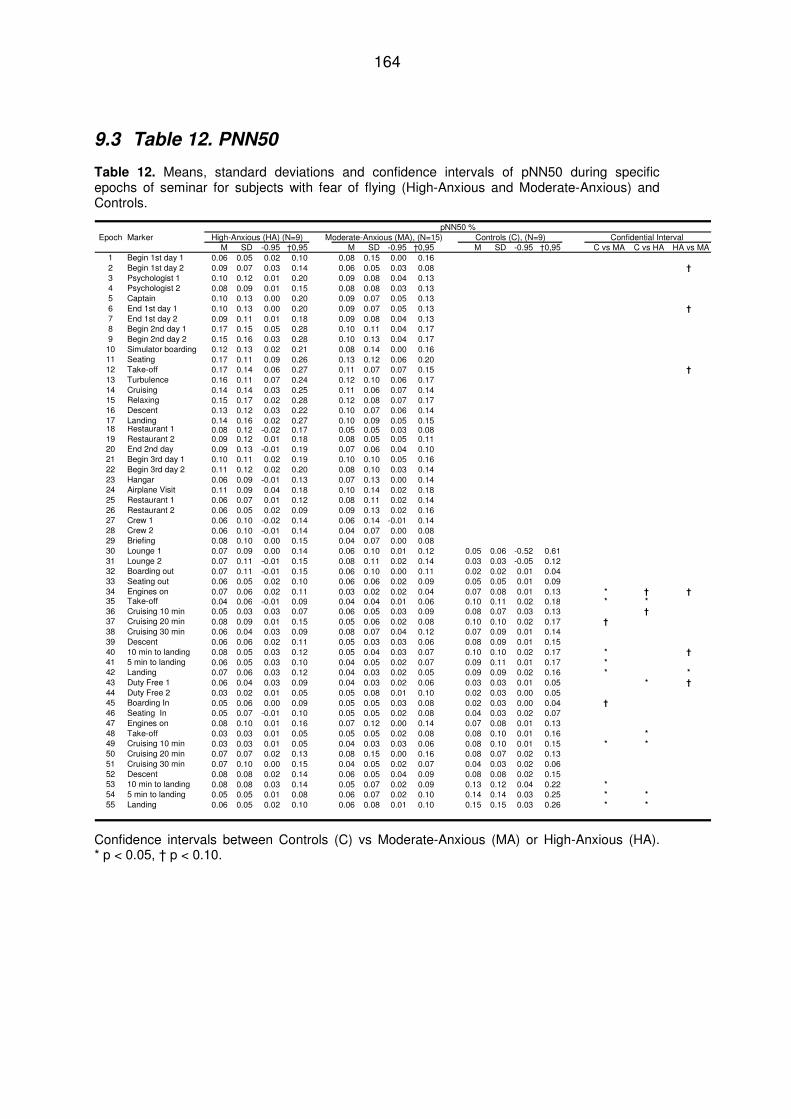
164
9.3 Table 12. PNN50
Table 12. Means, standard deviations and confidence intervals of pNN50 during specific epochs of seminar for subjects with fear of flying (High-Anxious and Moderate-Anxious) and Controls.
pNN50 %Epoch Marker High-Anxious (HA) (N=9) Moderate-Anxious (MA), (N=15) Controls (C), (N=9) Confidential Interval
M SD -0.95 †0,95 M SD -0.95 †0,95 M SD -0.95 †0,95 C vs MA C vs HA HA vs MA1 Begin 1st day 1 0.06 0.05 0.02 0.10 0.08 0.15 0.00 0.162 Begin 1st day 2 0.09 0.07 0.03 0.14 0.06 0.05 0.03 0.08 †
3 Psychologist 1 0.10 0.12 0.01 0.20 0.09 0.08 0.04 0.134 Psychologist 2 0.08 0.09 0.01 0.15 0.08 0.08 0.03 0.135 Captain 0.10 0.13 0.00 0.20 0.09 0.07 0.05 0.136 End 1st day 1 0.10 0.13 0.00 0.20 0.09 0.07 0.05 0.13 †
7 End 1st day 2 0.09 0.11 0.01 0.18 0.09 0.08 0.04 0.138 Begin 2nd day 1 0.17 0.15 0.05 0.28 0.10 0.11 0.04 0.179 Begin 2nd day 2 0.15 0.16 0.03 0.28 0.10 0.13 0.04 0.1710 Simulator boarding 0.12 0.13 0.02 0.21 0.08 0.14 0.00 0.1611 Seating 0.17 0.11 0.09 0.26 0.13 0.12 0.06 0.2012 Take-off 0.17 0.14 0.06 0.27 0.11 0.07 0.07 0.15 †
13 Turbulence 0.16 0.11 0.07 0.24 0.12 0.10 0.06 0.1714 Cruising 0.14 0.14 0.03 0.25 0.11 0.06 0.07 0.1415 Relaxing 0.15 0.17 0.02 0.28 0.12 0.08 0.07 0.1716 Descent 0.13 0.12 0.03 0.22 0.10 0.07 0.06 0.1417 Landing 0.14 0.16 0.02 0.27 0.10 0.09 0.05 0.1518 Restaurant 1 0.08 0.12 -0.02 0.17 0.05 0.05 0.03 0.0819 Restaurant 2 0.09 0.12 0.01 0.18 0.08 0.05 0.05 0.1120 End 2nd day 0.09 0.13 -0.01 0.19 0.07 0.06 0.04 0.1021 Begin 3rd day 1 0.10 0.11 0.02 0.19 0.10 0.10 0.05 0.1622 Begin 3rd day 2 0.11 0.12 0.02 0.20 0.08 0.10 0.03 0.1423 Hangar 0.06 0.09 -0.01 0.13 0.07 0.13 0.00 0.1424 Airplane Visit 0.11 0.09 0.04 0.18 0.10 0.14 0.02 0.1825 Restaurant 1 0.06 0.07 0.01 0.12 0.08 0.11 0.02 0.1426 Restaurant 2 0.06 0.05 0.02 0.09 0.09 0.13 0.02 0.1627 Crew 1 0.06 0.10 -0.02 0.14 0.06 0.14 -0.01 0.1428 Crew 2 0.06 0.10 -0.01 0.14 0.04 0.07 0.00 0.0829 Briefing 0.08 0.10 0.00 0.15 0.04 0.07 0.00 0.0830 Lounge 1 0.07 0.09 0.00 0.14 0.06 0.10 0.01 0.12 0.05 0.06 -0.52 0.6131 Lounge 2 0.07 0.11 -0.01 0.15 0.08 0.11 0.02 0.14 0.03 0.03 -0.05 0.1232 Boarding out 0.07 0.11 -0.01 0.15 0.06 0.10 0.00 0.11 0.02 0.02 0.01 0.0433 Seating out 0.06 0.05 0.02 0.10 0.06 0.06 0.02 0.09 0.05 0.05 0.01 0.0934 Engines on 0.07 0.06 0.02 0.11 0.03 0.02 0.02 0.04 0.07 0.08 0.01 0.13 * † †35 Take-off 0.04 0.06 -0.01 0.09 0.04 0.04 0.01 0.06 0.10 0.11 0.02 0.18 * *
36 Cruising 10 min 0.05 0.03 0.03 0.07 0.06 0.05 0.03 0.09 0.08 0.07 0.03 0.13 †
37 Cruising 20 min 0.08 0.09 0.01 0.15 0.05 0.06 0.02 0.08 0.10 0.10 0.02 0.17 †
38 Cruising 30 min 0.06 0.04 0.03 0.09 0.08 0.07 0.04 0.12 0.07 0.09 0.01 0.1439 Descent 0.06 0.06 0.02 0.11 0.05 0.03 0.03 0.06 0.08 0.09 0.01 0.1540 10 min to landing 0.08 0.05 0.03 0.12 0.05 0.04 0.03 0.07 0.10 0.10 0.02 0.17 * †
41 5 min to landing 0.06 0.05 0.03 0.10 0.04 0.05 0.02 0.07 0.09 0.11 0.01 0.17 *
42 Landing 0.07 0.06 0.03 0.12 0.04 0.03 0.02 0.05 0.09 0.09 0.02 0.16 * *
43 Duty Free 1 0.06 0.04 0.03 0.09 0.04 0.03 0.02 0.06 0.03 0.03 0.01 0.05 * †
44 Duty Free 2 0.03 0.02 0.01 0.05 0.05 0.08 0.01 0.10 0.02 0.03 0.00 0.0545 Boarding In 0.05 0.06 0.00 0.09 0.05 0.05 0.03 0.08 0.02 0.03 0.00 0.04 †
46 Seating In 0.05 0.07 -0.01 0.10 0.05 0.05 0.02 0.08 0.04 0.03 0.02 0.0747 Engines on 0.08 0.10 0.01 0.16 0.07 0.12 0.00 0.14 0.07 0.08 0.01 0.1348 Take-off 0.03 0.03 0.01 0.05 0.05 0.05 0.02 0.08 0.08 0.10 0.01 0.16 *
49 Cruising 10 min 0.03 0.03 0.01 0.05 0.04 0.03 0.03 0.06 0.08 0.10 0.01 0.15 * *
50 Cruising 20 min 0.07 0.07 0.02 0.13 0.08 0.15 0.00 0.16 0.08 0.07 0.02 0.1351 Cruising 30 min 0.07 0.10 0.00 0.15 0.04 0.05 0.02 0.07 0.04 0.03 0.02 0.0652 Descent 0.08 0.08 0.02 0.14 0.06 0.05 0.04 0.09 0.08 0.08 0.02 0.1553 10 min to landing 0.08 0.08 0.03 0.14 0.05 0.07 0.02 0.09 0.13 0.12 0.04 0.22 *
54 5 min to landing 0.05 0.05 0.01 0.08 0.06 0.07 0.02 0.10 0.14 0.14 0.03 0.25 * *
55 Landing 0.06 0.05 0.02 0.10 0.06 0.08 0.01 0.10 0.15 0.15 0.03 0.26 * *
Confidence intervals between Controls (C) vs Moderate-Anxious (MA) or High-Anxious (HA). * p < 0.05, † p < 0.10.
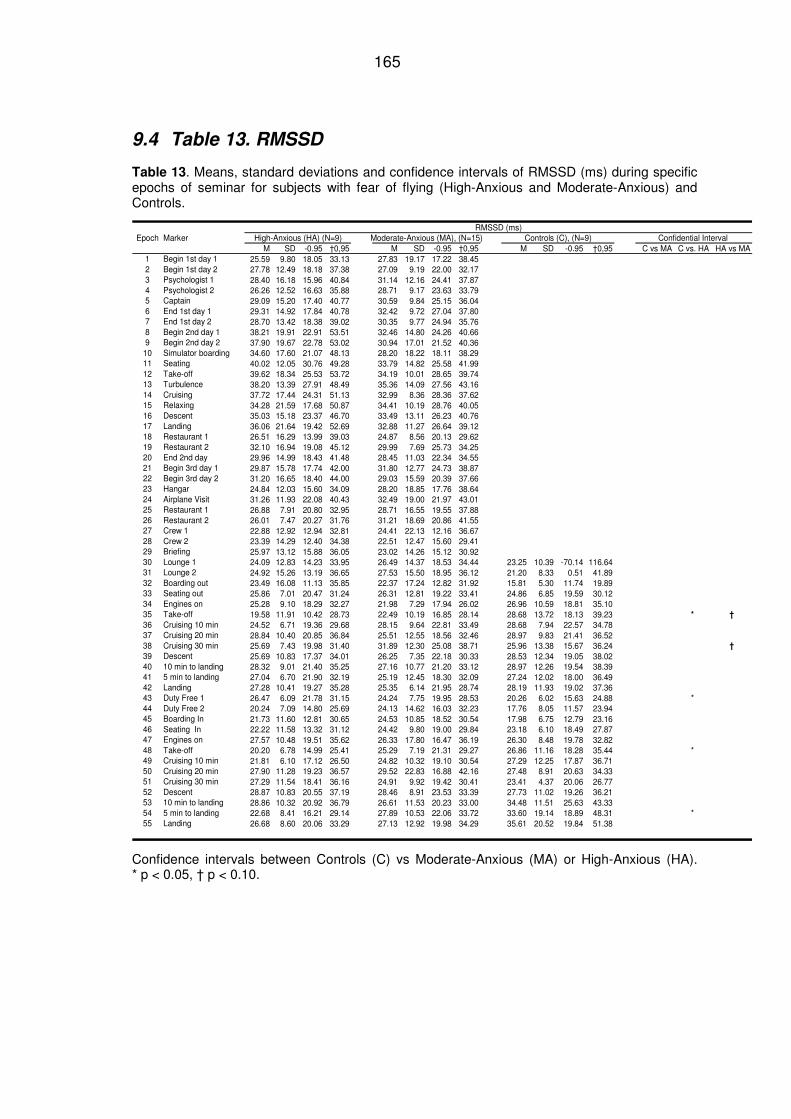
165
9.4 Table 13. RMSSD
Table 13. Means, standard deviations and confidence intervals of RMSSD (ms) during specific epochs of seminar for subjects with fear of flying (High-Anxious and Moderate-Anxious) and Controls.
RMSSD (ms)Epoch Marker High-Anxious (HA) (N=9) Moderate-Anxious (MA), (N=15) Controls (C), (N=9) Confidential Interval
M SD -0.95 †0,95 M SD -0.95 †0,95 M SD -0.95 †0,95 C vs MA C vs. HA HA vs MA1 Begin 1st day 1 25.59 9.80 18.05 33.13 27.83 19.17 17.22 38.452 Begin 1st day 2 27.78 12.49 18.18 37.38 27.09 9.19 22.00 32.173 Psychologist 1 28.40 16.18 15.96 40.84 31.14 12.16 24.41 37.874 Psychologist 2 26.26 12.52 16.63 35.88 28.71 9.17 23.63 33.795 Captain 29.09 15.20 17.40 40.77 30.59 9.84 25.15 36.046 End 1st day 1 29.31 14.92 17.84 40.78 32.42 9.72 27.04 37.807 End 1st day 2 28.70 13.42 18.38 39.02 30.35 9.77 24.94 35.768 Begin 2nd day 1 38.21 19.91 22.91 53.51 32.46 14.80 24.26 40.669 Begin 2nd day 2 37.90 19.67 22.78 53.02 30.94 17.01 21.52 40.36
10 Simulator boarding 34.60 17.60 21.07 48.13 28.20 18.22 18.11 38.2911 Seating 40.02 12.05 30.76 49.28 33.79 14.82 25.58 41.9912 Take-off 39.62 18.34 25.53 53.72 34.19 10.01 28.65 39.7413 Turbulence 38.20 13.39 27.91 48.49 35.36 14.09 27.56 43.1614 Cruising 37.72 17.44 24.31 51.13 32.99 8.36 28.36 37.6215 Relaxing 34.28 21.59 17.68 50.87 34.41 10.19 28.76 40.0516 Descent 35.03 15.18 23.37 46.70 33.49 13.11 26.23 40.7617 Landing 36.06 21.64 19.42 52.69 32.88 11.27 26.64 39.1218 Restaurant 1 26.51 16.29 13.99 39.03 24.87 8.56 20.13 29.6219 Restaurant 2 32.10 16.94 19.08 45.12 29.99 7.69 25.73 34.2520 End 2nd day 29.96 14.99 18.43 41.48 28.45 11.03 22.34 34.5521 Begin 3rd day 1 29.87 15.78 17.74 42.00 31.80 12.77 24.73 38.8722 Begin 3rd day 2 31.20 16.65 18.40 44.00 29.03 15.59 20.39 37.6623 Hangar 24.84 12.03 15.60 34.09 28.20 18.85 17.76 38.6424 Airplane Visit 31.26 11.93 22.08 40.43 32.49 19.00 21.97 43.0125 Restaurant 1 26.88 7.91 20.80 32.95 28.71 16.55 19.55 37.8826 Restaurant 2 26.01 7.47 20.27 31.76 31.21 18.69 20.86 41.5527 Crew 1 22.88 12.92 12.94 32.81 24.41 22.13 12.16 36.6728 Crew 2 23.39 14.29 12.40 34.38 22.51 12.47 15.60 29.4129 Briefing 25.97 13.12 15.88 36.05 23.02 14.26 15.12 30.9230 Lounge 1 24.09 12.83 14.23 33.95 26.49 14.37 18.53 34.44 23.25 10.39 -70.14 116.6431 Lounge 2 24.92 15.26 13.19 36.65 27.53 15.50 18.95 36.12 21.20 8.33 0.51 41.8932 Boarding out 23.49 16.08 11.13 35.85 22.37 17.24 12.82 31.92 15.81 5.30 11.74 19.8933 Seating out 25.86 7.01 20.47 31.24 26.31 12.81 19.22 33.41 24.86 6.85 19.59 30.1234 Engines on 25.28 9.10 18.29 32.27 21.98 7.29 17.94 26.02 26.96 10.59 18.81 35.1035 Take-off 19.58 11.91 10.42 28.73 22.49 10.19 16.85 28.14 28.68 13.72 18.13 39.23 * †
36 Cruising 10 min 24.52 6.71 19.36 29.68 28.15 9.64 22.81 33.49 28.68 7.94 22.57 34.7837 Cruising 20 min 28.84 10.40 20.85 36.84 25.51 12.55 18.56 32.46 28.97 9.83 21.41 36.5238 Cruising 30 min 25.69 7.43 19.98 31.40 31.89 12.30 25.08 38.71 25.96 13.38 15.67 36.24 †
39 Descent 25.69 10.83 17.37 34.01 26.25 7.35 22.18 30.33 28.53 12.34 19.05 38.0240 10 min to landing 28.32 9.01 21.40 35.25 27.16 10.77 21.20 33.12 28.97 12.26 19.54 38.3941 5 min to landing 27.04 6.70 21.90 32.19 25.19 12.45 18.30 32.09 27.24 12.02 18.00 36.4942 Landing 27.28 10.41 19.27 35.28 25.35 6.14 21.95 28.74 28.19 11.93 19.02 37.3643 Duty Free 1 26.47 6.09 21.78 31.15 24.24 7.75 19.95 28.53 20.26 6.02 15.63 24.88 *44 Duty Free 2 20.24 7.09 14.80 25.69 24.13 14.62 16.03 32.23 17.76 8.05 11.57 23.9445 Boarding In 21.73 11.60 12.81 30.65 24.53 10.85 18.52 30.54 17.98 6.75 12.79 23.1646 Seating In 22.22 11.58 13.32 31.12 24.42 9.80 19.00 29.84 23.18 6.10 18.49 27.8747 Engines on 27.57 10.48 19.51 35.62 26.33 17.80 16.47 36.19 26.30 8.48 19.78 32.8248 Take-off 20.20 6.78 14.99 25.41 25.29 7.19 21.31 29.27 26.86 11.16 18.28 35.44 *49 Cruising 10 min 21.81 6.10 17.12 26.50 24.82 10.32 19.10 30.54 27.29 12.25 17.87 36.7150 Cruising 20 min 27.90 11.28 19.23 36.57 29.52 22.83 16.88 42.16 27.48 8.91 20.63 34.3351 Cruising 30 min 27.29 11.54 18.41 36.16 24.91 9.92 19.42 30.41 23.41 4.37 20.06 26.7752 Descent 28.87 10.83 20.55 37.19 28.46 8.91 23.53 33.39 27.73 11.02 19.26 36.2153 10 min to landing 28.86 10.32 20.92 36.79 26.61 11.53 20.23 33.00 34.48 11.51 25.63 43.3354 5 min to landing 22.68 8.41 16.21 29.14 27.89 10.53 22.06 33.72 33.60 19.14 18.89 48.31 *55 Landing 26.68 8.60 20.06 33.29 27.13 12.92 19.98 34.29 35.61 20.52 19.84 51.38
Confidence intervals between Controls (C) vs Moderate-Anxious (MA) or High-Anxious (HA). * p < 0.05, † p < 0.10.
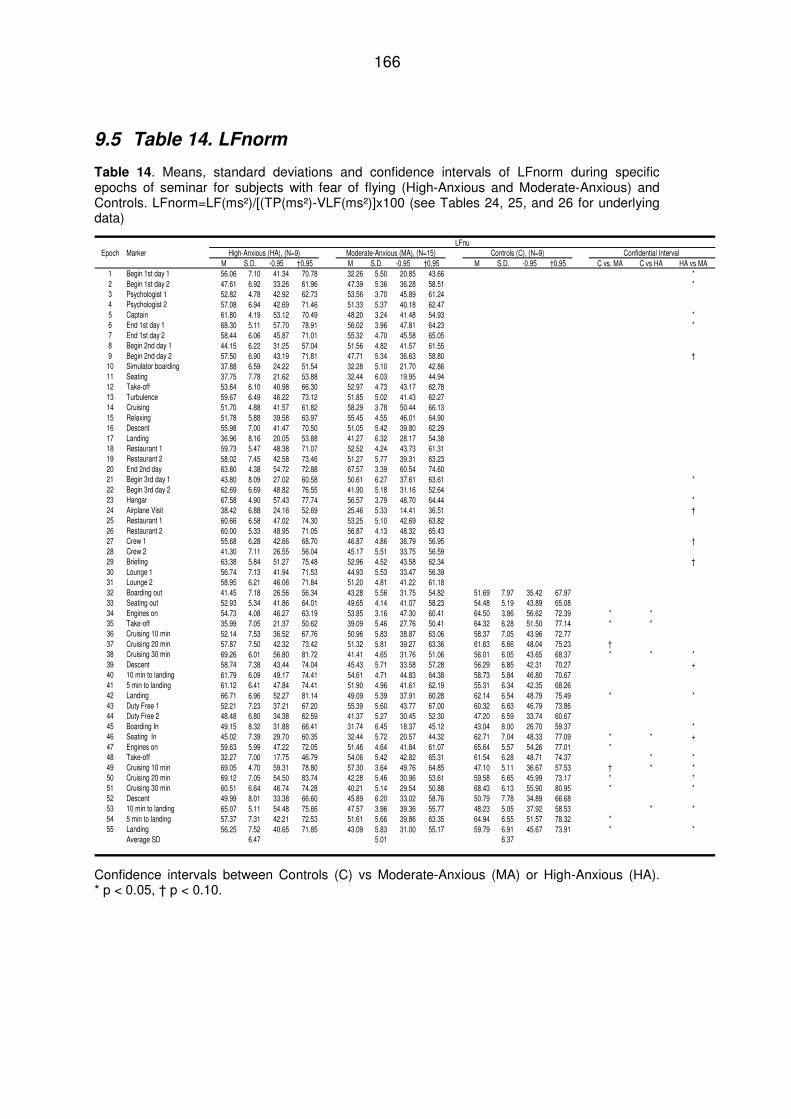
166
9.5 Table 14. LFnorm
Table 14. Means, standard deviations and confidence intervals of LFnorm during specific epochs of seminar for subjects with fear of flying (High-Anxious and Moderate-Anxious) and Controls. LFnorm=LF(ms²)/[(TP(ms²)-VLF(ms²)]x100 (see Tables 24, 25, and 26 for underlying data)
LFnuEpoch Marker High-Anxious (HA), (N=9) Moderate-Anxious (MA), (N=15) Controls (C), (N=9) Confidential Interval
M S.D. -0.95 †0,95 M S.D. -0.95 †0,95 M S.D. -0.95 †0,95 C vs. MA C vs HA HA vs MA1 Begin 1st day 1 56.06 7.10 41.34 70.78 32.26 5.50 20.85 43.66 *2 Begin 1st day 2 47.61 6.92 33.26 61.96 47.39 5.36 36.28 58.51 *3 Psychologist 1 52.82 4.78 42.92 62.73 53.56 3.70 45.89 61.244 Psychologist 2 57.08 6.94 42.69 71.46 51.33 5.37 40.18 62.475 Captain 61.80 4.19 53.12 70.49 48.20 3.24 41.48 54.93 *6 End 1st day 1 68.30 5.11 57.70 78.91 56.02 3.96 47.81 64.23 *7 End 1st day 2 58.44 6.06 45.87 71.01 55.32 4.70 45.58 65.058 Begin 2nd day 1 44.15 6.22 31.25 57.04 51.56 4.82 41.57 61.559 Begin 2nd day 2 57.50 6.90 43.19 71.81 47.71 5.34 36.63 58.80 †10 Simulator boarding 37.88 6.59 24.22 51.54 32.28 5.10 21.70 42.8611 Seating 37.75 7.78 21.62 53.88 32.44 6.03 19.95 44.9412 Take-off 53.64 6.10 40.98 66.30 52.97 4.73 43.17 62.7813 Turbulence 59.67 6.49 46.22 73.12 51.85 5.02 41.43 62.2714 Cruising 51.70 4.88 41.57 61.82 58.29 3.78 50.44 66.1315 Relaxing 51.78 5.88 39.58 63.97 55.45 4.55 46.01 64.9016 Descent 55.98 7.00 41.47 70.50 51.05 5.42 39.80 62.2917 Landing 36.96 8.16 20.05 53.88 41.27 6.32 28.17 54.3818 Restaurant 1 59.73 5.47 48.38 71.07 52.52 4.24 43.73 61.3119 Restaurant 2 58.02 7.45 42.58 73.46 51.27 5.77 39.31 63.2320 End 2nd day 63.80 4.38 54.72 72.88 67.57 3.39 60.54 74.6021 Begin 3rd day 1 43.80 8.09 27.02 60.58 50.61 6.27 37.61 63.61 *22 Begin 3rd day 2 62.69 6.69 48.82 76.55 41.90 5.18 31.16 52.6423 Hangar 67.58 4.90 57.43 77.74 56.57 3.79 48.70 64.44 *24 Airplane Visit 38.42 6.88 24.16 52.69 25.46 5.33 14.41 36.51 †25 Restaurant 1 60.66 6.58 47.02 74.30 53.25 5.10 42.69 63.8226 Restaurant 2 60.00 5.33 48.95 71.05 56.87 4.13 48.32 65.4327 Crew 1 55.68 6.28 42.66 68.70 46.87 4.86 36.79 56.95 †28 Crew 2 41.30 7.11 26.55 56.04 45.17 5.51 33.75 56.5929 Briefing 63.38 5.84 51.27 75.48 52.96 4.52 43.58 62.34 †30 Lounge 1 56.74 7.13 41.94 71.53 44.93 5.53 33.47 56.3931 Lounge 2 58.95 6.21 46.06 71.84 51.20 4.81 41.22 61.1832 Boarding out 41.45 7.18 26.56 56.34 43.28 5.56 31.75 54.82 51.69 7.97 35.42 67.9733 Seating out 52.93 5.34 41.86 64.01 49.65 4.14 41.07 58.23 54.48 5.19 43.89 65.0834 Engines on 54.73 4.08 46.27 63.19 53.85 3.16 47.30 60.41 64.50 3.86 56.62 72.39 * *35 Take-off 35.99 7.05 21.37 50.62 39.09 5.46 27.76 50.41 64.32 6.28 51.50 77.14 * *36 Cruising 10 min 52.14 7.53 36.52 67.76 50.96 5.83 38.87 63.06 58.37 7.05 43.96 72.7737 Cruising 20 min 57.87 7.50 42.32 73.42 51.32 5.81 39.27 63.36 61.63 6.66 48.04 75.23 †38 Cruising 30 min 69.26 6.01 56.80 81.72 41.41 4.65 31.76 51.06 56.01 6.05 43.65 68.37 * * *39 Descent 58.74 7.38 43.44 74.04 45.43 5.71 33.58 57.28 56.29 6.85 42.31 70.27 +40 10 min to landing 61.79 6.09 49.17 74.41 54.61 4.71 44.83 64.38 58.73 5.84 46.80 70.6741 5 min to landing 61.12 6.41 47.84 74.41 51.90 4.96 41.61 62.19 55.31 6.34 42.35 68.2642 Landing 66.71 6.96 52.27 81.14 49.09 5.39 37.91 60.28 62.14 6.54 48.79 75.49 * *43 Duty Free 1 52.21 7.23 37.21 67.20 55.39 5.60 43.77 67.00 60.32 6.63 46.79 73.8644 Duty Free 2 48.48 6.80 34.38 62.59 41.37 5.27 30.45 52.30 47.20 6.59 33.74 60.6745 Boarding In 49.15 8.32 31.88 66.41 31.74 6.45 18.37 45.12 43.04 8.00 26.70 59.37 *46 Seating In 45.02 7.39 29.70 60.35 32.44 5.72 20.57 44.32 62.71 7.04 48.33 77.09 * * +47 Engines on 59.63 5.99 47.22 72.05 51.46 4.64 41.84 61.07 65.64 5.57 54.26 77.01 *48 Take-off 32.27 7.00 17.75 46.79 54.06 5.42 42.82 65.31 61.54 6.28 48.71 74.37 * *49 Cruising 10 min 69.05 4.70 59.31 78.80 57.30 3.64 49.76 64.85 47.10 5.11 36.67 57.53 † * *50 Cruising 20 min 69.12 7.05 54.50 83.74 42.28 5.46 30.96 53.61 59.58 6.65 45.99 73.17 * *51 Cruising 30 min 60.51 6.64 46.74 74.28 40.21 5.14 29.54 50.88 68.43 6.13 55.90 80.95 * *52 Descent 49.99 8.01 33.38 66.60 45.89 6.20 33.02 58.76 50.79 7.78 34.89 66.6853 10 min to landing 65.07 5.11 54.48 75.66 47.57 3.96 39.36 55.77 48.23 5.05 37.92 58.53 * *54 5 min to landing 57.37 7.31 42.21 72.53 51.61 5.66 39.86 63.35 64.94 6.55 51.57 78.32 *55 Landing 56.25 7.52 40.65 71.85 43.09 5.83 31.00 55.17 59.79 6.91 45.67 73.91 * *
Average SD 6.47 5.01 6.37
Confidence intervals between Controls (C) vs Moderate-Anxious (MA) or High-Anxious (HA). * p < 0.05, † p < 0.10.
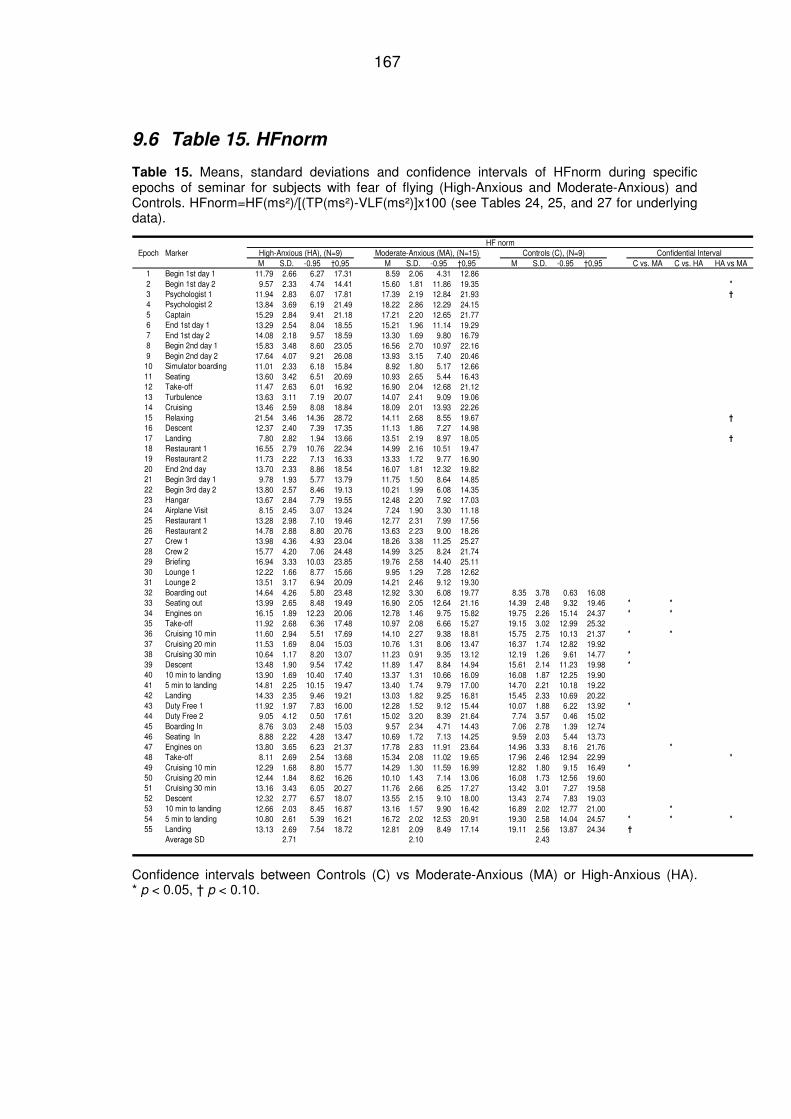
167
9.6 Table 15. HFnorm
Table 15. Means, standard deviations and confidence intervals of HFnorm during specific epochs of seminar for subjects with fear of flying (High-Anxious and Moderate-Anxious) and Controls. HFnorm=HF(ms²)/[(TP(ms²)-VLF(ms²)]x100 (see Tables 24, 25, and 27 for underlying data).
HF normEpoch Marker High-Anxious (HA), (N=9) Moderate-Anxious (MA), (N=15) Controls (C), (N=9) Confidential Interval
M S.D. -0.95 †0,95 M S.D. -0.95 †0,95 M S.D. -0.95 †0,95 C vs. MA C vs. HA HA vs MA1 Begin 1st day 1 11.79 2.66 6.27 17.31 8.59 2.06 4.31 12.862 Begin 1st day 2 9.57 2.33 4.74 14.41 15.60 1.81 11.86 19.35 *
3 Psychologist 1 11.94 2.83 6.07 17.81 17.39 2.19 12.84 21.93 †
4 Psychologist 2 13.84 3.69 6.19 21.49 18.22 2.86 12.29 24.155 Captain 15.29 2.84 9.41 21.18 17.21 2.20 12.65 21.776 End 1st day 1 13.29 2.54 8.04 18.55 15.21 1.96 11.14 19.297 End 1st day 2 14.08 2.18 9.57 18.59 13.30 1.69 9.80 16.798 Begin 2nd day 1 15.83 3.48 8.60 23.05 16.56 2.70 10.97 22.169 Begin 2nd day 2 17.64 4.07 9.21 26.08 13.93 3.15 7.40 20.46
10 Simulator boarding 11.01 2.33 6.18 15.84 8.92 1.80 5.17 12.6611 Seating 13.60 3.42 6.51 20.69 10.93 2.65 5.44 16.4312 Take-off 11.47 2.63 6.01 16.92 16.90 2.04 12.68 21.1213 Turbulence 13.63 3.11 7.19 20.07 14.07 2.41 9.09 19.0614 Cruising 13.46 2.59 8.08 18.84 18.09 2.01 13.93 22.2615 Relaxing 21.54 3.46 14.36 28.72 14.11 2.68 8.55 19.67 †
16 Descent 12.37 2.40 7.39 17.35 11.13 1.86 7.27 14.9817 Landing 7.80 2.82 1.94 13.66 13.51 2.19 8.97 18.05 †
18 Restaurant 1 16.55 2.79 10.76 22.34 14.99 2.16 10.51 19.4719 Restaurant 2 11.73 2.22 7.13 16.33 13.33 1.72 9.77 16.9020 End 2nd day 13.70 2.33 8.86 18.54 16.07 1.81 12.32 19.8221 Begin 3rd day 1 9.78 1.93 5.77 13.79 11.75 1.50 8.64 14.8522 Begin 3rd day 2 13.80 2.57 8.46 19.13 10.21 1.99 6.08 14.3523 Hangar 13.67 2.84 7.79 19.55 12.48 2.20 7.92 17.0324 Airplane Visit 8.15 2.45 3.07 13.24 7.24 1.90 3.30 11.1825 Restaurant 1 13.28 2.98 7.10 19.46 12.77 2.31 7.99 17.5626 Restaurant 2 14.78 2.88 8.80 20.76 13.63 2.23 9.00 18.2627 Crew 1 13.98 4.36 4.93 23.04 18.26 3.38 11.25 25.2728 Crew 2 15.77 4.20 7.06 24.48 14.99 3.25 8.24 21.7429 Briefing 16.94 3.33 10.03 23.85 19.76 2.58 14.40 25.1130 Lounge 1 12.22 1.66 8.77 15.66 9.95 1.29 7.28 12.6231 Lounge 2 13.51 3.17 6.94 20.09 14.21 2.46 9.12 19.3032 Boarding out 14.64 4.26 5.80 23.48 12.92 3.30 6.08 19.77 8.35 3.78 0.63 16.0833 Seating out 13.99 2.65 8.48 19.49 16.90 2.05 12.64 21.16 14.39 2.48 9.32 19.46 * *
34 Engines on 16.15 1.89 12.23 20.06 12.78 1.46 9.75 15.82 19.75 2.26 15.14 24.37 * *
35 Take-off 11.92 2.68 6.36 17.48 10.97 2.08 6.66 15.27 19.15 3.02 12.99 25.3236 Cruising 10 min 11.60 2.94 5.51 17.69 14.10 2.27 9.38 18.81 15.75 2.75 10.13 21.37 * *
37 Cruising 20 min 11.53 1.69 8.04 15.03 10.76 1.31 8.06 13.47 16.37 1.74 12.82 19.9238 Cruising 30 min 10.64 1.17 8.20 13.07 11.23 0.91 9.35 13.12 12.19 1.26 9.61 14.77 *
39 Descent 13.48 1.90 9.54 17.42 11.89 1.47 8.84 14.94 15.61 2.14 11.23 19.98 *
40 10 min to landing 13.90 1.69 10.40 17.40 13.37 1.31 10.66 16.09 16.08 1.87 12.25 19.9041 5 min to landing 14.81 2.25 10.15 19.47 13.40 1.74 9.79 17.00 14.70 2.21 10.18 19.2242 Landing 14.33 2.35 9.46 19.21 13.03 1.82 9.25 16.81 15.45 2.33 10.69 20.2243 Duty Free 1 11.92 1.97 7.83 16.00 12.28 1.52 9.12 15.44 10.07 1.88 6.22 13.92 *
44 Duty Free 2 9.05 4.12 0.50 17.61 15.02 3.20 8.39 21.64 7.74 3.57 0.46 15.0245 Boarding In 8.76 3.03 2.48 15.03 9.57 2.34 4.71 14.43 7.06 2.78 1.39 12.7446 Seating In 8.88 2.22 4.28 13.47 10.69 1.72 7.13 14.25 9.59 2.03 5.44 13.7347 Engines on 13.80 3.65 6.23 21.37 17.78 2.83 11.91 23.64 14.96 3.33 8.16 21.76 *
48 Take-off 8.11 2.69 2.54 13.68 15.34 2.08 11.02 19.65 17.96 2.46 12.94 22.99 *
49 Cruising 10 min 12.29 1.68 8.80 15.77 14.29 1.30 11.59 16.99 12.82 1.80 9.15 16.49 *
50 Cruising 20 min 12.44 1.84 8.62 16.26 10.10 1.43 7.14 13.06 16.08 1.73 12.56 19.6051 Cruising 30 min 13.16 3.43 6.05 20.27 11.76 2.66 6.25 17.27 13.42 3.01 7.27 19.5852 Descent 12.32 2.77 6.57 18.07 13.55 2.15 9.10 18.00 13.43 2.74 7.83 19.0353 10 min to landing 12.66 2.03 8.45 16.87 13.16 1.57 9.90 16.42 16.89 2.02 12.77 21.00 *
54 5 min to landing 10.80 2.61 5.39 16.21 16.72 2.02 12.53 20.91 19.30 2.58 14.04 24.57 * * *
55 Landing 13.13 2.69 7.54 18.72 12.81 2.09 8.49 17.14 19.11 2.56 13.87 24.34 †
Average SD 2.71 2.10 2.43
Confidence intervals between Controls (C) vs Moderate-Anxious (MA) or High-Anxious (HA). * p < 0.05, † p < 0.10.
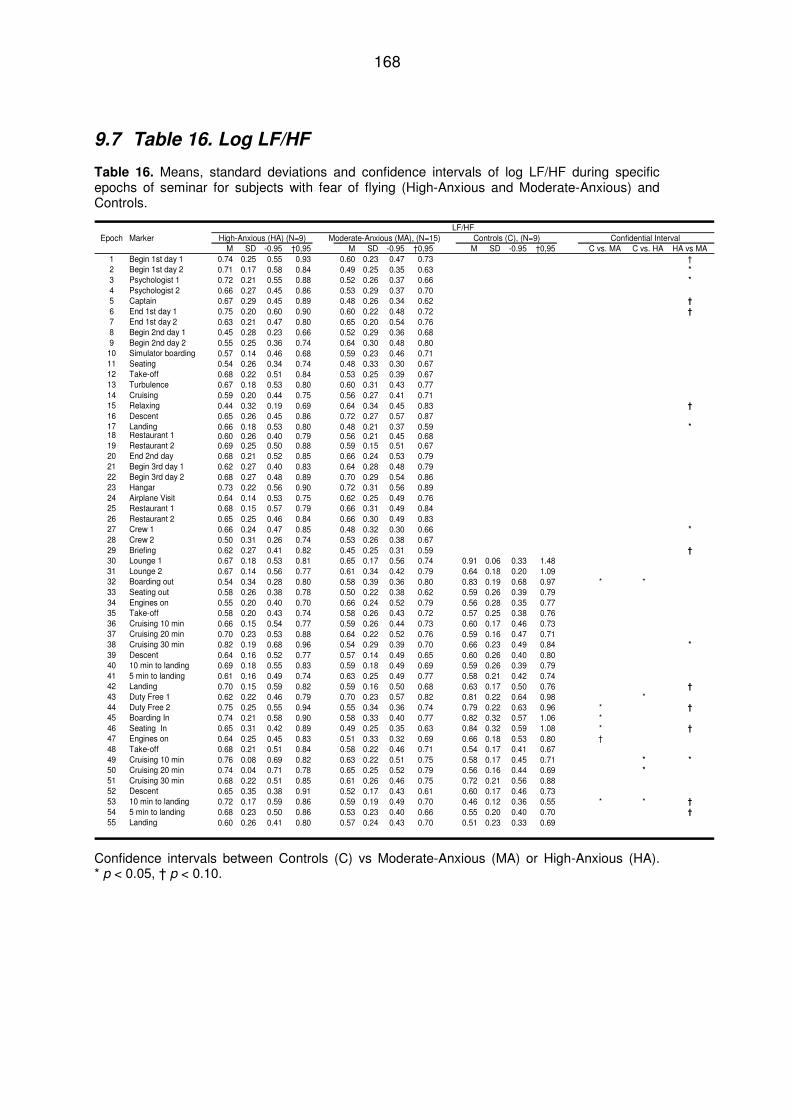
168
9.7 Table 16. Log LF/HF
Table 16. Means, standard deviations and confidence intervals of log LF/HF during specific epochs of seminar for subjects with fear of flying (High-Anxious and Moderate-Anxious) and Controls.
LF/HFEpoch Marker High-Anxious (HA) (N=9) Moderate-Anxious (MA), (N=15) Controls (C), (N=9) Confidential Interval
M SD -0.95 †0,95 M SD -0.95 †0,95 M SD -0.95 †0,95 C vs. MA C vs. HA HA vs MA1 Begin 1st day 1 0.74 0.25 0.55 0.93 0.60 0.23 0.47 0.73 †2 Begin 1st day 2 0.71 0.17 0.58 0.84 0.49 0.25 0.35 0.63 *
3 Psychologist 1 0.72 0.21 0.55 0.88 0.52 0.26 0.37 0.66 *
4 Psychologist 2 0.66 0.27 0.45 0.86 0.53 0.29 0.37 0.705 Captain 0.67 0.29 0.45 0.89 0.48 0.26 0.34 0.62 †
6 End 1st day 1 0.75 0.20 0.60 0.90 0.60 0.22 0.48 0.72 †
7 End 1st day 2 0.63 0.21 0.47 0.80 0.65 0.20 0.54 0.768 Begin 2nd day 1 0.45 0.28 0.23 0.66 0.52 0.29 0.36 0.689 Begin 2nd day 2 0.55 0.25 0.36 0.74 0.64 0.30 0.48 0.80
10 Simulator boarding 0.57 0.14 0.46 0.68 0.59 0.23 0.46 0.7111 Seating 0.54 0.26 0.34 0.74 0.48 0.33 0.30 0.6712 Take-off 0.68 0.22 0.51 0.84 0.53 0.25 0.39 0.6713 Turbulence 0.67 0.18 0.53 0.80 0.60 0.31 0.43 0.7714 Cruising 0.59 0.20 0.44 0.75 0.56 0.27 0.41 0.7115 Relaxing 0.44 0.32 0.19 0.69 0.64 0.34 0.45 0.83 †
16 Descent 0.65 0.26 0.45 0.86 0.72 0.27 0.57 0.8717 Landing 0.66 0.18 0.53 0.80 0.48 0.21 0.37 0.59 *18 Restaurant 1 0.60 0.26 0.40 0.79 0.56 0.21 0.45 0.6819 Restaurant 2 0.69 0.25 0.50 0.88 0.59 0.15 0.51 0.6720 End 2nd day 0.68 0.21 0.52 0.85 0.66 0.24 0.53 0.7921 Begin 3rd day 1 0.62 0.27 0.40 0.83 0.64 0.28 0.48 0.7922 Begin 3rd day 2 0.68 0.27 0.48 0.89 0.70 0.29 0.54 0.8623 Hangar 0.73 0.22 0.56 0.90 0.72 0.31 0.56 0.8924 Airplane Visit 0.64 0.14 0.53 0.75 0.62 0.25 0.49 0.7625 Restaurant 1 0.68 0.15 0.57 0.79 0.66 0.31 0.49 0.8426 Restaurant 2 0.65 0.25 0.46 0.84 0.66 0.30 0.49 0.8327 Crew 1 0.66 0.24 0.47 0.85 0.48 0.32 0.30 0.66 *
28 Crew 2 0.50 0.31 0.26 0.74 0.53 0.26 0.38 0.6729 Briefing 0.62 0.27 0.41 0.82 0.45 0.25 0.31 0.59 †
30 Lounge 1 0.67 0.18 0.53 0.81 0.65 0.17 0.56 0.74 0.91 0.06 0.33 1.4831 Lounge 2 0.67 0.14 0.56 0.77 0.61 0.34 0.42 0.79 0.64 0.18 0.20 1.0932 Boarding out 0.54 0.34 0.28 0.80 0.58 0.39 0.36 0.80 0.83 0.19 0.68 0.97 * *33 Seating out 0.58 0.26 0.38 0.78 0.50 0.22 0.38 0.62 0.59 0.26 0.39 0.7934 Engines on 0.55 0.20 0.40 0.70 0.66 0.24 0.52 0.79 0.56 0.28 0.35 0.7735 Take-off 0.58 0.20 0.43 0.74 0.58 0.26 0.43 0.72 0.57 0.25 0.38 0.7636 Cruising 10 min 0.66 0.15 0.54 0.77 0.59 0.26 0.44 0.73 0.60 0.17 0.46 0.7337 Cruising 20 min 0.70 0.23 0.53 0.88 0.64 0.22 0.52 0.76 0.59 0.16 0.47 0.7138 Cruising 30 min 0.82 0.19 0.68 0.96 0.54 0.29 0.39 0.70 0.66 0.23 0.49 0.84 *
39 Descent 0.64 0.16 0.52 0.77 0.57 0.14 0.49 0.65 0.60 0.26 0.40 0.8040 10 min to landing 0.69 0.18 0.55 0.83 0.59 0.18 0.49 0.69 0.59 0.26 0.39 0.7941 5 min to landing 0.61 0.16 0.49 0.74 0.63 0.25 0.49 0.77 0.58 0.21 0.42 0.7442 Landing 0.70 0.15 0.59 0.82 0.59 0.16 0.50 0.68 0.63 0.17 0.50 0.76 †
43 Duty Free 1 0.62 0.22 0.46 0.79 0.70 0.23 0.57 0.82 0.81 0.22 0.64 0.98 *44 Duty Free 2 0.75 0.25 0.55 0.94 0.55 0.34 0.36 0.74 0.79 0.22 0.63 0.96 * †
45 Boarding In 0.74 0.21 0.58 0.90 0.58 0.33 0.40 0.77 0.82 0.32 0.57 1.06 *46 Seating In 0.65 0.31 0.42 0.89 0.49 0.25 0.35 0.63 0.84 0.32 0.59 1.08 * †
47 Engines on 0.64 0.25 0.45 0.83 0.51 0.33 0.32 0.69 0.66 0.18 0.53 0.80 †48 Take-off 0.68 0.21 0.51 0.84 0.58 0.22 0.46 0.71 0.54 0.17 0.41 0.6749 Cruising 10 min 0.76 0.08 0.69 0.82 0.63 0.22 0.51 0.75 0.58 0.17 0.45 0.71 * *
50 Cruising 20 min 0.74 0.04 0.71 0.78 0.65 0.25 0.52 0.79 0.56 0.16 0.44 0.69 *
51 Cruising 30 min 0.68 0.22 0.51 0.85 0.61 0.26 0.46 0.75 0.72 0.21 0.56 0.8852 Descent 0.65 0.35 0.38 0.91 0.52 0.17 0.43 0.61 0.60 0.17 0.46 0.7353 10 min to landing 0.72 0.17 0.59 0.86 0.59 0.19 0.49 0.70 0.46 0.12 0.36 0.55 * * †
54 5 min to landing 0.68 0.23 0.50 0.86 0.53 0.23 0.40 0.66 0.55 0.20 0.40 0.70 †
55 Landing 0.60 0.26 0.41 0.80 0.57 0.24 0.43 0.70 0.51 0.23 0.33 0.69
Confidence intervals between Controls (C) vs Moderate-Anxious (MA) or High-Anxious (HA). * p < 0.05, † p < 0.10.
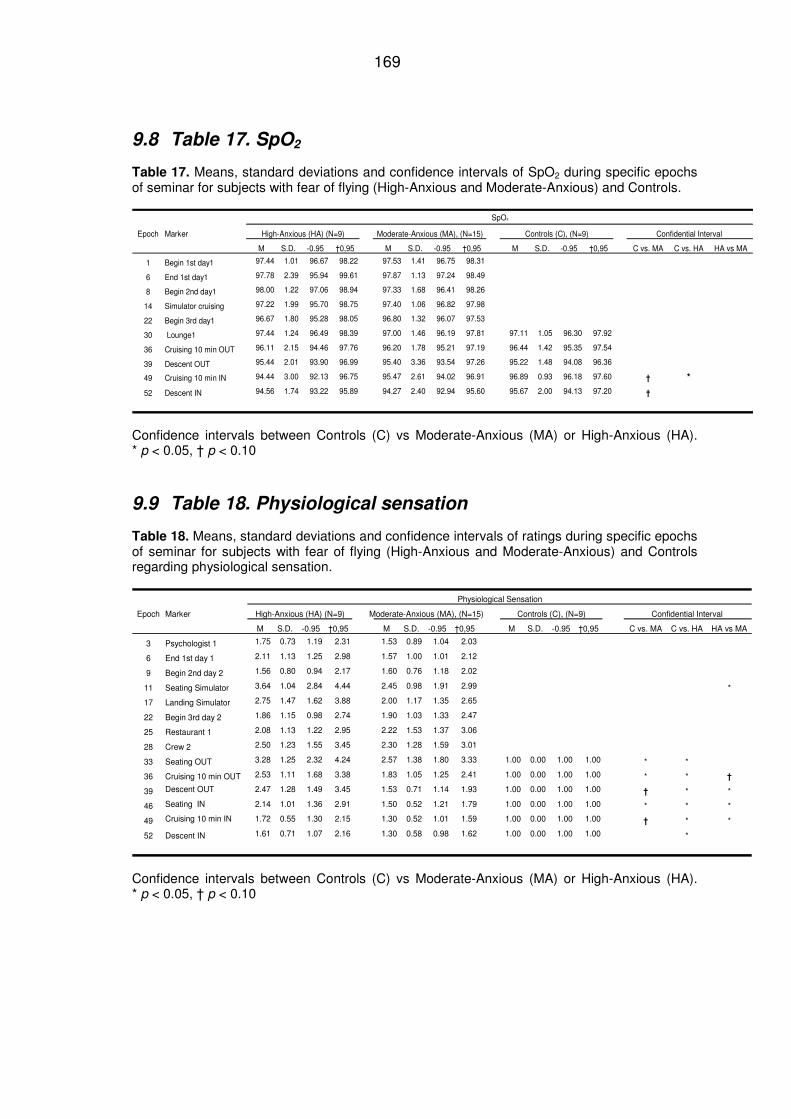
169
9.8 Table 17. SpO2
Table 17. Means, standard deviations and confidence intervals of SpO2 during specific epochs of seminar for subjects with fear of flying (High-Anxious and Moderate-Anxious) and Controls.
SpO²
Epoch Marker High-Anxious (HA) (N=9) Moderate-Anxious (MA), (N=15) Controls (C), (N=9) Confidential Interval
M S.D. -0.95 †0,95 M S.D. -0.95 †0,95 M S.D. -0.95 †0,95 C vs. MA C vs. HA HA vs MA
1 Begin 1st day1 97.44 1.01 96.67 98.22 97.53 1.41 96.75 98.31
6 End 1st day1 97.78 2.39 95.94 99.61 97.87 1.13 97.24 98.49
8 Begin 2nd day1 98.00 1.22 97.06 98.94 97.33 1.68 96.41 98.26
14 Simulator cruising 97.22 1.99 95.70 98.75 97.40 1.06 96.82 97.98
22 Begin 3rd day1 96.67 1.80 95.28 98.05 96.80 1.32 96.07 97.53
30 Lounge1 97.44 1.24 96.49 98.39 97.00 1.46 96.19 97.81 97.11 1.05 96.30 97.92
36 Cruising 10 min OUT 96.11 2.15 94.46 97.76 96.20 1.78 95.21 97.19 96.44 1.42 95.35 97.54
39 Descent OUT 95.44 2.01 93.90 96.99 95.40 3.36 93.54 97.26 95.22 1.48 94.08 96.36
49 Cruising 10 min IN 94.44 3.00 92.13 96.75 95.47 2.61 94.02 96.91 96.89 0.93 96.18 97.60 † *
52 Descent IN 94.56 1.74 93.22 95.89 94.27 2.40 92.94 95.60 95.67 2.00 94.13 97.20 †
Confidence intervals between Controls (C) vs Moderate-Anxious (MA) or High-Anxious (HA). * p < 0.05, † p < 0.10
9.9 Table 18. Physiological sensation
Table 18. Means, standard deviations and confidence intervals of ratings during specific epochs of seminar for subjects with fear of flying (High-Anxious and Moderate-Anxious) and Controls regarding physiological sensation.
Physiological Sensation
Epoch Marker High-Anxious (HA) (N=9) Moderate-Anxious (MA), (N=15) Controls (C), (N=9) Confidential Interval
M S.D. -0.95 †0,95 M S.D. -0.95 †0,95 M S.D. -0.95 †0,95 C vs. MA C vs. HA HA vs MA
3 Psychologist 1 1.75 0.73 1.19 2.31 1.53 0.89 1.04 2.03
6 End 1st day 1 2.11 1.13 1.25 2.98 1.57 1.00 1.01 2.12
9 Begin 2nd day 2 1.56 0.80 0.94 2.17 1.60 0.76 1.18 2.02
11 Seating Simulator 3.64 1.04 2.84 4.44 2.45 0.98 1.91 2.99 *
17 Landing Simulator 2.75 1.47 1.62 3.88 2.00 1.17 1.35 2.65
22 Begin 3rd day 2 1.86 1.15 0.98 2.74 1.90 1.03 1.33 2.47
25 Restaurant 1 2.08 1.13 1.22 2.95 2.22 1.53 1.37 3.06
28 Crew 2 2.50 1.23 1.55 3.45 2.30 1.28 1.59 3.01
33 Seating OUT 3.28 1.25 2.32 4.24 2.57 1.38 1.80 3.33 1.00 0.00 1.00 1.00 * *
36 Cruising 10 min OUT 2.53 1.11 1.68 3.38 1.83 1.05 1.25 2.41 1.00 0.00 1.00 1.00 * * †
39 Descent OUT 2.47 1.28 1.49 3.45 1.53 0.71 1.14 1.93 1.00 0.00 1.00 1.00 † * *
46 Seating IN 2.14 1.01 1.36 2.91 1.50 0.52 1.21 1.79 1.00 0.00 1.00 1.00 * * *
49 Cruising 10 min IN 1.72 0.55 1.30 2.15 1.30 0.52 1.01 1.59 1.00 0.00 1.00 1.00 † * *
52 Descent IN 1.61 0.71 1.07 2.16 1.30 0.58 0.98 1.62 1.00 0.00 1.00 1.00 *
Confidence intervals between Controls (C) vs Moderate-Anxious (MA) or High-Anxious (HA). * p < 0.05, † p < 0.10
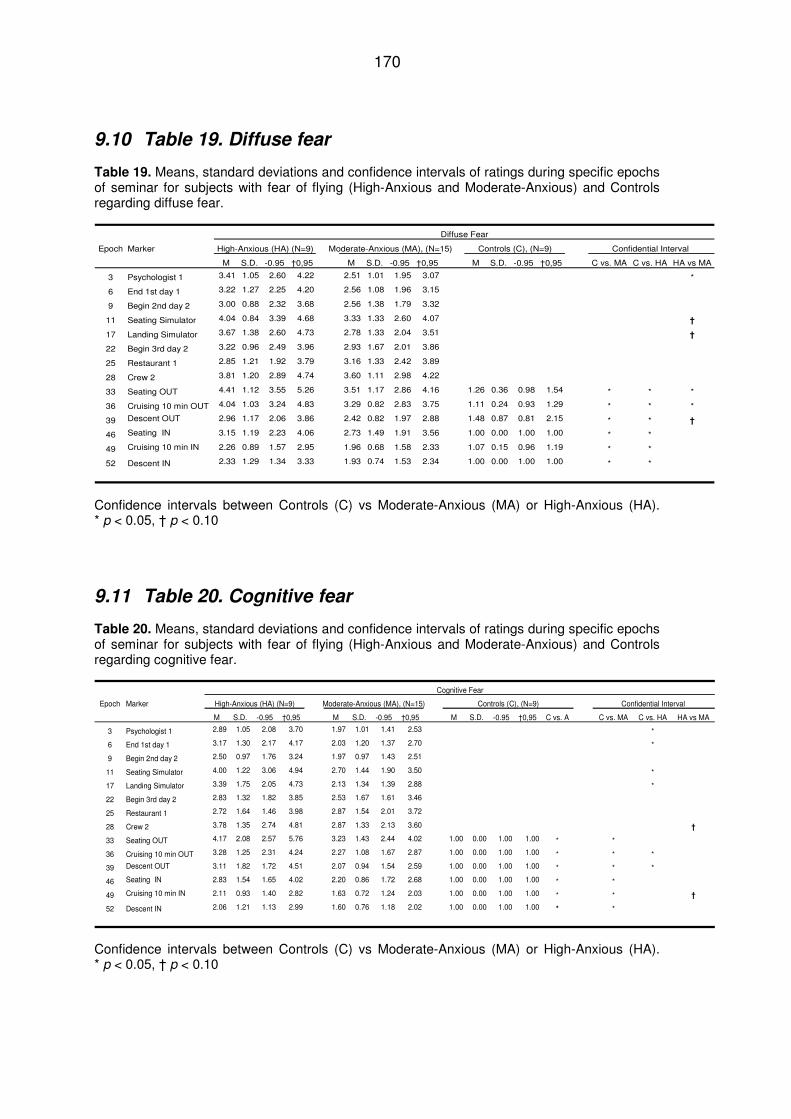
170
9.10 Table 19. Diffuse fear
Table 19. Means, standard deviations and confidence intervals of ratings during specific epochs of seminar for subjects with fear of flying (High-Anxious and Moderate-Anxious) and Controls regarding diffuse fear.
Diffuse Fear
Epoch Marker High-Anxious (HA) (N=9) Moderate-Anxious (MA), (N=15) Controls (C), (N=9) Confidential Interval
M S.D. -0.95 †0,95 M S.D. -0.95 †0,95 M S.D. -0.95 †0,95 C vs. MA C vs. HA HA vs MA
3 Psychologist 1 3.41 1.05 2.60 4.22 2.51 1.01 1.95 3.07 *
6 End 1st day 1 3.22 1.27 2.25 4.20 2.56 1.08 1.96 3.15
9 Begin 2nd day 2 3.00 0.88 2.32 3.68 2.56 1.38 1.79 3.32
11 Seating Simulator 4.04 0.84 3.39 4.68 3.33 1.33 2.60 4.07 †
17 Landing Simulator 3.67 1.38 2.60 4.73 2.78 1.33 2.04 3.51 †
22 Begin 3rd day 2 3.22 0.96 2.49 3.96 2.93 1.67 2.01 3.86
25 Restaurant 1 2.85 1.21 1.92 3.79 3.16 1.33 2.42 3.89
28 Crew 2 3.81 1.20 2.89 4.74 3.60 1.11 2.98 4.22
33 Seating OUT 4.41 1.12 3.55 5.26 3.51 1.17 2.86 4.16 1.26 0.36 0.98 1.54 * * *
36 Cruising 10 min OUT 4.04 1.03 3.24 4.83 3.29 0.82 2.83 3.75 1.11 0.24 0.93 1.29 * * *
39 Descent OUT 2.96 1.17 2.06 3.86 2.42 0.82 1.97 2.88 1.48 0.87 0.81 2.15 * * †
46 Seating IN 3.15 1.19 2.23 4.06 2.73 1.49 1.91 3.56 1.00 0.00 1.00 1.00 * *
49 Cruising 10 min IN 2.26 0.89 1.57 2.95 1.96 0.68 1.58 2.33 1.07 0.15 0.96 1.19 * *
52 Descent IN 2.33 1.29 1.34 3.33 1.93 0.74 1.53 2.34 1.00 0.00 1.00 1.00 * *
Confidence intervals between Controls (C) vs Moderate-Anxious (MA) or High-Anxious (HA). * p < 0.05, † p < 0.10
9.11 Table 20. Cognitive fear
Table 20. Means, standard deviations and confidence intervals of ratings during specific epochs of seminar for subjects with fear of flying (High-Anxious and Moderate-Anxious) and Controls regarding cognitive fear.
Cognitive Fear
Epoch Marker High-Anxious (HA) (N=9) Moderate-Anxious (MA), (N=15) Controls (C), (N=9) Confidential Interval
M S.D. -0.95 †0,95 M S.D. -0.95 †0,95 M S.D. -0.95 †0,95 C vs. A C vs. MA C vs. HA HA vs MA
3 Psychologist 1 2.89 1.05 2.08 3.70 1.97 1.01 1.41 2.53 *
6 End 1st day 1 3.17 1.30 2.17 4.17 2.03 1.20 1.37 2.70 *
9 Begin 2nd day 2 2.50 0.97 1.76 3.24 1.97 0.97 1.43 2.51
11 Seating Simulator 4.00 1.22 3.06 4.94 2.70 1.44 1.90 3.50 *
17 Landing Simulator 3.39 1.75 2.05 4.73 2.13 1.34 1.39 2.88 *
22 Begin 3rd day 2 2.83 1.32 1.82 3.85 2.53 1.67 1.61 3.46
25 Restaurant 1 2.72 1.64 1.46 3.98 2.87 1.54 2.01 3.72
28 Crew 2 3.78 1.35 2.74 4.81 2.87 1.33 2.13 3.60 †
33 Seating OUT 4.17 2.08 2.57 5.76 3.23 1.43 2.44 4.02 1.00 0.00 1.00 1.00 * *
36 Cruising 10 min OUT 3.28 1.25 2.31 4.24 2.27 1.08 1.67 2.87 1.00 0.00 1.00 1.00 * * *
39 Descent OUT 3.11 1.82 1.72 4.51 2.07 0.94 1.54 2.59 1.00 0.00 1.00 1.00 * * *
46 Seating IN 2.83 1.54 1.65 4.02 2.20 0.86 1.72 2.68 1.00 0.00 1.00 1.00 * *
49 Cruising 10 min IN 2.11 0.93 1.40 2.82 1.63 0.72 1.24 2.03 1.00 0.00 1.00 1.00 * * †
52 Descent IN 2.06 1.21 1.13 2.99 1.60 0.76 1.18 2.02 1.00 0.00 1.00 1.00 * *
Confidence intervals between Controls (C) vs Moderate-Anxious (MA) or High-Anxious (HA). * p < 0.05, † p < 0.10
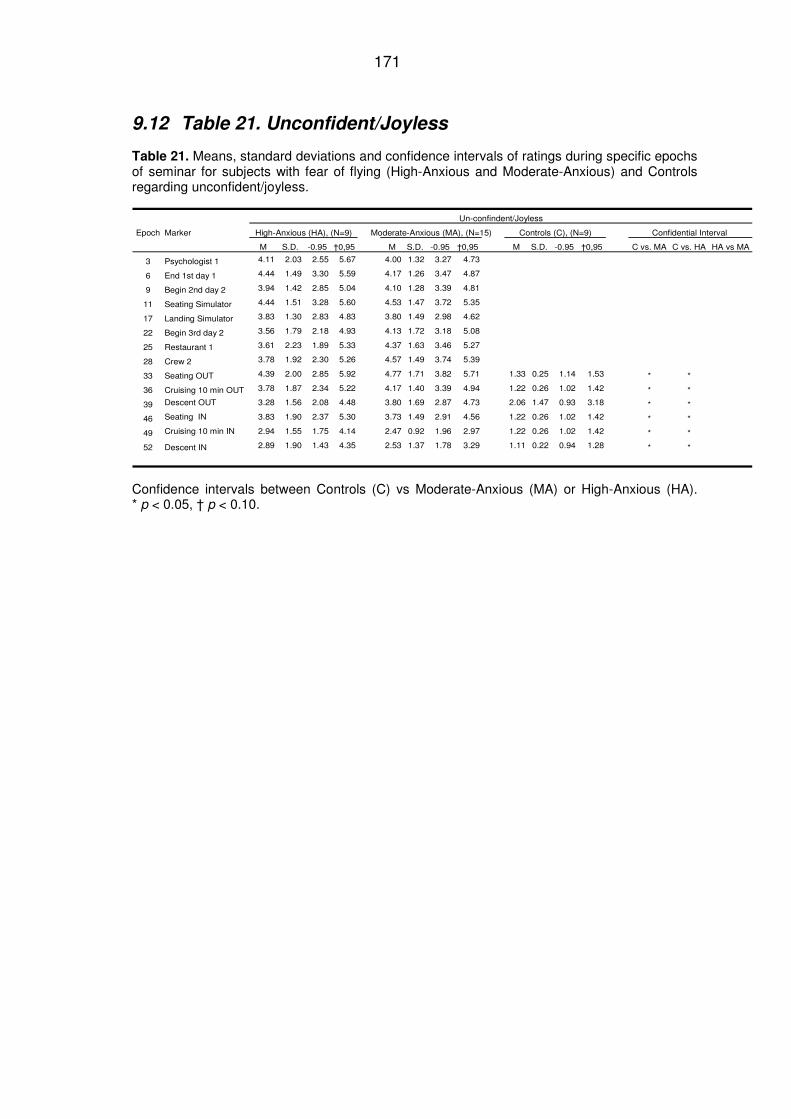
171
9.12 Table 21. Unconfident/Joyless
Table 21. Means, standard deviations and confidence intervals of ratings during specific epochs of seminar for subjects with fear of flying (High-Anxious and Moderate-Anxious) and Controls regarding unconfident/joyless.
Un-confindent/Joyless
Epoch Marker High-Anxious (HA), (N=9) Moderate-Anxious (MA), (N=15) Controls (C), (N=9) Confidential Interval
M S.D. -0.95 †0,95 M S.D. -0.95 †0,95 M S.D. -0.95 †0,95 C vs. MA C vs. HA HA vs MA
3 Psychologist 1 4.11 2.03 2.55 5.67 4.00 1.32 3.27 4.73
6 End 1st day 1 4.44 1.49 3.30 5.59 4.17 1.26 3.47 4.87
9 Begin 2nd day 2 3.94 1.42 2.85 5.04 4.10 1.28 3.39 4.81
11 Seating Simulator 4.44 1.51 3.28 5.60 4.53 1.47 3.72 5.35
17 Landing Simulator 3.83 1.30 2.83 4.83 3.80 1.49 2.98 4.62
22 Begin 3rd day 2 3.56 1.79 2.18 4.93 4.13 1.72 3.18 5.08
25 Restaurant 1 3.61 2.23 1.89 5.33 4.37 1.63 3.46 5.27
28 Crew 2 3.78 1.92 2.30 5.26 4.57 1.49 3.74 5.39
33 Seating OUT 4.39 2.00 2.85 5.92 4.77 1.71 3.82 5.71 1.33 0.25 1.14 1.53 * *
36 Cruising 10 min OUT 3.78 1.87 2.34 5.22 4.17 1.40 3.39 4.94 1.22 0.26 1.02 1.42 * *
39 Descent OUT 3.28 1.56 2.08 4.48 3.80 1.69 2.87 4.73 2.06 1.47 0.93 3.18 * *
46 Seating IN 3.83 1.90 2.37 5.30 3.73 1.49 2.91 4.56 1.22 0.26 1.02 1.42 * *
49 Cruising 10 min IN 2.94 1.55 1.75 4.14 2.47 0.92 1.96 2.97 1.22 0.26 1.02 1.42 * *
52 Descent IN 2.89 1.90 1.43 4.35 2.53 1.37 1.78 3.29 1.11 0.22 0.94 1.28 * *
Confidence intervals between Controls (C) vs Moderate-Anxious (MA) or High-Anxious (HA). * p < 0.05, † p < 0.10.
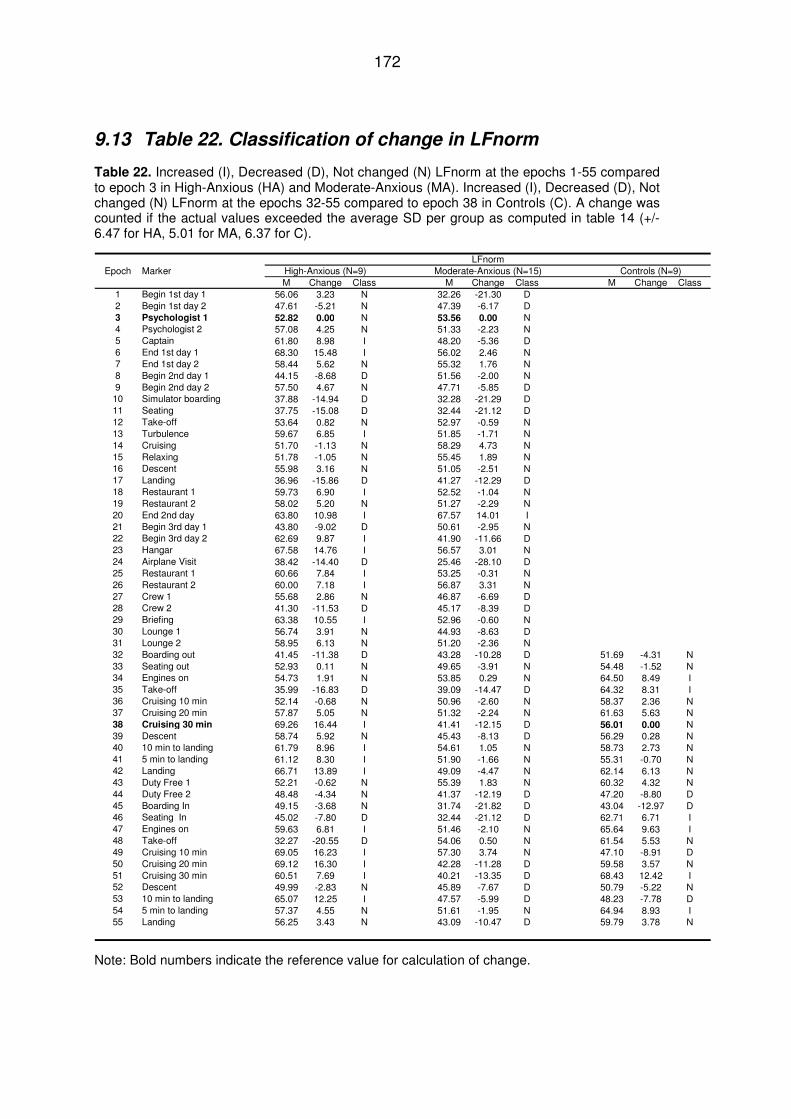
172
9.13 Table 22. Classification of change in LFnorm
Table 22. Increased (I), Decreased (D), Not changed (N) LFnorm at the epochs 1-55 compared to epoch 3 in High-Anxious (HA) and Moderate-Anxious (MA). Increased (I), Decreased (D), Not changed (N) LFnorm at the epochs 32-55 compared to epoch 38 in Controls (C). A change was counted if the actual values exceeded the average SD per group as computed in table 14 (+/- 6.47 for HA, 5.01 for MA, 6.37 for C).
LFnormEpoch Marker High-Anxious (N=9) Moderate-Anxious (N=15) Controls (N=9)
M Change Class M Change Class M Change Class1 Begin 1st day 1 56.06 3.23 N 32.26 -21.30 D2 Begin 1st day 2 47.61 -5.21 N 47.39 -6.17 D3 Psychologist 1 52.82 0.00 N 53.56 0.00 N4 Psychologist 2 57.08 4.25 N 51.33 -2.23 N5 Captain 61.80 8.98 I 48.20 -5.36 D6 End 1st day 1 68.30 15.48 I 56.02 2.46 N7 End 1st day 2 58.44 5.62 N 55.32 1.76 N8 Begin 2nd day 1 44.15 -8.68 D 51.56 -2.00 N9 Begin 2nd day 2 57.50 4.67 N 47.71 -5.85 D10 Simulator boarding 37.88 -14.94 D 32.28 -21.29 D11 Seating 37.75 -15.08 D 32.44 -21.12 D12 Take-off 53.64 0.82 N 52.97 -0.59 N13 Turbulence 59.67 6.85 I 51.85 -1.71 N14 Cruising 51.70 -1.13 N 58.29 4.73 N15 Relaxing 51.78 -1.05 N 55.45 1.89 N16 Descent 55.98 3.16 N 51.05 -2.51 N17 Landing 36.96 -15.86 D 41.27 -12.29 D18 Restaurant 1 59.73 6.90 I 52.52 -1.04 N19 Restaurant 2 58.02 5.20 N 51.27 -2.29 N20 End 2nd day 63.80 10.98 I 67.57 14.01 I21 Begin 3rd day 1 43.80 -9.02 D 50.61 -2.95 N22 Begin 3rd day 2 62.69 9.87 I 41.90 -11.66 D23 Hangar 67.58 14.76 I 56.57 3.01 N24 Airplane Visit 38.42 -14.40 D 25.46 -28.10 D25 Restaurant 1 60.66 7.84 I 53.25 -0.31 N26 Restaurant 2 60.00 7.18 I 56.87 3.31 N27 Crew 1 55.68 2.86 N 46.87 -6.69 D28 Crew 2 41.30 -11.53 D 45.17 -8.39 D29 Briefing 63.38 10.55 I 52.96 -0.60 N30 Lounge 1 56.74 3.91 N 44.93 -8.63 D31 Lounge 2 58.95 6.13 N 51.20 -2.36 N32 Boarding out 41.45 -11.38 D 43.28 -10.28 D 51.69 -4.31 N33 Seating out 52.93 0.11 N 49.65 -3.91 N 54.48 -1.52 N34 Engines on 54.73 1.91 N 53.85 0.29 N 64.50 8.49 I35 Take-off 35.99 -16.83 D 39.09 -14.47 D 64.32 8.31 I36 Cruising 10 min 52.14 -0.68 N 50.96 -2.60 N 58.37 2.36 N37 Cruising 20 min 57.87 5.05 N 51.32 -2.24 N 61.63 5.63 N38 Cruising 30 min 69.26 16.44 I 41.41 -12.15 D 56.01 0.00 N39 Descent 58.74 5.92 N 45.43 -8.13 D 56.29 0.28 N40 10 min to landing 61.79 8.96 I 54.61 1.05 N 58.73 2.73 N41 5 min to landing 61.12 8.30 I 51.90 -1.66 N 55.31 -0.70 N42 Landing 66.71 13.89 I 49.09 -4.47 N 62.14 6.13 N43 Duty Free 1 52.21 -0.62 N 55.39 1.83 N 60.32 4.32 N44 Duty Free 2 48.48 -4.34 N 41.37 -12.19 D 47.20 -8.80 D45 Boarding In 49.15 -3.68 N 31.74 -21.82 D 43.04 -12.97 D46 Seating In 45.02 -7.80 D 32.44 -21.12 D 62.71 6.71 I47 Engines on 59.63 6.81 I 51.46 -2.10 N 65.64 9.63 I48 Take-off 32.27 -20.55 D 54.06 0.50 N 61.54 5.53 N49 Cruising 10 min 69.05 16.23 I 57.30 3.74 N 47.10 -8.91 D50 Cruising 20 min 69.12 16.30 I 42.28 -11.28 D 59.58 3.57 N51 Cruising 30 min 60.51 7.69 I 40.21 -13.35 D 68.43 12.42 I52 Descent 49.99 -2.83 N 45.89 -7.67 D 50.79 -5.22 N53 10 min to landing 65.07 12.25 I 47.57 -5.99 D 48.23 -7.78 D54 5 min to landing 57.37 4.55 N 51.61 -1.95 N 64.94 8.93 I55 Landing 56.25 3.43 N 43.09 -10.47 D 59.79 3.78 N
Note: Bold numbers indicate the reference value for calculation of change.
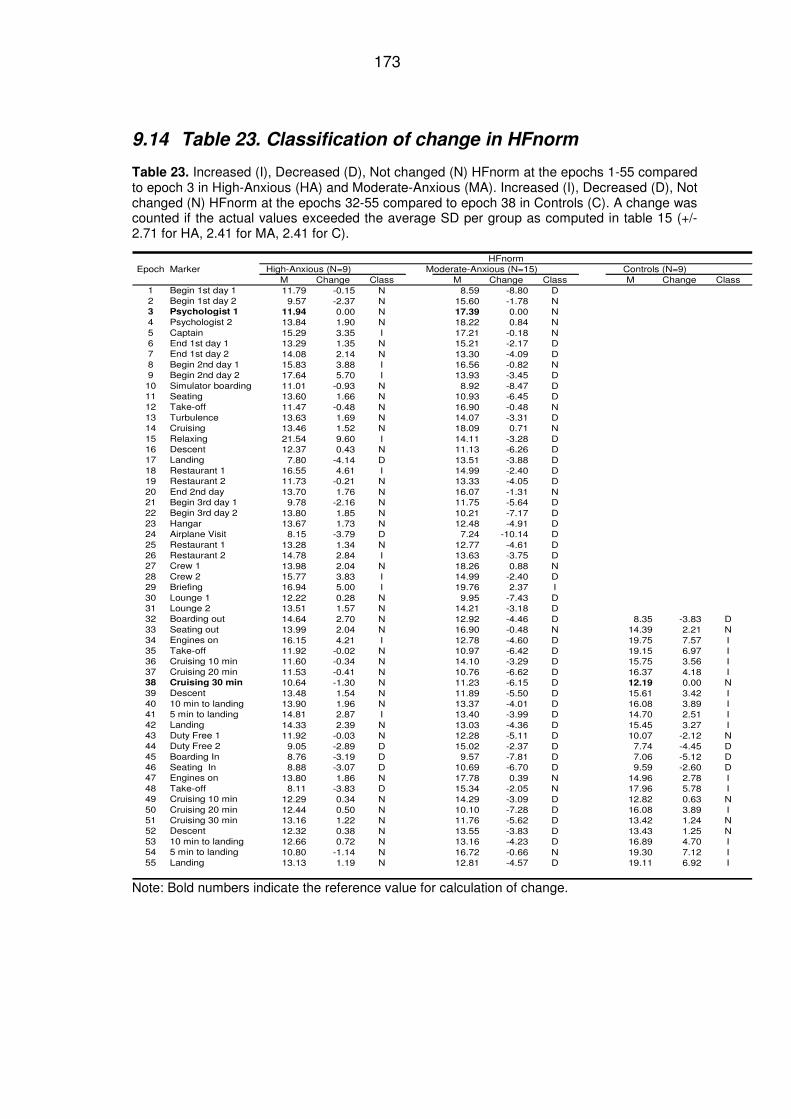
173
9.14 Table 23. Classification of change in HFnorm
Table 23. Increased (I), Decreased (D), Not changed (N) HFnorm at the epochs 1-55 compared to epoch 3 in High-Anxious (HA) and Moderate-Anxious (MA). Increased (I), Decreased (D), Not changed (N) HFnorm at the epochs 32-55 compared to epoch 38 in Controls (C). A change was counted if the actual values exceeded the average SD per group as computed in table 15 (+/- 2.71 for HA, 2.41 for MA, 2.41 for C).
HFnormEpoch Marker High-Anxious (N=9) Moderate-Anxious (N=15) Controls (N=9)
M Change Class M Change Class M Change Class1 Begin 1st day 1 11.79 -0.15 N 8.59 -8.80 D2 Begin 1st day 2 9.57 -2.37 N 15.60 -1.78 N3 Psychologist 1 11.94 0.00 N 17.39 0.00 N4 Psychologist 2 13.84 1.90 N 18.22 0.84 N5 Captain 15.29 3.35 I 17.21 -0.18 N6 End 1st day 1 13.29 1.35 N 15.21 -2.17 D7 End 1st day 2 14.08 2.14 N 13.30 -4.09 D8 Begin 2nd day 1 15.83 3.88 I 16.56 -0.82 N9 Begin 2nd day 2 17.64 5.70 I 13.93 -3.45 D
10 Simulator boarding 11.01 -0.93 N 8.92 -8.47 D11 Seating 13.60 1.66 N 10.93 -6.45 D12 Take-off 11.47 -0.48 N 16.90 -0.48 N13 Turbulence 13.63 1.69 N 14.07 -3.31 D14 Cruising 13.46 1.52 N 18.09 0.71 N15 Relaxing 21.54 9.60 I 14.11 -3.28 D16 Descent 12.37 0.43 N 11.13 -6.26 D17 Landing 7.80 -4.14 D 13.51 -3.88 D18 Restaurant 1 16.55 4.61 I 14.99 -2.40 D19 Restaurant 2 11.73 -0.21 N 13.33 -4.05 D20 End 2nd day 13.70 1.76 N 16.07 -1.31 N21 Begin 3rd day 1 9.78 -2.16 N 11.75 -5.64 D22 Begin 3rd day 2 13.80 1.85 N 10.21 -7.17 D23 Hangar 13.67 1.73 N 12.48 -4.91 D24 Airplane Visit 8.15 -3.79 D 7.24 -10.14 D25 Restaurant 1 13.28 1.34 N 12.77 -4.61 D26 Restaurant 2 14.78 2.84 I 13.63 -3.75 D27 Crew 1 13.98 2.04 N 18.26 0.88 N28 Crew 2 15.77 3.83 I 14.99 -2.40 D29 Briefing 16.94 5.00 I 19.76 2.37 I30 Lounge 1 12.22 0.28 N 9.95 -7.43 D31 Lounge 2 13.51 1.57 N 14.21 -3.18 D32 Boarding out 14.64 2.70 N 12.92 -4.46 D 8.35 -3.83 D33 Seating out 13.99 2.04 N 16.90 -0.48 N 14.39 2.21 N34 Engines on 16.15 4.21 I 12.78 -4.60 D 19.75 7.57 I35 Take-off 11.92 -0.02 N 10.97 -6.42 D 19.15 6.97 I36 Cruising 10 min 11.60 -0.34 N 14.10 -3.29 D 15.75 3.56 I37 Cruising 20 min 11.53 -0.41 N 10.76 -6.62 D 16.37 4.18 I38 Cruising 30 min 10.64 -1.30 N 11.23 -6.15 D 12.19 0.00 N39 Descent 13.48 1.54 N 11.89 -5.50 D 15.61 3.42 I40 10 min to landing 13.90 1.96 N 13.37 -4.01 D 16.08 3.89 I41 5 min to landing 14.81 2.87 I 13.40 -3.99 D 14.70 2.51 I42 Landing 14.33 2.39 N 13.03 -4.36 D 15.45 3.27 I43 Duty Free 1 11.92 -0.03 N 12.28 -5.11 D 10.07 -2.12 N44 Duty Free 2 9.05 -2.89 D 15.02 -2.37 D 7.74 -4.45 D45 Boarding In 8.76 -3.19 D 9.57 -7.81 D 7.06 -5.12 D46 Seating In 8.88 -3.07 D 10.69 -6.70 D 9.59 -2.60 D47 Engines on 13.80 1.86 N 17.78 0.39 N 14.96 2.78 I48 Take-off 8.11 -3.83 D 15.34 -2.05 N 17.96 5.78 I49 Cruising 10 min 12.29 0.34 N 14.29 -3.09 D 12.82 0.63 N50 Cruising 20 min 12.44 0.50 N 10.10 -7.28 D 16.08 3.89 I51 Cruising 30 min 13.16 1.22 N 11.76 -5.62 D 13.42 1.24 N52 Descent 12.32 0.38 N 13.55 -3.83 D 13.43 1.25 N53 10 min to landing 12.66 0.72 N 13.16 -4.23 D 16.89 4.70 I54 5 min to landing 10.80 -1.14 N 16.72 -0.66 N 19.30 7.12 I55 Landing 13.13 1.19 N 12.81 -4.57 D 19.11 6.92 I
Note: Bold numbers indicate the reference value for calculation of change.
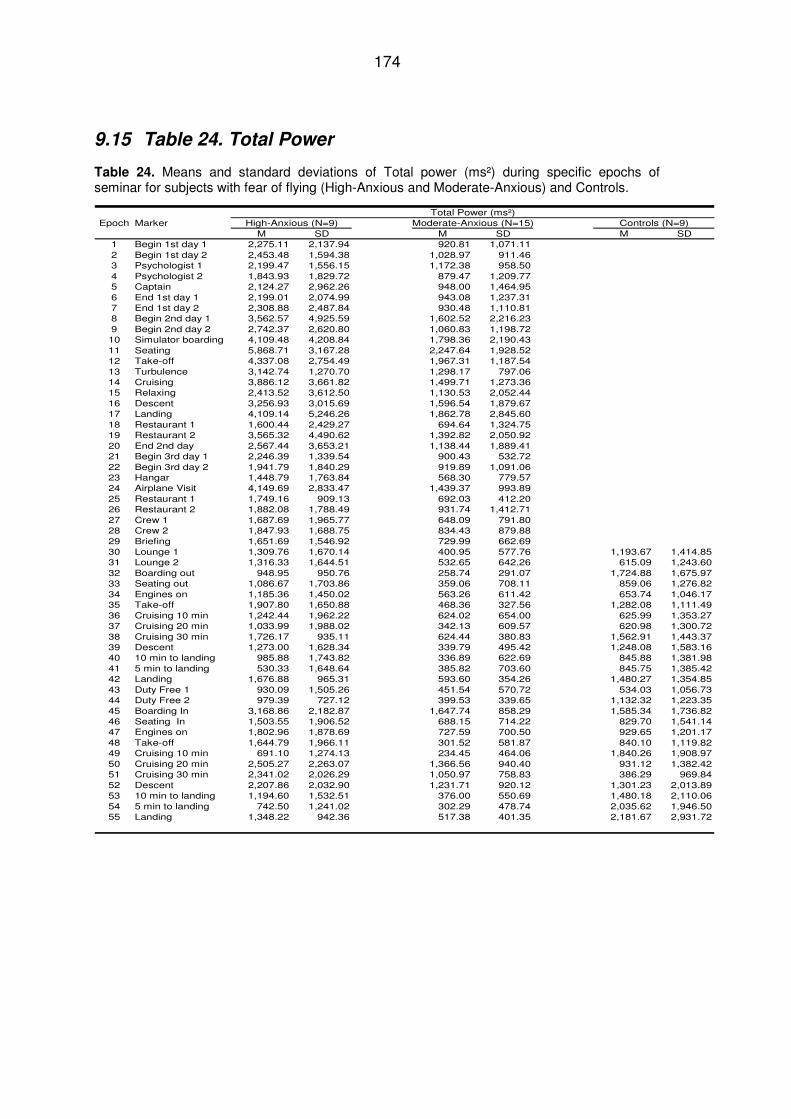
174
9.15 Table 24. Total Power
Table 24. Means and standard deviations of Total power (ms²) during specific epochs of seminar for subjects with fear of flying (High-Anxious and Moderate-Anxious) and Controls.
Total Power (ms²)Epoch Marker High-Anxious (N=9) Moderate-Anxious (N=15) Controls (N=9)
M SD M SD M SD1 Begin 1st day 1 2,275.11 2,137.94 920.81 1,071.112 Begin 1st day 2 2,453.48 1,594.38 1,028.97 911.463 Psychologist 1 2,199.47 1,556.15 1,172.38 958.504 Psychologist 2 1,843.93 1,829.72 879.47 1,209.775 Captain 2,124.27 2,962.26 948.00 1,464.956 End 1st day 1 2,199.01 2,074.99 943.08 1,237.317 End 1st day 2 2,308.88 2,487.84 930.48 1,110.818 Begin 2nd day 1 3,562.57 4,925.59 1,602.52 2,216.239 Begin 2nd day 2 2,742.37 2,620.80 1,060.83 1,198.7210 Simulator boarding 4,109.48 4,208.84 1,798.36 2,190.4311 Seating 5,868.71 3,167.28 2,247.64 1,928.5212 Take-off 4,337.08 2,754.49 1,967.31 1,187.5413 Turbulence 3,142.74 1,270.70 1,298.17 797.0614 Cruising 3,886.12 3,661.82 1,499.71 1,273.3615 Relaxing 2,413.52 3,612.50 1,130.53 2,052.4416 Descent 3,256.93 3,015.69 1,596.54 1,879.6717 Landing 4,109.14 5,246.26 1,862.78 2,845.6018 Restaurant 1 1,600.44 2,429.27 694.64 1,324.7519 Restaurant 2 3,565.32 4,490.62 1,392.82 2,050.9220 End 2nd day 2,567.44 3,653.21 1,138.44 1,889.4121 Begin 3rd day 1 2,246.39 1,339.54 900.43 532.7222 Begin 3rd day 2 1,941.79 1,840.29 919.89 1,091.0623 Hangar 1,448.79 1,763.84 568.30 779.5724 Airplane Visit 4,149.69 2,833.47 1,439.37 993.8925 Restaurant 1 1,749.16 909.13 692.03 412.2026 Restaurant 2 1,882.08 1,788.49 931.74 1,412.7127 Crew 1 1,687.69 1,965.77 648.09 791.8028 Crew 2 1,847.93 1,688.75 834.43 879.8829 Briefing 1,651.69 1,546.92 729.99 662.6930 Lounge 1 1,309.76 1,670.14 400.95 577.76 1,193.67 1,414.8531 Lounge 2 1,316.33 1,644.51 532.65 642.26 615.09 1,243.6032 Boarding out 948.95 950.76 258.74 291.07 1,724.88 1,675.9733 Seating out 1,086.67 1,703.86 359.06 708.11 859.06 1,276.8234 Engines on 1,185.36 1,450.02 563.26 611.42 653.74 1,046.1735 Take-off 1,907.80 1,650.88 468.36 327.56 1,282.08 1,111.4936 Cruising 10 min 1,242.44 1,962.22 624.02 654.00 625.99 1,353.2737 Cruising 20 min 1,033.99 1,988.02 342.13 609.57 620.98 1,300.7238 Cruising 30 min 1,726.17 935.11 624.44 380.83 1,562.91 1,443.3739 Descent 1,273.00 1,628.34 339.79 495.42 1,248.08 1,583.1640 10 min to landing 985.88 1,743.82 336.89 622.69 845.88 1,381.9841 5 min to landing 530.33 1,648.64 385.82 703.60 845.75 1,385.4242 Landing 1,676.88 965.31 593.60 354.26 1,480.27 1,354.8543 Duty Free 1 930.09 1,505.26 451.54 570.72 534.03 1,056.7344 Duty Free 2 979.39 727.12 399.53 339.65 1,132.32 1,223.3545 Boarding In 3,168.86 2,182.87 1,647.74 858.29 1,585.34 1,736.8246 Seating In 1,503.55 1,906.52 688.15 714.22 829.70 1,541.1447 Engines on 1,802.96 1,878.69 727.59 700.50 929.65 1,201.1748 Take-off 1,644.79 1,966.11 301.52 581.87 840.10 1,119.8249 Cruising 10 min 691.10 1,274.13 234.45 464.06 1,840.26 1,908.9750 Cruising 20 min 2,505.27 2,263.07 1,366.56 940.40 931.12 1,382.4251 Cruising 30 min 2,341.02 2,026.29 1,050.97 758.83 386.29 969.8452 Descent 2,207.86 2,032.90 1,231.71 920.12 1,301.23 2,013.8953 10 min to landing 1,194.60 1,532.51 376.00 550.69 1,480.18 2,110.0654 5 min to landing 742.50 1,241.02 302.29 478.74 2,035.62 1,946.5055 Landing 1,348.22 942.36 517.38 401.35 2,181.67 2,931.72
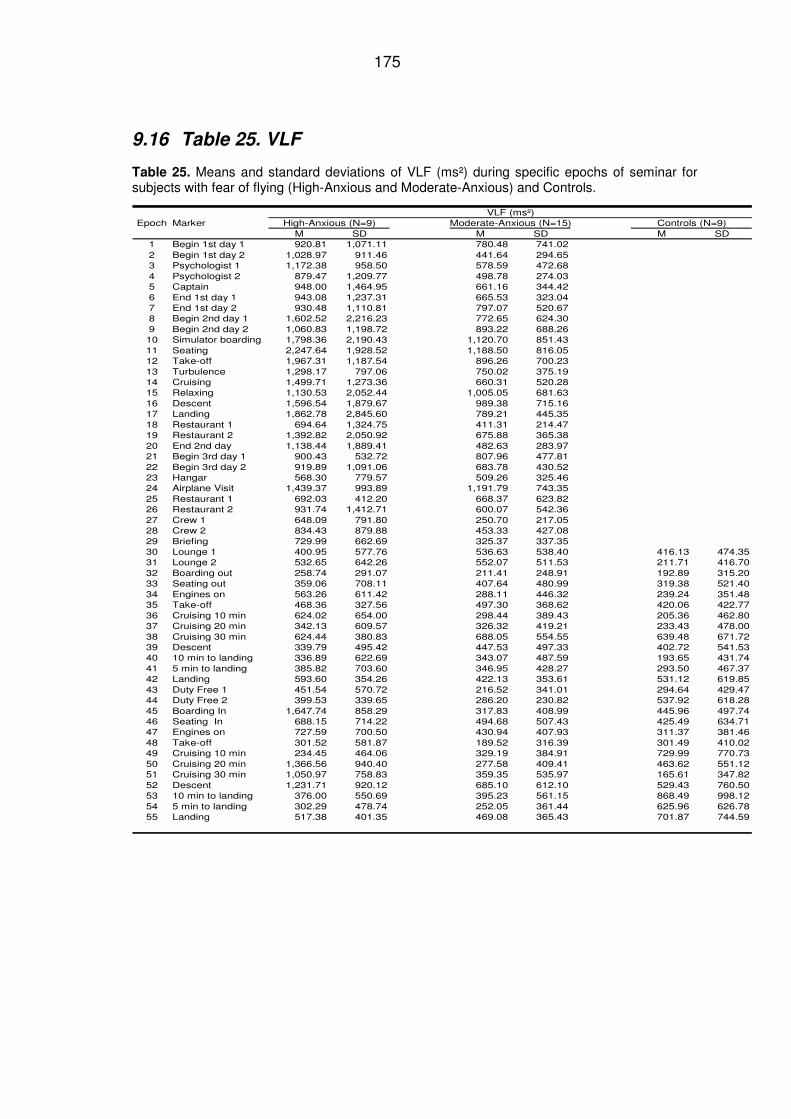
175
9.16 Table 25. VLF
Table 25. Means and standard deviations of VLF (ms²) during specific epochs of seminar for subjects with fear of flying (High-Anxious and Moderate-Anxious) and Controls.
VLF (ms²)Epoch Marker High-Anxious (N=9) Moderate-Anxious (N=15) Controls (N=9)
M SD M SD M SD1 Begin 1st day 1 920.81 1,071.11 780.48 741.022 Begin 1st day 2 1,028.97 911.46 441.64 294.653 Psychologist 1 1,172.38 958.50 578.59 472.684 Psychologist 2 879.47 1,209.77 498.78 274.035 Captain 948.00 1,464.95 661.16 344.426 End 1st day 1 943.08 1,237.31 665.53 323.047 End 1st day 2 930.48 1,110.81 797.07 520.678 Begin 2nd day 1 1,602.52 2,216.23 772.65 624.309 Begin 2nd day 2 1,060.83 1,198.72 893.22 688.2610 Simulator boarding 1,798.36 2,190.43 1,120.70 851.4311 Seating 2,247.64 1,928.52 1,188.50 816.0512 Take-off 1,967.31 1,187.54 896.26 700.2313 Turbulence 1,298.17 797.06 750.02 375.1914 Cruising 1,499.71 1,273.36 660.31 520.2815 Relaxing 1,130.53 2,052.44 1,005.05 681.6316 Descent 1,596.54 1,879.67 989.38 715.1617 Landing 1,862.78 2,845.60 789.21 445.3518 Restaurant 1 694.64 1,324.75 411.31 214.4719 Restaurant 2 1,392.82 2,050.92 675.88 365.3820 End 2nd day 1,138.44 1,889.41 482.63 283.9721 Begin 3rd day 1 900.43 532.72 807.96 477.8122 Begin 3rd day 2 919.89 1,091.06 683.78 430.5223 Hangar 568.30 779.57 509.26 325.4624 Airplane Visit 1,439.37 993.89 1,191.79 743.3525 Restaurant 1 692.03 412.20 668.37 623.8226 Restaurant 2 931.74 1,412.71 600.07 542.3627 Crew 1 648.09 791.80 250.70 217.0528 Crew 2 834.43 879.88 453.33 427.0829 Briefing 729.99 662.69 325.37 337.3530 Lounge 1 400.95 577.76 536.63 538.40 416.13 474.3531 Lounge 2 532.65 642.26 552.07 511.53 211.71 416.7032 Boarding out 258.74 291.07 211.41 248.91 192.89 315.2033 Seating out 359.06 708.11 407.64 480.99 319.38 521.4034 Engines on 563.26 611.42 288.11 446.32 239.24 351.4835 Take-off 468.36 327.56 497.30 368.62 420.06 422.7736 Cruising 10 min 624.02 654.00 298.44 389.43 205.36 462.8037 Cruising 20 min 342.13 609.57 326.32 419.21 233.43 478.0038 Cruising 30 min 624.44 380.83 688.05 554.55 639.48 671.7239 Descent 339.79 495.42 447.53 497.33 402.72 541.5340 10 min to landing 336.89 622.69 343.07 487.59 193.65 431.7441 5 min to landing 385.82 703.60 346.95 428.27 293.50 467.3742 Landing 593.60 354.26 422.13 353.61 531.12 619.8543 Duty Free 1 451.54 570.72 216.52 341.01 294.64 429.4744 Duty Free 2 399.53 339.65 286.20 230.82 537.92 618.2845 Boarding In 1,647.74 858.29 317.83 408.99 445.96 497.7446 Seating In 688.15 714.22 494.68 507.43 425.49 634.7147 Engines on 727.59 700.50 430.94 407.93 311.37 381.4648 Take-off 301.52 581.87 189.52 316.39 301.49 410.0249 Cruising 10 min 234.45 464.06 329.19 384.91 729.99 770.7350 Cruising 20 min 1,366.56 940.40 277.58 409.41 463.62 551.1251 Cruising 30 min 1,050.97 758.83 359.35 535.97 165.61 347.8252 Descent 1,231.71 920.12 685.10 612.10 529.43 760.5053 10 min to landing 376.00 550.69 395.23 561.15 868.49 998.1254 5 min to landing 302.29 478.74 252.05 361.44 625.96 626.7855 Landing 517.38 401.35 469.08 365.43 701.87 744.59
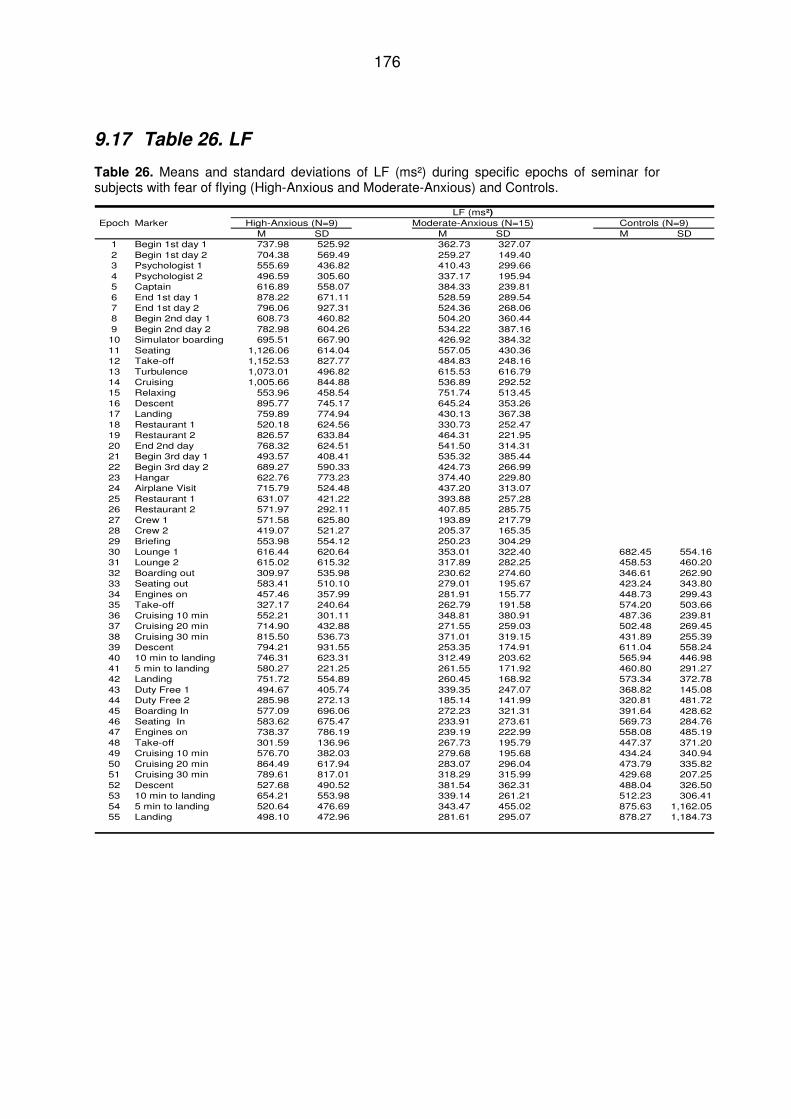
176
9.17 Table 26. LF
Table 26. Means and standard deviations of LF (ms²) during specific epochs of seminar for subjects with fear of flying (High-Anxious and Moderate-Anxious) and Controls.
LF (ms²)
Epoch Marker High-Anxious (N=9) Moderate-Anxious (N=15) Controls (N=9)M SD M SD M SD
1 Begin 1st day 1 737.98 525.92 362.73 327.072 Begin 1st day 2 704.38 569.49 259.27 149.403 Psychologist 1 555.69 436.82 410.43 299.664 Psychologist 2 496.59 305.60 337.17 195.945 Captain 616.89 558.07 384.33 239.816 End 1st day 1 878.22 671.11 528.59 289.547 End 1st day 2 796.06 927.31 524.36 268.068 Begin 2nd day 1 608.73 460.82 504.20 360.449 Begin 2nd day 2 782.98 604.26 534.22 387.1610 Simulator boarding 695.51 667.90 426.92 384.3211 Seating 1,126.06 614.04 557.05 430.3612 Take-off 1,152.53 827.77 484.83 248.1613 Turbulence 1,073.01 496.82 615.53 616.7914 Cruising 1,005.66 844.88 536.89 292.5215 Relaxing 553.96 458.54 751.74 513.4516 Descent 895.77 745.17 645.24 353.2617 Landing 759.89 774.94 430.13 367.3818 Restaurant 1 520.18 624.56 330.73 252.4719 Restaurant 2 826.57 633.84 464.31 221.9520 End 2nd day 768.32 624.51 541.50 314.3121 Begin 3rd day 1 493.57 408.41 535.32 385.4422 Begin 3rd day 2 689.27 590.33 424.73 266.9923 Hangar 622.76 773.23 374.40 229.8024 Airplane Visit 715.79 524.48 437.20 313.0725 Restaurant 1 631.07 421.22 393.88 257.2826 Restaurant 2 571.97 292.11 407.85 285.7527 Crew 1 571.58 625.80 193.89 217.7928 Crew 2 419.07 521.27 205.37 165.3529 Briefing 553.98 554.12 250.23 304.2930 Lounge 1 616.44 620.64 353.01 322.40 682.45 554.1631 Lounge 2 615.02 615.32 317.89 282.25 458.53 460.2032 Boarding out 309.97 535.98 230.62 274.60 346.61 262.9033 Seating out 583.41 510.10 279.01 195.67 423.24 343.8034 Engines on 457.46 357.99 281.91 155.77 448.73 299.4335 Take-off 327.17 240.64 262.79 191.58 574.20 503.6636 Cruising 10 min 552.21 301.11 348.81 380.91 487.36 239.8137 Cruising 20 min 714.90 432.88 271.55 259.03 502.48 269.4538 Cruising 30 min 815.50 536.73 371.01 319.15 431.89 255.3939 Descent 794.21 931.55 253.35 174.91 611.04 558.2440 10 min to landing 746.31 623.31 312.49 203.62 565.94 446.9841 5 min to landing 580.27 221.25 261.55 171.92 460.80 291.2742 Landing 751.72 554.89 260.45 168.92 573.34 372.7843 Duty Free 1 494.67 405.74 339.35 247.07 368.82 145.0844 Duty Free 2 285.98 272.13 185.14 141.99 320.81 481.7245 Boarding In 577.09 696.06 272.23 321.31 391.64 428.6246 Seating In 583.62 675.47 233.91 273.61 569.73 284.7647 Engines on 738.37 786.19 239.19 222.99 558.08 485.1948 Take-off 301.59 136.96 267.73 195.79 447.37 371.2049 Cruising 10 min 576.70 382.03 279.68 195.68 434.24 340.9450 Cruising 20 min 864.49 617.94 283.07 296.04 473.79 335.8251 Cruising 30 min 789.61 817.01 318.29 315.99 429.68 207.2552 Descent 527.68 490.52 381.54 362.31 488.04 326.5053 10 min to landing 654.21 553.98 339.14 261.21 512.23 306.4154 5 min to landing 520.64 476.69 343.47 455.02 875.63 1,162.0555 Landing 498.10 472.96 281.61 295.07 878.27 1,184.73
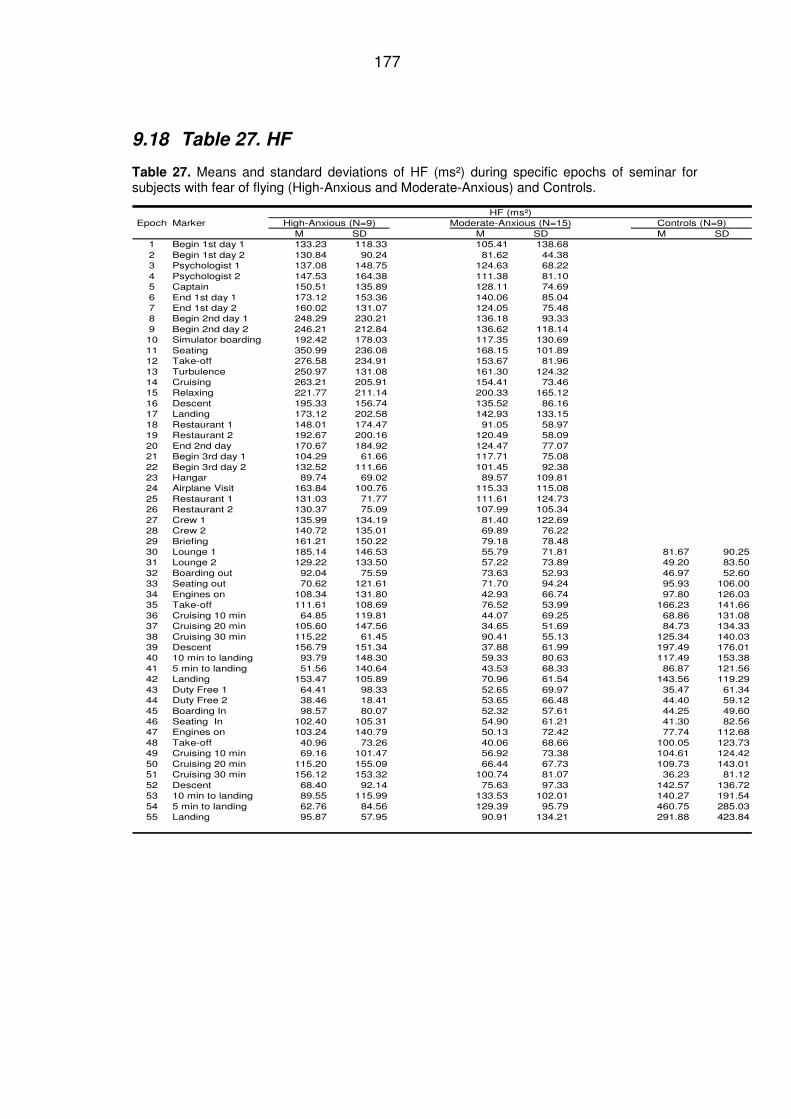
177
9.18 Table 27. HF
Table 27. Means and standard deviations of HF (ms²) during specific epochs of seminar for subjects with fear of flying (High-Anxious and Moderate-Anxious) and Controls.
HF (ms²)Epoch Marker High-Anxious (N=9) Moderate-Anxious (N=15) Controls (N=9)
M SD M SD M SD1 Begin 1st day 1 133.23 118.33 105.41 138.682 Begin 1st day 2 130.84 90.24 81.62 44.383 Psychologist 1 137.08 148.75 124.63 68.224 Psychologist 2 147.53 164.38 111.38 81.105 Captain 150.51 135.89 128.11 74.696 End 1st day 1 173.12 153.36 140.06 85.047 End 1st day 2 160.02 131.07 124.05 75.488 Begin 2nd day 1 248.29 230.21 136.18 93.339 Begin 2nd day 2 246.21 212.84 136.62 118.1410 Simulator boarding 192.42 178.03 117.35 130.6911 Seating 350.99 236.08 168.15 101.8912 Take-off 276.58 234.91 153.67 81.9613 Turbulence 250.97 131.08 161.30 124.3214 Cruising 263.21 205.91 154.41 73.4615 Relaxing 221.77 211.14 200.33 165.1216 Descent 195.33 156.74 135.52 86.1617 Landing 173.12 202.58 142.93 133.1518 Restaurant 1 148.01 174.47 91.05 58.9719 Restaurant 2 192.67 200.16 120.49 58.0920 End 2nd day 170.67 184.92 124.47 77.0721 Begin 3rd day 1 104.29 61.66 117.71 75.0822 Begin 3rd day 2 132.52 111.66 101.45 92.3823 Hangar 89.74 69.02 89.57 109.8124 Airplane Visit 163.84 100.76 115.33 115.0825 Restaurant 1 131.03 71.77 111.61 124.7326 Restaurant 2 130.37 75.09 107.99 105.3427 Crew 1 135.99 134.19 81.40 122.6928 Crew 2 140.72 135.01 69.89 76.2229 Briefing 161.21 150.22 79.18 78.4830 Lounge 1 185.14 146.53 55.79 71.81 81.67 90.2531 Lounge 2 129.22 133.50 57.22 73.89 49.20 83.5032 Boarding out 92.04 75.59 73.63 52.93 46.97 52.6033 Seating out 70.62 121.61 71.70 94.24 95.93 106.0034 Engines on 108.34 131.80 42.93 66.74 97.80 126.0335 Take-off 111.61 108.69 76.52 53.99 166.23 141.6636 Cruising 10 min 64.85 119.81 44.07 69.25 68.86 131.0837 Cruising 20 min 105.60 147.56 34.65 51.69 84.73 134.3338 Cruising 30 min 115.22 61.45 90.41 55.13 125.34 140.0339 Descent 156.79 151.34 37.88 61.99 197.49 176.0140 10 min to landing 93.79 148.30 59.33 80.63 117.49 153.3841 5 min to landing 51.56 140.64 43.53 68.33 86.87 121.5642 Landing 153.47 105.89 70.96 61.54 143.56 119.2943 Duty Free 1 64.41 98.33 52.65 69.97 35.47 61.3444 Duty Free 2 38.46 18.41 53.65 66.48 44.40 59.1245 Boarding In 98.57 80.07 52.32 57.61 44.25 49.6046 Seating In 102.40 105.31 54.90 61.21 41.30 82.5647 Engines on 103.24 140.79 50.13 72.42 77.74 112.6848 Take-off 40.96 73.26 40.06 68.66 100.05 123.7349 Cruising 10 min 69.16 101.47 56.92 73.38 104.61 124.4250 Cruising 20 min 115.20 155.09 66.44 67.73 109.73 143.0151 Cruising 30 min 156.12 153.32 100.74 81.07 36.23 81.1252 Descent 68.40 92.14 75.63 97.33 142.57 136.7253 10 min to landing 89.55 115.99 133.53 102.01 140.27 191.5454 5 min to landing 62.76 84.56 129.39 95.79 460.75 285.0355 Landing 95.87 57.95 90.91 134.21 291.88 423.84
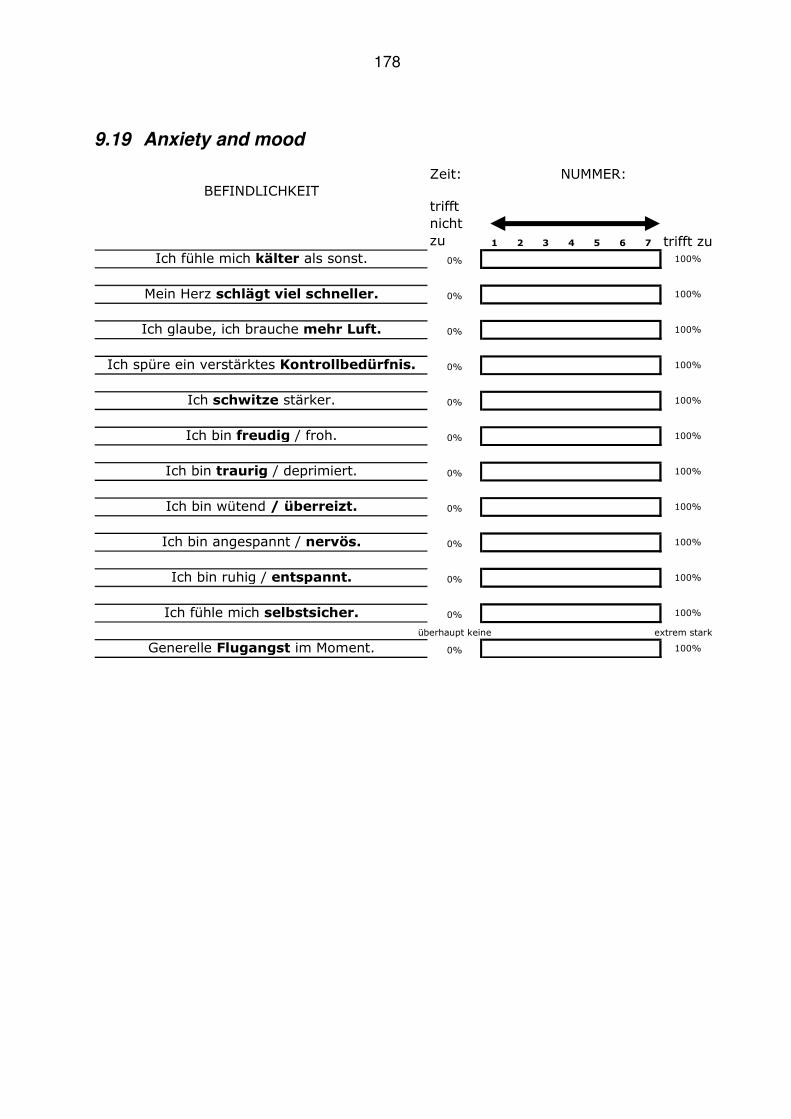
178
9.19 Anxiety and mood
Zeit: NUMMER:
BEFINDLICHKEITtrifft
nicht
zu 1 2 3 4 5 6 7 trifft zu
Ich fühle mich kälter als sonst. 0% 100%
Mein Herz schlägt viel schneller. 0% 100%
Ich glaube, ich brauche mehr Luft. 0% 100%
Ich spüre ein verstärktes Kontrollbedürfnis. 0% 100%
Ich schwitze stärker. 0% 100%
Ich bin freudig / froh. 0% 100%
Ich bin traurig / deprimiert. 0% 100%
Ich bin wütend / überreizt. 0% 100%
Ich bin angespannt / nervös. 0% 100%
Ich bin ruhig / entspannt. 0% 100%
Ich fühle mich selbstsicher. 0% 100%
überhaupt keine extrem stark
Generelle Flugangst im Moment. 0% 100%
179
Curriculum Vitae
Name: Margit Burger, nee König Date of Birth: January 13, 1964 Place of Birth: Vienna Nationality: Austria Address: A-2440 Moosbrunn, Neubachgasse 44 Family status: married, two children (1991, 1993)
Education June 2007 Participation in the 3rd world conference on Fear of Flying
in Montreal Since May 2004 Clinical and Health Psychologist 1995 – 2001 University of Vienna, studying Psychology 1978 – 1983 Vienna Business School, A-1010 Vienna, Akademiestr 12 1974 – 1978 Secondary School: A-1040 Vienna, Wiedner Gürtel 68 1970 – 1974 Elementary School: A-1100 Vienna Career: From 2007 PSZ – inter.work Arbeitsassistenz, A-2500 Baden
Commercial and project management
2003 – 2007 inter.work Arbeitsassistenz, A-2500 Baden Executive management
2001 – 2003 inter.work Arbeitsassistenz, A- 2500 Baden (Psychosocial help and employment coaching of people with psychiatric illness)
1999 – 2001 BBRZ , A-1110 Vienna: Honorary training for
psychological diagnostic 1993 Maternity leave, son Clemens 1991 Maternity leave, daughter Sarah 1986 – 1991 Austrian Chamber of Commerce, Damascus Syria
Secretary of the Austrian Commercial Attaché in Syria
1984 – 1986 American Embassy, A-1090 Vienna, Human Resource 1983 – 1984 Coloniale Commerce, A-1100 Vienna (Import – Export) Moosbrunn, April 2011