Embed Size (px)
Citation preview
Burlington Resources Canada-MIT Alliance
By: Chen-Wen Huang & David Miller
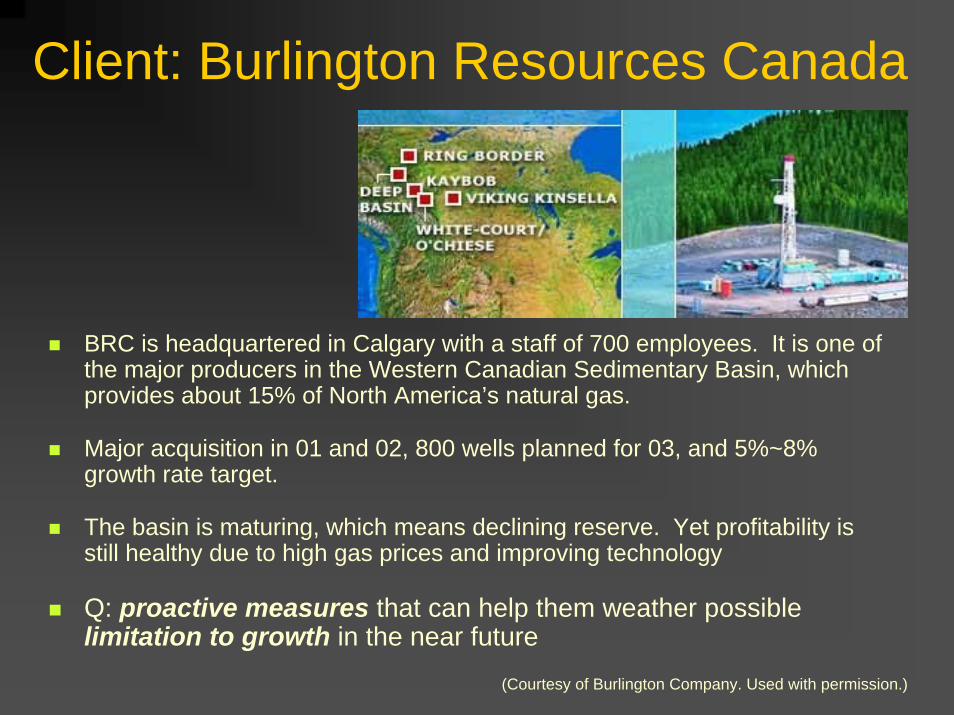
Client: Burlington Resources Canada
BRC is headquartered in Calgary with a staff of 700 employees. It is one of the major producers in the Western Canadian Sedimentary Basin, which provides about 15% of North America’s natural gas.
Major acquisition in 01 and 02, 800 wells planned for 03, and 5%~8% growth rate target.
The basin is maturing, which means declining reserve. Yet profitability is still healthy due to high gas prices and improving technology
Q: proactive measures that can help them weather possible limitation to growth in the near future
(Courtesy of Burlington Company. Used with permission.)
Our ContactsThe People
George: Consultant and system dynamicistRoy: Manager, Reserves Jeff: Head of Planning Colleen: Commercial AnalystRob: Head of Engineering Tom: Management Team
The ProcessWeekly conference call, along with web-based conferencing
(Courtesy of Burlington Company. Used with permission.)

The Most Valuable Pieces of Information BRC walks away with:
To increase the number of licenses for drilling, you need to apply for fewer licenses.
The more months of inventory you try to create, the fewer resources you need to do so.
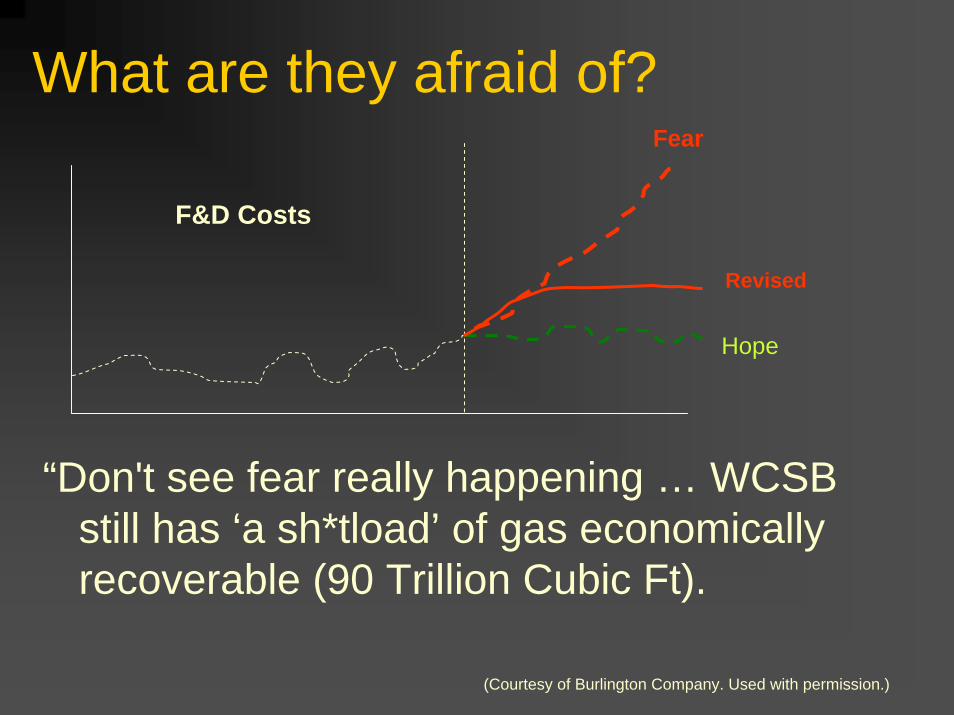
What are they afraid of?Fear
F&D Costs
Revised
Hope
“Don't see fear really happening … WCSB still has ‘a sh*tload’ of gas economically recoverable (90 Trillion Cubic Ft).
(Courtesy of Burlington Company. Used with permission.)
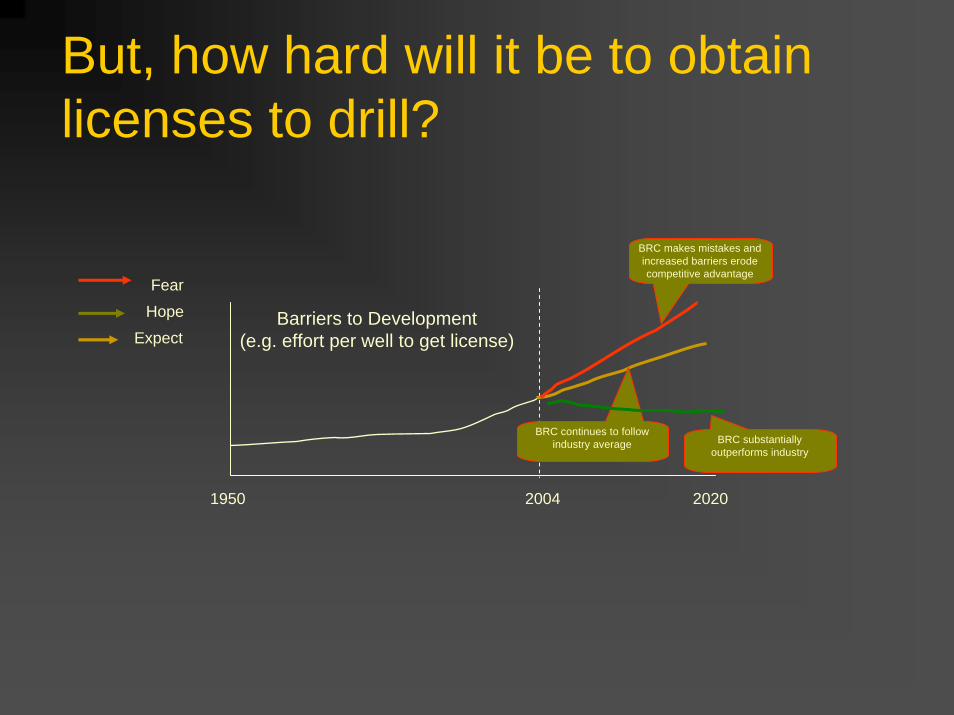
But, how hard will it be to obtain licenses to drill?
FearHope
Expect
1950 2004 2020
Barriers to Development(e.g. effort per well to get license)
BRC continues to follow industry average
BRC makes mistakes and increased barriers erode competitive advantage
BRC substantially outperforms industry
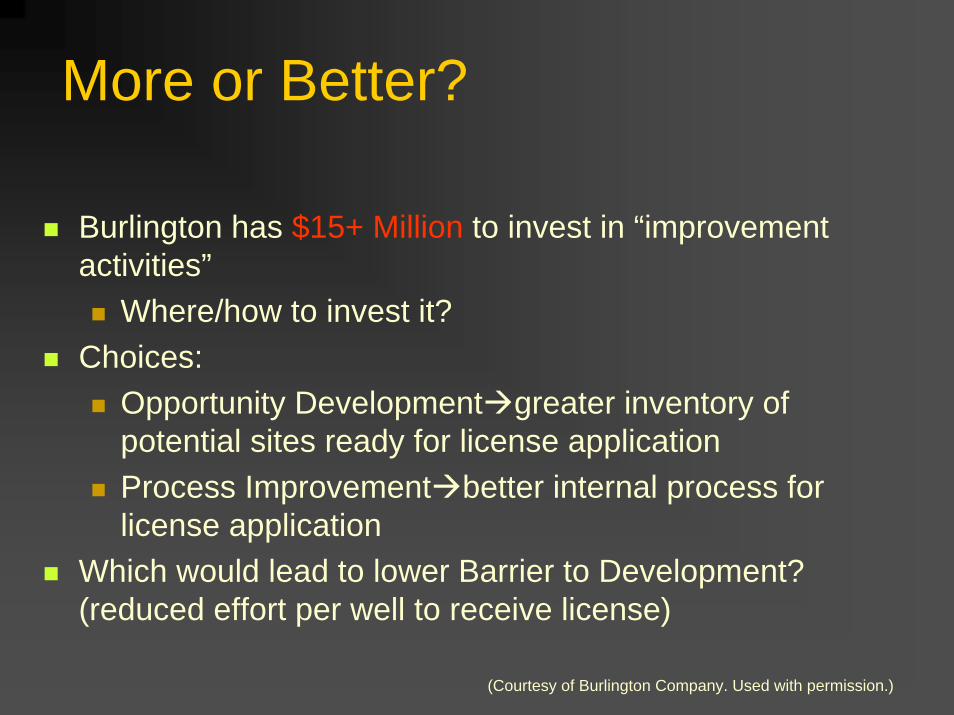
More or Better?
Burlington has $15+ Million to invest in “improvement activities”
Where/how to invest it?Choices:
Opportunity Development greater inventory of potential sites ready for license applicationProcess Improvement better internal process for license application
Which would lead to lower Barrier to Development? (reduced effort per well to receive license)
(Courtesy of Burlington Company. Used with permission.)
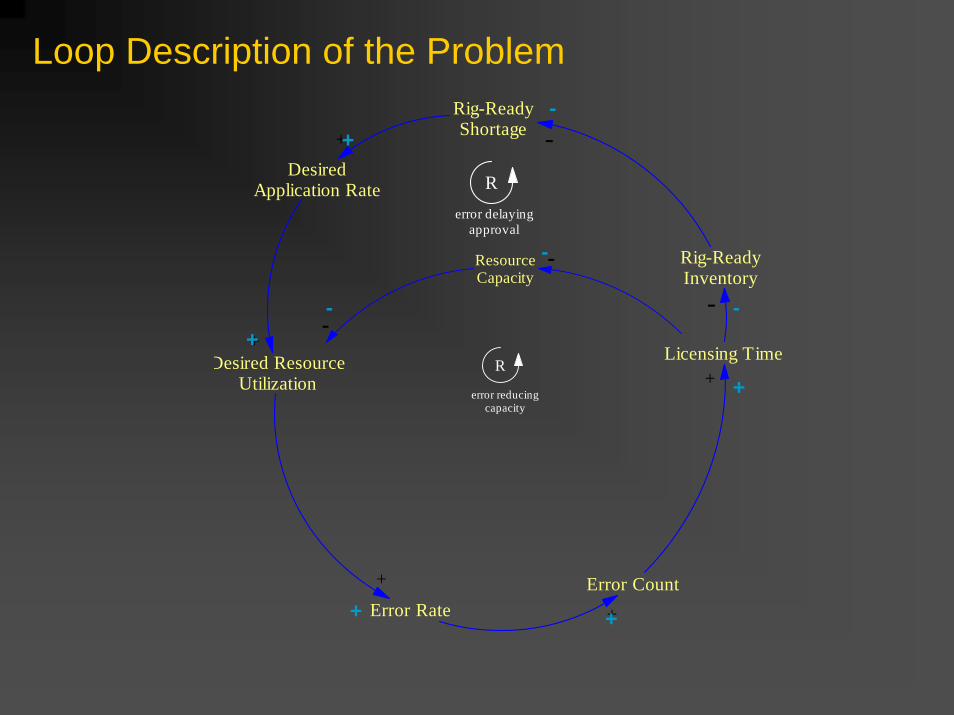
Loop Description of the Problem
Error RateError Count
Licensing Time
DesiredApplication Rate
Desired ResourceUtilization
+
+
+
+
R
Rig-ReadyShortage+
Rig-ReadyInventory
-
-
error delayingapproval
+
+
+ +
+
-
-
ResourceCapacity
-
-
R
error reducingcapacity
-
-
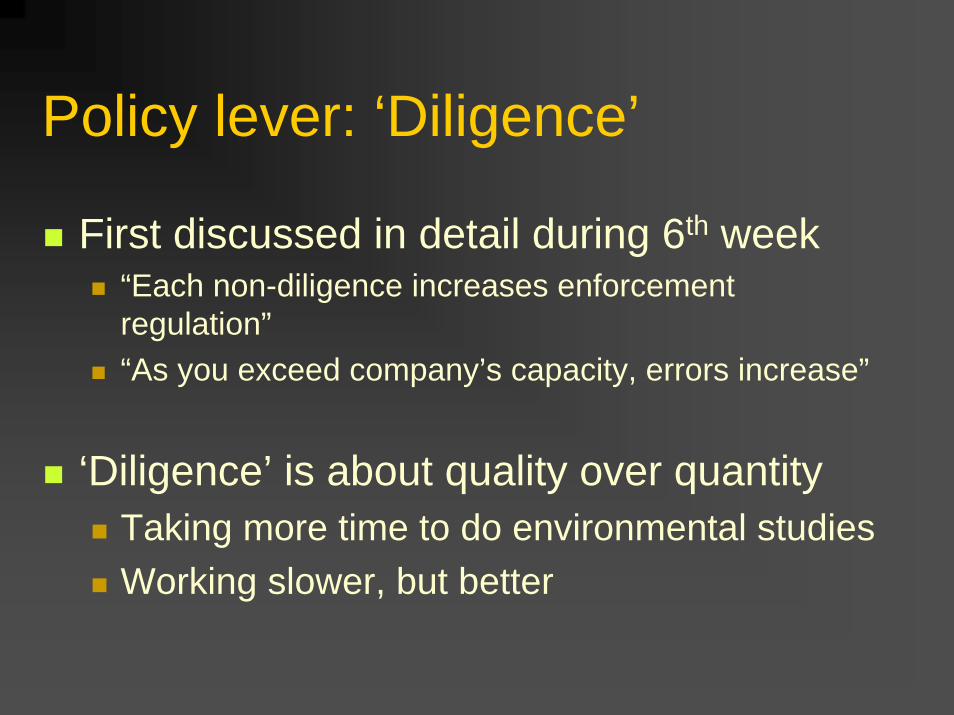
Policy lever: ‘Diligence’
First discussed in detail during 6th week“Each non-diligence increases enforcement regulation”“As you exceed company’s capacity, errors increase”
‘Diligence’ is about quality over quantityTaking more time to do environmental studiesWorking slower, but better
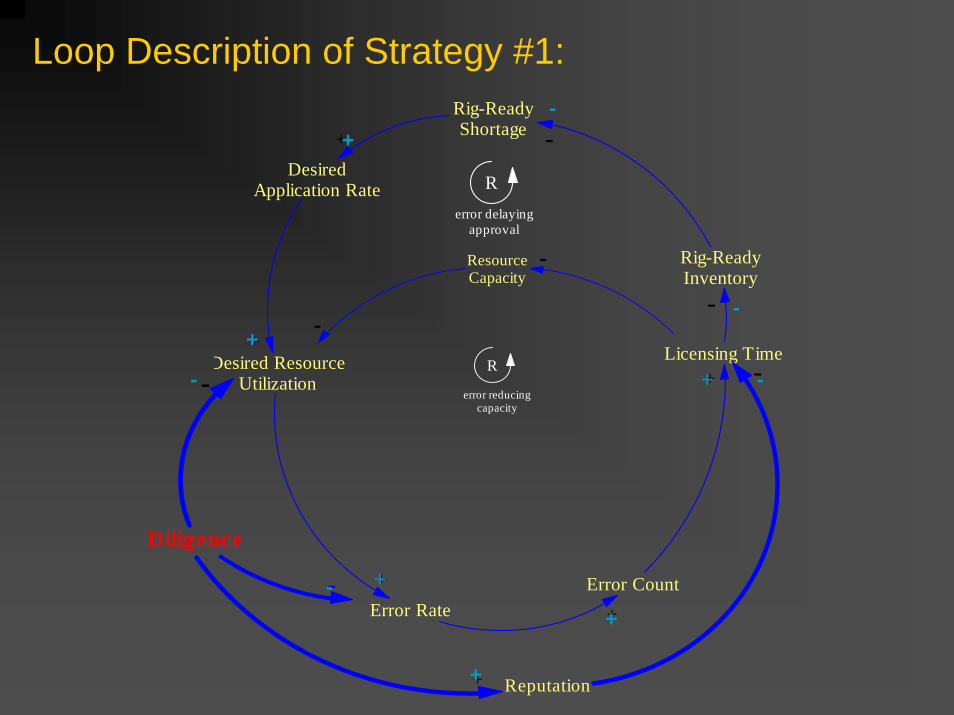
Error RateError Count
Licensing Time
DesiredApplication Rate
Desired ResourceUtilization
+
+
+
+
R
Rig-ReadyShortage+
Rig-ReadyInventory
-
-
error delayingapproval
Loop Description of Strategy #1:
ResourceCapacity
-
-
R
error reducingcapacity
Diligence
-
Reputation+
-
-
+
+
+
+
+
-
-
- -
+
-
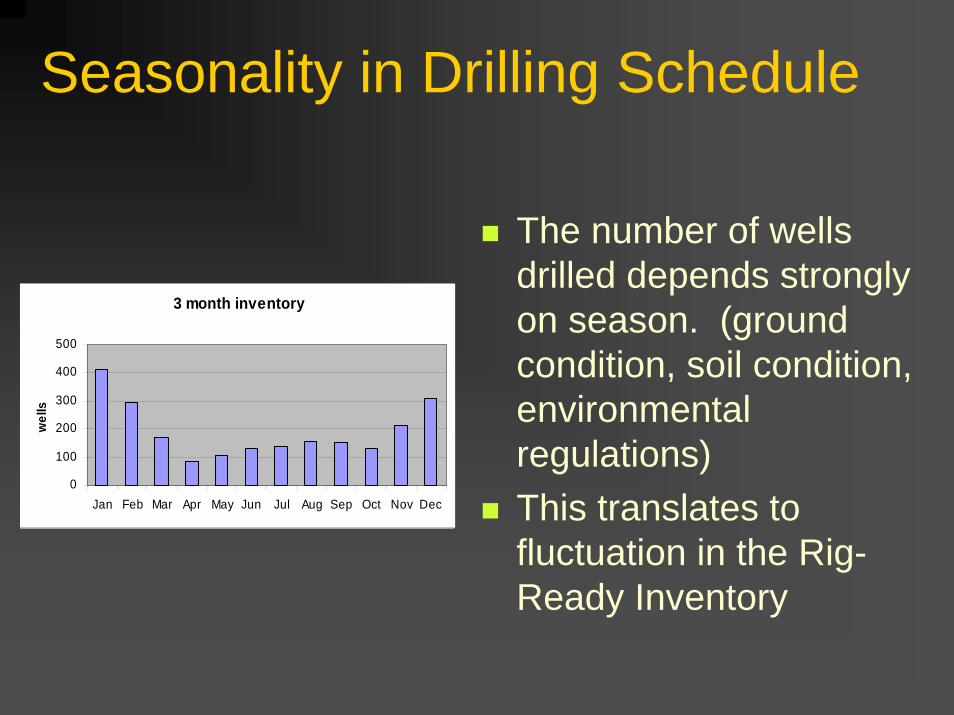
Seasonality in Drilling Schedule
monthly drilling schedule
0
50
100
150
Jan Feb Mar Apr May Jun Jul Aug Sep Oct Nov Dec
wel
ls
The number of wells drilled depends strongly on season. (ground condition, soil condition, environmental regulations)This translates to fluctuation in the Rig-Ready Inventory
3 month inventory
0
100
200
300
400
500
Jan Feb Mar Apr May Jun Jul Aug Sep Oct Nov Dec
wel
ls
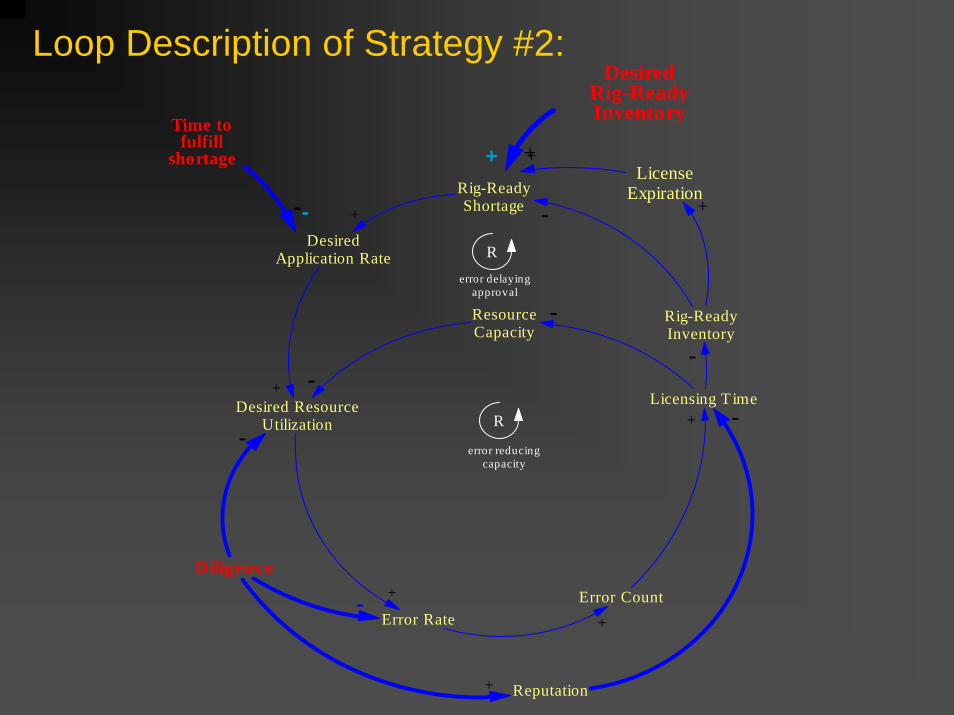
Loop Description of Strategy #2:
LicenseExpiration
+
+
Error RateError Count
Licensing T ime
DesiredApplication Rate
Desired ResourceUtilization
+
+
+
+
ResourceCapacity
-
-
R
R
Diligence
-
Rig-ReadyShortage+
Reputation+
-
Rig-ReadyInventory
-
-
error reducingcapacity
error delayingapproval
-
Time tofulfill
shortage
--
DesiredRig-ReadyInventory
++
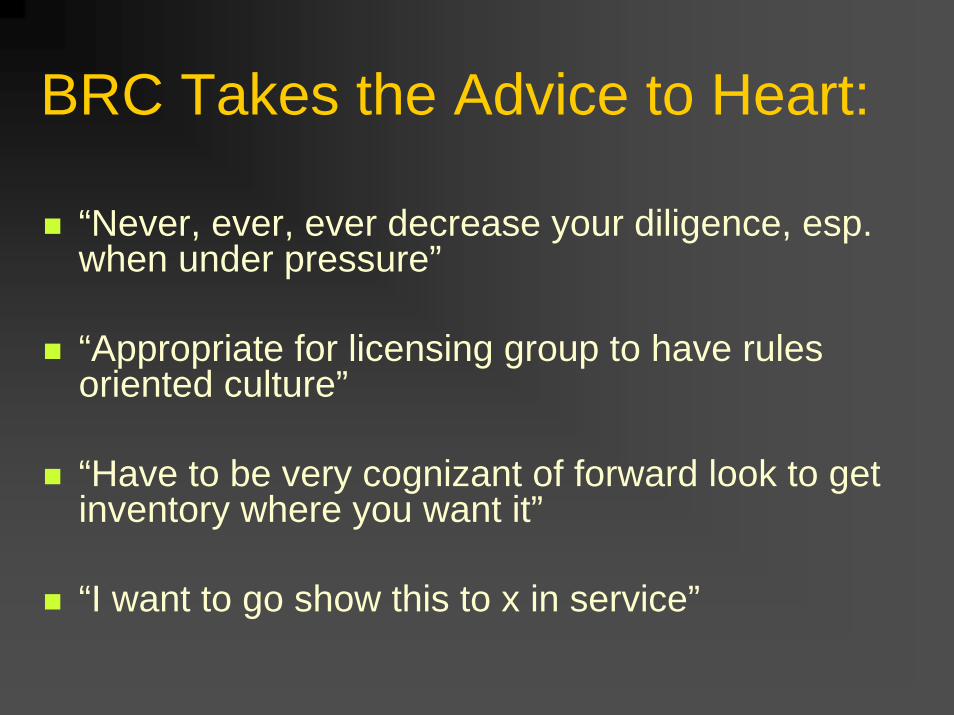
BRC Takes the Advice to Heart:
“Never, ever, ever decrease your diligence, esp. when under pressure”
“Appropriate for licensing group to have rules oriented culture”
“Have to be very cognizant of forward look to get inventory where you want it”
“I want to go show this to x in service”
Consulting Process:
Standard Method Standard MethodStandard Method Standard MethodStandard Method Standard MethodStandard Method Standard MethodStandard Method Standard MethodStandard Method Standard MethodStandard Method Standard Method
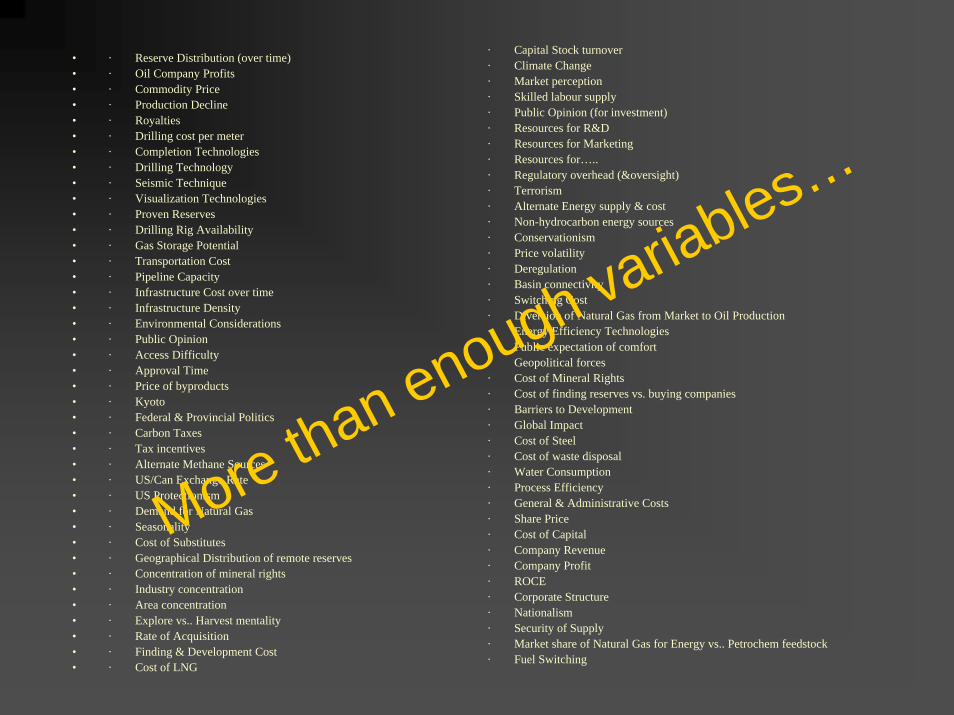
• · Reserve Distribution (over time)• · Oil Company Profits• · Commodity Price• · Production Decline• · Royalties• · Drilling cost per meter• · Completion Technologies• · Drilling Technology• · Seismic Technique• · Visualization Technologies• · Proven Reserves• · Drilling Rig Availability• · Gas Storage Potential• · Transportation Cost• · Pipeline Capacity• · Infrastructure Cost over time• · Infrastructure Density• · Environmental Considerations• · Public Opinion• · Access Difficulty• · Approval Time• · Price of byproducts• · Kyoto• · Federal & Provincial Politics• · Carbon Taxes• · Tax incentives• · Alternate Methane Sources• · US/Can Exchange Rate• · US Protectionism• · Demand for Natural Gas• · Seasonality• · Cost of Substitutes• · Geographical Distribution of remote reserves• · Concentration of mineral rights• · Industry concentration• · Area concentration• · Explore vs.. Harvest mentality• · Rate of Acquisition• · Finding & Development Cost• · Cost of LNG
· Capital Stock turnover· Climate Change· Market perception· Skilled labour supply· Public Opinion (for investment)· Resources for R&D· Resources for Marketing· Resources for…..· Regulatory overhead (&oversight)· Terrorism· Alternate Energy supply & cost· Non-hydrocarbon energy sources· Conservationism· Price volatility· Deregulation· Basin connectivity· Switching Cost· Diversion of Natural Gas from Market to Oil Production· Energy Efficiency Technologies· Public expectation of comfort· Geopolitical forces· Cost of Mineral Rights· Cost of finding reserves vs. buying companies· Barriers to Development· Global Impact· Cost of Steel· Cost of waste disposal· Water Consumption· Process Efficiency· General & Administrative Costs· Share Price· Cost of Capital· Company Revenue· Company Profit· ROCE· Corporate Structure· Nationalism· Security of Supply· Market share of Natural Gas for Energy vs.. Petrochem feedstock· Fuel Switching
More than enough variables…
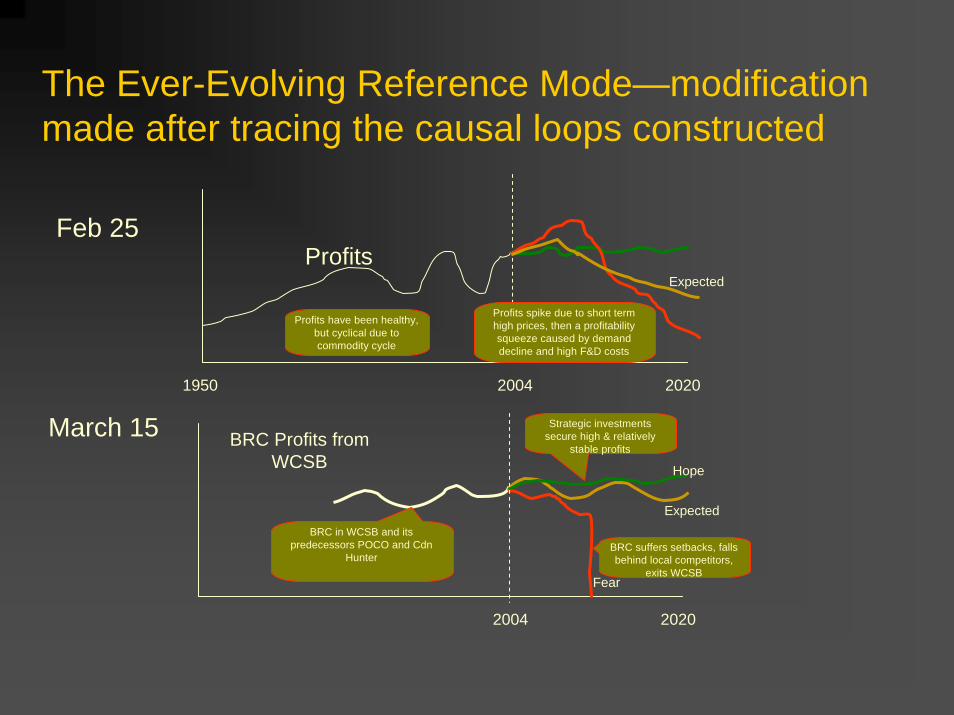
The Ever-Evolving Reference Mode—modification made after tracing the causal loops constructed
Profits
Profits spike due to short term high prices, then a profitability squeeze caused by demand decline and high F&D costs
Profits have been healthy, but cyclical due to commodity cycle
Expected
Feb 25
1950 2004 2020
March 15 BRC Profits fromWCSB
BRC suffers setbacks, falls behind local competitors,
exits WCSB
ExpectedBRC in WCSB and its
predecessors POCO and CdnHunter
Hope
Fear
Strategic investments secure high & relatively
stable profits
2004 2020
Profits 0 Total Costs 0
Finding Cost 0
+
Basin Maturity 0
+
PsychologicalAcceptance of higher
costs 0
+
+
-
costacceptance
B - Profit balan
cingFindingCost
Number ofreserves found
Activity Level
Technology/Efficiency
Appetite for risk
Demand/ProductionRequired
InvestorPerception
Capital Generation
CapacityUtilization
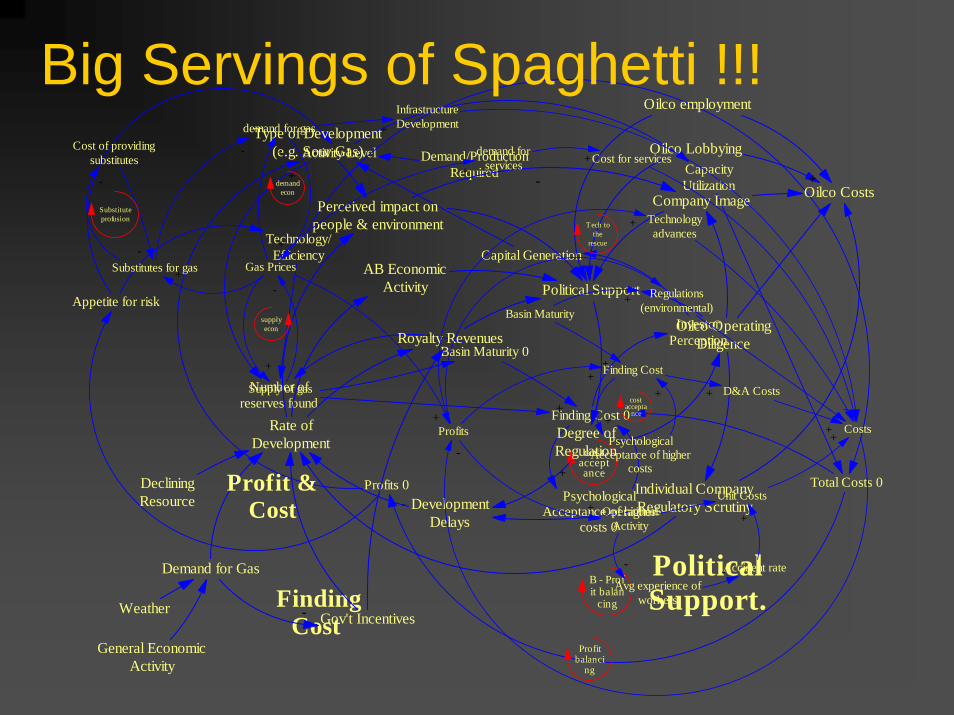
Big Servings of Spaghetti !!!
Political Support
Rate ofDevelopment
Oilco OperatingDiligence
Type of Development(e.g. Sour Gas)
Perceived impact onpeople & environment
Royalty Revenues
Oilco employment
Oilco Lobbying
Company Image Oilco Costs
DevelopmentDelays
- +
Individual CompanyRegulatory Scrutiny
Degree ofRegulation
Gov't Incentives
Demand for Gas
AB EconomicActivity
DecliningResource
-Weather
General EconomicActivity
PoliticalSupport.
Gas Prices
Profits
Cost for services
Costs
Regulations(environmental)
Finding Cost
D&A Costs
Technologyadvances
+
-
Supply of gas
demand forservices
Substitutes for gas
Cost of providingsubstitutes
-
-
demand for gas
+
+
+
+
+
+
-
+
OperationalActivity
Avg experience ofworkers
Accident rate
Unit Costs+
- -
+
+
InfrastructureDevelopment+
+
+
-
Basin Maturity
+
PsychologicalAcceptance of higher
costs
+
+
-
-
+
demandecon
supplyecon
Substituteprofusion
Tech tothe
rescue
costaccepta
nce
Profitbalanci
ng
+
Profit &Cost
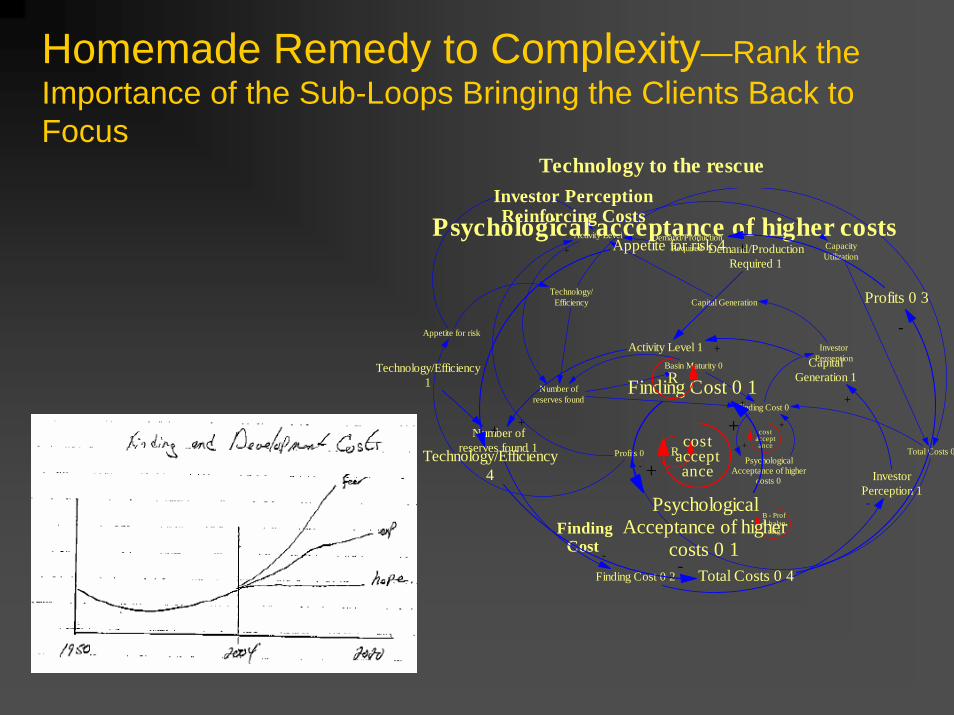
Homemade Remedy to Complexity—Rank the Importance of the Sub-Loops Bringing the Clients Back to Focus
Profits 0 Total Costs 0
Finding Cost 0
+
Basin Maturity 0
+
PsychologicalAcceptance of higher
costs 0
+
+
-
costacceptance
B - Profit balan
cingFindingCost
Number ofreserves found
Activity Level
Technology/Efficiency
Appetite for risk
Demand/ProductionRequired
InvestorPerception
Capital Generation
CapacityUtilization
Finding Cost 0 2
Investor PerceptionReinforcing Costs
Number ofreserves found 1
Activity Level 1
+
Technology/Efficiency1
Demand/ProductionRequired 1
-
InvestorPerception 1-
CapitalGeneration 1
+
+
R
Finding Cost 0 1
PsychologicalAcceptance of higher
costs 0 1
+
+cost
acceptance
Psychological acceptance of higher costs
Profits 0 3
Total Costs 0 4
-
Technology/Efficiency4
Appetite for risk 4 +
+
-
R
Technology to the rescue
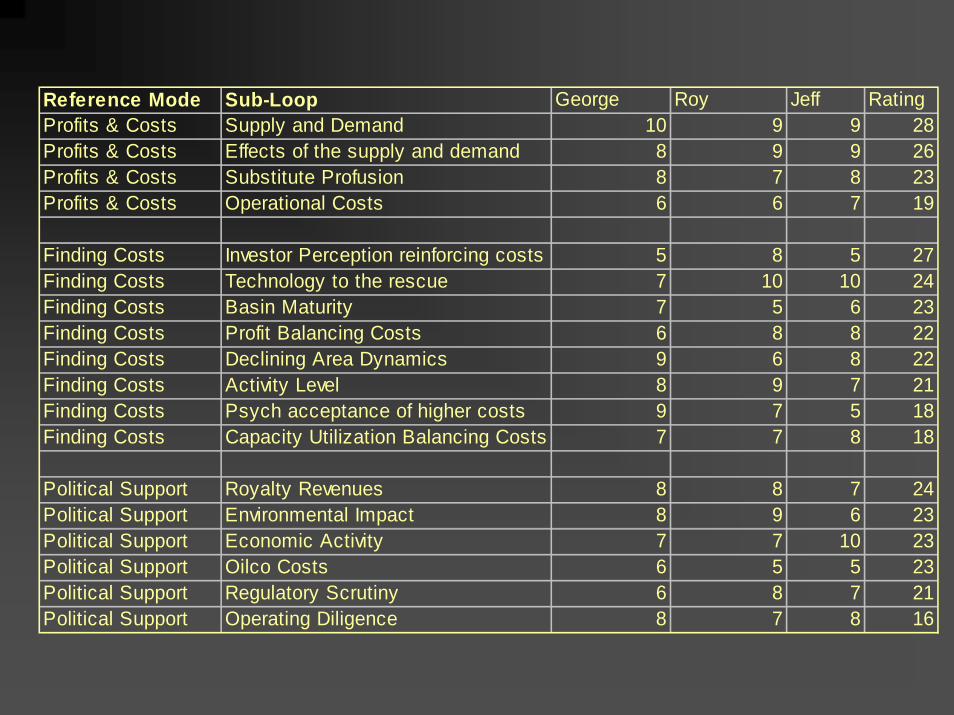
Reference Mode Sub-Loop George Roy Jeff RatingProfits & Costs Supply and Demand 10 9 9 28Profits & Costs Effects of the supply and demand 8 9 9 26Profits & Costs Substitute Profusion 8 7 8 23Profits & Costs Operational Costs 6 6 7 19
Finding Costs Investor Perception reinforcing costs 5 8 5 27Finding Costs Technology to the rescue 7 10 10 24Finding Costs Basin Maturity 7 5 6 23Finding Costs Profit Balancing Costs 6 8 8 22Finding Costs Declining Area Dynamics 9 6 8 22Finding Costs Activity Level 8 9 7 21Finding Costs Psych acceptance of higher costs 9 7 5 18Finding Costs Capacity Utilization Balancing Costs 7 7 8 18
Political Support Royalty Revenues 8 8 7 24Political Support Environmental Impact 8 9 6 23Political Support Economic Activity 7 7 10 23Political Support Oilco Costs 6 5 5 23Political Support Regulatory Scrutiny 6 8 7 21Political Support Operating Diligence 8 7 8 16
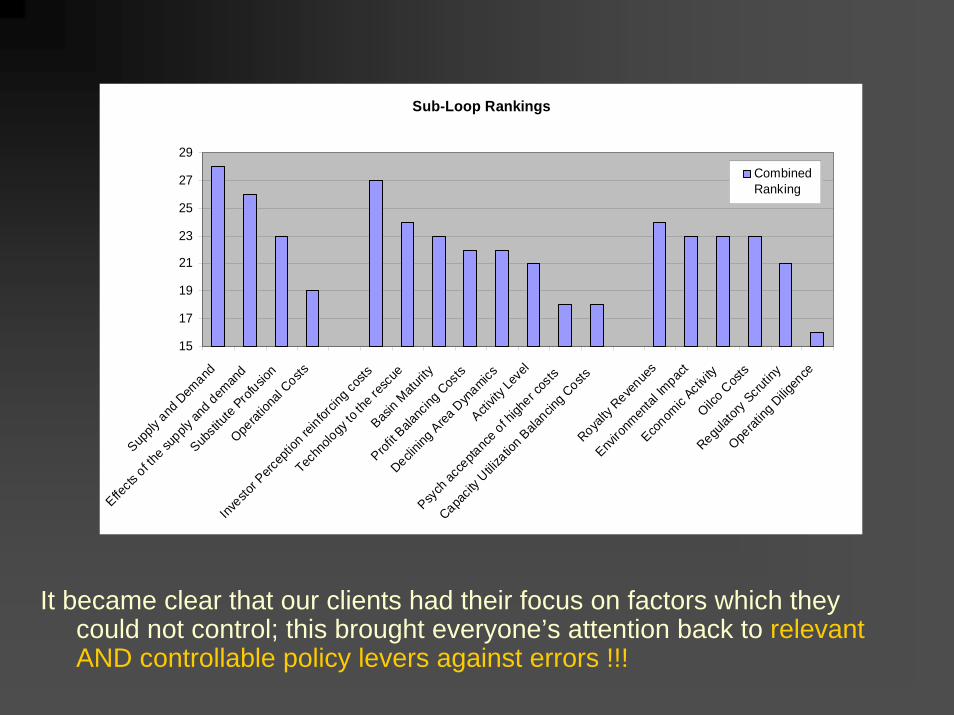
Sub-Loop Rankings
15
17
19
21
23
25
27
29
Supply
and D
emand
Effects
of the s
upply
and dem
and
Substi
tute P
rofusio
n
Operat
ional
Costs
Investo
r Perc
eptio
n rein
forcin
g costs
Techn
ology
to th
e resc
ue
Basin M
aturity
Profit B
alanc
ing C
osts
Declining
Area D
ynamics
Activit
y Lev
el
Psych
acce
ptanc
e of high
er cos
ts
Capacit
y Utiliz
ation Bala
ncing C
ostsRoya
lty R
evenue
s
Enviro
nmen
tal Im
pact
Econom
ic Acti
vity
Oilco C
osts
Regulat
ory Scru
tiny
Operat
ing D
iligen
ce
CombinedRanking
It became clear that our clients had their focus on factors which they could not control; this brought everyone’s attention back to relevant AND controllable policy levers against errors !!!
We Learned from the Client Reception of the Different Generations of Models that…
Model need not reflect operational details of client. In fact, our clients resisted model version 1.0 initially due to too much operational detail.
At the end, we had to remind the clients that the model is not reality and should not be used to generate magical numbers for policy-making.

Finally…Finally…
It's hard letting go of our baby at the end!
Last but not Least…Last but not Least…
“I would like your mailing addresses so we can send you a small token of appreciation.”
-George CoppusMay 12th, 2004