Embed Size (px)
Citation preview
b u s i ne s s s t ra t e g i e s
In a previous issueof M a n a g e m e n t(April 2002), webriefly examinedbusiness intelli-gence (BI) toolsand their role invalue-added deci-
sion making. BI essentially supports a corporation’stransition from being data rich and information poor,to becoming information rich and capable of betterfact-based decision making. Recent events have high-lighted the importance of senior management havingthis operational and financial information. An effec-tive use of BI should ensure that the right informa-tion is made available to the right decision makers atthe right time.
A management initiative
BI is one of the most robust managerial initiativesthat smart managers can employ to help their organi-zations create more value for shareholders. Other ini-tiatives include activity-based costing/management(ABC/M), economic value creation (EVC) and thebalanced scorecard.
BI has been described in various ways. Below are afew examples:● BI is about having the right information available
to the right decision makers at the right time tohelp organizations make better decisions faster.
● BI is an effective way to link systems that tradi-tionally don’t communicate well, to ensure thatthe mountains of data in different legacy systemsare converted into accessible information.
● BI is a decision support system that employs arational approach to management. It uses a fact-based approach to decision making to ensure thatan organization achieves a competitive advantage.
In sum, BI is an enterprise-wide strategy that sup-ports reporting, analysis and decision making on mul-tiple levels. It supports organization-wide analysis,which in turn leads to insight, action, and the propermeasurement of results.
The BI approach has been successful at givingmany leading companies an edge over the competitionbecause it brings people and technology together to
solve problems. It is our experience that as a management initiative, theBI approach involves one major hurdle. Because it empowers decisionmakers, members of an organization who previously wielded power andinfluence by maintaining a handle on information have a lot to lose.Thus, the possibility of one or two people stonewalling a BI initiativeand its successful implementation can’t be completely discounted.
The method
To successfully implement BI, we recommend following a six-stepa p p r o a c h :1. Identify what needs to be addressed with a BI solution. A successful
BI initiative can’t exist in a vacuum. It has to be linked to businessstrategies and goals.
2. Identify the multiple data sources that currently exist within theorganization. Most organizations are drowning in data that are kept
Business intelligence in action T h ree examples of how it really works
CMA MANAGEMENT 1 5 March 2003
By Kobana Abukari, CMA, and Vijay Jog
Three real-world examples
Existing research indicates that analysts and managers typicallyspend more than half of their time number crunching in Excel.More time is spent making the reports look pretty. These don’t addvalue and are often boring activities, but they have to be done — thereporting environment demands this time and energy investment.But a well-designed BI solution can free up this time for more stim-ulating work such as analysis and data mining. The following arereal-world examples, although for confidentiality, the companies’names have not been included. Their experiences are not unique andinclude valuable lessons for anyone considering a BI solution.
BI in finance
A leading government agency with over 5,000 employees spreadacross all the provinces and territories of Canada faced several chal-lenges in its finance department. Among other things:● The agency had separate financial systems for more than 28
regional offices and had great difficulty obtaining a central, con-solidated view of operations.
● Finance department staff members spent several days construct-ing reports.
● When simple questions were asked about the reports the depart-ment produced, it took even more time to provide answers(which were fraught with errors).
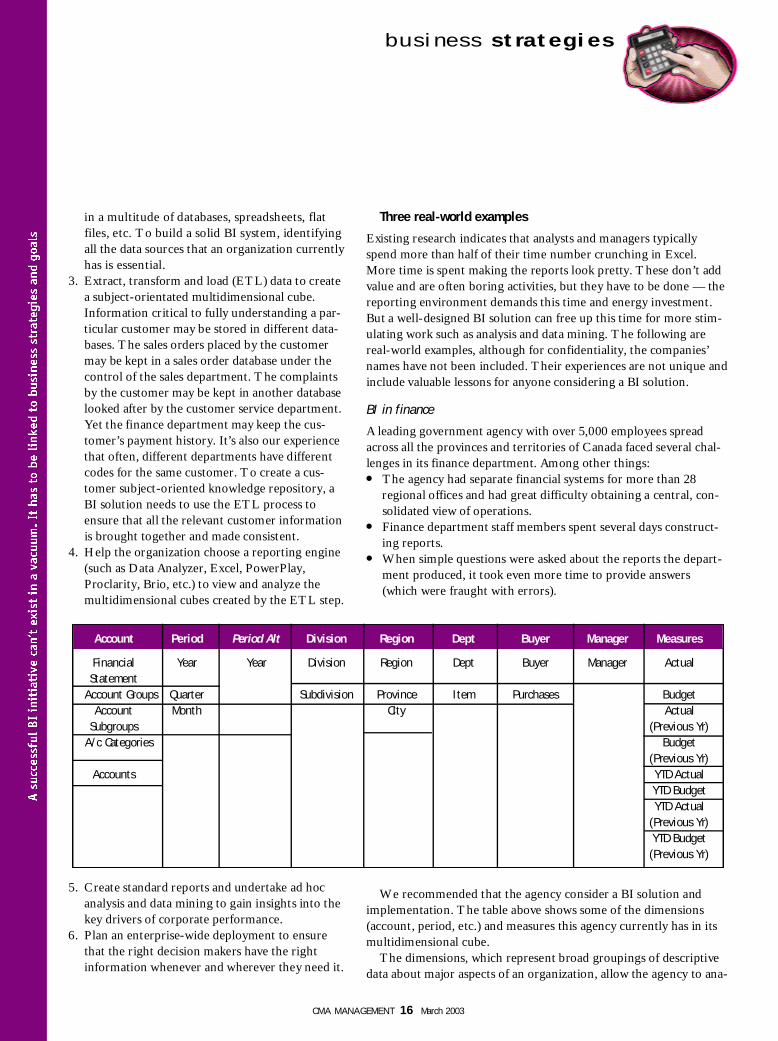
We recommended that the agency consider a BI solution andimplementation. The table above shows some of the dimensions(account, period, etc.) and measures this agency currently has in itsmultidimensional cube.
The dimensions, which represent broad groupings of descriptivedata about major aspects of an organization, allow the agency to ana-
in a multitude of databases, spreadsheets, flatfiles, etc. To build a solid BI system, identifyingall the data sources that an organization currentl yhas is essential.
3. Extract, transform and load (ETL) data to createa subject-orientated multidimensional cube.Information critical to fully understanding a par-ticular customer may be stored in different data-bases. The sales orders placed by the customermay be kept in a sales order database under thecontrol of the sales department. The complaintsby the customer may be kept in another databaselooked after by the customer service department.Yet the finance department may keep the cus-tomer’s payment history. It’s also our experiencethat often, different departments have differentcodes for the same customer. To create a cus-tomer subject-oriented knowledge repository, aBI solution needs to use the ETL process toensure that all the relevant customer informationis brought together and made consistent.
4. Help the organization choose a reporting engine(such as Data Analyzer, Excel, PowerPlay,Proclarity, Brio, etc.) to view and analyze themultidimensional cubes created by the ETL step.
5. Create standard reports and undertake ad hocanalysis and data mining to gain insights into thekey drivers of corporate performance.
6. Plan an enterprise-wide deployment to ensurethat the right decision makers have the rightinformation whenever and wherever they need it.
CMA MANAGEMENT 1 6 March 2003
b u s i ne s s s t ra t e g i e s
A c c o u n t P e r i o d Period Alt D i v i s i o n R e g i o n D e p t B u y e r M a n a g e r M e a s u r e s
Financial Y e a r Y e a r D i v i s i o n R e g i o n D e p t B u y e r M a n a g e r A c t u a lS t a t e m e n t
Account Groups Q u a r t e r S u b d i v i s i o n P r o v i n c e I t e m P u r c h a s e s B u d g e tAccount M o n t h C i t y A c t u a l
S u b g r o u p s (Previous Yr)A/c Categories Budget
(Previous Yr)A c c o u n t s YTD Actual
YTD BudgetYTD Actual
(Previous Yr)YTD Budget (Previous Yr)
All in all, this agency is happy with its BI solution because:● monthly multidimensional cubes it creates provide a consolidated
view of financial performance across different locations;● Decision makers are able to answer ad hoc questions in seconds;● Reports are presented in user-friendly formats, and can be
accessed on demand; and● More finance department time is spent on value-added activities.
The motivational effects of moving from routine repetitive tasksto more advanced analysis have been great.
BI in manufacturing
A premier manufacturer of products and materials derived fromengineered, recycled rubber kept cost, sales and inventory data inseparate mainframe and mini-mainframe proprietary systems.These systems used different IDs for products and processes. Itwas unduly burdensome to understand profitability and qualityissues, let alone handling inventory control. The company hadfour staff just compiling data from various systems. On a monthlybasis, a 20’ x 8’ wall of Excel pivot tables had to be generated to tryto understand unit margins by product, vendor and customer. Theinformation contained in the pivot tables was so overwhelmingthat it couldn’t support managerial decision making. And it took along time to generate reports.
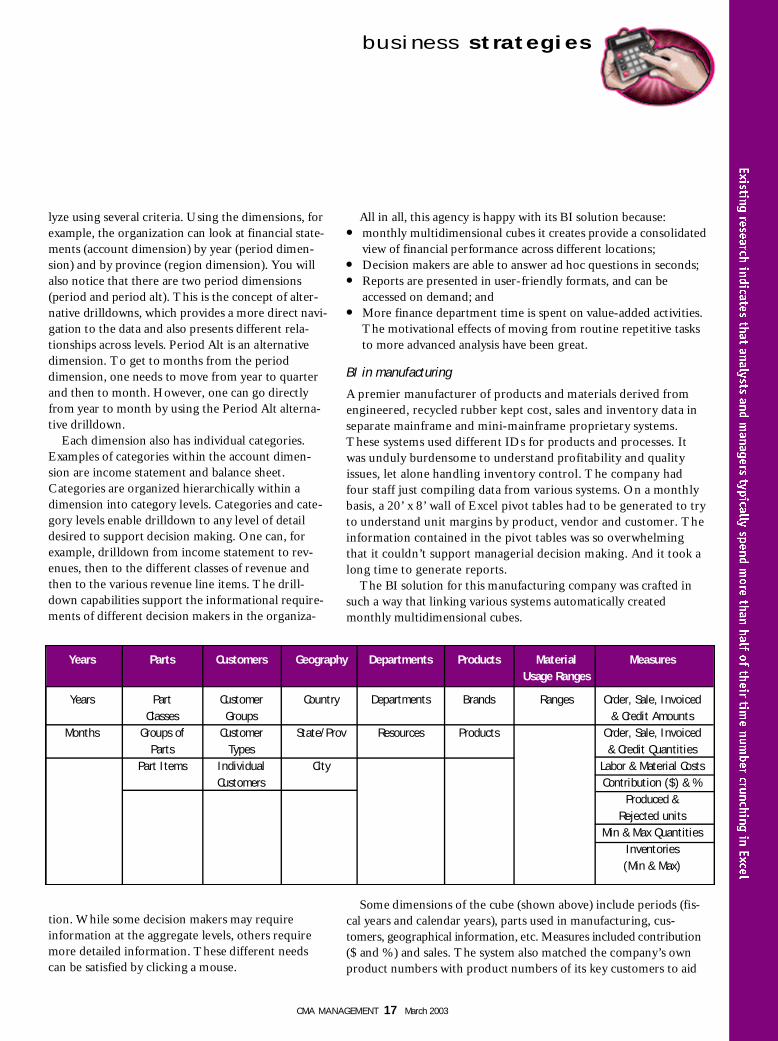
The BI solution for this manufacturing company was crafted insuch a way that linking various systems automatically createdmonthly multidimensional cubes.
Some dimensions of the cube (shown above) include periods (fis-cal years and calendar years), parts used in manufacturing, cus-tomers, geographical information, etc. Measures included contribut i o n($ and %) and sales. The system also matched the company’s ownproduct numbers with product numbers of its key customers to aid
lyze using several criteria. Using the dimensions, forexample, the organization can look at financial state-ments (account dimension) by year (period dimen-sion) and by province (region dimension). You willalso notice that there are two period dimensions(period and period alt). This is the concept of alter-native drilldowns, which provides a more direct navi-gation to the data and also presents different rela-tionships across levels. Period Alt is an alternativedimension. To get to months from the perioddimension, one needs to move from year to quarterand then to month. However, one can go directlyfrom year to month by using the Period Alt alterna-tive drilldown.
Each dimension also has individual categories.Examples of categories within the account dimen-sion are income statement and balance sheet.Categories are organized hierarchically within adimension into category levels. Categories and cate-gory levels enable drilldown to any level of detaildesired to support decision making. One can, forexample, drilldown from income statement to rev-enues, then to the different classes of revenue andthen to the various revenue line items. The drill-down capabilities support the informational require-ments of different decision makers in the organiza-
tion. While some decision makers may requireinformation at the aggregate levels, others requiremore detailed information. These different needscan be satisfied by clicking a mouse.
CMA MANAGEMENT 1 7 March 2003
b u s i ne s s s t ra t e g i e s
Y e a r s P a r t s C u s t o m e r s G e o g r a p h y D e p a r t m e n t s P r o d u c t s Material M e a s u r e sUsage Ranges
Y e a r s Part Customer C o u n t r y D e p a r t m e n t s B r a n d s R a n g e s Order, Sale, Invoiced C l a s s e s G r o u p s & Credit Amounts
M o n t h s Groups of C u s t o m e r S t a t e / P r o v R e s o u r c e s P r o d u c t s Order, Sale, Invoiced P a r t s T y p e s & Credit Quantities
Part Items I n d i v i d u a l C i t y Labor & Material CostsC u s t o m e r s Contribution ($) & %
Produced &Rejected units
Min & Max QuantitiesInventories (Min & Max)
CMA MANAGEMENT 1 8 March 2003
electronic transfer of information. Individual cubestailored to each sales person, sales territory, specificcustomer, specific part type, etc. could easily becreated and deployed across the enterprise —avoiding information overload while protectinginformation security.
This BI solution also allows the company to:● Match purchasing and selling activities;● Calculate margins;● Maintain a level of control over inventory;● Perform more useful analysis; and● Generate reports reasonably promptly.
BI in HR
Effective and efficient human resource manage-ment is critical if an organization is to continue to
innovate and grow. BI has helped leading organiza-tions in both the private sector and public sectorremain relevant as their environments change.
The HR department of a large national organi-zation faced multiple challenges including:● Difficulty reconciling salary information in the
HR system to salary expense in the generall e d g e r ;
● Difficulty getting information on vital statisticssuch as employment equity, training and devel-opment and other benefits;
● Using several manual days to produce a labourdistribution report (from the HR system) in a
format that wasn’t user-friendly; and● Difficulty responding to many urgent and ad-hoc requests for
information, including training courses taken, employment equi-ty, succession challenges in specific management categories andgeographical locations, employee turnover across specific loca-tions, etc.
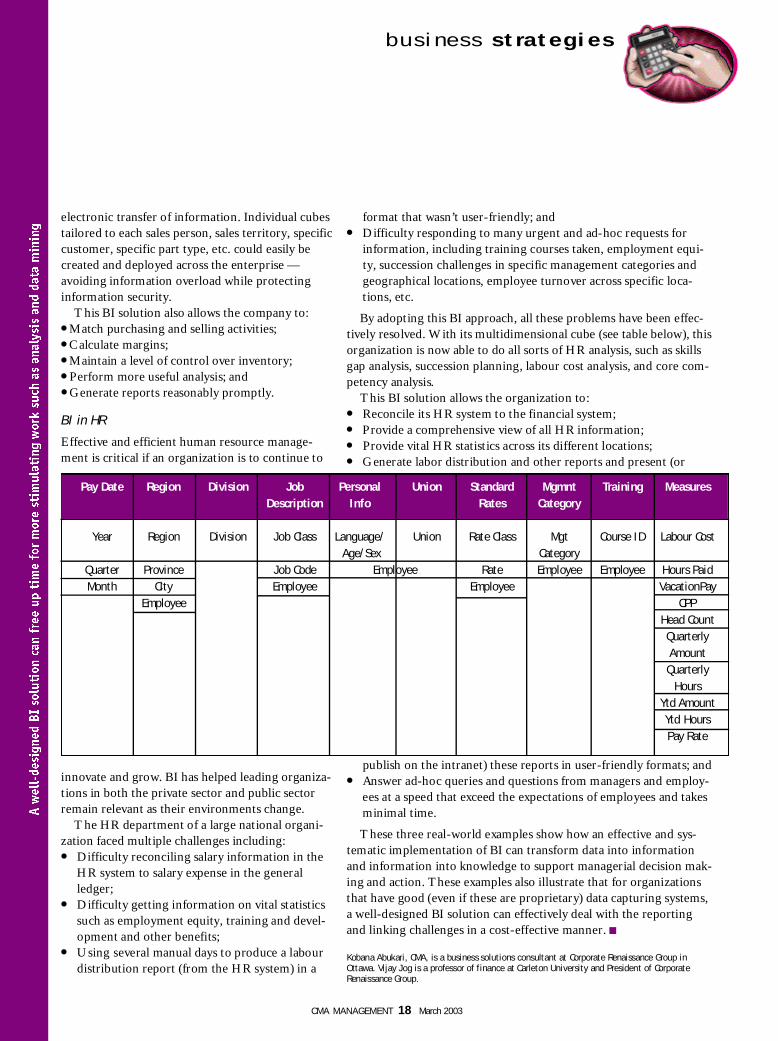
By adopting this BI approach, all these problems have been effec-tively resolved. With its multidimensional cube (see table below), thisorganization is now able to do all sorts of HR analysis, such as skillsgap analysis, succession planning, labour cost analysis, and core com-petency analysis.
This BI solution allows the organization to:● Reconcile its HR system to the financial system; ● Provide a comprehensive view of all HR information;● Provide vital HR statistics across its different locations;● Generate labor distribution and other reports and present (or
publish on the intranet) these reports in user-friendly formats; and● Answer ad-hoc queries and questions from managers and employ-
ees at a speed that exceed the expectations of employees and takesminimal time.
These three real-world examples show how an effective and sys-tematic implementation of BI can transform data into informationand information into knowledge to support managerial decision mak-ing and action. These examples also illustrate that for organizationsthat have good (even if these are proprietary) data capturing systems,a well-designed BI solution can effectively deal with the reportingand linking challenges in a cost-effective manner. ■
Kobana Abukari, CMA, is a business solutions consultant at Corporate Renaissance Group inOttawa. Vijay Jog is a professor of finance at Carleton University and President of CorporateRenaissance Group.
Pay Date R e g i o n D i v i s i o n J o b Personal U n i o n Standard Mgmnt Training M e a s u r e sD e s c r i p t i o n I n f o R a t e s C a t e g o r y
Y e a r R e g i o n D i v i s i o n Job Class Language/ Union Rate Class Mgt Course ID Labour CostA g e / S e x C a t e g o r y
Q u a r t e r P r o v i n c e Job Code Employee R a t e Employee Employee Hours PaidM o n t h C i t y Employee Employee V a c a t i o n P a y
E m p l o y e e C P PHead Count Quarterly Amount Quarterly
Hours Ytd Amount Ytd Hours Pay Rate
b u s i ne s s s t ra t e g i e s