Embed Size (px)
Citation preview
Business model innovation within the
Norwegian energy sector A comparative case study of business model innovation applied
by ABB and DNVGL to adapt to the energy change in Norway
Hao Wu
MSc in Innovation and Entrepreneurship
Centre for Entrepreneurship
The Faculty of Mathematics and Natural Sciences
UNIVERSITETET I OSLO
1 September 2015

II
Copyright © Hao Wu
2015
Business model innovation within the Norwegian energy sector—A comparative case study of
business model innovation applied by ABB and DNVGL to adapt to the energy change in
Norway
Author: Hao Wu
http://www.duo.uio.no
Press: Reprosentralen, Universitetet i Oslo

III
Acknowledgements
I WOULD LIKE TO THANK:
my husband Mark, for full love and support, being a good company and to always cheer me
up
my mother and father for always loving me and supporting me, spiritually and financially
my sister Yao, for always loving me and supporting me selflessly like my little mother
my nephew Peng peng, for inspiring me by showing a great interest in reading and learning
my friend Jonathan van de Sande, for being there for me and checking all the details of my
writing
my friend Yining, for encouraging and trusting me and always supporting me
my supervisor, Tor Borgar, for giving me constructive criticism and clear guidance
my supervisor, Xiaolin, for giving me critical academic suggestions and useful advices
my friend Lene Jahnsen, for her precious, thorough and academic comments
my friend Mali Brødreskift, for her useful comments and detail check
my teacher Daniel Leunbach, for recommending me useful book and article
my friend Sumi, for discussing with me and gearing me up
The interviewees from both firms, you guys are really nice and extremely professional. I feel
lucky having this chance to get to know your company and to learn from you all
IV
Abstract The trend of energy change affects the Norwegian energy sector. Due to the relatively
nascent and rapid advancing nature of the industry, BMI in the energy sector is a new domain
that has not been explored much in the literature. This thesis explores how suppliers in the
Norwegian energy sector respond and adapt to the context change by innovating their
business models. Through a qualitative case study with an explorative and comparative
design, the author compared the case of ABB and DNVGL and demonstrated the different
BMI approaches that are applied by firms in the sector.
The findings indicate that technology is both the core competence for the firm as well as the
dominant factor for BMI. The success of technology commercialization is based on a good
value proposition and BMI, but if the technology is unique as an outstanding offering of the
business model, it may lighten the importance of BMI, and will dominate the BMI. Except
the technology factor, the BMI differs based on the firm’s culture and cognition. A different
degree of flexibility in the extent of implementing BMI between product-based firm and
service-centred firm is due to firm’s value creation difference and essentially due to the
firm’s culture and cognition difference. The results indicate that the BMI in the product-
based firm is more likely to be influenced by the end user, but the BMI in the service-centred
firm is more likely to influence the end user. It would be interesting to conduct more
interviews across a number of suppliers who vary in size, resources and brand popularity to
determine how the BMI will be impacted by these factors, and to highlight the main
difference between product-based firm and service-centred firm in applying BMI.
V
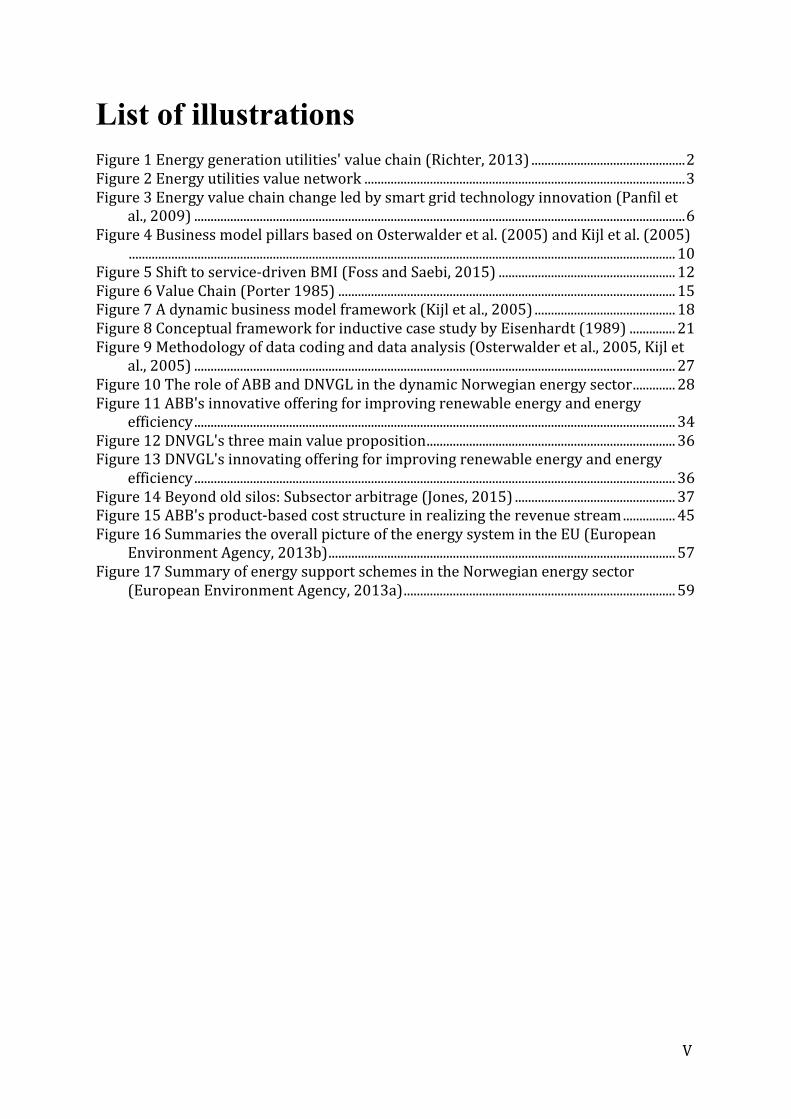
List of illustrations Figure 1 Energy generation utilities' value chain (Richter, 2013) ............................................... 2 Figure 2 Energy utilities value network .................................................................................................. 3 Figure 3 Energy value chain change led by smart grid technology innovation (Panfil et
al., 2009) ...................................................................................................................................................... 6 Figure 4 Business model pillars based on Osterwalder et al. (2005) and Kijl et al. (2005)
....................................................................................................................................................................... 10 Figure 5 Shift to service-‐driven BMI (Foss and Saebi, 2015) ...................................................... 12 Figure 6 Value Chain (Porter 1985) ....................................................................................................... 15 Figure 7 A dynamic business model framework (Kijl et al., 2005) ........................................... 18 Figure 8 Conceptual framework for inductive case study by Eisenhardt (1989) .............. 21 Figure 9 Methodology of data coding and data analysis (Osterwalder et al., 2005, Kijl et
al., 2005) ................................................................................................................................................... 27 Figure 10 The role of ABB and DNVGL in the dynamic Norwegian energy sector ............. 28 Figure 11 ABB's innovative offering for improving renewable energy and energy
efficiency ................................................................................................................................................... 34 Figure 12 DNVGL's three main value proposition ............................................................................ 36 Figure 13 DNVGL's innovating offering for improving renewable energy and energy
efficiency ................................................................................................................................................... 36 Figure 14 Beyond old silos: Subsector arbitrage (Jones, 2015) ................................................. 37 Figure 15 ABB's product-‐based cost structure in realizing the revenue stream ................ 45 Figure 16 Summaries the overall picture of the energy system in the EU (European
Environment Agency, 2013b) .......................................................................................................... 57 Figure 17 Summary of energy support schemes in the Norwegian energy sector
(European Environment Agency, 2013a) ................................................................................... 59
VI
List of tables Table 1 Abbreviation overview ............................................................................................................... VII Table 2 Business model pillars and nine building blocks (Osterwalder et al., 2005)
(Osterwalder and Pigneur, 2010) .................................................................................................. 11 Table 3 Introduction of analysis units ................................................................................................... 21 Table 4 Primary data collection ................................................................................................................ 23 Table 5 Dynamic context change and the general innovation applied by ABB & DNVGL
reacting to the change ......................................................................................................................... 33 Table 6 Offering analysis ............................................................................................................................. 37 Table 7 Customer interface analysis ...................................................................................................... 42 Table 8 Infrastructure management analysis .................................................................................... 44 Table 9 Financial aspects analysis ........................................................................................................... 46 Table 10 Analysis categories and interview questions .................................................................. 56
VII
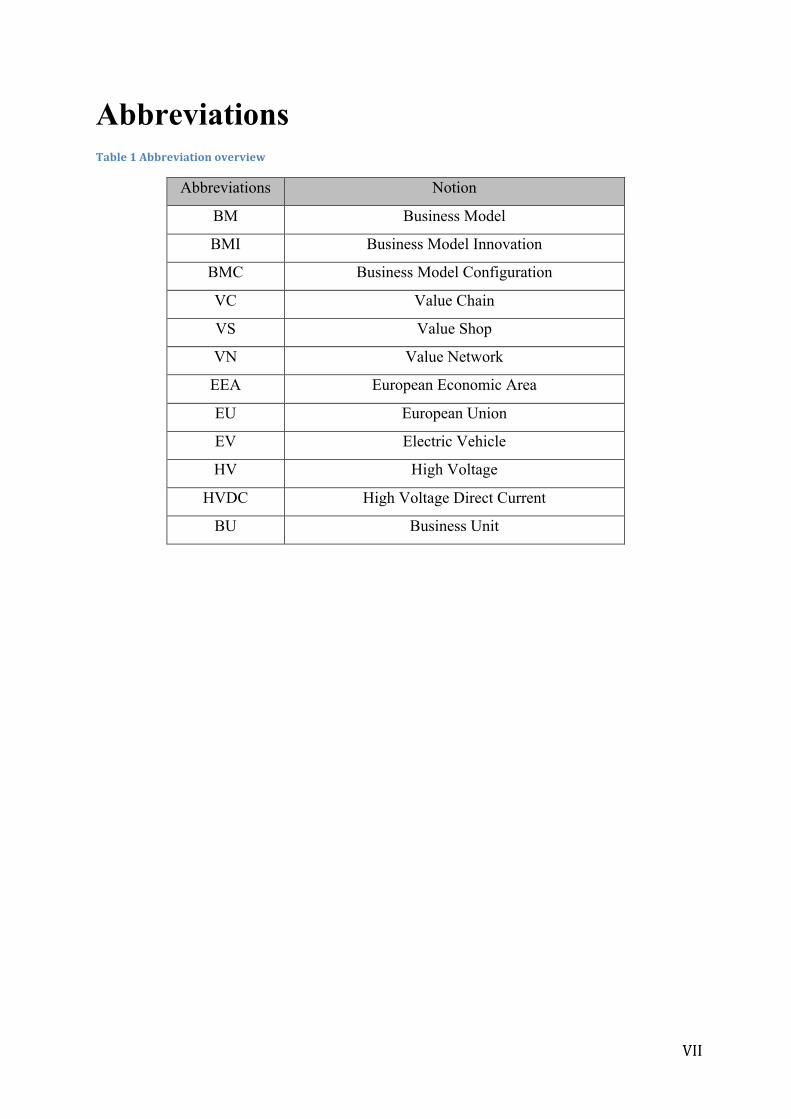
Abbreviations Table 1 Abbreviation overview
Abbreviations Notion
BM Business Model
BMI Business Model Innovation
BMC Business Model Configuration
VC Value Chain
VS Value Shop
VN Value Network
EEA European Economic Area
EU European Union
EV Electric Vehicle
HV High Voltage
HVDC High Voltage Direct Current
BU Business Unit
VIII
Contents
Acknowledgements ..................................................................................................................... III
Abstract ............................................................................................................................................ IV
List of illustrations ......................................................................................................................... V List of tables .................................................................................................................................... VI
Abbreviations ............................................................................................................................... VII 1 Introduction .............................................................................................................................. 1 1.1 Why a study on BMI within the Norwegian energy sector? ............................................. 1 1.2 Suppliers and the energy sector value network .................................................................. 2 1.3 Norwegian energy policy and the action plan ...................................................................... 3 1.4 Changes in Norwegian energy sector scenario in the study timelines ........................ 5 1.5 Rationale of the research ............................................................................................................ 7 1.6 Research question ......................................................................................................................... 8 1.7 Objectives of the study ................................................................................................................. 8 1.8 Layout of the study ........................................................................................................................ 8
2 Theory framework and literature review ...................................................................... 9 2.1 Business Model Framework ....................................................................................................... 9 2.1.1 Business model ......................................................................................................................................... 9 2.1.2 Business model configuration ............................................................................................................ 9 2.1.3 A cognitive perspective of BMI ........................................................................................................ 13 2.1.4 A dynamic context perspective of BMI ......................................................................................... 13 2.1.5 BMI in the energy sector ..................................................................................................................... 14
2.2 Value Creation Framework ..................................................................................................... 14 2.2.1 Value chain and its elements ............................................................................................................ 15 2.2.2 From value chain to value shop and value network ............................................................... 16 2.2.3 Firm’s culture and cognition based on value creation logic ................................................ 16
2.3 Dynamic Business Model .......................................................................................................... 17 3 Research Methodology ........................................................................................................ 20 3.1 Research design ........................................................................................................................... 20 3.2 Conceptual framework ............................................................................................................. 21 3.3 Introduction of analysis units ................................................................................................. 21 3.4 Data Collection ............................................................................................................................. 22 3.4.1 Primary Data ............................................................................................................................................ 22 3.4.2 Secondary Data ....................................................................................................................................... 23 3.4.3 Data Reliability ........................................................................................................................................ 23 3.4.4 Data Validity ............................................................................................................................................. 24
3.5 Question design and interviewee selection ....................................................................... 25 3.6 Data Coding and Analysing ...................................................................................................... 26
4 Results Analysis ..................................................................................................................... 28 4.1 Analysis units in the dynamic context ................................................................................. 28 4.1.1 The government energy target and action on generation, distribution and consumption ............................................................................................................................................................ 28 4.1.2 How do leading suppliers adjust to the changing environment? ...................................... 31

IX
4.2 Offering ........................................................................................................................................... 34 4.3 Customer interface ..................................................................................................................... 39 4.4 Infrastructure management .................................................................................................... 42 4.5 Financial aspects ......................................................................................................................... 45
5 Discussion and conclusion ................................................................................................. 47
References ...................................................................................................................................... 53 Appendix 1: Interview Questions ........................................................................................... 56
Appendix 2: Summaries the overall picture of the energy system in the EU ........... 57 Appendix 3: Summary of energy support schemes in the Norwegian energy sector ............................................................................................................................................................ 58
1
1 Introduction 1.1 Why a study on BMI within the Norwegian
energy sector? This thesis explores the question of how suppliers in the Norwegian energy sector respond
and adapt to context changes by innovating their business models. This overall topic is
discussed in the particular context of Norwegian energy sector, and the study is implemented
during the time that the energy change became a trend affecting the whole scenario and the
public mind-set. A study on BMI in the Norwegian energy sector is chosen mainly based on
the author’s personal interest in the field, as well as the geographic proximity. With eight
years of experiences working for suppliers of equipment and services in the energy sector, the
author is fascinated by observing the dynamic abilities to the ever-changing conditions in the
industry.
Firstly, Norway is rich in renewable energy resources especially in hydropower, the resource
that used to generate 100% of electricity in Norway. However, this situation is changing
because the government is strongly encouraging a more diversified energy utility in order to
achieve the country energy target; Secondly, the Norwegian government is both changing its
regulations for renewable energy, and creating funds for economic support for these
companies. This creates a dynamic industry that needs to develop new business model to
adapt to. This study wishes to uncover different methods of BMI that are stimulated by these
governmental initiatives. Therefore, it is particularly interesting to discover the change in the
Norwegian energy sector and to learn BMI applied by the analysis units reacting to the
change.
Besides the professional perspectives, academic perspectives also motivate this study. From
an academic standpoint, we know a lot about how organizations respond to change (e.g.,
(Duncan, 1972)), there is also research on how firms apply BMI (e.g., (Chesbrough, 2007)),
however, very few studies have explored this particular issue in the energy change scenario.
Zott et al. (2011) summarizes three main research trends in the literature on business models.
The first big part is e-business or digital market, the second part is strategy and the last part is
technology and innovation management. Recently, some literatures on renewable energy
utility’s BMI has drawn academic’s attention (e.g., (Richter, 2013, Huijben and Verbong,
2
2013)). However BMI studies that target the industrial equipment and service suppliers in the
energy sector have not yet been performed.
1.2 Suppliers and the energy sector value network In order to clearly present the study objective, the notions ‘suppliers’ and ‘utilities’ in the
energy sector should be clarified and differentiated.
In this study, the ‘suppliers’ are the firms who sell equipment, engineering, or service to the
energy generation utilities. Also included are those who sell to the firms on the utilities’ value
chain that distribute and consume energy.
The ‘utilities’ represent energy-generating firms. In the Norwegian energy sector, these
energy-generating firms are electric power generation companies based on all kinds of
renewable energy, such as hydropower, solar energy, biomass, and wind power etc. The
biggest renewable energy producer is a state owned company Statkraft, which has more than
230 hydro power plants, and a few wind power plants in Norway. The electricity distribution-
electric network is operated and managed by another state owned company Statnett1. There
are three main parts of the electricity consumption: industry customer, transportation and
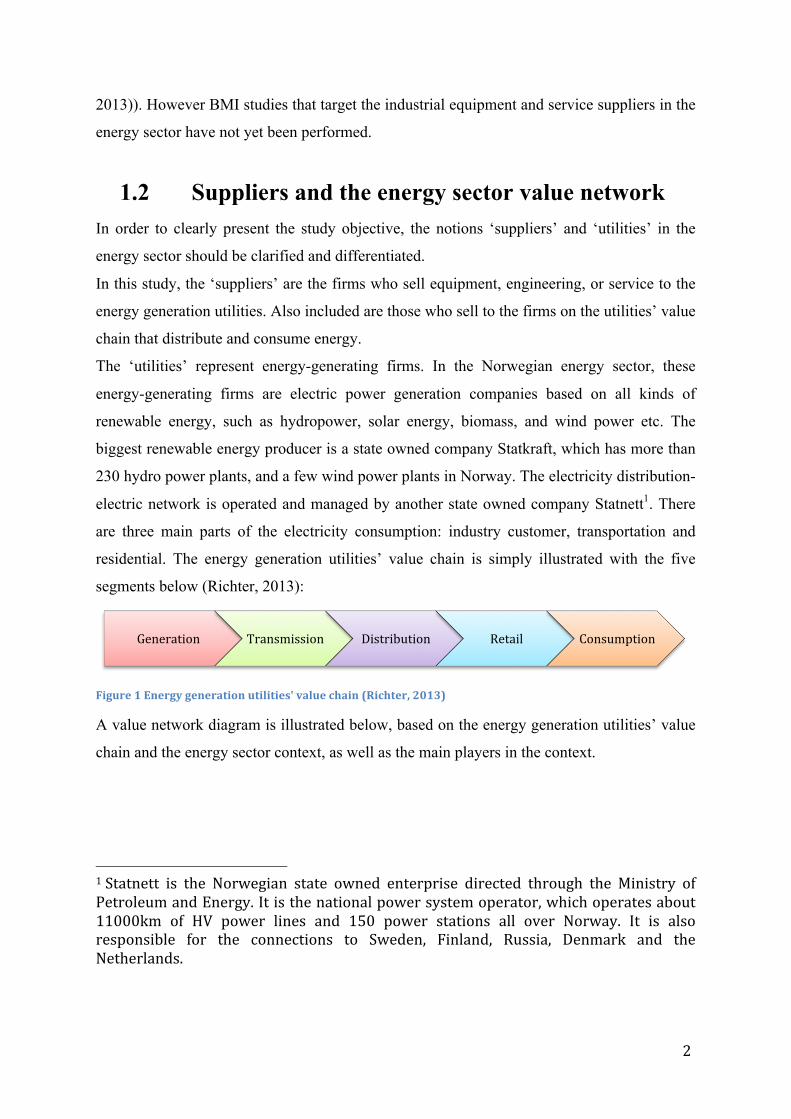
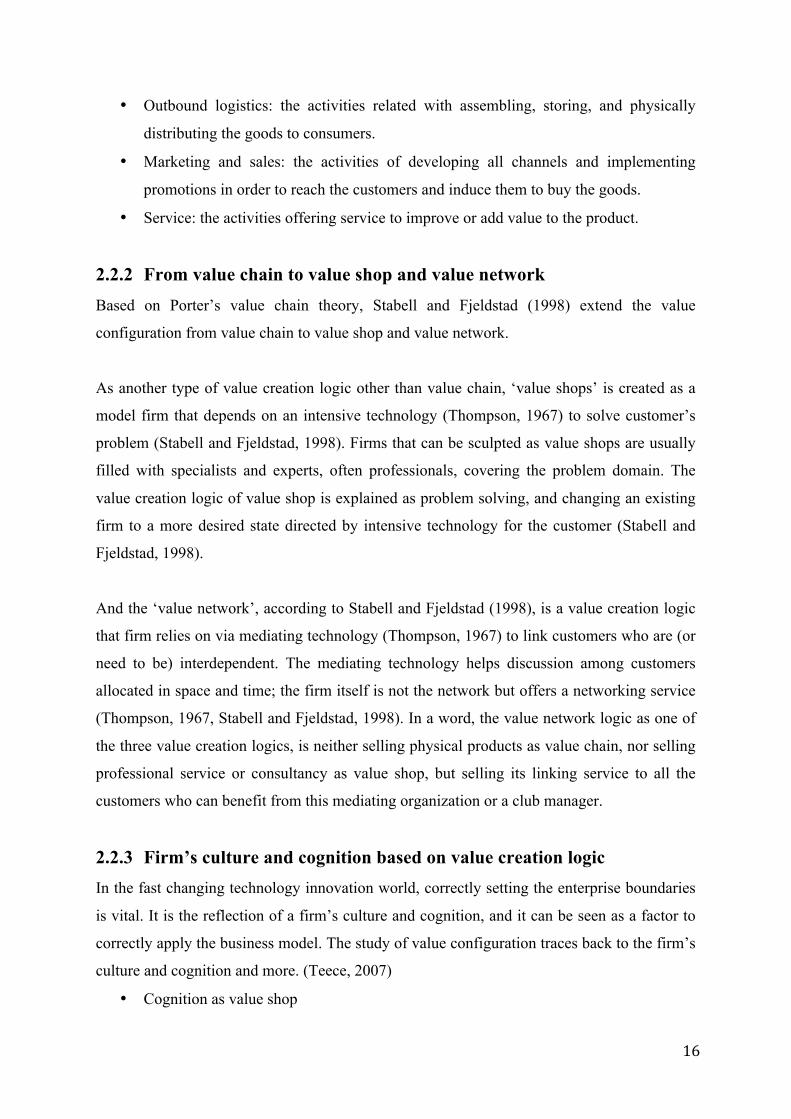
residential. The energy generation utilities’ value chain is simply illustrated with the five
segments below (Richter, 2013):
Figure 1 Energy generation utilities' value chain (Richter, 2013)
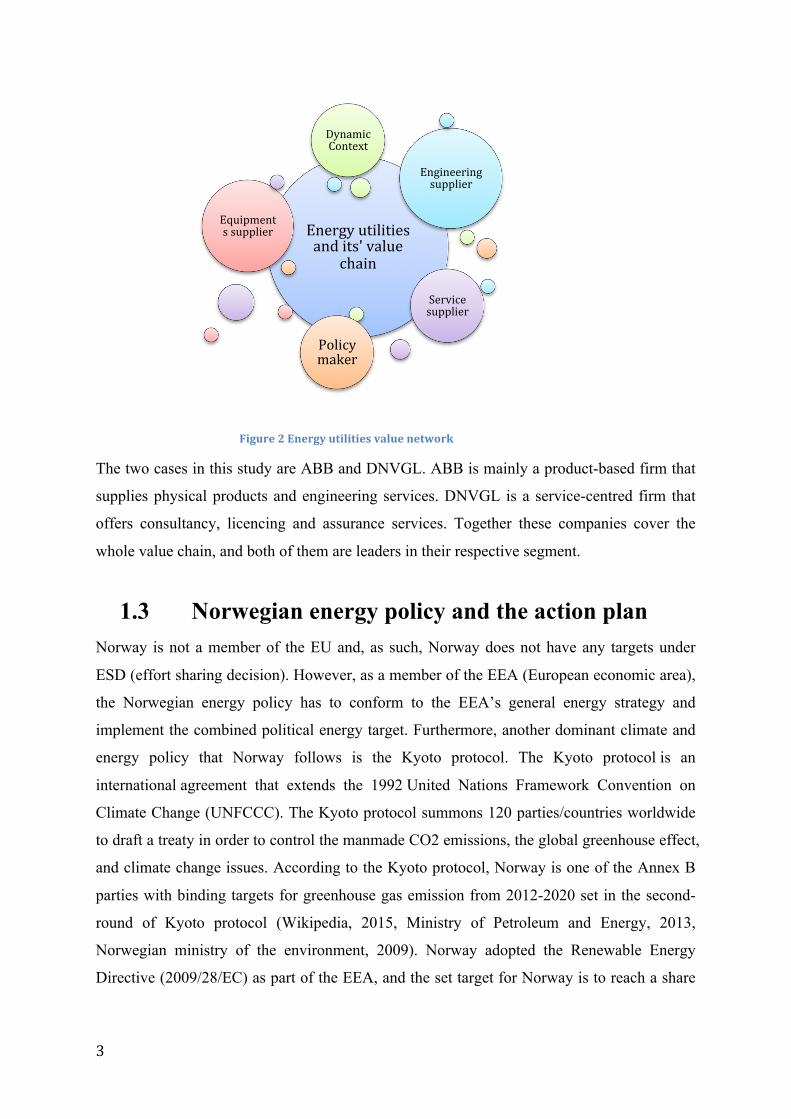
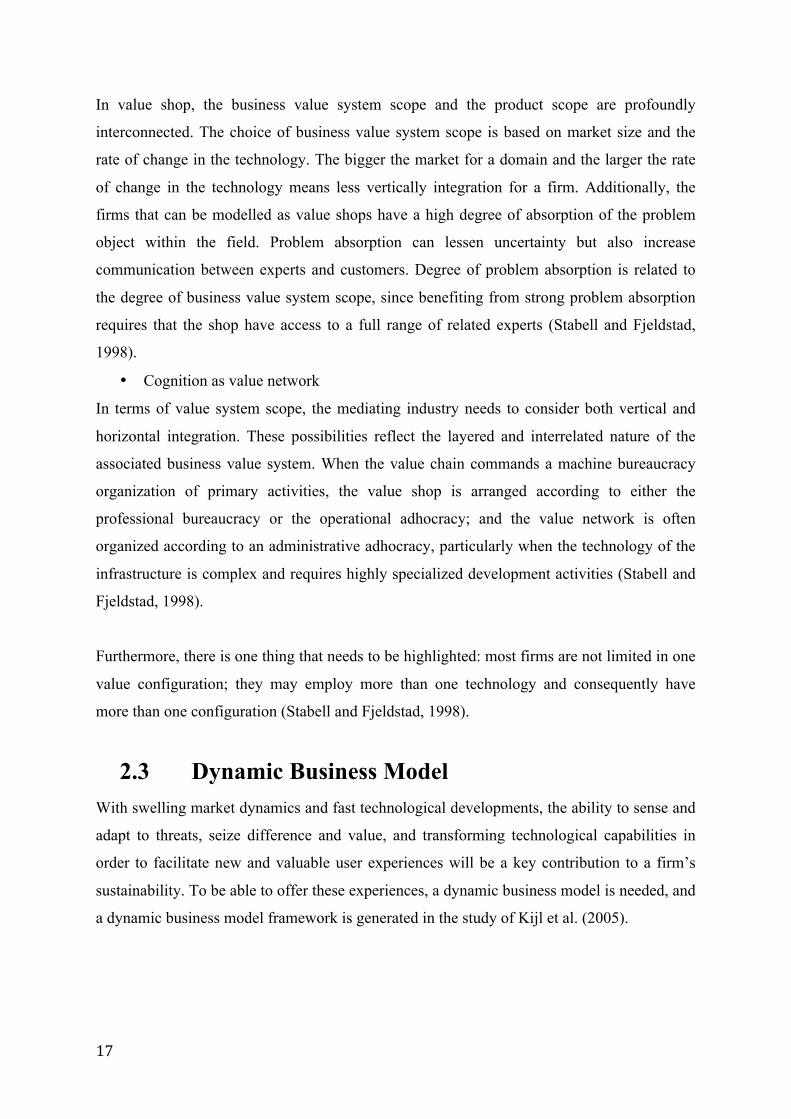
A value network diagram is illustrated below, based on the energy generation utilities’ value
chain and the energy sector context, as well as the main players in the context.
1 Statnett is the Norwegian state owned enterprise directed through the Ministry of Petroleum and Energy. It is the national power system operator, which operates about 11000km of HV power lines and 150 power stations all over Norway. It is also responsible for the connections to Sweden, Finland, Russia, Denmark and the Netherlands.
Generation Transmission Distribution Retail Consumption
3
Figure 2 Energy utilities value network
The two cases in this study are ABB and DNVGL. ABB is mainly a product-based firm that
supplies physical products and engineering services. DNVGL is a service-centred firm that
offers consultancy, licencing and assurance services. Together these companies cover the
whole value chain, and both of them are leaders in their respective segment.
1.3 Norwegian energy policy and the action plan Norway is not a member of the EU and, as such, Norway does not have any targets under
ESD (effort sharing decision). However, as a member of the EEA (European economic area),
the Norwegian energy policy has to conform to the EEA’s general energy strategy and
implement the combined political energy target. Furthermore, another dominant climate and
energy policy that Norway follows is the Kyoto protocol. The Kyoto protocol is an
international agreement that extends the 1992 United Nations Framework Convention on
Climate Change (UNFCCC). The Kyoto protocol summons 120 parties/countries worldwide
to draft a treaty in order to control the manmade CO2 emissions, the global greenhouse effect,
and climate change issues. According to the Kyoto protocol, Norway is one of the Annex B
parties with binding targets for greenhouse gas emission from 2012-2020 set in the second-
round of Kyoto protocol (Wikipedia, 2015, Ministry of Petroleum and Energy, 2013,
Norwegian ministry of the environment, 2009). Norway adopted the Renewable Energy
Directive (2009/28/EC) as part of the EEA, and the set target for Norway is to reach a share
Energy utilities and its' value
chain
Equipments supplier
Engineering supplier
Service supplier
Policy maker
Dynamic Context
4
of 67.5% renewable energy in the gross final energy consumption (FEC) in 2020 (European
Environment Agency, 2013a).
In the new white paper presented by the Norwegian government in 2012, a new political
climate agreement was made. I.e. the CO2 tax for the petroleum sector on the Norwegian
Continental Shelf was raised by NOK200 per ton from 1 January 2013. Meanwhile, a new
fund for climate change mitigation, renewable energy and energy renovation is created, in
order to supplement the basic fund for renewable energy and energy efficiency (European
Environment Agency, 2013a). Furthermore, a new government support schemes on energy
tax exemption are implemented for stimulating and supporting the renewable energy and
energy efficiency (Appendix 3).
The Norwegian energy sector has evolved greatly before and during the timespan of this
research. An incremental change is the following on-going worldwide trend towards
renewable energy and energy efficiency—as required by the Kyoto protocol and EEA energy
and climate target. Based on the country energy report from ABB and the EEA, there are
three main trends within the Norwegian energy sector (European Environment Agency,
2013a):
Trend 1: Energy efficiency: A demand on energy efficiency and low carbon emission, the
energy that is saved is considered ‘green’.
Trend 2: Energy intensity: A demand on energy storage capacity and energy security.
Trend 3: Energy consumption: A requirement on reducing energy consumption per capita.
Influenced by these trends, the Norwegian government initiated an action plan in order to
reach the target as part of EEA and to realize the agreement of Kyoto protocol (European
Environment Agency, 2013a). The action plan comprises three main directions:
Action 1: Promote the energy efficiency2,
Action 2: Encourage the renewable energy,
Action 3: Develop the energy and climate technologies.
2 Energy efficiency is a term that is widespread in global energy sustainability and has been appraised by the International Energy Agency (IEA) as “the greatest potential” to save energy and reduce greenhouse gas emissions. SHAH, V. 2015. 5 ways energy efficiency is changing the world [Online]. Eco-‐Business. Available: http://www.eco-‐business.com/news/5-‐ways-‐energy-‐efficiency-‐is-‐changing-‐the-‐world/ [Accessed 8 August 2015].
5
1.4 Changes in Norwegian energy sector scenario in
the study timelines According to Kijl et al. (2005), many firms as well as incumbents often fail to monitor and
act on economic macro trends that may indicate opportunities or threats. It is undoubtedly
important to analyse the macro environment. Kijl et al. (2005) points out that in the context
of business model analysis, the technological developments and regulations have direct
impact on business models.
Change is defined as an “act or process through which something becomes different” (Oxford
Dictionaries, 2015). In academic study, the word ‘change’ is divided into two levels
according to a popular classification dichotomy—the radical versus the incremental change.
Kijl et al. (2005) explains that from a technological capabilities view, technological change
can be seen as competence heightening or incremental if the capabilities (e.g. skills,
knowledge, assets, and resources) needed to exploit a new technology are built on the firms’
existing capabilities.
This research timeline spans from February 2015 to August 2015. The macro economy
observes an incremental change that is on going within the Norwegian energy sector. This is
a current energy change following the Kyoto protocol and EEA energy and the climate target
2020.
Norway is a country with rich and diversified energy resources, and energy resources can be
simply summed up of fossil energy and renewable energy. According to Energi Norge
(2015): Norway has one per cent of Europe’s population, but 20 per cent of the hydropower
resources, 40 per cent of the gas resources and 60 per cent of the oil resources. The chart in
the appendix 2 presents a summary of all kinds of energy resources and its consumption
process in the EU for a better understanding about the energy sector. Norway does not have
such broad energy resources but the energy consumption process is somehow similar.
Norway is a unique country that is rich of hydropower and other kinds of renewable energies
such as wind, thermal, wave, and tidal resources. According to Statistics Norway (2015), the
Norwegian energy sector became well known to the world thanks to the oil resource and oil
industry, but the truth is that more than 97% of the electricity production in Norway is based
on renewable energy. This is interesting information for the general background of this study.
The energy change trend is worldwide and it dominates the main external dynamic context of
the Norwegian energy sector. In the meantime, renewable technologies and technologies that
6
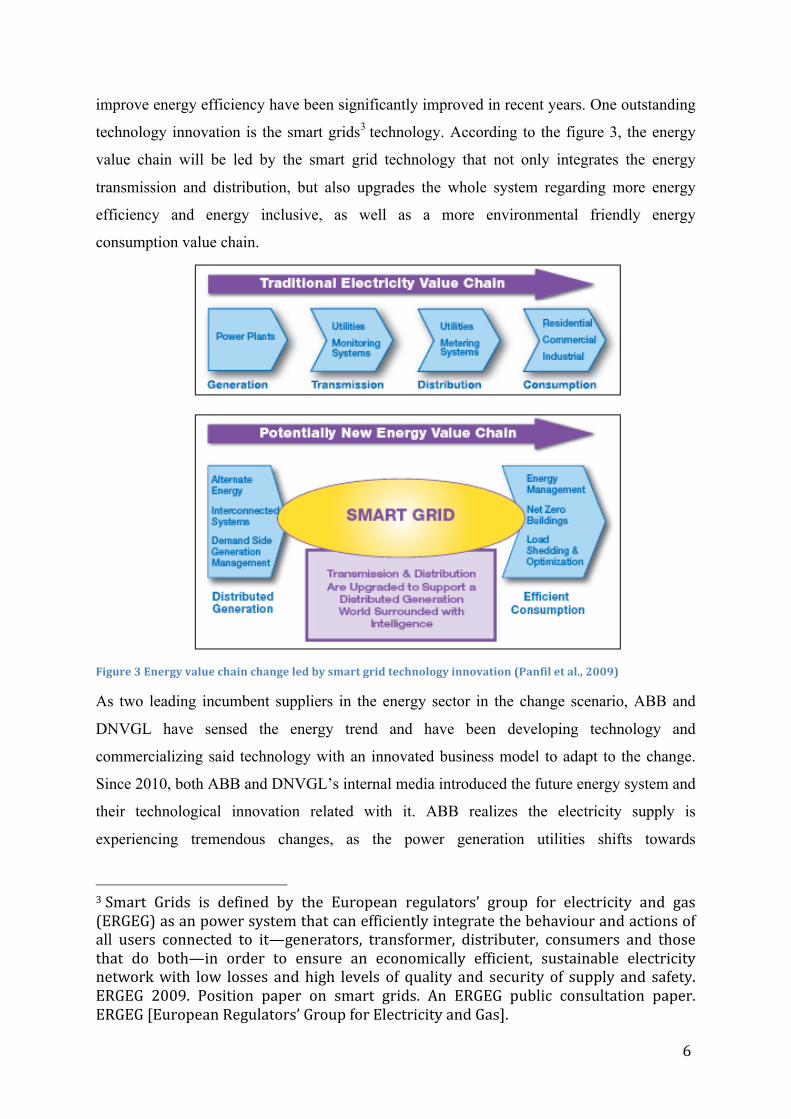
improve energy efficiency have been significantly improved in recent years. One outstanding
technology innovation is the smart grids3 technology. According to the figure 3, the energy
value chain will be led by the smart grid technology that not only integrates the energy
transmission and distribution, but also upgrades the whole system regarding more energy
efficiency and energy inclusive, as well as a more environmental friendly energy
consumption value chain.
Figure 3 Energy value chain change led by smart grid technology innovation (Panfil et al., 2009)
As two leading incumbent suppliers in the energy sector in the change scenario, ABB and
DNVGL have sensed the energy trend and have been developing technology and
commercializing said technology with an innovated business model to adapt to the change.
Since 2010, both ABB and DNVGL’s internal media introduced the future energy system and
their technological innovation related with it. ABB realizes the electricity supply is
experiencing tremendous changes, as the power generation utilities shifts towards
3 Smart Grids is defined by the European regulators’ group for electricity and gas (ERGEG) as an power system that can efficiently integrate the behaviour and actions of all users connected to it—generators, transformer, distributer, consumers and those that do both—in order to ensure an economically efficient, sustainable electricity network with low losses and high levels of quality and security of supply and safety. ERGEG 2009. Position paper on smart grids. An ERGEG public consultation paper. ERGEG [European Regulators’ Group for Electricity and Gas].
7
renewables, more feed-in nodes are increasing the complexity of the grid (ABB, 2014). With
more than 1085 patents supporting this technological innovation, ABB is the top one smart
grids pioneer company; and its innovation target is focused on not just grids, but smart cities
with a better energy monitoring and easier usage for residential and business customers
(White, 2015).
DNVGL is passionate and experienced in the energy industry research and renewable energy
technology development. In the latest energy industry report by DNVGL, the renewable
energy, energy efficiency, and decarbonized energy systems are discussed and considered as
a world trend and as alternatives to fossil energy. DNVGL believes that the energy context
will be more challenging to cope with for the firms in the energy sector compared to the past
five years. However, the new reality brings both opportunities and challenges. It is a thrilling
time to work in the electricity sector, and the energy industry at large. The energy system is
changing, new technologies and existing systems need to be made to work together;
environmental concerns are far more critical than they’ve been before; and electricity’s role
in underpinning and expanding prosperity is almost impossible to overemphasize (Jones,
2015).
1.5 Rationale of the research The business model, especially the BMI is a new concept in the theory ground. The ‘BMI’
concept discussed in this study is “a process where a firm introduces changes into its business
model in order to realign it to fit a new competitive landscape” (Casadesus-Masanell and
Ricart, 2010, Foss and Saebi, 2015).
There are very few relevant studies with the perspective of BMI applied by equipment and
service suppliers in the energy sector. Therefore, this research is designed as an explorative
study; the data for analysing the research units are collected mainly from secondary research
and direct interviews. The data collection and interpretation are following the methodology in
order to guarantee the most reliable data and validity. Chapter 3 presents the detailed
methodology, and the whole research follows the conceptual framework from Eisenhardt
(1989) in order to carry out this case study and to realize the data implementation. Based on
the conceptual framework, two cases are chosen due to the significant similarity in the nature
of those two case objectives: Firstly, both companies are the market leaders cross industries,
big in scale and well known in the market worldwide. Secondly, both of their core businesses
comprise the energy segment, to which they supply equipment, engineering or services.
8
Not only the similarities between the two analysis units, but also the differences in the
offering and the culture of these two firms fascinate the author to compare them in detail.
Since each of them can represent a typical type of supplier in the energy sector, it can be very
interesting to find out their respective response to the energy change by studying their BMI
following this trend.
1.6 Research question How do suppliers in the Norwegian energy sector employ BMI to adapt to the energy
change?
In order to adequately carry out the explorative case study and answer this research question,
the theories and literatures will covers three key elements:
• Business model
• Value creation
• Dynamic business model
1.7 Objectives of the study Based on the research question, the following section lists the general objectives and specific
objectives to achieve in the study:
General objectives:
• To analyse the BMI conducted by the analysis units.
Specific objectives:
• To assess the current business model and analyse its major elements.
• To examine the dynamic context change that affects the company and BMI.
• To evaluate and compare the value creation logic of the two analysis units.
1.8 Layout of the study Chapter 2 presents the current literature and the theoretical frameworks to which the research
question is related. The chapter describes and discusses the methodology applied in previous
studies as well as the findings. The methodology of this qualitative case study is described in
chapter 3, and the results of the analysis are presented in chapter 4. Discussion is addressed in
light of analysis and relevant literature in chapter 5; the conclusion, limitation and
implication of this study are drawn in the latter part of chapter 5.
9
2 Theory framework and literature review The research question is based on BMI in the energy sector; therefore the business model and
value creation logic are the basic theory to start with. Since no business runs in vacuum, the
dynamic business model is important for the study. In a word, to employ the BMI within the
firms, it is vital to base on the theory framework consists of business model, value creation
logic and dynamic business model (Teece, 2010, Casadesus-Masanell and Ricart, 2010,
Chesbrough, 2010).
2.1 Business Model Framework 2.1.1 Business model The concept of a business model has become particularly influential, and the business model
research and application has driven this notion into various streams.
From the research of Zott et al. (2011), the literature related with Business Model has been
developed mainly in three silos: (a) e-business and the use of information technology in
organizations; (b) strategic issues i.e. value creation, competitive advantage, and firm
performance; and (c) technology innovation. In the recently published book BMI, Foss and
Saebi (2015) correspondingly conclude the overall business model literature construct in the
current academic research, amongst others (1) as a foundation for categorizing firms; (2) as
an antecedent of distinguishing firm performances; and (3) as a new form of innovation.
The definition of a business model chosen for this study is the one given by Teece: The core
of a business model is in defining the manner by which the enterprise delivers value to
customers, attracts customers to pay for value, and alters the payments to profit (Teece,
2010).
2.1.2 Business model configuration The business model framework contains both internal and external elements, among which
are the core element offering, value creation and value capture (Foss and Saebi, 2015, Baden-
Fuller and Morgan, 2010, Teece, 2010).
Over the years, the research in business model has become more matured. In the research
literature and company practice, a business model is broken down into various parts for better
understanding and implementation, two typical business model configuration research are:
10
Osterwalder and Pigneur (2010) suggest nine building blocks (Table 2); Foss and Saebi
(2015) state a service-driven business model and draw a figure consist of five elements
(Figure 5).
• Four pillars and Nine building blocks
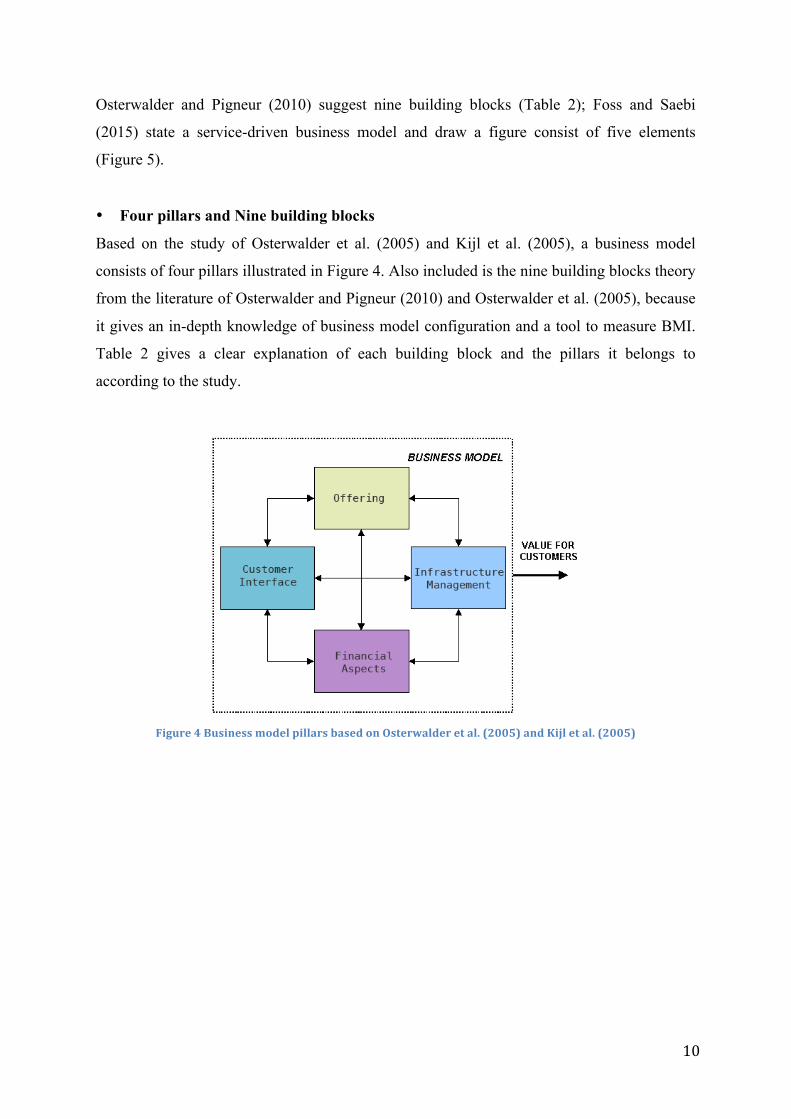
Based on the study of Osterwalder et al. (2005) and Kijl et al. (2005), a business model
consists of four pillars illustrated in Figure 4. Also included is the nine building blocks theory
from the literature of Osterwalder and Pigneur (2010) and Osterwalder et al. (2005), because
it gives an in-depth knowledge of business model configuration and a tool to measure BMI.
Table 2 gives a clear explanation of each building block and the pillars it belongs to
according to the study.
Figure 4 Business model pillars based on Osterwalder et al. (2005) and Kijl et al. (2005)
11
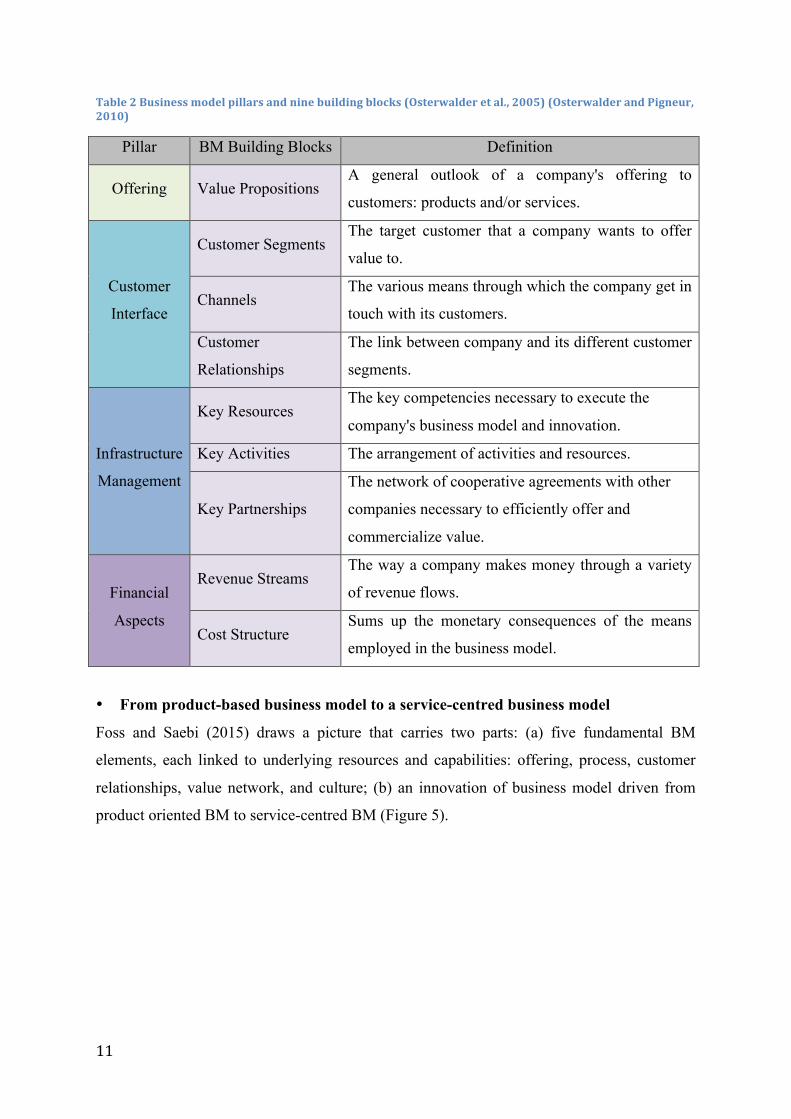
Table 2 Business model pillars and nine building blocks (Osterwalder et al., 2005) (Osterwalder and Pigneur, 2010)
Pillar BM Building Blocks Definition
Offering Value Propositions A general outlook of a company's offering to
customers: products and/or services.
Customer
Interface
Customer Segments The target customer that a company wants to offer
value to.
Channels The various means through which the company get in
touch with its customers.
Customer
Relationships
The link between company and its different customer
segments.
Infrastructure
Management
Key Resources The key competencies necessary to execute the
company's business model and innovation.
Key Activities The arrangement of activities and resources.
Key Partnerships
The network of cooperative agreements with other
companies necessary to efficiently offer and
commercialize value.
Financial
Aspects
Revenue Streams The way a company makes money through a variety
of revenue flows.
Cost Structure Sums up the monetary consequences of the means
employed in the business model.
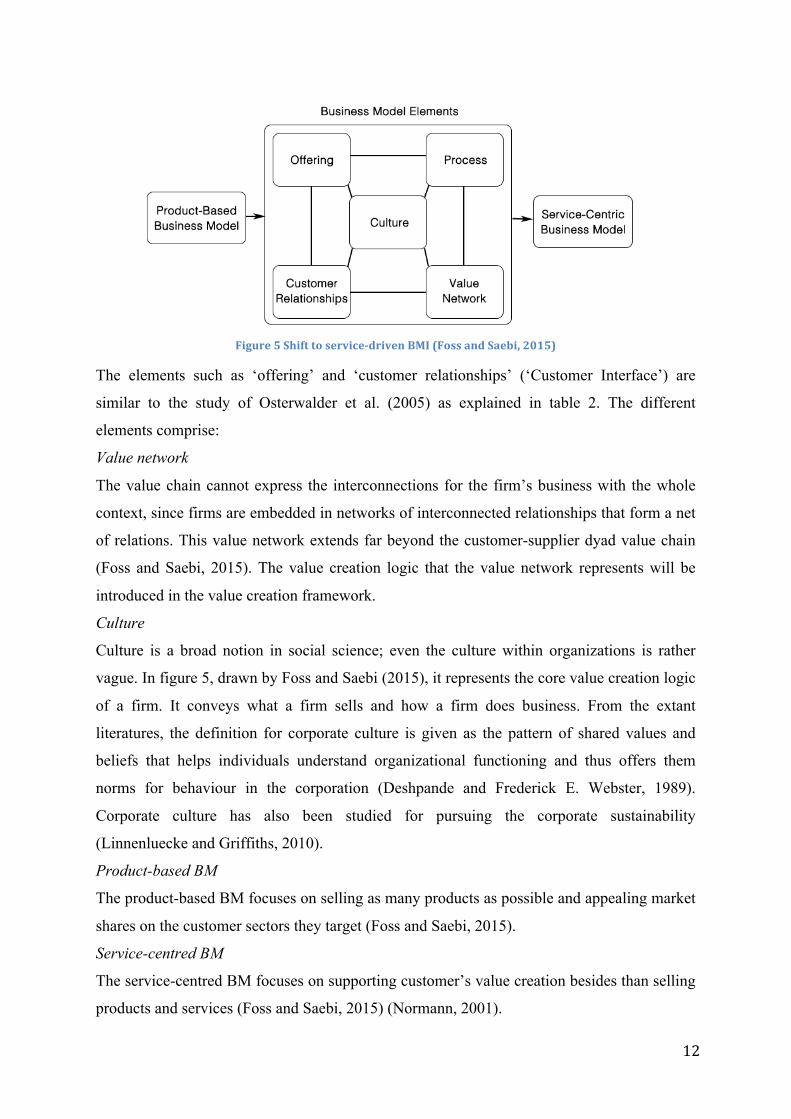
• From product-based business model to a service-centred business model
Foss and Saebi (2015) draws a picture that carries two parts: (a) five fundamental BM
elements, each linked to underlying resources and capabilities: offering, process, customer
relationships, value network, and culture; (b) an innovation of business model driven from
product oriented BM to service-centred BM (Figure 5).
12
Figure 5 Shift to service-‐driven BMI (Foss and Saebi, 2015)
The elements such as ‘offering’ and ‘customer relationships’ (‘Customer Interface’) are
similar to the study of Osterwalder et al. (2005) as explained in table 2. The different
elements comprise:
Value network
The value chain cannot express the interconnections for the firm’s business with the whole
context, since firms are embedded in networks of interconnected relationships that form a net
of relations. This value network extends far beyond the customer-supplier dyad value chain
(Foss and Saebi, 2015). The value creation logic that the value network represents will be
introduced in the value creation framework.
Culture
Culture is a broad notion in social science; even the culture within organizations is rather
vague. In figure 5, drawn by Foss and Saebi (2015), it represents the core value creation logic
of a firm. It conveys what a firm sells and how a firm does business. From the extant
literatures, the definition for corporate culture is given as the pattern of shared values and
beliefs that helps individuals understand organizational functioning and thus offers them
norms for behaviour in the corporation (Deshpande and Frederick E. Webster, 1989).
Corporate culture has also been studied for pursuing the corporate sustainability
(Linnenluecke and Griffiths, 2010).
Product-based BM
The product-based BM focuses on selling as many products as possible and appealing market
shares on the customer sectors they target (Foss and Saebi, 2015).
Service-centred BM
The service-centred BM focuses on supporting customer’s value creation besides than selling
products and services (Foss and Saebi, 2015) (Normann, 2001).
13
2.1.3 A cognitive perspective of BMI There is, of course, a wide extant literature dealing with the corporate culture or inter-
organizational cognition. Some research has also connect the corporate culture to the firm’s
management strategy (Hynes, 2009). Others research even points to the role of managerial
cognition in particular to express that the cognition inertial will be the obstacle of BMI
(Chesbrough, 2010). However, the corporate culture that effects or even drives the BMI has
not received much attention so far. This is particularly true when it comes to inter-
organizational cognitions, which is considered as the role of the corporation and its
businesses that are shared by the corporation’s managers and its stakeholders.
Though the research on the cognitive approach on corporate BMI is completely under-
researched, the single case study on Nokia implemented by Aspara et al. (2013) gained
awareness by discovering the connection between corporate business model transformation
and the inter-organization cognition. The study also tried to find out how managers cognitive
processes can influence corporate business model transformation decisions (Aspara et al.,
2013). Until recently, a cognitive approach as created by Martins et al. (2015) for firms
actively implement BMI in order to avoid the cognition inertial.
2.1.4 A dynamic context perspective of BMI Currently, there are quite many literatures about a firm’s BMI. It is a method a firm employs
to adapt to technology or regulation change (Chesbrough, 2010, Teece, 2010), and also a
procedure that a firm employs to adapt to new competitive scenery. It is normally triggered
when the technology turns out to be out-of-date, customer requests change, and new value
propositions emerge (Casadesus-Masanell and Ricart, 2010, Foss and Saebi, 2015).
Apparently, technology development as one element of dynamic context plays an important
role in BMI. Teece (2010) proposes BMI together with technology innovation. He clarifies
that the technological innovation often needs to be matched with BMI in order to capture
value or create profit for innovator. He highlights the importance of BMI that BMI may not
seem daring but without it there may be no reward for pioneering individuals, corporates and
nations (Teece, 2010). Baden-Fuller and Haefliger (2013) believe that in order to appropriate
features of a technology that create customer value, BMI may be needed to allow
technological development. Moreover, firms can also view the business model as a source of
14
innovation, not just as facilitating technological innovation and the management of
technology (Zott et al., 2011, Mitchell and Coles, 2003).
The BMI is clearly presented as a theory founded together with business model theories. In
addition to introducing the nine building blocks of a business model, Osterwalder and
Pigneur (2010) recommends epicentres of BMI. They encourage practisers that these nine
BM building blocks can be an excellent starting point for BMI. Likewise, innovating nine
building blocks of business model is undoubtedly suggested as the approach of BMI in firms
according to Osterwalder and Pigneur (2010). Moreover, the technological innovation is part
of BMI based on the theory of (Zott et al., 2011, Mitchell and Coles, 2003, Teece, 2010).
However, the BMI study is still in its early stage. Very few literatures have developed this
part of theory, especially in the energy sector. After thorough literature search, a study on
BMI in energy utilities in the German energy sector is reviewed as one of the more
representative current literature.
2.1.5 BMI in the energy sector With the perspective of electricity generator-energy utilities, Richter (2013) uses the business
model concept to examine how German utilities place themselves while facing the challenges
of the energy transition – the trend of promoting renewable energy utilities. Though it is the
case study in the German energy sector, it is still practically and academically useful for the
study in Norwegian energy sector due to a limitation on relevant research base.
According to the results, technology helps utilities creating new business model on renewable
energy. The value proposition of this business model is mass generation of electricity, and the
value creation logic of these renewable utility projects is similar to traditional centralized
power plants (Richter, 2013). Though the research outcome has limited contribution on
business model and value proposition of suppliers in the Norwegian energy sector, the clear
introduction of the Europe energy utility and energy policy, and the methodology of
comparing two sides of business model elements shed light on the BMI study in the
Norwegian energy sector.
2.2 Value Creation Framework The value creation and value capture is the keyword among all the business model
definitions, and it is one of the main themes. In order to employ BM and BMI to capture
15
value, the elements of business model are studied and generalized by scholars in former
studies. Former reviews uncover a solid consensus that the business model revolves around
customer-focused value creation (Chesbrough and Rosenbloom, 2002).
Stabell and Fjeldstad (1998) conduct a four-year study having supervised extensive
utilization of the value chain model in more than 24 companies from a mixture of industries.
In this study serious problems are pointed out when applying the value chain framework.
They find that the primary activity typology of the value chain appears well fit to describing
and understanding a traditional manufacturing company. Moreover, they suggest that the
value chain cannot describe the entire value configuration; in fact it is just the basic one out
of three generic value configurations.
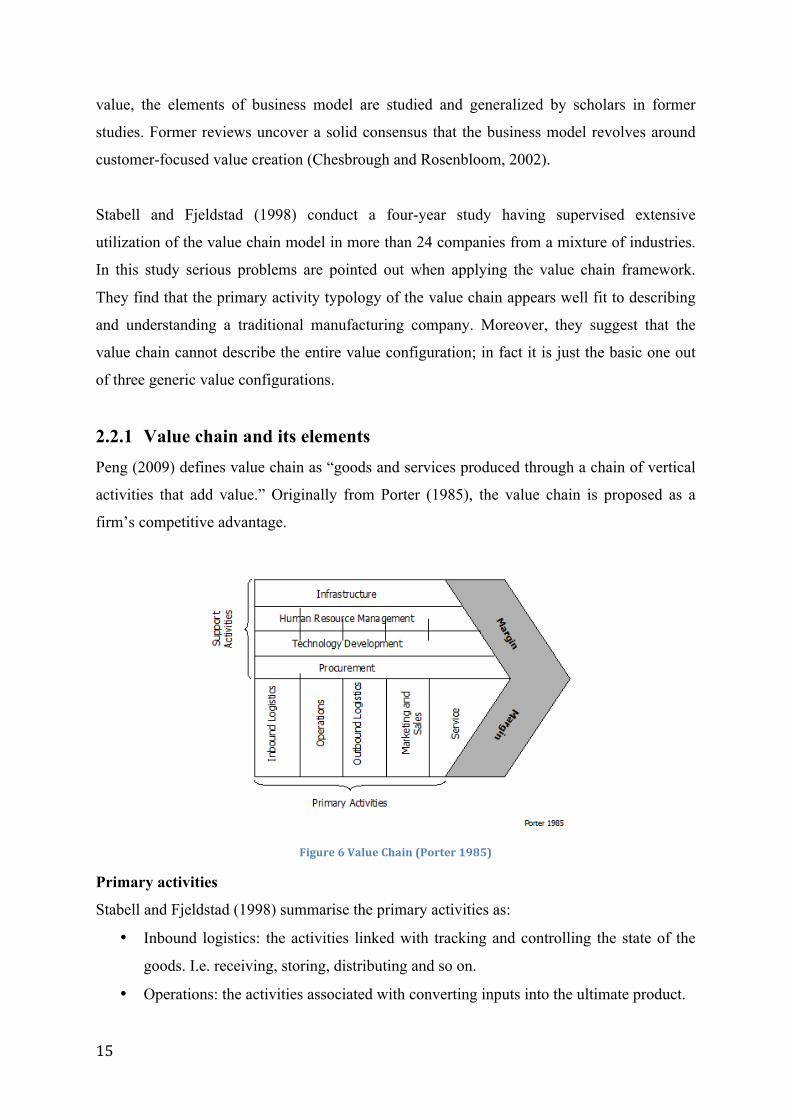
2.2.1 Value chain and its elements Peng (2009) defines value chain as “goods and services produced through a chain of vertical
activities that add value.” Originally from Porter (1985), the value chain is proposed as a
firm’s competitive advantage.
Figure 6 Value Chain (Porter 1985)
Primary activities
Stabell and Fjeldstad (1998) summarise the primary activities as:
• Inbound logistics: the activities linked with tracking and controlling the state of the
goods. I.e. receiving, storing, distributing and so on.
• Operations: the activities associated with converting inputs into the ultimate product.
16
• Outbound logistics: the activities related with assembling, storing, and physically
distributing the goods to consumers.
• Marketing and sales: the activities of developing all channels and implementing
promotions in order to reach the customers and induce them to buy the goods.
• Service: the activities offering service to improve or add value to the product.
2.2.2 From value chain to value shop and value network Based on Porter’s value chain theory, Stabell and Fjeldstad (1998) extend the value
configuration from value chain to value shop and value network.
As another type of value creation logic other than value chain, ‘value shops’ is created as a
model firm that depends on an intensive technology (Thompson, 1967) to solve customer’s
problem (Stabell and Fjeldstad, 1998). Firms that can be sculpted as value shops are usually
filled with specialists and experts, often professionals, covering the problem domain. The
value creation logic of value shop is explained as problem solving, and changing an existing
firm to a more desired state directed by intensive technology for the customer (Stabell and
Fjeldstad, 1998).
And the ‘value network’, according to Stabell and Fjeldstad (1998), is a value creation logic
that firm relies on via mediating technology (Thompson, 1967) to link customers who are (or
need to be) interdependent. The mediating technology helps discussion among customers
allocated in space and time; the firm itself is not the network but offers a networking service
(Thompson, 1967, Stabell and Fjeldstad, 1998). In a word, the value network logic as one of
the three value creation logics, is neither selling physical products as value chain, nor selling
professional service or consultancy as value shop, but selling its linking service to all the
customers who can benefit from this mediating organization or a club manager.
2.2.3 Firm’s culture and cognition based on value creation logic In the fast changing technology innovation world, correctly setting the enterprise boundaries
is vital. It is the reflection of a firm’s culture and cognition, and it can be seen as a factor to
correctly apply the business model. The study of value configuration traces back to the firm’s
culture and cognition and more. (Teece, 2007)
• Cognition as value shop
17
In value shop, the business value system scope and the product scope are profoundly
interconnected. The choice of business value system scope is based on market size and the
rate of change in the technology. The bigger the market for a domain and the larger the rate
of change in the technology means less vertically integration for a firm. Additionally, the
firms that can be modelled as value shops have a high degree of absorption of the problem
object within the field. Problem absorption can lessen uncertainty but also increase
communication between experts and customers. Degree of problem absorption is related to
the degree of business value system scope, since benefiting from strong problem absorption
requires that the shop have access to a full range of related experts (Stabell and Fjeldstad,
1998).
• Cognition as value network
In terms of value system scope, the mediating industry needs to consider both vertical and
horizontal integration. These possibilities reflect the layered and interrelated nature of the
associated business value system. When the value chain commands a machine bureaucracy
organization of primary activities, the value shop is arranged according to either the
professional bureaucracy or the operational adhocracy; and the value network is often
organized according to an administrative adhocracy, particularly when the technology of the
infrastructure is complex and requires highly specialized development activities (Stabell and
Fjeldstad, 1998).
Furthermore, there is one thing that needs to be highlighted: most firms are not limited in one
value configuration; they may employ more than one technology and consequently have
more than one configuration (Stabell and Fjeldstad, 1998).
2.3 Dynamic Business Model With swelling market dynamics and fast technological developments, the ability to sense and
adapt to threats, seize difference and value, and transforming technological capabilities in
order to facilitate new and valuable user experiences will be a key contribution to a firm’s
sustainability. To be able to offer these experiences, a dynamic business model is needed, and
a dynamic business model framework is generated in the study of Kijl et al. (2005).
18
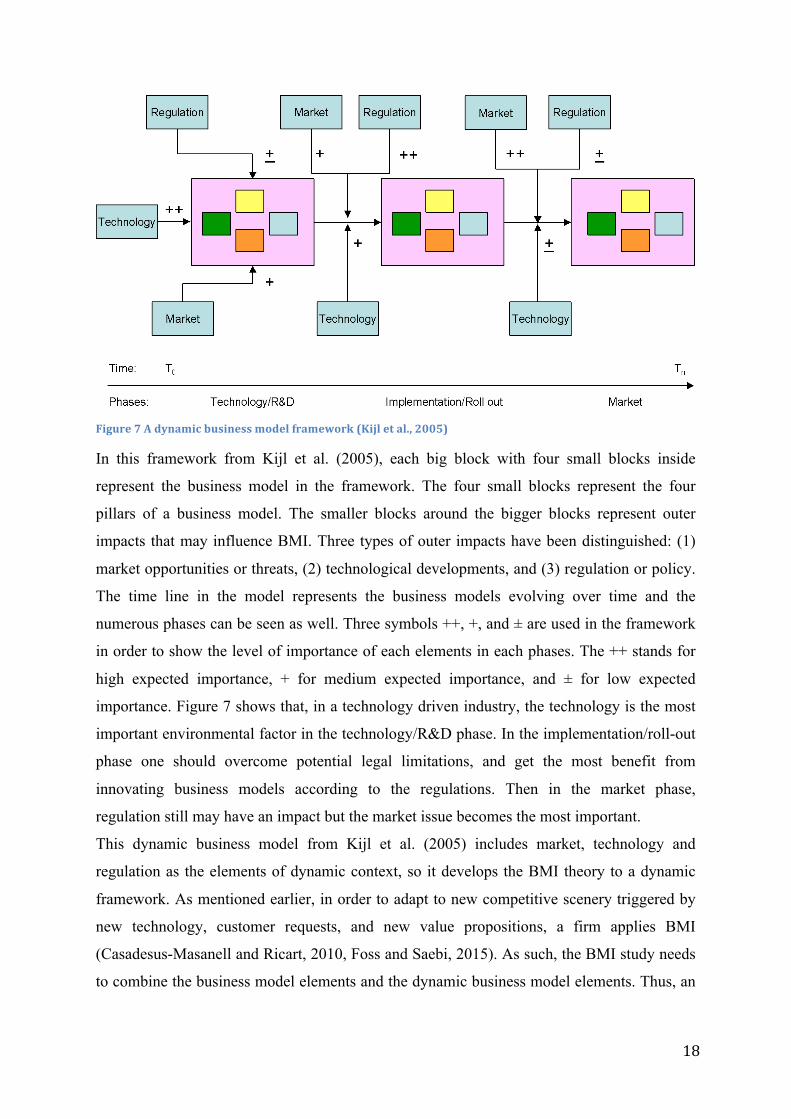
Figure 7 A dynamic business model framework (Kijl et al., 2005)
In this framework from Kijl et al. (2005), each big block with four small blocks inside
represent the business model in the framework. The four small blocks represent the four
pillars of a business model. The smaller blocks around the bigger blocks represent outer
impacts that may influence BMI. Three types of outer impacts have been distinguished: (1)
market opportunities or threats, (2) technological developments, and (3) regulation or policy.
The time line in the model represents the business models evolving over time and the
numerous phases can be seen as well. Three symbols ++, +, and ± are used in the framework
in order to show the level of importance of each elements in each phases. The ++ stands for
high expected importance, + for medium expected importance, and ± for low expected
importance. Figure 7 shows that, in a technology driven industry, the technology is the most
important environmental factor in the technology/R&D phase. In the implementation/roll-out
phase one should overcome potential legal limitations, and get the most benefit from
innovating business models according to the regulations. Then in the market phase,
regulation still may have an impact but the market issue becomes the most important.
This dynamic business model from Kijl et al. (2005) includes market, technology and
regulation as the elements of dynamic context, so it develops the BMI theory to a dynamic
framework. As mentioned earlier, in order to adapt to new competitive scenery triggered by
new technology, customer requests, and new value propositions, a firm applies BMI
(Casadesus-Masanell and Ricart, 2010, Foss and Saebi, 2015). As such, the BMI study needs
to combine the business model elements and the dynamic business model elements. Thus, an

19
in-depth BMI study needs to include offering, infrastructure management, customer interface,
financial aspects, and dynamic context that includes market, technology and regulation.
20
3 Research Methodology The research question that, together with the conceptual framework, guides this study’s
design and data collection methods is:
How do suppliers in the Norwegian energy sector employ BMI to adapt to the energy
change?
3.1 Research design Based on prior studies and motivation, the research question was selected, and the research
perspective on BMI in specific Norwegian energy sector was targeted. Furthermore, two
suppliers in the energy industry were specially chosen.
Yin (2009) states that a case is a realistic investigation that explores a contemporary
phenomenon within its real-life context, especially when the boundaries between
phenomenon and context are not clearly manifested.
Therefore, a case study design is chosen according to Yin (2009) because (a) the research
question is a ‘how’ question, related with finding out the actions that a company takes to
adapt to the context change; (b) the investigator cannot direct or influence the performance of
the events; (c) the context is relevant to the phenomenon under the study, and (d) the question
may require an in-depth analysis of a specific problem.
Also, it is advised by Yin (2009) that if you have a choice of resources, multiple-case designs
could be preferred over single-case designs, since the analytic conclusions individually
ascending from two cases will be more compelling and robust than those coming from a
single case alone.
Thus the research design chose a two-case comparative case study. The units of analysis are:
1. Product-based supplier, market leader in energy-related products; (ABB Norway)
2. Service-centred supplier, market leader in energy-related service. (DNVGL Norway)
Moreover, it is most likely an exploratory case study because the aim of this research is to
develop a better insight into a particular topic. In the timespan of writing this study, the
earlier work / previous studies that can be referred to seems very little. The main focus of this
study is the scenario of suppliers in the Norwegian energy sector in the energy context
21
change. It is entirely an in-depth analysis of a distinct problem within real-life context, and it
employs focus groups, in-depth interviews, historical analysis and observation (Wilson,
2010).
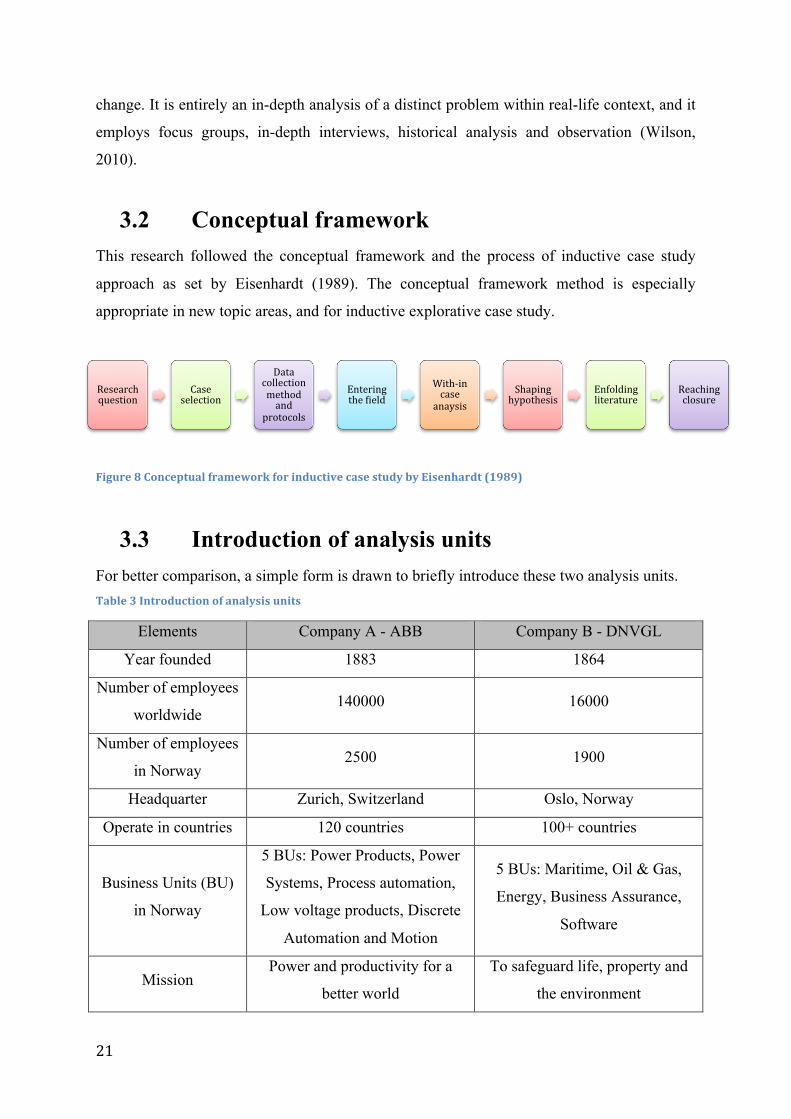
3.2 Conceptual framework This research followed the conceptual framework and the process of inductive case study
approach as set by Eisenhardt (1989). The conceptual framework method is especially
appropriate in new topic areas, and for inductive explorative case study.
Figure 8 Conceptual framework for inductive case study by Eisenhardt (1989)
3.3 Introduction of analysis units For better comparison, a simple form is drawn to briefly introduce these two analysis units. Table 3 Introduction of analysis units
Elements Company A - ABB Company B - DNVGL
Year founded 1883 1864
Number of employees
worldwide 140000 16000
Number of employees
in Norway 2500 1900
Headquarter Zurich, Switzerland Oslo, Norway
Operate in countries 120 countries 100+ countries
Business Units (BU)
in Norway
5 BUs: Power Products, Power
Systems, Process automation,
Low voltage products, Discrete
Automation and Motion
5 BUs: Maritime, Oil & Gas,
Energy, Business Assurance,
Software
Mission Power and productivity for a
better world
To safeguard life, property and
the environment
Research question
Case selection
Data collection method and
protocols
Entering the lield
With-‐in case
anaysis Shaping hypothesis
Enfolding literature
Reaching closure
22
Company A—ABB is a global leader in power and automation technologies. It is the largest
supplier in the world regarding energy products that include power generating, transforming
as well as transferring. ABB’s main competence and business model are focused on how to
use the energy efficiently and stand for the top level of technical innovations among
competitors in the market. In Norway, ABB’s products cover all energy sectors such as oil
and gas industry, hydropower, wind power, electronic auto, solar industry etc. In conclusion,
ABB is a product-based supplier that offers a broad product portfolio in the energy sector.
Company B—DNVGL as the world's largest classification society owns the main expertise in
technical assurance, research, certification, and risk management. DNVGL is also a reference
in both renewable and conventional energies. It is the world's largest technical consultancy to
onshore and offshore wind, wave, tidal, and solar industries, as well as to the global oil and
gas industries. After acquiring KEMA at the year 2011, and merging with GL at the year
2013, DNVGL is the biggest energy certification and consulting company worldwide.
According to the range of the energy sector where ABB and DNVGL either supply products
or services, it is apparent that both of them face the same ambient context across the total
energy sector even though they have different value creation logic.
3.4 Data Collection As explained in Yin (2009), the research method is using different techniques for collecting
data. Yin (2009) suggests that there are broadly six main sources of data collection, each of
which has its particular strengths and weaknesses. For these two specific cases in the study,
two main sources are relied on due to the realistic issues and the nature of the research:
documentation and interviews.
3.4.1 Primary Data The methods of collecting primary data are based on several kinds of interviews: face-to-face
interviews, interviews by phone, and sending questionnaires by email. I sent out three emails
with questionnaires to the potential interviewees who could not make it to the face-to-face
interview. One relevant answer was received. Therefore, the interviews of this research
include three face-to-face interviews; one done by email and by phone for additional
confirmation. A direct observation is not applicable based on the research question, since this
high-level business strategy can hardly be observed by a short visit at the firm. In total, the
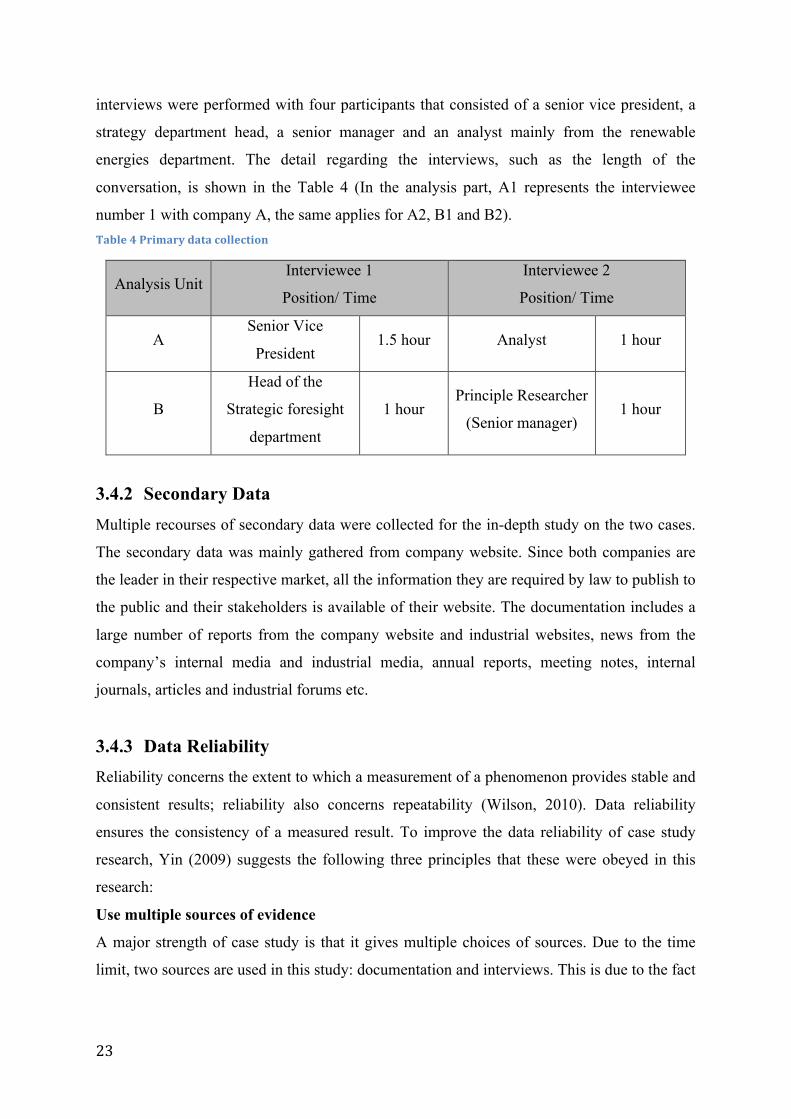
23
interviews were performed with four participants that consisted of a senior vice president, a
strategy department head, a senior manager and an analyst mainly from the renewable
energies department. The detail regarding the interviews, such as the length of the
conversation, is shown in the Table 4 (In the analysis part, A1 represents the interviewee
number 1 with company A, the same applies for A2, B1 and B2). Table 4 Primary data collection
Analysis Unit Interviewee 1
Position/ Time
Interviewee 2
Position/ Time
A Senior Vice
President 1.5 hour Analyst 1 hour
B
Head of the
Strategic foresight
department
1 hour Principle Researcher
(Senior manager) 1 hour
3.4.2 Secondary Data Multiple recourses of secondary data were collected for the in-depth study on the two cases.
The secondary data was mainly gathered from company website. Since both companies are
the leader in their respective market, all the information they are required by law to publish to
the public and their stakeholders is available of their website. The documentation includes a
large number of reports from the company website and industrial websites, news from the
company’s internal media and industrial media, annual reports, meeting notes, internal
journals, articles and industrial forums etc.
3.4.3 Data Reliability Reliability concerns the extent to which a measurement of a phenomenon provides stable and
consistent results; reliability also concerns repeatability (Wilson, 2010). Data reliability
ensures the consistency of a measured result. To improve the data reliability of case study
research, Yin (2009) suggests the following three principles that these were obeyed in this
research:
Use multiple sources of evidence
A major strength of case study is that it gives multiple choices of sources. Due to the time
limit, two sources are used in this study: documentation and interviews. This is due to the fact
24
that a few hours visiting the company for conducting interview cannot count as direct
observation, especially regarding the BMI topic that is a lengthy process.
Create a Case Study database
The interview was designed and guided following the elements of BMI and dynamic context.
After the interviews, a formal, presentable database was developed. Some easy-to-catch
forms were created conveying the brief background information of the interviewees and
analysis units, the data type and resources. The main purpose of making this database was to
make it easy for other investigators to review the data directly and not be limited to the
written reports.
Maintain a chain of evidence
With the permission of interviewees, the interviews were well recorded by the app voice
memos that were installed on the used equipment—an iPhone and an iPad. This record was
subsequently carefully transferred in to written transcript by listening to the record slowly
and word by word. The major interview questions and guides are attached in Appendix 1.
Due to privacy concerns, the interview transcripts and interviewees’ names are not published
here.
3.4.4 Data Validity Validity is related to the topics what researchers are measuring or intend to measure, and it
refers to the relationship between a construct and its indicators (Wilson, 2010). Except for the
reliability, the quality of a study can be tested by internal and external validity as well as
construct validity.
According to Wilson (2010), the external validity means the extent to which the findings
from study can be generalized to other cases or settings. A positivist researcher will often
strive to claim generalizability of their results.
The author suggests that as an explorative case study, the general findings from this study
may support other similar cases or settings, but due to the limited number of cases studied, as
well as the time limitation for the whole study, the replication of logic cannot yet be
achieved.
It is described by Yin (2009) that the internal validity is for explanatory or causal studies only
and not for descriptive or exploratory studies. However the construct validity, part of internal
validity is valid to the extent that it measures what it is supposed to measure. In this case
25
study, the primary indicators were the questions during the semi-structured interviews in
accordance with research question followed by literature study.
Yin (2009) suggests the technique for improving validity in qualitative research by applying
data triangulation—finding multiple sources, which supports a given finding—and that is
accepted within this study.
In addition to data triangulation, Mays and Pope (2000) endorses some additional measures
to improve data validity for qualitative research, all the suggestions below were used within
this study.
• Clear exposition of data collection and analysis: The following section will follow this
in result and data analysis.
• Reflexivity: It is defined as sensitivity to the ways in which the researcher and the
research process have shaped the collected data (Wilson, 2010). The application for this
suggestion is mentioned in the question design in the next section.
• Attention to negative cases: The contradict element in the data were also considered and
analysed in care to ensure the validity of the findings.
• Fair dealing. To maintain the quality of research, the interviews were well planned,
prepared, and performed. The depth and diversity of the conversation in the one to one
and half hour timeslot can cover all the sectors, which are targeted by this research.
Having two analysis units and with each of the unit working with two interviewees can
very much minimize the dominant viewpoint.
3.5 Question design and interviewee selection The interviewees selection was based on the function of the interviewee who directly works
with BMI or implementing BMI. All the interviewees are experienced, high level, long time
working at the firm and key persons in the organization who understand the research topic
and associated field very well. Therefore the interviewees could guarantee the reliability of
the data. Because of the interviewees’ roles in the company are either the top leader in the
firm who governs the strategy; or the energy change project leader, who performs the
strategy, they are professionals who not only understand the study topic, but practically apply
it in their daily work. This can highly prohibit personal and intellectual biases that may
influence the data collection.
26
All the interview participants were provided with a semi-structured questionnaire guided by
conversation. The questions were designed based on the overall research question and the
objectives of the study: To seek the main approaches employed in the BMI conducted by the
analysis units in this case study. Thus, the questionnaire was created following the categories
that consist of dynamic context and business model pillars that were mentioned as the theory
framework (Appendix 1).
The study is more of a flexible nature than a closed study. The author asked neutral and open-
ended interview questions that would allow the interviewees to explicate freely upon the
given subject. If needed, follow-on questions were used for clarification of topics already
volunteered by the interviewee. Adjustment was on going when the new data was added.
3.6 Data Coding and Analysing Coding is a method that serves as a way to label, compile and organize the data, as the basis
for developing the analysis. A code can be a key word, theme or category within the
interview transcript or notes (Wilson, 2010). With the consideration of data validity and data
reliability, this case study strictly followed the methodology of acquiring data, coding, and
analysing data.
The interview transcripts were carefully evaluated whilst creating notes in a systematic way.
The data analysis will include both primary data and secondary data. Since the interview
questions are designed to match to the data protocol, it is easier for data interpretation and
information category. And the data from the protocols was conducted in a three-step process:
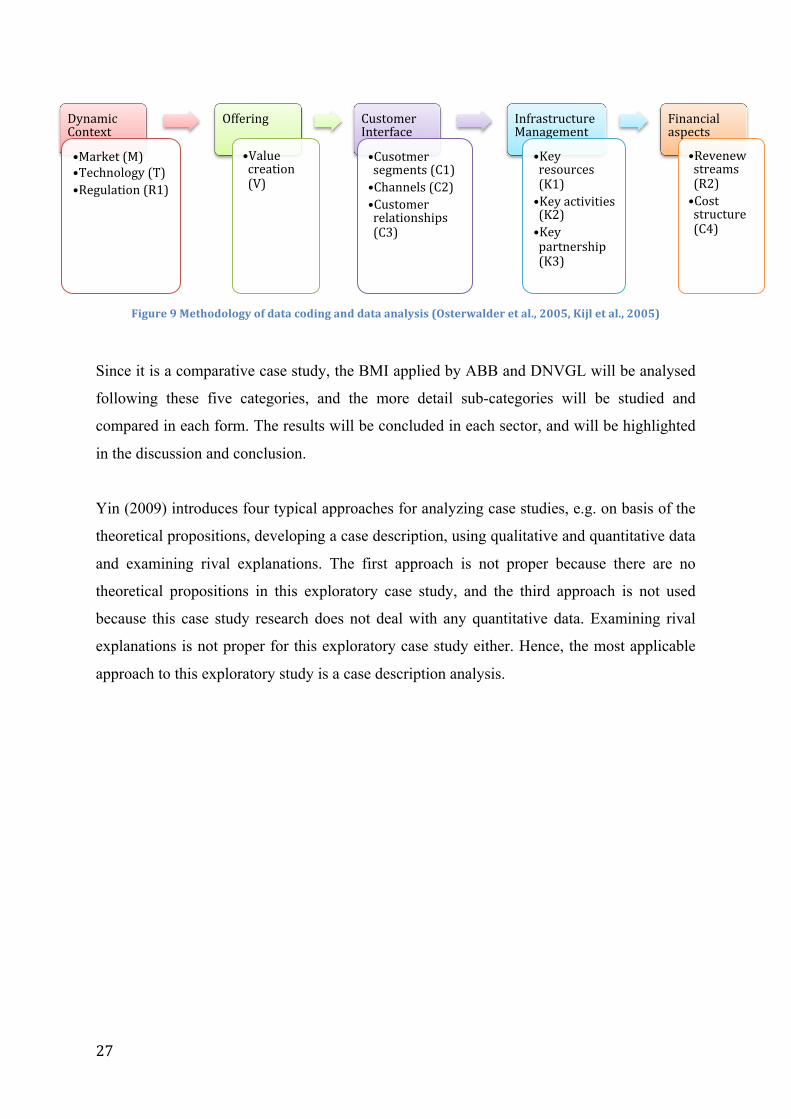
First, referring the coding frame comprises five categories below (Figure 9), each category
was interpreted into sub-categories comprising nine business model elements and three
dynamic context elements; Second, the coded results were clustered into five main categories
including dynamic context as well as four business model components: offering, customer
interface, infrastructure management, and financial aspects; Third and finally, the results
were grouped to recognise the relevant issues and enable a thorough and comparative
analysis of the interview results.
27
Figure 9 Methodology of data coding and data analysis (Osterwalder et al., 2005, Kijl et al., 2005)
Since it is a comparative case study, the BMI applied by ABB and DNVGL will be analysed
following these five categories, and the more detail sub-categories will be studied and
compared in each form. The results will be concluded in each sector, and will be highlighted
in the discussion and conclusion.
Yin (2009) introduces four typical approaches for analyzing case studies, e.g. on basis of the
theoretical propositions, developing a case description, using qualitative and quantitative data
and examining rival explanations. The first approach is not proper because there are no
theoretical propositions in this exploratory case study, and the third approach is not used
because this case study research does not deal with any quantitative data. Examining rival
explanations is not proper for this exploratory case study either. Hence, the most applicable
approach to this exploratory study is a case description analysis.
Dynamic Context
• Market (M) • Technology (T) • Regulation (R1)
Offering
• Value creation (V)
Customer Interface
• Cusotmer segments (C1) • Channels (C2) • Customer relationships (C3)
Infrastructure Management
• Key resources (K1) • Key activities (K2) • Key partnership (K3)
Financial aspects
• Revenew streams (R2) • Cost structure (C4)
28
4 Results Analysis In this chapter the results from the interviews and the secondary data will be discussed in
light of the previously presented literature. The analysis category and process are introduced
with Figure 9 in the sector 3.6.
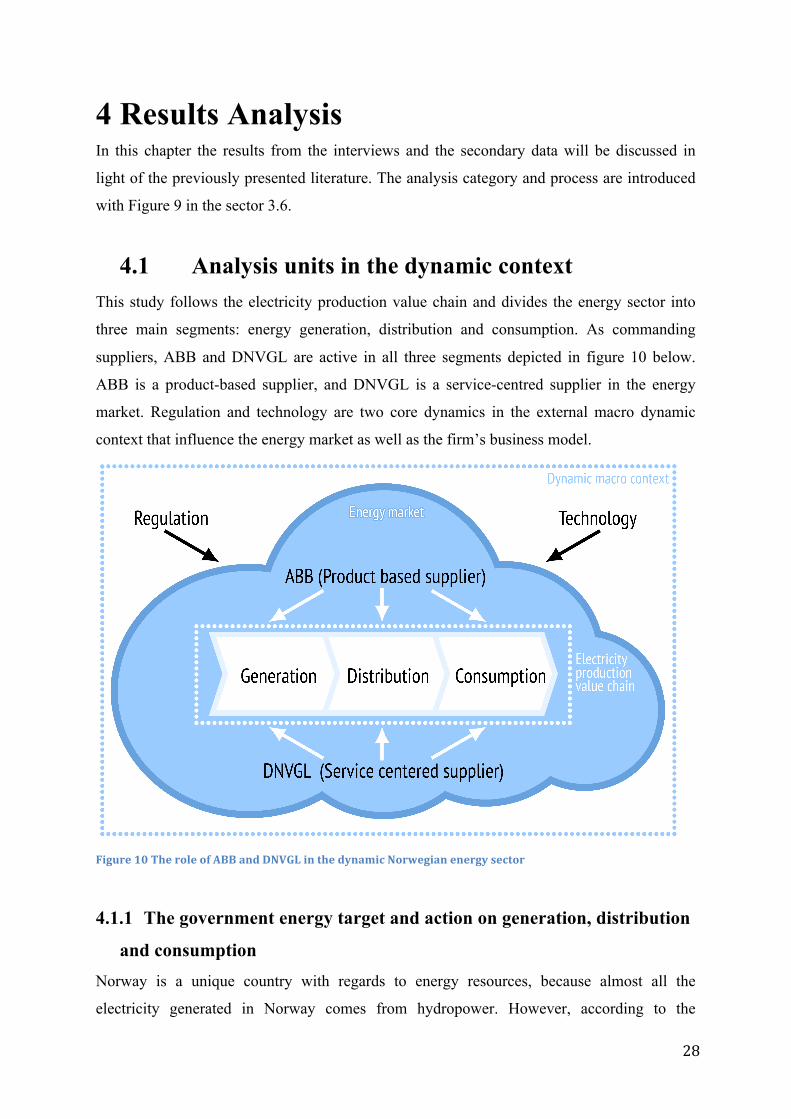
4.1 Analysis units in the dynamic context This study follows the electricity production value chain and divides the energy sector into
three main segments: energy generation, distribution and consumption. As commanding
suppliers, ABB and DNVGL are active in all three segments depicted in figure 10 below.
ABB is a product-based supplier, and DNVGL is a service-centred supplier in the energy
market. Regulation and technology are two core dynamics in the external macro dynamic
context that influence the energy market as well as the firm’s business model.
Figure 10 The role of ABB and DNVGL in the dynamic Norwegian energy sector
4.1.1 The government energy target and action on generation, distribution
and consumption Norway is a unique country with regards to energy resources, because almost all the
electricity generated in Norway comes from hydropower. However, according to the
29
Enova4’s contractual goals, the contribution of renewables and energy savings still need to be
improved by 30 TWh by 2016 and by 40 TWh by 2020 (compared with 2001) due to
increased demand of energy. The established targets in the agreement by the Renewables
Directive also show the high Norwegian ambitions in the renewable energy area. As is
mentioned in chapter 1, the Norwegian renewable energy target is a percentage of 67.5 in
2020. In 2010, the percentage was about 61 (European Environment Agency, 2013a).
In addition to the demands in renewable energy, diversification in the energy generation is
required and encouraged by the government through Enova and the energy fund. According
to the action plan of Norwegian government, the licensed market welcomes three types of
renewable energy: wind power, hydropower, and bio energy. Three core issues are important
in the pursue of the climate friendly energy targets: nature diversity, local communities and
other public interests (Ministry of Petroleum and Energy, 2013).
In order to realise this plan, the government has initiated many activities accordingly and has
placed great emphasis on encouraging the supply of renewable energy. For example, the
government increased the licenses issued in order to increase the energy production. From
2012-2020, the production capacity that will result in a total of 26.4 TWh renewable
electricity production in Norway and Sweden in 2020 will be developed. This equals 20 per
cent of the current Norwegian power production, and Norway is committed to finance 50 per
cent of the certificates, regardless of the location of production in two countries. Moreover,
the attention to the use of district heating has increased considerably. The government
improved the scope of measures and instruments regarding renewable energy development
and energy efficiency, an effort that will be continued (Ministry of Petroleum and Energy,
2013).
With the increasing production of renewable energy, the electricity system demands a well-
functioning grid. Substantial emphasis has been placed on the investment on grid
developments and the grid transmission capability and efficiency improvement. For example,
Statnett has increasingly invested in grid construction and improvement, and the investment
4 Enova is a Norwegian state owned enterprise founded at the year 2001, with the mission of energy efficiency improvement and renewable Norway as well as technology development in the energy sector. It manages the fund for the promotion of energy efficiency measures and the use of renewable energy (along with a broader Energy Fund financed through an electricity tax).
30
will remain high in the future. In the year 2010, the investment was nearly NOK 1.9 billion
(Ministry of Petroleum and Energy, 2013).
With regard to the energy sector’s innovation towards more renewable energy and energy
efficiency, the efforts are also placed through extending investment in research and
technology development. Through the Norwegian Research Council, programmes for
developing technology and knowledge on renewable energy, energy efficiency and
environmentally friendly transport have been reinforced and recorded in White Paper No. 21
(2011-2012). Also, the parliament asked the government to establish a new fund for climate,
renewable energy and energy diversification. The capital fund will increase by NOK 5 billion
in 2015 and NOK 5 billion in 2016. Another statement mentioned in the White Paper No. 21
(2011-2012) is that the government will increase the mandatory sale of biofuel to 10 per cent
if the experience is good with regard to the sustainability criteria. Moreover, the government
will support the development of the value chain for second-generation biofuel and contribute
to biogas development in Norway (Ministry of Petroleum and Energy, 2013).
The energy consumption includes three main parts: industry, residential and transportation. In
White Paper No. 21 (2011-2012) Norwegian Climate Policy to parliament, the government
has proposed a new climate and technology initiative, which is funded through the yields
from the national capital increases. The White Paper also presents a labelled action plan with
the goal of reducing overall energy consumption significantly by 2020 in the construction and
transportation sectors. The target is to increase the use of energy carriers for heating from
renewable electricity, and the energy efficiency measures in the industry segment and
buildings with new energy technologies. Among other things, Enova is to accelerate
renovation to environment-friendly energy consumption in households, and to a more energy-
diversified and security-improved energy supply in the consumption segment.
Renewable energy in transportation is encouraged in Norway. It has been calculated at 4860
ktoe (thousand tonnes oil equivalents) in the Norwegian transport sector in 2020, and the
Renewables Directive requires Norway to achieve 10 per cent renewable energy in the
transport sector by 2020. The share of renewables in transport has increased from 1.3 per cent
in 2005 to 4.0 per cent in 2010. In particular, more efficient passenger cars contribute to the
estimated total in the energy efficiency improvement plan. The government set the goal for
the average emissions from new passenger cars in 2020 to not exceed 85 g CO2/km2, thus
31
continued efficiency improvement and introduction of more energy-efficient vehicles are
expected. Some additional acts to decrease energy consumption may include a further
transition in cargo transport to sea and rail, as well as a transition from road to public
transportation, bicycles and walking.
Through recommendation to the parliament No. 390 S, the efforts have been strengthened
further. The most obvious effort in this segment will be the current tax benefit. It will be
continued through to the next parliamentary term (2017), as long as the number does not
exceed 50,000. Appendix 3 contains a summary of the regulation support schemes for tax
benefit in the Norwegian energy sector.
4.1.2 How do leading suppliers adjust to the changing environment? As the leading suppliers in the energy sector, ABB and DNVGL both sensed the change and
took actions to adjust to the new regulations by developing new technology and promoting
new markets. In view of the primary data, all interviewees declared that energy change is
driving both companies’ business units towards renewable energy and an energy efficiency
oriented setting. This is the main reason to use BMI as framework for this research. ABB and
DNVGL both agree that the regulation is a particularly dominant factor in the energy sector,
and that it directly effects the technological development and the energy market. As
mentioned in the introduction, the smart grid technology has been developed in recent years,
and it is already contributing to energy efficiency and energy diversity. ABB is the top
innovator in the smart grid technology, and targets to build a futuristic smart city based on
their more than 1085 patents.
The dynamic context has affected both ABB and DNVGL in their technology innovation and
new business model generation. As a pioneer in the electricity transmission, ABB is leading
the smart grid technology in order to adapt to the new pattern of generation. One example of
an early smart grid project that ABB is involved in is the Sweden Gotland smart grid project.
It is an example of how to adapt an existing electricity network to modern conditions. It is
covering various requirements and examining all aspects of smart grids, like many other
project that ABB leads, comprising e-mobility and energy storage to network management,
metering and communication, distribution automation as well as home automation systems
(ABB, 2012). Instead of offering smart grid hardware and software equipment, DNVGL
32
supplies all kinds of services related to cutting edge smart grid training and consulting
services, engineering design and testing services, as well as other license services.
According to the regulation effect, A1 explains the government encouragement on energy
production and associates it with the recent electricity price decrease in Norway and the
Nordic countries. He believes that increase of the electricity production may result in a price
drop, but it also gives new possibilities to the Norwegian energy production industry as the
main electricity supplier in Europe. Since a lower electricity price will create a demand for it,
and in the end stimulate the industries in Norway.
DNVGL’s strategy and business model is dominated by the climate change and low carbon
ambition. According to the report from Jones (2015), the electricity systems around the world
are changing, and one of the most overwhelming changes to the power system is the
expanding share of solar and wind energy. The target of fighting with climate change,
providing secure energy supplies and protecting electricity consumers is challenging. The
regulations are struggling to keep up with technology, and the business models are being
created and destroyed.
Interviewee B2 who has a PHD in the energy field is a professional in energy change
research. As a principal researcher in DNVGL’s low carbon team, she emphasizes that the
energy sector is very much depending on government regulation. Therefore the company
fluctuates with the changes in this political playing ground. However B2 thinks it does not
exactly pressure their business model and their value proposition as a service company.
However it does affect the demand of the service. If there is a slowdown in investments in a
specific type of energy, then it slows down the demand of services that DNVGL supplies to
the value network.
As leaders in their respective field, ABB and DNVGL both consider technology as its strong
competence in the dynamic energy change context; and they both show the needs to focus
more on technology innovation regarding energy and climate change, strengthening customer
relationships, creating new services and products and innovating their business model. In
conclusion, the table below sketches these two companies’ innovations in the dynamic
context.
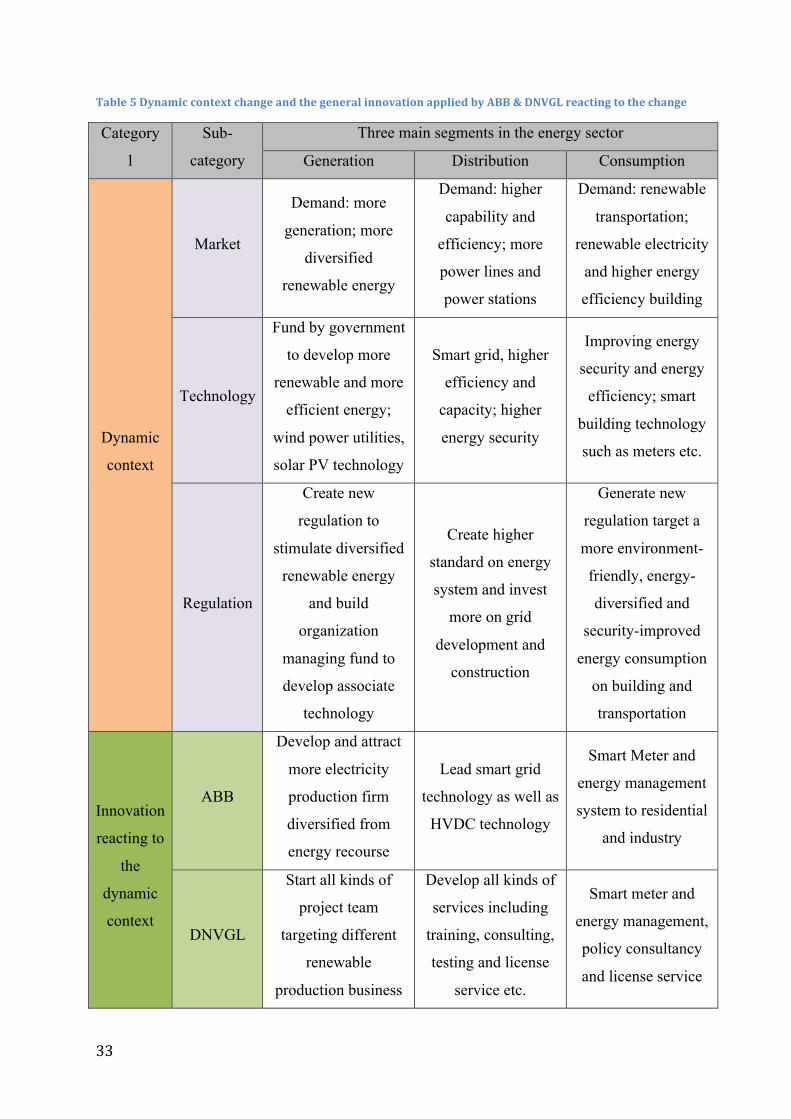
33
Table 5 Dynamic context change and the general innovation applied by ABB & DNVGL reacting to the change
Category
1
Sub-
category
Three main segments in the energy sector
Generation Distribution Consumption
Dynamic
context
Market
Demand: more
generation; more
diversified
renewable energy
Demand: higher
capability and
efficiency; more
power lines and
power stations
Demand: renewable
transportation;
renewable electricity
and higher energy
efficiency building
Technology
Fund by government
to develop more
renewable and more
efficient energy;
wind power utilities,
solar PV technology
Smart grid, higher
efficiency and
capacity; higher
energy security
Improving energy
security and energy
efficiency; smart
building technology
such as meters etc.
Regulation
Create new
regulation to
stimulate diversified
renewable energy
and build
organization
managing fund to
develop associate
technology
Create higher
standard on energy
system and invest
more on grid
development and
construction
Generate new
regulation target a
more environment-
friendly, energy-
diversified and
security-improved
energy consumption
on building and
transportation
Innovation
reacting to
the
dynamic
context
ABB
Develop and attract
more electricity
production firm
diversified from
energy recourse
Lead smart grid
technology as well as
HVDC technology
Smart Meter and
energy management
system to residential
and industry
DNVGL
Start all kinds of
project team
targeting different
renewable
production business
Develop all kinds of
services including
training, consulting,
testing and license
service etc.
Smart meter and
energy management,
policy consultancy
and license service
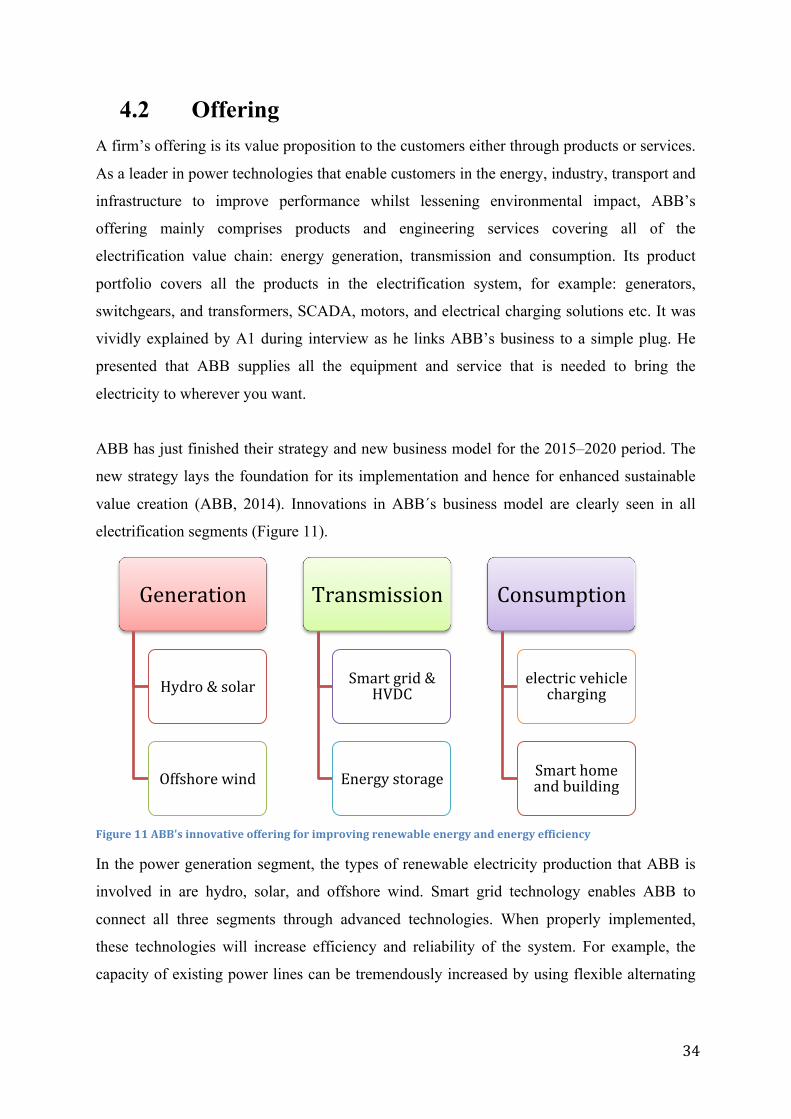
34
4.2 Offering A firm’s offering is its value proposition to the customers either through products or services.
As a leader in power technologies that enable customers in the energy, industry, transport and
infrastructure to improve performance whilst lessening environmental impact, ABB’s
offering mainly comprises products and engineering services covering all of the
electrification value chain: energy generation, transmission and consumption. Its product
portfolio covers all the products in the electrification system, for example: generators,
switchgears, and transformers, SCADA, motors, and electrical charging solutions etc. It was
vividly explained by A1 during interview as he links ABB’s business to a simple plug. He
presented that ABB supplies all the equipment and service that is needed to bring the
electricity to wherever you want.
ABB has just finished their strategy and new business model for the 2015–2020 period. The
new strategy lays the foundation for its implementation and hence for enhanced sustainable
value creation (ABB, 2014). Innovations in ABB´s business model are clearly seen in all
electrification segments (Figure 11).
Figure 11 ABB's innovative offering for improving renewable energy and energy efficiency
In the power generation segment, the types of renewable electricity production that ABB is
involved in are hydro, solar, and offshore wind. Smart grid technology enables ABB to
connect all three segments through advanced technologies. When properly implemented,
these technologies will increase efficiency and reliability of the system. For example, the
capacity of existing power lines can be tremendously increased by using flexible alternating
Generation
Hydro & solar
Offshore wind
Transmission
Smart grid & HVDC
Energy storage
Consumption
electric vehicle charging
Smart home and building
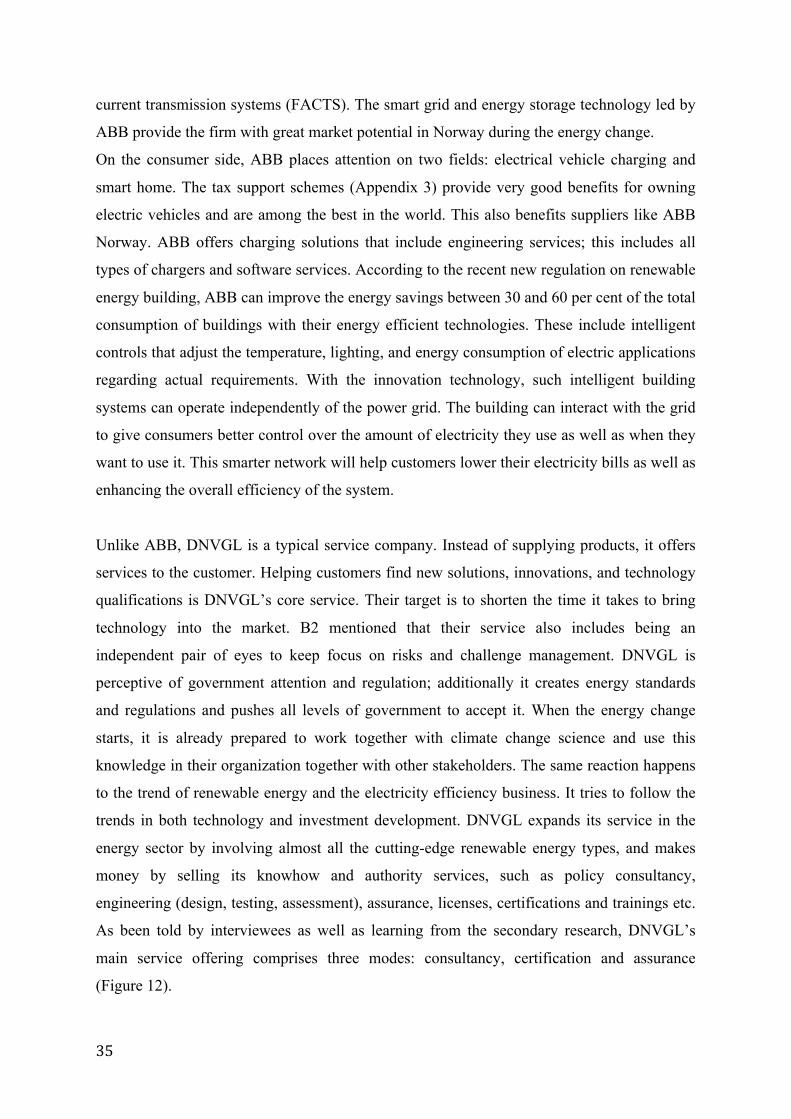
35
current transmission systems (FACTS). The smart grid and energy storage technology led by
ABB provide the firm with great market potential in Norway during the energy change.
On the consumer side, ABB places attention on two fields: electrical vehicle charging and
smart home. The tax support schemes (Appendix 3) provide very good benefits for owning
electric vehicles and are among the best in the world. This also benefits suppliers like ABB
Norway. ABB offers charging solutions that include engineering services; this includes all
types of chargers and software services. According to the recent new regulation on renewable
energy building, ABB can improve the energy savings between 30 and 60 per cent of the total
consumption of buildings with their energy efficient technologies. These include intelligent
controls that adjust the temperature, lighting, and energy consumption of electric applications
regarding actual requirements. With the innovation technology, such intelligent building
systems can operate independently of the power grid. The building can interact with the grid
to give consumers better control over the amount of electricity they use as well as when they
want to use it. This smarter network will help customers lower their electricity bills as well as
enhancing the overall efficiency of the system.
Unlike ABB, DNVGL is a typical service company. Instead of supplying products, it offers
services to the customer. Helping customers find new solutions, innovations, and technology
qualifications is DNVGL’s core service. Their target is to shorten the time it takes to bring
technology into the market. B2 mentioned that their service also includes being an
independent pair of eyes to keep focus on risks and challenge management. DNVGL is
perceptive of government attention and regulation; additionally it creates energy standards
and regulations and pushes all levels of government to accept it. When the energy change
starts, it is already prepared to work together with climate change science and use this
knowledge in their organization together with other stakeholders. The same reaction happens
to the trend of renewable energy and the electricity efficiency business. It tries to follow the
trends in both technology and investment development. DNVGL expands its service in the
energy sector by involving almost all the cutting-edge renewable energy types, and makes
money by selling its knowhow and authority services, such as policy consultancy,
engineering (design, testing, assessment), assurance, licenses, certifications and trainings etc.
As been told by interviewees as well as learning from the secondary research, DNVGL’s
main service offering comprises three modes: consultancy, certification and assurance
(Figure 12).
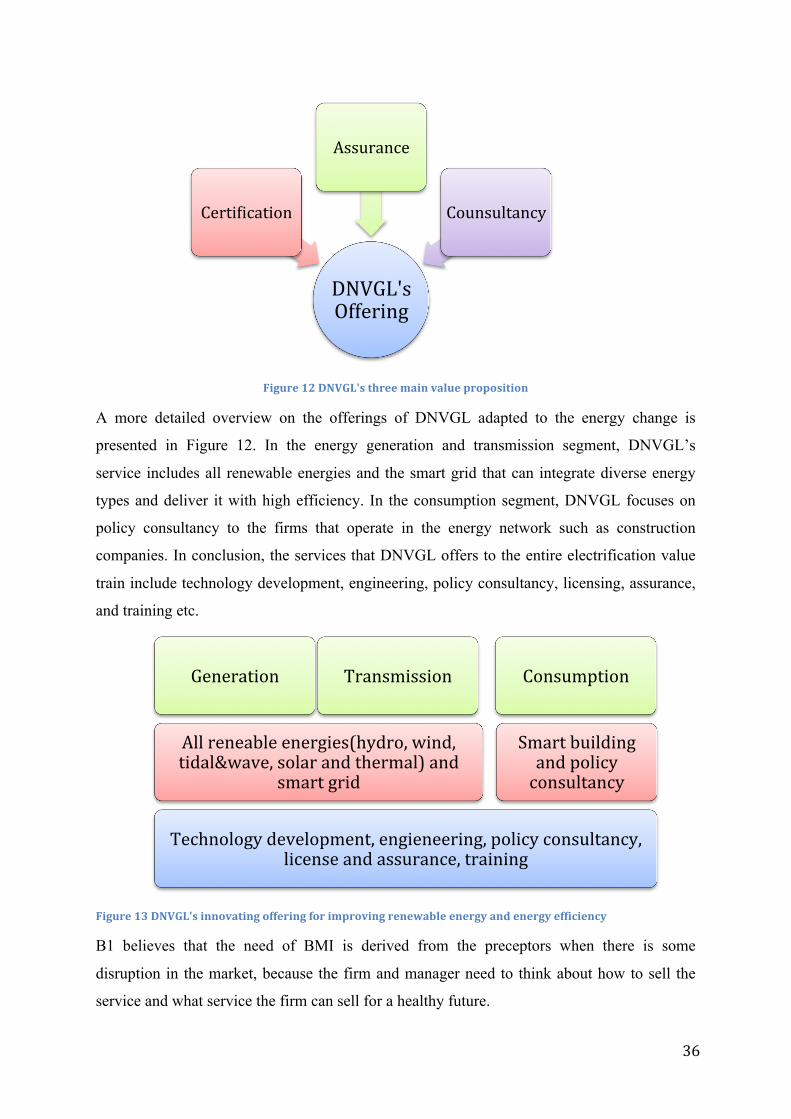
36
Figure 12 DNVGL's three main value proposition
A more detailed overview on the offerings of DNVGL adapted to the energy change is
presented in Figure 12. In the energy generation and transmission segment, DNVGL’s
service includes all renewable energies and the smart grid that can integrate diverse energy
types and deliver it with high efficiency. In the consumption segment, DNVGL focuses on
policy consultancy to the firms that operate in the energy network such as construction
companies. In conclusion, the services that DNVGL offers to the entire electrification value
train include technology development, engineering, policy consultancy, licensing, assurance,
and training etc.
Figure 13 DNVGL's innovating offering for improving renewable energy and energy efficiency
B1 believes that the need of BMI is derived from the preceptors when there is some
disruption in the market, because the firm and manager need to think about how to sell the
service and what service the firm can sell for a healthy future.
DNVGL's Offering
Certilication
Assurance
Counsultancy
Technology development, engieneering, policy consultancy, license and assurance, training
All reneable energies(hydro, wind, tidal&wave, solar and thermal) and
smart grid
Generation Transmission
Smart building and policy consultancy
Consumption
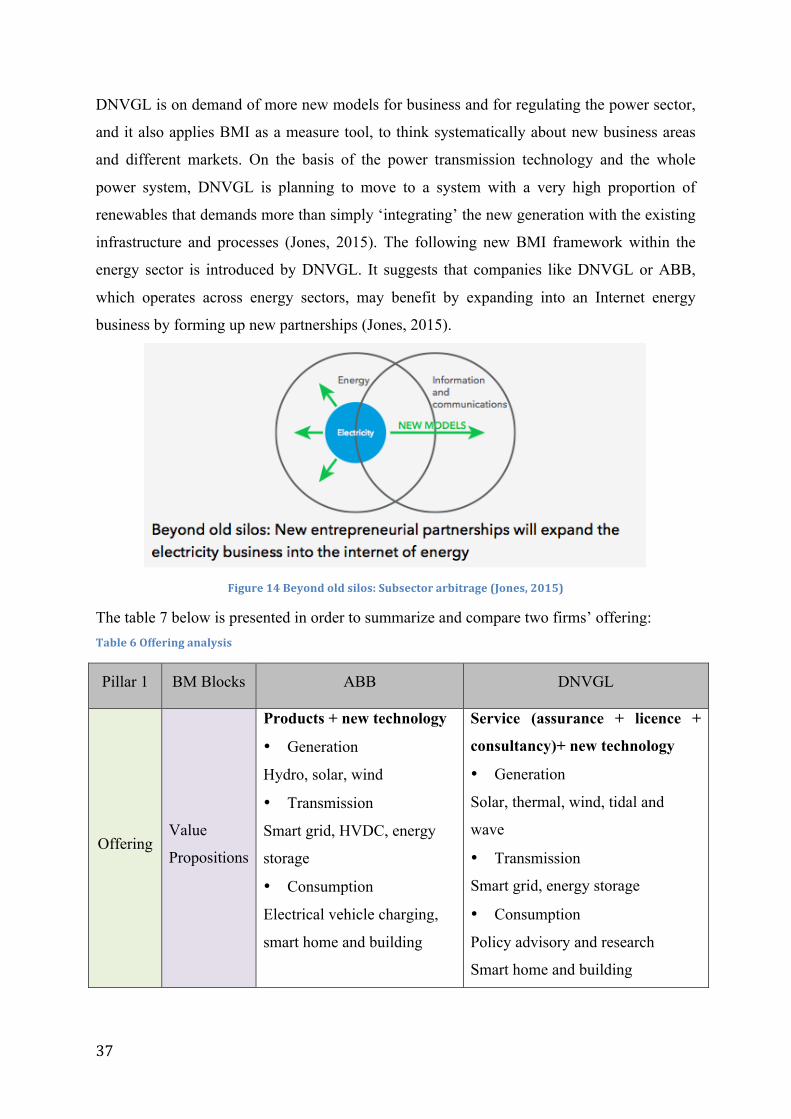
37
DNVGL is on demand of more new models for business and for regulating the power sector,
and it also applies BMI as a measure tool, to think systematically about new business areas
and different markets. On the basis of the power transmission technology and the whole
power system, DNVGL is planning to move to a system with a very high proportion of
renewables that demands more than simply ‘integrating’ the new generation with the existing
infrastructure and processes (Jones, 2015). The following new BMI framework within the
energy sector is introduced by DNVGL. It suggests that companies like DNVGL or ABB,
which operates across energy sectors, may benefit by expanding into an Internet energy
business by forming up new partnerships (Jones, 2015).
Figure 14 Beyond old silos: Subsector arbitrage (Jones, 2015)
The table 7 below is presented in order to summarize and compare two firms’ offering: Table 6 Offering analysis
Pillar 1 BM Blocks ABB DNVGL
Offering Value
Propositions
Products + new technology
• Generation
Hydro, solar, wind
• Transmission
Smart grid, HVDC, energy
storage
• Consumption
Electrical vehicle charging,
smart home and building
Service (assurance + licence +
consultancy)+ new technology
• Generation
Solar, thermal, wind, tidal and
wave
• Transmission
Smart grid, energy storage
• Consumption
Policy advisory and research
Smart home and building
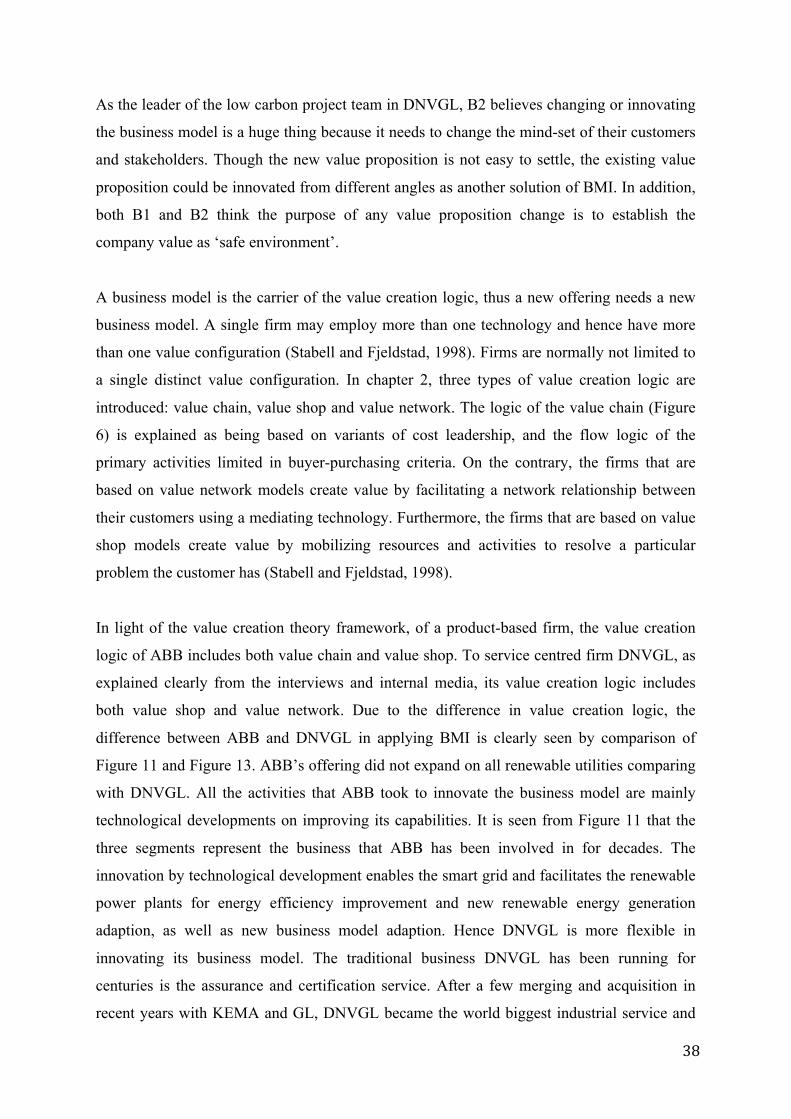
38
As the leader of the low carbon project team in DNVGL, B2 believes changing or innovating
the business model is a huge thing because it needs to change the mind-set of their customers
and stakeholders. Though the new value proposition is not easy to settle, the existing value
proposition could be innovated from different angles as another solution of BMI. In addition,
both B1 and B2 think the purpose of any value proposition change is to establish the
company value as ‘safe environment’.
A business model is the carrier of the value creation logic, thus a new offering needs a new
business model. A single firm may employ more than one technology and hence have more
than one value configuration (Stabell and Fjeldstad, 1998). Firms are normally not limited to
a single distinct value configuration. In chapter 2, three types of value creation logic are
introduced: value chain, value shop and value network. The logic of the value chain (Figure
6) is explained as being based on variants of cost leadership, and the flow logic of the
primary activities limited in buyer-purchasing criteria. On the contrary, the firms that are
based on value network models create value by facilitating a network relationship between
their customers using a mediating technology. Furthermore, the firms that are based on value
shop models create value by mobilizing resources and activities to resolve a particular
problem the customer has (Stabell and Fjeldstad, 1998).
In light of the value creation theory framework, of a product-based firm, the value creation
logic of ABB includes both value chain and value shop. To service centred firm DNVGL, as
explained clearly from the interviews and internal media, its value creation logic includes
both value shop and value network. Due to the difference in value creation logic, the
difference between ABB and DNVGL in applying BMI is clearly seen by comparison of
Figure 11 and Figure 13. ABB’s offering did not expand on all renewable utilities comparing
with DNVGL. All the activities that ABB took to innovate the business model are mainly
technological developments on improving its capabilities. It is seen from Figure 11 that the
three segments represent the business that ABB has been involved in for decades. The
innovation by technological development enables the smart grid and facilitates the renewable
power plants for energy efficiency improvement and new renewable energy generation
adaption, as well as new business model adaption. Hence DNVGL is more flexible in
innovating its business model. The traditional business DNVGL has been running for
centuries is the assurance and certification service. After a few merging and acquisition in
recent years with KEMA and GL, DNVGL became the world biggest industrial service and
39
assurance, certification supplier. Thus as a pure industrial service company, DNVGL keeps
an extremely high sensitiveness on the regulation and all the possibilities in the renewable
energy sector. The entire innovated offering generated recently as shown in figure 13 has a
high-level of diversification of services that are offered across energy sectors. A shift from
value shop to value network in DNVGL was confirmed by interviewees and it is also seen
from the activities on service-oriented BMI. Yet, the common part between ABB and
DNVGL on offering is that the technology development and commercialization lead the
entire new business model to respond to the dynamic context based on the demand of
renewable energy and energy efficiency.
4.3 Customer interface The customer interface explains the interaction between a company and its customers.
Customer interface includes customer segment, channel and customer relationship.
Since ABB is the main equipment supplier in the energy sector, the power production
companies (utilities) and the electricity network companies are the main customers from the
generation and transmission segments. From the latest statistic report by Statistic Norway, the
electricity produced from hydropower accounts for around 95% of the total electricity
production in Norway, the rest is contributed by thermal and wind power. Thus, Statkraft as
the biggest state owned energy-generating company is the main customer in the energy
generation segment of ABB Norway, as explained by A1. Interestingly, A1 further
introduced the Norwegian energy policy and society to explain ABB’s market context in the
energy sector. The principle is that all the energy that is produced in Norway belongs to the
country, the community and the people. Private companies can operate the utility, but the
country owns it by leasing the operation rights to them and taking a share of the profit.
Statkraft is the main national power generation firm in Norway. It owns 273 hydro power
plants, 25 district heating plants, and 3 wind power plants (Statkraft, 2015). During the
interview, A1 confirmed the importance of the business with Statkraft, he mentioned that
even though the profit from the framework agreement signed between ABB and Statkraft is
very low, it can help them securely achieve the annual sales target.
An even more important customer to ABB is Statnett, the state-owned power transmission
and operation company. According to the recent news, Statnett just awarded ABB a 240
million Kroner contract of nine transformers related to the Western Corridor power upgrade,
which is currently being implemented to increase capacity in the main grid. The transformers
40
will help to increase the transmission capacity in the main grid, which means it will improve
the power supply reliability and support more renewable energy transmission in accordance
with the regulation and target for 2020 (ABB, 2015b).
Except the projects run in Norway, Statnett has some very big projects collaborating with
other countries. ABB Norway won the two largest contracts from Statnett this year as
equipment supplier. One is a $450 million order for Norway-UK HVDC interconnection with
the target of increasing power supply security for both countries and supporting the
integration of more renewable hydro and wind electric power into the networks. Another
order awarded to ABB by Statnett at March 2015 is worth $900 million, ABB will contribute
to on-shore HVDC converter stations and facilitate the first ever interconnection between the
Norwegian and German power grids.
In the electricity consumption segment, there are two types of customers for ABB: the
customers that are companies such as electric vehicle charging stations and construction
companies; and public consumers who buy the smart house solution. At the 19th of May
2015, ABB has installed and commissioned its 100th fast charger for electric vehicles, at
Eikelandsosen near Bergen in Norway. The owner of charging stations is Fusa Kraftlag SA
and the operator is Grønn Kontakt5 (i.e. “Green Plug”). So far ABB has delivered around 50
per cent of the existing fast chargers in Norway excluding the separate Tesla super chargers
(ABB, 2015a). Therefore, the customers of ABB in the EV segments are charging stations
nationwide in Norway.
Regarding the smart house and building construction, in order to become fully incorporated
into the power supply network, buildings have to be furnished with meters in order to collect
precise data of electricity consumption and the building network management. The end user
in this case is either the constructing company, the local government’s house management
organization or individual households.
As a leading industrial service-centred company DNVGL’s main customers are firms in the
industry rather than public consumers. However, DNVGL does offer training courses to the
5 Grønn Kontakt is a national operator of charging stations supplying charging service to all types of electrical cars. The company was established in 2009 and is currently owned by 23 power and grid companies from all over Norway. The owners include Statkraft, BKK, Innovation and R & D AS (Agder Energi) etc.
41
general public for who wants to get technical licenses or learn professional knowledge about
some specific issues in the energy sector.
Therefore, in the energy change trend, DNVGL works closely with government not only by
investigating the regulation, but also by creating the standards and pushing them to all levels
of the government. The authority DNVGL has been granted to issue certification and
assurance to its customer due to its ownership of high standard technology and knowhow, as
well as by cooperating with the government fund. In all three segments of the energy value
chain, DNVGL’s main customers are all the players in the energy sector. These include but
are not limited to suppliers in the energy value network such as ABB, the utilities and
operation firms like Statkraft and Statnett, the companies that own and runs charging stations
like Fusa Kraftlag SA and Grønn Kontakt, as well as construction firms that accept better
energy consumption solutions. Despite of the training services that may be open to private
persons, DNVGL does not have business to consumers. This differs with ABB, who has a
clear private market segment as well.
DNVGL believes that providing the platform for communication among its relevant
customers is their future business model. Although as an industrial consultancy company,
DNVGL has already provided valuable information to all players in the market by publishing
and sharing policy research, technical codes, and industrial standard openly.
The above analysis shows that ABB’s customer segments are limited to the customers across
the electrification value chains that buy physical products from ABB: the firms that produce
and transfer power, and firms or public consumers that consume power. Thus, ABB needs to
rely on the customer’s needs, and the production yield will be influenced by the fluctuation of
the power market demand. On the contrary, DNVGL does not sell physical products, but sells
its customers consultancy services on industrial policies and knowhow, technology solutions
and its authority to issuing certification and assurance. Instead of being influenced by
demand like ABB, DNVGL tends to lead the market demand by influencing customers with
cutting edge regulations and specific services. The relationship between DNVGL and its
customers is less tight but is more like a partnership (Table 7).
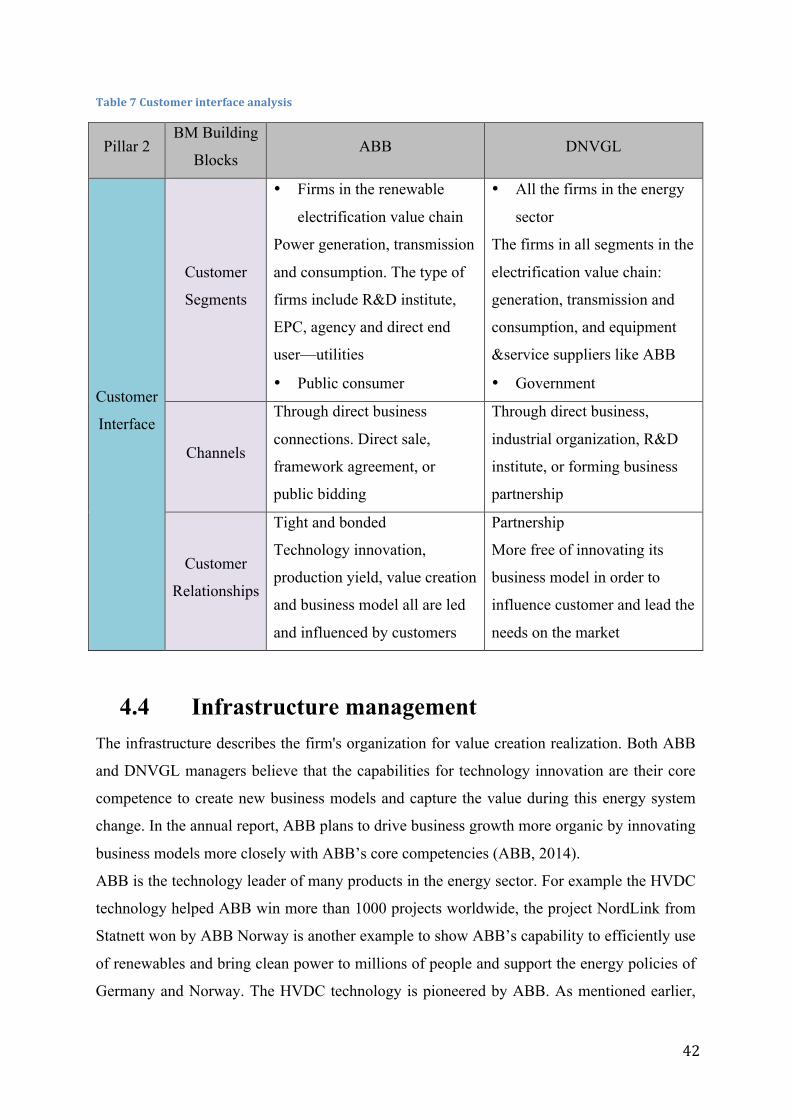
42
Table 7 Customer interface analysis
Pillar 2 BM Building
Blocks ABB DNVGL
Customer
Interface
Customer
Segments
• Firms in the renewable
electrification value chain
Power generation, transmission
and consumption. The type of
firms include R&D institute,
EPC, agency and direct end
user—utilities
• Public consumer
• All the firms in the energy
sector
The firms in all segments in the
electrification value chain:
generation, transmission and
consumption, and equipment
&service suppliers like ABB
• Government
Channels
Through direct business
connections. Direct sale,
framework agreement, or
public bidding
Through direct business,
industrial organization, R&D
institute, or forming business
partnership
Customer
Relationships
Tight and bonded
Technology innovation,
production yield, value creation
and business model all are led
and influenced by customers
Partnership
More free of innovating its
business model in order to
influence customer and lead the
needs on the market
4.4 Infrastructure management The infrastructure describes the firm's organization for value creation realization. Both ABB
and DNVGL managers believe that the capabilities for technology innovation are their core
competence to create new business models and capture the value during this energy system
change. In the annual report, ABB plans to drive business growth more organic by innovating
business models more closely with ABB’s core competencies (ABB, 2014).
ABB is the technology leader of many products in the energy sector. For example the HVDC
technology helped ABB win more than 1000 projects worldwide, the project NordLink from
Statnett won by ABB Norway is another example to show ABB’s capability to efficiently use
of renewables and bring clean power to millions of people and support the energy policies of
Germany and Norway. The HVDC technology is pioneered by ABB. As mentioned earlier,
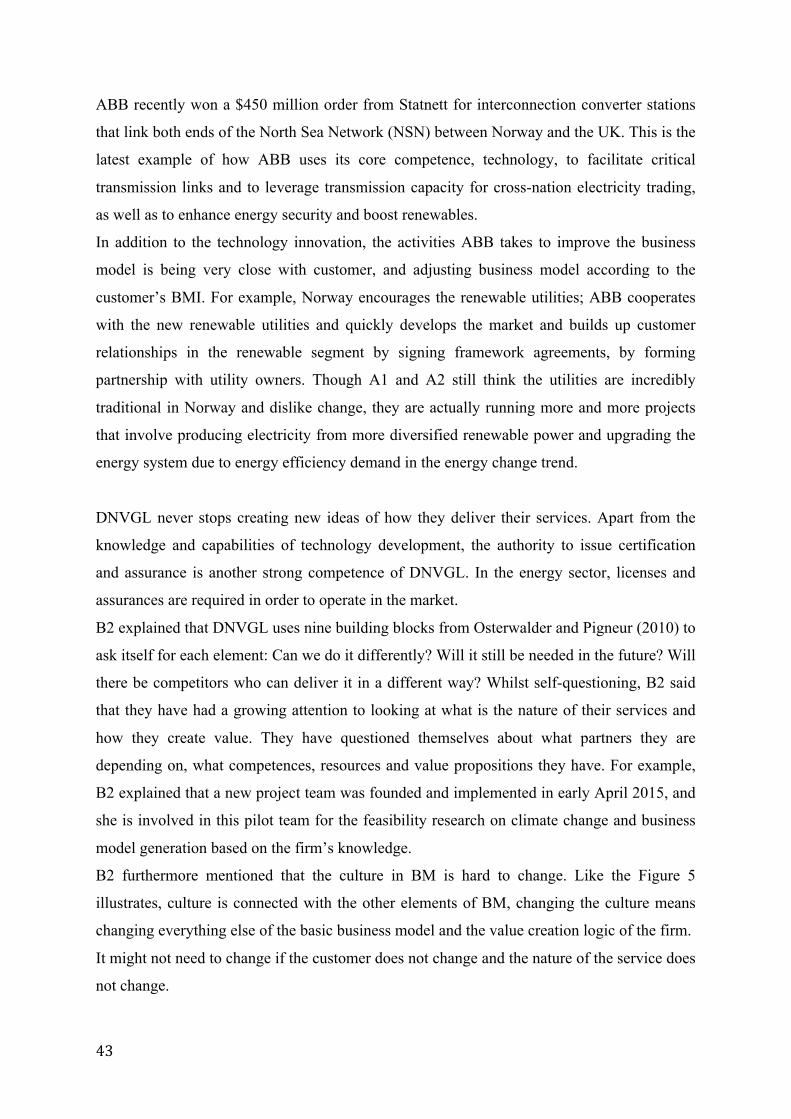
43
ABB recently won a $450 million order from Statnett for interconnection converter stations
that link both ends of the North Sea Network (NSN) between Norway and the UK. This is the
latest example of how ABB uses its core competence, technology, to facilitate critical
transmission links and to leverage transmission capacity for cross-nation electricity trading,
as well as to enhance energy security and boost renewables.
In addition to the technology innovation, the activities ABB takes to improve the business
model is being very close with customer, and adjusting business model according to the
customer’s BMI. For example, Norway encourages the renewable utilities; ABB cooperates
with the new renewable utilities and quickly develops the market and builds up customer
relationships in the renewable segment by signing framework agreements, by forming
partnership with utility owners. Though A1 and A2 still think the utilities are incredibly
traditional in Norway and dislike change, they are actually running more and more projects
that involve producing electricity from more diversified renewable power and upgrading the
energy system due to energy efficiency demand in the energy change trend.
DNVGL never stops creating new ideas of how they deliver their services. Apart from the
knowledge and capabilities of technology development, the authority to issue certification
and assurance is another strong competence of DNVGL. In the energy sector, licenses and
assurances are required in order to operate in the market.
B2 explained that DNVGL uses nine building blocks from Osterwalder and Pigneur (2010) to
ask itself for each element: Can we do it differently? Will it still be needed in the future? Will
there be competitors who can deliver it in a different way? Whilst self-questioning, B2 said
that they have had a growing attention to looking at what is the nature of their services and
how they create value. They have questioned themselves about what partners they are
depending on, what competences, resources and value propositions they have. For example,
B2 explained that a new project team was founded and implemented in early April 2015, and
she is involved in this pilot team for the feasibility research on climate change and business
model generation based on the firm’s knowledge.
B2 furthermore mentioned that the culture in BM is hard to change. Like the Figure 5
illustrates, culture is connected with the other elements of BM, changing the culture means
changing everything else of the basic business model and the value creation logic of the firm.
It might not need to change if the customer does not change and the nature of the service does
not change.
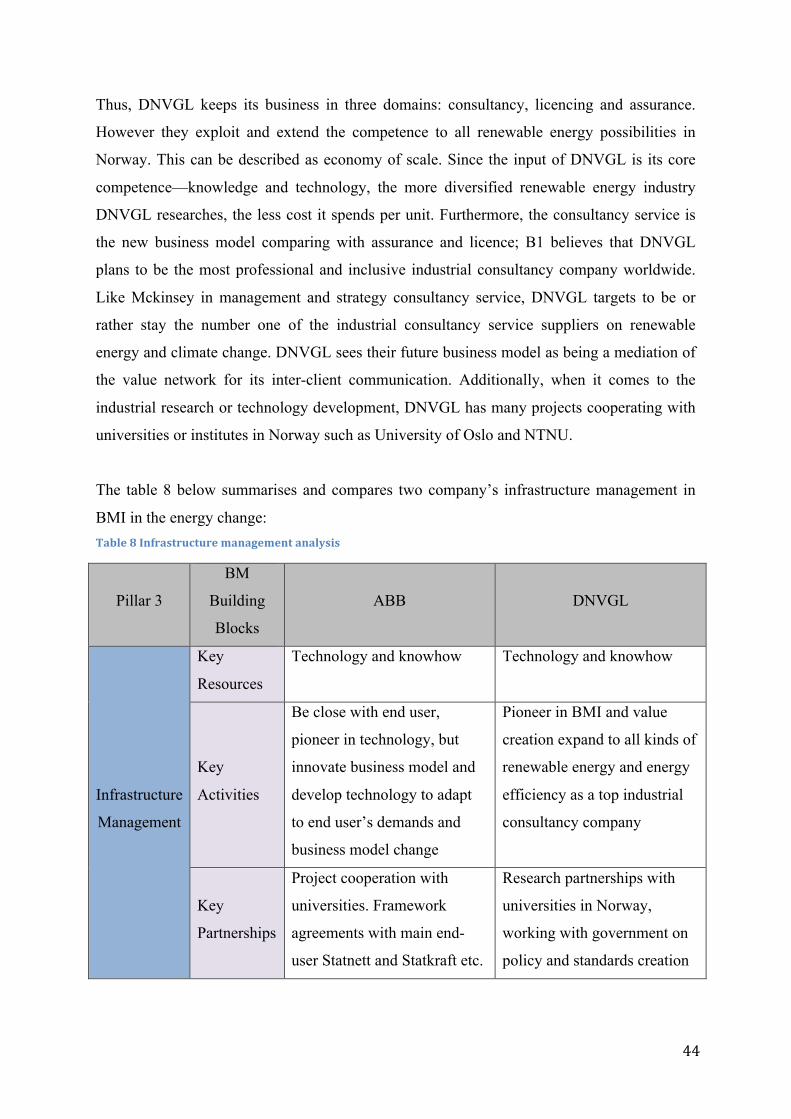
44
Thus, DNVGL keeps its business in three domains: consultancy, licencing and assurance.
However they exploit and extend the competence to all renewable energy possibilities in
Norway. This can be described as economy of scale. Since the input of DNVGL is its core
competence—knowledge and technology, the more diversified renewable energy industry
DNVGL researches, the less cost it spends per unit. Furthermore, the consultancy service is
the new business model comparing with assurance and licence; B1 believes that DNVGL
plans to be the most professional and inclusive industrial consultancy company worldwide.
Like Mckinsey in management and strategy consultancy service, DNVGL targets to be or
rather stay the number one of the industrial consultancy service suppliers on renewable
energy and climate change. DNVGL sees their future business model as being a mediation of
the value network for its inter-client communication. Additionally, when it comes to the
industrial research or technology development, DNVGL has many projects cooperating with
universities or institutes in Norway such as University of Oslo and NTNU.
The table 8 below summarises and compares two company’s infrastructure management in
BMI in the energy change: Table 8 Infrastructure management analysis
Pillar 3
BM
Building
Blocks
ABB DNVGL
Infrastructure
Management
Key
Resources
Technology and knowhow Technology and knowhow
Key
Activities
Be close with end user,
pioneer in technology, but
innovate business model and
develop technology to adapt
to end user’s demands and
business model change
Pioneer in BMI and value
creation expand to all kinds of
renewable energy and energy
efficiency as a top industrial
consultancy company
Key
Partnerships
Project cooperation with
universities. Framework
agreements with main end-
user Statnett and Statkraft etc.
Research partnerships with
universities in Norway,
working with government on
policy and standards creation
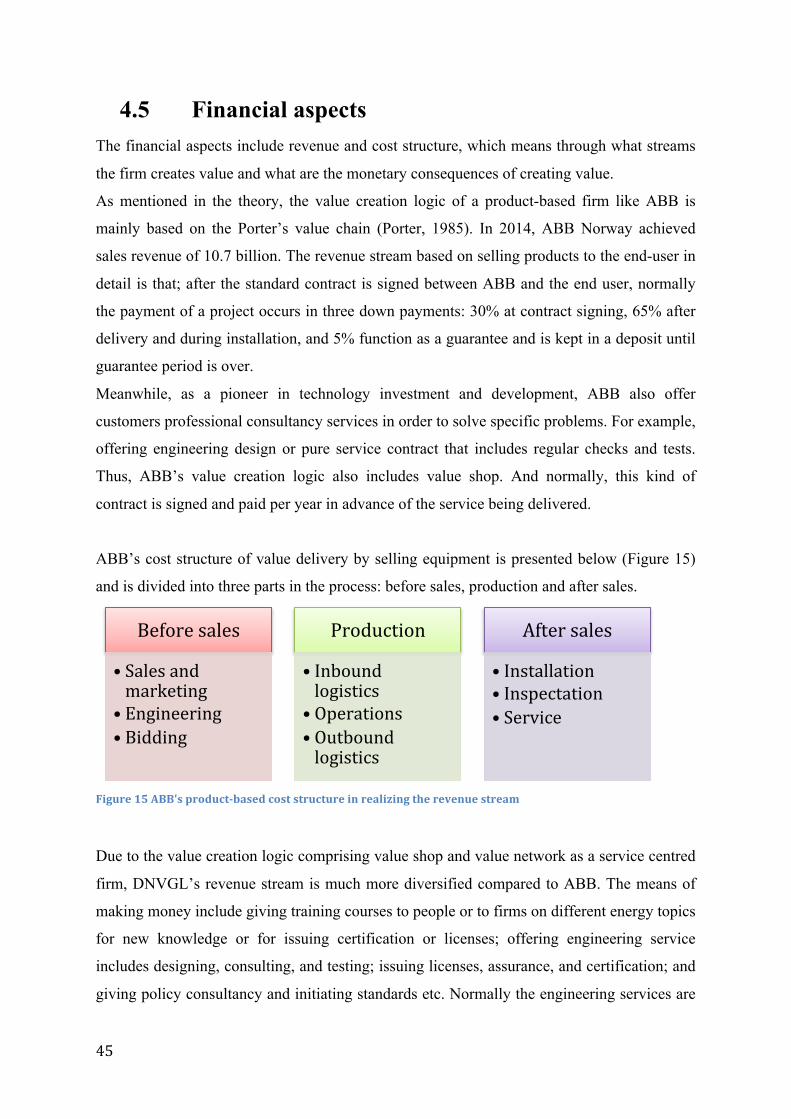
45
4.5 Financial aspects The financial aspects include revenue and cost structure, which means through what streams
the firm creates value and what are the monetary consequences of creating value.
As mentioned in the theory, the value creation logic of a product-based firm like ABB is
mainly based on the Porter’s value chain (Porter, 1985). In 2014, ABB Norway achieved
sales revenue of 10.7 billion. The revenue stream based on selling products to the end-user in
detail is that; after the standard contract is signed between ABB and the end user, normally
the payment of a project occurs in three down payments: 30% at contract signing, 65% after
delivery and during installation, and 5% function as a guarantee and is kept in a deposit until
guarantee period is over.
Meanwhile, as a pioneer in technology investment and development, ABB also offer
customers professional consultancy services in order to solve specific problems. For example,
offering engineering design or pure service contract that includes regular checks and tests.
Thus, ABB’s value creation logic also includes value shop. And normally, this kind of
contract is signed and paid per year in advance of the service being delivered.
ABB’s cost structure of value delivery by selling equipment is presented below (Figure 15)
and is divided into three parts in the process: before sales, production and after sales.
Figure 15 ABB's product-‐based cost structure in realizing the revenue stream
Due to the value creation logic comprising value shop and value network as a service centred
firm, DNVGL’s revenue stream is much more diversified compared to ABB. The means of
making money include giving training courses to people or to firms on different energy topics
for new knowledge or for issuing certification or licenses; offering engineering service
includes designing, consulting, and testing; issuing licenses, assurance, and certification; and
giving policy consultancy and initiating standards etc. Normally the engineering services are
Before sales
• Sales and marketing • Engineering • Bidding
Production
• Inbound logistics • Operations • Outbound logistics
After sales
• Installation • Inspectation • Service
46
realized by signing a contract and this will be fully paid after the service is delivered, for the
authorised issuing service which include the licences, assurance, and certification, the fee has
to be paid in advance during the service application session from the customer side. This is
the same as the policy for consultancy services and the trainings.
Furthermore, B2 suggest that DNVGL can think more fundamentally about the revenue
model, for example, B1 and B2 both shared their new business model ideas such as a network
and mediation for all the customers and charge them a membership fee instead of selling
hours.
To conclude this part of analysis, table 9 collects the features of both firms’ financial aspects: Table 9 Financial aspects analysis
Pillar 4 BM Building
Blocks ABB DNVGL
Financial
Aspects
Revenue
Streams
Mainly by selling products
and signing equipment
contract;
Or offering pure service by
signing service contract
Mainly by selling man hours
for engineering;
Selling authorization services
through issuing license and
assurance;
In the future: membership fee
Cost Structure
Mainly includes man hours
and cost of all the activities,
raw materials and logistic
before sales, during
production and after sales
Mainly man hours
47
5 Discussion and conclusion This study clearly shows that the changes in the energy sector are leading the BMI in the
firms affected. Interestingly, the author finds that the two suppliers that have been studied
here show different approaches to the challenge.
Technology as a drive for business model innovation and as firm’s core competence
Both companies are actively focusing on developing their business model to best suit their
technology and to meet the challenges made by the dynamic industry. Maybe this is one of
the reasons why they are both leaders in their field. The resulting analysis shows that both
ABB and DNVGL consider technology as its core competence and they both show the needs
to focus more on technology innovation regarding energy and climate change, strengthening
customer relationship, creating new services and products.
Teece (2010) suggests that the technological innovation needs BMI in order to create value.
Chesbrough (2007) explains that the technology itself does not require BMI, but the
technology commercialization demands a profoundly novel value proposition and revenue
model compared to the current way of doing business. In the later research, Chesbrough
(2010) strengthens that the same technology taken to market through two different business
models may yield two different economic outcomes. A mediocre technology pursued within a
good business model may be more valuable than a good technology exploited via a mediocre
business model, thus, it is why BMI is very important for new technology commercialization.
This analysis shows that both firms are very sensitive to the regulation and technology. In
order to react to the energy change, developing technology is the basis of leading the BMI to
keep their competence on the market, or even jump ahead of the curve to lead the market
demand and influence the government regulations as DNVGL does. How the firm creates
proper value proposition to commercialize technology is the key to their success.
However, it is also observed that ABB and DNVGL are both technology pioneers in their
relative fields in the energy business, they do not just develop technology according to
change, they somehow lead the change and enact the market by their technology competence.
For example, the HVDC and smart grid technology from ABB lead in the power transfer
sector, and DNVGL uses their certification and standard authority to influence the regulation
and market demand. The technology or authority as offering from both ABB and DNVGL are
48
the core competence which brings them customers and contracts due to limited substitution
/competitors on the market. Thus, their offering is more important than other elements such
as customer interface, infrastructure management, and financial aspects in the business
model. It is maybe more important than the BMI as well. After all, the technology makes
them stand out in the energy market, and most utility managers in the energy sector are
focused very much on technology and the reduction of production costs through economies
of scale (Richter, 2013). Furthermore, it would have been enriching for the analysis to look at
how the smaller suppliers, and those who are not succeeding, are approaching these issues.
Business model innovation on basis of firm’s culture and cognition
Existing literature has contradictory opinions on the BMI. One suggests that the BMI is a
response either to exogenous technological and regulatory change (e.g., (Amit and Zott,
2001); (Teece, 2010)) or to the dynamic context change (e.g., (Chesbrough, 2010)); another
opinion is that the BMI can be applied proactively in the absence of exogenous changes
through processes of procreative cognition by firm (e.g., Martins et al. (2015)).
This study can hardly agree on any side since the business cannot run in a vacuum, but in a
dynamic context where the BMI is applied. Therefore, the research on BMI should consider
both the dynamic context and the inter-organizational cognition.
Chesbrough (2010) considers the firm’s cognition as a barrier of BMI, as how the firms see
themselves creating value and capturing value can limit their innovative capacity. The
success of proven business models strongly influence the information that consequently gets
routed into or filtered out of corporate decision processes. This so called ‘dominant logic’
aids the firm in assessing what information is important, and it will pursue information that
fits with this logic and avoid that which conflicts with it (Chesbrough, 2010). However, the
firm’s cognition is indeed the basis of the BMI. Linking it to the business model
configuration theory by Foss and Saebi (2015), the culture as one out of the five elements
(Figure 5) is interrelated to the rest of business model elements, and the firms’ culture is the
most important factor that influences the firm’s cognition. In fact, both the culture and firm’s
cognition are dominant factors of the new value proposition or BMI, and they are the
coordinate that measures the position of the firm in the value network. As strengthened by A1
and B2 in the interview, the firm’s culture is the core value of their business model, and a
domain factor that influences their BMI. They both agree that during this incremental change,
no disruptive conversion should happen in the market and to their customers. Thus they
should stay on their current value creation logic and not deviate; especially since, according
49
to the interviewees, the electricity industry is very traditional and both ABB, and DNVGL are
well-known market leaders and technology pioneers. Furthermore, in order to avoid being
blind by their cognition, they both have strong departments as information sensors that
collect and analyse market information, government regulation, and technology development.
After all, to know what to do, what not to do, what to try, and what they should never try is
extremely important cognition that can lower the risk in the firm’s BMI and help the
company run on the track that is based on firm’s culture and core value.
The comparison of the two firms showed that ABB’s value creation logic is mainly based on
the value chain as a product-based firm. Although it also offers pure service, a service
contract is often added after the product contracts are signed. This research seized ABB’s
value creation logic shift from value chain to value shop due to the energy change that
requires its highly professional capabilities to solve specific problems of the end users.
However, it is hard to shift to value network because ABB is still and will stay a product-
based firm. On the contrary, as a service-centred firm, the BMI leads DNVGL’s business
creation logic when expanding from value shop to value network. This is achieved through a
diversified solution to the energy market that is required by upgrading the energy system.
Many prior studies have shown that product-based firms generally struggle to make the shift
towards service-centred (e.g. (Gebauer et al., 2005, Ulaga and Reinartz, 2011)).
Foss and Saebi (2015) ask the question of how the firm’s often product-based organizational
structures, capabilities, and culture can influence a firm’s BMI. They also point out that these
important organizational aspects of business models and the innovation thereof have so far
been missing from the literature. The author links its reason back to the firm’s culture and
cognition, as well as to the theory of the economies of scale.
The findings of this study indicate that technology is not only the dominant factor of the
dynamic context that stimulates the BMI, but also the core competence of the firm that lead
the BMI. The success of technology commercialization is based on a good value proposition
and BMI. However if the technology is unique, the offering as an outstanding element of
business model may lighten the importance of BMI, or will dominate the BMI. Except the
technology factor, the BMI differs based on the firm’s culture and cognition. A different
degree of flexibility in the extent of implementing BMI between product-based firm and
service-centred firm is due to firm’s value creation difference, and essentially due to the
firm’s culture and cognition difference.
50
This study proved that two perspectives—the technology perspective and the cognitive
perspective—are both needed to apply BMI, since a firm’s business is not in a vacuum, the
dynamic change (e.g. (Kijl et al., 2005)) and organizational cognition (e.g. (Aspara et al.,
2013)) both affect the business model and its innovation.
Moreover, two implications emerge from the analysis and conclusions in this research.
Firstly, this research has several practical implications for business development and strategy
professionals focusing on BMI in the renewable energy market. The value propositions and
the different perspectives on BMI, from the leading product- and service-based suppliers, is a
good example for managers to learn and practice BMI. The in-depth study on the Norwegian
energy regulation and environment, as well as the segment analysing the energy sector
prepare the knowledge ground for implementation by managers in the Norwegian energy
value network.
Secondly, this exploratory research has several implications for academics. It provides
groundwork for researchers to continue deeper analysis of the BMI in the Norwegian energy
sector. The methodology that integrated dynamic business model elements and the business
model elements to analysis the firm’s BMI is practical and logical for future similar study.
The results indicate that the BMI in a product-based firm is more likely to be influenced by
the end user, but the service-centred firm is more likely to influence the end user. It would be
interesting to conduct more interviews across a number of suppliers who vary in size,
resources and brand popularity to determine how the BMI will be impacted by these factors,
and to highlight the main differences between product-based firms and service-centred firms
in applying BMI.
Though this research is designed with full consideration of reliability and validity, due to the
limited timespan of the research, there are some limitations that need to be pointed out:
First of all, the findings from this study may be argued that they providing limited basis for
scientific generalization due to the quantity of the units of analysis (Yin, 2009); Secondly, the
research topic limits the author to only a few people within the organizations who can
provide in-depth insights, although the study will achieve higher validity by having more
interviewees. Finally, during the time of conducting the research and while writing this
thesis, many innovations are still on going, therefore the viable measurements may not be
thorough and completed.

51
In conclusion, this research is resonant with previous literature. This explorative study
contributes with essential groundwork for future research on this very interesting and
important topic in times of change in the energy sector.

52
53
References
ABB. 2012. Pioneering smart grids on Gotland, Sweden [Online]. ABB Webpage: ABB. Available: http://www.abb.com/cawp/seitp202/077f92def9668579c1257a400037425b.aspx [Accessed 23 August 2015].
ABB 2014. Ready for next level-‐-‐The ABB group annual report 2014. ABB Webpage. ABB. 2015a. ABB installed its 100th fast charger in Norway [Online]. ABB. Available:
http://www.abb.com/cawp/seitp202/645fb8840b1971d5c1257e57002c38b2.aspx [Accessed 4 July 2015].
ABB. 2015b. ABB leverer transformatorer verdt 240 millioner kroner til Statnett [Online]. ABB i Norge Webpage. Available: http://www.abb.no/cawp/seitp202/ad79a1b30c5b36c5c1257e8a002075b8.aspx?_ga=1.148803380.2000908162.1433314371 [Accessed 30 July 2015].
AMIT, R. & ZOTT, C. 2001. Value creation in e-‐business. Strategic Management Journal, 22, 493-‐520.
ASPARA, J., LAMBERG, J.-‐A., LAUKIA, A. & TIKKANEN, H. 2013. Corporate business model transformation and inter-‐organizational cognition: the case of Nokia. Long Range Planning, 46, 459–474.
BADEN-‐FULLER, C. & HAEFLIGER, S. 2013. Business models and technological innovation Long Range Planning, 46, 419–426.
BADEN-‐FULLER, C. & MORGAN, M. S. 2010. Business Models as Models. Long Range Planning, 43, 156-‐171.
CASADESUS-‐MASANELL, R. & RICART, J. E. 2010. From Strategy to Business Models and onto Tactics. Long Range Planning, 43, 195-‐215.
CHESBROUGH, H. 2010. Business Model Innovation: Opportunities and Barriers. Long Range Planning, 43, 354-‐363.
CHESBROUGH, H. W. 2007. Business model innovation: It's not just about technology anymore. Strategy and Leadership, 35, 12-‐17.
CHESBROUGH, H. W. & ROSENBLOOM, R. S. 2002. The role of the business model in capturing value from innovation: evidence from xerox corporation's technology spin-‐off companies. Industrial and corporate change, 11, 529-‐555.
DESHPANDE, R. & FREDERICK E. WEBSTER, J. 1989. Organizational culture and marketing: defining the research agenda. Journal Of Marketing, 53, 3-‐15.
DUNCAN, R. B. 1972. Characteristics of Organizational Environments and Perceived Environmental Uncertainty. Administrative Science Quarterly, 17, 313-‐327.
EISENHARDT, K. M. 1989. Building theories from case study research. Academy of management, 14, 532-‐550.
ENERGI NORGE. 2015. Energi Norge. Available: http://www.energinorge.no/english/ [Accessed 9 April 2015].
ERGEG 2009. Position paper on smart grids. An ERGEG public consultation paper. ERGEG [European Regulators’ Group for Electricity and Gas].
EUROPEAN ENVIRONMENT AGENCY 2013a. Climate and energy country profiles — Key facts and figures for EEA member countries. EEA Technical Report, 17, 178.
EUROPEAN ENVIRONMENT AGENCY. 2013b. Summaries the overall picture of the energy system in the EU (Mtoe) [Online]. European Environment Agency. Available:
54
http://www.eea.europa.eu/data-‐and-‐maps/figures/summaries-‐the-‐overall-‐picture-‐of [Accessed 19 April 2015].
FOSS, N. J. & SAEBI, T. 2015. Business Model Innovation: The organizational dimension, United Kindom, Oxford university press.
GEBAUER, H., FLEISCH, E. & FRIEDLI, T. 2005. Overcoming the Service Paradox in Manufacturing Companies. European Management Journal, 23, 14-‐26.
HUIJBEN, J. C. C. M. & VERBONG, G. P. J. 2013. Breakthrough without subsidies? PV business model experiments in the Netherlands. Energy Policy, 56, 362–370.
HYNES, N. 2009. Corporate culture, strategic orientation, and business performance: New approaches to modeling complex relationships. Technological Forecasting & Social Change, 76, 644–651.
JONES, F. 2015. A global industry report: Beyond integration-‐-‐Three dynamics reshaping renewables and the grid. http://www.dnvgl.com/energy.
KIJL, B., BOUWMAN, H., HAAKER, T. & FABER, E. 2005. Developing a dynamic business model framework for emerging mobile services. in ITS 16th European Regional Conference. Porto, Portugal.
LINNENLUECKE, M. K. & GRIFFITHS, A. 2010. Corporate sustainability and organizational culture. Journal of World Business, 45, 357–366.
MARTINS, L. L., RINDOVA, V. P. & GREENBAUM, B. E. 2015. Unlocking the hidden value of concepts: A cognitive approach to business model innovation. Strategic Entrepreneurship Journal, 9, 99–117.
MAYS, N. & POPE, C. 2000. Qualitative research in healthcare: addressing quality in qualitative research. British Medical Journal, 320, 50-‐52.
MINISTRY OF PETROLEUM AND ENERGY 2013. National renewable energy action plan under Directive 2009/28/EC. In: ENERGY, M. O. P. A. (ed.). Ministry of Petroleum and Energy.
MITCHELL, D. & COLES, C. 2003. The ultimate competitive advantage of continuing business model innovation. JOURNAL OF BUSINESS STRATEGY, 24, 15-‐21.
NORMANN, R. 2001. Reframing Business-‐-‐When the Map Changes the Landscape, Chichester, John Wiley & Sons.
NORWEGIAN MINISTRY OF THE ENVIRONMENT 2009. Norway's fifth national communication under the framework convention on climate change.
OSTERWALDER, A. & PIGNEUR, Y. 2010. Business model generation, Hoboken, New Jersey, John Wiley & Sons, Inc.
OSTERWALDER, A., PIGNEUR, Y. & TUCCI, C. L. 2005. Clarifying business models: Origins, present, and future of the concept. Communications of AIS, 15, 40.
OXFORD DICTIONARIES 2015. Change. http://www.oxforddictionaries.com/definition/english/change: Oxford Dictionaries.
PANFIL, P., JOHN WALLACE, P. E. & WOODWARD, G. 2009. Power supply trends: Powering Up [Online]. Facility executive. Available: http://facilityexecutive.com/2009/07/power-‐supply-‐trends-‐powering-‐up/ [Accessed 19, August 2015].
PENG, M. W. 2009. Global Strategy, South-‐Western Cengage Learning. PORTER, M. 1985. Competitive Advantage: Creating and Sustaining Superior
Performance, New York. RICHTER, M. 2013. Business model innovation for sustainable energy: German utilities
and renewable energy. Energy Policy, 62, 1226–1237.
55
SHAH, V. 2015. 5 ways energy efficiency is changing the world [Online]. Eco-‐Business. Available: http://www.eco-‐business.com/news/5-‐ways-‐energy-‐efficiency-‐is-‐changing-‐the-‐world/ [Accessed 8 August 2015].
STABELL, C. B. & FJELDSTAD, Ø. D. 1998. Configuring value for competitive advantage: on chains, shops, and networks. Strategic Management Journal, 19, 413-‐437.
STATISTICS NORWAY. 2015. Electricity, annual figures, 2013 [Online]. Statistics Norway. Available: http://www.ssb.no/en/energi-‐og-‐industri/statistikker/elektrisitetaar/aar/2015-‐03-‐25?fane=tabell&sort=nummer&tabell=222061 [Accessed 9 April 2015].
STATKRAFT. 2015. Facts about Statkraft [Online]. Statkraft webpage. Available: http://www.statkraft.com/about-‐statkraft/facts-‐about-‐statkraft/ [Accessed 5 August 2015].
TEECE, D. J. 2007. Explicating Dynamic Capabilities: The nature and microfoundations of (sustainable) enterprise performance. Strategic management journal, 28, 1319-‐1350.
TEECE, D. J. 2010. Business Models, Business Strategy and Innovation. Long Range Planning, 43, 172-‐194.
THOMPSON, J. D. 1967. Organizations in Action, New York., McGraw-‐Hill. ULAGA, W. & REINARTZ, W. 2011. Hybrid Offerings: How Manufacturing Firms Combine
Goods and Services Successfully. Journal of Marketing, 71, 1-‐17. WHITE, J. 2015. Top 10 companies shaping the future of smart grid technology [Online].
energydigital. Available: http://www.energydigital.com/top10/3868/Top-‐10-‐companies-‐shaping-‐the-‐future-‐of-‐smart-‐grid-‐technology [Accessed 23 August 2015].
WIKIPEDIA. 2015. United nations framework convention on climate change [Online]. Wikipedia: Wikipedia. Available: https://en.wikipedia.org/wiki/United_Nations_Framework_Convention_on_Climate_Change [Accessed 21 July 2015].
WILSON, J. 2010. Essentials of business research, SAGE. YIN, R. K. 2009. Case Study Research: Design and Methods, SAGE. ZOTT, C., AMIT, R. & MASSA, L. 2011. The Business Model: Recent Developments and
Future Research. Journal of Management, 37, 1019-‐1042.
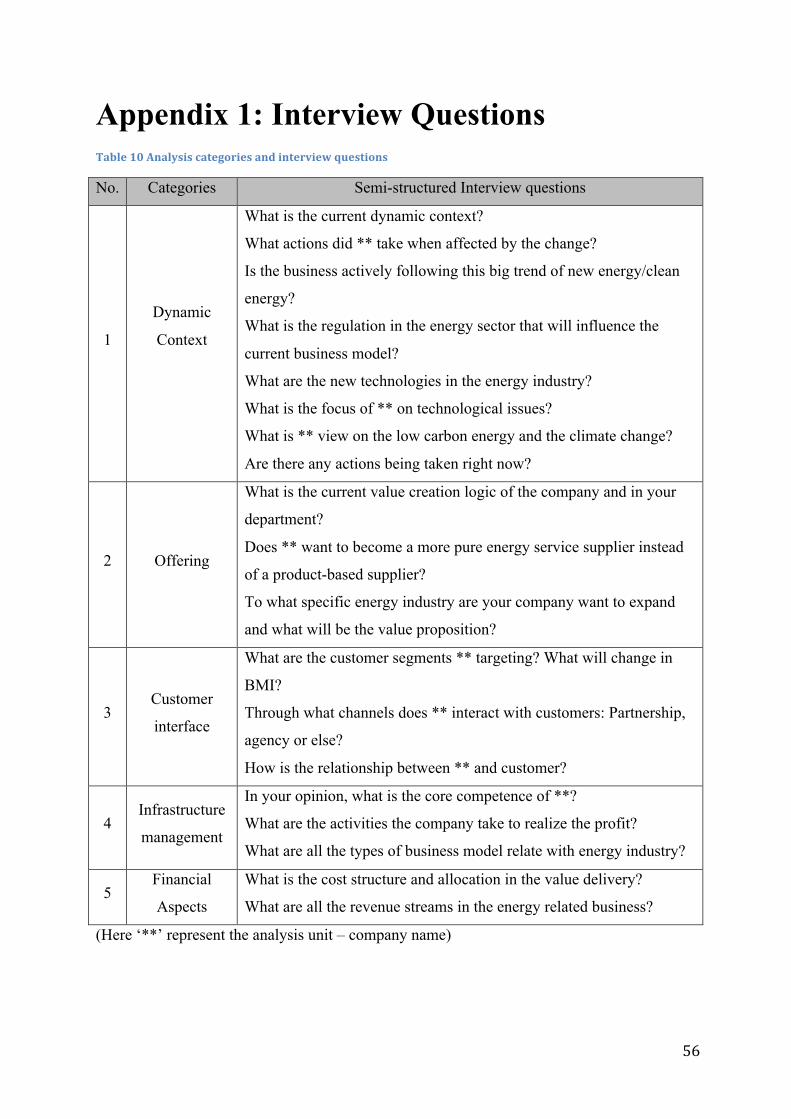
56
Appendix 1: Interview Questions Table 10 Analysis categories and interview questions
No. Categories Semi-structured Interview questions
1
Dynamic
Context
What is the current dynamic context?
What actions did ** take when affected by the change?
Is the business actively following this big trend of new energy/clean
energy?
What is the regulation in the energy sector that will influence the
current business model?
What are the new technologies in the energy industry?
What is the focus of ** on technological issues?
What is ** view on the low carbon energy and the climate change?
Are there any actions being taken right now?
2 Offering
What is the current value creation logic of the company and in your
department?
Does ** want to become a more pure energy service supplier instead
of a product-based supplier?
To what specific energy industry are your company want to expand
and what will be the value proposition?
3 Customer
interface
What are the customer segments ** targeting? What will change in
BMI?
Through what channels does ** interact with customers: Partnership,
agency or else?
How is the relationship between ** and customer?
4 Infrastructure
management
In your opinion, what is the core competence of **?
What are the activities the company take to realize the profit?
What are all the types of business model relate with energy industry?
5 Financial
Aspects
What is the cost structure and allocation in the value delivery?
What are all the revenue streams in the energy related business?
(Here ‘**’ represent the analysis unit – company name)
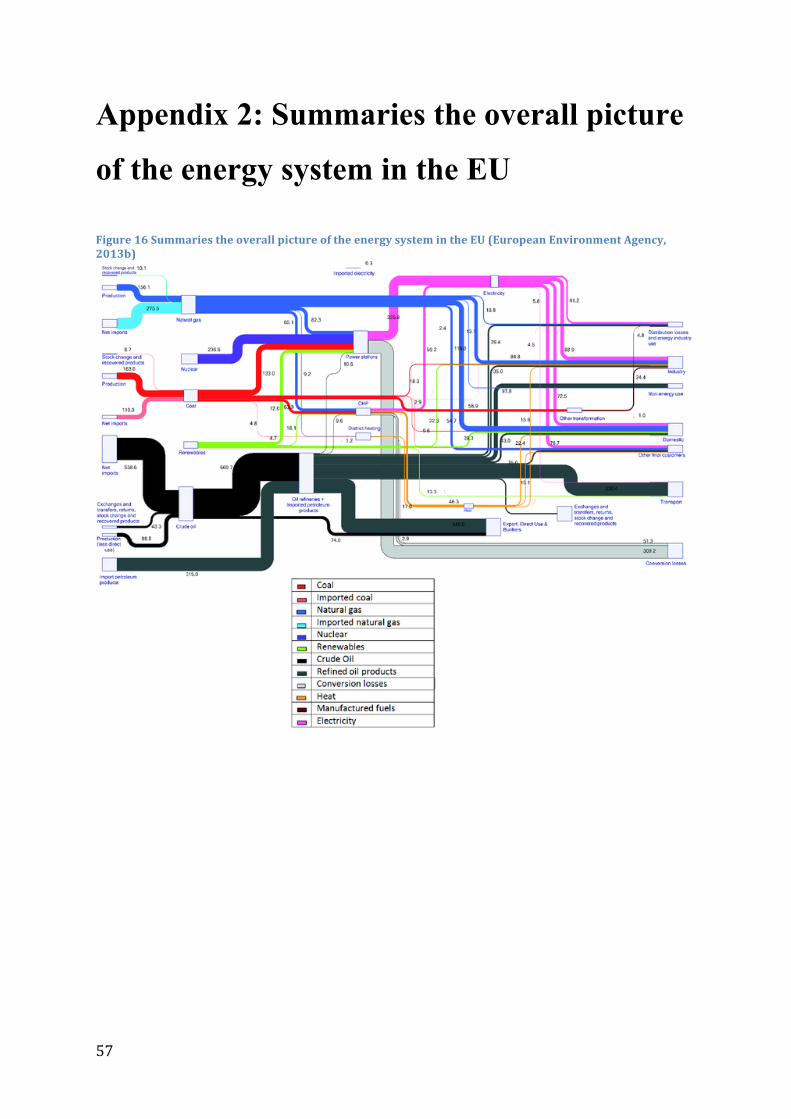
57
Appendix 2: Summaries the overall picture
of the energy system in the EU Figure 16 Summaries the overall picture of the energy system in the EU (European Environment Agency, 2013b)
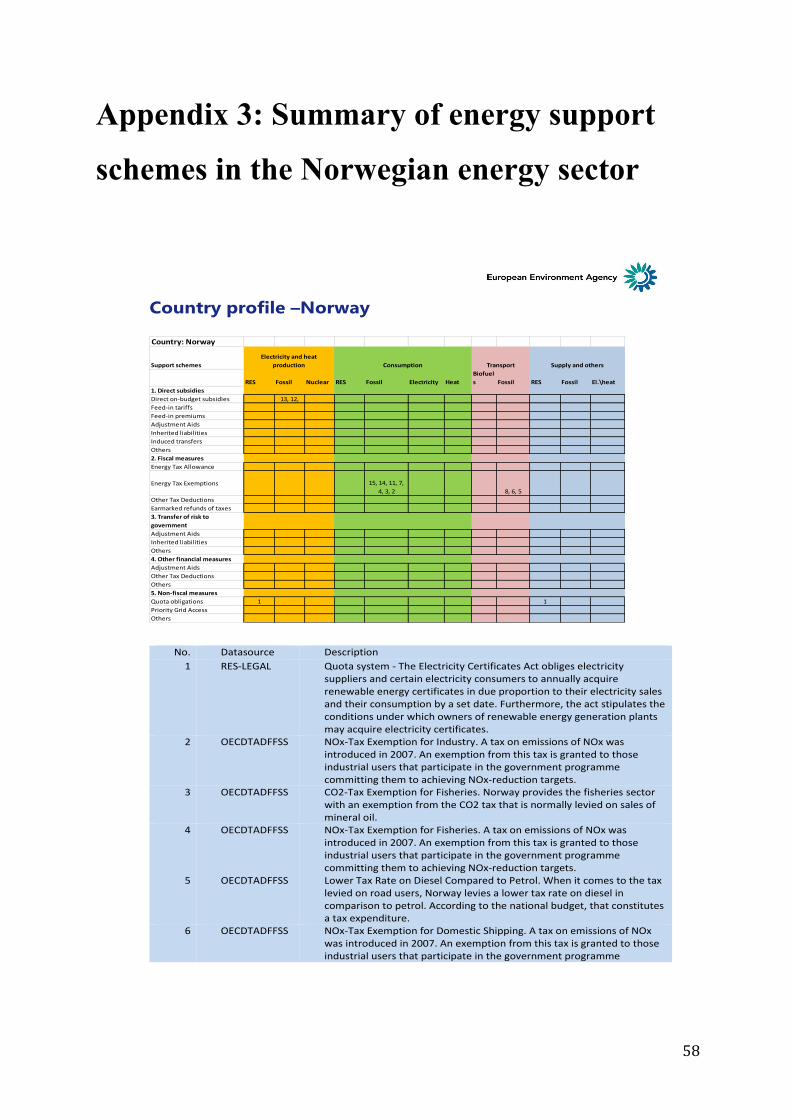
58
Appendix 3: Summary of energy support
schemes in the Norwegian energy sector
Country profile �Norway
Country:)Norway
Support)schemes
RES Fossil Nuclear RES Fossil Electricity HeatBiofuels Fossil RES Fossil El.\heat
1.)Direct)subsidiesDirect'on*budget'subsidies 13,'12,'Feed*in'tariffsFeed*in'premiumsAdjustment'AidsInherited'liabilitiesInduced'transfersOthers2.)Fiscal)measuresEnergy'Tax'Allowance
Energy'Tax'Exemptions 15,'14,'11,'7,'4,'3,'2 8,'6,'5
Other'Tax'DeductionsEarmarked'refunds'of'taxes3.)Transfer)of)risk)to)governmentAdjustment'AidsInherited'liabilitiesOthers4.)Other)financial)measuresAdjustment'AidsOther'Tax'DeductionsOthers5.)NonKfiscal)measuresQuota'obligations 1 1Priority'Grid'AccessOthers
Electricity)and)heat)production Consumption Transport Supply)and)others
No.' Datasource' Description'1' RES*LEGAL' Quota'system'*'The'Electricity'Certificates'Act'obliges'electricity'
suppliers'and'certain'electricity'consumers'to'annually'acquire'renewable'energy'certificates'in'due'proportion'to'their'electricity'sales'and'their'consumption'by'a'set'date.'Furthermore,'the'act'stipulates'the'conditions'under'which'owners'of'renewable'energy'generation'plants'may'acquire'electricity'certificates.'
2' OECDTADFFSS' NOx*Tax'Exemption'for'Industry.'A'tax'on'emissions'of'NOx'was'introduced'in'2007.'An'exemption'from'this'tax'is'granted'to'those'industrial'users'that'participate'in'the'government'programme'committing'them'to'achieving'NOx*reduction'targets.'
3' OECDTADFFSS' CO2*Tax'Exemption'for'Fisheries.'Norway'provides'the'fisheries'sector'with'an'exemption'from'the'CO2'tax'that'is'normally'levied'on'sales'of'mineral'oil.'
4' OECDTADFFSS' NOx*Tax'Exemption'for'Fisheries.'A'tax'on'emissions'of'NOx'was'introduced'in'2007.'An'exemption'from'this'tax'is'granted'to'those'industrial'users'that'participate'in'the'government'programme'committing'them'to'achieving'NOx*reduction'targets.'
5' OECDTADFFSS' Lower'Tax'Rate'on'Diesel'Compared'to'Petrol.'When'it'comes'to'the'tax'levied'on'road'users,'Norway'levies'a'lower'tax'rate'on'diesel'in'comparison'to'petrol.'According'to'the'national'budget,'that'constitutes'a'tax'expenditure.'
6' OECDTADFFSS' NOx*Tax'Exemption'for'Domestic'Shipping.'A'tax'on'emissions'of'NOx'was'introduced'in'2007.'An'exemption'from'this'tax'is'granted'to'those'industrial'users'that'participate'in'the'government'programme'
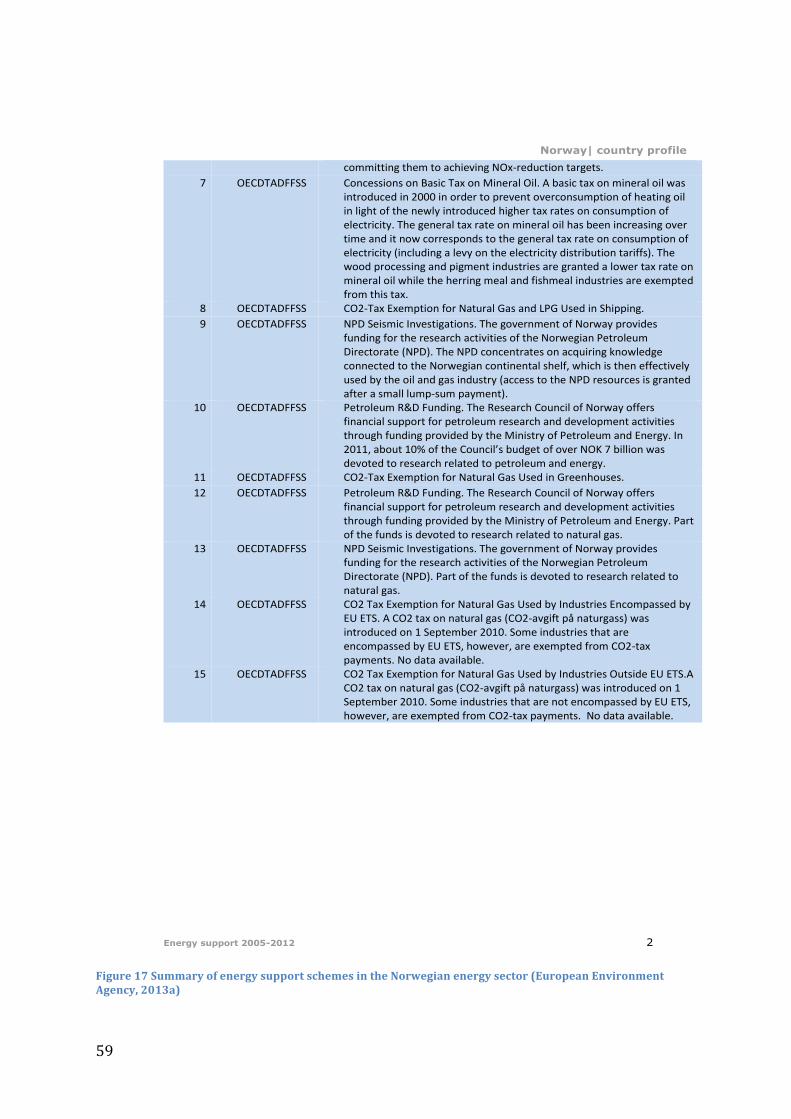
59
Figure 17 Summary of energy support schemes in the Norwegian energy sector (European Environment Agency, 2013a)
Norway|(country(profile(
Energy(support(200582012 2(
committing(them(to(achieving(NOx0reduction(targets.(
7( OECDTADFFSS( Concessions(on(Basic(Tax(on(Mineral(Oil.(A(basic(tax(on(mineral(oil(was(introduced(in(2000(in(order(to(prevent(overconsumption(of(heating(oil(in(light(of(the(newly(introduced(higher(tax(rates(on(consumption(of(electricity.(The(general(tax(rate(on(mineral(oil(has(been(increasing(over(time(and(it(now(corresponds(to(the(general(tax(rate(on(consumption(of(electricity((including(a(levy(on(the(electricity(distribution(tariffs).(The(wood(processing(and(pigment(industries(are(granted(a(lower(tax(rate(on(mineral(oil(while(the(herring(meal(and(fishmeal(industries(are(exempted(from(this(tax.(
8( OECDTADFFSS( CO20Tax(Exemption(for(Natural(Gas(and(LPG(Used(in(Shipping.((
9( OECDTADFFSS( NPD(Seismic(Investigations.(The(government(of(Norway(provides(funding(for(the(research(activities(of(the(Norwegian(Petroleum(Directorate((NPD).(The(NPD(concentrates(on(acquiring(knowledge(connected(to(the(Norwegian(continental(shelf,(which(is(then(effectively(used(by(the(oil(and(gas(industry((access(to(the(NPD(resources(is(granted(after(a(small(lump0sum(payment).(
10( OECDTADFFSS( Petroleum(R&D(Funding.(The(Research(Council(of(Norway(offers(financial(support(for(petroleum(research(and(development(activities(through(funding(provided(by(the(Ministry(of(Petroleum(and(Energy.(In(2011,(about(10%(of(� �����������������������������������������devoted(to(research(related(to(petroleum(and(energy.(
11( OECDTADFFSS( CO20Tax(Exemption(for(Natural(Gas(Used(in(Greenhouses.(((
12( OECDTADFFSS( Petroleum(R&D(Funding.(The(Research(Council(of(Norway(offers(financial(support(for(petroleum(research(and(development(activities(through(funding(provided(by(the(Ministry(of(Petroleum(and(Energy.(Part(of(the(funds(is(devoted(to(research(related(to(natural(gas.(
13( OECDTADFFSS( NPD(Seismic(Investigations.(The(government(of(Norway(provides(funding(for(the(research(activities(of(the(Norwegian(Petroleum(Directorate((NPD).(Part(of(the(funds(is(devoted(to(research(related(to(natural(gas.(
14( OECDTADFFSS( CO2(Tax(Exemption(for(Natural(Gas(Used(by(Industries(Encompassed(by(EU(ETS.(A(CO2(tax(on(natural(gas((CO20avgift(på(naturgass)(was(introduced(on(1(September(2010.(Some(industries(that(are(encompassed(by(EU(ETS,(however,(are(exempted(from(CO20tax(payments.(No(data(available.(
15( OECDTADFFSS( CO2(Tax(Exemption(for(Natural(Gas(Used(by(Industries(Outside(EU(ETS.A(CO2(tax(on(natural(gas((CO20avgift(på(naturgass)(was(introduced(on(1(September(2010.(Some(industries(that(are(not(encompassed(by(EU(ETS,(however,(are(exempted(from(CO20tax(payments.((No(data(available.(
""""""""