Embed Size (px)
Citation preview

MKW VENTURES
Business of NAND: Trends, Forecasts & Challenges
Rahul Advani, Microsemi
&
Mark Webb, MKW Ventures
Flash Memory Summit 2016
Santa Clara, CA
MKW VENTURES
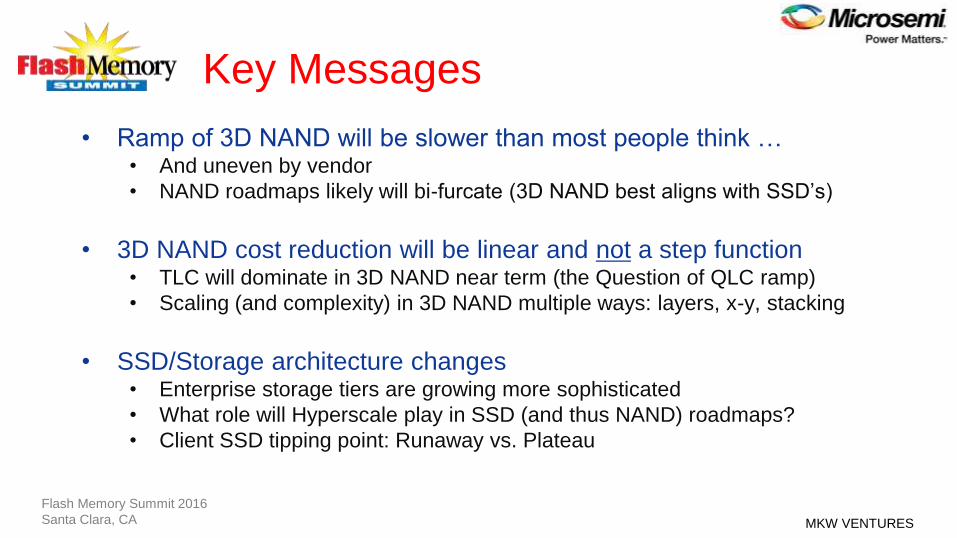
Key Messages
• Ramp of 3D NAND will be slower than most people think … • And uneven by vendor
• NAND roadmaps likely will bi-furcate (3D NAND best aligns with SSD’s)
• 3D NAND cost reduction will be linear and not a step function• TLC will dominate in 3D NAND near term (the Question of QLC ramp)
• Scaling (and complexity) in 3D NAND multiple ways: layers, x-y, stacking
• SSD/Storage architecture changes • Enterprise storage tiers are growing more sophisticated
• What role will Hyperscale play in SSD (and thus NAND) roadmaps?
• Client SSD tipping point: Runaway vs. Plateau
Flash Memory Summit 2016
Santa Clara, CA

MKW VENTURES
Agenda
• Where is NAND today?
• What is NAND going?
Segment level
Component level
• What are the Challenges?
Flash Memory Summit 2016
Santa Clara, CA

MKW VENTURES
NAND: Status
Flash Memory Summit 2016
Santa Clara, CA
MKW VENTURES
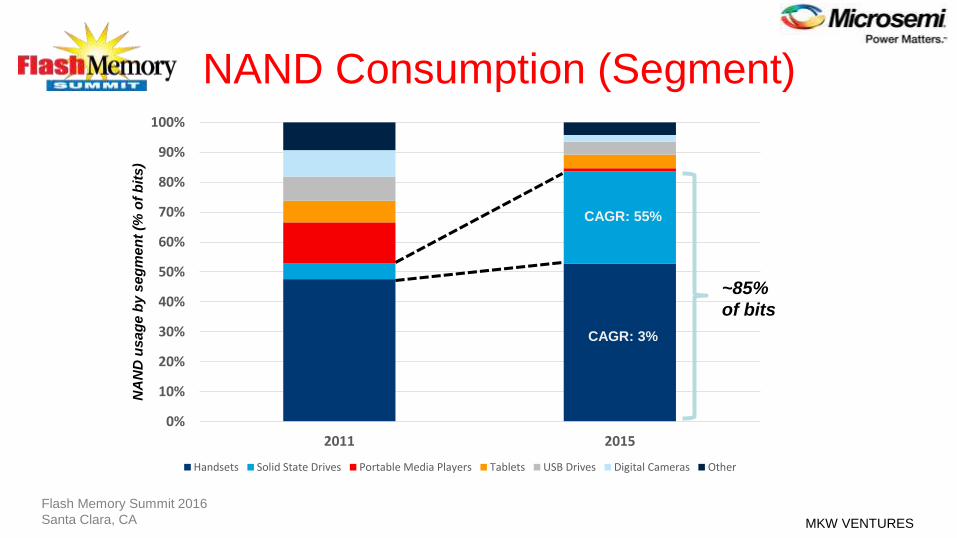
NAND Consumption (Segment)
0%
10%
20%
30%
40%
50%
60%
70%
80%
90%
100%
2011 2015
Handsets Solid State Drives Portable Media Players Tablets USB Drives Digital Cameras Other
CAGR: 3%
CAGR: 55%
~85%
of bits
NA
ND
us
ag
e b
y s
eg
me
nt
(% o
f b
its
)
Flash Memory Summit 2016
Santa Clara, CA

MKW VENTURES
NAND Suppliers (Vendors)
31%
21%15%
14%
11%
8%
2015 NAND MSS(bits)
31%
22%20%
11%
10%
7%
2012 NAND MSS(bits)
Samsung
Toshiba
SanDisk
Micron
SK Hynix
Intel
Flash Memory Summit 2016
Santa Clara, CA

MKW VENTURES
SSD Unit Shipments
Source: Source: IDC, Gartner, I.H.S, Trendfocus, Trendforce and Internal 2016
Enterprise 50% of Revenue & 30% of Bits (and growing)
0
50
100
150
200
250
2014 2015 2016 2017 2018 2019
SSD Unit Shipments (M)
Client Enterprise
Enterprise CAGR: 32%
Client CAGR: 21%
Un
its (
millio
ns)
Flash Memory Summit 2016
Santa Clara, CA
MKW VENTURES
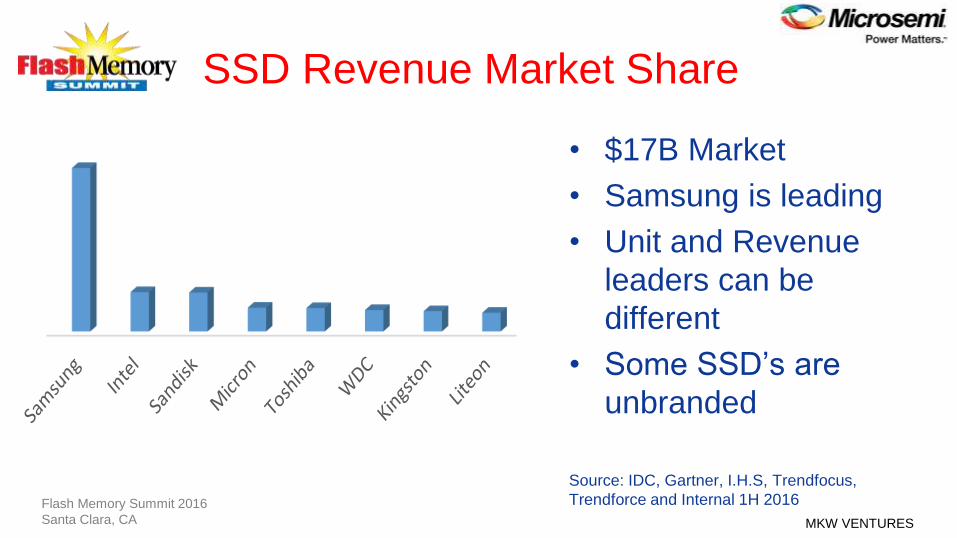
SSD Revenue Market Share
• $17B Market
• Samsung is leading
• Unit and Revenue
leaders can be
different
• Some SSD’s are
unbranded
Source: IDC, Gartner, I.H.S, Trendfocus,
Trendforce and Internal 1H 2016
Overall SSD Market ShareRevenue
Flash Memory Summit 2016
Santa Clara, CA

MKW VENTURES
Enterprise/Datacenter Revenue Share
• $8B+ Market
• Share varies widely
between analysts
• Definition of enterprise
• Intel revenue reports
• Will change again with
Sandisk merger
Source: IDC, Gartner, IHS, Trendfocus,
Trendforce and Internal 1H 2016Samsung Intel WDC Sandisk
Enterprise SSD Market ShareRevenue
Flash Memory Summit 2016
Santa Clara, CA
MKW VENTURES
Hyperscale … the hidden numbers
• Often Hyperscale internal use is
hard to track easily
• DRAM can be argued to be a
bellwether for SSD trends
• Over 50% of DRAM enterprise bits
‘Cloud’ by 2017
• For more complex SSD’s:
• What % will be direct vs. thru vendors
optimizations ?
• How expansive will the BYO trend
with tier 1 cloud vendors ?
0%
10%
20%
30%
40%
50%
2014 2015 2016 2017 2018 2019
Cloud as % of Enterprise SSD's
Flash Memory Summit 2016
Santa Clara, CA

MKW VENTURES
3D NAND: Component Trends
Flash Memory Summit 2016
Santa Clara, CA

MKW VENTURES
TLC Industry Output
201720162015
TL
C (
% o
f o
utp
ut)
20142013
Leaders
LaggardsIndustry average
50%
25%
75%
TLC output secularly rising across Vendors(with QLC products on the horizon)
Flash Memory Summit 2016
Santa Clara, CA

MKW VENTURES
2D to 3D NAND Volume Ramp
3D Volume Ramp Factors
• Technology readiness (3D
TLC spec equivalent to 2D
MLC)
• Economics of the last 2D
NAND node
• Manufacturability & Yield
• Equipment planned
3D
NAND
Cost/bit (
yie
lded)
A B
Last 2D
NAND
X
Flash Memory Summit 2016
Santa Clara, CA
MKW VENTURES
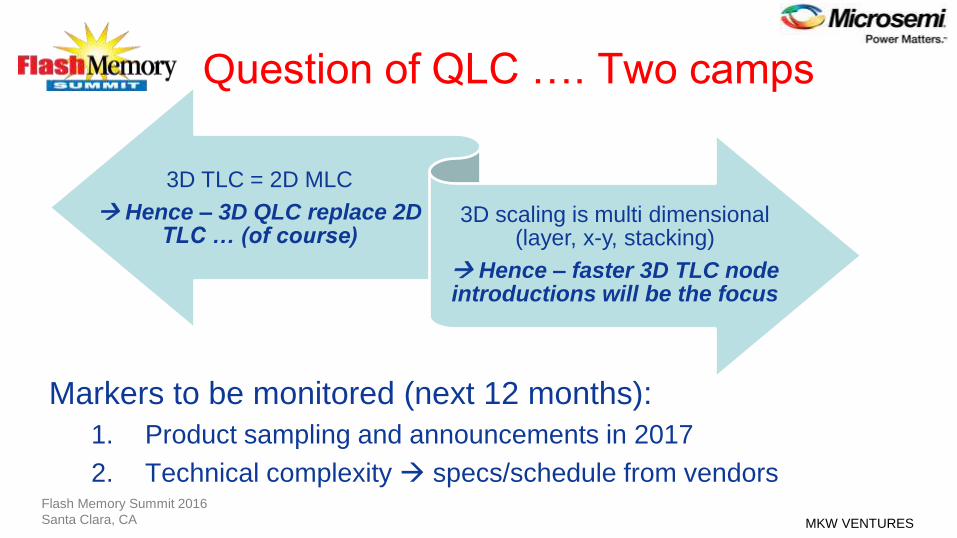
Question of QLC …. Two camps
Markers to be monitored (next 12 months):
1. Product sampling and announcements in 2017
2. Technical complexity specs/schedule from vendors
3D TLC = 2D MLC
Hence – 3D QLC replace 2D TLC … (of course)
3D scaling is multi dimensional (layer, x-y, stacking)
Hence – faster 3D TLC node introductions will be the focus
Flash Memory Summit 2016
Santa Clara, CA

MKW VENTURES
NAND Roadmaps
64Gb
128Gb
256/384Gb
512Gb (pr)
1Tb+ (pr)
What about applications like…
1. Low cost Mobile
2. Low capacity client SSDs (for perf)
3. High performance low capacity
Is bi-furcation of NAND roadmaps inevitable?(or support for 2D nodes extended)
Enterprise SSD’s
Client SSD’s
High Capacity Mobile
Flash Memory Summit 2016
Santa Clara, CA
MKW VENTURESFlash Memory Summit 2016
Santa Clara, CA
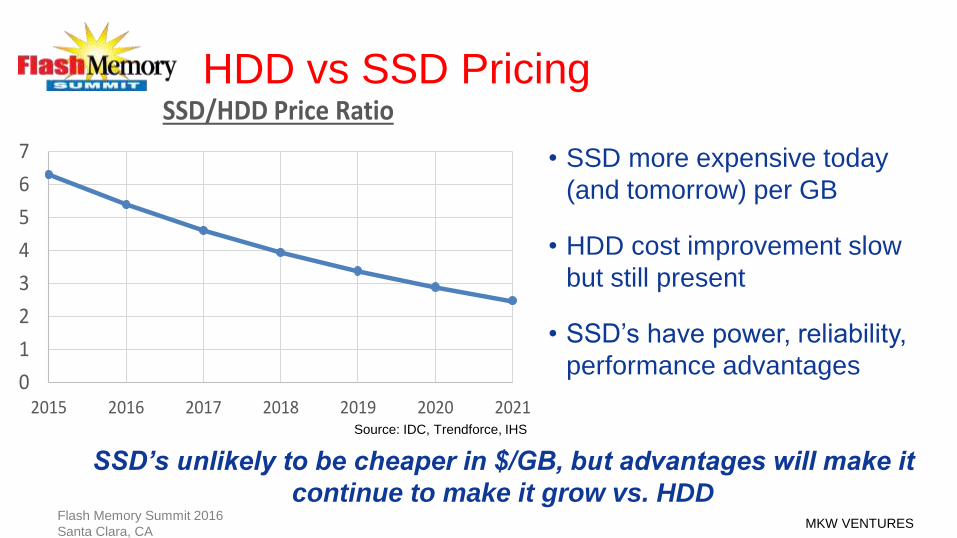
HDD vs SSD Pricing
• SSD more expensive today
(and tomorrow) per GB
• HDD cost improvement slow
but still present
• SSD’s have power, reliability,
performance advantages0
1
2
3
4
5
6
7
2015 2016 2017 2018 2019 2020 2021
SSD/HDD Price Ratio
Source: IDC, Trendforce, IHS
SSD’s unlikely to be cheaper in $/GB, but advantages will make it
continue to make it grow vs. HDD

MKW VENTURES
3D NAND: Segment Trends
Flash Memory Summit 2016
Santa Clara, CA

MKW VENTURES
Enterprise SSD’s
• PCIe driving innovative solutions
• Hyperscale has led initial charge
with rising global deployments
• Mainstream PCIe closing gap
with better performance &
comparable economics to SATA
• PCIe & SAS will lead enterprise
Flash Memory Summit 2016
Santa Clara, CA

MKW VENTURES
Enterprise New Storage Tiers
DRAM
Persistent Tier (Next gen memory)
Performance Optimized SSD (PCIe)
Capacity Optimized SSDs (SAS, SATA)
Capacity Optimized HDDs
Key Metrics
$/GB Read/ Write
Endurance
$3-57ns/7ns
1e18
Between DRAM &
NAND
100’s ns tolow µs
Between DRAM &
NAND
$0.4-1.0 100µs/ 25µs100’s-10K PE cycles
< $0.4 0.5ms/ 50µs100’s-10K PE cycles
< $0.05 2-10 ms High
Flash Memory Summit 2016
Santa Clara, CA

MKW VENTURES
Build-Your-Own: Economics
Standard SSD BYO SSD
Controller Board & Components
Manufacturing & Test NAND (user GB)
25-40%
advantage
Flash Memory Summit 2016
Santa Clara, CA

MKW VENTURES
Build-Your-Own: Platform Knobs
Applications
Platform “Knobs”Power
Used
DRAM
Density
Flash
Density
Flash
Type/Cost
Host
I/F BW
Cold Storage
2.5” SSD
(SAS/SATA)
Low/Mid PCIe SSD
Enterprise PCIe SSD
Caching Adapter
Low
Medium
High
BYO motivation broader than cost arbitrage(Hyperscale with added qual advantages)
Flash Memory Summit 2016
Santa Clara, CA

MKW VENTURES
Enterprise Controller Ecosystem
• Complexity• Multiple rev’s and related delays
• Cost• Several $10’s millions
• Capability• Specific technical expertise
• Architectural maturity• Multiple generations in production
NAND Vendors
SSD & AFA Vendors
Hyperscaledirect
Microsemi (3rd party)
Controller Customers
Flash Memory Summit 2016
Santa Clara, CA
MKW VENTURESFlash Memory Summit 2016
Santa Clara, CA
3D NAND: Forecasts
MKW VENTURESFlash Memory Summit 2016
Santa Clara, CA
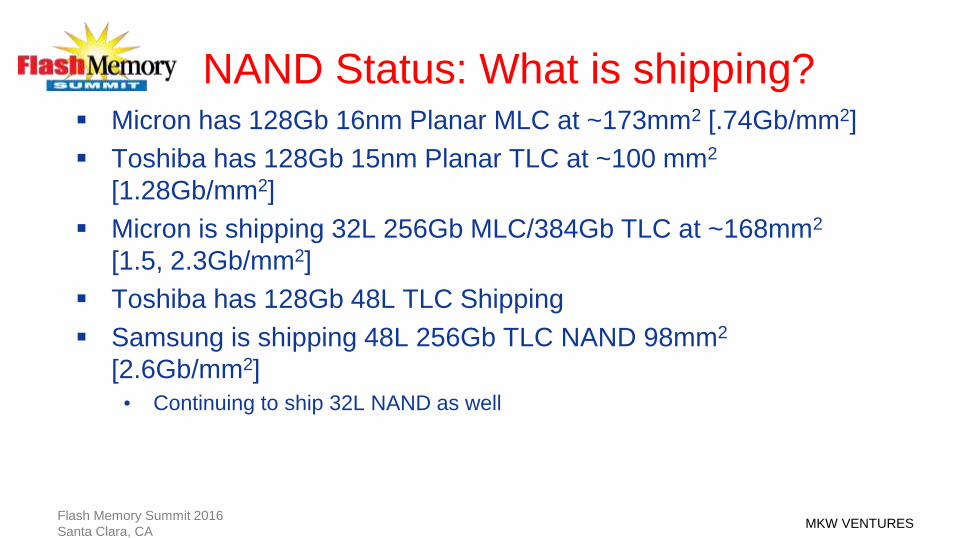
NAND Status: What is shipping? Micron has 128Gb 16nm Planar MLC at ~173mm2 [.74Gb/mm2]
Toshiba has 128Gb 15nm Planar TLC at ~100 mm2
[1.28Gb/mm2]
Micron is shipping 32L 256Gb MLC/384Gb TLC at ~168mm2
[1.5, 2.3Gb/mm2]
Toshiba has 128Gb 48L TLC Shipping
Samsung is shipping 48L 256Gb TLC NAND 98mm2
[2.6Gb/mm2]
• Continuing to ship 32L NAND as well
MKW VENTURESFlash Memory Summit 2016
Santa Clara, CA
What is Announced or Expected
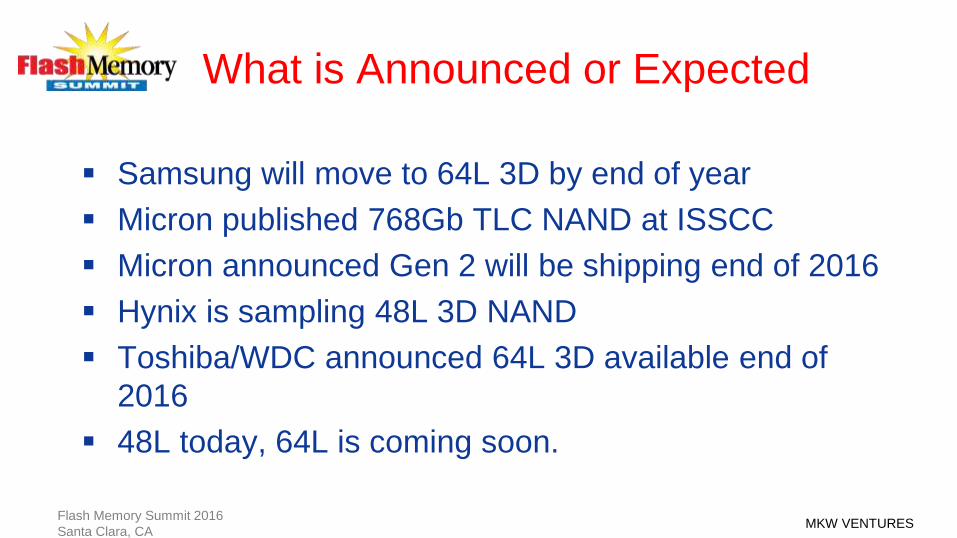
Samsung will move to 64L 3D by end of year
Micron published 768Gb TLC NAND at ISSCC
Micron announced Gen 2 will be shipping end of 2016
Hynix is sampling 48L 3D NAND
Toshiba/WDC announced 64L 3D available end of
2016
48L today, 64L is coming soon.
MKW VENTURESFlash Memory Summit 2016
Santa Clara, CA
3D Process Technologies
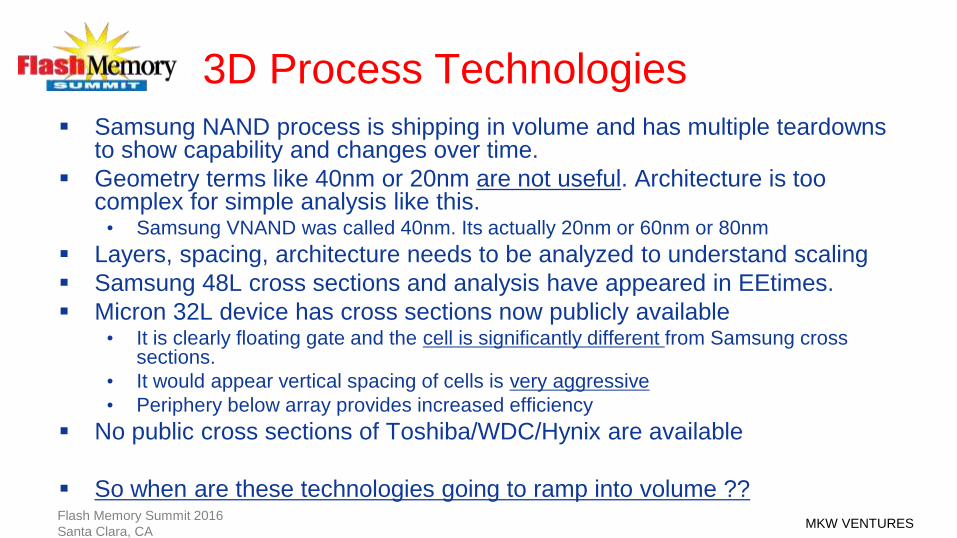
Samsung NAND process is shipping in volume and has multiple teardowns to show capability and changes over time.
Geometry terms like 40nm or 20nm are not useful. Architecture is too complex for simple analysis like this.• Samsung VNAND was called 40nm. Its actually 20nm or 60nm or 80nm
Layers, spacing, architecture needs to be analyzed to understand scaling
Samsung 48L cross sections and analysis have appeared in EEtimes.
Micron 32L device has cross sections now publicly available• It is clearly floating gate and the cell is significantly different from Samsung cross
sections.
• It would appear vertical spacing of cells is very aggressive
• Periphery below array provides increased efficiency
No public cross sections of Toshiba/WDC/Hynix are available
So when are these technologies going to ramp into volume ??

MKW VENTURESFlash Memory Summit 2016
Santa Clara, CA
FMS 2013: Return-On-Investment on
NAND Scaling
N +1
Generation
announced for
samples
6Q Later
N Generation
announced for
samples
N +1 Cost is
cheaper than N
Quarter after N Generation Samples
Un
it c
ost (n
orm
aliz
ed
)
Unit cost is very high
to start
• High wafer cost
• Low output/yield
• These improve
continuously over
time
We convert line fully
when new cost is
lower than old
CO
ST
TIME

MKW VENTURESFlash Memory Summit 2016
Santa Clara, CA
Example of 3D Layer Impact
• Average of all
densities and vendors
• Die size/yield is
determining factor
• ~60% Reduction in
cost in 3 years

MKW VENTURESFlash Memory Summit 2016
Santa Clara, CA
August 2016 Cost Summary ($/GB)Specific Announced or Reported Products
• Modeled cost
• Based on data for
each product
• Each product at
different maturity
2016 Planar MLC

MKW VENTURESFlash Memory Summit 2016
Santa Clara, CA
Impact of Cost on 3D Ramp
3D NAND allows NAND cost reduction to continue.
• 25%-35% per year is typical for NAND
• There will not be a non-linear cost reduction with 3D NAND
– 3D NAND will ramp over time, cost will improve continuously
TLC will potentially lead to significant cost reduction.
• TLC is a 25-30% cost reduction to MLC.
• Impact seen as SSDs, Cell phones convert from MLC to TLC
If more applications can use TLC with 3D NAND, Cost
benefits increase

MKW VENTURESFlash Memory Summit 2016
Santa Clara, CA
2D to 3D Transition
X %3D By
vendor

MKW VENTURESFlash Memory Summit 2016
Santa Clara, CA
3D NAND Bit% Over TimeTotal Shipped for Each Year
• 3D NAND Exceeds 50% in 2018
0%
20%
40%
60%
80%
100%
2016 2017 2018
3D NAND Bit%
3D NAND Planar

MKW VENTURES
SSD Market Penetration
• SSDs are growing but still
trail HDD
• Will there be a tipping
Point?
• Will it saturate?
• Gartner, IDC, DE, Internal
• Notebook includes 2:1s with SSD
• Does not include notebooks with eMMC
(No SSD/HDD)
Flash Memory Summit 2016
Santa Clara, CA
MKW VENTURESFlash Memory Summit 2016
Santa Clara, CA
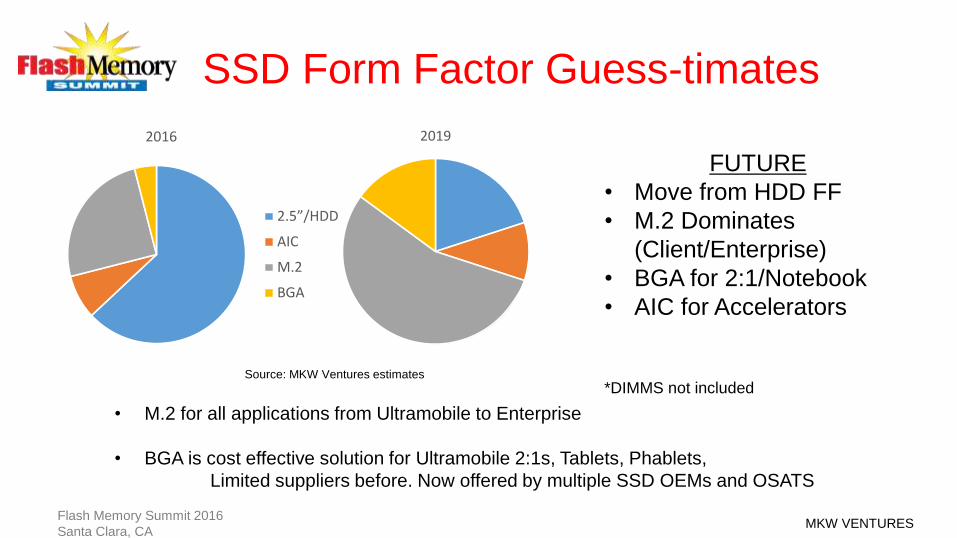
SSD Form Factor Guess-timates
FUTURE
• Move from HDD FF
• M.2 Dominates
(Client/Enterprise)
• BGA for 2:1/Notebook
• AIC for Accelerators
*DIMMS not included
• M.2 for all applications from Ultramobile to Enterprise
• BGA is cost effective solution for Ultramobile 2:1s, Tablets, Phablets,
Limited suppliers before. Now offered by multiple SSD OEMs and OSATS
Source: MKW Ventures estimates
20192016
2.5”/HDD
AIC
M.2
BGA

MKW VENTURES
3D NAND: Challenges
Flash Memory Summit 2016
Santa Clara, CA
MKW VENTURESFlash Memory Summit 2016
Santa Clara, CA
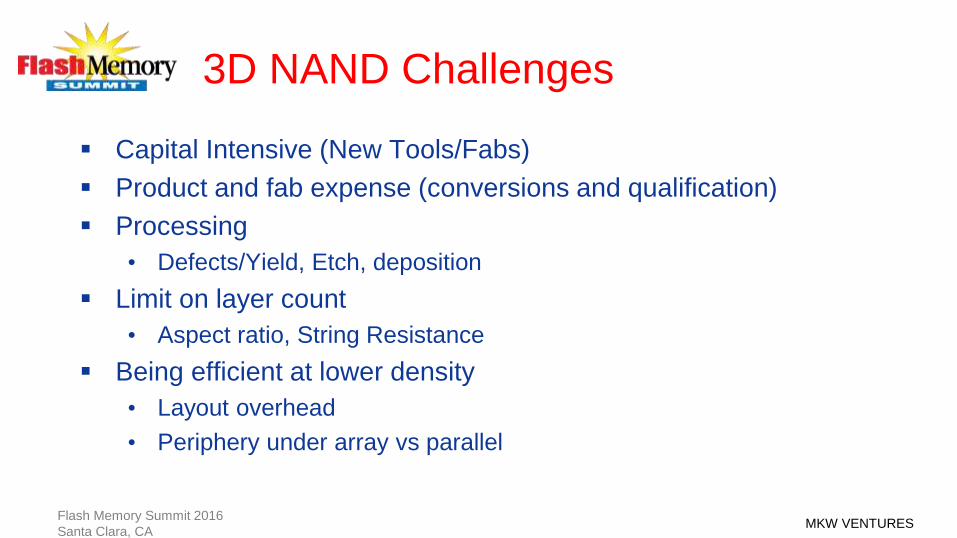
3D NAND Challenges
Capital Intensive (New Tools/Fabs)
Product and fab expense (conversions and qualification)
Processing
• Defects/Yield, Etch, deposition
Limit on layer count
• Aspect ratio, String Resistance
Being efficient at lower density
• Layout overhead
• Periphery under array vs parallel
MKW VENTURES
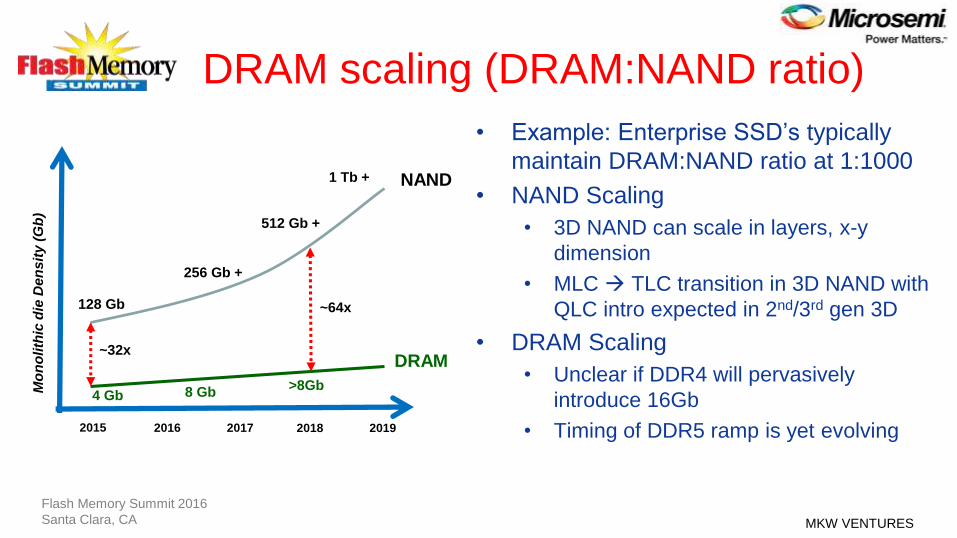
DRAM scaling (DRAM:NAND ratio)
• Example: Enterprise SSD’s typically
maintain DRAM:NAND ratio at 1:1000
• NAND Scaling
• 3D NAND can scale in layers, x-y
dimension
• MLC TLC transition in 3D NAND with
QLC intro expected in 2nd/3rd gen 3D
• DRAM Scaling
• Unclear if DDR4 will pervasively
introduce 16Gb
• Timing of DDR5 ramp is yet evolving 20192018201720162015
512 Gb +
256 Gb +
128 Gb
Mo
no
lith
ic d
ie D
en
sit
y (
Gb
)
>8Gb 8 Gb4 Gb
~32x
~64x
NAND
DRAM
1 Tb +
Flash Memory Summit 2016
Santa Clara, CA

MKW VENTURES
Next Generation Memories
SRAM
Wri
te/R
ea
d R
ati
o
1ns 10ns 100ns 100µs 1ms 10ms1µs 10µs
1
2
5
25SLC
DRAM
PCM
RRAM
MRAM
Size of bubble
represents cost/bit
(not to scale)ML
C
TL
C
HDD
NAND
Flash Memory Summit 2016
Santa Clara, CA

MKW VENTURESFlash Memory Summit 2016
Santa Clara, CA
New Memory Technologies
Latency Density Cost HVM ready
DRAM ***** *** *** *****
NAND * ***** ***** *****
MRAM ***** * * **
PCM (Micron) *** **** ** *
3DXP *** **** **** *
ReRAM *** **** **** *
3D XPoint Announced in July 2015: 128G ,“1000x faster,10x denser, 1000x better endurance”
Revenue projected to grow significantly starting end of 2016• Session 203A (RRAM), 301C (3d Xpoint)

MKW VENTURES
Key Messages
• Ramp of 3D NAND will be slower than most people think … • And uneven by vendor
• NAND roadmaps likely will bi-furcate (3D NAND best aligns with SSD’s)
• 3D NAND cost reduction will be linear and not a step function• TLC will dominate in 3D NAND near term (the Question of QLC ramp)
• Scaling (and complexity) in 3D NAND multiple ways: layers, x-y, stacking
• SSD/Storage architecture changes • Enterprise storage tiers are growing more sophisticated
• What role will Hyperscale play in SSD (and thus NAND) roadmaps?
• Client SSD tipping point: Runaway vs. Plateau
Flash Memory Summit 2016
Santa Clara, CA
MKW VENTURES
THANKS!
Come and visit us at booth #213
www.microsemi.com
Flash Memory Summit 2016
Santa Clara, CA