Embed Size (px)
Citation preview
Business Statistics Intorduction
Donglei Du(dduunbedu)
Faculty of Business Administration University of New Brunswick NB Canada FrederictonE3B 9Y2
September 23 2015
Donglei Du (UNB) AlgoTrading September 23 2015 1 45
Table of contents
1 Why Statistics2 What is Statistics3 Two methodologies in Science4 Variables and types5 Sources of Statistical Data
6 Software for StatisticalAnalysis
7 Materials to learn R8 A brief tutorial of R with a
case study
Donglei Du (UNB) AlgoTrading September 23 2015 2 45
Section 1
Why Statistics
Donglei Du (UNB) AlgoTrading September 23 2015 3 45
Figure Source httpmechanicalforexcom201505building-algorithmic-trading-systems-for-the-forex-market-part-2-where-to-lookhtml
Donglei Du (UNB) AlgoTrading September 23 2015 4 45
Why Statistics
This is a required course for your degreeIt is a prerequisite for many other topicsData everywhere particularly in this big data eraSampling vs censusingDecision Making Statistics will help you make importantdecision
Donglei Du (UNB) AlgoTrading September 23 2015 5 45
Data everywhere Example 1 productivity andstandard of living of a nation
wages
Labor productivity
JapanUS
UK
CanadaFrance
GermanyItaly
IndiaIndonesia
Bulgaria
EgyptPakistan
80
8
08
2 20 200
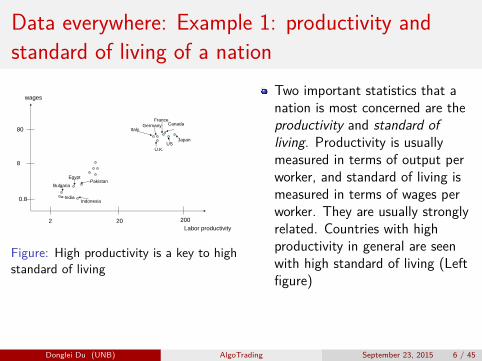
Figure High productivity is a key to highstandard of living
Two important statistics that anation is most concerned are theproductivity and standard ofliving Productivity is usuallymeasured in terms of output perworker and standard of living ismeasured in terms of wages perworker They are usually stronglyrelated Countries with highproductivity in general are seenwith high standard of living (Leftfigure)
Donglei Du (UNB) AlgoTrading September 23 2015 6 45
Data everywhere Example 2 Consumer PriceIndex (CPI) in Canada
The Consumer Price Index measures the rate of price change forgoods and services bought by consumers in a country
It is a statistic constructed using the prices of a sample ofrepresentative items whose prices are collected periodicallyFor instance the CPI All-items for Canada for the month ofJuly 2013 was 1231 (2000=100) meaning that consumerprices were 231 higher in July 2013 than in 2000[hyphens]httpwwwstatcangccatables-tableauxsum-soml01cst01cpis01a-enghtm
Donglei Du (UNB) AlgoTrading September 23 2015 7 45
Data everywhere Example 2 Consumer PriceIndex (CPI) in Canada
The CPI directly or indirectly affects nearly all CanadiansOld Age Security pensions Canada Pension Plan payments andother forms of social and welfare payments are adjustedperiodically to take account of changes in the CPIRental agreements spousal and child support payments andother forms of contractual and price-setting arrangements arefrequently tied in some manner to movements in the CPICost-of-living adjustment (COLA) clauses link wage increases tomovements in the CPI Labour contracts governing the wages ofmany Canadian workers include COLA clauses
Donglei Du (UNB) AlgoTrading September 23 2015 8 45
Sampling vs censusing
Costs of surveying the entire population may be too large orprohibitive
eg Television networks monitor the popularity of theirprograms
Destruction of elements during investigationeg Manufacturers estimate the average lifetime of light bulbsdoctors take a blood sample to check for disease
Unknown futureeg stock index temperature tomorrow
Donglei Du (UNB) AlgoTrading September 23 2015 9 45
Decision Making
How do large retailers (like COSTO Walmart) fill their storeshelves so as to meet the customer demand while minimizingtheir operating costHow do doctors in the hospital make diagnoseHow do political leaders run their campaignHow do Investment Banks in Wall Street (or Bay Street) decidewhich stock (or stocks) to investHow do insurance companies decide the premium for a particularclientHow do car dealers decide how many car models of each brandto be kept in their locations
Donglei Du (UNB) AlgoTrading September 23 2015 10 45
Section 2
What is Statistics
Donglei Du (UNB) AlgoTrading September 23 2015 11 45
What is Statistics
It is the science and artof collecting organizing and representing data in such a waythat the characteristics and patterns of the data can be easilycaptured (Descriptive Statistics)also of estimating attributes and drawing inference from asample about the entire population (Inferential Statistics)
Donglei Du (UNB) AlgoTrading September 23 2015 12 45
Examples descriptive or inferential
In 1995 45 of Canadian households owned a computer and25 were connected to internet On average Canadians spend13 hours per day commuting and 15 hours per day with theirchildren
descriptiveThe accounting department of a firm will select a sample ofinvoices to check for accuracy of all the invoices of the company
inferential
Donglei Du (UNB) AlgoTrading September 23 2015 13 45
Terminologies
Population vs samplePopulation a set of all elements of interests in an investigationSample a subset of all elements of a population
Parameter vs StatisticParameter a measurable characteristic of a Population (such asaverage extreme variation proportion)Statistic a measurable characteristic of a Sample
Donglei Du (UNB) AlgoTrading September 23 2015 14 45
Section 3
Two methodologies in Science
Donglei Du (UNB) AlgoTrading September 23 2015 15 45
Two methodologies in Science
Deductive general minusrarr particularMathematics Axioms + logic
Inductive particular minusrarr generalMost natural sciences like physics chemistry and Statisticsaka the method of Experimentation
Donglei Du (UNB) AlgoTrading September 23 2015 16 45
The method of Experimentation
1 Define the experimental goal or a working hypothesis2 Design an experiment3 Collect and represent data4 Estimate the valuesrelations5 Draw inferences6 Predict and prepare policy analysis
Donglei Du (UNB) AlgoTrading September 23 2015 17 45
Section 4
Variables and types
Donglei Du (UNB) AlgoTrading September 23 2015 18 45
Variable
1 A variable is a characteristicattribute of a populationsamplethat is interest in a particular investigation and the value of thevariable can vary from one entity to another
A personrsquos gender is a variable which could have the value ofMale for one person and Female for anotherThe rank of faculty members in Business Administration is avariable which could have the value of Full Professor for oneperson Associate Professor for another and lsquoAssistantProfessorrsquo for yet anotherTemperatures in this classroom is a variable which could havethe value of 20 or 100Annual salary of NBA players (or hockey players in Canada)which could have the value of 10M or 5M
Donglei Du (UNB) AlgoTrading September 23 2015 19 45
Types of Data Qualitative vs QuantitativeVariables
Qualitative (aka categorical)Qualitative variables take on values that are names or labels
Examples gender country names colorQuantitative (aka numeric)
Quantitative variables are numericExamples number of bedrooms in houses number of minutesto the end of this class distance between two cities
Donglei Du (UNB) AlgoTrading September 23 2015 20 45
Types of Data Discrete vs Continuous Variables
Quantitative variables can be further classified as discrete orcontinuous
Continuous Variable a variable can take on any value within arange
Examples the number of minutes to the end of this classdistance between two cities pressure in a tire weight of a porkchop height of students in a class
Discrete variable a variable can take only certain value (finiteor countably infinite) within a range
Examples number of bedrooms in houses
Donglei Du (UNB) AlgoTrading September 23 2015 21 45
Datavariable representation
Language such as English French Chinese This is the naturaland direct way
Such as All the people in CanadarsquoNumbers This is the mathematical and indirect way
such as data representation in computer binary numbers 01
Donglei Du (UNB) AlgoTrading September 23 2015 22 45
Level of measurement
Suppose now we represent all data variable using numbers thenLevel of measurement (aka scales of measure) are the differentways numbers can be usedThere are four levels of measurements
NominalOrdinalIntervalRatio
However representing variables as numbers does not give youthe license to perform the regular logicalarithmetic operationsall the time (such as comparison addition subtractionmultiplication and division etc) or to infer anything about themagnitude or quantitative difference between the numbers
Donglei Du (UNB) AlgoTrading September 23 2015 23 45
Nominal level
A variable is at the nominal level if none of the five operations(namely comparison addition subtraction multiplication anddivision) is meaningfulAt the nominal level of measurement numbers are assigned to aset of mutually exclusive and exhaustive categories for thepurpose of naming labeling or classifying the observations butno arithmetic operation is meaningfulwhere
Mutually exclusive any individual object is included in ONLYONE CATEGORYExhaustive any individual object MUST APPEAR in one of thecategories
Donglei Du (UNB) AlgoTrading September 23 2015 24 45
Examples
ExamplesBarcodesSocial insurance numbers (SIN)Student IDsPhones numbers
The fact that the barcode for one product is higher than that foranother or that your SIN is higher than mine tells us nothingIn surveys we often use arbitrary numbers to code variables suchas religion ethnicity major in college or gender
Donglei Du (UNB) AlgoTrading September 23 2015 25 45
Ordinal level
A variable is at the ordinal level if only comparison is meaningful
Donglei Du (UNB) AlgoTrading September 23 2015 26 45
Examples
ExamplesRank of faculty membersMaclean ranking of Canadian colleges[hyphens]httponcampusmacleanscaeducation201211012013-comprehensiveUS News Ranking of USworld collegeshttpwwwusnewscomrankings
The differences between data values cannot be determined or aremeaningless
For instance first class is better than economy and thatbusiness is in between Just how much better first class iscompared to business and business compared to economy variesfrom airline to airline and even from flight to flight
Donglei Du (UNB) AlgoTrading September 23 2015 27 45
Interval
A variable is at the interval level if only division is meaninglessReason Interval data have meaningful intervals betweenmeasurements but there is no true starting point (zero)
Donglei Du (UNB) AlgoTrading September 23 2015 28 45
Examples
ExamplesTemperatures in Celsius and Fahrenheit are interval data
Certainly order is important and intervals are meaningfulHowever a 20 C dashboard is not twice as hot as the 10 CoutsideA conversion formula between Celsius and Fahrenheit
F =95
C + 32
So 10 C = 50 F and 20 C = 68 F Obviously
20 C10 C
6= 68 F50 F
Calender year arbitrary 0 year the birth of JesusIQ score non-arbitrary 0 score
Donglei Du (UNB) AlgoTrading September 23 2015 29 45
Ratio
A variable is at the ratio level if all logicalarithmetic operationsare meaningfulReason Ratios between measurements as well as intervals aremeaningful because there is a non-arbitrary zero point
Donglei Du (UNB) AlgoTrading September 23 2015 30 45
Examples
ExamplesIncomeDistanceHeight
Donglei Du (UNB) AlgoTrading September 23 2015 31 45
Summary of level of measurement
comparison addition subtraction multiplication divisionnominal x x x x xordinal
radicx x x x
intervalradic radic radic
x xratio
radic radic radic radic radic
Donglei Du (UNB) AlgoTrading September 23 2015 32 45
A general method for identifying the level ofmeasurement
Ask yourself the following three questionsIs order meaningful
No then the data is nominalIs difference meaningful
No then the data is ordinalIs zero meaningful
No then the data is intervalYes then the data is ratio
Donglei Du (UNB) AlgoTrading September 23 2015 33 45
Section 5
Sources of Statistical Data
Donglei Du (UNB) AlgoTrading September 23 2015 34 45
Sources of Statistical Data
Statistics Canada httpwwwstatcancaTwitter wwwtwittercomFacebook wwwfacebookcom
Donglei Du (UNB) AlgoTrading September 23 2015 35 45
Section 6
Software for Statistical Analysis
Donglei Du (UNB) AlgoTrading September 23 2015 36 45
Software for Statistical Analysis
Many but the most popular ones areEXCEL (proprietary)SAS (proprietary)R (open-source)
Donglei Du (UNB) AlgoTrading September 23 2015 37 45
Section 7
Materials to learn R
Donglei Du (UNB) AlgoTrading September 23 2015 38 45
Some online resources to learn R I
R in a nutshellAn introduction to RR for BeginnersTry RQuick-RThe art of R Programmingwwwcourseraorg offers some nice courses on R
Such as this one
Donglei Du (UNB) AlgoTrading September 23 2015 39 45
Section 8
A brief tutorial of R with a case study
Donglei Du (UNB) AlgoTrading September 23 2015 40 45
R for Statistical Analysis
We will retrieve some stock data via package quantmod fromYahoo Finance
Donglei Du (UNB) AlgoTrading September 23 2015 41 45
Load package
rm(list=ls())require(quantmod)
Donglei Du (UNB) AlgoTrading September 23 2015 42 45
Parameters
startDate lt- 1957-03-04 start of dataendDate lt- 2014-01-06 end of dataSyssetenv(TZ = UTC)
Donglei Du (UNB) AlgoTrading September 23 2015 43 45
Retrieve data
symbolslt-c(^GSPC)symbolslt-c(AAPLFB YHOO)if(fileexists(dataGSPCRData))
load(dataGSPCRData)GSPC_csv lt- readcsv(dataGSPCcsv)
else getSymbols(symbols
src = yahoo OHLC formatfrom = startDateto = endDateindexclass=c(POSIXtPOSIXct) Recommended time series indexwarnings = FALSEadjust=TRUE)
dircreate(filepath(data) showWarnings = TRUE)save(list=GSPC file=dataGSPCRData)writecsv(GSPCfile=dataGSPCcsv)
Donglei Du (UNB) AlgoTrading September 23 2015 44 45
Plot
options(width=60)chartSeries(GSPC[20042014])addMACD()addBBands()
Donglei Du (UNB) AlgoTrading September 23 2015 45 45
Table of contents
1 Why Statistics2 What is Statistics3 Two methodologies in Science4 Variables and types5 Sources of Statistical Data
6 Software for StatisticalAnalysis
7 Materials to learn R8 A brief tutorial of R with a
case study
Donglei Du (UNB) AlgoTrading September 23 2015 2 45
Section 1
Why Statistics
Donglei Du (UNB) AlgoTrading September 23 2015 3 45
Figure Source httpmechanicalforexcom201505building-algorithmic-trading-systems-for-the-forex-market-part-2-where-to-lookhtml
Donglei Du (UNB) AlgoTrading September 23 2015 4 45
Why Statistics
This is a required course for your degreeIt is a prerequisite for many other topicsData everywhere particularly in this big data eraSampling vs censusingDecision Making Statistics will help you make importantdecision
Donglei Du (UNB) AlgoTrading September 23 2015 5 45
Data everywhere Example 1 productivity andstandard of living of a nation
wages
Labor productivity
JapanUS
UK
CanadaFrance
GermanyItaly
IndiaIndonesia
Bulgaria
EgyptPakistan
80
8
08
2 20 200
Figure High productivity is a key to highstandard of living
Two important statistics that anation is most concerned are theproductivity and standard ofliving Productivity is usuallymeasured in terms of output perworker and standard of living ismeasured in terms of wages perworker They are usually stronglyrelated Countries with highproductivity in general are seenwith high standard of living (Leftfigure)
Donglei Du (UNB) AlgoTrading September 23 2015 6 45
Data everywhere Example 2 Consumer PriceIndex (CPI) in Canada
The Consumer Price Index measures the rate of price change forgoods and services bought by consumers in a country
It is a statistic constructed using the prices of a sample ofrepresentative items whose prices are collected periodicallyFor instance the CPI All-items for Canada for the month ofJuly 2013 was 1231 (2000=100) meaning that consumerprices were 231 higher in July 2013 than in 2000[hyphens]httpwwwstatcangccatables-tableauxsum-soml01cst01cpis01a-enghtm
Donglei Du (UNB) AlgoTrading September 23 2015 7 45
Data everywhere Example 2 Consumer PriceIndex (CPI) in Canada
The CPI directly or indirectly affects nearly all CanadiansOld Age Security pensions Canada Pension Plan payments andother forms of social and welfare payments are adjustedperiodically to take account of changes in the CPIRental agreements spousal and child support payments andother forms of contractual and price-setting arrangements arefrequently tied in some manner to movements in the CPICost-of-living adjustment (COLA) clauses link wage increases tomovements in the CPI Labour contracts governing the wages ofmany Canadian workers include COLA clauses
Donglei Du (UNB) AlgoTrading September 23 2015 8 45
Sampling vs censusing
Costs of surveying the entire population may be too large orprohibitive
eg Television networks monitor the popularity of theirprograms
Destruction of elements during investigationeg Manufacturers estimate the average lifetime of light bulbsdoctors take a blood sample to check for disease
Unknown futureeg stock index temperature tomorrow
Donglei Du (UNB) AlgoTrading September 23 2015 9 45
Decision Making
How do large retailers (like COSTO Walmart) fill their storeshelves so as to meet the customer demand while minimizingtheir operating costHow do doctors in the hospital make diagnoseHow do political leaders run their campaignHow do Investment Banks in Wall Street (or Bay Street) decidewhich stock (or stocks) to investHow do insurance companies decide the premium for a particularclientHow do car dealers decide how many car models of each brandto be kept in their locations
Donglei Du (UNB) AlgoTrading September 23 2015 10 45
Section 2
What is Statistics
Donglei Du (UNB) AlgoTrading September 23 2015 11 45
What is Statistics
It is the science and artof collecting organizing and representing data in such a waythat the characteristics and patterns of the data can be easilycaptured (Descriptive Statistics)also of estimating attributes and drawing inference from asample about the entire population (Inferential Statistics)
Donglei Du (UNB) AlgoTrading September 23 2015 12 45
Examples descriptive or inferential
In 1995 45 of Canadian households owned a computer and25 were connected to internet On average Canadians spend13 hours per day commuting and 15 hours per day with theirchildren
descriptiveThe accounting department of a firm will select a sample ofinvoices to check for accuracy of all the invoices of the company
inferential
Donglei Du (UNB) AlgoTrading September 23 2015 13 45
Terminologies
Population vs samplePopulation a set of all elements of interests in an investigationSample a subset of all elements of a population
Parameter vs StatisticParameter a measurable characteristic of a Population (such asaverage extreme variation proportion)Statistic a measurable characteristic of a Sample
Donglei Du (UNB) AlgoTrading September 23 2015 14 45
Section 3
Two methodologies in Science
Donglei Du (UNB) AlgoTrading September 23 2015 15 45
Two methodologies in Science
Deductive general minusrarr particularMathematics Axioms + logic
Inductive particular minusrarr generalMost natural sciences like physics chemistry and Statisticsaka the method of Experimentation
Donglei Du (UNB) AlgoTrading September 23 2015 16 45
The method of Experimentation
1 Define the experimental goal or a working hypothesis2 Design an experiment3 Collect and represent data4 Estimate the valuesrelations5 Draw inferences6 Predict and prepare policy analysis
Donglei Du (UNB) AlgoTrading September 23 2015 17 45
Section 4
Variables and types
Donglei Du (UNB) AlgoTrading September 23 2015 18 45
Variable
1 A variable is a characteristicattribute of a populationsamplethat is interest in a particular investigation and the value of thevariable can vary from one entity to another
A personrsquos gender is a variable which could have the value ofMale for one person and Female for anotherThe rank of faculty members in Business Administration is avariable which could have the value of Full Professor for oneperson Associate Professor for another and lsquoAssistantProfessorrsquo for yet anotherTemperatures in this classroom is a variable which could havethe value of 20 or 100Annual salary of NBA players (or hockey players in Canada)which could have the value of 10M or 5M
Donglei Du (UNB) AlgoTrading September 23 2015 19 45
Types of Data Qualitative vs QuantitativeVariables
Qualitative (aka categorical)Qualitative variables take on values that are names or labels
Examples gender country names colorQuantitative (aka numeric)
Quantitative variables are numericExamples number of bedrooms in houses number of minutesto the end of this class distance between two cities
Donglei Du (UNB) AlgoTrading September 23 2015 20 45
Types of Data Discrete vs Continuous Variables
Quantitative variables can be further classified as discrete orcontinuous
Continuous Variable a variable can take on any value within arange
Examples the number of minutes to the end of this classdistance between two cities pressure in a tire weight of a porkchop height of students in a class
Discrete variable a variable can take only certain value (finiteor countably infinite) within a range
Examples number of bedrooms in houses
Donglei Du (UNB) AlgoTrading September 23 2015 21 45
Datavariable representation
Language such as English French Chinese This is the naturaland direct way
Such as All the people in CanadarsquoNumbers This is the mathematical and indirect way
such as data representation in computer binary numbers 01
Donglei Du (UNB) AlgoTrading September 23 2015 22 45
Level of measurement
Suppose now we represent all data variable using numbers thenLevel of measurement (aka scales of measure) are the differentways numbers can be usedThere are four levels of measurements
NominalOrdinalIntervalRatio
However representing variables as numbers does not give youthe license to perform the regular logicalarithmetic operationsall the time (such as comparison addition subtractionmultiplication and division etc) or to infer anything about themagnitude or quantitative difference between the numbers
Donglei Du (UNB) AlgoTrading September 23 2015 23 45
Nominal level
A variable is at the nominal level if none of the five operations(namely comparison addition subtraction multiplication anddivision) is meaningfulAt the nominal level of measurement numbers are assigned to aset of mutually exclusive and exhaustive categories for thepurpose of naming labeling or classifying the observations butno arithmetic operation is meaningfulwhere
Mutually exclusive any individual object is included in ONLYONE CATEGORYExhaustive any individual object MUST APPEAR in one of thecategories
Donglei Du (UNB) AlgoTrading September 23 2015 24 45
Examples
ExamplesBarcodesSocial insurance numbers (SIN)Student IDsPhones numbers
The fact that the barcode for one product is higher than that foranother or that your SIN is higher than mine tells us nothingIn surveys we often use arbitrary numbers to code variables suchas religion ethnicity major in college or gender
Donglei Du (UNB) AlgoTrading September 23 2015 25 45
Ordinal level
A variable is at the ordinal level if only comparison is meaningful
Donglei Du (UNB) AlgoTrading September 23 2015 26 45
Examples
ExamplesRank of faculty membersMaclean ranking of Canadian colleges[hyphens]httponcampusmacleanscaeducation201211012013-comprehensiveUS News Ranking of USworld collegeshttpwwwusnewscomrankings
The differences between data values cannot be determined or aremeaningless
For instance first class is better than economy and thatbusiness is in between Just how much better first class iscompared to business and business compared to economy variesfrom airline to airline and even from flight to flight
Donglei Du (UNB) AlgoTrading September 23 2015 27 45
Interval
A variable is at the interval level if only division is meaninglessReason Interval data have meaningful intervals betweenmeasurements but there is no true starting point (zero)
Donglei Du (UNB) AlgoTrading September 23 2015 28 45
Examples
ExamplesTemperatures in Celsius and Fahrenheit are interval data
Certainly order is important and intervals are meaningfulHowever a 20 C dashboard is not twice as hot as the 10 CoutsideA conversion formula between Celsius and Fahrenheit
F =95
C + 32
So 10 C = 50 F and 20 C = 68 F Obviously
20 C10 C
6= 68 F50 F
Calender year arbitrary 0 year the birth of JesusIQ score non-arbitrary 0 score
Donglei Du (UNB) AlgoTrading September 23 2015 29 45
Ratio
A variable is at the ratio level if all logicalarithmetic operationsare meaningfulReason Ratios between measurements as well as intervals aremeaningful because there is a non-arbitrary zero point
Donglei Du (UNB) AlgoTrading September 23 2015 30 45
Examples
ExamplesIncomeDistanceHeight
Donglei Du (UNB) AlgoTrading September 23 2015 31 45
Summary of level of measurement
comparison addition subtraction multiplication divisionnominal x x x x xordinal
radicx x x x
intervalradic radic radic
x xratio
radic radic radic radic radic
Donglei Du (UNB) AlgoTrading September 23 2015 32 45
A general method for identifying the level ofmeasurement
Ask yourself the following three questionsIs order meaningful
No then the data is nominalIs difference meaningful
No then the data is ordinalIs zero meaningful
No then the data is intervalYes then the data is ratio
Donglei Du (UNB) AlgoTrading September 23 2015 33 45
Section 5
Sources of Statistical Data
Donglei Du (UNB) AlgoTrading September 23 2015 34 45
Sources of Statistical Data
Statistics Canada httpwwwstatcancaTwitter wwwtwittercomFacebook wwwfacebookcom
Donglei Du (UNB) AlgoTrading September 23 2015 35 45
Section 6
Software for Statistical Analysis
Donglei Du (UNB) AlgoTrading September 23 2015 36 45
Software for Statistical Analysis
Many but the most popular ones areEXCEL (proprietary)SAS (proprietary)R (open-source)
Donglei Du (UNB) AlgoTrading September 23 2015 37 45
Section 7
Materials to learn R
Donglei Du (UNB) AlgoTrading September 23 2015 38 45
Some online resources to learn R I
R in a nutshellAn introduction to RR for BeginnersTry RQuick-RThe art of R Programmingwwwcourseraorg offers some nice courses on R
Such as this one
Donglei Du (UNB) AlgoTrading September 23 2015 39 45
Section 8
A brief tutorial of R with a case study
Donglei Du (UNB) AlgoTrading September 23 2015 40 45
R for Statistical Analysis
We will retrieve some stock data via package quantmod fromYahoo Finance
Donglei Du (UNB) AlgoTrading September 23 2015 41 45
Load package
rm(list=ls())require(quantmod)
Donglei Du (UNB) AlgoTrading September 23 2015 42 45
Parameters
startDate lt- 1957-03-04 start of dataendDate lt- 2014-01-06 end of dataSyssetenv(TZ = UTC)
Donglei Du (UNB) AlgoTrading September 23 2015 43 45
Retrieve data
symbolslt-c(^GSPC)symbolslt-c(AAPLFB YHOO)if(fileexists(dataGSPCRData))
load(dataGSPCRData)GSPC_csv lt- readcsv(dataGSPCcsv)
else getSymbols(symbols
src = yahoo OHLC formatfrom = startDateto = endDateindexclass=c(POSIXtPOSIXct) Recommended time series indexwarnings = FALSEadjust=TRUE)
dircreate(filepath(data) showWarnings = TRUE)save(list=GSPC file=dataGSPCRData)writecsv(GSPCfile=dataGSPCcsv)
Donglei Du (UNB) AlgoTrading September 23 2015 44 45
Plot
options(width=60)chartSeries(GSPC[20042014])addMACD()addBBands()
Donglei Du (UNB) AlgoTrading September 23 2015 45 45
Data everywhere Example 2 Consumer PriceIndex (CPI) in Canada
The CPI directly or indirectly affects nearly all CanadiansOld Age Security pensions Canada Pension Plan payments andother forms of social and welfare payments are adjustedperiodically to take account of changes in the CPIRental agreements spousal and child support payments andother forms of contractual and price-setting arrangements arefrequently tied in some manner to movements in the CPICost-of-living adjustment (COLA) clauses link wage increases tomovements in the CPI Labour contracts governing the wages ofmany Canadian workers include COLA clauses
Donglei Du (UNB) AlgoTrading September 23 2015 8 45
Sampling vs censusing
Costs of surveying the entire population may be too large orprohibitive
eg Television networks monitor the popularity of theirprograms
Destruction of elements during investigationeg Manufacturers estimate the average lifetime of light bulbsdoctors take a blood sample to check for disease
Unknown futureeg stock index temperature tomorrow
Donglei Du (UNB) AlgoTrading September 23 2015 9 45
Decision Making
How do large retailers (like COSTO Walmart) fill their storeshelves so as to meet the customer demand while minimizingtheir operating costHow do doctors in the hospital make diagnoseHow do political leaders run their campaignHow do Investment Banks in Wall Street (or Bay Street) decidewhich stock (or stocks) to investHow do insurance companies decide the premium for a particularclientHow do car dealers decide how many car models of each brandto be kept in their locations
Donglei Du (UNB) AlgoTrading September 23 2015 10 45
Section 2
What is Statistics
Donglei Du (UNB) AlgoTrading September 23 2015 11 45
What is Statistics
It is the science and artof collecting organizing and representing data in such a waythat the characteristics and patterns of the data can be easilycaptured (Descriptive Statistics)also of estimating attributes and drawing inference from asample about the entire population (Inferential Statistics)
Donglei Du (UNB) AlgoTrading September 23 2015 12 45
Examples descriptive or inferential
In 1995 45 of Canadian households owned a computer and25 were connected to internet On average Canadians spend13 hours per day commuting and 15 hours per day with theirchildren
descriptiveThe accounting department of a firm will select a sample ofinvoices to check for accuracy of all the invoices of the company
inferential
Donglei Du (UNB) AlgoTrading September 23 2015 13 45
Terminologies
Population vs samplePopulation a set of all elements of interests in an investigationSample a subset of all elements of a population
Parameter vs StatisticParameter a measurable characteristic of a Population (such asaverage extreme variation proportion)Statistic a measurable characteristic of a Sample
Donglei Du (UNB) AlgoTrading September 23 2015 14 45
Section 3
Two methodologies in Science
Donglei Du (UNB) AlgoTrading September 23 2015 15 45
Two methodologies in Science
Deductive general minusrarr particularMathematics Axioms + logic
Inductive particular minusrarr generalMost natural sciences like physics chemistry and Statisticsaka the method of Experimentation
Donglei Du (UNB) AlgoTrading September 23 2015 16 45
The method of Experimentation
1 Define the experimental goal or a working hypothesis2 Design an experiment3 Collect and represent data4 Estimate the valuesrelations5 Draw inferences6 Predict and prepare policy analysis
Donglei Du (UNB) AlgoTrading September 23 2015 17 45
Section 4
Variables and types
Donglei Du (UNB) AlgoTrading September 23 2015 18 45
Variable
1 A variable is a characteristicattribute of a populationsamplethat is interest in a particular investigation and the value of thevariable can vary from one entity to another
A personrsquos gender is a variable which could have the value ofMale for one person and Female for anotherThe rank of faculty members in Business Administration is avariable which could have the value of Full Professor for oneperson Associate Professor for another and lsquoAssistantProfessorrsquo for yet anotherTemperatures in this classroom is a variable which could havethe value of 20 or 100Annual salary of NBA players (or hockey players in Canada)which could have the value of 10M or 5M
Donglei Du (UNB) AlgoTrading September 23 2015 19 45
Types of Data Qualitative vs QuantitativeVariables
Qualitative (aka categorical)Qualitative variables take on values that are names or labels
Examples gender country names colorQuantitative (aka numeric)
Quantitative variables are numericExamples number of bedrooms in houses number of minutesto the end of this class distance between two cities
Donglei Du (UNB) AlgoTrading September 23 2015 20 45
Types of Data Discrete vs Continuous Variables
Quantitative variables can be further classified as discrete orcontinuous
Continuous Variable a variable can take on any value within arange
Examples the number of minutes to the end of this classdistance between two cities pressure in a tire weight of a porkchop height of students in a class
Discrete variable a variable can take only certain value (finiteor countably infinite) within a range
Examples number of bedrooms in houses
Donglei Du (UNB) AlgoTrading September 23 2015 21 45
Datavariable representation
Language such as English French Chinese This is the naturaland direct way
Such as All the people in CanadarsquoNumbers This is the mathematical and indirect way
such as data representation in computer binary numbers 01
Donglei Du (UNB) AlgoTrading September 23 2015 22 45
Level of measurement
Suppose now we represent all data variable using numbers thenLevel of measurement (aka scales of measure) are the differentways numbers can be usedThere are four levels of measurements
NominalOrdinalIntervalRatio
However representing variables as numbers does not give youthe license to perform the regular logicalarithmetic operationsall the time (such as comparison addition subtractionmultiplication and division etc) or to infer anything about themagnitude or quantitative difference between the numbers
Donglei Du (UNB) AlgoTrading September 23 2015 23 45
Nominal level
A variable is at the nominal level if none of the five operations(namely comparison addition subtraction multiplication anddivision) is meaningfulAt the nominal level of measurement numbers are assigned to aset of mutually exclusive and exhaustive categories for thepurpose of naming labeling or classifying the observations butno arithmetic operation is meaningfulwhere
Mutually exclusive any individual object is included in ONLYONE CATEGORYExhaustive any individual object MUST APPEAR in one of thecategories
Donglei Du (UNB) AlgoTrading September 23 2015 24 45
Examples
ExamplesBarcodesSocial insurance numbers (SIN)Student IDsPhones numbers
The fact that the barcode for one product is higher than that foranother or that your SIN is higher than mine tells us nothingIn surveys we often use arbitrary numbers to code variables suchas religion ethnicity major in college or gender
Donglei Du (UNB) AlgoTrading September 23 2015 25 45
Ordinal level
A variable is at the ordinal level if only comparison is meaningful
Donglei Du (UNB) AlgoTrading September 23 2015 26 45
Examples
ExamplesRank of faculty membersMaclean ranking of Canadian colleges[hyphens]httponcampusmacleanscaeducation201211012013-comprehensiveUS News Ranking of USworld collegeshttpwwwusnewscomrankings
The differences between data values cannot be determined or aremeaningless
For instance first class is better than economy and thatbusiness is in between Just how much better first class iscompared to business and business compared to economy variesfrom airline to airline and even from flight to flight
Donglei Du (UNB) AlgoTrading September 23 2015 27 45
Interval
A variable is at the interval level if only division is meaninglessReason Interval data have meaningful intervals betweenmeasurements but there is no true starting point (zero)
Donglei Du (UNB) AlgoTrading September 23 2015 28 45
Examples
ExamplesTemperatures in Celsius and Fahrenheit are interval data
Certainly order is important and intervals are meaningfulHowever a 20 C dashboard is not twice as hot as the 10 CoutsideA conversion formula between Celsius and Fahrenheit
F =95
C + 32
So 10 C = 50 F and 20 C = 68 F Obviously
20 C10 C
6= 68 F50 F
Calender year arbitrary 0 year the birth of JesusIQ score non-arbitrary 0 score
Donglei Du (UNB) AlgoTrading September 23 2015 29 45
Ratio
A variable is at the ratio level if all logicalarithmetic operationsare meaningfulReason Ratios between measurements as well as intervals aremeaningful because there is a non-arbitrary zero point
Donglei Du (UNB) AlgoTrading September 23 2015 30 45
Examples
ExamplesIncomeDistanceHeight
Donglei Du (UNB) AlgoTrading September 23 2015 31 45
Summary of level of measurement
comparison addition subtraction multiplication divisionnominal x x x x xordinal
radicx x x x
intervalradic radic radic
x xratio
radic radic radic radic radic
Donglei Du (UNB) AlgoTrading September 23 2015 32 45
A general method for identifying the level ofmeasurement
Ask yourself the following three questionsIs order meaningful
No then the data is nominalIs difference meaningful
No then the data is ordinalIs zero meaningful
No then the data is intervalYes then the data is ratio
Donglei Du (UNB) AlgoTrading September 23 2015 33 45
Section 5
Sources of Statistical Data
Donglei Du (UNB) AlgoTrading September 23 2015 34 45
Sources of Statistical Data
Statistics Canada httpwwwstatcancaTwitter wwwtwittercomFacebook wwwfacebookcom
Donglei Du (UNB) AlgoTrading September 23 2015 35 45
Section 6
Software for Statistical Analysis
Donglei Du (UNB) AlgoTrading September 23 2015 36 45
Software for Statistical Analysis
Many but the most popular ones areEXCEL (proprietary)SAS (proprietary)R (open-source)
Donglei Du (UNB) AlgoTrading September 23 2015 37 45
Section 7
Materials to learn R
Donglei Du (UNB) AlgoTrading September 23 2015 38 45
Some online resources to learn R I
R in a nutshellAn introduction to RR for BeginnersTry RQuick-RThe art of R Programmingwwwcourseraorg offers some nice courses on R
Such as this one
Donglei Du (UNB) AlgoTrading September 23 2015 39 45
Section 8
A brief tutorial of R with a case study
Donglei Du (UNB) AlgoTrading September 23 2015 40 45
R for Statistical Analysis
We will retrieve some stock data via package quantmod fromYahoo Finance
Donglei Du (UNB) AlgoTrading September 23 2015 41 45
Load package
rm(list=ls())require(quantmod)
Donglei Du (UNB) AlgoTrading September 23 2015 42 45
Parameters
startDate lt- 1957-03-04 start of dataendDate lt- 2014-01-06 end of dataSyssetenv(TZ = UTC)
Donglei Du (UNB) AlgoTrading September 23 2015 43 45
Retrieve data
symbolslt-c(^GSPC)symbolslt-c(AAPLFB YHOO)if(fileexists(dataGSPCRData))
load(dataGSPCRData)GSPC_csv lt- readcsv(dataGSPCcsv)
else getSymbols(symbols
src = yahoo OHLC formatfrom = startDateto = endDateindexclass=c(POSIXtPOSIXct) Recommended time series indexwarnings = FALSEadjust=TRUE)
dircreate(filepath(data) showWarnings = TRUE)save(list=GSPC file=dataGSPCRData)writecsv(GSPCfile=dataGSPCcsv)
Donglei Du (UNB) AlgoTrading September 23 2015 44 45
Plot
options(width=60)chartSeries(GSPC[20042014])addMACD()addBBands()
Donglei Du (UNB) AlgoTrading September 23 2015 45 45
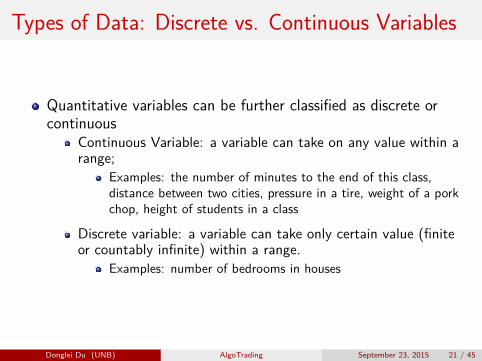
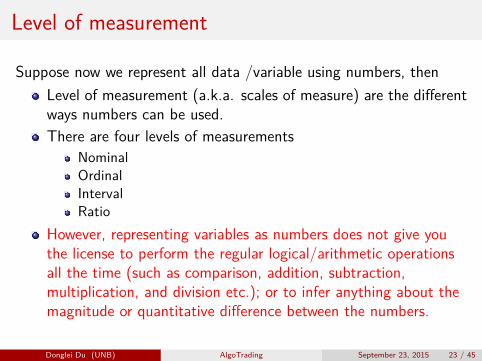
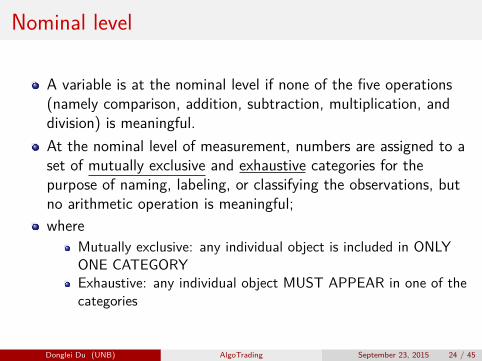
Examples
ExamplesBarcodesSocial insurance numbers (SIN)Student IDsPhones numbers
The fact that the barcode for one product is higher than that foranother or that your SIN is higher than mine tells us nothingIn surveys we often use arbitrary numbers to code variables suchas religion ethnicity major in college or gender
Donglei Du (UNB) AlgoTrading September 23 2015 25 45
Ordinal level
A variable is at the ordinal level if only comparison is meaningful
Donglei Du (UNB) AlgoTrading September 23 2015 26 45
Examples
ExamplesRank of faculty membersMaclean ranking of Canadian colleges[hyphens]httponcampusmacleanscaeducation201211012013-comprehensiveUS News Ranking of USworld collegeshttpwwwusnewscomrankings
The differences between data values cannot be determined or aremeaningless
For instance first class is better than economy and thatbusiness is in between Just how much better first class iscompared to business and business compared to economy variesfrom airline to airline and even from flight to flight
Donglei Du (UNB) AlgoTrading September 23 2015 27 45
Interval
A variable is at the interval level if only division is meaninglessReason Interval data have meaningful intervals betweenmeasurements but there is no true starting point (zero)
Donglei Du (UNB) AlgoTrading September 23 2015 28 45
Examples
ExamplesTemperatures in Celsius and Fahrenheit are interval data
Certainly order is important and intervals are meaningfulHowever a 20 C dashboard is not twice as hot as the 10 CoutsideA conversion formula between Celsius and Fahrenheit
F =95
C + 32
So 10 C = 50 F and 20 C = 68 F Obviously
20 C10 C
6= 68 F50 F
Calender year arbitrary 0 year the birth of JesusIQ score non-arbitrary 0 score
Donglei Du (UNB) AlgoTrading September 23 2015 29 45
Ratio
A variable is at the ratio level if all logicalarithmetic operationsare meaningfulReason Ratios between measurements as well as intervals aremeaningful because there is a non-arbitrary zero point
Donglei Du (UNB) AlgoTrading September 23 2015 30 45
Examples
ExamplesIncomeDistanceHeight
Donglei Du (UNB) AlgoTrading September 23 2015 31 45
Summary of level of measurement
comparison addition subtraction multiplication divisionnominal x x x x xordinal
radicx x x x
intervalradic radic radic
x xratio
radic radic radic radic radic
Donglei Du (UNB) AlgoTrading September 23 2015 32 45
A general method for identifying the level ofmeasurement
Ask yourself the following three questionsIs order meaningful
No then the data is nominalIs difference meaningful
No then the data is ordinalIs zero meaningful
No then the data is intervalYes then the data is ratio
Donglei Du (UNB) AlgoTrading September 23 2015 33 45
Section 5
Sources of Statistical Data
Donglei Du (UNB) AlgoTrading September 23 2015 34 45
Sources of Statistical Data
Statistics Canada httpwwwstatcancaTwitter wwwtwittercomFacebook wwwfacebookcom
Donglei Du (UNB) AlgoTrading September 23 2015 35 45
Section 6
Software for Statistical Analysis
Donglei Du (UNB) AlgoTrading September 23 2015 36 45
Software for Statistical Analysis
Many but the most popular ones areEXCEL (proprietary)SAS (proprietary)R (open-source)
Donglei Du (UNB) AlgoTrading September 23 2015 37 45
Section 7
Materials to learn R
Donglei Du (UNB) AlgoTrading September 23 2015 38 45
Some online resources to learn R I
R in a nutshellAn introduction to RR for BeginnersTry RQuick-RThe art of R Programmingwwwcourseraorg offers some nice courses on R
Such as this one
Donglei Du (UNB) AlgoTrading September 23 2015 39 45
Section 8
A brief tutorial of R with a case study
Donglei Du (UNB) AlgoTrading September 23 2015 40 45
R for Statistical Analysis
We will retrieve some stock data via package quantmod fromYahoo Finance
Donglei Du (UNB) AlgoTrading September 23 2015 41 45
Load package
rm(list=ls())require(quantmod)
Donglei Du (UNB) AlgoTrading September 23 2015 42 45
Parameters
startDate lt- 1957-03-04 start of dataendDate lt- 2014-01-06 end of dataSyssetenv(TZ = UTC)
Donglei Du (UNB) AlgoTrading September 23 2015 43 45
Retrieve data
symbolslt-c(^GSPC)symbolslt-c(AAPLFB YHOO)if(fileexists(dataGSPCRData))
load(dataGSPCRData)GSPC_csv lt- readcsv(dataGSPCcsv)
else getSymbols(symbols
src = yahoo OHLC formatfrom = startDateto = endDateindexclass=c(POSIXtPOSIXct) Recommended time series indexwarnings = FALSEadjust=TRUE)
dircreate(filepath(data) showWarnings = TRUE)save(list=GSPC file=dataGSPCRData)writecsv(GSPCfile=dataGSPCcsv)
Donglei Du (UNB) AlgoTrading September 23 2015 44 45
Plot
options(width=60)chartSeries(GSPC[20042014])addMACD()addBBands()
Donglei Du (UNB) AlgoTrading September 23 2015 45 45
Examples
ExamplesRank of faculty membersMaclean ranking of Canadian colleges[hyphens]httponcampusmacleanscaeducation201211012013-comprehensiveUS News Ranking of USworld collegeshttpwwwusnewscomrankings
The differences between data values cannot be determined or aremeaningless
For instance first class is better than economy and thatbusiness is in between Just how much better first class iscompared to business and business compared to economy variesfrom airline to airline and even from flight to flight
Donglei Du (UNB) AlgoTrading September 23 2015 27 45
Interval
A variable is at the interval level if only division is meaninglessReason Interval data have meaningful intervals betweenmeasurements but there is no true starting point (zero)
Donglei Du (UNB) AlgoTrading September 23 2015 28 45
Examples
ExamplesTemperatures in Celsius and Fahrenheit are interval data
Certainly order is important and intervals are meaningfulHowever a 20 C dashboard is not twice as hot as the 10 CoutsideA conversion formula between Celsius and Fahrenheit
F =95
C + 32
So 10 C = 50 F and 20 C = 68 F Obviously
20 C10 C
6= 68 F50 F
Calender year arbitrary 0 year the birth of JesusIQ score non-arbitrary 0 score
Donglei Du (UNB) AlgoTrading September 23 2015 29 45
Ratio
A variable is at the ratio level if all logicalarithmetic operationsare meaningfulReason Ratios between measurements as well as intervals aremeaningful because there is a non-arbitrary zero point
Donglei Du (UNB) AlgoTrading September 23 2015 30 45
Examples
ExamplesIncomeDistanceHeight
Donglei Du (UNB) AlgoTrading September 23 2015 31 45
Summary of level of measurement
comparison addition subtraction multiplication divisionnominal x x x x xordinal
radicx x x x
intervalradic radic radic
x xratio
radic radic radic radic radic
Donglei Du (UNB) AlgoTrading September 23 2015 32 45
A general method for identifying the level ofmeasurement
Ask yourself the following three questionsIs order meaningful
No then the data is nominalIs difference meaningful
No then the data is ordinalIs zero meaningful
No then the data is intervalYes then the data is ratio
Donglei Du (UNB) AlgoTrading September 23 2015 33 45
Section 5
Sources of Statistical Data
Donglei Du (UNB) AlgoTrading September 23 2015 34 45
Sources of Statistical Data
Statistics Canada httpwwwstatcancaTwitter wwwtwittercomFacebook wwwfacebookcom
Donglei Du (UNB) AlgoTrading September 23 2015 35 45
Section 6
Software for Statistical Analysis
Donglei Du (UNB) AlgoTrading September 23 2015 36 45
Software for Statistical Analysis
Many but the most popular ones areEXCEL (proprietary)SAS (proprietary)R (open-source)
Donglei Du (UNB) AlgoTrading September 23 2015 37 45
Section 7
Materials to learn R
Donglei Du (UNB) AlgoTrading September 23 2015 38 45
Some online resources to learn R I
R in a nutshellAn introduction to RR for BeginnersTry RQuick-RThe art of R Programmingwwwcourseraorg offers some nice courses on R
Such as this one
Donglei Du (UNB) AlgoTrading September 23 2015 39 45
Section 8
A brief tutorial of R with a case study
Donglei Du (UNB) AlgoTrading September 23 2015 40 45
R for Statistical Analysis
We will retrieve some stock data via package quantmod fromYahoo Finance
Donglei Du (UNB) AlgoTrading September 23 2015 41 45
Load package
rm(list=ls())require(quantmod)
Donglei Du (UNB) AlgoTrading September 23 2015 42 45
Parameters
startDate lt- 1957-03-04 start of dataendDate lt- 2014-01-06 end of dataSyssetenv(TZ = UTC)
Donglei Du (UNB) AlgoTrading September 23 2015 43 45
Retrieve data
symbolslt-c(^GSPC)symbolslt-c(AAPLFB YHOO)if(fileexists(dataGSPCRData))
load(dataGSPCRData)GSPC_csv lt- readcsv(dataGSPCcsv)
else getSymbols(symbols
src = yahoo OHLC formatfrom = startDateto = endDateindexclass=c(POSIXtPOSIXct) Recommended time series indexwarnings = FALSEadjust=TRUE)
dircreate(filepath(data) showWarnings = TRUE)save(list=GSPC file=dataGSPCRData)writecsv(GSPCfile=dataGSPCcsv)
Donglei Du (UNB) AlgoTrading September 23 2015 44 45
Plot
options(width=60)chartSeries(GSPC[20042014])addMACD()addBBands()
Donglei Du (UNB) AlgoTrading September 23 2015 45 45
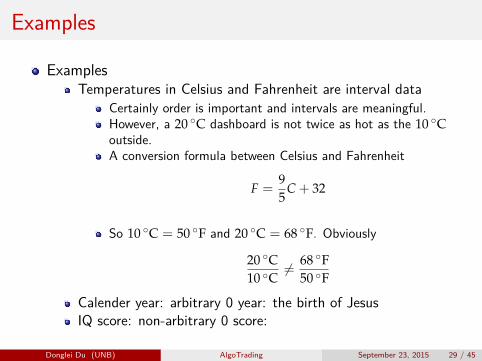
Examples
ExamplesTemperatures in Celsius and Fahrenheit are interval data
Certainly order is important and intervals are meaningfulHowever a 20 C dashboard is not twice as hot as the 10 CoutsideA conversion formula between Celsius and Fahrenheit
F =95
C + 32
So 10 C = 50 F and 20 C = 68 F Obviously
20 C10 C
6= 68 F50 F
Calender year arbitrary 0 year the birth of JesusIQ score non-arbitrary 0 score
Donglei Du (UNB) AlgoTrading September 23 2015 29 45
Ratio
A variable is at the ratio level if all logicalarithmetic operationsare meaningfulReason Ratios between measurements as well as intervals aremeaningful because there is a non-arbitrary zero point
Donglei Du (UNB) AlgoTrading September 23 2015 30 45
Examples
ExamplesIncomeDistanceHeight
Donglei Du (UNB) AlgoTrading September 23 2015 31 45
Summary of level of measurement
comparison addition subtraction multiplication divisionnominal x x x x xordinal
radicx x x x
intervalradic radic radic
x xratio
radic radic radic radic radic
Donglei Du (UNB) AlgoTrading September 23 2015 32 45
A general method for identifying the level ofmeasurement
Ask yourself the following three questionsIs order meaningful
No then the data is nominalIs difference meaningful
No then the data is ordinalIs zero meaningful
No then the data is intervalYes then the data is ratio
Donglei Du (UNB) AlgoTrading September 23 2015 33 45
Section 5
Sources of Statistical Data
Donglei Du (UNB) AlgoTrading September 23 2015 34 45
Sources of Statistical Data
Statistics Canada httpwwwstatcancaTwitter wwwtwittercomFacebook wwwfacebookcom
Donglei Du (UNB) AlgoTrading September 23 2015 35 45
Section 6
Software for Statistical Analysis
Donglei Du (UNB) AlgoTrading September 23 2015 36 45
Software for Statistical Analysis
Many but the most popular ones areEXCEL (proprietary)SAS (proprietary)R (open-source)
Donglei Du (UNB) AlgoTrading September 23 2015 37 45
Section 7
Materials to learn R
Donglei Du (UNB) AlgoTrading September 23 2015 38 45
Some online resources to learn R I
R in a nutshellAn introduction to RR for BeginnersTry RQuick-RThe art of R Programmingwwwcourseraorg offers some nice courses on R
Such as this one
Donglei Du (UNB) AlgoTrading September 23 2015 39 45
Section 8
A brief tutorial of R with a case study
Donglei Du (UNB) AlgoTrading September 23 2015 40 45
R for Statistical Analysis
We will retrieve some stock data via package quantmod fromYahoo Finance
Donglei Du (UNB) AlgoTrading September 23 2015 41 45
Load package
rm(list=ls())require(quantmod)
Donglei Du (UNB) AlgoTrading September 23 2015 42 45
Parameters
startDate lt- 1957-03-04 start of dataendDate lt- 2014-01-06 end of dataSyssetenv(TZ = UTC)
Donglei Du (UNB) AlgoTrading September 23 2015 43 45
Retrieve data
symbolslt-c(^GSPC)symbolslt-c(AAPLFB YHOO)if(fileexists(dataGSPCRData))
load(dataGSPCRData)GSPC_csv lt- readcsv(dataGSPCcsv)
else getSymbols(symbols
src = yahoo OHLC formatfrom = startDateto = endDateindexclass=c(POSIXtPOSIXct) Recommended time series indexwarnings = FALSEadjust=TRUE)
dircreate(filepath(data) showWarnings = TRUE)save(list=GSPC file=dataGSPCRData)writecsv(GSPCfile=dataGSPCcsv)
Donglei Du (UNB) AlgoTrading September 23 2015 44 45
Plot
options(width=60)chartSeries(GSPC[20042014])addMACD()addBBands()
Donglei Du (UNB) AlgoTrading September 23 2015 45 45
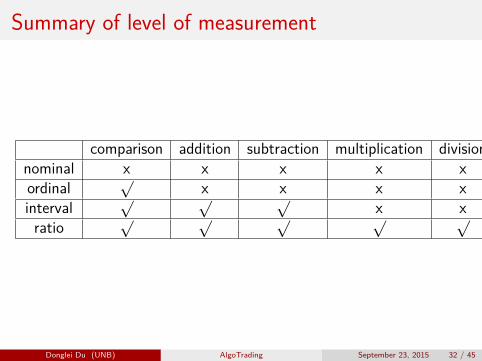
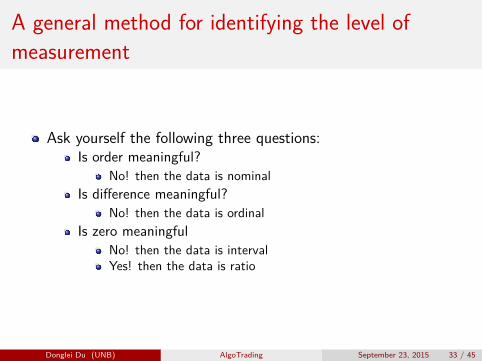
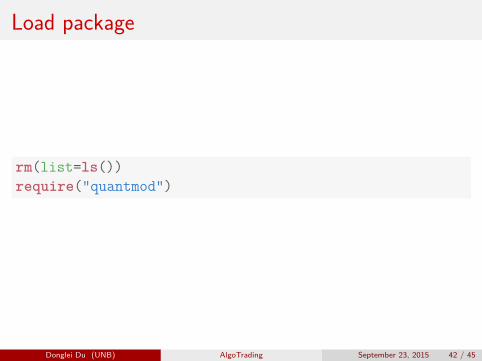
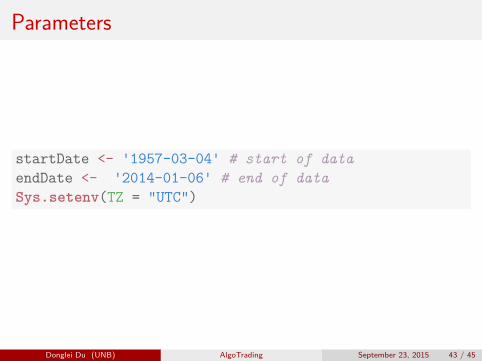
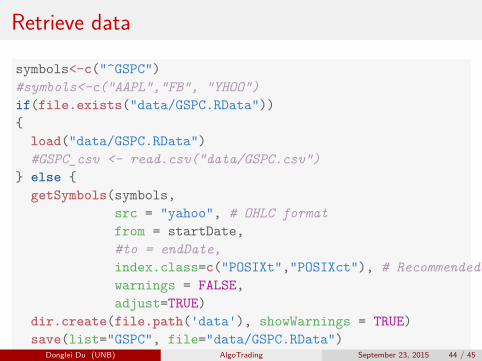
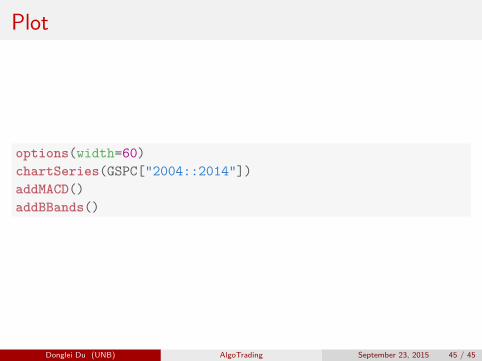
Plot
options(width=60)chartSeries(GSPC[20042014])addMACD()addBBands()
Donglei Du (UNB) AlgoTrading September 23 2015 45 45


![Augmented reality intorduction [SCTPiter, NevaCamp]](https://img.pdfslide.net/doc/110x75/54533b85b1af9f160a8b47b0/augmented-reality-intorduction-sctpiter-nevacamp.jpg)