Embed Size (px)
Citation preview
2079
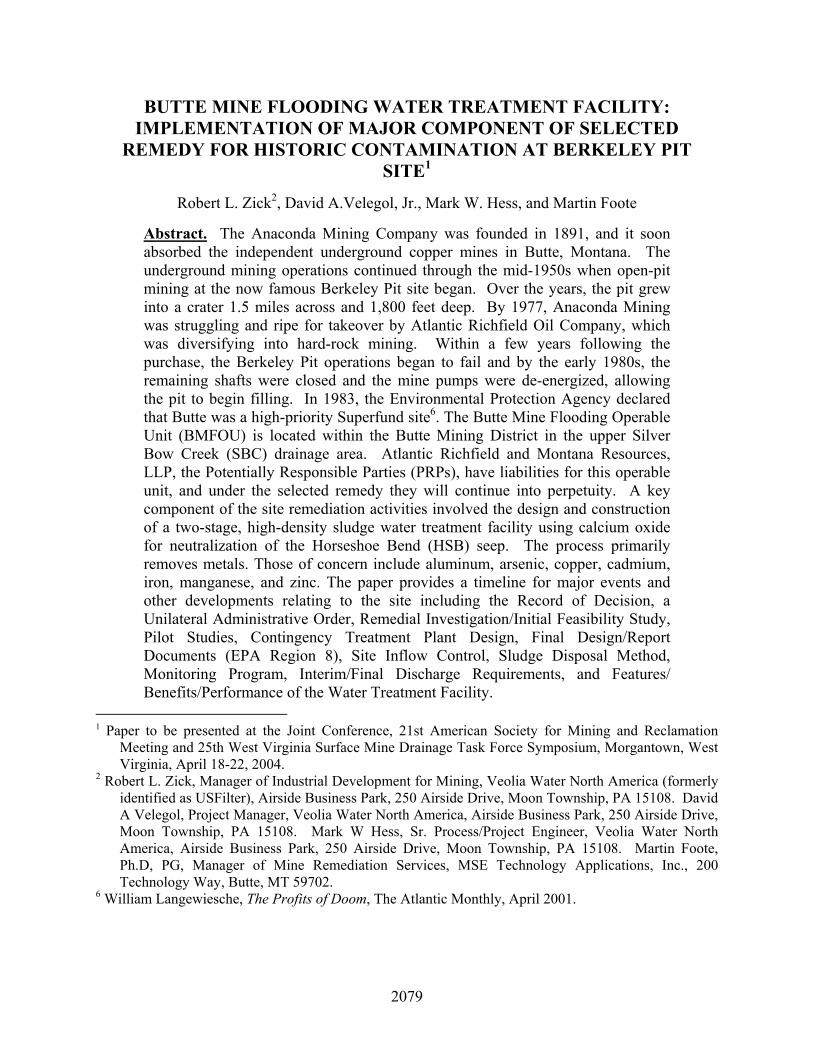
BUTTE MINE FLOODING WATER TREATMENT FACILITY: IMPLEMENTATION OF MAJOR COMPONENT OF SELECTED
REMEDY FOR HISTORIC CONTAMINATION AT BERKELEY PIT SITE1
Robert L. Zick2, David A.Velegol, Jr., Mark W. Hess, and Martin Foote
Abstract. The Anaconda Mining Company was founded in 1891, and it soon absorbed the independent underground copper mines in Butte, Montana. The underground mining operations continued through the mid-1950s when open-pit mining at the now famous Berkeley Pit site began. Over the years, the pit grew into a crater 1.5 miles across and 1,800 feet deep. By 1977, Anaconda Mining was struggling and ripe for takeover by Atlantic Richfield Oil Company, which was diversifying into hard-rock mining. Within a few years following the purchase, the Berkeley Pit operations began to fail and by the early 1980s, the remaining shafts were closed and the mine pumps were de-energized, allowing the pit to begin filling. In 1983, the Environmental Protection Agency declared that Butte was a high-priority Superfund site6. The Butte Mine Flooding Operable Unit (BMFOU) is located within the Butte Mining District in the upper Silver Bow Creek (SBC) drainage area. Atlantic Richfield and Montana Resources, LLP, the Potentially Responsible Parties (PRPs), have liabilities for this operable unit, and under the selected remedy they will continue into perpetuity. A key component of the site remediation activities involved the design and construction of a two-stage, high-density sludge water treatment facility using calcium oxide for neutralization of the Horseshoe Bend (HSB) seep. The process primarily removes metals. Those of concern include aluminum, arsenic, copper, cadmium, iron, manganese, and zinc. The paper provides a timeline for major events and other developments relating to the site including the Record of Decision, a Unilateral Administrative Order, Remedial Investigation/Initial Feasibility Study, Pilot Studies, Contingency Treatment Plant Design, Final Design/Report Documents (EPA Region 8), Site Inflow Control, Sludge Disposal Method, Monitoring Program, Interim/Final Discharge Requirements, and Features/ Benefits/Performance of the Water Treatment Facility.
1 Paper to be presented at the Joint Conference, 21st American Society for Mining and Reclamation
Meeting and 25th West Virginia Surface Mine Drainage Task Force Symposium, Morgantown, West Virginia, April 18-22, 2004.
2 Robert L. Zick, Manager of Industrial Development for Mining, Veolia Water North America (formerly identified as USFilter), Airside Business Park, 250 Airside Drive, Moon Township, PA 15108. David A Velegol, Project Manager, Veolia Water North America, Airside Business Park, 250 Airside Drive, Moon Township, PA 15108. Mark W Hess, Sr. Process/Project Engineer, Veolia Water North America, Airside Business Park, 250 Airside Drive, Moon Township, PA 15108. Martin Foote, Ph.D, PG, Manager of Mine Remediation Services, MSE Technology Applications, Inc., 200 Technology Way, Butte, MT 59702.
6 William Langewiesche, The Profits of Doom, The Atlantic Monthly, April 2001.
2080
Introduction
On November 25, 2003 a ribbon-cutting ceremony was held at the Horseshoe Bend Water
Treatment site located in the East Camp area of the Berkeley Pit site in Butte, Montana. This
was hosted by Atlantic Richfield and Montana Resources and attended by about 100 people
including representatives from the PRPs, the project execution team members, EPA Region 8,
State of Montana DEQ, local Butte government officials, State of Montana government officials,
local news teams, and environmental activists. This was the culmination of project development
work that began in March of 2001, involving a facilities design contract by USFilter (now Veolia
Water North America) and subsequent construction activities headed by General Contractor,
Swank Enterprises located in Kalispell, Montana.
Turning back the clock from March 2001, a progression of significant events and
developments as listed below comprised the Butte Timeline relating to the Berkeley Pit site.
• Berkeley Pit opened by Anaconda Company – July, 1955
• Atlantic Richfield Corporation (ARCO) purchases Anaconda Company – August, 1977
• ARCO shuts down underground pump operations – April 22, 1982
• All ARCO mining operations in Butte are discontinued – June, 1983
• Groundwater level reaches bottom of Berkeley Pit – November, 1983
• Berkeley Pit area designated as a Superfund site - March, 1984
• Berkeley Pit and surrounding area sold to Montana Resources (MR) – September, 1985
• MR begins operations in Continental Pit – July, 1986
• The Record of Decision (ROD) for the Butte Mine Flooding Operable Unit (BMFOU)
signed – September, 1994
• MR begins operating water diversion system that prevents Horseshoe Bend water from
entering the Berkeley pit and pumps it to the Yankee Doodle tailings pond – April 1996
• Unilateral Administrative Order of Consent (UAO) for the BMFOU issued – November,
1996
• MR suspends mining and milling operations – June 30, 2000
• Horseshoe Bend flow allowed to reenter the Berkeley Pit; provisions within the ROD and
UAO that call for the immediate design and construction of a treatment facility for the
flow entering the Berkeley Pit go into effect – July 1, 2000
2081
• In late 2003, Montana Resources reactivated mining and milling operations at the
Continental Pit and their copper concentrator. While active mining is in progress,
effluent from the Horseshoe Bend Water Treatment Plant (if Montana Resources
continues to operate it) will be recycled to the concentrator and not discharged to a
receiving stream (Silver Bow Creek).
Final Design
A Phase I final design contract was awarded to USFilter in early March of 2001. Events
leading up to this included Solicitation of Interest from Atlantic Richfield, responses by
perspective bidders, issuance of Request for Proposal to selected contractors, Butte site visit and
pre-bid meeting, and visits to representative project sites, specifically (for the USFilter proposal)
to North Branch and Flaggy Meadows AMD Treatment Facilities in West Virginia.
The tasks performed by the USFilter team, including MSE and HKM Engineering (both local
Montana engineering firms), included the following:
• Evaluation of Retrofitting the Montana Resources Concentrator vs. a New Plant
Alternative
• Treatability Testing by MSE at their Butte Facilities
• Modeling of Sludge Disposal in the Berkeley Pit completed by MSE
• Final Detailed Engineering Design with four levels of review, HKM Engineering
completed the site work, major concrete tank design including two reactors and two
clarifiers, influent equalization pond, and piping for influent and effluent lines. USFilter
completed the remaining design scope and provided oversight for all work.
• Preparation of Complete Project Specifications
• Develop Environmental Health and Safety Program
• Agency/Public Meeting Attendance
• Project Control Support and Documentation Control by MSE
Following completion of the Phase I design, a contract for Phase II Design Services was
awarded to USFilter. These services included the following scope of work:
• Complete Final Design Report to include agency comments, Contingency Plan,
Operations and Maintenance Plan, Start-Up/Shake-Down Plan, Construction QA/QC
2082
Plan, Field Sampling and Analysis Plan, Site Specific Health and Safety Plan, Data
Management/Data Validation Plan, and Performance Standards Plan. These documents
were drafted by MSE and reviewed/submitted by USFilter.
• Develop Remedial Action Work Plan including Remedial Action Completion Report and
Inspection Report.
• Complete a Process Hazard Analysis (PHA)
• Perform additional treatability services to address toxicity issues
• Develop Project Schedule for Agency review and in support of General Contractor bid
process.
• Provide Construction Engineering Services – Shop Drawing Review and Responses to
Contractor Requests for Information
• Provide Project Control Services – Cost Estimating and Schedule Revisions
• Recommend, Select, and Procure Major Equipment Components – Lime Silo/Slaker/
Slurry Systems and Thickener-Clarifiers.
• Provide Oversight and Inspections of Equipment Manufacturing/Fabrication
• Provide Operations and Maintenance Manual Development
• Develop Functional Process Descriptions and Software Programming for PLC’s
• Provide Design Solutions/Conceptual Cost Estimating for addressing, as necessary,
future toxicity requirements
Process Description and Selection Factors
The process used as the design basis for treatment of Horseshoe Bend seep water,
Continental Pit water (Montana Resources’ active mine pit), and Berkeley Pit water in the future
(starting around 2017), incorporates a two-stage High Density Sludge (HDS), lime neutralization
approach to produce water for discharge or reuse in MR’s copper concentrator. The two-stage
process was a result of the Remedial Investigation/Feasibility Study for the Berkeley Pit
demonstrating that aluminum, having its minimum solubility around neutral pH, would re-
dissolve excessively at the higher pH values that are necessary for optimum removal of zinc,
manganese, and cadmium. Selection of the HDS process was influenced to a great extent by
benefits derived from a system that provides much higher percent recovery of the influent flow
2083
(with HDS) compared to the expected recovery with a low-density treatment system
(conventional). This comparison typically shows an order of magnitude difference.
The Statement of Work (SOW) as permitted by the ROD requires that 95% of the HSB
channel on a yearly flow basis must be prevented from entering the Pit. This, in effect, reduced
the quantity of sludge blowdown allowed (including the grit flow from lime slakers and periodic
flush water for the common sludge disposal line) to less than 5% of the treated flow. Since this
is attainable under the HDS scenario, disposal of sludge into the Berkeley Pit was allowed
following a review of dispersion modeling and sludge stability predictions as completed during a
pilot testing phase at MSE. If a low-density treatment system had been utilized, either an equal
volume of Berkeley Pit water would have needed to be withdrawn and treated to offset sludge
flow going into the Pit or a separate on-site sludge waste disposal area would have needed to be
constructed. The estimated cost for a 30-year sludge repository was $15-25 million in capital (the
range representing un-lined and lined options), plus an expected need for sludge dewatering
equipment, plus operations/maintenance for this entire additional investment.
In summarizing, a low-density treatment option would have resulted in higher costs based on
an evaluation that assessed the additive effects from either of the following scenarios:
• For sludge disposal in a separate repository, the cost for this plus sludge dewatering
equipment that likely would have been needed, involved considerable additional
expenditures over the HDS process.
• For sludge disposal in the Pit, an additional volume of Berkeley Pit water to offset the
sludge would have needed to be withdrawn, thus requiring an increase in the treatment
plant capacity by ~ 20% and an expected 30% increase in lime neutralization cost due
to both the higher flow and the more concentrated pit water.
Pilot Testing Phase
The pilot testing processes associated with the design of the Horseshoe Bend water treatment
facility was comprised of two specific test sequences. The first of these sequences was related to
treatability testing to determine the effectiveness of the proposed process to meet the water
quality discharge requirements and generate required design data for the final plant design. The
2084
second testing sequence was a series of tests to establish the geochemical interactions between
the high-density sludge and the water contained within the Berkeley Pit.
Treatability Testing
In the treatability testing sequence three series of tests were performed. The first series of
tests were initiated in March of 2001. The second series of tests were initiated in August of
2001, and the third series of tests were initiated in October of 2001. In each of these a
combination of batch-type tests, continuous flow tests, and physical tests were performed to
evaluate the following specific objectives that were established for the process treatability
testing:
Determine whether the planned two-stage, HDS, lime treatment process will meet
discharge requirements;
Determine the process conditions needed to meet discharge requirements;
Determine other process information for design purposes for both stages, such as the rate
of dry solids formed, the sludge density, the sludge volume, the specific gravity of the
sludge, the flocculant dosage, and the sludge settling rates;
Evaluate the post-treatment formation of calcium sulfate in the discharge stream; and
Determine the representative toxicity of the effluent as produced from the pilot plant.
Following a series of batch (or jar) testing procedures to establish specific criteria,
continuous flow testing was performed using a pilot-scale mini-plant that was assembled to
simulate the full-scale process including process controls. The mini-plant was operated at a feed
rate of 100 milliliters per minute (ml/min) using both Horseshoe Bend water and a mixture of
Continental pit water and Horseshoe Bend water.
From the results of the treatability test sequences detailed above, it was determined that the
two-stage, high density solids, lime/aeration treatment method would be able to meet the
discharge limitations imposed by Water Quality Bureau Circular Number 7 (WQB-7), Montana
Numeric Water Quality Standards for disposal of the treated water into Silver Bow Creek as
those standards existed at the time of the testing and dependent upon the dissolved concentration
of iron in the influent stream to the facility.
2085
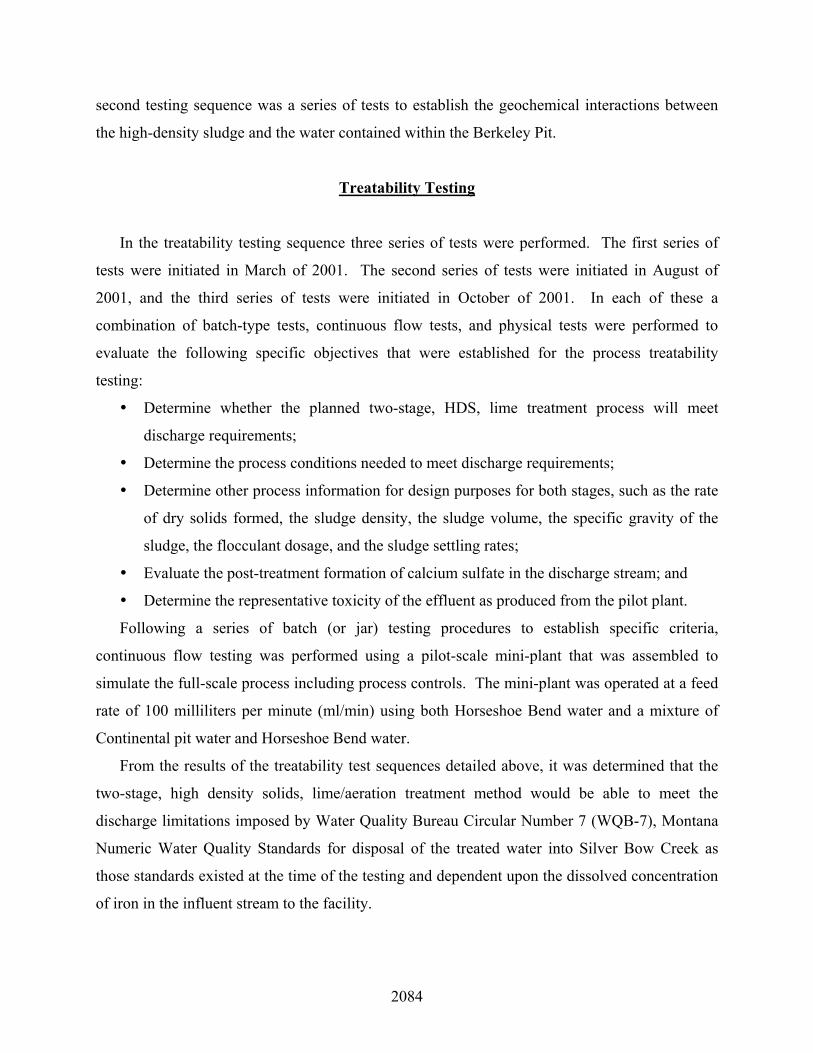
The pilot plant effluent quality shown in Table 1 below is the range of values determined
from the analysis of the appropriate samples acquired during the treatability studies.
Table 1. Summary of WQB-7 requirements versus expected plant discharge.
WQB-7 Requirements Constituent Acute
(mg/L) Chronic (mg/L)
Pilot Plant Effluent (mg/L)
Al 0.750 0.087 <0.031 – 0.07 As 0.018 0.010 1 <0.033 – 0.058 Cd 0.022 0.0073 <0.004 – 0.021 Cr 5.607 0.268 <0.002 – 0.005 Cu 0.052 0.030 <0.002 – 0.041 Fe - 1.000 <0.008 – 1.0 Mn - 0.050 2 <0.003 – 3.6 Ni 1.516 0.168 <0.013 – 0.023 Pb 0.476 0.019 <0.001 – 0.003 U 0.020 1 0.020 1 <0.0052 – 0.014 Zn 0.387 0.387 <0.008 – 0.95 pH 6.5 – 9.5 6.5 - 9.5 9.0 – 9.5
1 Human health standard. 2 Secondary MCL - detailed note of explanation number 24, WQB-7.
Sludge Stability Testing
In this testing sequence, tests were conducted using sludges (first and second stage) produced
by the operation of the previously described mini-plant, along with water (near surface, plus 100
feet and greater than 200 feet in depth) from the Berkeley Pit. In addition, a geochemical model
was developed to simulate the geochemical interaction of the mini-plant sludges and the
Berkeley Pit water into the future.
In the sludge stability testing sequence two groups of tests were performed. The first group
was initiated in March of 2001 and the second group of tests was initiated in August of 2001. In
each of these groups of tests a combination of batch-type tests, and physical tests were performed
to evaluate the following specific, short-term, objectives that were established for the sludge
stability testing:
Evaluation of the physical settling aspects of Stage 1 sludge and Stage 2 sludge while in
contact with deep and surface Berkeley Pit water;
Evaluation of the short term stability of Stage 1 and Stage 2 sludges while in contact with
deep and surface pit waters under partial anaerobic conditions; and

2086
Evaluation of the short-term stability of Stage 1 and Stage 2 sludges while in contact with
deep pit waters under anaerobic conditions.
In addition to the sludge stability testing, the long-term effects associated with disposal of
sludge into Berkeley Pit water were determined using a thermodynamic, geochemical model
developed by Exponent, Inc. of Boulder, Colorado based on the U.S. Geological Survey (USGS)
geochemical speciation model PHREEQC. This model was used to simulate the following
effects:
The long-term effects of mixing current Berkeley Pit water volume, future groundwater flow,
and future sludge addition to the Berkeley Pit water; and
The other long-term effects (evaporation, precipitation, and treatment of the Berkeley Pit
water) associated with the disposal of treatment sludge into the Berkeley Pit water.
A future prediction was generated simulating the bulk Berkeley Pit water composition yearly
over a 20-year period using the volume and composition of Berkeley Pit water, the annual
Berkeley Pit groundwater inflow rate, and the expected annual sludge composition and volume
produced by the Horseshoe Bend treatment plant.
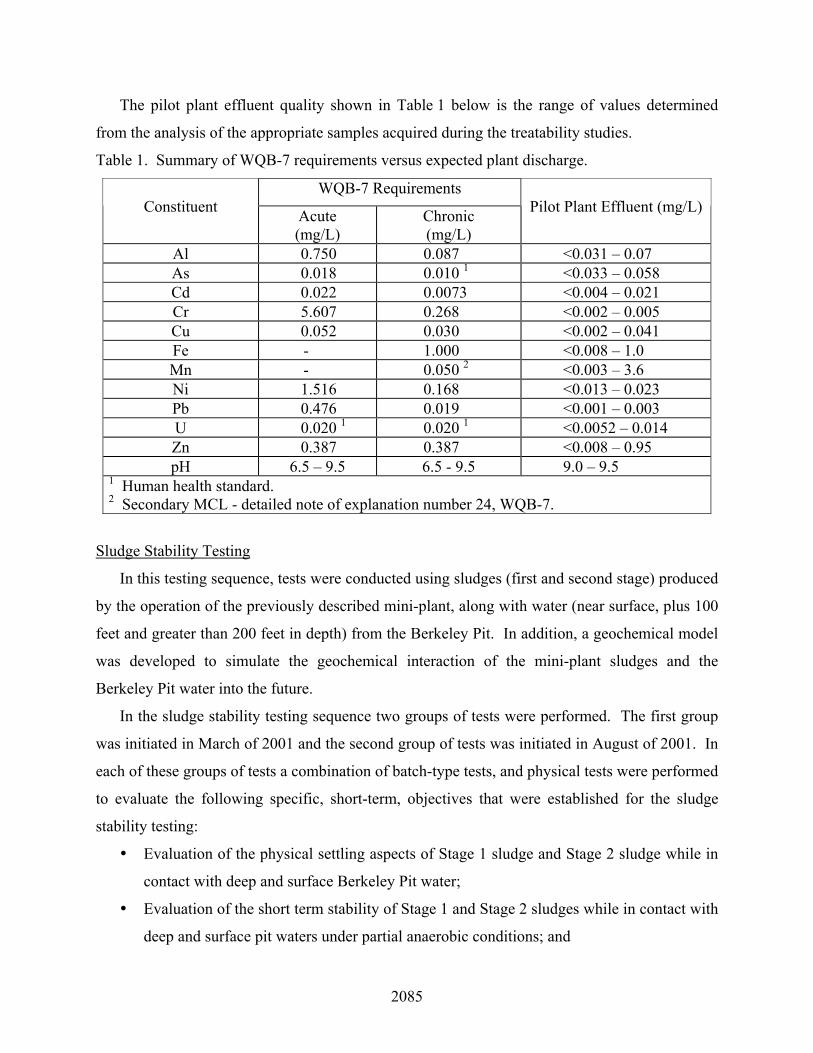
Process Flow Diagram
It was determined during the BMFOU Feasibility Study that the most suitable technology for
treating Berkeley Pit/Horseshoe Bend type water was a two-stage hydroxide
neutralization/aeration process followed by clarification in both stages. This concept was
developed into a HDS water treatment scenario starting during the proposal phase and it was
supported by data generated during the pilot testing phase including sludge evaluation factors
described above. The process that was selected to provide the optimum treatment method for the
HSB Water Treatment Facility is shown in Fig. 1.
2087
Water Treatment Facility – Design Basis
Design parameters, other requirements used as the design basis for the facility, and relevant
data are provided below:
Maximum Total Flow Capacity: 7 million gallons per day (flows comprising this as stated
below are not additive).
• Maximum Flow from Horseshoe Bend: 5.5 mgd.
• Maximum Flow from Continental Pit: 0.5 mgd
• Maximum Flow from Berkeley Pit: 3.3 mgd to maintain the elevation below the critical
water level – 5,410 mean sea level
Maximum Lime Demand: 120 tons/day of CaO
• Lime Turn Down Capacity: 20:1
• Current Lime Usage: < 1000 lbs/hr
Air Air
EqualizationBasin
HSB Water
Influent PumpStation
1st StagePH Adjust
1st StageClarifier
2nd StagePH Adjust
2nd StageClarifier
Effluent PumpStation
Alk. Tank Alk. Tank
LimeSystem
PolymerSystem
Sludge Blow-Downto Berkeley Pit
Discharge toSilver Bow Creek
EffluentLagoon
Figure 1. Water Treatment Facility Process Flow Diagram
2088
Maximum Polymer (used as settling aid) Demand: 1 ton/day
• Current Polymer Usage: < 8 lbs/hr
Maximum Solids Formed:
• First Stage - 1.6 g/l from Horseshoe Bend water and 4.2 g/l from Berkeley Pit water
• Second Stage - 0.8 g/l from Horseshoe Bend water and 2.1 g/l from Berkeley Pit water
Neutralization Reactor Design: ~ 1 hour detention time in each stage
Blower Design: Capacity to oxidize 24 lb/min of iron and 10 lb/min of manganese
Clarifier Design:
• First Stage – 0.21 gpm/sq ft surface overflow rate based upon column tests and settling
curves
• Second Stage – 0.32 gpm/sq ft surface overflow rate based upon column tests and settling
curves
Water Quality Parameters:
Water quality analyses of Horseshoe Bend water, Continental Pit water and Berkeley Pit
water were obtained from the Montana Bureau of Mines and Geology (MBMG) and are
presented in Table 2. These are intended to be representative, but the water compositions are not
constant and do fluctuate.
2089
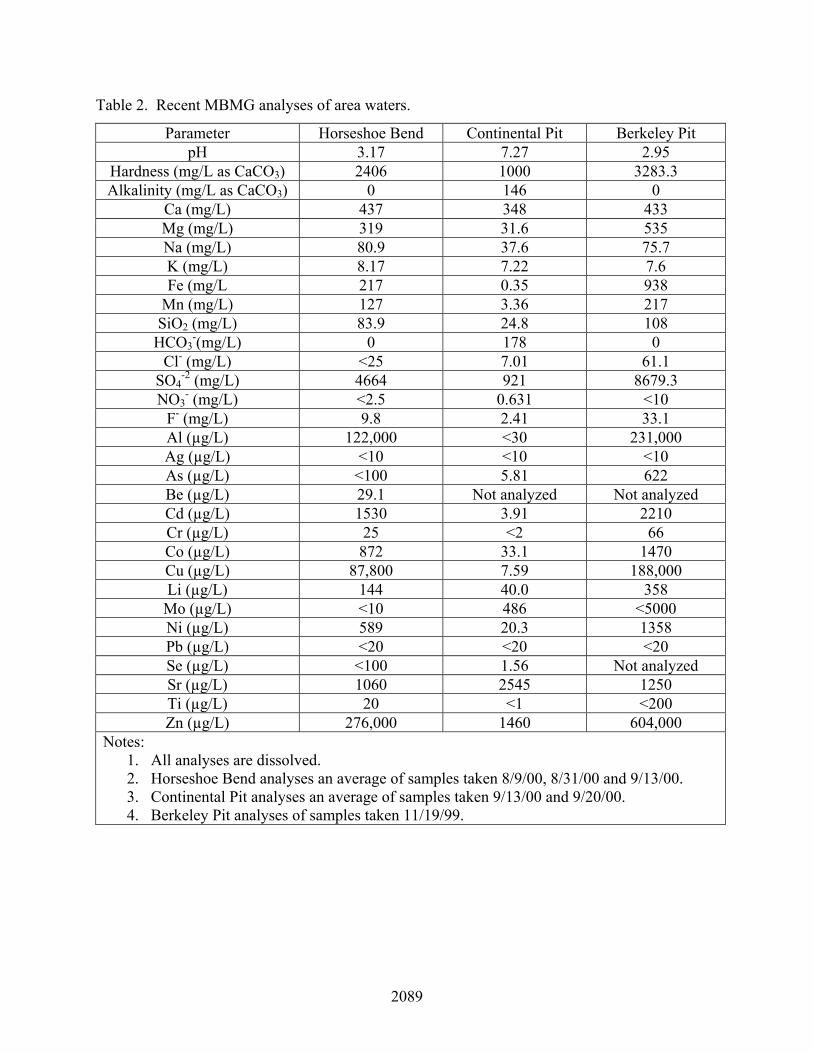
Table 2. Recent MBMG analyses of area waters.
Parameter Horseshoe Bend Continental Pit Berkeley Pit pH 3.17 7.27 2.95
Hardness (mg/L as CaCO3) 2406 1000 3283.3 Alkalinity (mg/L as CaCO3) 0 146 0
Ca (mg/L) 437 348 433 Mg (mg/L) 319 31.6 535 Na (mg/L) 80.9 37.6 75.7 K (mg/L) 8.17 7.22 7.6 Fe (mg/L 217 0.35 938
Mn (mg/L) 127 3.36 217 SiO2 (mg/L) 83.9 24.8 108
HCO3-(mg/L) 0 178 0
Cl- (mg/L) <25 7.01 61.1 SO4
-2 (mg/L) 4664 921 8679.3 NO3
- (mg/L) <2.5 0.631 <10 F- (mg/L) 9.8 2.41 33.1 Al (µg/L) 122,000 <30 231,000 Ag (µg/L) <10 <10 <10 As (µg/L) <100 5.81 622 Be (µg/L) 29.1 Not analyzed Not analyzed Cd (µg/L) 1530 3.91 2210 Cr (µg/L) 25 <2 66 Co (µg/L) 872 33.1 1470 Cu (µg/L) 87,800 7.59 188,000 Li (µg/L) 144 40.0 358 Mo (µg/L) <10 486 <5000 Ni (µg/L) 589 20.3 1358 Pb (µg/L) <20 <20 <20 Se (µg/L) <100 1.56 Not analyzed Sr (µg/L) 1060 2545 1250 Ti (µg/L) 20 <1 <200 Zn (µg/L) 276,000 1460 604,000
Notes: 1. All analyses are dissolved. 2. Horseshoe Bend analyses an average of samples taken 8/9/00, 8/31/00 and 9/13/00. 3. Continental Pit analyses an average of samples taken 9/13/00 and 9/20/00. 4. Berkeley Pit analyses of samples taken 11/19/99.
2090
Water Treatment Facility - Key Features
Many of the important operating features incorporated into the design are listed below:
• System is fully automatic with remote alarm indication.
• System uses the High Density Sludge (HDS) process to minimize volume of sludge
blowdown.
• System uses aeration to enhance sludge stability and optimize metals removal with the
highest oxidation state.
• Concrete design and construction for major tanks provide longevity.
• Efficient turn down capacity. System will consume less power at the lower flows
expected initially.
o Influent and effluent pumps operate from variable frequency drives.
o Sludge recycle pumps operate from variable frequency drives.
o Blowers can be turned down with the inlet butterfly valve and reduce power
consumption.
• Equalization basin is used to minimize influent variations.
• Redundant lime systems are provided.
• Redundancy is provided in other major components.
o Duplex influent and effluent pumps
o Duplex aeration blowers
o Duplex polymer feed pumps Duplex reaction/clarification stages with by-passes
• Automatic effluent rejection is provided. If effluent is out of specification on pH,
system will automatically send water to Berkeley Pit rather than discharge to the Silver
Bow Creek.
• Final effluent lagoon provides added polishing of effluent and added flow control
capability.
•
Water Treatment Plant – Construction Phase
Construction activities for the HSB Water Treatment Plant began during June of 2002 and
continued through the end of 2003. As stated previously, Swank Enterprises of Kalispell,
2091
Montana was the Prime or General Contractor selected by Atlantic Richfield and Montana
Resources. USFilter provided construction management acting on behalf of the owners during
the entire construction phase. The subcontractors that performed under Swank Enterprises are
listed below.
• Jordan Contracting – Site work
• L. H. Sowles – Structural Steel and Rebar
• R. H. Grover – Mechanical
• Fister Electric – Electrical
• T&L Painting – Coatings and Painting
• Timberline Fencing – Fencing
• HKM Engineering – Testing Laboratory, Building Construction
• Pioneer – Concrete Supplier
During execution of the construction phase task work, there were a number of awards that
were presented to the project team in recognition of exceptional efforts. In December 2002 the
Montana Contractors Association, Inc., Concrete Division selected the project as First Place
recipient of their Concrete Excellence Award in the Industrial/Commercial Category. In
September 2003 the Board of Directors of British Petroleum presented an award to U. S. Filter
representing performance of the entire construction team in recognition of over 100,000 man-
hours of Safe and High Quality Effort, and without a Day Away From Work Case in the
construction of the Horseshoe Bend Water Treatment Plant. This outstanding safety record
continued and during the ribbon cutting ceremony it was announced that over 120,000 safe work
hours had been exceeded! The final recognition for the project was presented at a dinner
ceremony in Great Falls during January 2004. This was the Project of the Year Award in the
Industrial Category by Montana Contractors Association, a member group of the Associated
General Contractors of America (AGC).
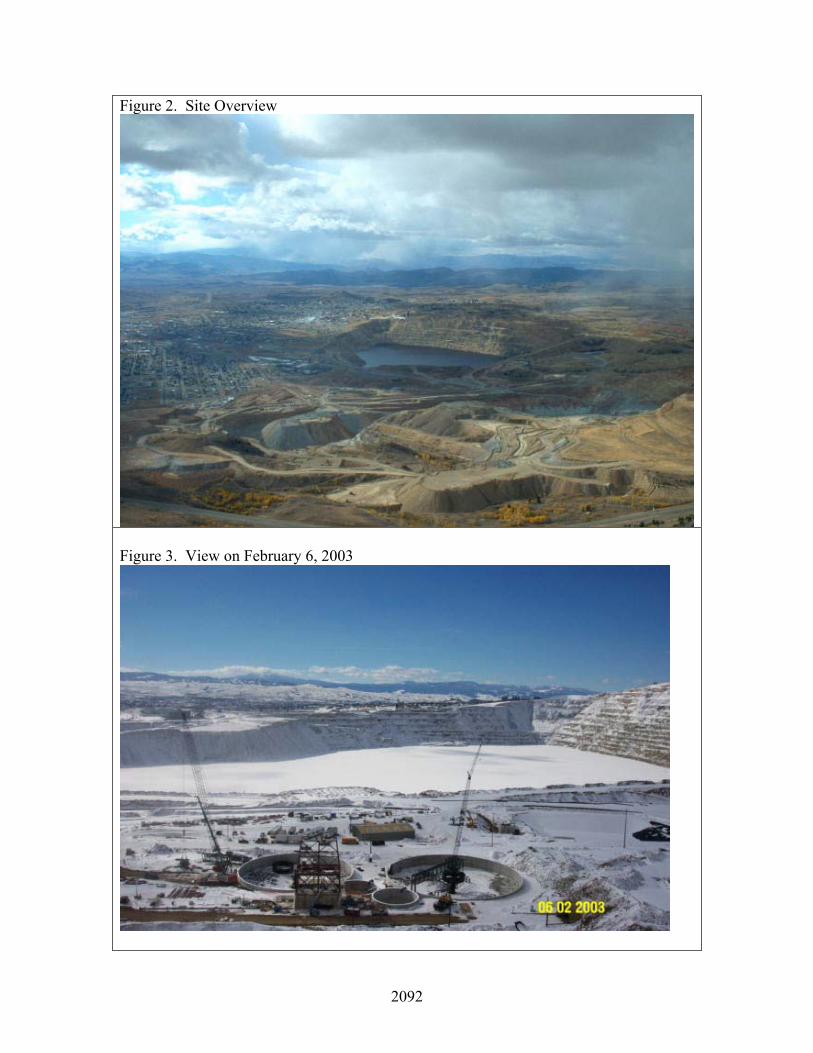
The construction activities that were performed over the 18-month schedule can best be
represented by the following site photos:
2092
Figure 2. Site Overview
Figure 3. View on February 6, 2003
2093
Figure 4. Lime Silo Steel
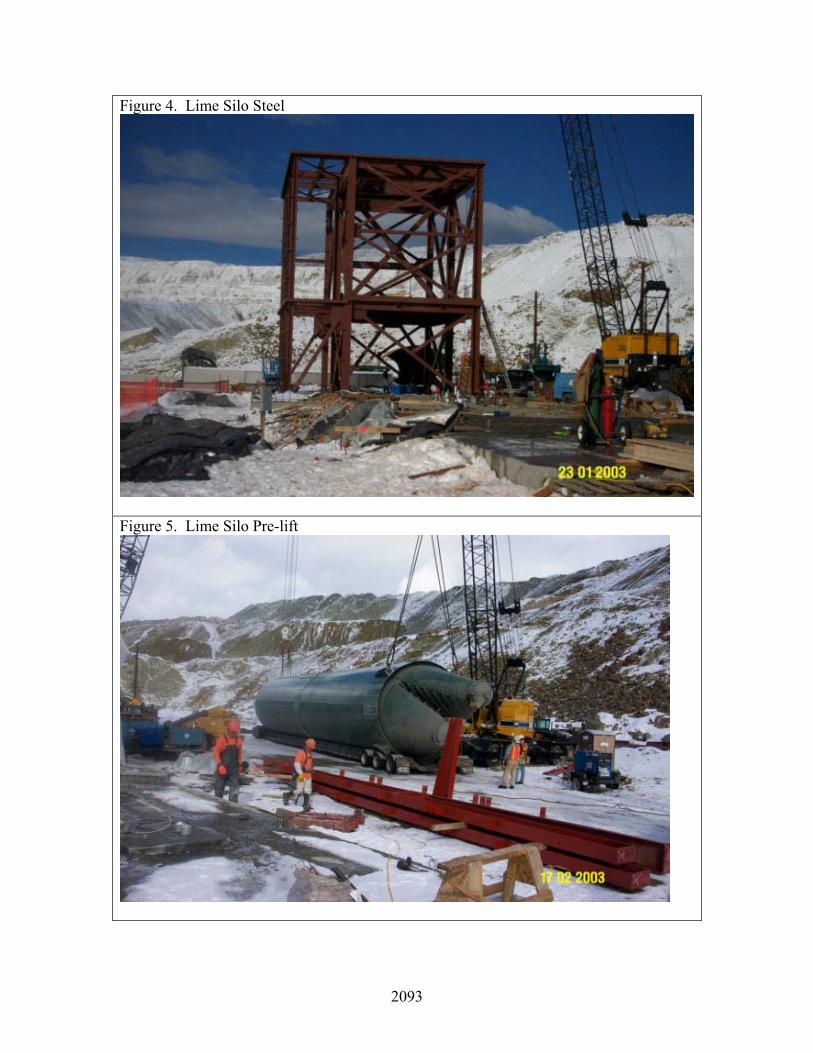
Figure 5. Lime Silo Pre-lift
2094
Figure 6. Lime Silo Lift
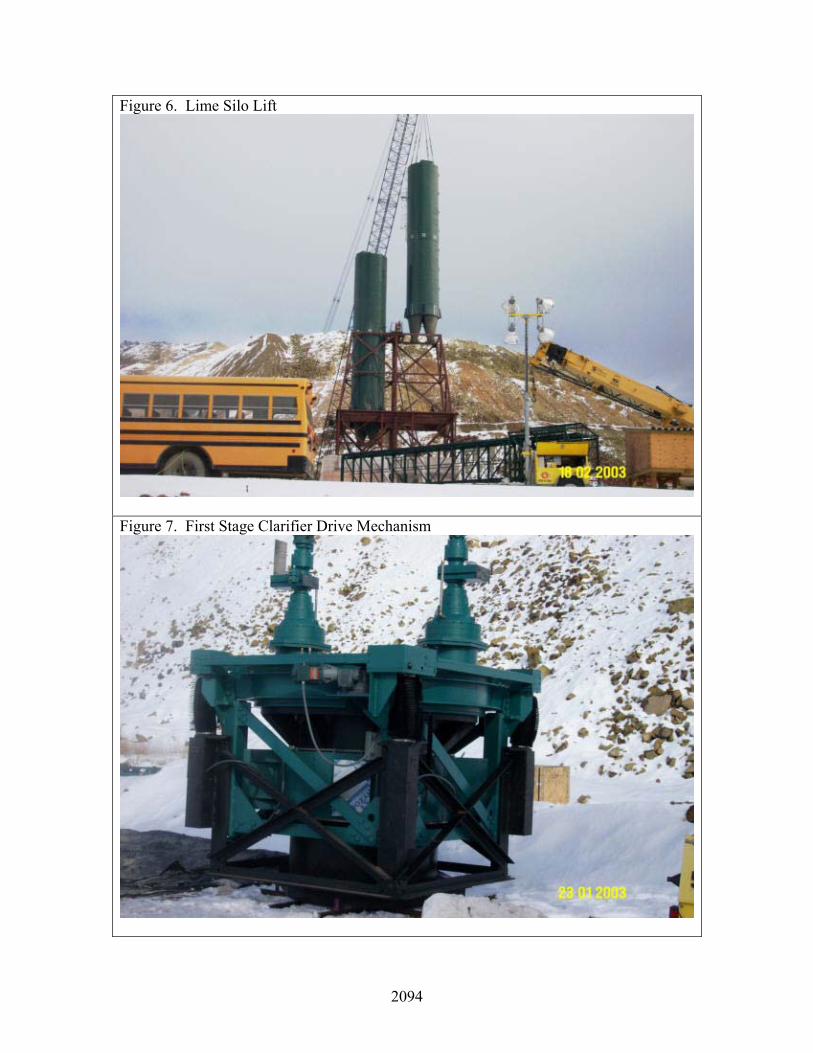
Figure 7. First Stage Clarifier Drive Mechanism
2095
Figure 8. View on March 10, 2003
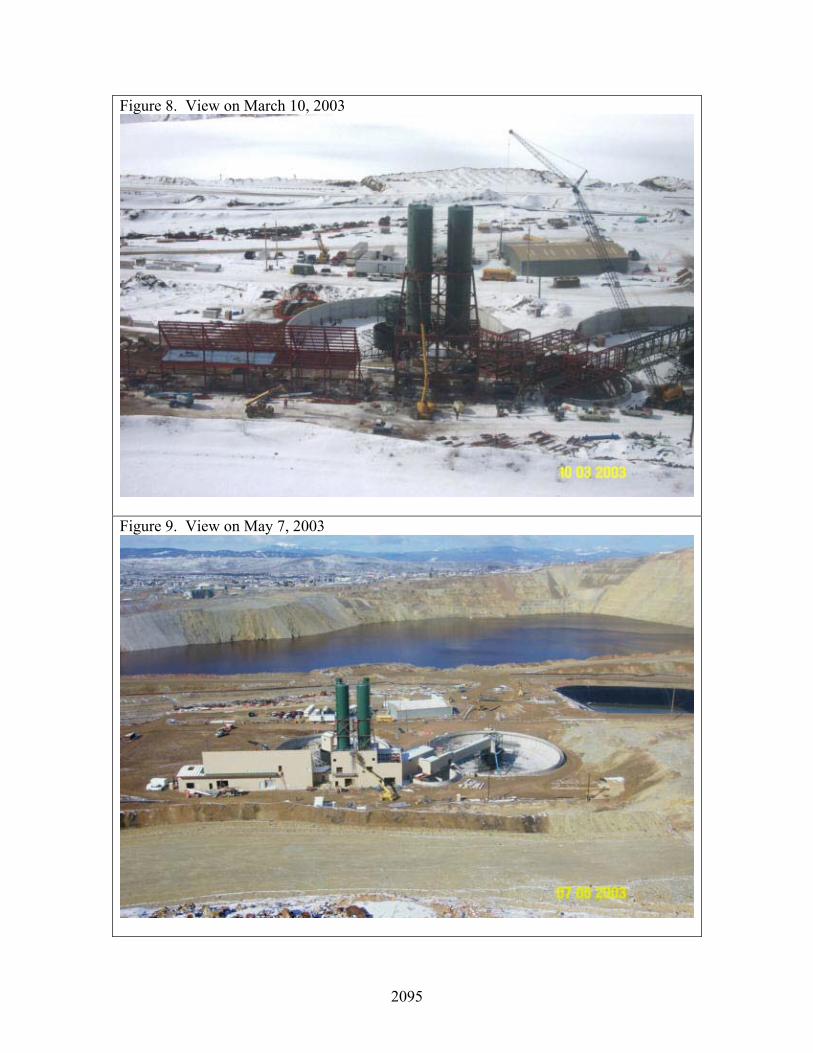
Figure 9. View on May 7, 2003
2096
Figure 10. Second Stage Agitator/Aerator Drive Mechanism
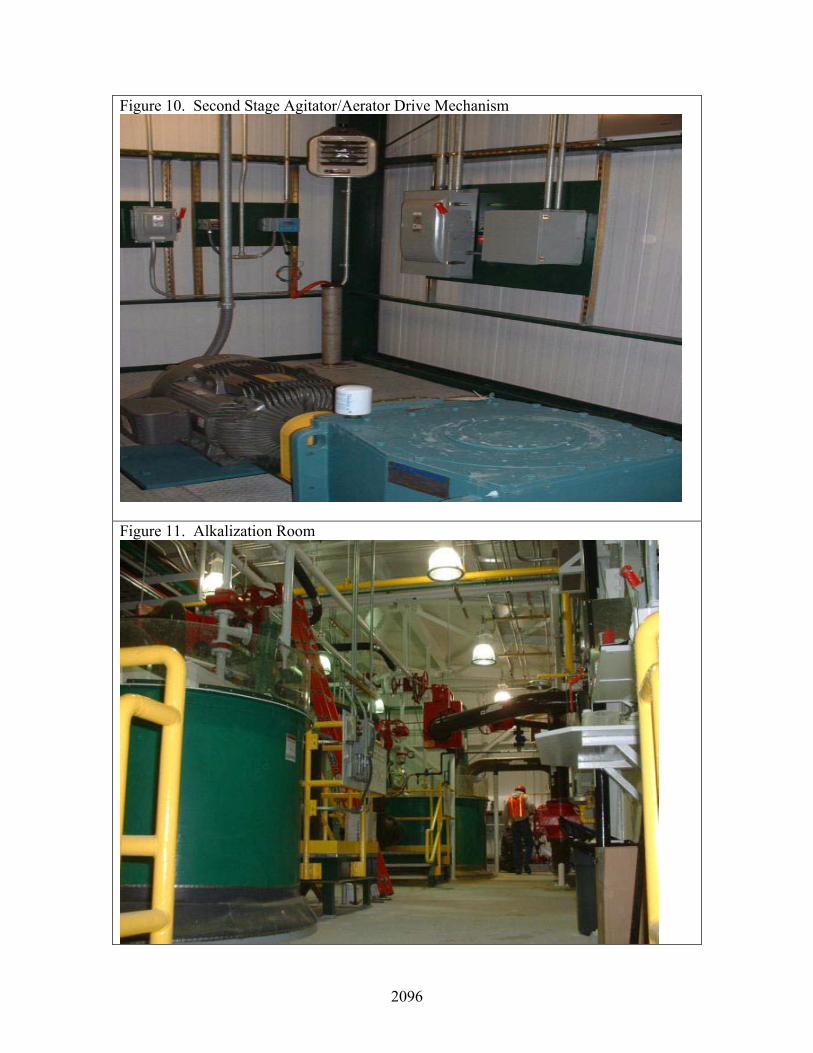
Figure 11. Alkalization Room
2097
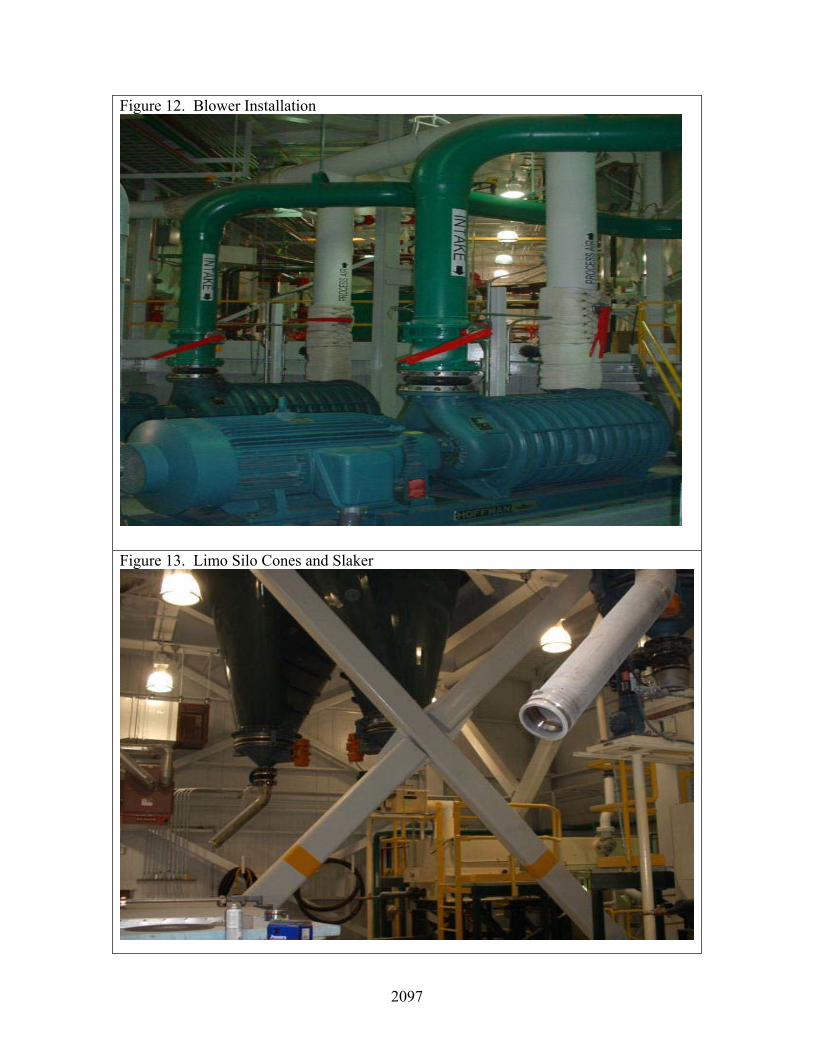
Figure 12. Blower Installation
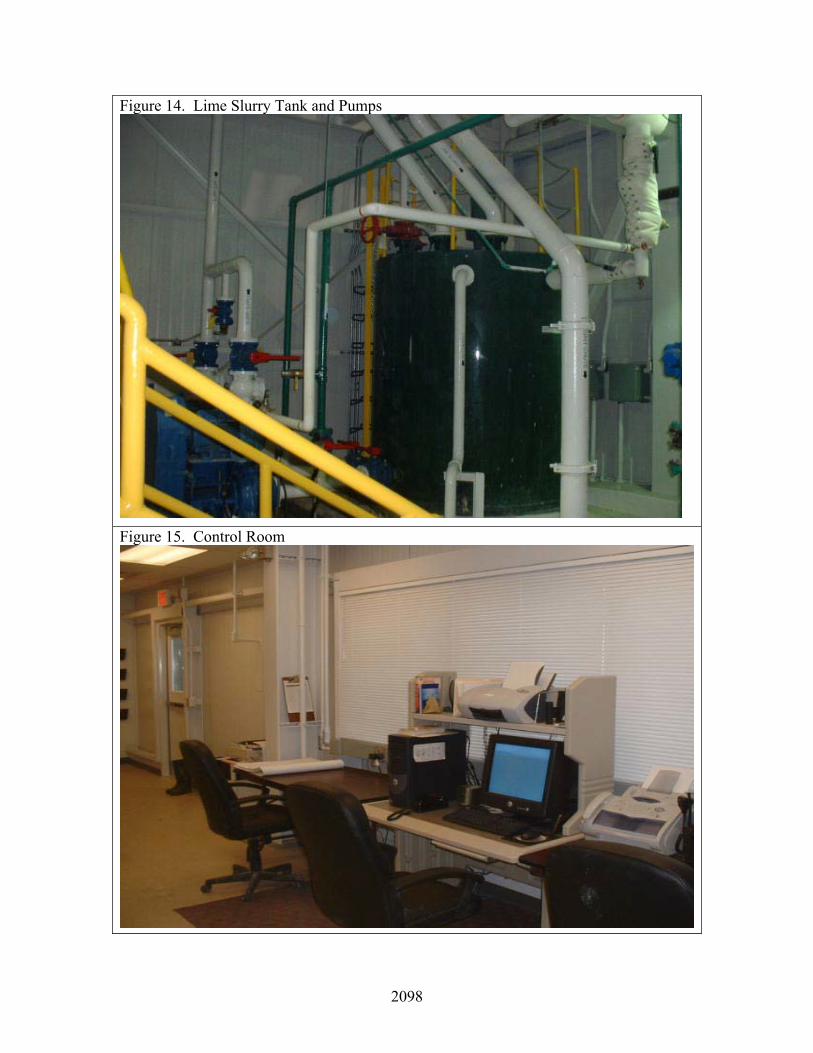
Figure 13. Limo Silo Cones and Slaker
2098
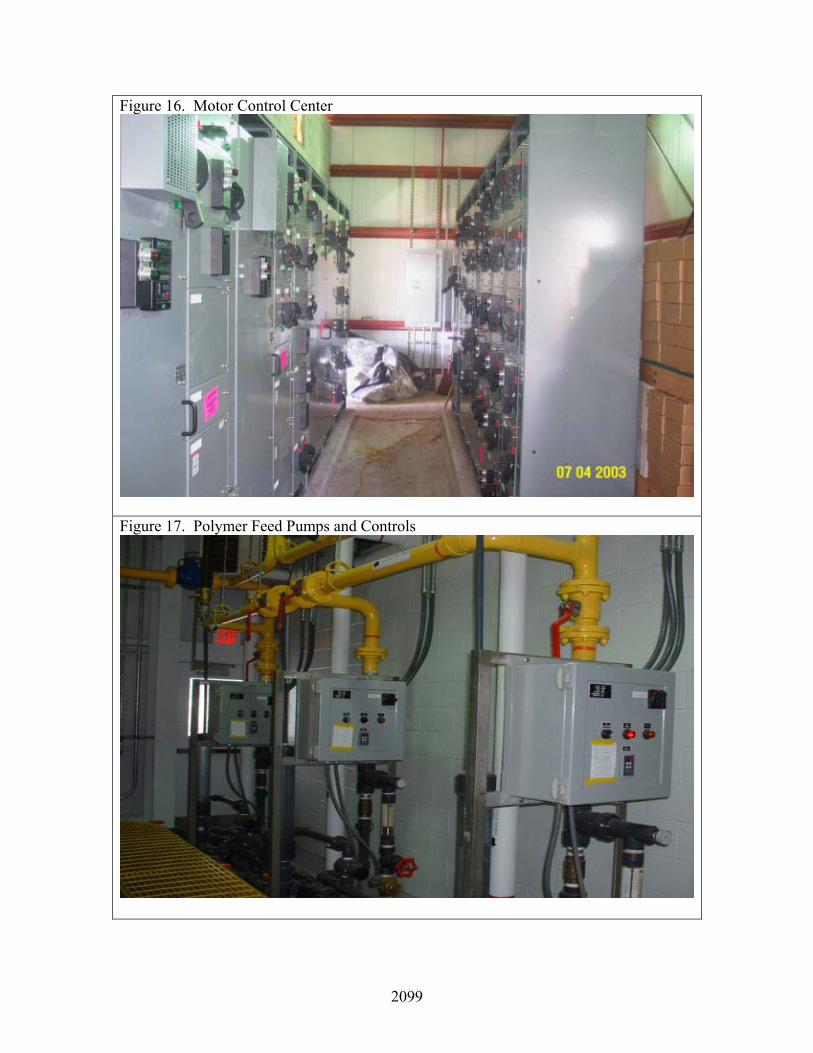
Figure 14. Lime Slurry Tank and Pumps
Figure 15. Control Room
2099
Figure 16. Motor Control Center
Figure 17. Polymer Feed Pumps and Controls
2100
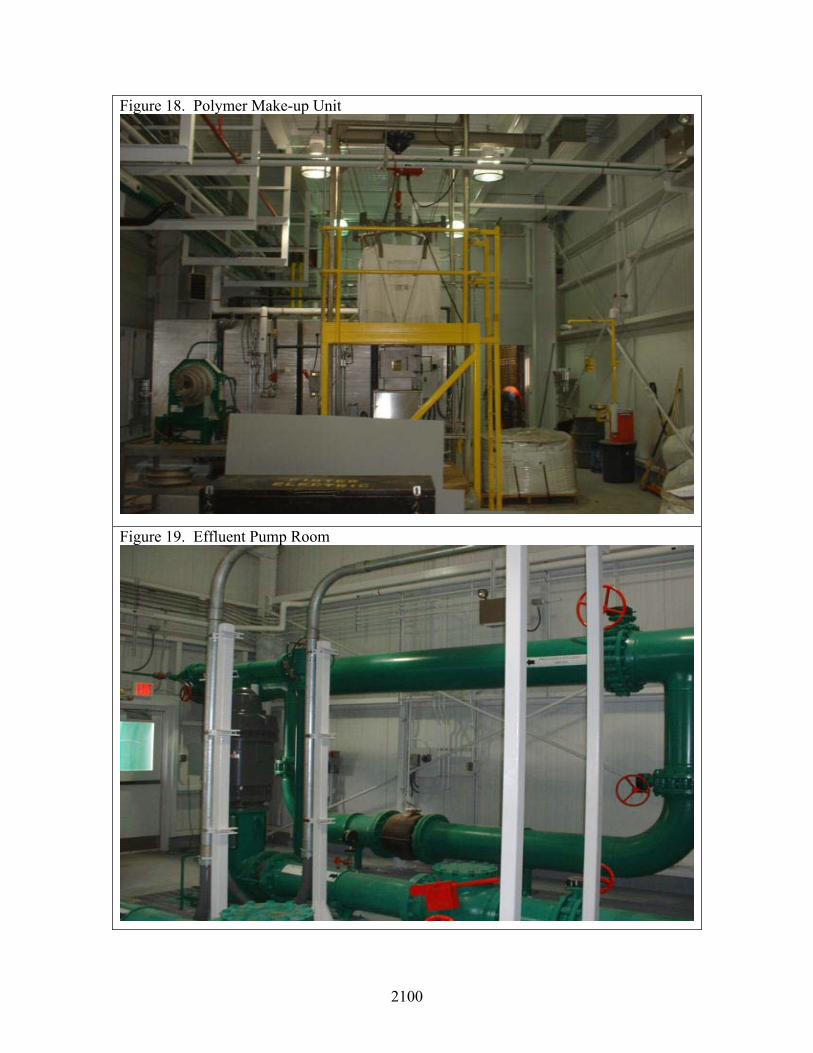
Figure 18. Polymer Make-up Unit
Figure 19. Effluent Pump Room
2101
Performance Testing Procedure
Following completion of an extensive start-up and commissioning protocol beginning the
week of November 2, 2003, the USFilter operations team began performance testing of the
Horseshoe Bend Wastewater Treatment Facility on December 5, 2003. The test was conducted
to verify that that the plant could produce effluent water meeting the Interim Standards as
outlined in the Statement of Work to Consent Decree for Mine Flooding OU. The performance
was demonstrated during a 72-hour continuous test during which data was collected from
installed inline instrumentation. The data was collected every six hours during the 72-hour run
and grab samples were collected for chemical analysis of the influent and effluent water. The
following is a summary of the Performance Test Results and Conditions:
• The influent water flow averaged 1211 GPM.
• The effluent water quality complied with the expected Interim Standards with the
exception of pH. The set-point limit of the pH was raised in order to meet the cadmium
limits.
• Sludge samples were taken to determine the percent solids and total sludge flow going
into the Berkeley Pit.
• USFilter and operating personnel used the HMI system to monitor the treatment facility
process and to make set-point changes, equipment operation changes, and control
changes as necessary to operate the facility.
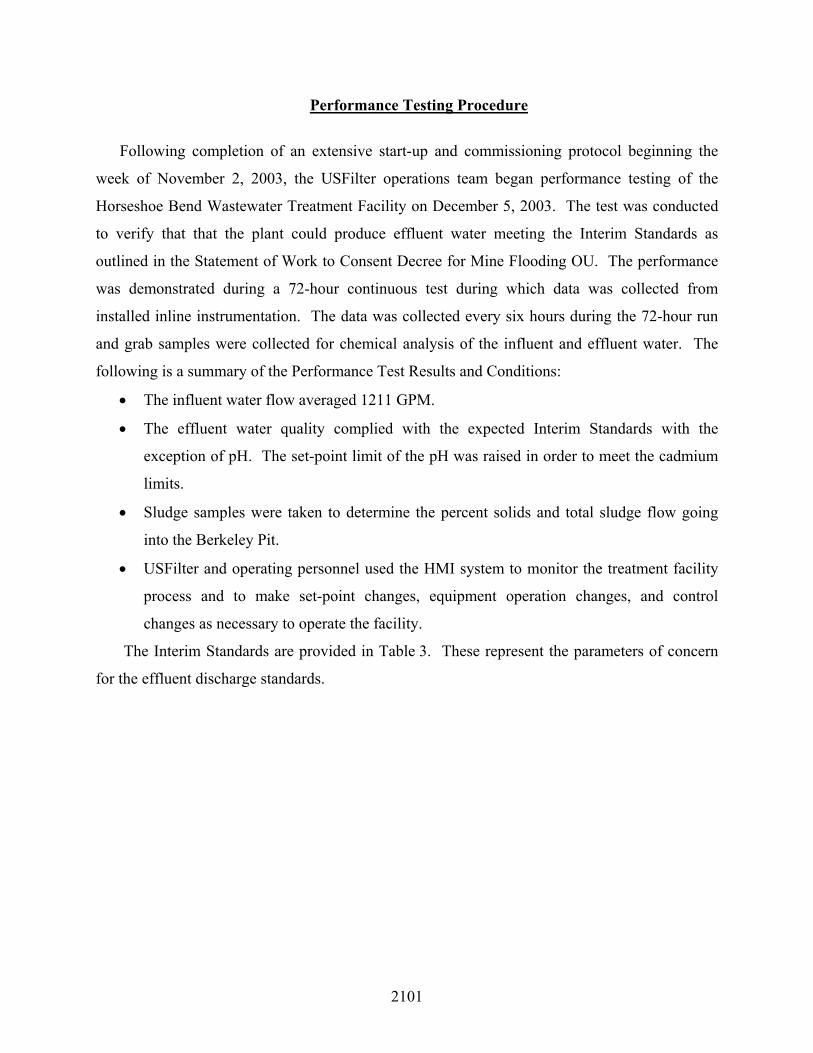
The Interim Standards are provided in Table 3. These represent the parameters of concern
for the effluent discharge standards.
2102
Table 3. Interim Standards.
Parameter Average Monthly Limitation (mg/L)
Daily Maximum Limitation (mg/L)
As2 0.018 0.027 Cd4 0.011 0.022 Cu 0.0305 0.0516 Fe3 1.000 1.500 Pb 0.019 0.476 Hg 0.001 0.002 Zn4 0.388 0.653 pH 6.5 – 9.5 6.5 – 9.5 TSS 20 30
1 The standards for copper and lead are hardness dependent and these limitations are based on the WQB-7 numeric standard assuming a hardness of 400 mg/L. Hardness shall be measured in the discharge and limitations adjusted for each sample.
2 Human health standard from WQB-7. 3 Chronic aquatic life standard from WQB-7. 4 The interim standards for cadmium and zinc are derived from pilot studies and represent a
maximum monthly average and daily concentration limit that may occur during shakedown operations as experience is gained with operation of the treatment system.
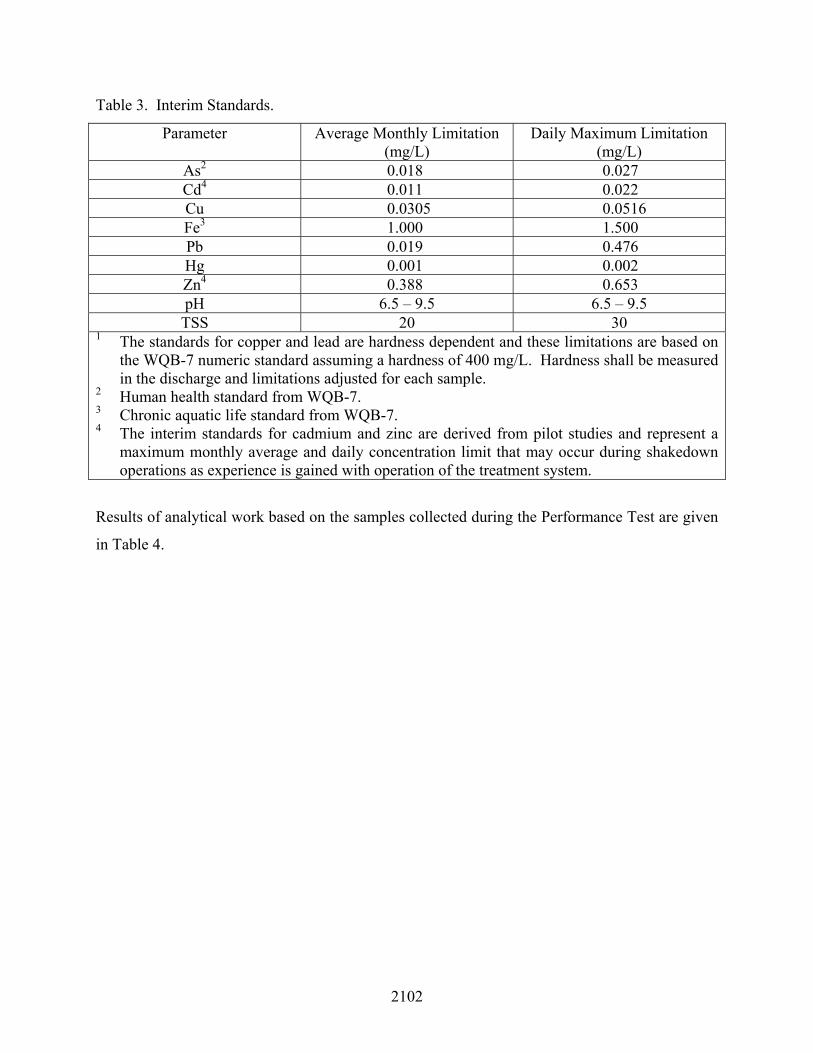
Results of analytical work based on the samples collected during the Performance Test are given
in Table 4.
2103
Table 4. Laboratory test results from performance test.
Parameter
Influent Sample 12/6/03 700 hrs
Effluent Sample 12/6/03 1300 hrs
Influent Sample 12/7/03 711 hrs
Effluent Sample 12/7/03 1300 hrs
Influent Sampler 12/8/03 846 hrs
Effluent Sample 12/8/03 1300 hrs
IDL
Arsenic .0249 .0005 U .0277 .0005 U .0263 .00061 .0005 Cadmium .910 .0017 .990 .0019 1.053 .0018 .0001 Copper 49.10 .0067 49.40 .0097 48.50 .0092 .0014
Iron 153.0 .0501 156.0 .0571 147.0 .0505 .009 Lead .0188 .0001 U .0197 .0001 U .0203 .0001 U .0001
Mercury .00011 U .00011 U .00011 U .00011 U .00011 U .00011 U .00011 Zinc 158.0 .057 159.0 .0783 152.0 .064 .0067 pH
Laboratory 3.1 9.2 3.1 9.2 3.1 9.4 N/A
PH Field data
3.3 10.6 3.2 10.6 3.2 10.6 N/A
TSS 58.0 < 4 68.0 < 4 61.0 < 4 N/A Hardness 15800 2590 16000 2580 NR 2580 N/A Sulfates 2820 2250 2890 2200 2840 2230 N/A
Laboratory results converted from µg/l to mg/l. IDL: instrument detection limit U: analyte undetected NR: analyte not requested Hardness as mg/L CaCo3 Laboratory pH not temperature compensated Field data pH from Effluent pH meter AIT-16A
2104
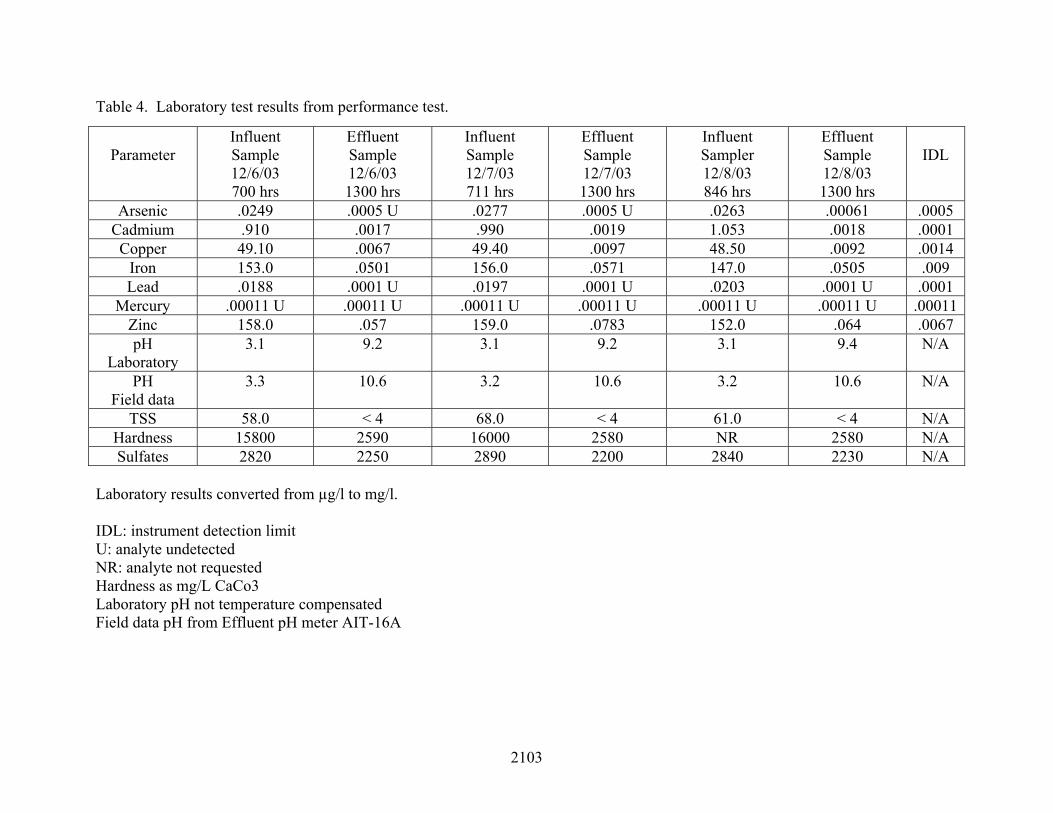
Sludge data is also presented as follows in Table 5.
Table 5. Sludge Data. First Stage.
Sample Date/Time
Dry Solids (% Solids)
Marcy Scale(% Solids)
Specific Gravity
Sludge Blowdown (GPD)
Flush Water* (GPD)
12/6/03 1300 hrs.
24 26 1.180 14,362 4,500
12/7/03 1905 hrs.
22 24 1.180 11,643 4,500
Second Stage.
Sample Date/Time
Dry Solids (% Solids)
Marcy Scale (% Solids)
Specific Gravity
Sludge Blowdown (GPD)
Flush Water* (GPD)
12/6/03 1300 hrs.
8 9 1.055 13,391 4,500
12/7/03 1905 hrs.
9 10 1.060 12,944 4,500
* Flush Water for each stage based on 300 GPM, four times per day for 1.5 min/per flush plus lime grit flush every four hours at 300 GPM for 1.5 minutes.
Following the presentation of the Performance Testing results, it was determined that another
72-hour Performance Test would be conducted to determine optimum results that can be
achieved when the facility produces an effluent < pH 9.5 at the final location in the plant proper
where pH is monitored and continuously recorded. This is at a sampling station located within
the effluent pump room. In addition, a final 72-hour Performance Test at pH 11.2 will then be
conducted to determine expected plant performance relative to the Final Standards.