Embed Size (px)
Citation preview
1
Lecture5:Measures of DispersionBy: Amani Albraikan
2
Measures of Dispersion
Synonym for variability Often called “spread” or “scatter” Indicator of consistency among a data
set Indicates how close data are clustered
about a measure of central tendency Commonly used measures of dispersion
◦ Range◦ Interquartile Range◦ Standard Deviation
4
Measures of dispersion are descriptive statistics that describe how similar a set of scores are to each other◦ The more similar the scores are to each other, the
lower the measure of dispersion will be◦ The less similar the scores are to each other, the
higher the measure of dispersion will be◦ In general, the more spread out a distribution is,
the larger the measure of dispersion will be
Definition
5
Measures of Dispersion
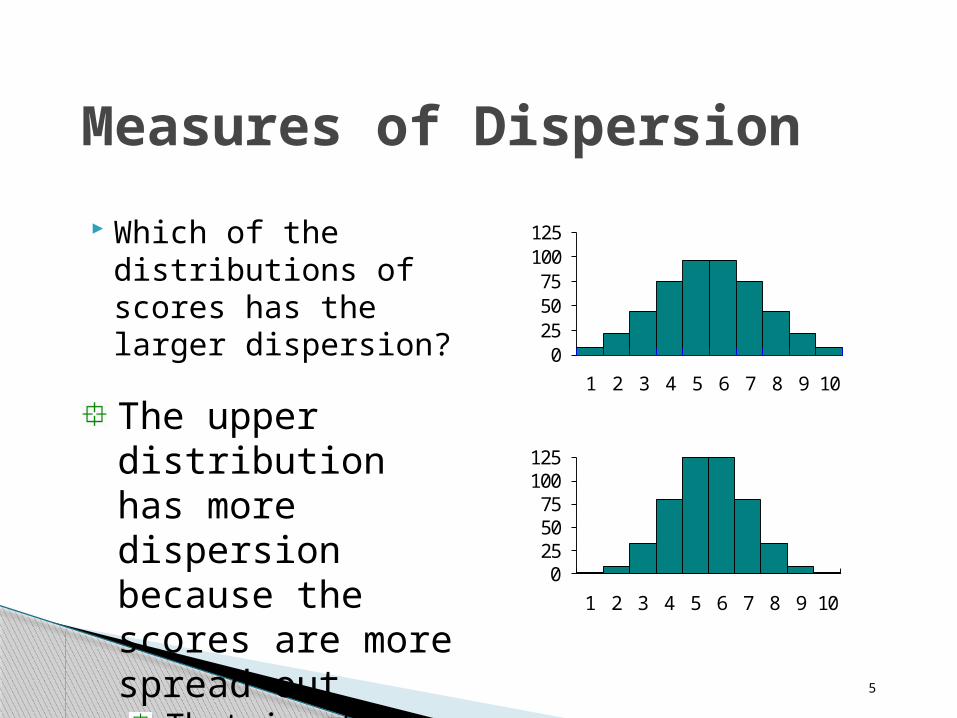
Which of the distributions of scores has the larger dispersion? 0
255075
100125
1 2 3 4 5 6 7 8 9 10
0255075
100125
1 2 3 4 5 6 7 8 9 10
The upper distribution has more dispersion because the scores are more spread out
That is, they are less similar to each other
6
There are three main measures of dispersion:◦ The range (المدى)◦ The semi-interquartile range (SIR) الربيعي المدى نصف◦ Variance / standard deviation( االنحراف و التباين
(المعياري
Measures of Dispersion
7
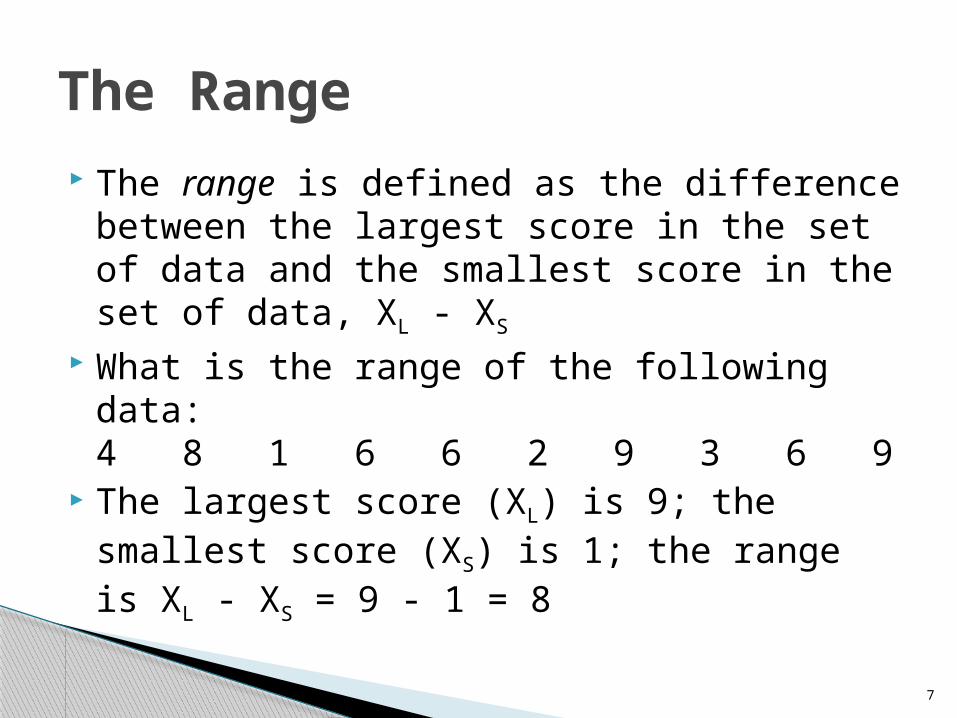
The range is defined as the difference between the largest score in the set of data and the smallest score in the set of data, XL - XS
What is the range of the following data:4 8 1 6 6 2 9 3 6 9
The largest score (XL) is 9; the smallest score (XS) is 1; the range is XL - XS = 9 - 1 = 8
The Range
8
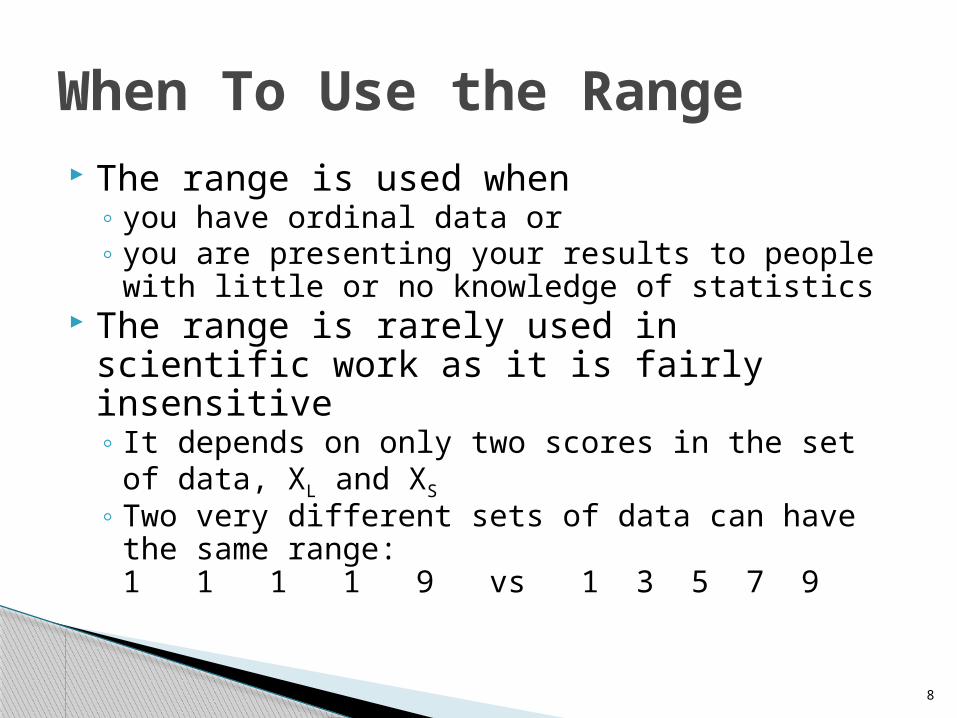
The range is used when◦ you have ordinal data or◦ you are presenting your results to people with
little or no knowledge of statistics The range is rarely used in scientific work as
it is fairly insensitive◦ It depends on only two scores in the set of data,
XL and XS
◦ Two very different sets of data can have the same range:1 1 1 1 9 vs 1 3 5 7 9
When To Use the Range
9
Used for Interval-Ratio Level Variables Difference between the Highest and Lowest
Values. Range= Maximum value – minimum value Often expressed as the full equation (i.e.,
There was a 19 point range, with a maximum score of 96 and a minimum of 77.)
10
Represents the width of the middle 50% of the data.
The 3rd quartile (Q3 ; 75th percentile) minus the 1st quartile (Q1; 25th percentile) equals the interquartile range (IQR).
Formula: IQR=Q3-Q1

11
Order the values of an interval-ratio level variable from lowest to highest.
Multiple N by .75 to find where Q3 is located and by .25 to find Q1. If Q3 and Q1 are not even numbers, find the values on either side and average them.
Subtract the value at Q1 from the one at Q3.
12
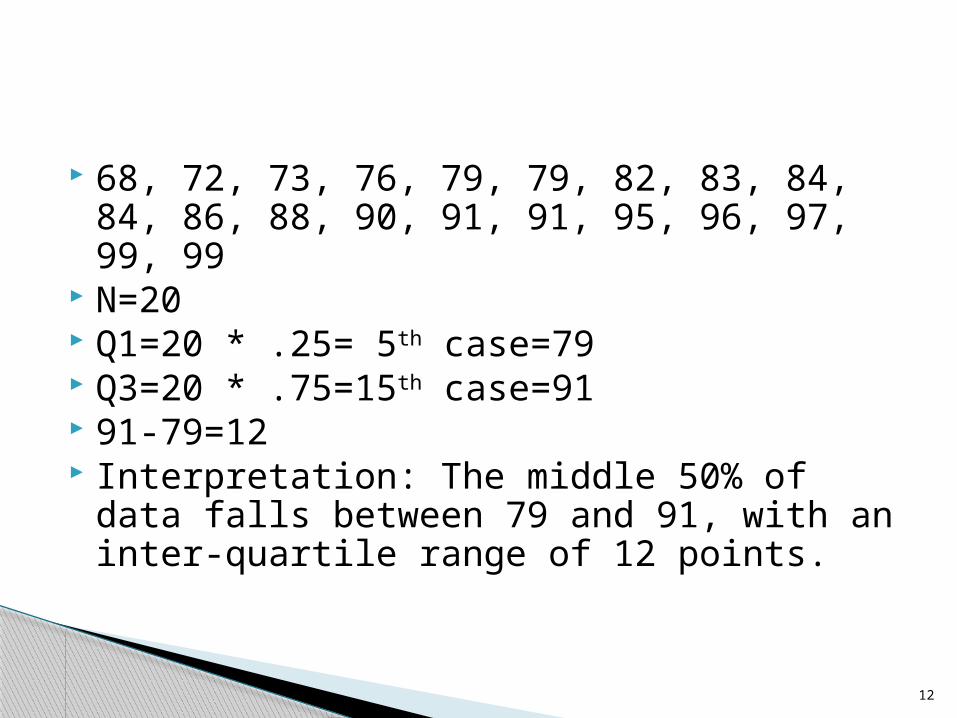
68, 72, 73, 76, 79, 79, 82, 83, 84, 84, 86, 88, 90, 91, 91, 95, 96, 97, 99, 99
N=20 Q1=20 * .25= 5th case=79 Q3=20 * .75=15th case=91 91-79=12 Interpretation: The middle 50% of data falls
between 79 and 91, with an inter-quartile range of 12 points.
13
The semi-interquartile range (or SIR) is defined as the difference of the first and third quartiles divided by two◦ The first quartile is the 25th percentile◦ The third quartile is the 75th percentile
SIR = (Q3 - Q1) / 2
The Semi-Interquartile Range
14
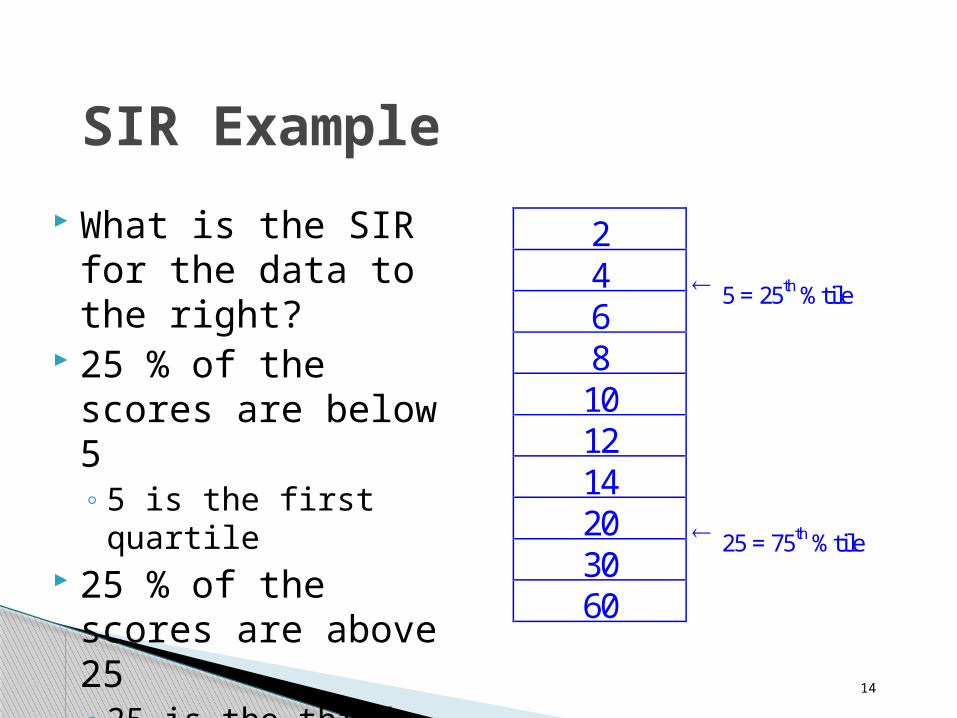
SIR Example
What is the SIR for the data to the right?
25 % of the scores are below 5◦ 5 is the first quartile
25 % of the scores are above 25◦ 25 is the third
quartile SIR = (Q3 - Q1) / 2 =
(25 - 5) / 2 = 10
246
5 = 25th %tile
81012142030
25 = 75th %tile
60
15
The SIR is often used with skewed data as it is insensitive to the extreme scores
When To Use the SIR
16
Variance: Used only for interval-ratio level variables. Assesses the average squared deviations of all values from the mean value.
Standard Deviation: The square root of the variance. Roughly estimated to be the average amount of deviation between each score and the mean.
Deviation from the mean
Variance Variance for a population is symbolized by:
2
Variance for a sample is s2
Formula:

18
Variance of a Sample
1N
XXs
2
2
s2 is the sample variance, X is a score, X is the sample mean, and N is the number of scores
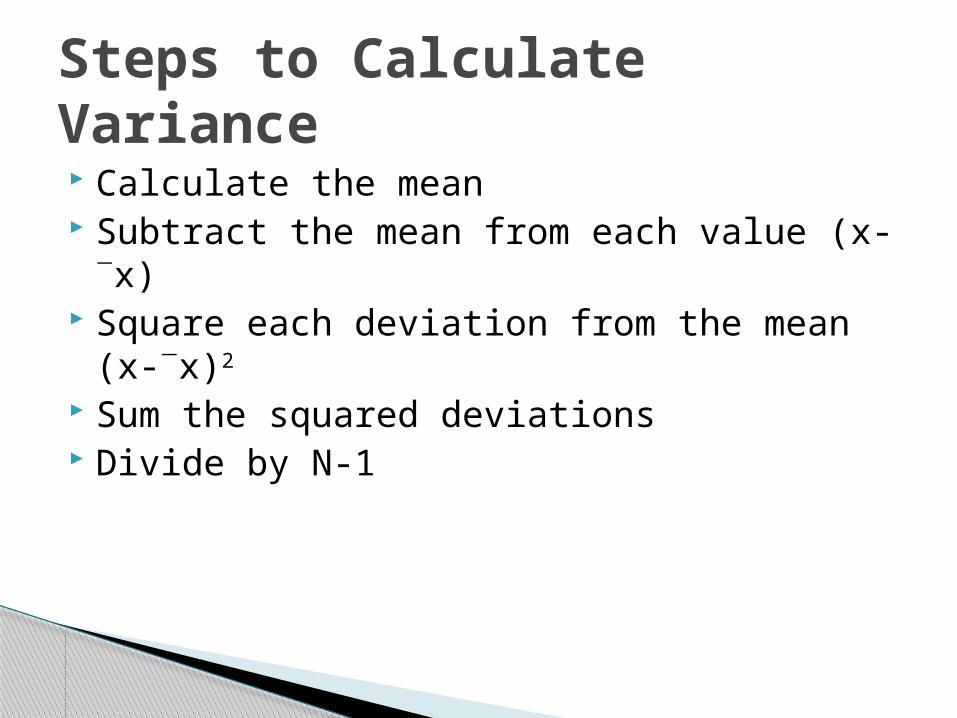
Steps to Calculate Variance Calculate the mean Subtract the mean from each value (x-x) Square each deviation from the mean (x-
x)2
Sum the squared deviations Divide by N-1
Variance Example
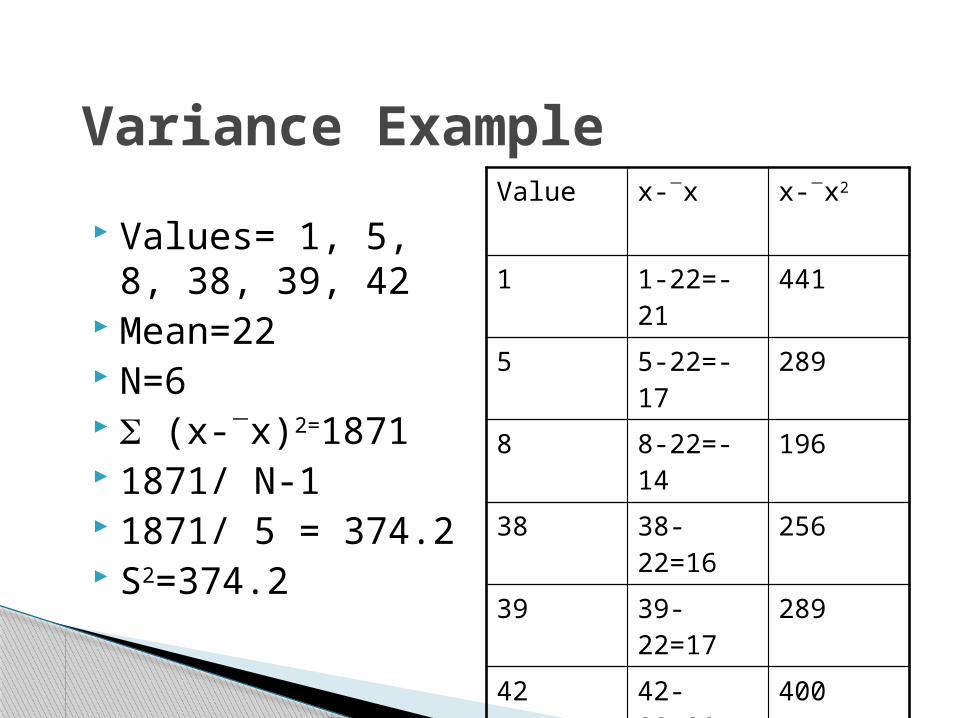
Values= 1, 5, 8, 38, 39, 42
Mean=22 N=6 (x-x)2=1871 1871/ N-1 1871/ 5 = 374.2 S2=374.2
Value x-x x-x2
1 1-22=-21 441
5 5-22=-17 289
8 8-22=-14 196
38 38-22=16 256
39 39-22=17 289
42 42-22=20 400
1871
Calculate the Variance and Standard Deviation Values:
◦ 12, 15, 18, 21, 22, 23, 26, 32
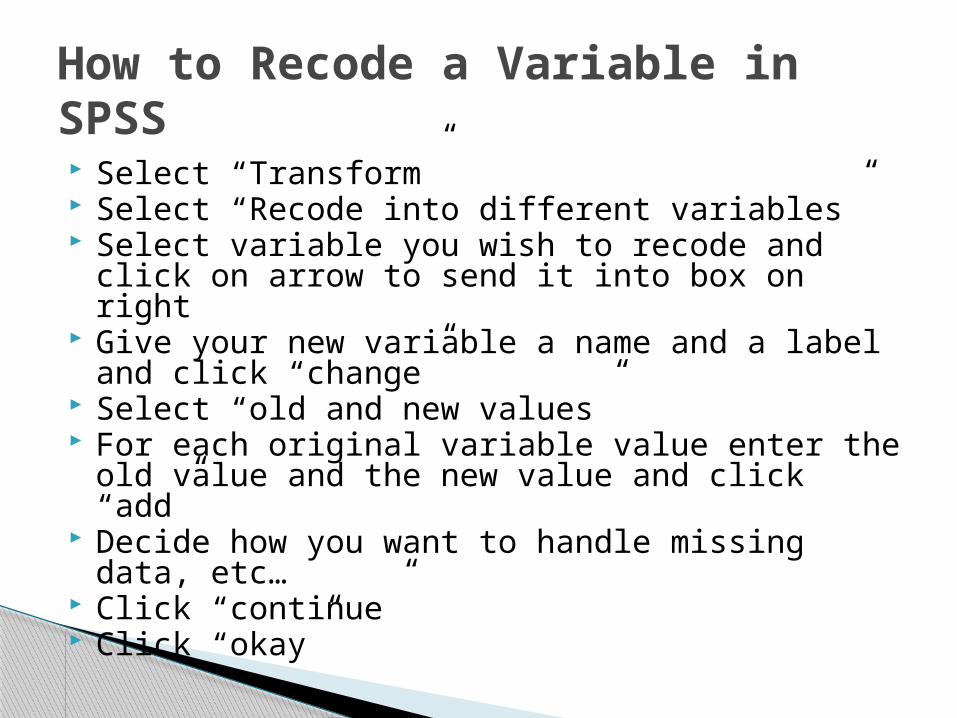
How to Recode a Variable in SPSS Select “Transform” Select “Recode into different variables” Select variable you wish to recode and click on
arrow to send it into box on right Give your new variable a name and a label and
click “change” Select “old and new values” For each original variable value enter the old
value and the new value and click “add” Decide how you want to handle missing data,
etc… Click “continue” Click “okay”
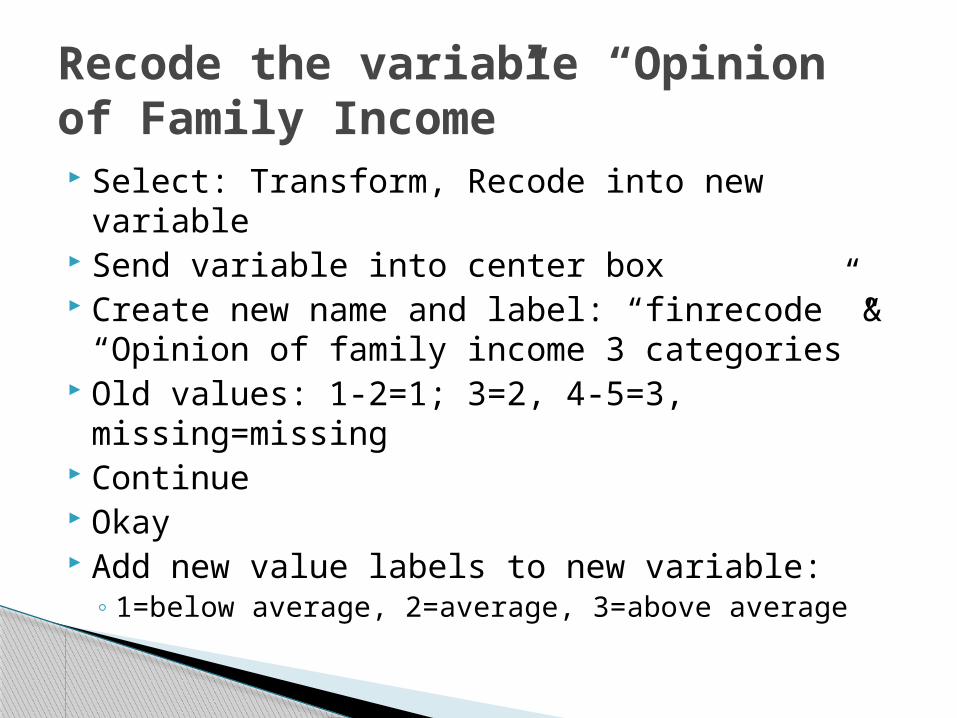
Recode the variable “Opinion of Family Income” Select: Transform, Recode into new variable Send variable into center box Create new name and label: “finrecode” &
“Opinion of family income 3 categories” Old values: 1-2=1; 3=2, 4-5=3,
missing=missing Continue Okay Add new value labels to new variable:
◦ 1=below average, 2=average, 3=above average
24
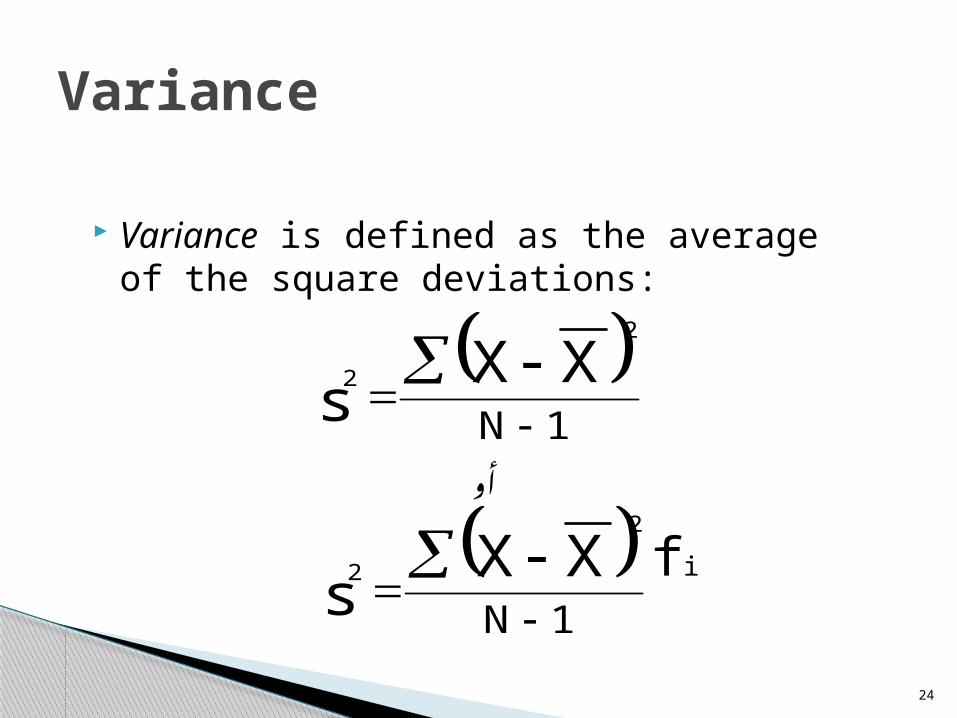
Variance is defined as the average of the square deviations:
Variance
1N
XXs
2
2
1N
XXs
2
2
أو
fi
25
First, it says to subtract the mean from each of the scores◦ This difference is called a deviate or a deviation
score◦ The deviate tells us how far a given score is from
the typical, or average, score◦ Thus, the deviate is a measure of dispersion for a
given score
What Does the Variance Formula Mean?
26
Variance is the mean of the squared deviation scores
The larger the variance is, the more the scores deviate, on average, away from the mean
The smaller the variance is, the less the scores deviate, on average, from the mean
What Does the Variance Formula Mean?
27
When the deviate scores are squared in variance, their unit of measure is squared as well◦ E.g. If people’s weights are measured in pounds,
then the variance of the weights would be expressed in pounds2 (or squared pounds)
Since squared units of measure are often awkward to deal with, the square root of variance is often used instead◦ The standard deviation is the square root of variance
Standard Deviation
28
Standard deviation = variance Variance = standard deviation2
Standard Deviation
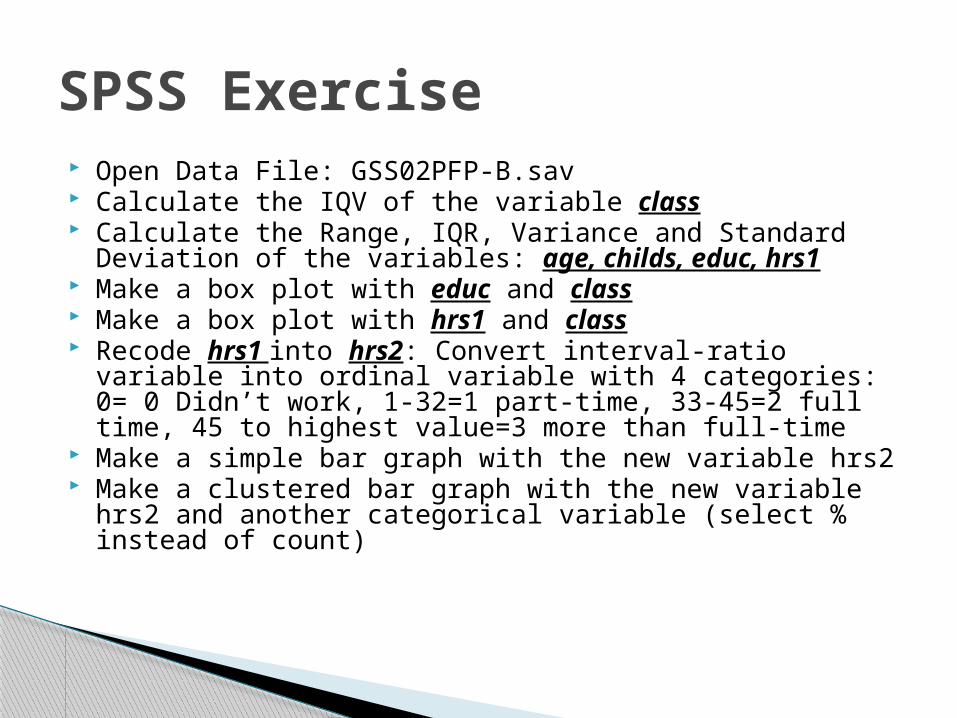
SPSS Exercise Open Data File: GSS02PFP-B.sav Calculate the IQV of the variable class Calculate the Range, IQR, Variance and Standard Deviation
of the variables: age, childs, educ, hrs1 Make a box plot with educ and class Make a box plot with hrs1 and class Recode hrs1 into hrs2: Convert interval-ratio variable into
ordinal variable with 4 categories: 0= 0 Didn’t work, 1-32=1 part-time, 33-45=2 full time, 45 to highest value=3 more than full-time
Make a simple bar graph with the new variable hrs2 Make a clustered bar graph with the new variable hrs2 and
another categorical variable (select % instead of count)