Embed Size (px)
Citation preview

By Brooks Mendell, Ph.D. and Amanda Hamsley Lang Forisk Consulting
Prepared for George Mason University’s EconoSTATS with foreword by
Wayne Winegarden, Ph.D. and Donald Rieck
June 2013
Economic Analysis of Forest Certification June 2013
2 | P a g e
Table of Contents Foreword .................................................................................................................................... 3
Executive Summary ................................................................................................................... 6
Introduction ................................................................................................................................ 8
Scenarios and Methods ............................................................................................................. 8
Case Studies: Description of Sample Timberland Ownerships ............................................... 9
Criteria ................................................................................................................................... 9
Scenarios ..............................................................................................................................10
Harvest Scheduling Models and Assumptions .......................................................................13
Economic Analysis Methods and Assumptions .....................................................................14
Operational Analysis .................................................................................................................18
Southern Case Study Results ...............................................................................................18
Pacific Northwest Case Study Results ..................................................................................20
Economic Analysis ....................................................................................................................23
Southern Case Study Results ...............................................................................................23
Pacific Northwest Case Study Results ..................................................................................23
Discussion and Conclusions .....................................................................................................25
Appendix A: Southern Case RMZ Widths ..................................................................................26
Appendix B: Habplan Software .................................................................................................27
Appendix C: Remsoft Software .................................................................................................28
Appendix D: Jobs Ratios and Assumptions ...............................................................................29

Economic Analysis of Forest Certification June 2013
3 | P a g e
Foreword By Wayne Winegarden, PhD, and Donald Rieck* With apologies to John Maynard Keynes, all too often policymakers, businesspeople, and consumers are unknowingly captive to some obscure economic trend or study. The need to accurately interpret these trends and studies is growing. However, a gap exists for key media and thought leaders – they lack the resources to quickly assess the practical applications of the academic research or put the various and sometimes conflicting economic data into perspective. The mission of EconoSTATS is to help bridge this widening gap through editorials, short white papers, and technical analyses that are created with a strict focus on the needs of key media and thought leaders. This technical EconoSTATS paper, on competing forestry certification programs, reflects secondary and primary research (through interviews with timberland owners, managers, and certification auditors and modeling of forest management scenarios). The purpose was to gain a better understanding of the impacts that forest certification programs have on the practical management of forests in the U.S.; as well as potential negative economic consequences resulting from the various certification programs. Effectively managing global forests, including U.S. forests, is a daunting task. And, the stakes are high. Poorly applied policies could incent excessive forest degradation. Alternatively, they could create problems of unemployment and declining incomes. In the worst of both worlds, poorly applied policies could simultaneously injure the environment and create significant economic harm. Competitive markets provide consumers more choices of high quality goods and services at lower prices than under a monopoly, and the certification marketplace is no exception. Competitive forestry certification programs are uniquely qualified to balance competing interests and establish optimal regulatory practices. Of course, striking the optimal balance requires reliable information on the alternative costs and benefits created by the different forest certification programs. Such a study needs to account for the varying needs across different forests and different regions. This paper, authored by Brooks Mendell, PhD, and Amanda Hamsley Lang, makes an important contribution by estimating the costs of the three commonly applied forestry certification programs in the U.S. – a base case corresponding with the American Tree Farm System (ATFS), the Forest Stewardship Council (FSC), and the Sustainable Forestry Initiative (SFI). Mendell and Lang examine the impacts for specific forests in the South (Arkansas/Louisiana) and the Pacific Northwest (Oregon) and then generalize their findings to provide insights specific to Arkansas and Oregon, which represent approximately 14 percent of the private forestlands and 10 percent of forest owners in the South and Pacific Northwest. All three forestry certification programs “advance responsible forestry management”. However, not all three programs effectively manage the potential economic consequences. In both regions, the FSC standards impose significantly higher costs and lead to significantly lower output (in the South the most significant negative economic impacts were associated with designating certain forests as “plantations”). Higher costs and lower output lead to lower economic activity including lost jobs, incomes, and tax revenues.

Economic Analysis of Forest Certification June 2013
4 | P a g e
The FSC standards also reduce operational flexibility creating additional economic costs that, while difficult to measure, are no less real. The long-term economic consequences are exemplified by the fate of the American automobile manufacturers during the 1970s and 1980s. Reduced operational flexibility makes it more difficult for any industry to adapt to changing global circumstances or consumer demands. Then there is the problem of FSC’s ambiguity, exemplified by its varying standards across the globe. Policy implementation works best when there is little room for confusion or interpretation. When policies are vague or open to interpretation by either the industry or the regulator/auditor, uncertainty arises. Regulatory uncertainty is the enemy of business growth – whether that business is manufacturing, finance, or forestry. As Mendell and Lang illustrate, the forestry certification programs need improvement with respect to clarity in their practical application, particularly the FSC program. While not discussed in the paper, the problem of uncertainty is amplified once the scope of the global certification marketplace is considered. FSC implements 38 different standards across the world, many of which are “interim,” or not fully developed. The requirements on businesses and landowners vary greatly across the 38 different standards even though all of these products are FSC certified. This lack of consistency leads to American foresters facing steep benchmarks, while some international landowners in countries like Brazil or Russia receiving FSC certification more easily. The U.S. FSC program’s excessive restrictions and higher costs are imposed with the intention of establishing better environmental stewardship. An unintentional consequence arises, however, because suppliers and consumers do not appear willing or able to afford the costs created by the U.S. FSC program. The result is lower U.S. FSC output. Of course, the lost domestic timber output can be fulfilled from other suppliers. Suppliers can avoid these prohibitive costs by turning to ATFS or SFI as better options for their land and financial situation. But, the added value of ATFS or SFI decreases if timber certified to these programs is not able to access “green” markets – such as LEED projects – or does not get stocked on store shelves, due to pressure from environmental activists who favor FSC. Since FSC is a worldwide program, with 90 percent of its land overseas, ultimately this leaves global FSC supplies to meet the unfilled domestic demand. Therefore, domestic policies that artificially inflate the demand for FSC timber while depressing its supply of U.S. product results in more imports of forest products from regions that lack the environmental safeguards taken for granted in the U.S. Such a policy not only creates economic losses in the U.S., as described above, many global FSC certified timber is produced in a less environmentally sustainable manner. Thus, the FSC program incents consumers to purchase timber from countries with less, or no, environmental standards. The result is greater environmental degradation from a global perspective. Thus, the FSC program imposes large economic costs and greater global environmental degradation unintentionally creating the worst of both worlds. And, due to the labeling requirements, consumers and businesses have no definitive way of knowing the actual conditions under which their FSC certified forest products were harvested. Balancing the competing needs of forests owners, consumers of timber products, and environmental concerns is complex. Competitive certification programs create a system where the different interests can consistently interact with one another and adjust to material economic or technological changes helping to ensure that the most efficient outcome results. The Mendell

Economic Analysis of Forest Certification June 2013
5 | P a g e
and Lang study makes an important contribution toward establishing the right forestry standards by illustrating the strengths and weaknesses across the three main forestry certification programs, and the potential economic losses of imposing an FSC monopoly in certain areas of the U.S. By demonstrating the benefits created by maintaining a competitive certification standard program, the Mendell and Lang study has broader applicability as well. Forestry management is not the only industry facing competing interests across diverse groups of constituents. A deeper understanding of how the forestry certification programs balance these risks can help these industries develop a dynamic and responsive regulatory system as well. As such, we also believe that this Mendell and Lang study provides an important case study that illustrates the benefits that can be gained through competitive regulatory structures. *Donald Rieck is Executive Director of the Statistical Assessment Service (STATS). Wayne Winegarden, PhD, is a Contributing Editor to EconoSTATS at George Mason University and a Senior Fellow at the Pacific Research Institute.
Economic Analysis of Forest Certification June 2013
6 | P a g e
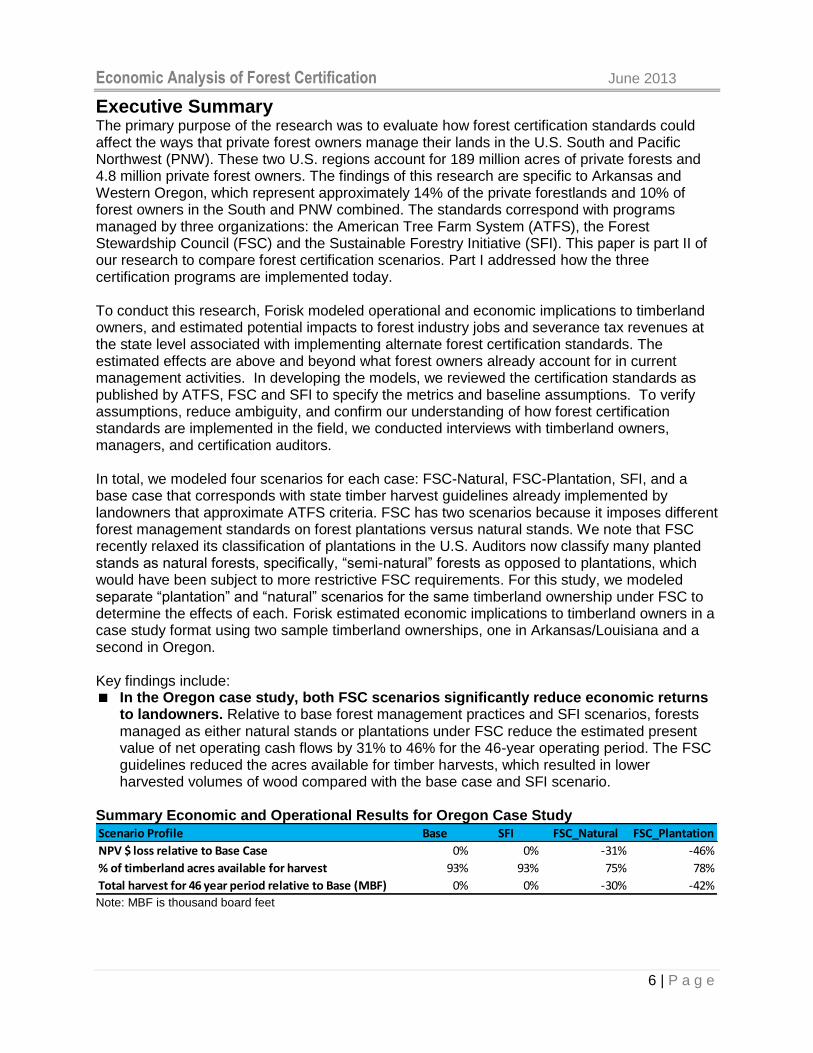
Executive Summary The primary purpose of the research was to evaluate how forest certification standards could affect the ways that private forest owners manage their lands in the U.S. South and Pacific Northwest (PNW). These two U.S. regions account for 189 million acres of private forests and 4.8 million private forest owners. The findings of this research are specific to Arkansas and Western Oregon, which represent approximately 14% of the private forestlands and 10% of forest owners in the South and PNW combined. The standards correspond with programs managed by three organizations: the American Tree Farm System (ATFS), the Forest Stewardship Council (FSC) and the Sustainable Forestry Initiative (SFI). This paper is part II of our research to compare forest certification scenarios. Part I addressed how the three certification programs are implemented today. To conduct this research, Forisk modeled operational and economic implications to timberland owners, and estimated potential impacts to forest industry jobs and severance tax revenues at the state level associated with implementing alternate forest certification standards. The estimated effects are above and beyond what forest owners already account for in current management activities. In developing the models, we reviewed the certification standards as published by ATFS, FSC and SFI to specify the metrics and baseline assumptions. To verify assumptions, reduce ambiguity, and confirm our understanding of how forest certification standards are implemented in the field, we conducted interviews with timberland owners, managers, and certification auditors. In total, we modeled four scenarios for each case: FSC-Natural, FSC-Plantation, SFI, and a base case that corresponds with state timber harvest guidelines already implemented by landowners that approximate ATFS criteria. FSC has two scenarios because it imposes different forest management standards on forest plantations versus natural stands. We note that FSC recently relaxed its classification of plantations in the U.S. Auditors now classify many planted stands as natural forests, specifically, “semi-natural” forests as opposed to plantations, which would have been subject to more restrictive FSC requirements. For this study, we modeled separate “plantation” and “natural” scenarios for the same timberland ownership under FSC to determine the effects of each. Forisk estimated economic implications to timberland owners in a case study format using two sample timberland ownerships, one in Arkansas/Louisiana and a second in Oregon. Key findings include: In the Oregon case study, both FSC scenarios significantly reduce economic returns
to landowners. Relative to base forest management practices and SFI scenarios, forests managed as either natural stands or plantations under FSC reduce the estimated present value of net operating cash flows by 31% to 46% for the 46-year operating period. The FSC guidelines reduced the acres available for timber harvests, which resulted in lower harvested volumes of wood compared with the base case and SFI scenario.
Summary Economic and Operational Results for Oregon Case Study
Note: MBF is thousand board feet
Scenario Profile Base SFI FSC_Natural FSC_Plantation
NPV $ loss relative to Base Case 0% 0% -31% -46%
% of timberland acres available for harvest 93% 93% 75% 78%
Total harvest for 46 year period relative to Base (MBF) 0% 0% -30% -42%
Economic Analysis of Forest Certification June 2013
7 | P a g e
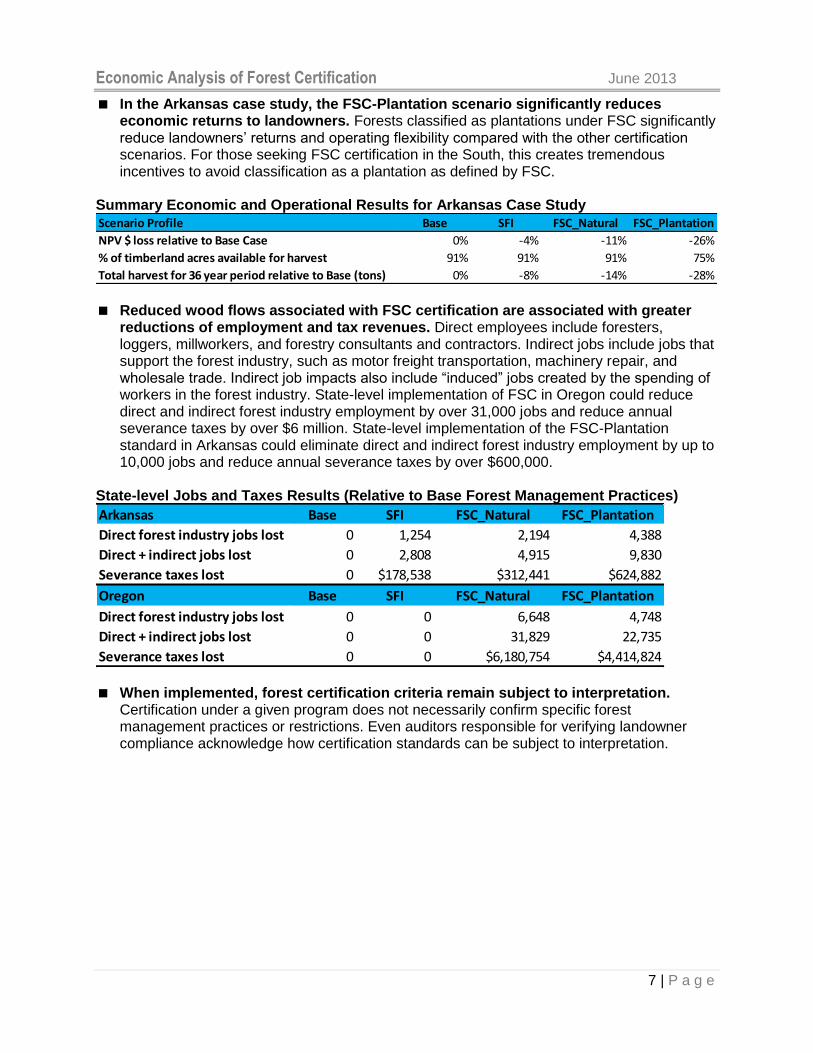
In the Arkansas case study, the FSC-Plantation scenario significantly reduces economic returns to landowners. Forests classified as plantations under FSC significantly reduce landowners’ returns and operating flexibility compared with the other certification scenarios. For those seeking FSC certification in the South, this creates tremendous incentives to avoid classification as a plantation as defined by FSC.
Summary Economic and Operational Results for Arkansas Case Study
Reduced wood flows associated with FSC certification are associated with greater
reductions of employment and tax revenues. Direct employees include foresters, loggers, millworkers, and forestry consultants and contractors. Indirect jobs include jobs that support the forest industry, such as motor freight transportation, machinery repair, and wholesale trade. Indirect job impacts also include “induced” jobs created by the spending of workers in the forest industry. State-level implementation of FSC in Oregon could reduce direct and indirect forest industry employment by over 31,000 jobs and reduce annual severance taxes by over $6 million. State-level implementation of the FSC-Plantation standard in Arkansas could eliminate direct and indirect forest industry employment by up to 10,000 jobs and reduce annual severance taxes by over $600,000.
State-level Jobs and Taxes Results (Relative to Base Forest Management Practices)
When implemented, forest certification criteria remain subject to interpretation.
Certification under a given program does not necessarily confirm specific forest management practices or restrictions. Even auditors responsible for verifying landowner compliance acknowledge how certification standards can be subject to interpretation.
Scenario Profile Base SFI FSC_Natural FSC_Plantation
NPV $ loss relative to Base Case 0% -4% -11% -26%
% of timberland acres available for harvest 91% 91% 91% 75%
Total harvest for 36 year period relative to Base (tons) 0% -8% -14% -28%
Arkansas Base SFI FSC_Natural FSC_Plantation
Direct forest industry jobs lost 0 1,254 2,194 4,388
Direct + indirect jobs lost 0 2,808 4,915 9,830
Severance taxes lost 0 $178,538 $312,441 $624,882
Oregon Base SFI FSC_Natural FSC_Plantation
Direct forest industry jobs lost 0 0 6,648 4,748
Direct + indirect jobs lost 0 0 31,829 22,735
Severance taxes lost 0 0 $6,180,754 $4,414,824

Economic Analysis of Forest Certification June 2013
8 | P a g e
Introduction Forisk researched the economic implications to timberland owners, forest industry employers and U.S. states in the South and Pacific Northwest (PNW) associated with implementing specific elements of alternate forest certification standards. These two U.S. regions account for 189 million acres of private forests and 4.8 million private forest owners. These standards correspond with programs managed by three organizations: the American Tree Farm System (ATFS), the Forest Stewardship Council (FSC) and the Sustainable Forestry Initiative (SFI). This effort responds to questions from three primary sources: 1. Forest owners and timberland investors: small and large forest owners ask “how could forest
certification programs affect my current forest management plans? How could they affect returns on investments I make?”
2. Natural resource professionals: foresters, wildlife biologists and auditors ask “how are certification standards implemented? How do they differ from current forest management practices and standards? How can we better understand operational and economic implications when communicating with our clients?”
3. Policy makers: legislators and economic development professionals ask “how might forest certification standards affect employment and tax revenues in our states?”
In addition, forest industry manufacturers, retailers that sell paper and forest products, and consumers that buy paper and forest products have interests in better understanding the implications, costs and benefits associated with forest certification programs in the U.S. This research models certification impacts for large blocks of timberland in the South (Arkansas/Louisiana) and the Pacific Northwest (Oregon). The findings are specific to and generalized for Arkansas and Oregon, which represent approximately 14% of the private forestlands and 10% of forest owners in the South and PNW combined. These scenarios comprise criteria related to clear cut size, land set-asides, adjacency (“green-up”) and streamside management zones. The standards reflect criteria from ATFS, FSC, and SFI. What effects do these alternate approaches have on the economics of forestland ownership and management? This paper is part II of our research to compare forest certification scenarios. Part I addressed how the three certification programs are implemented today.1 As we outlined the modeling parameters for the economic research, we found that programs were ambiguous, particularly FSC, with respect to certain certification criteria. To better understand how the programs implement standards on the ground and to confirm key assumptions, we conducted nearly two dozen interviews with timberland owners, managers, and auditors. We found that in the United States, forest owners and certification auditors have wide latitude to design and interpret management plans that broadly conform to responsible forest management and satisfy forest certification objectives. This paper presents the results of the operational and economic analysis to approximate and compare impacts of ATFS, SFI, and FSC on private forestland ownerships and state-level employment and tax measures.
Scenarios and Methods The overall objective of this research was to estimate the economic impacts of managing timberland under the ATFS, FSC and SFI certification systems in the U.S. South and Pacific Northwest. Two types of costs are associated with forest certification programs: 1) direct and
1 Mendell, B. and A. Lang. 2012. Comparing Forest Certification Standards in the U.S., Part I: How Are They Being
Implemented Today? Prepared for the American Consumer Institute. Available: www.theamericanconsumer.org

Economic Analysis of Forest Certification June 2013
9 | P a g e
indirect costs associated with becoming certified and auditing fees; and 2) direct and opportunity costs associated with changing operations to meet standard requirements. This research focuses on the economic costs from operating under forest certification programs relative to current baseline forest management standards and does not include an assessment of the costs associated with either becoming certified or with complying with current state-level best management or harvest practices. To evaluate the economic performance of timberland under different forest certification systems, we used a harvest scheduling approach to generate operational effects (harvestable volumes), and used these results to support an analysis of net operating cash flows. Following the analysis of forest certification on operations and financial returns at the ownership level, we estimated potential impacts on jobs and taxes at the state level for Arkansas and Oregon. Case Studies: Description of Sample Timberland Ownerships Modeling the effects of the four certification scenarios required large blocks of timberland with stand-level detail for harvest scheduling and map-related shapefiles for conducting spatial analysis associated with riparian management zones (RMZs) and adjacency issues. To conduct the analysis of scenarios across regions, we sought industry cooperators who shared detailed stand-level and spatial data for blocks of timberlands in the Pacific Northwest and U.S. South. The examples are portions of actual industrial timberland ownerships. South The sample timberland ownership in the South includes approximately 110,000 acres located in Arkansas and Louisiana. The ownership is predominantly planted loblolly pine. We note that growing conditions vary across Arkansas (i.e. the Ozarks). Pacific Coast The sample timberland ownership in the Pacific Coast region includes approximately 210,000 acres located in Western Oregon. The ownership is predominantly Douglas-fir and includes harvested volumes of hemlock (white wood) and cedar. Criteria This research developed scenarios based on the alternate forest certification programs as currently implemented in the U.S. South and Pacific Northwest. While ATFS, FSC and SFI cover a range of objectives and standards, the scenarios focus on forest management guidelines for criteria that are economically sensitive for landowners. For each scenario, we modeled the following elements: Riparian management zones (RMZs): buffers adjacent to streams in which vegetation is
maintained or managed to protect water quality. These buffers are called streamside management zones (SMZs) or riparian management zones (RMZs). The width of recommended or required RMZs is measured in feet and varies across certification programs and states in the U.S.
Retention: living vegetation, including trees, that is left after a harvest operation. Guidelines associated with forest retention vary across certification programs and U.S. states.
Permanent set-asides of land: a certain percentage of the total area in a given Forest Management Unit (FMU) that must be restored to and/or maintained as natural or semi-natural cover. This criterion varies across certification programs.
Harvest size: harvest size restrictions limit the area of harvest activity, as measured in acres. Recommendations and guidelines associated with harvest size area vary across certification programs and states in the U.S.

Economic Analysis of Forest Certification June 2013
10 | P a g e
“Green-up interval”: some forest certification schemes require a specific period of time between harvests of adjacent, or neighboring, stands. Referred to as the “green-up interval”, this guideline or requirement varies across programs and U.S. geographies.
We note that ATFS, FSC and SFI all provide chemical use guidelines. However, the costs and productivity impacts associated with restrictions on chemical use are not included in this analysis. Scenarios Using the criteria detailed above, scenarios were developed for the Pacific Northwest and for the U.S. South. We reviewed the certification standards as published by ATFS, FSC and SFI to specify the metrics for the modeling work. To verify assumptions, limit ambiguity, and confirm our understanding of how forest owners and managers implement standards in the field, we conducted interviews with timberland owners, managers, and certification auditors. Among the three certification programs, FSC uniquely distinguishes plantations from natural stands. This is important because FSC imposes different forest management standards for each related to permanent set-asides of land that cannot be harvested, how many live trees to leave after a harvest, and requirements related to adjacent stands and harvest areas. Under SFI and ATFS, the same criteria apply to all timberlands, regardless of how they were established. Recently, FSC relaxed its classification of plantations in the U.S. Auditors now classify many planted stands (traditionally thought of as plantations) as natural forests, specifically, “semi-natural” forests. Interviews with timberland owners and auditors confirmed this emerging practice of defining planted stands as “semi-natural” forests as opposed to plantations, which would have been subject to more restrictive FSC requirements. The ambiguity surrounding the classification of plantations is problematic for researchers. For this study, we modeled separate “plantation” and “natural” scenarios for the same timberland ownerships under FSC to determine the effects of each. ATFS is a “family forest” certification program designed specifically for smaller, non-industrial private timberland owners. Alternately, FSC and SFI are commonly applied to large, contiguous forest ownerships. Initiated in the 1940s, ATFS defines criteria more broadly than FSC and SFI. ATFS requires landowners to implement a management plan appropriate for the ownership size and intensity of forest management activities. For the criteria modeled in this research, ATFS broadly defaults to state BMPs. While the requirements impose costs and limitations on landowners in managing their forests, this study does not evaluate the costs to reach and sustain forest management at this level; rather we assume this level as the base case. Management of ownership sizes modeled in this study (100,000+ acres) have different management implications than typical non-industrial ATFS ownerships. For this reason, we did not specify an ATFS scenario. The “base” case approximates ATFS criteria for smaller ownerships (BMPs); however, we do not infer relative financial impacts of ownership under ATFS. We do reference ATFS throughout to confirm the relevance of specific criteria and the expectations for smaller landowners under this program. In sum, we modeled four scenarios for each region: FSC-Natural, FSC-Plantation, SFI, and a base case based on state BMPs. Table 1 details the scenarios for the U.S. South case. We highlight the following assumptions:

Economic Analysis of Forest Certification June 2013
11 | P a g e
Riparian management zones (RMZs): We assumed that there would be no harvesting activity in RMZs. The current landowner demarcated RMZs prior to the initiation of this research that exceeded the minimum state-level requirements for Arkansas and Louisiana. These RMZs included on-the-ground verification. We defaulted to these RMZs as the baseline for the Southern case as they reflected current practice and exceeded the minimum guidelines. See Appendix A for additional detail.
Retention: We lacked a reasonable basis to specify a parameter for retention across programs. FSC’s retention policy for plantations in the South is ambiguous; we did not include specific retention-related effects in the economic analysis. ATFS does not have a specific retention requirement, although it does require that forest management activities maintain or enhance habitat for threatened or endangered communities and species. SFI requires landowners to implement criteria to retain stand-level wildlife habitat elements, but does not specify exact criteria for doing so. Most landowners that manage timberland under SFI leave small patches of snags and other unmerchantable trees on site for wildlife in addition to RMZs and specific management plans for threatened and endangered species.
Clearcut size: FSC has non-binding guidelines for clearcut sizes for natural stands of 80-acre maximums and a 40-acre average. For plantations, FSC has a strict opening size limit of an 80-acre maximum size and 40-acre average. We modeled to the stated guideline, but allowed for a tolerance in the harvest model to account for some variance. In practice, our interviews indicated that some landowners in the South target 80 to 100-acres as an average clearcut size. SFI requires a maximum 120-acre average clearcut size, unless otherwise stipulated under state forest practices rules. In cases, landowners use 250 acres as a maximum. ATFS does not have a harvest size restriction.
Green-up interval: SFI has the most specific green-up policy in the U.S. South; neither ATFS nor FSC have clearly defined green-up requirements. For FSC, this applies for both plantations and natural stands. For FSC, we used two years, assuming that this would provide enough separation for adjacent stands to be considered separate harvest openings.
Table 1. Scenarios Modeled for the South Case Study
Note: Assume that clear cut and green up intervals managed as a “moving window” where an area adjacent to a clear cut may be harvested prior to green-up conditions, provided that the sum of the area is less than or equal to the maximum clear cut size. Assume 250 maximum clearcut size for SFI based on common practice in the South. *Landowner current practice was used as the baseline RMZ in the Southern scenarios. We used the landowner’s RMZs instead of state BMPs because the landowner’s RMZs were larger than the minimum state BMPs for Arkansas and Louisiana. Please see Appendix A for additional detail.
Table 2 details the scenarios for the Pacific Northwest case. We highlight the following assumptions:
SPATIAL/HARVEST FSC – Plantation FSC – Natural SFI Base
Width of RMZ*
Landowner current
practice + set-asides
(425 ft buffer on
stream)
Landowner current
practice
Landowner current
practice
Landowner current
practice
Retention N/AAssume no
measurable impact
Assume no
measurable impact
Assume no
measurable impact
Permanent land set-
aside
25% of FMU ac
(including RMZ)N/A
None
(outside RMZ)
None
(outside RMZ)
Clear cut size 40 acre average 40 acre average 120 acre average None
80 acre max 80 acre max 250 acre max
1 acre min 1 acre min 1 acre min
Green-up interval 2 years 2 years 3 years None

Economic Analysis of Forest Certification June 2013
12 | P a g e
Riparian management zones (RMZs): FSC in the Pacific Northwest has specific parameters for RMZ widths. SFI and ATFS default to rules adopted under Oregon’s Forest Practices Act regarding RMZ widths (Table 3). We assumed no harvesting activity within RMZs. We delineated RMZs in the shapefiles based on the specific requirements of FSC for the two FSC scenarios, and used Oregon’s rules for the Base and SFI scenarios.
Retention: For natural stands, FSC requires landowners to retain at least 10% to 30% of the basal area of the stand after harvest. FSC guidelines state that if timberland owners manage on rotation ages that approach culmination of mean annual increment (CMAI), then they may leave retention in the lower end of the range. Since CMAI ranges from 50 to 80 years, we used a growth and yield model to specify an age for our timberland case. The model found that 55 years approximated the CMAI (ranging from 47 to 57 depending on the site index). We modeled 10% retention with a 55-year rotation age for the FSC-Natural case. For plantations, FSC requires a 25% land set-aside. Oregon’s forest practices rules require that an average of at least two snags or two green trees per acre and two downed logs per acre be left after harvest (if the harvest exceeds 25 acres). We assumed that ATFS and SFI landowners would manage to the Oregon rule requirements. We thus assumed no measurable impact from the Oregon retention requirements.
We explored the issue of retention and CMAI during interviews with multiple timberland owners and certification auditors. One timberland manager in the Pacific Northwest indicated that “managing to the minimum standard is rarely sufficient.” This firm applies a 15% retention rule. Issues that arise from implementing retention guidelines in the Pacific Northwest under FSC include the uncertainty associated with establishing the retention percentage and the exclusion or the double-counting of RMZs, which can count towards retention in cases. For standard RMZs that border harvest units, the retention is in addition to the RMZ (in other words, the acres within the RMZ do not count towards the 15% retention). If an RMZ has outcroppings into a stand, or islands of trees, they can be included as part of the retention area. In this study, we assumed 10% of the volume retained completely in addition to SMZs. Although we model at the low end of the retention range, we do not account for outcroppings or islands of trees and avoid the issue of double-counting, which is implemented inconsistently. Table 2. Scenarios Modeled for the Pacific Northwest Case Study
Note: Assumed that clear cut and green up intervals managed as a “moving window” where an area adjacent to a clear cut may be harvested prior to green-up conditions, provided that the sum of the area is less than or equal to the maximum clear cut size. For green up interval, scenarios assume that adjacency is managed as described in the
SPATIAL FSC – Plantation FSC – Natural SFI Base
Fish bearing: 150 ft
Perennial: 100 ft
Intermittent (aquatic
species): 75 ft
Oregon BMP (see
Table 3)
Oregon BMP (see
Table 3)
Intermittent (no
aquatic species): 0
Retention N/A
Harvest age 55 years
with 10% basal area
(in addition to RMZ)
Assume no
measurable impact
Assume no
measurable impact
Permanent land set-
aside
25% of FMU acres
(including RMZ)N/A
None
(outside RMZ)
None
(outside RMZ)
40 acre average 40 acre average
80 acre max 60 acre max
Greenup interval 7 years 4 years 4 years 4 years
Width of RMZ Same as plantation
Clear cut size120 acre max; 5 acre
min
120 acre max; 5 acre
min

Economic Analysis of Forest Certification June 2013
13 | P a g e
Oregon forest practices rules. The rules state that no clear cut should be within 300 feet of a previous clear cut unless the total acreage is less than the maximum clear cut size or the stand meets green up requirements.
Table 3. Oregon State BMP for Riparian Management Zone (RMZ) Width
Source: Oregon Forest Practices Act
Harvest Scheduling Models and Assumptions We used two software programs to model the certification scenarios. Harvest Scheduling Methods: South To develop harvest schedules with the parameters from the four scenarios in the South (Table 1), we used the harvest scheduling model Habplan, developed by the National Council for Air and Stream Improvement (NCASI). (See Appendix B for more information on Habplan.) We ran the RMZ parameters (RMZ width and set-asides) in conjunction with the harvest parameters (clearcut size and green-up interval) to generate four scenarios in Habplan. The outputs show the combined effects of RMZ, set-asides, clearcut size and adjacency parameters. In addition to the scenario parameters in Table 1, we made several Habplan-specific assumptions based on a planning period of 36 years. Habplan can use net present value (NPV) goals and harvest size requirements to generate
harvest flows. Habplan allows users to enter NPV targets (0-100%), in which 100% is maximum NPV. Likewise, Habplan allows users to enter tolerances around the harvest size maximum to allow for larger harvest sizes. We opted to generate harvest schedules that maximized NPV (100%). As a result, Habplan was allowed a tolerance around the maximum clearcut size in the Habplan model that required 99% of the stands to satisfy the parameter detailed in the scenario. We felt this better reflects how private timberland owners in the U.S. would attempt to operate. Also, FSC implements non-binding clearcut size guidelines in natural forests and SFI only has an average maximum clearcut size.
We imposed “even flow” constraints on harvest volume to better approximate actual timberland owner and manager objectives and operations. This limited the maximum variance in pine sawtimber volumes to plus or minus 50,000 tons in succeeding years.
We assumed that all harvested stands were reforested. We assumed that conversion to the certification scheme occurred in 2013; activities tied to
harvests prior to 2013 were the same for all scenarios. We re-formatted the shapefile to divide large stands into smaller blocks so that the harvest
schedule model could select smaller stand sizes to better satisfy the FSC guidelines. We used existing roads and streams to break up the stands.
While the model has the capacity to choose from nearly 100 harvest regimes for each stand, the primary management regimes for the pine stands included the following assumptions:
o Fertilization: age 14; o First thinning: between ages 13 and 15; o Second thinning: six years after first thinning; o Final harvest: age 26
All pine volumes harvested within the 36 year timeframe are included in this analysis.
Size Type F (Fish) Type D (Domestic, Non-fish) Type N (Other)
Large 100 feet 70 feet 70 feet
Medium 70 feet 50 feet 50 feet
Small 50 feet 20 feet 0 feet

Economic Analysis of Forest Certification June 2013
14 | P a g e
The FSC-Plantation scenario is the FSC-Natural scenario with additional set-aside acres. We modified the Habplan output for the FSC-Natural scenario by removing acres and volumes from the additional set-asides in the FSC-Plantation scenario. Harvest Scheduling Methods: Pacific Northwest Forisk retained Remsoft to develop the optimization models for the Pacific Northwest scenarios and generate the harvest scheduling results. Headquartered in New Brunswick, Canada, Remsoft provides analytical optimization modeling and spatial planning software to public agencies, forest products companies, timber investment management organizations (TIMOs) and forestry consulting companies. Remsoft developed models using its Woodstock Modeling Platform. (See Appendix C for more information on Remsoft and Woodstock.) For the Pacific Northwest scenarios, parameters for the base case and SFI parameters were identical as they both defaulted to Oregon’s forest practices rules. As a result, Remsoft modeled three scenarios: FSC-Plantation, FSC-Natural, and SFI/Base. In addition to the scenario parameters in Tables 2 and 3, several assessments and assumptions were made based on a 45-year planning period. We removed the RMZ buffers from each shapefile. To do this, we first buffered the streams
in the shapefile based on the RMZ widths in Tables 2 and 3 with a GIS program. For the FSC-Plantation case, we performed an iterative analysis to determine the required
set-aside acres to meet the requirement of 25% of the FMU in set-aside (based on productive acres). We removed the buffers from the stand shapefile and re-formatted the shapefile to divide the stands into smaller blocks so that the harvest schedule model could pick from smaller stand sizes to meet the FSC criteria.
We ran the RMZ parameters (RMZ width and set-asides) in conjunction with the harvest parameters (clearcut size and greenup interval) to generate the harvest schedule results for the four scenarios outlined in Tables 2 and 3. Outputs reflect the combined effects of RMZ requirements, set-asides, clearcut size, and adjacency parameters.
We imposed harvest flow constraints through requiring “non-declining” yields of plus or minus 5% on an annual basis for Douglas-fir and hemlock sawlogs (domestic and export).
We assumed that all harvested stands were reforested. The management regimes for the Douglas-fir stands included the following assumptions:
o Fertilization: no new fertilizations; stands fertilized previously utilized a separate yield table.
o Final harvest: minimum clearcut age depended on species and site for scenarios not requiring the 55-year CMAI standard:
Douglas-fir high sites: 40-year minimum age; Douglas-fir medium sites: 43-year minimum age; Douglas-fir low sites: 47-year minimum age; and Other species/sites: 40-year minimum age.
Only Douglas-fir, hemlock and cedar volumes harvested within the 45-year timeframe are included in this analysis.
Economic Analysis Methods and Assumptions We specified silviculture costs and log values to evaluate net cash flow and NPV impacts across scenarios and regions for the modeled certification scenarios. NPV analysis focused on the present value of the net operating cash flows, which included revenues from selling logs and costs associated with forest management. Tables 4 and 5 summarize the cost and price assumptions included in the economic analysis of the U.S. South case.

Economic Analysis of Forest Certification June 2013
15 | P a g e
Table 4. Cost Assumptions for U.S. South Case
We made two subjective price assumptions for “in-between” product categories. For small sawtimber, the assumed price reflects a long-term average of the larger pine sawtimber and smaller pine chip-n-saw product categories. For pine topwood, we assumed a market price of 50% of the long-term average of tree-length pine pulpwood. Table 5. Price and Discount Rate Assumptions for U.S. South Case
Tables 6 and 7 summarize the cost and price assumptions included in the economic analysis of the Pacific Northwest case. Cost assumptions for the Oregon case include logging and hauling because log prices are quoted on a delivered basis. We assumed logging and hauling costs in order to estimate the “net” cash flows and returns to the landowner. Harvesting cost is measured in dollars per thousand board foot ($/MBF). Table 6. Cost Assumptions for Pacific Northwest Case
For the chip-n-saw (CNS) product class for both Douglas-fir and hemlock, we allocated the harvested volume to domestic sawlog and fiber categories respectively.
Activity Cost ($/acre) Notes
Planting, including seedlings $75
Chemical site prep $50 All acres
Herbaceous weed control $30
Shear-bed $155 80% acres
Fertilizer $140 Two applications
Product/Item Assumption Units Notes
Pine sawtimber (PST) $32.63 $/ton 10-year Arkansas average, Timber Mart-South
Small sawtimber $25.94 $/ton 10-year average for PST and CNS
Chip-n-saw (CNS) $19.25 $/ton 10-year Arkansas average, Timber Mart-South
Pine pulpwood $8.01 $/ton 10-year Arkansas average, Timber Mart-South
Topwood $4.01 $/ton 50% of 10-year average for pine pulpwood
Discount rate (real) 6% %
Activity Cost ($/acre) Notes
Planting/seedlings/site prep $350 Bareground
Harvesting, includes hauling $180 per MBF

Economic Analysis of Forest Certification June 2013
16 | P a g e
Table 7. Price and Discount Rate Assumptions for Pacific Northwest Case
In addition to an economic analysis of forestland performance, we assessed the impact on employment and select sources of state-based tax revenue associated with each of the forest certification scenarios. Jobs Impact Assumptions We evaluated direct and indirect forest industry job impacts in this research. Direct employees include foresters, loggers, millworkers, and forestry consultants and contractors. Indirect jobs include jobs that support the forest industry, such as motor freight transportation, machinery repair, and wholesale trade. Indirect job impacts in this research also include “induced” jobs created by the spending of workers in the forest industry. Forest industry jobs are directly associated with wood flows; if landowners harvest fewer trees and less wood volume over time, then industry jobs decline as fewer foresters, loggers, millworkers, and consultants are needed to service the industry. This analysis estimates potential job losses by applying and generalizing the results of the individual case studies to the state level. We ask “how might employment levels change if all wood-producing timberland in a state were certified under SFI, FSC as natural stands, and FSC as plantations relative to the base case?” We note that this analysis directly considered job losses that were a function of reduced wood flows. We did not directly consider job impacts of the certification programs themselves, or potential jobs associated with maintaining certification programs, becoming certified or increasing forest certification services. In reality, actual job losses during a period of harvest decline are lower than estimated using static job ratios per annual harvest volumes. This occurs because mills can increase imports of wood raw materials from neighboring states or use more recycled material (in cases), entrepreneurs initiate new services or modify current activities, and manufacturers adjust their processes. While our analysis implied job losses at a certain level, we applied a job rate “impact” of 50% to account for adjustments made by employers, manufacturers, importers/exporters and industry entrepreneurs during periods of decreased harvest activity. This, potentially, includes jobs generated by the forest certification sector. While potentially conservative, the 50% impact comes from evaluating how job ratios changed over time from 1992 through 2002 in the Pacific Northwest during a period of significant harvest decreases. Appendix D further details these assumptions. For the Southern case, we assumed all impacts would occur in Arkansas as this was the location of most of the timberland ownership in the study. To estimate forest industry job losses
Product/Item Assumption Units Notes
Douglas-fir, export $780 $/MBF Sample of USFS PNW reported prices
Douglas-fir, domestic $545 $/MBF 10-year average from ODF for Coastal Units
Douglas-fir, CNS Volume allocated to saw logs and fiber; 60/40
Douglas-fir, fiber (pulp) $220 $/MBF Assumption based on market interviews
Hemlock, export $500 $/MBF Sample of USFS PNW reported prices
Hemlock, domestic $400 $/MBF 10-year average from ODF for Coastal Units
Hemlock, CNS Volume allocated to saw logs and fiber; 60/40
Hemlock, fiber (pulp) $200 $/MBF Assumption based on market interviews
Cedar $880 $/MBF 5-year ave, 2S W. Red Cedar, ODF Coastal Units
Discount rate 6% %

Economic Analysis of Forest Certification June 2013
17 | P a g e
from reduced harvesting levels, we calculated ratios of jobs per tons of wood harvested. Specific steps and assumptions included: Using previous research by Dr. Pelkki (2005) at the University of Arkansas, we divided the
direct and indirect forest industry jobs in Arkansas in 2001 by the industrial softwood roundwood harvested in Arkansas in 1999 to calculate ratios of direct jobs per 1000 tons of wood and indirect jobs per 1000 tons of wood. Softwood roundwood harvested in 1999 was used as a proxy for wood flows in 2001 as volumes from 2001 were unavailable.
We calculated the percent reduction in wood volume for the SFI, FSC-Natural, and FSC-Plantation scenarios relative to the base case as estimated in the harvest schedules. We multiplied the percent reduction in timber harvest by total softwood flows for Arkansas in 2009.
To estimate the potential job losses, we multiplied the direct and indirect job rates by the state-wide reduction in wood volume.
Finally, to be conservative and account for potential efficiencies, adjustments and entrepreneurial activity in the forest sector, we applied a job rate “impact” of 50%.
For the Pacific Northwest case, we estimated potential job impacts for the forest industry in Oregon if all wood-producing timberlands in the state were certified as Base case/SFI, FSC as natural stands or FSC as plantations. Overall, the methodology mirrors that of the analysis for Arkansas. Specific steps and assumptions included: The direct and indirect job rates per MMBF were from Lippke et al. 1996. See Appendix D
for details. We calculated the percent reduction in harvested volume for the FSC-Natural and FSC-
Plantation scenarios as compared with Base case/SFI program in the Pacific Northwest case.
We multiplied the percent reduction in harvest volume by the total volume of softwood harvested in Oregon in 2006.
We multiplied jobs rates by the reduction in wood volume state-wide to calculate jobs lost. This assumes that impacts would translate equally across the state, although over three-quarters of all wood flows and harvest activity occur on the West-side.
Finally, to be conservative and account for potential efficiencies, adjustments and entrepreneurial activity in the forest sector, we applied a job rate “impact” of 50%.
State Revenue Assumptions For both Arkansas and Oregon, we estimated potential reductions in severance taxes associated with state-wide conversions to three forest certification scenarios. We calculated the severance taxes lost by multiplying the total tons lost from each scenario by the severance tax rate in each state. For Oregon, we assume all landowners pay the “Forest Products Harvest Tax”, which applies an annually adjusted severance tax rate to harvested timber. This assumption may underestimate the total severance tax because small landowners that qualify for and harvest timber under the Small Tract Forestland Program in Oregon pay higher severance tax rates in exchange for lower property taxes. Eligible landowners have 10 to 5,000 acres of forestlands within the state. Since the decision to enroll and the designation of the program falls outside of the certification program analysis, we assumed the lower severance tax rate as the baseline. Alternately, some small landowners can qualify for severance tax exemptions. As such, we assume the industrial-oriented “Forest Products Harvest Tax” as the baseline. We did not calculate reductions in other taxes, such as business taxes or business or personal income taxes, sales taxes, or property taxes. These would be significantly higher than the estimated losses in severance taxes.

Economic Analysis of Forest Certification June 2013
18 | P a g e
Operational Analysis Southern Case Study Results For the South, the base case, SFI, and the FSC-Natural scenarios used landowner RMZs, which followed state BMPs for RMZ widths. For the sample ownership, RMZs represented 9% of the productive acres (Table 8). The FSC-Plantation case required additional set-asides; the set-asides along with RMZs accounted for 25% of the productive acres in the ownership. As a result, these acres were removed from the operations and unavailable for harvesting. Table 8. Harvestable and Set-Aside Acres, U.S. South case
Maps in Figures 1 and 2 show the relative differences across scenarios and certification programs as reflected in RMZ widths and impacts on harvestable acres. Figure 1 shows, in light blue, an example of the minimum RMZ required by Arkansas State BMPs. This “office-based” exercise did not include on-the-ground testing or verification. The dark blue RMZs reflect the actual, operational management zones implemented and used by the current landowner. The analysis in this research used the landowner-defined RMZs. Figure 1. Landowner RMZ versus State Minimum Requirement, U.S. South case
Base, SFI &
FSC-Natural
Total acres 110,731 110,731
Forested/Productive acres 109,155 109,155
RMZ & set-aside acres 10,189 27,553
Set-aside (% of productive acres) 9% 25%
Harvestable acres 98,966 81,602
FSC-Plantation

Economic Analysis of Forest Certification June 2013
19 | P a g e
Note: the light blue represents the minimum RMZ based on Arkansas BMPs. The dark blue is the landowner delineated RMZ.
Figure 2 shows, in light blue, an example of the additional forestland set-asides required by the FSC-Plantation scenario in addition to the RMZs implemented by the current landowner. While the base case, SFI and FSC-Natural scenarios set aside approximately 9% of the harvestable acres, the FSC-Plantation scenario increases the set-aside to 25%, which would have a significant negative impact on landowner forest management activities if U.S. Southern forests were classified as plantations under FSC. We chose to increase the riparian buffers to achieve the 25%, but the standard would allow it to be achieved in other ways that may or may not involve higher costs to the landowner. Figure 2. Landowner RMZ versus FSC Plantation Scenario, U.S. South case
Note: the dark blue represents the RMZ as implemented by the landowner. The light blue represents additional forestland set-asides required by the FSC-Plantation scenario.
The base case scenario yielded the highest harvest volume over the 36 year planning period with an average of 620,121 tons per year (Figure 3). SFI’s volumes per year were closer to the FSC-Natural case, although SFI had higher volumes over the last 15 years of the planning period. SFI had average harvest volumes of 570,230 tons, only 7.0% higher than the FSC-Natural average volume of 532,726 tons per year. This is not surprising given the similarities between the two scenarios. SFI had a 3-year green-up interval (compared with 2-years for FSC-Natural) and a higher clearcut size of a 250-acre maximum and 120-acre average (compared with an 80-acre maximum and 40-acre average for FSC-Natural). The model permitted a tolerance around the maximum clearcut size, which allowed for harvests on stands larger than the maximum for both cases. The FSC-Plantation scenario consistently yielded the lowest harvest volume per year over the planning period. The difference in the FSC-Plantation volume output and the FSC-Natural

Economic Analysis of Forest Certification June 2013
20 | P a g e
output is the removal of an additional 17,364 acres to satisfy the requirement for permanent set-asides of land. This was the primary driver in reducing the average harvest volume by an additional 16.3%, from 532,726 tons to 445,690. Compared with the SFI case, FSC-Plantation reduced average volume per year by 21.8%. Figure 3. Total Harvest Volumes, U.S. South case
Pacific Northwest Case Study Results For the Pacific Northwest, the base case and SFI scenarios had identical constraints, including the same RMZ parameters, which defaulted to Oregon’s forest practices rules. The RMZs defined by Oregon’s rules removed 7% of the productive acres in the sample ownership (Table 9). The FSC scenarios have more restrictive stream buffer widths, as dictated in the FSC Pacific Northwest regional variation. The FSC-Natural case removes 22% of the productive acres for RMZs. The FSC-Plantation case removes an additional 3% of the acres to meet the 25% set-aside requirement for FSC plantations. Table 9. Harvestable and Set-Aside Acres, Pacific Northwest case
The maps in Figures 4 and 5 show the relative differences across scenarios and certification programs as reflected in RMZ widths and the impacts on harvestable acres. Figure 4 shows, in white, an example of the RMZs under the base case and SFI scenarios. The blue shows the additional buffer and set-asides required to move from SFI to the FSC-Natural scenario. This corresponds with moving from the setting aside of 7% of productive acres to 22% of productive, harvestable acres.
Base & SFI FSC-Natural FSC-Plantation
Total acres 210,601 210,601 210,601
Forested/Productive acres 203,374 203,374 203,374
RMZ & set-aside acres 13,433 45,202 51,536
Set-aside (% of productive acres) 7% 22% 25%
Harvestable acres 189,941 158,172 151,838

Economic Analysis of Forest Certification June 2013
21 | P a g e
Figure 4. Base/SFI RMZ versus FSC-Natural, Pacific Northwest case
Note: The white areas are the RMZs as defined under the ATFS and SFI scenarios. The blue shows the additional buffer and set-asides required to move from SFI to the FSC-Natural scenario.
Figure 5 shows, in white, an example of the streams and RMZs under the FSC-Natural scenario for a portion of the Oregon timberland ownership evaluated. The purple colored buffers represent the additional acres set-aside to move from the FSC-Natural to the FSC-Plantation scenario. This corresponds with moving from the setting aside of 22% of productive acres to 25% of productive, harvestable acres. The Base/SFI scenarios generated the highest and most consistent harvest volumes by year throughout the 45 year planning period (Figure 6). Base/SFI averaged 161,949 MBF per year. Harvest volumes in the FSC-Natural scenario are restricted in the early years of the harvest schedule by the harvest age constraint requiring stands to be 55 years of age for harvesting (our assumed age for CMAI). With typical harvest rotations in the Pacific Northwest of 45 years, the FSC-Natural scenario delays harvesting by approximately 10 years relative to common practice. This delay reduces harvest volume in the earlier years as mature stands that are 45 to 55 years of age are left to grow. The base case, SFI and FSC-Plantation do not have similar harvest age restrictions, so there is not a similar increase in harvest level over time for those scenarios.

Economic Analysis of Forest Certification June 2013
22 | P a g e
Figure 5. FSC-Natural versus FSC-Plantation, Pacific Northwest case
Note: RMZs are white under the FSC-Natural scenario for a portion of the Oregon timberland ownership evaluated. The purple colored buffers represent the additional acres set-aside to move from the FSC-Natural to the FSC-Plantation scenario.
Average harvest volume per year for the FSC-Natural scenario is 94,568 MBF, 16.3% lower than the average harvest volume for the FSC-Plantation scenario of 113,022 MBF. The FSC-Natural scenario generates 41.6% less annual volume per year than the Base/SFI scenario and the FSC-Plantation scenario generates 30.2% less annual volume than the Base/SFI scenario. Figure 6. Total Harvest Volumes, Pacific Northwest case

Economic Analysis of Forest Certification June 2013
23 | P a g e
Economic Analysis The economic analysis generalizes the results of the individual case studies to the state-level in Arkansas and Oregon. The job loss and severance tax estimates are purely a function of reductions in marketable wood flows resulting from compliance with alternate certification programs. The step-by-step math and assumptions associated with this analysis are provided in Appendix D. Southern Case Study Results
Table 10 summarizes the economic and operational results for the U.S. South. Compared with the base case, the SFI scenario reduces value, as measured by the NPV of net operating cash flows, by 4%. The FSC-Natural scenario reduces NPV by 11% compared with the base case, and the FSC-Plantation scenario reduces NPV by 26% compared with the base case. The analysis of state-level implications from the certification systems indicate potential job losses and less state revenue from all programs, with FSC programs reducing jobs and state income to a greater degree than SFI (Table 10). State-wide conversion to natural stand management under FSC could eliminate 4,915 jobs in the state and $312,441 in state revenue through lower severance taxes. State-wide conversion of forests to plantation management under FSC could eliminate 9,830 jobs and $624,882 in state revenue from severance taxes. Table 10. Economic and Operational Results, Arkansas case
Pacific Northwest Case Study Results Table 11 summarizes the economic and operational results for the Pacific Northwest. The economic analysis highlights performance relative to the Base case/SFI scenario as the baseline for the Pacific Northwest case. Compared with Base/SFI, the FSC-Natural scenario reduces NPV of net operating cash flows by 46%, and the FSC-Plantation scenario reduces NPV by 31% compared with Base/SFI.
Scenario Profile Base SFI FSC_Natural FSC_Plantation
RMZ & set-asides, acres 10,189 10,189 10,189 27,553
Set-aside % of productive acres 9% 9% 9% 25%
Harvestable acres in scenario 98,966 98,966 98,966 81,602
Harvestable % of productive acres 91% 91% 91% 75%
Forest Operations
Total harvest volume for period (tons) 22,324,364 20,528,296 19,178,139 16,044,850
Volume % reduction relative to Base Case 0% -8% -14% -28%
Economic Analysis
NPV $ loss relative to Base Case 0% -4% -11% -26%
State-level Jobs and Taxes
Direct forest industry jobs lost relative to Base Case 0 1,254 2,194 4,388
Direct + indirect jobs lost relative to Base Case 0 2,808 4,915 9,830
Severance taxes lost relative to Base Case 0 $178,538 $312,441 $624,882
Economic Analysis of Forest Certification June 2013
24 | P a g e
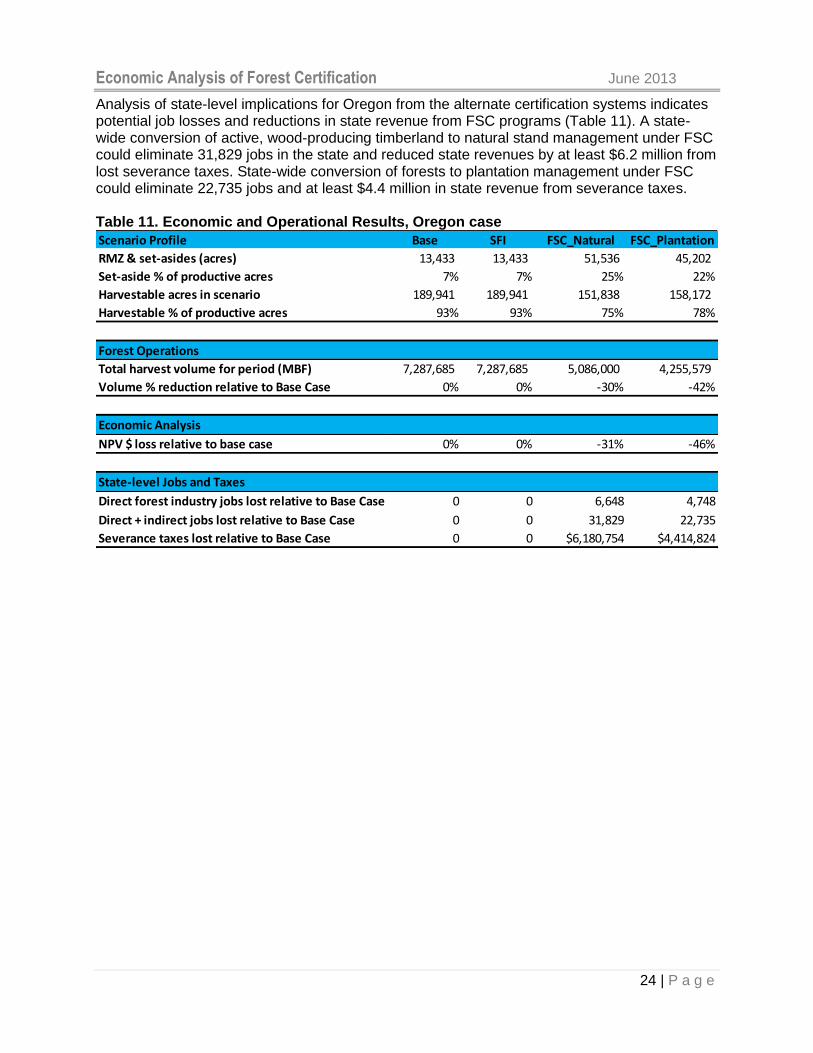
Analysis of state-level implications for Oregon from the alternate certification systems indicates potential job losses and reductions in state revenue from FSC programs (Table 11). A state-wide conversion of active, wood-producing timberland to natural stand management under FSC could eliminate 31,829 jobs in the state and reduced state revenues by at least $6.2 million from lost severance taxes. State-wide conversion of forests to plantation management under FSC could eliminate 22,735 jobs and at least $4.4 million in state revenue from severance taxes. Table 11. Economic and Operational Results, Oregon case
Scenario Profile Base SFI FSC_Natural FSC_Plantation
RMZ & set-asides (acres) 13,433 13,433 51,536 45,202
Set-aside % of productive acres 7% 7% 25% 22%
Harvestable acres in scenario 189,941 189,941 151,838 158,172
Harvestable % of productive acres 93% 93% 75% 78%
Forest Operations
Total harvest volume for period (MBF) 7,287,685 7,287,685 5,086,000 4,255,579
Volume % reduction relative to Base Case 0% 0% -30% -42%
Economic Analysis
NPV $ loss relative to base case 0% 0% -31% -46%
State-level Jobs and Taxes
Direct forest industry jobs lost relative to Base Case 0 0 6,648 4,748
Direct + indirect jobs lost relative to Base Case 0 0 31,829 22,735
Severance taxes lost relative to Base Case 0 0 $6,180,754 $4,414,824

Economic Analysis of Forest Certification June 2013
25 | P a g e
Discussion and Conclusions Economic implications to private forest owners for complying with forest certification above and beyond current best management practices differ in the U.S. South versus the Pacific Northwest. In the U.S. South, FSC common practice treats planted stands as semi-natural stands with similar management implications as the SFI certification program. Also, FSC guidelines for green-up intervals and retention in the South are subject to interpretation and variance. This research assumes that landowners follow FSC guidelines for clearcut size and this contributes to a greater economic impact from FSC than SFI in the South. In addition, the Pacific Northwest has a greater spread of economic implications across the certification programs than in the U.S. South. FSC requirements for plantations and natural forests are more restrictive than SFI and significantly impact timberland profitability in this region. We believe and observed that all forest certification programs – including ATFS, FSC and SFI – advance responsible forest management activities in the U.S. Timberland owners enrolled in third-party certification programs adhere to program standards and are subject to confirmation by third-party auditors. However, when implemented, forest certification criteria remain subject to interpretation. Certification under a given program does not necessarily confirm specific forest management practices or restrictions. Even auditors responsible for verifying landowners’ compliance with certification programs acknowledge how some standards, even if explicit, remain subject to interpretation in implementation. The analysis found significant economic impacts to landowners that varied by program and U.S. region. Key findings include: In the Pacific Northwest, both FSC scenarios significantly reduce economic returns to
landowners. Relative to the base forest management practices and SFI scenarios, forests managed as either natural stands or plantations under FSC reduce the estimated present value of net operating cash flows by 31 to 46% for the 46-year operating period from, primarily, shrinking the operable acres and reducing the harvested volumes.
In the South, the FSC-Plantation scenario significantly reduces economic returns to landowners. Relative to the base forest management practices, SFI, and the FSC-Natural scenarios, forests classified as plantations under FSC significantly reduce landowners’ returns and operating flexibility. For those seeking FSC certification in the South, this creates tremendous incentives to avoid classification as a plantation as defined by FSC.
Reduced wood flows associated with forest certification are associated with reduced employment and tax revenues. State-level implementation of FSC in Oregon could reduce direct and indirect forest industry employment by over 31,000 jobs and reduce annual severance taxes by over $6 million. State-level implementation of the FSC-Plantation standard in Arkansas could eliminate direct and indirect forest industry employment by up to 10,000 jobs and reduce annual severance taxes by over $600,000.
Economic Analysis of Forest Certification June 2013
26 | P a g e
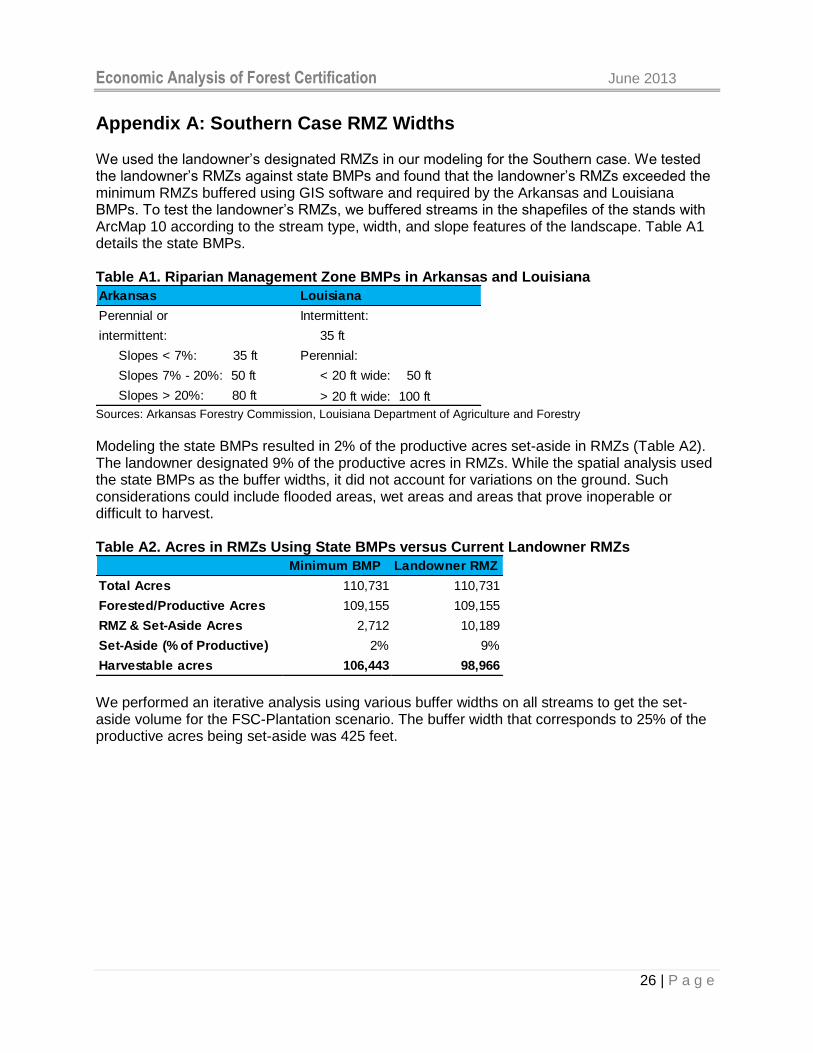
Appendix A: Southern Case RMZ Widths We used the landowner’s designated RMZs in our modeling for the Southern case. We tested the landowner’s RMZs against state BMPs and found that the landowner’s RMZs exceeded the minimum RMZs buffered using GIS software and required by the Arkansas and Louisiana BMPs. To test the landowner’s RMZs, we buffered streams in the shapefiles of the stands with ArcMap 10 according to the stream type, width, and slope features of the landscape. Table A1 details the state BMPs. Table A1. Riparian Management Zone BMPs in Arkansas and Louisiana
Sources: Arkansas Forestry Commission, Louisiana Department of Agriculture and Forestry
Modeling the state BMPs resulted in 2% of the productive acres set-aside in RMZs (Table A2). The landowner designated 9% of the productive acres in RMZs. While the spatial analysis used the state BMPs as the buffer widths, it did not account for variations on the ground. Such considerations could include flooded areas, wet areas and areas that prove inoperable or difficult to harvest. Table A2. Acres in RMZs Using State BMPs versus Current Landowner RMZs
We performed an iterative analysis using various buffer widths on all streams to get the set-aside volume for the FSC-Plantation scenario. The buffer width that corresponds to 25% of the productive acres being set-aside was 425 feet.
Arkansas Louisiana
Perennial or Intermittent:
intermittent: 35 ft
Slopes < 7%: 35 ft Perennial:
Slopes 7% - 20%: 50 ft < 20 ft wide: 50 ft
Slopes > 20%: 80 ft > 20 ft wide: 100 ft
Minimum BMP Landowner RMZ
Total Acres 110,731 110,731
Forested/Productive Acres 109,155 109,155
RMZ & Set-Aside Acres 2,712 10,189
Set-Aside (% of Productive) 2% 9%
Harvestable acres 106,443 98,966
Economic Analysis of Forest Certification June 2013
27 | P a g e
Appendix B: Habplan Software For the U.S. South certification scenarios based on the timberland ownership in Arkansas/Louisiana, we used Habplan to generate harvest schedules. Habplan is a program developed by the National Council for Air and Stream Improvement (NCASI). Established in 1943, NCASI is an independent non-profit research group that focuses on environmental issues relevant to the forest products industry. Developed by NCASI’s Statistics and Model Development Group and written in Java, Habplan uses a simulation approach to generate “feasible” and “near optimal” harvest schedules for forest harvest and habitat scheduling. Harvest scheduling uses a mathematical program to determine the allowable cut for a given timberland area, over multiple cutting cycles. Per the needs of this research, Habplan has the capability to process spatial objectives as well as produce harvest schedules with or without spatial or adjacency constraints. Habplan includes a linear program solver, which is a mathematical program that finds the optimal solution given constraints. Constraints may include, for example: Species; Site quality; Age of current stand; Rotation length; Number of thinnings; Regeneration or replanting; “Green-up interval”; and Clearcut size. For more information on Habplan, go to http://www.ncasi2.org/projects/habplan/habplan/

Economic Analysis of Forest Certification June 2013
28 | P a g e
Appendix C: Remsoft Software Headquartered in New Brunswick, Canada, Remsoft is a private firm that provides analytical optimization modeling and spatial planning software to public agencies, forest products companies, timber investment management organizations (TIMOs) and forestry consulting companies. For this research, Remsoft used the Woodstock Modeling Platform, in particular, the Woodstock Optimization System and Spatial Optimizer. The Woodstock Optimization System allows users to define the model inputs, outputs, objectives, and constraints. The Spatial Optimizer provides a harvest schedule that considers spatial elements such as stand adjacency and proximity. Remsoft ran the Woodstock Optimization System and Spatial Optimizer to generate harvest schedules for the certification scenarios for the baseline, SFI, FSC-Natural and FSC-Plantation. The models accounted for criteria specific to: Species; Growth and yield assumptions; Age of current stand; Rotation length; Harvest flow constraints and requirements; Regeneration or replanting; “Green-up interval” and adjacency; and Clearcut size. For more information on Remsoft and Woodstock, go to www.remsoft.com.

Economic Analysis of Forest Certification June 2013
29 | P a g e
Appendix D: Jobs Ratios and Assumptions Analysis for potential direct and indirect forest industry job impacts relied on ratios that estimate the relationship between annually harvested wood flows and employment. Direct employees include foresters, loggers, millworkers, and forestry consultants and contractors. Indirect jobs include jobs that support the forest industry, such as motor freight transportation, machinery repair, and wholesale trade. Indirect job impacts in this research also include “induced” jobs created by the spending of workers in the forest industry. Since job ratios reflect a current, static condition, we adjusted estimated net job losses by an assumed “job rate impact” of 50%. While potentially conservative, this assumption is based on the actual rate of net job loss in Washington State between 1992 and 2002 during a period of significant harvest decreases as described by Lippke and Mason in their 2005 study. In reality, actual job losses during a period of harvest decline are lower than estimated using static job ratios per annual harvest volumes. This occurs because mills can increase imports of wood raw materials from neighboring states or use more recycled material (in cases), entrepreneurs initiate new services or modify current activities, and manufacturers adjust their processes. Tables D1 and D2 summarize the ratios and calculations for the Southern case, which assumes all effects are associated with Arkansas (most of the analyzed property is located in Arkansas, with the balance in Louisiana). Using a ratio of 2.5 direct jobs per thousand tons, we estimate that Arkansas has 31,344 direct forest industry jobs in total for the current annual timber harvest level of 12,538 thousand tons. The analysis for Arkansas assumes a net impact similar to Oregon of a 50% expected realized job loss over time relative to the actual estimate. To calculate the job reduction from 100% FSC-Plantation certification, for example, a 28% reduction of volume would be associated with a loss of 8,776 direct jobs before any adjustment (12,538 thousand tons * 28% reduction * 2.5 jobs = 8,776 direct job loss). We apply a 50% reduction factor to assume an actual job rate effect of 4,388 jobs to account for adjustments made by firms. While potentially conservative, the 50% impact comes from evaluating how job ratios changed over time from 1992 through 2002 in the Pacific Northwest during a period of significant harvest decreases. Table D1. Job Ratio Inputs and Assumptions, South (Arkansas)
Input Assumption Notes
Total AR harvest volume (softwood) 12,538 thousand tons
% volume lost SFI 8%
% volume lost FSC-Natural 14%
% volume lost FSC-Plantation 28%
Direct job rate 2.5 jobs/1,000 tons
Indirect job rate 3.1 indirect jobs/1,000 tons
Direct jobs, AR state-level estimate 31,344
Indirect jobs, AR state-level estimate 38,867
Assumed job rate impact 50% reduction factor
Severence tax rate 0.178 $/ton

Economic Analysis of Forest Certification June 2013
30 | P a g e
Table D2. Job Ratio Outputs Compared with Baseline Scenario, South (Arkansas)
*Tons of timber per year
These figures were checked by comparing the maximum assumed job losses from this analysis relative to state-level direct employment levels from the U.S. Census Bureau (Table D3). The Census Bureau reports that Arkansas has just over 25,000 direct forest industry employees, which is a slightly lower estimate than the 31,344 direct jobs estimated through applying job ratios. Relative to the 25,000 jobs reported by the Census, the estimated job loss of 4,388 from the FSC-Plantation scenario results in an estimated direct industry job loss of 17.3%. Table D3. Direct Forest Industry Employment, Arkansas
Sources: U.S. Census Bureau, Forisk Consulting
Tables D4 and D5 summarize the ratios and calculations for the Pacific Northwest. The direct and indirect job rates are from Lippke et al. 1996. The analysis assumes a net impact of 50% expected job loss over time. Table D4. Job Ratio Inputs and Assumptions, Pacific Northwest (Oregon)
Output SFI FSC-Natural FSC-Plantation
Harvest volume lost* 1,003,020 1,755,286 3,510,571
Direct jobs lost 1,254 2,194 4,388
Indirect jobs lost 1,555 2,721 5,441
Total jobs lost 2,808 4,915 9,830
Severance taxes lost $178,538 $312,441 $624,882
Subsector Employees
Forestry & Logging 2,141
Forestry Support 622
Furniture 3,544
Paper 10,003
Wood Manufacturing 9,028
Total direct jobs 25,338
Maximum estimated direct job "loss" 4,388
Estimated % of direct job "loss" 17.3%
Input Assumption Notes
Total OR harvest volume (softwood) 4,116,386 MBF
% volume lost FSC-Natural 42%
% volume lost FSC-Plantation 30%
Direct job rate 7.69 jobs/MMBF
Indirect job rate 29.13 indirect jobs/MMBF
Direct jobs, OR state-level estimate 31,655
Indirect jobs, OR state-level estimate 119,910
Assumed job rate impact 50% reduction factor
Severence tax rate 3.575 $/MBF

Economic Analysis of Forest Certification June 2013
31 | P a g e
Table D5. Job Ratio Outputs Compared with Base/SFI Scenario, Pacific Northwest (Oregon)
*MBF of timber per year
Table D6 uses data from the U.S. Census to cross-check the estimated direct industry employment effects. Oregon has just over 39,000 direct forest industry employees relative to the 31,655 estimated by applying job ratios. We apply the maximum estimated job loss of 6,648 from the FSC-Natural scenario. This results in an estimated direct industry job loss of 16.9%. Table D6. Direct Forest Industry Employment, Oregon
Sources: U.S. Census Bureau, Forisk Consulting
Output FSC-Natural FSC-Plantation
Harvest volume lost* 1,728,882 1,234,916
Direct jobs lost 6,648 4,748
Indirect jobs lost 25,181 17,987
Total jobs lost 31,829 22,735
Severance taxes lost $6,180,754 $4,414,824
Subsector Employees
Forestry & Logging 6,326
Forestry Support 3,192
Furniture 4,818
Paper 4,766
Wood Manufacturing 20,150
Total direct jobs 39,252
Maximum estimated direct job "loss" 6,648
Estimated % of direct job "loss" 16.9%