Embed Size (px)
Citation preview
IDENTIFICATION, CONSUMPTION PATTERN AND NUTRIENT COMPOSITION OF PROCESSED GREEN LEAFY VEGETABLES AND THEIR YAM DISHES AS CONSUMED IN IGBO-
UKWU IN ANAMBRA STATE, NIGERIA
BY EZEIFE CHINWE JOY. (MRS)
PG/M.SC/2003/34663
DEPARTMENT OF HOME SCIENCE, NUTRITION AND DIETETICS, U.N.N.
SUPERVISOR: PROF. I. C. OBIZOBA
FEBUARY , 2010
i
TITLE PAGE
IDENTIFICATION, CONSUMPTION PATTERN AND NUTRIENT COMPOSITION OF PROCESSED GREEN LEAFY VEGETABLES AND THEIR YAM DISHES AS CONSUMED IN IGBO-
UKWU IN ANAMBRA STATE, NIGERIA
BY EZEIFE CHINWE JOY. (MRS)
PG/M.SC/2003/34663
A dissertation
Submitted in partial fulfilments for the requirement for the
MSc in Human Nutrition
DEPARTMENT OF HOME SCIENCE, NUTRITION AND DIETETICS, U.N.N.
SUPERVISOR: PROF. I. C. OBIZOBA
FEBUARY, 2010
ii
APPROVAL PAGE
THIS DISSERTATION HAS BEEN APPROVED FOR THE DEPARTMENT OF HOME SCIENCE, NUTRITION AND DIETECTICS, UNIVERSITY OF NIGERIA NSUKKA
BY
__________________ _______________
PROF I.C. OBIZOBA DR (MRS) C.I. ILOEGE
SUPERVISOR HEAD OF DEPARMENT
___________________ _______________
DEAN OF FACULTY EXTERNAL EXAMINER

iii
CERTIFICATION
Ezeife, chinwe joy, a post graduate student in the Department of Home Science,
Nutrition and Dietectics with Registration Number PG/M.Sc/2003/34663 has
satisfactorily completed the research work for the degree of MSc in Human Nutrition.
The work embodied in this dissertation is original and has not been submitted in part or
full for any other diploma or degree of this or any other university.
______________________ ________________
Dr (Mrs) C.I. Iloeje Prof I.C. Obizoba
Head of Department Supervisor

iv
DEDICATION
This dissertation is dedicated to my late brother- Obiora Afamdi Chiuba (1971-2004)
who drove me to UNN for the registration of Msc in Human Nutrition but was not alive
to see to the completion of the degree.
May Almighty God grant him peace and eternal rest. Amen.

v
ACKNOWLEDGEMENTS
I thank God Almighty for his kindness, mercies and his special grace throughout the
duration of this course
I am very grateful and indeed indepthed to my outstanding Supervisor, Mentor,
Motivator and Counselor, Professor I. C. Obizoba. He is a Supervisor with a difference.
I dare not attempt expressing his efforts and contributions towards the success of this
project. Words cannot describe his tremendious support effectively. His humility,
steadfastness, patience and sense of humour are highly appreciated. May our good Lord
keep him and reward him abundantly.
I am equally grateful to other Professors in the Department ; N.M Nnam,E.C.Okeke
and H.N.Ene-Obong. My gratitude also goes to Dr(Mrs) E. K. Ngwu for technical
assistance
My gratitude also goes to the good people of Health Systems Development of National
Primary Health Care development Agency Abuja. I appreciate particularly Dr M. J.
Abdulahi for his encouragement during the period of the programme.
I am highly indepthed to my husband, Chief Robinson Nwakaire Ezeife for the
tremendious sacrifice .good understanding and support throughout the programme
I also thank my children for bearing with my absence , whenever I travel to Nsukka
especially during the holidays
I thank God for a true friend indeed Dr Mrs Nneka C Mefoh , Ag Provost Anambra
State College of Agriculture ,Mgbakwu I call her project Supervisor 1 and indeed she
contributed immensely even when this programme was on the verge of abandonement.
Nneka ,I salute your wisdom ,innovation and resourcefulness.
My gratitude also goes to my parents Mr and Mrs Angus Chiuba, Who have given me
the basic gift of formal education and first degree which formed the bases for other
degrees.

vi
I am grateful to my brother Izuchukwu, my sisters: Ifeoma, Nkiru, Uchenna, Nwamaka
and Ifenyinwa
I pray that God almighty will meet you all at various points of your needs in Jesus nane
– amen
Ezeife Chinwe Joy (Mrs)
vii
TABLE OF CONTENT
TITLE PAGE .............................................................................................................. i
APPROVAL PAGE .................................................................................................... ii
CERTIFICATION ....................................................................................................iii
DEDICATION ........................................................................................................... iv
ACKNOWLEDGEMENTS ....................................................................................... v
TABLE OF CONTENT ........................................................................................... vii
LIST OF TABLES .................................................................................................... xi
LIST OF FIGURES................................................................................................. xiii
ABSTACT................................................................................................................ xiv
CHAPTER ONE ....................................................................................................... 15
INTRODUCTION .................................................................................................... 15
1.1 Background information ...................................................................................... 15
1.2 Statement of the problem ...................................................................................... 19
1.3 Justification .......................................................................................................... 21
1.4 Objectives of the study ......................................................................................... 22
1.4.1 General objective .............................................................................................. 22
1.4.2 Specific objectives ............................................................................................ 22
1. 5 Significance of the study .................................................................................... 23
CHAPTER TWO...................................................................................................... 25
LITERATURE REVIEW ........................................................................................ 25
2.1Malnutrition .......................................................................................................... 25
2.1.1 Causes of malnutrition ....................................................................................... 25
2.1.2 Effects of malnutrition ...................................................................................... 26
2.1.3 Efforts to improve nutrition status ...................................................................... 27
2.2 New trend in nutrition .......................................................................................... 28
2.2.1 Food values of vegetables ................................................................................. 28
2.2.2 Drawbacks to vegetables consumption .............................................................. 30
2.3 Vegetables ........................................................................................................... 31
2.4 Food processing .................................................................................................... 34
2.4.1 Drying ............................................................................................................... 36
viii
2.5 Defining fruits and vegetables .............................................................................. 40
2.6 Nutritional and antinutritional factors of green leafy vegetables. .......................... 43
2.6.1 Chemical composition of vegetables ................................................................. 46
2.6.2 Nutrient composition of green leafy vegetables ................................................ 46
2.6.2a Moisture .......................................................................................................... 46
2.6.2b Energy ............................................................................................................. 47
2.6.2c Protein content ................................................................................................. 47
2.6.2d Ether extract ................................................................................................... 48
2.6.2e Mineral composition ........................................................................................ 48
2.6.2f Vitamins ........................................................................................................... 48
2.6.2g Antinutrient component ................................................................................... 48
2.7 Vegetable production and utilization ..................................................................... 54
2.7.1 Vegetables in general ........................................................................................ 34
2.7.2 Use of green vegetables .................................................................................... 35
2.8 Staple foods .......................................................................................................... 55
2.8.1 Roots and tubers ................................................................................................ 55
2.8.2 Yam origins and distribution .............................................................................. 56
CHAPTER THREE ................................................................................................. 62
3.0 MATERIALS AND METHOD ........................................................................ 62
3.1 MATERIALS ...................................................................................................... 62
3.2 Sample identification ........................................................................................... 62
3.3 Sample preparation .............................................................................................. 63
3.3.1 Broad pumpkin leaves - “Ugbogulu” (Curcubita pepo) ..................................... 63
3.3.2 “Eliemionu” (celosia argentea) ......................................................................... 63
3.3.3 “Ariraa” (Corchorus trideus) ............................................................................. 64
3.3.4 “Akwukwo Ji-nwannu (Ipomoea batatas) .......................................................... 64
3.3.5 “Okpa okuko” (Uvaria chamae) ...................................................................... 64
3.3.6 “Ugu oyibo” (Jatropha aconitifolia) ................................................................. 65
3.4 Chemical analysis ............................................................................................... 68
3.4.1 Crude protein determination .............................................................................. 68
3.4.2 Fat determination (Soxhlet method) ................................................................. 69
3.4.3 Ash determination............................................................................................. 69
3.4.4 Moisture determination ..................................................................................... 70
ix
3.4.5 Crude fibre content ........................................................................................... 70
3.4.6 Carbohydrate content ........................................................................................ 71
3.4.7 Energy ............................................................................................................... 71
3.4.8 Mineral determination........................................................................................ 71
3.4.9 Vitamin content ................................................................................................ 71
3.5 Anti-nutrients ...................................................................................................... 72
3.5.1 Tannins ............................................................................................................. 72
3.5.2 Phytate............................................................................................................... 72
3.5.3 Food toxicant .................................................................................................... 72
CHAPTER FOUR .................................................................................................... 76
4.0 RESULTS .......................................................................................................... 76
4.1 Survey on consumption pattern, processing and utilization of six vegetables....... 76
4.1.1 Identification of vegetables consumed in Igbo -ukwu ......................................... 76
4.1.2 Availability of these vegetables in Igbo ukwwu market ...................................... 77
4.1.3 Dishes prepared with identified vegetables........................................................ 79
4.1.4 Perception of taste and pattern of consumption of these vegetables .................... 81
4.1.5 Factors that affect the consumption pattern of the vegetables in Igbo ukwu ...... 84
4.1.6 Frequency of consumption of the identified vegetables in Igbo-ukwu ............... 86
4.1.7 Respondents knowledge of availability and common habitats of the identified
vegetables ........................................................................................................... 88
4.2.1 Proximate composition of fresh, sun and shade dried green leafy vegetables. ..... 90
4.2.2 Effects of sun and shade drying on proximate composition of fresh, sun and shade
green leafy vegetables. ........................................................................................ 95
4.2.3 Mineral composition of six green leafy vegetables .......................................... 101
4.2.4 Vitamin composition of fresh, sun and shade dried (dry weight basis) vegetables
......................................................................................................................... 106
4.2.5 Antinutrient composition of fresh, sun and shade dried green leafy vegetables
(dry wt, mg). ..................................................................................................... 111
4.3.1: Proximate composition of yam dishes prepared plain, with fresh, sun and shade
dried and pulverized vegetables. ....................................................................... 115
4.3.2 Mineral composition of yam dishes prepared plain with fresh, sun and shade
dried and pulverised vegetables(mg)*. .............................................................. 118
x
4.3.3: Vitamin composition of yam dishes prepared plain, with fresh, sun and shade
dried and pulverized vegetables ........................................................................ 122
4.4 1: Organoleptic attributes of the 8 yam dishes. ................................................... 125
CHAPTER FIVE .................................................................................................... 129
5.0 DISCUSSION .................................................................................................... 129
5.1 Survey on identification, consumption pattern and utilization of 6 leafy vegetables
............................................................................................................................. 129
5.2 Factors that influenced consumption pattern of these vegetables: ...................... 131
5.3 Proximate composition, micronutrient and antinutrient content of the 6 fresh and
processed vegetables............................................................................................. 132
5.4 Organoleptic studies ........................................................................................... 145
5.5 CONCLUSION ............................................................................................... 151
5.6 RECOMMENDATIONS. ................................................................................ 154
REFERENCES ....................................................................................................... 155
APPENDIX ................................................................................................................. 3
xi
LIST OF TABLES
Table 2.1 Proximate composition of Nigerian leafy vegetables (per 100g).
Table 2.2 Mineral content of Nigerian leafy vegetables (g/100g).
Table 2.3 Vitamin content of Nigerian leafy vegetables (g/100g)
Table 2.4 Phytic acid and oxalic acid content of leafy vegetables (mg/100g).
Table 2.5 Origin of tropical root crops
Table 4.1.1 Vegetables identified by Igbo ukwu women
Table 4.1.2 Availability of the vegetables in Igbo ukwu market
Table 4.1.3 Dishes prepared with the vegetables
Table 4.1.4 Perception of taste and pattern of consumption of these vegetables
Table 4.1.5 Factors that affect consumption pattern of the vegetables in Igbo ukwu.
Table 4.1.6 Frequency of consumption of the vegetables
Table 4.1.7 The subjects knowledge of availability and common habitats of
identified vegetables
Table 4.2.1 Effects of sun and shade drying on proximate composition of fresh, sun
and shade dried green leafy vegetables (wet wt)
Table 4.2.2 Proximate composition of fesh sun ans shade dried green leafy
vegetables (%) (dry wt).
Table 4.2.3 Mineral composition of sun and shade dried green leafy vegetables (mg)
(dry wt).
Table 4.2.3 Vitamin composition of fresh, sun and shade dried vegetables
Table 4.2.5 Antinutrient composition of fresh, sun and shade dried green leafy
vegetables (dry wt)(mg)
Table 4.3.1 Proximate composition of yam dishes prepared plain with fresh, sun and
shade dried and pulverised vegetables.

xii
Table 4.3.2 Mineral composition of yam dishes prepared plain, with fresh, sun and
shade dried and pulverised vegetables.
Table 4.3.3 Vitamin composition of yam dishes prepared plain with fresh sun and
shade dried and pulverised vegetables
Table 4.4.1 Organoleptic attributes of the yam dishes

xiii
LIST OF FIGURES
Fg 3.1 Flow chart for processing of the green leafy vegetables
Fg 4.1 Yam dishes prepared with fresh sun and shade dried and pulverised vegetables
Fg 4.2 Researcher with the group of panellist for organoleptic evaluation.
xiv
ABSTRACT
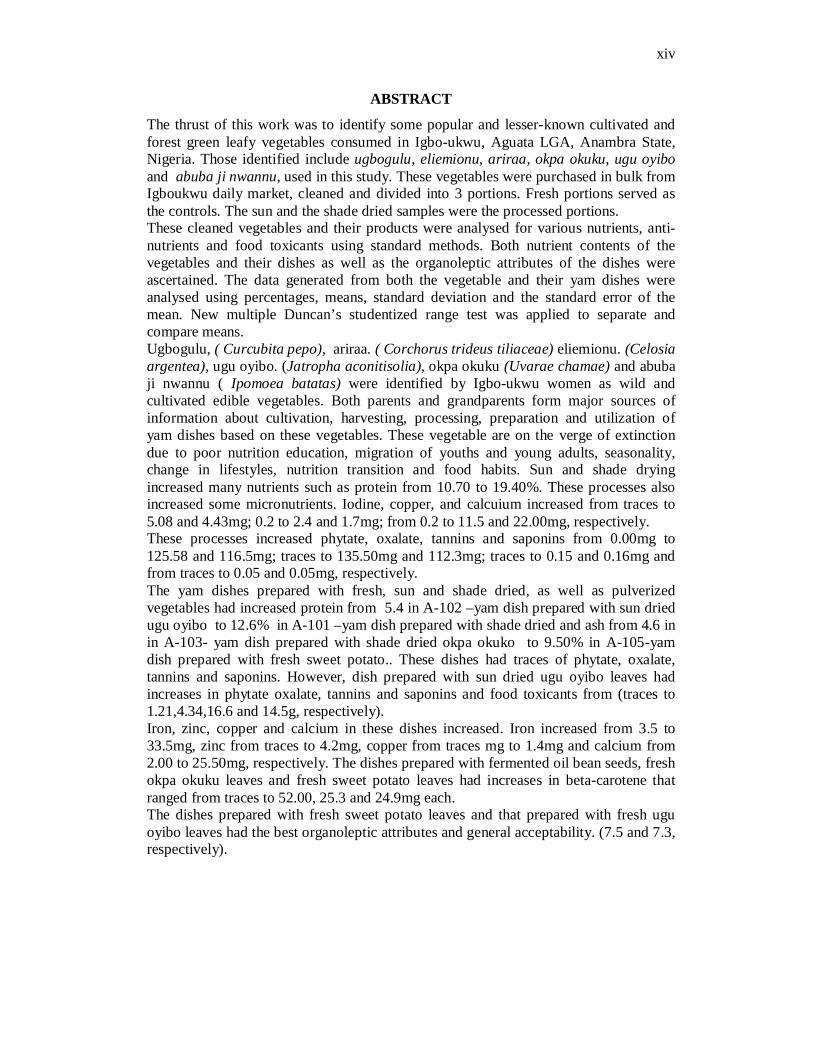
The thrust of this work was to identify some popular and lesser-known cultivated and forest green leafy vegetables consumed in Igbo-ukwu, Aguata LGA, Anambra State, Nigeria. Those identified include ugbogulu, eliemionu, ariraa, okpa okuku, ugu oyibo and abuba ji nwannu, used in this study. These vegetables were purchased in bulk from Igboukwu daily market, cleaned and divided into 3 portions. Fresh portions served as the controls. The sun and the shade dried samples were the processed portions. These cleaned vegetables and their products were analysed for various nutrients, anti-nutrients and food toxicants using standard methods. Both nutrient contents of the vegetables and their dishes as well as the organoleptic attributes of the dishes were ascertained. The data generated from both the vegetable and their yam dishes were analysed using percentages, means, standard deviation and the standard error of the mean. New multiple Duncan’s studentized range test was applied to separate and compare means. Ugbogulu, ( Curcubita pepo), ariraa. ( Corchorus trideus tiliaceae) eliemionu. (Celosia argentea), ugu oyibo. (Jatropha aconitisolia), okpa okuku (Uvarae chamae) and abuba ji nwannu ( Ipomoea batatas) were identified by Igbo-ukwu women as wild and cultivated edible vegetables. Both parents and grandparents form major sources of information about cultivation, harvesting, processing, preparation and utilization of yam dishes based on these vegetables. These vegetable are on the verge of extinction due to poor nutrition education, migration of youths and young adults, seasonality, change in lifestyles, nutrition transition and food habits. Sun and shade drying increased many nutrients such as protein from 10.70 to 19.40%. These processes also increased some micronutrients. Iodine, copper, and calcuium increased from traces to 5.08 and 4.43mg; 0.2 to 2.4 and 1.7mg; from 0.2 to 11.5 and 22.00mg, respectively. These processes increased phytate, oxalate, tannins and saponins from 0.00mg to 125.58 and 116.5mg; traces to 135.50mg and 112.3mg; traces to 0.15 and 0.16mg and from traces to 0.05 and 0.05mg, respectively. The yam dishes prepared with fresh, sun and shade dried, as well as pulverized vegetables had increased protein from 5.4 in A-102 –yam dish prepared with sun dried ugu oyibo to 12.6% in A-101 –yam dish prepared with shade dried and ash from 4.6 in in A-103- yam dish prepared with shade dried okpa okuko to 9.50% in A-105-yam dish prepared with fresh sweet potato.. These dishes had traces of phytate, oxalate, tannins and saponins. However, dish prepared with sun dried ugu oyibo leaves had increases in phytate oxalate, tannins and saponins and food toxicants from (traces to 1.21,4.34,16.6 and 14.5g, respectively). Iron, zinc, copper and calcium in these dishes increased. Iron increased from 3.5 to 33.5mg, zinc from traces to 4.2mg, copper from traces mg to 1.4mg and calcium from 2.00 to 25.50mg, respectively. The dishes prepared with fermented oil bean seeds, fresh okpa okuku leaves and fresh sweet potato leaves had increases in beta-carotene that ranged from traces to 52.00, 25.3 and 24.9mg each. The dishes prepared with fresh sweet potato leaves and that prepared with fresh ugu oyibo leaves had the best organoleptic attributes and general acceptability. (7.5 and 7.3, respectively).

15
CHAPTER ONE INTRODUCTION
1.1 Background information
Inadequate food and nutrient intake, improper feeding practices, poor nutrition education,
insufficient food availability at household level, domestic processing techniques and food
preparation methods are among the major causes of malnutrition (NDHS, 1990).
Nutrition and nutrition-related diseases continue to be a problem of public health
significance in Nigeria.
Several efforts are in place to reduce malnutrition. These efforts amongst others are
studies undertaken in Nigeria to assess the prevalence of malnutrition in the target
population.
Some of these studies were the Nigeria Demographic and Health Survey (NDHS, 1990),
the Participatory Information Collection study (PIC, 1993), the Multiple Indicator Cluster
Survey (MICS, 1995), the Benchmark Survey (1996) and the most recent, National Food
Consumption and Nutrition Survey (NFCNS) (IITA, 2004) among others.
These studies over the years established high prevalence of protein-energy malnutrition
(PEM), especially in children 0-5 and pre-school (IITA, 2004). PEM contributes to as
much as 52% of all deaths (Micro Nutrient Initiative, 2004).
National Demographic and Health Survey (NDHS,1990 ) reported 43% stunting among
children under five, the UNICEF/OAU Participatory Information Collection study (PIC,
1993) reported 52% stunting, 9% wasting and 36% underweight among children of the
same age group.
16
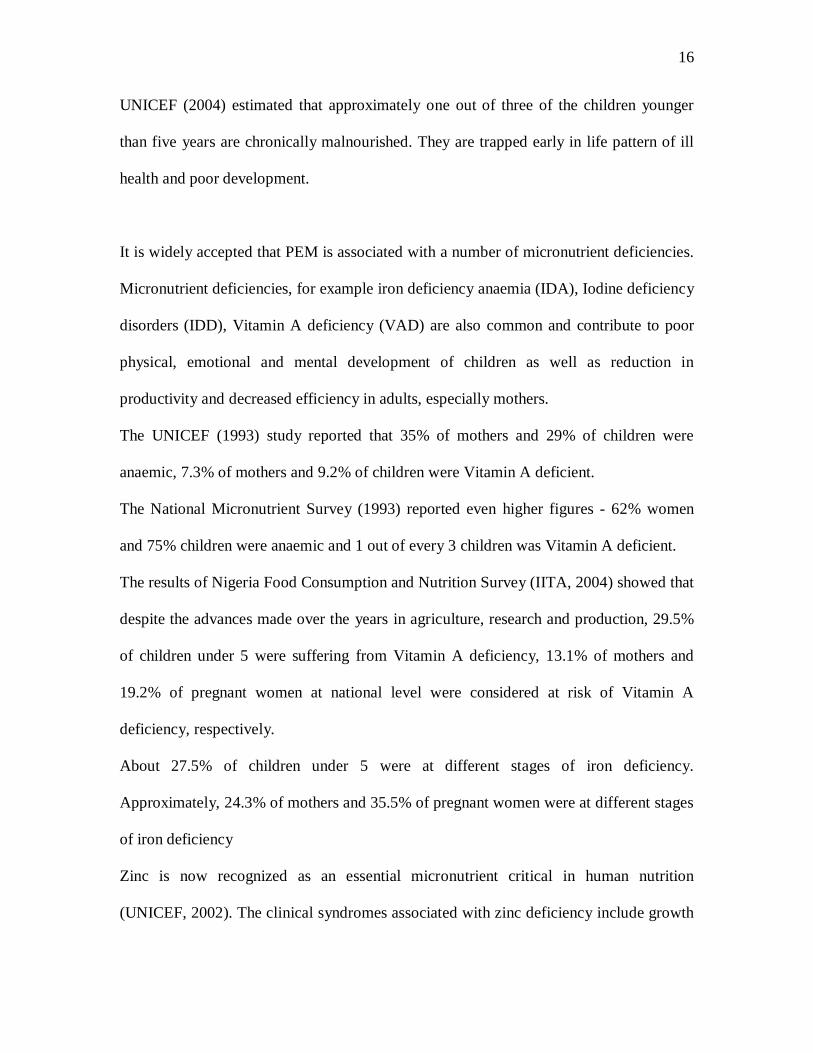
UNICEF (2004) estimated that approximately one out of three of the children younger
than five years are chronically malnourished. They are trapped early in life pattern of ill
health and poor development.
It is widely accepted that PEM is associated with a number of micronutrient deficiencies.
Micronutrient deficiencies, for example iron deficiency anaemia (IDA), Iodine deficiency
disorders (IDD), Vitamin A deficiency (VAD) are also common and contribute to poor
physical, emotional and mental development of children as well as reduction in
productivity and decreased efficiency in adults, especially mothers.
The UNICEF (1993) study reported that 35% of mothers and 29% of children were
anaemic, 7.3% of mothers and 9.2% of children were Vitamin A deficient.
The National Micronutrient Survey (1993) reported even higher figures - 62% women
and 75% children were anaemic and 1 out of every 3 children was Vitamin A deficient.
The results of Nigeria Food Consumption and Nutrition Survey (IITA, 2004) showed that
despite the advances made over the years in agriculture, research and production, 29.5%
of children under 5 were suffering from Vitamin A deficiency, 13.1% of mothers and
19.2% of pregnant women at national level were considered at risk of Vitamin A
deficiency, respectively.
About 27.5% of children under 5 were at different stages of iron deficiency.
Approximately, 24.3% of mothers and 35.5% of pregnant women were at different stages
of iron deficiency
Zinc is now recognized as an essential micronutrient critical in human nutrition
(UNICEF, 2002). The clinical syndromes associated with zinc deficiency include growth
17
retardation, male hypogonadism, skin changes, mental lethargy, hepatosenomegaly, iron
deficiency anaemia and geophagia (WHO/UNICEF, 2002).
Apart from low zinc levels due to rapid growth, pregnancy and lactation cause zinc
deficiency if these increased needs are not met.
At the national level 20% of children under 5 are zinc deficient. Zinc deficiency was
highest in pregnant women (43.8%). More than one-quarter (28.1%) of the mothers were
zinc deficient.
What these data show is that in spite of all efforts aimed at improving the nutritional
status of children and women, prevalence rates of nutritional deficiencies are on the
increase and remain unacceptably high. The consequences of malnutrition include
childhood morbidity and mortality, poor physical and mental development, poor school
performance and reduced adult size with reduced capacity for physical work (WHO,
1995).
If no action is taken, these conditions would spell enormous consequences for national
productivity, economic growth and human development (IITA, 2004).
Anambra state shares a common border with Imo state where the survey work was done.
This recent Nigeria food consumption and nutrition survey (IITA, 2004) was not
conducted in Anambra state. There is limited documented evidence concerning
micronutrient status of the members of the communities in Anambra. The result of the
survey in the neighbouring/adjoining states, Imo and Akwa Ibom, showed some pockets
of micronutrient deficiencies. These deficiencies are not restricted to only these states.
18
Anambra community has almost common culture and food habits with these states where
the study was conducted.
Besides, clinical signs observed during the community Health, Profile, Participatory
learning and action seminars/health observational tour (NPHCDA, 2005) in some wards
of Aguata LGA showed that there are clinical signs of malnutrition, especially those of
micronutrients. This development is surprising because the people of Aguata LGA
particularly cherish vegetables, which are the richest plant sources of micronutrients in
almost all dishes for eye appeal most importantly and to a lesser extent for their nutrient
concentrations.
Micronutrient deficiencies are global issues. They require fundamental approach such as
assessment of people’s traditional meals. This will ascertain the nutrient contents of
various foods to plan adequate intervention strategies to virtually eliminate malnutrition.
Identification of the commonly, traditionally and culturally accepted consumed foods to
determine their nutrient levels is imperative. It is also necessary to determine the factors
that affect consumption such as poor nutrition education, seasonal variation and
processing and preparation methods.
The identification of some lesser-known vegetables (“Okpa-okuko”, “ugu oyibo” and
sweet potato leaves) readily available and rich in micronutrients is considered important
for dietary diversification and to ensure that they are not extinct. “Ugbogulu”,
“eliamionu” and “arira” leaves are among the other more commonly consumed
vegetables.
Any domestic food processing methods to preserve and retain both macro and micro-
nutrients of these vegetables would go a long way to reduce micronutrient deficiencies
19
and be valuable in Igbo-Ukwu and Nigeria in general. Sun and shade-drying are among
the domestic food processing methods shown to preserve and retain nutrients in seasonal
green vegetables (Udofia, 2005; Wachap, 2005). The thrust of this study is to select both
known and lesser-known seasonal green leafy vegetables, sun and shade-dry and
pulverize them, prepare dishes and determine their nutrient content as consumed.
1.2 Statement of the problem
Micronutrient malnutrition is implicated in more than half of all childhood deaths
worldwide - a proportion unmatched by any infectious disease (Smith and Haddad,
2003). Improving micronutrient status can make enormous difference on the health
consequence of these nutrients. The question then is, how much nutrients do our
traditional dishes contain? World Health Organization (2002) observed that diet and
nutrient are important in the promotion and maintenance of good health throughout the
entire course of life.
In Anambra state, there are limited studies to determine the prevalence of micronutrient
deficiency among the communities. These are “hidden hunger” and have more to do with
the quality of diet rather than the quantity of food produced and consumed. The
observational tour of community health profile participatory learning and action
(NPHCDA, 2005) depicts that pockets of micronutrient deficiency exist. This position
supports the result of Nutritional Status of Children in Anambra State - A Comprehensive
Treatise (Nnanyelugo, 1980) reported that vitamin A intake of children in the state was
70% of the FAO requirements. Even though some progress had been made nationally to
combat micronutrient deficiency, urgent action is needed to accelerate the efforts to bring
micronutrient malnutrition under control. One of these efforts will be to assess the
nutrient content of the foods that are often consumed. This is because the quantity of each
20
nutrient in a diet is important and the quantity available for cellular utilization is equally
important
Fruits and vegetables are the richest sources of micronutrients. Vegetables are not usually
consumed alone, they are often served as accompaniment to main dishes such as in soup
meals, casseroles and sauces. They are served with basic staples such as maize meal,
cassava foofoo, gari and yam. They are equally served in combination as some of the
vegetable provide bounding effect to complement the other vegetables.
Yam (Dioscora spp.) is one of the basic and common staples cherished in Aguata LGA
by all members of families. Yam could be used as breakfast, lunch and supper dishes. It
is prepared traditionally in combination with vegetables or with just plain palm oil and
spices when vegetables are not available. Yam is a well appreciated staple in the local
government to the extent that culturally new yam festivals are celebrated to usher in new
yam harvest season. Combination of yam and vegetables provides adequate diet.
However, at times, it is consumed with only palm oil and spices as boiled or roasted yam
or plain yam pottage due to scarcity of vegetables. The consumption of yam without
vegetables is of low nutritional quality.
Varieties of green leafy vegetables cultivated or wildly grown and consumed are
available especially during the rainy season. Some of these green vegetables are more
common, popular and regularly consumed more than others which are lesser known but
have similar or even more nutrient value. These vegetables are lesser known and are
rarely consumed despite their nutrient content and their ability to withstand draught better
than most of the popular known and commonly consumed green vegetables. These lesser
21
known vegetables are going extinct and therefore needed to be studied to ascertain the
nutrient content as base for the promotion of its production and continued utilisation.
It is pertinent to apply sun and shade-drying to preserve and retain the nutrient content of
these lesser-know vegetables as well as the commonly used vegetables to ensure
availability of vegetable at affordable cost year round and in all season
Various yam dishes based on large quantities of these vegetables would be prepared. The
nutrient content and their availability would be determined in adult rats.
1.3 Justification
Plant foods are the major sources of nutrients in Igbo-Ukwu, Aguata LGA. However, the
availability of the nutrients, especially in fruits and vegetables vary with seasons and
locations. Fruits and vegetables are abundant during rainy season and are scarce in dry
season. This seasonal variation affects consumption and levels of micronutrient of the
consumers.
There are lesser-known edible vegetables that are readily available during dry season in
Igbo-Ukwu. Uvaria chamae “Okpa-okuko”, Ipomoea batata - sweet potato leaves
“Abuba ji nwanue” and Jatropha aconitifolia “ugu oyibo” leaves are among these lesser-
known vegetables; but they are rarely consumed .There are some popular green
vegetables that are commonly consumed mainly in yam dishes such as Curcubita pepo
broad pumpkin leaves “ugbogulu”, Corchorus trieus “Arira” and Celosia argentea
“Eliamionu” but are not as draught resistant as the lesser known green vegetables. It is
imperative to study the effect of domestic food processing techniques on the nutrient
content of some popular and commonly consumed vegetables (Curcubita pepo,
Corchorus trieus and Celosia argentea leaves) as well as lesser-known vegetables
22
(Uvaria chamae, Ipomoea batata leaves and Jatropha aconitifolia leaves) to preserve and
make them much more available all year at affordable prices. There is need to determine
the food potentials of these vegetables, especially those of the lesser-known vegetables to
encourage communities to consume them to meet their nutrient requirements. The result
of this study will encourage farmers to diversify food use of these vegetables and to
produce more for sale to generate income for other family needs.
1.4 Objectives of the study
1.4.1 General objective
The general objective of this study is to identify and determine the nutrient composition
of both popularly known and lesser-known vegetables that Igbo-Ukwu community in
Aguata L ocal Government Area use to prepare various yam dishes and determine their
nutrient composition.
1.4.2 Specific objectives
The specific objectives were:
1. to identify common popular yam (Dioscorea rotundata) dishes prepared with
vegetables as consumed in Igbo-Ukwu-
2. to identify common and lesser-known vegetables used in preparing various yam
dishes consumed in Igbo-Ukwu.
3. sun and shade-dry and pulverize these vegetables and determine their nutrient and
anti-nutrient composition.
4. compare the effects of processing on the nutrient composition of these vegetables
and yam dishes.
23
5. prepare eight (8) yam dishes using fresh and processed (sun and shade-dried and
pulverized) vegetables as consumed in Igbo-Ukwu community.
6 determine their nutrient content of these dishes, micronutrient in particular.
7. determine the organoleptic attributes of the dishes among non-Igbo-Ukwu
indigenes in UNN for diversification of use of the dishes.
1. 5 Significance of the study
There is little or no information on the nutrient profile of some dishes consumed in Igbo-
Ukwu. Nutrient composition of some known vegetables varies due to soil and location.
The result of this study will provide a database on foods and their nutrient content
consumed in Igbo-Ukwu.
The data generated would assist food scientists and nutritionists to compile food
composition table for use in Nigeria and assess nutrient composition of different Nigeria
dishes.
The result will add to the body of information for long term planning and periodic
evaluation of health, educational, economical and agricultural services and action. The
information would be a useful contribution to the compilation of local food standards and
identification of areas of priority in food production and consumption.
It would encourage farmers to produce and process more yam and vegetables to ensure
availability, affordability and surplus for sale to generate income for health care and other
non-nutrition needs.
The information from the study would be useful in solving micronutrient deficiency
problems among communities, hospitals, clinics and schools. These institutions would

24
use the result to advise mothers on the appropriate meal selection and management to
offset seasonal scarcity, traditional processing techniques and preparation methods. They
will be useful for nutrition intervention programmes, adequate nutrition education and
dietary diversification.
Nutrition educators and promoters and home economics extension workers would use the
information to encourage and promote new micronutrient-rich dishes among the rural and
urban populace. It is hoped that such programmes would drastically reduce both
morbidity and mortality among the communities and improve their nutritional status.
25
CHAPTER TWO
LITERATURE REVIEW
2.1 Malnutrition
Hunger and malnutrition remain among the most devastating problems facing the
majority of the world’s poor and needy people. They continue to dominate the health of
the world’s poorest nations. Nearly 30% of humanity is currently suffering from one or
more of the multiple forms of malnutrition (WHO, 2000). Hunger and malnutrition in
their different forms contribute to about half of the deaths of young children. In Nigeria,
the percentage of all under five deaths associated with malnutrition was estimated at 52%
(WHO, 2000).
Malnutrition is an important problem on its own. This is because good nutrition is an
essential determinant of well-being and a fundamental right, because of the consequences
associated with malnutrition.
The consequences of malnutrition as indicated by anthropometry include childhood
morbidity and mortality, poor physical and mental development, school performance and
reduced adult size and capacity for physical work . Some 60% of the 10.9 million deaths
each year among children aged under five years in the developing world are associated
with malnutrition (WHO, 2002).
2.1.1 Causes of malnutrition
The root causes of malnutrition include poverty and inequity. Inadequate intake of food
and vital nutrients can slow down economic growth, thus aggravating the problem of
poverty and disease. In our efforts to promote proper nutrition, there is a tendency to
26
focus on bulk nutrients – carbohydrates, proteins and fats (the main constituents of our
staples). However, though these are important components of good nutrition, the human
body requires other nutrients for proper growth and good health. These are the
micronutrients - vitamins and minerals that the body requires in minute quantities and
deficiency of these micronutrients result in severe health related problems.
For several decades, it has been known that lack of key vitamins and minerals such as
iron, folate, iodine and vitamin A caused anaemia, cretinism and blindness in millions of
people globally.
2.1.2 Effects of malnutrition
Iodine deficiency is the greatest single preventable cause of brain damage and mental
retardation worldwide. It is estimated to affect more than 700 million people, most of
them located in the less developed countries (WHO/UNICEF, 1999). Over 2000 million
people have iron deficiency anaemia (WHO/UNICEF/United Nations University, 2001).
Vitamin A deficiency remains the single greatest preventable cause of needless childhood
blindness and increased risk of premature childhood mortality from infectious diseases.
More than 250 million children under five years of age suffer from sub clinical deficiency
(WHO/UNICEF, 1996). Intrauterine growth retardation for – gestational – age reference
curve, affects 23.8% or approximately 30 million newborn babies per year. This
profoundly influences growth, survival and physical and mental capacity in childhood (de
Onis M et al, 1996). It also has major public health implications in view of the increased
risk of developing diet-related chronic diseases later in life (Barker ; 1989).
27
Given the rapidity with which traditional diets and lifestyles are changing in many
developing countries, it is not surprising that food insecurity and under-nutrition persist
in the same countries where chronic diseases are emerging as a major epidemic.
2.1.3 Efforts to improve nutrition status
Improved nutrition requires:
(a) Adequate household food security,
(b) Healthy environment and control of infections, and
(c) Adequate maternal and child care.
For the young child and the pregnant woman, provision of adequate food during
pregnancy and lactation, promotion, protection and support of breastfeeding and
complementary feeding practices, including frequent feeding, growth monitoring with
appropriate follow-up actions, and nutritional surveillance are the most essential needs.
As the child grows older (and for the adult population as a whole), adequate diet is an
obvious human priority. Meeting this need requires employment and income generating
opportunities, dissemination of knowledge and support devices to increase food
production and distribution. These are key actions within broader national strategies to
combat hunger and malnutrition.
It is in recognition of the important role of food and nutrition to the overall health and
well-being of individuals and populations that the promotion of adequate food supply and
proper nutrition has been made one of the key elements of primary health care (PHC,
Guideline, 2004). The National Nutrition Programme has been conceived to provide the
necessary framework for the implementation of food and nutrition activities with the
primary health care.
28
2.2 New trend in nutrition
There is a general trend to increase fresh fruits and vegetable consumption mainly due to
their health properties (Huxely, et al; 2004). The dietary changes that characterise the
“nutrition transition” include both quantitative and qualitative changes in the diet. The
adverse dietary changes include shifts in the structure of the diet toward a higher energy
density diet with a greater role for fat and added sugars in foods, greater saturated fat
intake (mostly from animal sources), reduced intake of complex carbohydrates and
dietary fibre, and reduced fruit and vegetable intakes (Drewnowski, 1997). These dietary
changes are compounded by lifestyle changes that reflect reduced physical activity at
work and during leisure time (Ferro-Luzzi A et al, 1996). At the same time however,
poor countries continue to face food shortages and nutrient inadequacies.
Diets evolve over time and are influenced by many factors and complex interactions.
Income, prices, individual preferences and beliefs, cultural traditions as well as
geographical, environmental, social and economic factors all interact in a complex
manner to shape dietary consumption patterns.
Consumption of fruits and vegetables plays a vital role in providing a diversified and
nutritious diet. A low consumption of fruits and vegetables in many regions of the
developing world is, however, a persistent phenomenon, confirmed by the findings of
food consumption surveys (India nutrition profile, 1998).
2.2.1 Food values of vegetables
Vegetables play a very important role in the human diet supplying some of the things in
which other food materials are deficient. They are important in neutralising the acid
substances produced in the course of digestion of meats, cheese and other foods. They
29
are of value as roughage which promotes digestion and prevents constipation. They are
important sources of mineral elements needed by the body, especially rich in calcium and
iron. They are valuable sources of vitamin. Although vegetables in general are not
considered of great importance in furnishing proteins, carbohydrates and fats, some of
them such as dried beans, peas and lentils are rich in protein. Others such as potatoes,
sweet potatoes and carrots are important sources of carbohydrate.
Vegetables as a source of minerals:
At least 10 mineral elements are needed for proper growth and development of the body.
The green vegetables are good sources of these important mineral elements (Homer P. et
al, 1957).
Vegetable foods as sources of dietary fibre:
A certain quantity of bulky food is necessary for good health. Vegetables are the main
source of “dietary fibre”. Most vegetables, particularly the leafy ones are characterised
by high water content and relatively high percentage of cellulose or fibre. It is because of
their succulence and relatively large bulk that the leafy vegetables and root crops,
probably aid in the digestion of the more concentrated foods.
Vegetables as a source of vitamins:
The name ‘vitamin’ has been given to a group of food substances other than fats,
proteins, carbohydrates and salts that occur in small quantities in natural food materials.
They are essential for growth, for reproduction and for the maintenance of health. Green
30
and yellow vegetables are important sources of vitamin A. These leafy green and yellow
vegetables contribute about 33 percent of the vitamin A supplied by the major food crops.
They supply also about 25% of the ascorbic acid and appreciable quantity of thiamin,
niacin and folic acid. Potatoes and sweet potatoes supply about 16 percent of ascorbic
acid.
A Pharmacy on your plate:
In addition to vitamins, minerals and fibre, vegetables contain hundreds of substances
that are active all over the organism. These are called phytochemicals. Although much
research remains to be done regarding these elements, science has confirmed their
preventive powers against cancer, arteriosclerosis, etc (Serdula, M. K. et al, 1996).
Most phytochemicals act as antioxidants, which explains in part the preventive and
healing action of fruits, legumes, grains and vegetables. In spite of their minute
quantities and non-consideration as nutrients, phytochemicals perform numerous
preventive and healing functions in the body.
2.2.2 Drawbacks to vegetables consumption
None of the drawbacks associated with vegetables is significant enough to justify less
consumption. However, no matter how slight they may be, it is worthwhile being aware
of them.
31
2.3 Vegetables
What are vegetables?
A vegetable is basically any part of a plant that can be eaten. Plants naturally are not too
keen on being eaten, and have devised various methods of dissuading us from eating
them by storing their food in different parts of the plants. As a result, we have been able
to eat many different parts of selected plants – flowers, flower buds, leaves, leaf buds,
shoots, shoot buds, stems, flower stems, pollen, immature seeds, pods, fruits, tubers,
bulbs and roots, etc
Vegetables generally play an important part in the diets of many people in the tropics.
They provide essential minerals, vitamins and add flavour, variety, taste, colour and
aesthetic appeal to what will "otherwise be a monotonous diet (Anyika, 2002).
Vegetables are edible portions of plants usually used in making soup or served as integral
part of the main meal. The edible parts of plant could either be from seeds, nuts, fruits,
roots, tubers, bulbs, buds, flowers, leaves or stem. They include those useful wild and
cultivated leaves that are cholesterol and fat free. They could be low income sources of
nutrient. Organolepticially, vegetables are also valued for their supreme flavour, aroma,
texture and others (Ajakaiye et al; 1995; Ladan et al; 1996; Sobande, 2005).
Vegetables are known to constitute important sources of dietary fibre and could
contribute significantly to protein intake of man (Ajakaiye et al; 1995; Ladan et al; 1996).
Vegetables are good sources of vitamin in human body as well as protein, minerals and
fibre (Terra, 1966, Tindall, 1983;: Ajakaiye, 1995; Ladan et al; 1996), iron and calcium
(Pacey, 1980). Vitamins and minerals are derived mainly from vegetables. However,
where the main food has low protein, protein derived from vegetables is very
32
considerable. Green leafy vegetables are perishable and deteriorate few days after
harvest. It is known to keep them for long in their fresh state such as to retain the actual
nutrients, taste and colour as when freshly or newly harvested has remained a problem
yet unsolved (Onwuka et al., 2002). Green leafy vegetables contain calcium, iron, iodine
and vitamins (especially vitamin C). They contain water in varying amount (Akinlotan
and Ojuile, 2002) and are rich sources of fibre (Oladunmoye et al; 2005).
Green leafy vegetables
Green leafy vegetables (GLV) constitute an indispensable constituent of human diet in
Africa generally and West Africa in particularly (Oguntona and Oguntona, 1986).
Generally, they are consumed as cooked complements to the major staples like yam,
cocoyam, corn, guinea corn, millet, rice and plantains. Indeed most of the meals based on
these staples are considered incomplete without a generous serving of cooked green leafy
vegetables. The variety of green leafy vegetables so utilized are as diverse as both the
staples with which they are consumed and the localities. It has, for example been
estimated that perhaps over sixty species of green leafy vegetables are so used in Nigeria
alone (Okoli et al; 1988). These range from leaves of annuals and shrubs of the families,
amaranthaceae, compositae, portulacacea and solanacea, to leaves of trees like the
baobab. Many of these vegetable leaves (e.g, amaranth) are common in all areas of the
country but some (e.g, baobab) are restricted in their natural distribution – savannah
region of Nigeria.
In Nigeria, generally and Igbo-Ukwu community in particular, there is an immense
number of GLV both wild and cultivated vegetables which can be consumed raw,
however, they are mostly cooked. These GLVs range from the leaves of annuals,
33
perennials and shrubs to leaves of trees (Sobande, 2005). Many of these GLVs are
common in all areas of the country (e.g. amaranthus). There are seasonal variations in the
availability of many of these vegetables. In general, these vegetables grow abundantly
during the rainy season and more readily available than in the dry season. This seasonal
variation in production and availability naturally leads to variation in quantities
consumed by the local people (Oguntona, 1988).
Green leafy vegetables are important sources of vitamins A and C (ascorbate) and
minerals in the diet. The loss of most nutrients in these vegetables depends on the
processing conditions used and types of vegetable (Solanke and Awonorin, 2002). Above
all, β-carotene (pro vitamin A) as well as considerable quantities of various B-complex
vitamins and minerals are derived from green leafy vegetables. They are high in
moisture, cellulose and low in energy (Ihekoronye and Ngoddy, 1985). In addition to
ascorbate, many GLVs supply iron and calcium and are very good source of protein
("leaf protein"). However, this is not always recognised, because food composition tables
express 'leaf protein" on a fresh weight basis". Comparing the amount of food after
cooking, many GLVs have as much protein as beans (Pacey, 1980). Green leafy
vegetables lose nutritional quality very rapidly after harvesting. This is due to increase in
cellulose and decrease in sugar. If they are kept for long, the moisture and flavour are
lost. This is because enzymes convert sugar to starch and decrease ascorbate. Vegetables
spoil due to (a) microflora enzyme activity (yeast, moulds and bacteria) in moist and
warmth conditions and (b) insects and rodents attack affect production and nutrient
composition of vegetables (Ihekoronye and Ngoddy, 1985; Mayhew and Penny, I988).
34
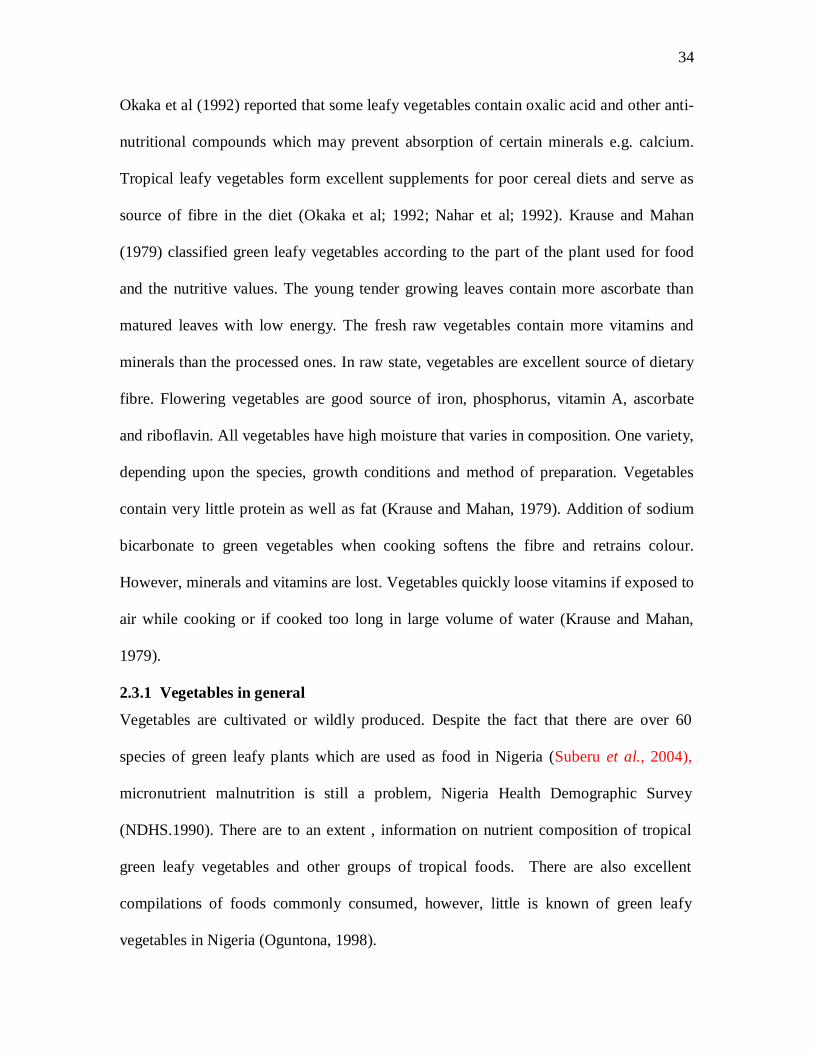
Okaka et al (1992) reported that some leafy vegetables contain oxalic acid and other anti-
nutritional compounds which may prevent absorption of certain minerals e.g. calcium.
Tropical leafy vegetables form excellent supplements for poor cereal diets and serve as
source of fibre in the diet (Okaka et al; 1992; Nahar et al; 1992). Krause and Mahan
(1979) classified green leafy vegetables according to the part of the plant used for food
and the nutritive values. The young tender growing leaves contain more ascorbate than
matured leaves with low energy. The fresh raw vegetables contain more vitamins and
minerals than the processed ones. In raw state, vegetables are excellent source of dietary
fibre. Flowering vegetables are good source of iron, phosphorus, vitamin A, ascorbate
and riboflavin. All vegetables have high moisture that varies in composition. One variety,
depending upon the species, growth conditions and method of preparation. Vegetables
contain very little protein as well as fat (Krause and Mahan, 1979). Addition of sodium
bicarbonate to green vegetables when cooking softens the fibre and retrains colour.
However, minerals and vitamins are lost. Vegetables quickly loose vitamins if exposed to
air while cooking or if cooked too long in large volume of water (Krause and Mahan,
1979).
2.3.1 Vegetables in general
Vegetables are cultivated or wildly produced. Despite the fact that there are over 60
species of green leafy plants which are used as food in Nigeria (Suberu et al., 2004),
micronutrient malnutrition is still a problem, Nigeria Health Demographic Survey
(NDHS.1990). There are to an extent , information on nutrient composition of tropical
green leafy vegetables and other groups of tropical foods. There are also excellent
compilations of foods commonly consumed, however, little is known of green leafy
vegetables in Nigeria (Oguntona, 1998).
35
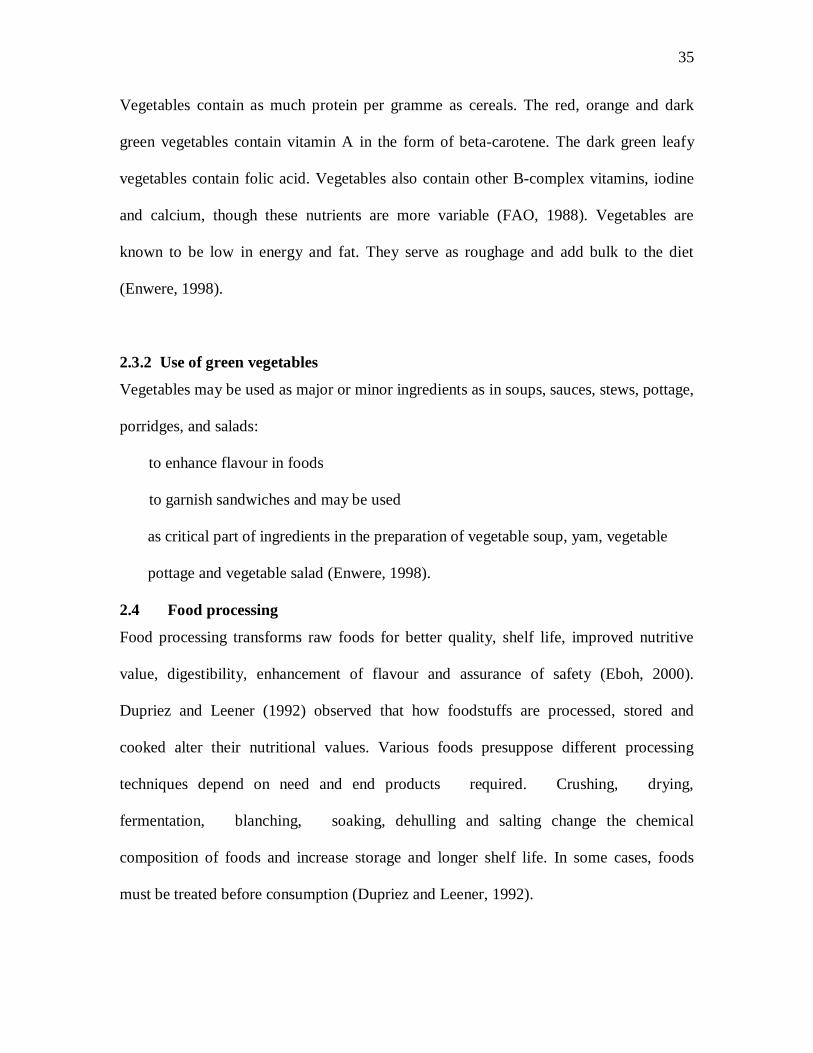
Vegetables contain as much protein per gramme as cereals. The red, orange and dark
green vegetables contain vitamin A in the form of beta-carotene. The dark green leafy
vegetables contain folic acid. Vegetables also contain other B-complex vitamins, iodine
and calcium, though these nutrients are more variable (FAO, 1988). Vegetables are
known to be low in energy and fat. They serve as roughage and add bulk to the diet
(Enwere, 1998).
2.3.2 Use of green vegetables
Vegetables may be used as major or minor ingredients as in soups, sauces, stews, pottage,
porridges, and salads:
to enhance flavour in foods
to garnish sandwiches and may be used
as critical part of ingredients in the preparation of vegetable soup, yam, vegetable
pottage and vegetable salad (Enwere, 1998).
2.4 Food processing
Food processing transforms raw foods for better quality, shelf life, improved nutritive
value, digestibility, enhancement of flavour and assurance of safety (Eboh, 2000).
Dupriez and Leener (1992) observed that how foodstuffs are processed, stored and
cooked alter their nutritional values. Various foods presuppose different processing
techniques depend on need and end products required. Crushing, drying,
fermentation, blanching, soaking, dehulling and salting change the chemical
composition of foods and increase storage and longer shelf life. In some cases, foods
must be treated before consumption (Dupriez and Leener, 1992).
36
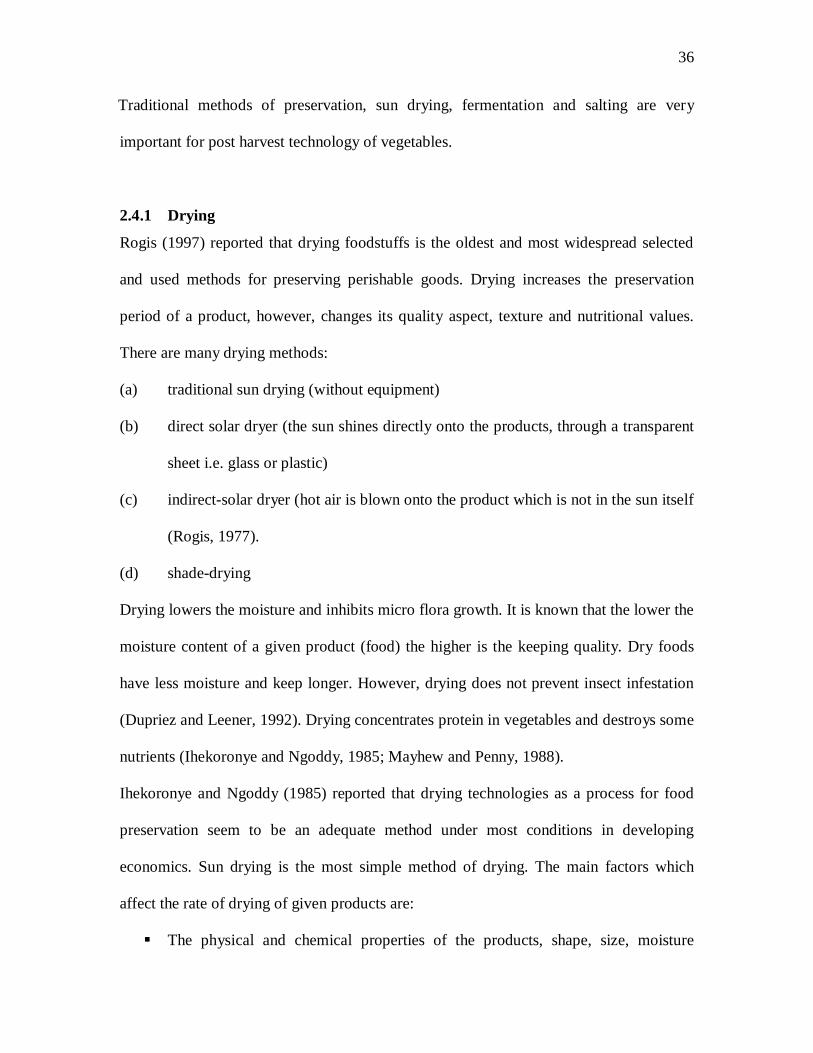
Traditional methods of preservation, sun drying, fermentation and salting are very
important for post harvest technology of vegetables.
2.4.1 Drying
Rogis (1997) reported that drying foodstuffs is the oldest and most widespread selected
and used methods for preserving perishable goods. Drying increases the preservation
period of a product, however, changes its quality aspect, texture and nutritional values.
There are many drying methods:
(a) traditional sun drying (without equipment)
(b) direct solar dryer (the sun shines directly onto the products, through a transparent
sheet i.e. glass or plastic)
(c) indirect-solar dryer (hot air is blown onto the product which is not in the sun itself
(Rogis, 1977).
(d) shade-drying
Drying lowers the moisture and inhibits micro flora growth. It is known that the lower the
moisture content of a given product (food) the higher is the keeping quality. Dry foods
have less moisture and keep longer. However, drying does not prevent insect infestation
(Dupriez and Leener, 1992). Drying concentrates protein in vegetables and destroys some
nutrients (Ihekoronye and Ngoddy, 1985; Mayhew and Penny, 1988).
Ihekoronye and Ngoddy (1985) reported that drying technologies as a process for food
preservation seem to be an adequate method under most conditions in developing
economics. Sun drying is the most simple method of drying. The main factors which
affect the rate of drying of given products are:
The physical and chemical properties of the products, shape, size, moisture
37
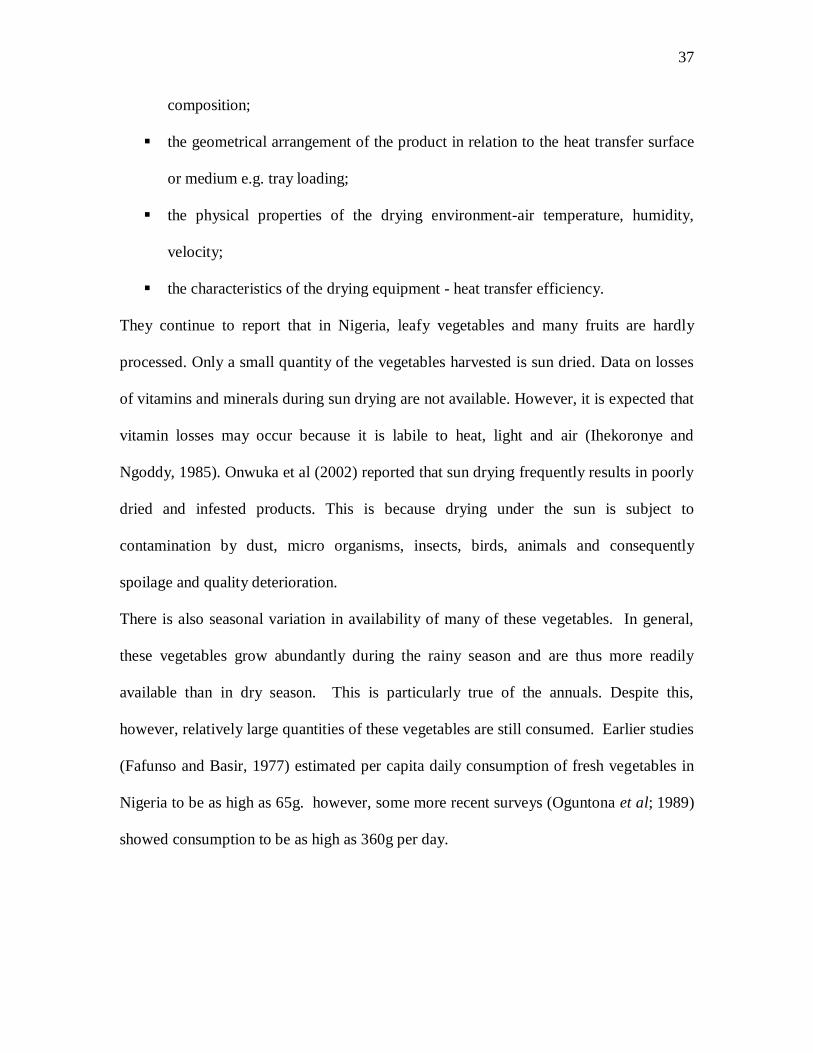
composition;
the geometrical arrangement of the product in relation to the heat transfer surface
or medium e.g. tray loading;
the physical properties of the drying environment-air temperature, humidity,
velocity;
the characteristics of the drying equipment - heat transfer efficiency.
They continue to report that in Nigeria, leafy vegetables and many fruits are hardly
processed. Only a small quantity of the vegetables harvested is sun dried. Data on losses
of vitamins and minerals during sun drying are not available. However, it is expected that
vitamin losses may occur because it is labile to heat, light and air (Ihekoronye and
Ngoddy, 1985). Onwuka et al (2002) reported that sun drying frequently results in poorly
dried and infested products. This is because drying under the sun is subject to
contamination by dust, micro organisms, insects, birds, animals and consequently
spoilage and quality deterioration.
There is also seasonal variation in availability of many of these vegetables. In general,
these vegetables grow abundantly during the rainy season and are thus more readily
available than in dry season. This is particularly true of the annuals. Despite this,
however, relatively large quantities of these vegetables are still consumed. Earlier studies
(Fafunso and Basir, 1977) estimated per capita daily consumption of fresh vegetables in
Nigeria to be as high as 65g. however, some more recent surveys (Oguntona et al; 1989)
showed consumption to be as high as 360g per day.
38
The importance of such a large constituent of the diet of the population in Nigeria has
long been ignored by food scientists and nutritionists. They have tended to stress on the
role and contribution of other dietary components to nutrition of Nigerians.
The recommendation to consume fruits and vegetables each day is based on evidence of
their role in prevention of many health problems such as obesity, diabetes, cancer and
heart disease. WHO have recommended that adults consume at least 400g fruits and
vegetables per day. Often this is phrased as “at least 5 portions per day”, based on a
typical portion size of 80g. This is widely accepted internationally. However, what is
less consistent is how countries classify “fruits and vegetables”.
There is a general trend to increase fresh fruit and vegetable consumption mainly due to
their health properties (Huxely, Lean, Crozier, John & Neil, 2004).
Different organisations (WHO, FAO, USDA, EFSA) recommend increasing fruit and
vegetable consumption to decrease risk of cardiovascular diseases and cancer.
Around the world, intake figures vary widely. For example, International Agency for
Research on Cancer data suggests that Israel and Spain average more than 400g/day/head
(IARC, 2003) whereas the UK, Philippines and India barely manage to get half the daily
target. We must remember that certain sub-groups will consume more or less than others.
In particular, people with less money generally consume less fruits and vegetables.
Overall, however, it is likely that most people consume far less than the
recommendations. Changes in meal patterns and lifestyles over recent years in many
areas have also probably resulted in lower intakes than in traditional diets.
How much is a portion?
39
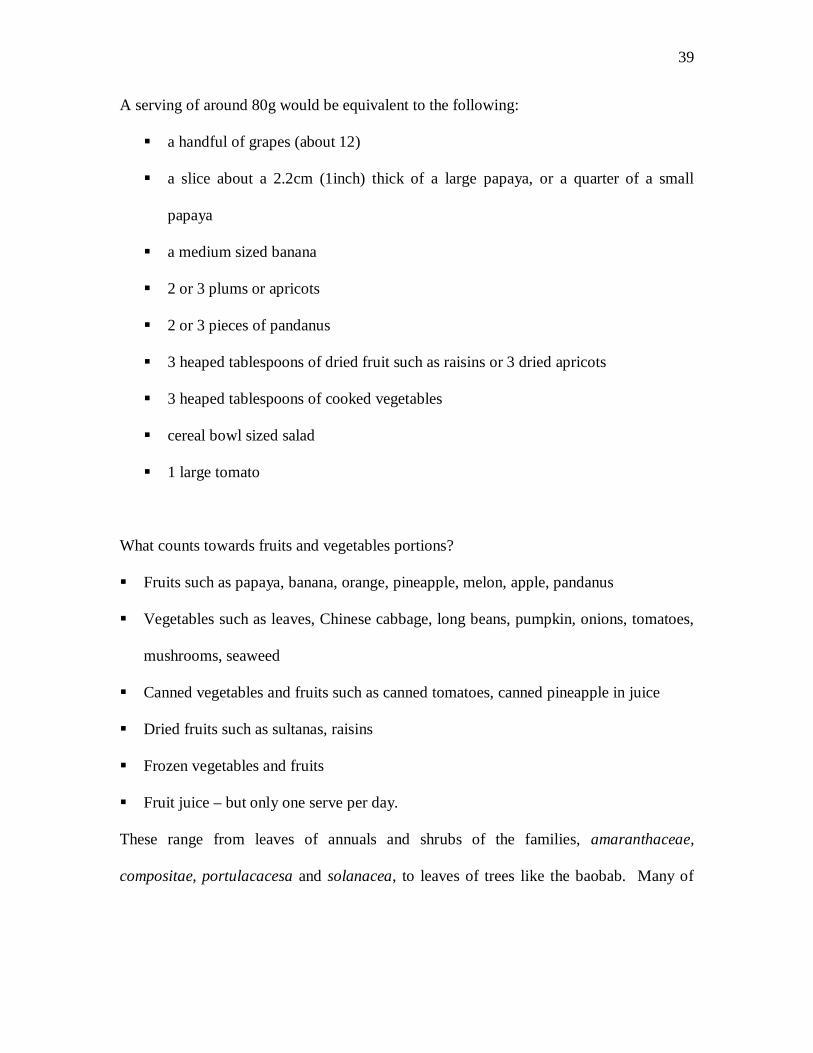
A serving of around 80g would be equivalent to the following:
a handful of grapes (about 12)
a slice about a 2.2cm (1inch) thick of a large papaya, or a quarter of a small
papaya
a medium sized banana
2 or 3 plums or apricots
2 or 3 pieces of pandanus
3 heaped tablespoons of dried fruit such as raisins or 3 dried apricots
3 heaped tablespoons of cooked vegetables
cereal bowl sized salad
1 large tomato
What counts towards fruits and vegetables portions?
Fruits such as papaya, banana, orange, pineapple, melon, apple, pandanus
Vegetables such as leaves, Chinese cabbage, long beans, pumpkin, onions, tomatoes,
mushrooms, seaweed
Canned vegetables and fruits such as canned tomatoes, canned pineapple in juice
Dried fruits such as sultanas, raisins
Frozen vegetables and fruits
Fruit juice – but only one serve per day.
These range from leaves of annuals and shrubs of the families, amaranthaceae,
compositae, portulacacesa and solanacea, to leaves of trees like the baobab. Many of
40
these vegetable leaves (e.g, amaranth) are common in all parts of Nigeria, however, some
(e.g, baobab) are restricted in their natural distribution – savannah northern Nigeria.
2.5 Definition of fruits and vegetables
The recommendation to eat fruits and vegetables each day is based on evidence of their
role in prevention of many health problems such as obesity, diabetes, cancer and heart
disease. WHO have recommended that adults consume at least 400g fruits and
vegetables per day. This is widely accepted internationally. However, what is less
consistent is how countries classify “fruits and vegetables”. WHO’s 2003 technical
report, Diet and Nutrition and the Prevention of Chronic Diseases, states, “The category
of tubers, i.e, potatoes, cassava, should not be included in fruits and vegetables” (p.58).
Yet many countries around the world do include these crops within their fruit and
vegetable promotion campaigns. There is also some controversy about whether or not
some other foods – beans and lentils (dahls), nuts, seeds, seaweed and mushrooms –
should be included in the “fruits and vegetables” group.
The components of fruits and vegetables which seem to be protective include fibre,
vitamins and minerals (particularly folate as well as antioxidants like selenium, zinc, beta
carotene) and some other phytochemicals. The question we can therefore consider is: Do
these other foods contain enough of these protective substances? In the updated pacific
three food group system and food guide, fruits and vegetables are in the “protective food”
group. This group is defined as including seaweed, mushrooms and other fruits and
vegetables. Foods such as taro, yam, cassava and plantain are included within the
“starchy energy food” group. Nuts, seeds, lentils and beans are included in the “body-
building food” group.
41
The small number of plants we consume are being increasingly well studied. So we now
know a lot about their vitamin and antioxidant content and their health protective effects.
The most powerfully protective domesticated vegetables that we consume are spinach,
garlic, pumpkin, broccoli, brussels sprouts, carrots, sweet potato, melon, red pepper,
cucumber, winter squash, frozen peas, more or less in that order. These are outstanding
vegetables, however every vegetable is an important contributor to well-being. While
roots and tubers are an important slow burning energy food, vegetables are responsible
for more subtle feelings of daily well-being and for protection from long-term
degenerative disease. Scientists fear that many of these important vegetables are fast
disappearing, however, leaving behind just a fraction of the most popular varieties and a
growing dependence on foreign vegetables that are less nutritious and more dependent on
pesticides and fertilizer. “There are lots of reasons to be concerned about African green
leafy vegetables”, says Patrick Maundu, a Kenyan ethno botanist. He studies the
relationship between plants and people. “Traditional vegetable crops are not only part of
our rituals, they are used to fend off malaria, help nursing mothers build up their milk
supply and assist rural communities to survive long periods of draught”.
Three commonly known and consumed vegetables – cucurbita pepo (ugbogulu), celosia
argentea (eliamionu) and corchorus tridens (ariraa) - and three non-conventional leafy
vegetables – ipomoea batata (sweet potato leaves), jatropha aconitifolia (ugu-oyibo) and
uvaria chamea (okpa-okuko) – would be analysed when fresh and processed.
Morphology of the plants
1. Cucurbita pepo cucurbitaceael (ugbogulu):
Habitat: The plant is grown in hot humid regions throughout the world.
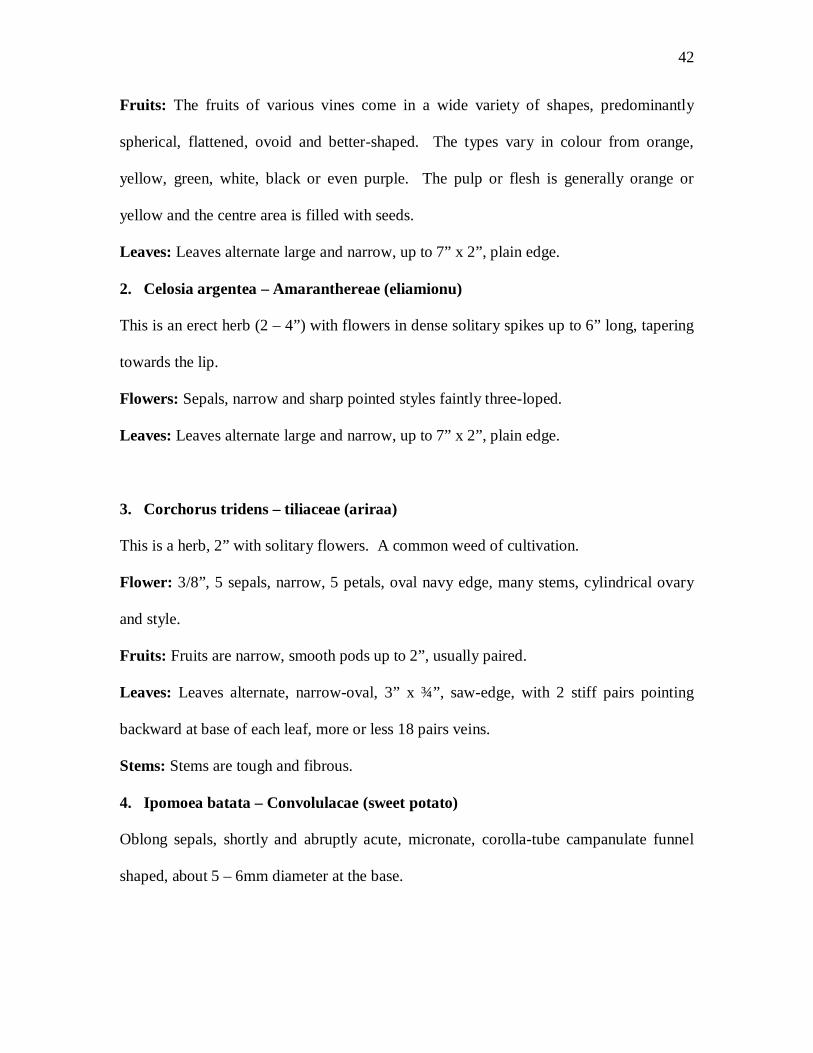
42
Fruits: The fruits of various vines come in a wide variety of shapes, predominantly
spherical, flattened, ovoid and better-shaped. The types vary in colour from orange,
yellow, green, white, black or even purple. The pulp or flesh is generally orange or
yellow and the centre area is filled with seeds.
Leaves: Leaves alternate large and narrow, up to 7” x 2”, plain edge.
2. Celosia argentea – Amaranthereae (eliamionu)
This is an erect herb (2 – 4”) with flowers in dense solitary spikes up to 6” long, tapering
towards the lip.
Flowers: Sepals, narrow and sharp pointed styles faintly three-loped.
Leaves: Leaves alternate large and narrow, up to 7” x 2”, plain edge.
3. Corchorus tridens – tiliaceae (ariraa)
This is a herb, 2” with solitary flowers. A common weed of cultivation.
Flower: 3/8”, 5 sepals, narrow, 5 petals, oval navy edge, many stems, cylindrical ovary
and style.
Fruits: Fruits are narrow, smooth pods up to 2”, usually paired.
Leaves: Leaves alternate, narrow-oval, 3” x ¾”, saw-edge, with 2 stiff pairs pointing
backward at base of each leaf, more or less 18 pairs veins.
Stems: Stems are tough and fibrous.
4. Ipomoea batata – Convolulacae (sweet potato)
Oblong sepals, shortly and abruptly acute, micronate, corolla-tube campanulate funnel
shaped, about 5 – 6mm diameter at the base.

43
Fruit: Fruit capsules very rarely developed in African specimens, glabrous seeds; plants
cultivated, but sometimes apparently wild in abandoned farmland.
Leaves: Leaf-lobes entire or nearly so.
Sepals: Opiculate sepals, 7 – 10mm long. Plants cultivated for their edible subterraneous
tubers, sometimes escaped from cultivation.
Stems: Stems mostly prostrate, thick leaves, broad – ovate to orbicular in outline,
corolate or truncate at base, entire or angular to palmately 3 – 5 (-7) lobed, petiole up to
15cm long; corolla pale violet 3 – 4.5cm long. The sweet potato is a very important
market vegetable which fits into rotations with basic three-or-six-month crops.
5. Jatropha aconitifolia, Euphorbiaceae (ugu-oyibo)
This is a shrub or small tree, up to 20ft high, with thick glabrous branchlets.
Flowers: Yellowish-green.
Fruit: Ellipsoid, scarcely lobed, about 1inch long, black when ripe. Commonly
cultivated in our area. It is common in the tropics.
6. Uravae chamae (okpa okuko)
2.6 Nutritional and antinutritional factors of green leafy vegetables.
Leafy vegetables preparations include the raw salad, widely known all over the world, in
partially or completely cooked or fried forms. In most Nigerian households, the inclusion
of a leafy vegetable preparation in daily diet is an accepted practice. These green leafy
vegetables are inexpensive in the wet season, are easily and quickly cooked, and are rich
in several nutrients such as vitamins, minerals, proteins, etc (Oke, 1966; Gopalen et al;
1971).
44
There is a lot of evidence showing that consumption of plenty of fruits and vegetables is
good for our health. What is it exactly in fruits and vegetables that make them so
healthy? Fruits and vegetables contain many important nutrients along with other natural
substances that protect us from various health problems. All fruits and vegetables contain
different nutrients or different amounts of the nutrients. For example, one fruit may be
particularly high in vitamin C while another may be very high in potassium.
Vegetables are important to get enough vitamins for health. They are particularly
important as a source of vitamin A, vitamin C and folate (folic acid, folacin). These three
are the ‘biggest’, but most vegetables are a ‘good’ source of thiamin (B1), potatoes and
green leafy vegetables are rated a ‘good’ source of riboflavin (B2), and potatoes, broccoli,
cauliflower and tomatoes are ‘good’ source of pantothenic acid. Pyridoxine (B6) is
important in brain function, immune system function and as a precursor to several
important hormones. Potatoes, spinach, peas, carrots, watercress and onions are rated as
‘good’ sources of pyridoxine (B6). Many vegetables contain small but useful amount of
vitamin E. Vegetables are generally very good sources of most minerals (with the
exception of iron), tubers and roots as an energy source aside. It is the protective
phytochemicals and the vital vitamin C, vitamin A and folic acid content that make
vegetables essential to human well-being. Vegetables are generally a good source of
calcium, and green beans in particular are a good source.
Fruits and vegetables are generally high in antioxidants. These protect the cells from
oxidant damages, which is thought to be involved in the development of cancer, heart
disease and some other health problems. Fruits and vegetables contain vitamin C, beta-
carotene and other substances called flavenoids which, all act as antioxidants. Naturally
45
occurring flavenoids in vegetables (and fruits) have been shown to spare the body
vitamin E. Flavenoids act as antioxidants and consequently reduce the ‘consumption’ of
vitamins in protecting cell membranes. Vegetables contain compounds that are valuable
antioxidants and protectants. Chief among these are the carotenoids. There are over 600
carotenoids in plants and in some animals:
Beta-carotene: This is converted by the body to vitamin A.
Fibre: This is found in all fruits and vegetables (and some other foods) and it keeps
the gut healthy, and also reduces blood glucose and fat levels.
Folate (folic acid): One of the B complex vitamins.
Potassium: It is an essential mineral. It plays a part in regulating blood pressure and
also helps to reduce blood pressure.
Fruits and vegetables are also generally low in
Fat: Nearly all fruits and vegetables are extremely low in fat, containing just
negligible amounts. An exception is avocado, which is high in fat, although mainly
mono-unsaturated fats, which are the healthiest type.
Calories: Most fruits and vegetables are high in water and fibre and low in fat and
calories. This means that they can form a generous part of a weight controlling diet.
Salt: Fruits and vegetables (unprocessed) are low in salt and sodium.
The presence of a large number of inexpensive edible green leafy vegetables, their
abundance and their attributive qualities create interest to study the nutritional value of
selected green leafy vegetables.
46
2.6.1 Nutrient composition of vegetables
Suburu et a/ (2004) reported that green leafy vegetable forms an indispensable
constituent of human diet. Considerable amount of vitamins and minerals are supplied in
addition to oils, fat and fibre. Vegetables are either cultivated or grow wild (Suburu,
2004) in form of herb, shrub, climbers or exact plant (Audu , 2000).
Enwere (1998) postulated that vegetables contain non-volatile acids, sugar, organic acids,
minerals, salts, volatile sulphur compounds, such as tannins and non-volatile acids such
as malic, citric, oxalic and succinate which contribute to flavor. Colour of vegetables
depends on the pigmentation it contains. Anthiocynin imparts blue, purple, and red
colours. Chlorophyll imparts green leafy yellow colours of ripe tomatoes, carrots, sweet
potatoes and maize (Enwere, 1998).
The carbohydrate content of vegetables is the indigestible fibre materials such as
cellulose, hemicellulose, and lignin. Besides, they contain some small quantities of
sugars such as glucose, fructose, sucrose, and starch. The degree of maturity determines
the proportion of the fibre in vegetable. The turgidity of the vegetables depends on the
water content which is between 75% and 95% (Enwere, 1998).
2.6.2 Proximate composition of green leafy vegetables
2.6.2a Moisture
Fresh vegetables are high in moisture that ranges from 72% in cassava leaves to 92 - 93%
in Indian spinach and waterleaf. The level in individual samples would depend on the
following;
i. Age (how tender or tough - maturity stage)
ii. Agronomic practices prevailing during cultivation,
iii. Freshness
47
Freshness is a function of the time lag between harvest and analysis as well as the
conditions under which the samples are kept during that time lag.
The moisture content of the dried vegetables are understandably variable. Generally, the
vegetables are traditionally sun dried and depending on the local environmental
conditions the materials continue to loose moisture while in storage or display for sale
(Eka, 1998).
2.6.2b Energy
Green leafy vegetables are poor sources of energy because of the low dry matter (DM)
contents of many leaves. This may be one of the reasons much work has not been
conducted on components of leafy vegetables.
2.6.2c Protein content
Green leafy vegetables have crude protein content that ranges from 1.5 to 1.7%.
However, some workers (Aleter and Adeogun, 1995) have obtained a mean of 4.2% for
seventeen (17) of such vegetables. When dried samples were used, the crude protein
content ranged from 15.0 to 30% and the mean is usually around 20% (Aleter and
Adeogun, 1995).
The quality of the protein in green leafy vegetables is almost 75% total nitrogen in most
vegetables in protein nitrogen. Many reports showed that leafy vegetables protein is low
in sulphur amino acids (Eka, 1998).
48
2.6.2d Ether extract
Among the proximate components fat represents the lowest in this category. It is unusual
to find levels of ether extract exceeding 1.9% in fresh leafy vegetable, however values in
dry samples can range from 1.0 - 30.0% (Eka; 1998). Green leafy vegetable is a poor
source of fat.
2.6.2e Mineral composition
Among the factors that influence mineral composition of green leafy
vegetables, soil fertility (or type of fertilizer) is probably the most
important. This is perhaps the reason for the wide variation observed in some published
work (Eka, 1998). Some vegetables contain more of potassium than sodium (FAO, 1988).
2.6.2f Vitamins
The factors that influence the amount of vitamins in green leafy vegetable are cultivars,
in particular, maturity and sometimes light may be of importance. The richest sources of
thiamin include green leafy vegetables. It is known that vitamin is retained at high levels
in the leaves prior to transfer to the seed or root at maturity (Eka, 1998).
2.6.2g Antinutrient component
The major anti nutritional factors in green leafy vegetable are phytates and oxalates (Eka,
1998).
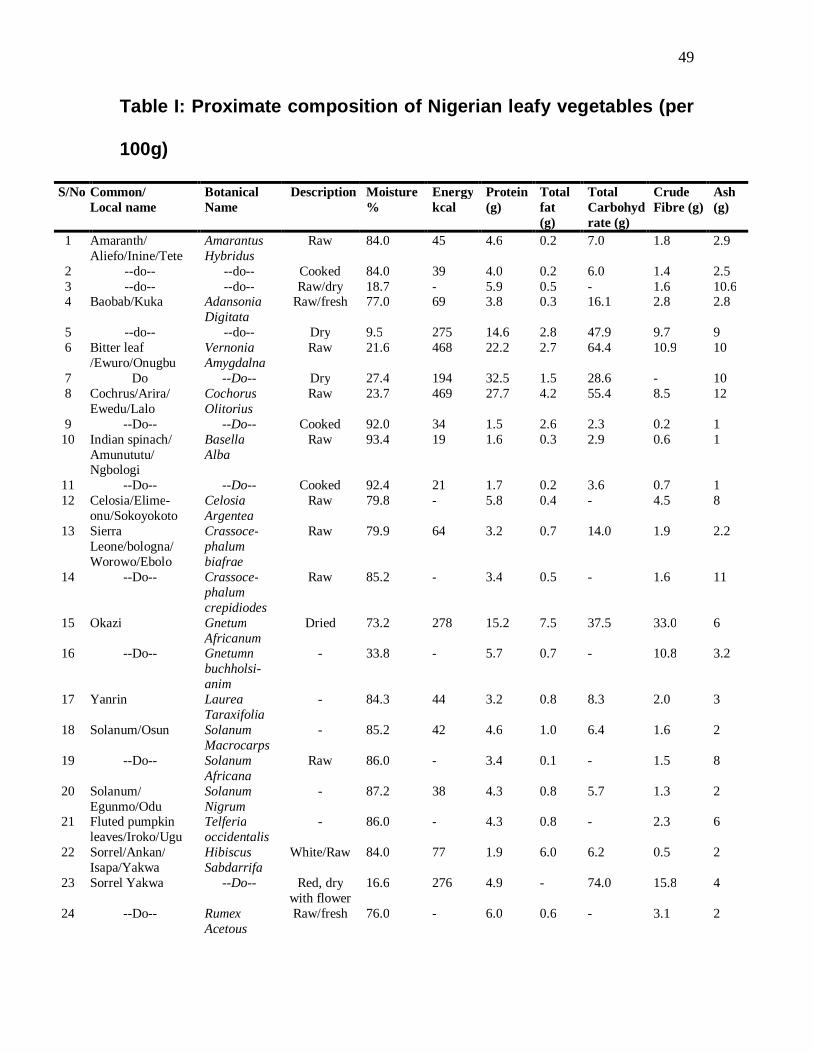
49
Table I: Proximate composition of Nigerian leafy vegetables (per
100g)
S/No Common/ Local name
Botanical Name
Description Moisture %
Energy kcal
Protein (g)
Total fat (g)
Total Carbohydrate (g)
Crude Fibre (g)
Ash (g)
1 Amaranth/ Aliefo/Inine/Tete
Amarantus Hybridus
Raw 84.0 45 4.6 0.2 7.0 1.8 2.9
2 --do-- --do-- Cooked 84.0 39 4.0 0.2 6.0 1.4 2.5 3 --do-- --do-- Raw/dry 18.7 - 5.9 0.5 - 1.6 10.6 4 Baobab/Kuka Adansonia
Digitata Raw/fresh 77.0 69 3.8 0.3 16.1 2.8 2.8
5 --do-- --do-- Dry 9.5 275 14.6 2.8 47.9 9.7 9 6 Bitter leaf
/Ewuro/Onugbu Vernonia Amygdalna
Raw 21.6 468 22.2 2.7 64.4 10.9 10
7 Do --Do-- Dry 27.4 194 32.5 1.5 28.6 - 10 8 Cochrus/Arira/
Ewedu/Lalo Cochorus Olitorius
Raw 23.7 469 27.7 4.2 55.4 8.5 12
9 --Do-- --Do-- Cooked 92.0 34 1.5 2.6 2.3 0.2 1 10 Indian spinach/
Amunututu/ Ngbologi
Basella Alba
Raw 93.4 19 1.6 0.3 2.9 0.6 1
11 --Do-- --Do-- Cooked 92.4 21 1.7 0.2 3.6 0.7 1 12 Celosia/Elime-
onu/Sokoyokoto Celosia Argentea
Raw 79.8 - 5.8 0.4 - 4.5 8
13 Sierra Leone/bologna/ Worowo/Ebolo
Crassoce- phalum biafrae
Raw 79.9 64 3.2 0.7 14.0 1.9 2.2
14 --Do-- Crassoce- phalum crepidiodes
Raw 85.2 - 3.4 0.5 - 1.6 11
15 Okazi Gnetum Africanum
Dried 73.2 278 15.2 7.5 37.5 33.0 6
16 --Do-- Gnetumn buchholsi-anim
- 33.8 - 5.7 0.7 - 10.8 3.2
17 Yanrin Laurea Taraxifolia
- 84.3 44 3.2 0.8 8.3 2.0 3
18 Solanum/Osun Solanum Macrocarps
- 85.2 42 4.6 1.0 6.4 1.6 2
19 --Do-- Solanum Africana
Raw 86.0 - 3.4 0.1 - 1.5 8
20 Solanum/ Egunmo/Odu
Solanum Nigrum
- 87.2 38 4.3 0.8 5.7 1.3 2
21 Fluted pumpkin leaves/Iroko/Ugu
Telferia occidentalis
- 86.0 - 4.3 0.8 - 2.3 6
22 Sorrel/Ankan/ Isapa/Yakwa
Hibiscus Sabdarrifa
White/Raw 84.0 77 1.9 6.0 6.2 0.5 2
23 Sorrel Yakwa --Do-- Red, dry with flower
16.6 276 4.9 - 74.0 15.8 4
24 --Do-- Rumex Acetous
Raw/fresh 76.0 - 6.0 0.6 - 3.1 2
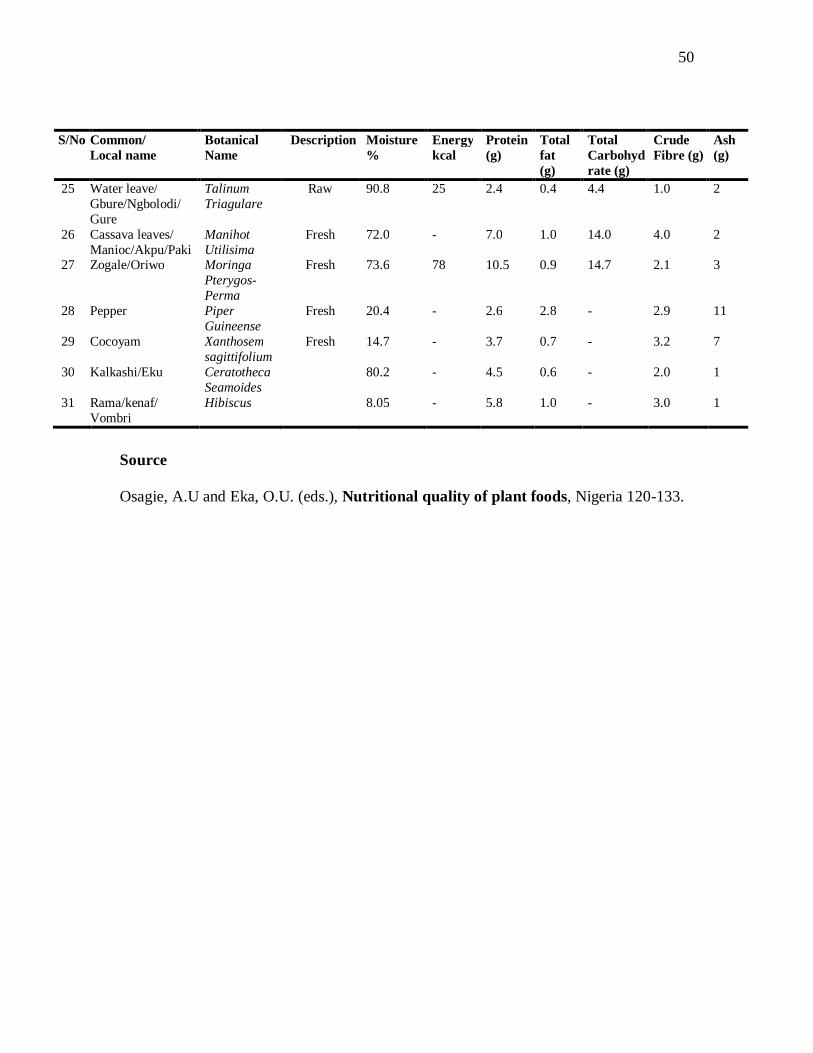
50
S/No Common/ Local name
Botanical Name
Description Moisture %
Energy kcal
Protein (g)
Total fat (g)
Total Carbohydrate (g)
Crude Fibre (g)
Ash (g)
25 Water leave/ Gbure/Ngbolodi/ Gure
Talinum Triagulare
Raw 90.8 25 2.4 0.4 4.4 1.0 2
26 Cassava leaves/ Manioc/Akpu/Paki
Manihot Utilisima
Fresh 72.0 - 7.0 1.0 14.0 4.0 2
27 Zogale/Oriwo Moringa Pterygos- Perma
Fresh 73.6 78 10.5 0.9 14.7 2.1 3
28 Pepper Piper Guineense
Fresh 20.4 - 2.6 2.8 - 2.9 11
29 Cocoyam Xanthosem sagittifolium
Fresh 14.7 - 3.7 0.7 - 3.2 7
30 Kalkashi/Eku Ceratotheca Seamoides
80.2 - 4.5 0.6 - 2.0 1
31 Rama/kenaf/ Vombri
Hibiscus 8.05 - 5.8 1.0 - 3.0 1
Source Osagie, A.U and Eka, O.U. (eds.), Nutritional quality of plant foods, Nigeria 120-133.
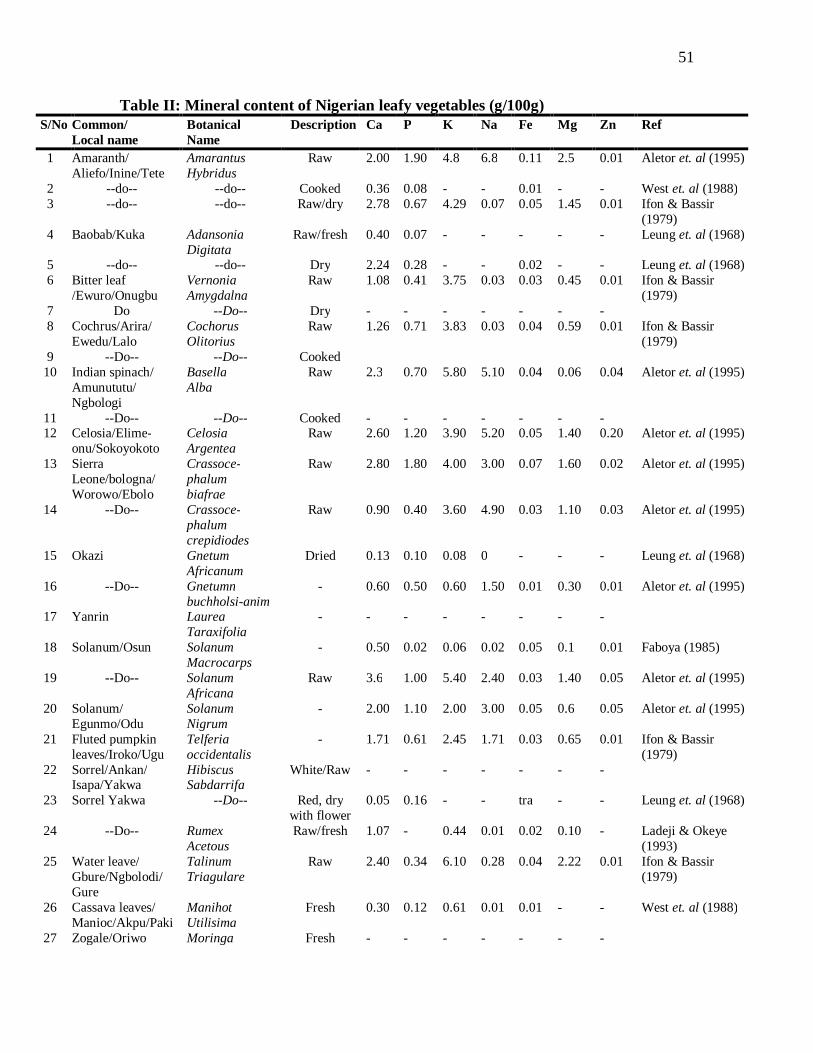
51
Table II: Mineral content of Nigerian leafy vegetables (g/100g) S/No Common/
Local name Botanical Name
Description Ca P K Na Fe Mg Zn Ref
1 Amaranth/ Aliefo/Inine/Tete
Amarantus Hybridus
Raw 2.00 1.90 4.8 6.8 0.11 2.5 0.01 Aletor et. al (1995)
2 --do-- --do-- Cooked 0.36 0.08 - - 0.01 - - West et. al (1988) 3 --do-- --do-- Raw/dry 2.78 0.67 4.29 0.07 0.05 1.45 0.01 Ifon & Bassir
(1979) 4 Baobab/Kuka Adansonia
Digitata Raw/fresh 0.40 0.07 - - - - - Leung et. al (1968)
5 --do-- --do-- Dry 2.24 0.28 - - 0.02 - - Leung et. al (1968) 6 Bitter leaf
/Ewuro/Onugbu Vernonia Amygdalna
Raw 1.08 0.41 3.75 0.03 0.03 0.45 0.01 Ifon & Bassir (1979)
7 Do --Do-- Dry - - - - - - - 8 Cochrus/Arira/
Ewedu/Lalo Cochorus Olitorius
Raw 1.26 0.71 3.83 0.03 0.04 0.59 0.01 Ifon & Bassir (1979)
9 --Do-- --Do-- Cooked 10 Indian spinach/
Amunututu/ Ngbologi
Basella Alba
Raw 2.3 0.70 5.80 5.10 0.04 0.06 0.04 Aletor et. al (1995)
11 --Do-- --Do-- Cooked - - - - - - - 12 Celosia/Elime-
onu/Sokoyokoto Celosia Argentea
Raw 2.60 1.20 3.90 5.20 0.05 1.40 0.20 Aletor et. al (1995)
13 Sierra Leone/bologna/ Worowo/Ebolo
Crassoce- phalum biafrae
Raw 2.80 1.80 4.00 3.00 0.07 1.60 0.02 Aletor et. al (1995)
14 --Do-- Crassoce- phalum crepidiodes
Raw 0.90 0.40 3.60 4.90 0.03 1.10 0.03 Aletor et. al (1995)
15 Okazi Gnetum Africanum
Dried 0.13 0.10 0.08 0 - - - Leung et. al (1968)
16 --Do-- Gnetumn buchholsi-anim
- 0.60 0.50 0.60 1.50 0.01 0.30 0.01 Aletor et. al (1995)
17 Yanrin Laurea Taraxifolia
- - - - - - - -
18 Solanum/Osun Solanum Macrocarps
- 0.50 0.02 0.06 0.02 0.05 0.1 0.01 Faboya (1985)
19 --Do-- Solanum Africana
Raw 3.6 1.00 5.40 2.40 0.03 1.40 0.05 Aletor et. al (1995)
20 Solanum/ Egunmo/Odu
Solanum Nigrum
- 2.00 1.10 2.00 3.00 0.05 0.6 0.05 Aletor et. al (1995)
21 Fluted pumpkin leaves/Iroko/Ugu
Telferia occidentalis
- 1.71 0.61 2.45 1.71 0.03 0.65 0.01 Ifon & Bassir (1979)
22 Sorrel/Ankan/ Isapa/Yakwa
Hibiscus Sabdarrifa
White/Raw - - - - - - -
23 Sorrel Yakwa --Do-- Red, dry with flower
0.05 0.16 - - tra - - Leung et. al (1968)
24 --Do-- Rumex Acetous
Raw/fresh 1.07 - 0.44 0.01 0.02 0.10 - Ladeji & Okeye (1993)
25 Water leave/ Gbure/Ngbolodi/ Gure
Talinum Triagulare
Raw 2.40 0.34 6.10 0.28 0.04 2.22 0.01 Ifon & Bassir (1979)
26 Cassava leaves/ Manioc/Akpu/Paki
Manihot Utilisima
Fresh 0.30 0.12 0.61 0.01 0.01 - - West et. al (1988)
27 Zogale/Oriwo Moringa Fresh - - - - - - -
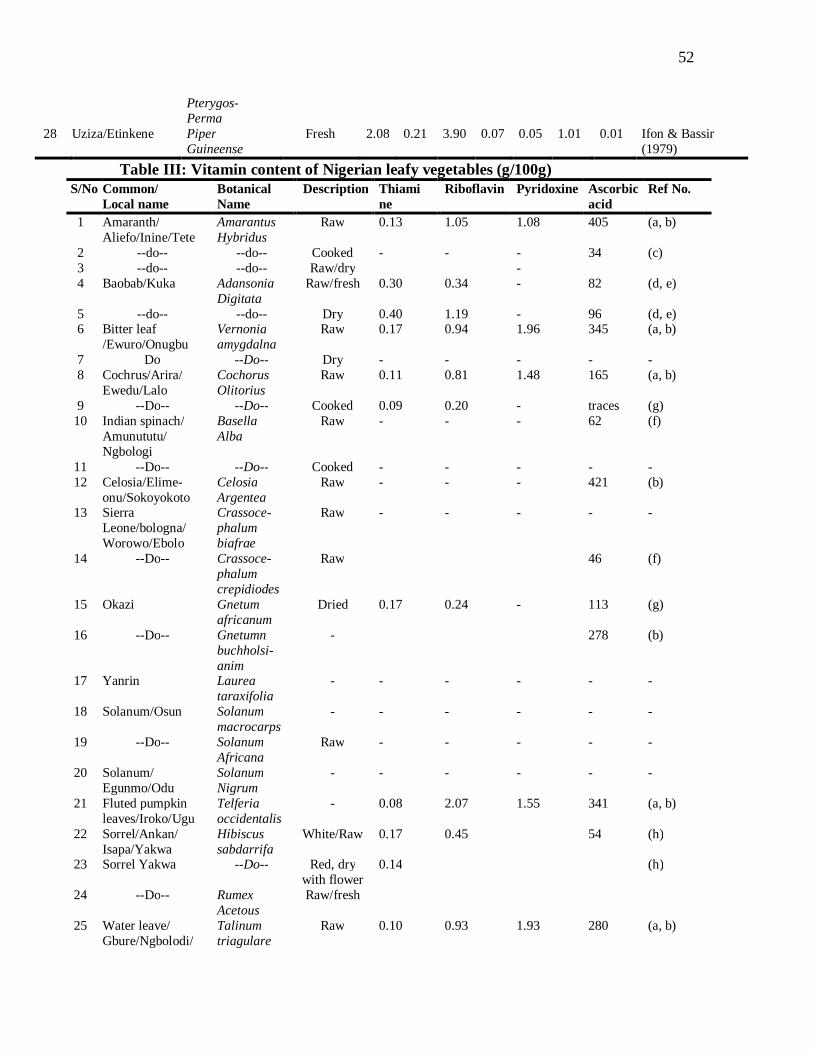
52
Pterygos- Perma
28 Uziza/Etinkene Piper Guineense
Fresh 2.08 0.21 3.90 0.07 0.05 1.01 0.01 Ifon & Bassir (1979)
Table III: Vitamin content of Nigerian leafy vegetables (g/100g) S/No Common/
Local name Botanical Name
Description Thiami ne
Riboflavin Pyridoxine Ascorbic acid
Ref No.
1 Amaranth/ Aliefo/Inine/Tete
Amarantus Hybridus
Raw 0.13 1.05 1.08 405 (a, b)
2 --do-- --do-- Cooked - - - 34 (c) 3 --do-- --do-- Raw/dry - 4 Baobab/Kuka Adansonia
Digitata Raw/fresh 0.30 0.34 - 82 (d, e)
5 --do-- --do-- Dry 0.40 1.19 - 96 (d, e) 6 Bitter leaf
/Ewuro/Onugbu Vernonia amygdalna
Raw 0.17 0.94 1.96 345 (a, b)
7 Do --Do-- Dry - - - - - 8 Cochrus/Arira/
Ewedu/Lalo Cochorus Olitorius
Raw 0.11 0.81 1.48 165 (a, b)
9 --Do-- --Do-- Cooked 0.09 0.20 - traces (g) 10 Indian spinach/
Amunututu/ Ngbologi
Basella Alba
Raw - - - 62 (f)
11 --Do-- --Do-- Cooked - - - - - 12 Celosia/Elime-
onu/Sokoyokoto Celosia Argentea
Raw - - - 421 (b)
13 Sierra Leone/bologna/ Worowo/Ebolo
Crassoce- phalum biafrae
Raw - - - - -
14 --Do-- Crassoce- phalum crepidiodes
Raw 46 (f)
15 Okazi Gnetum africanum
Dried 0.17 0.24 - 113 (g)
16 --Do-- Gnetumn buchholsi-anim
- 278 (b)
17 Yanrin Laurea taraxifolia
- - - - - -
18 Solanum/Osun Solanum macrocarps
- - - - - -
19 --Do-- Solanum Africana
Raw - - - - -
20 Solanum/ Egunmo/Odu
Solanum Nigrum
- - - - - -
21 Fluted pumpkin leaves/Iroko/Ugu
Telferia occidentalis
- 0.08 2.07 1.55 341 (a, b)
22 Sorrel/Ankan/ Isapa/Yakwa
Hibiscus sabdarrifa
White/Raw 0.17 0.45 54 (h)
23 Sorrel Yakwa --Do-- Red, dry with flower
0.14 (h)
24 --Do-- Rumex Acetous
Raw/fresh
25 Water leave/ Gbure/Ngbolodi/
Talinum triagulare
Raw 0.10 0.93 1.93 280 (a, b)
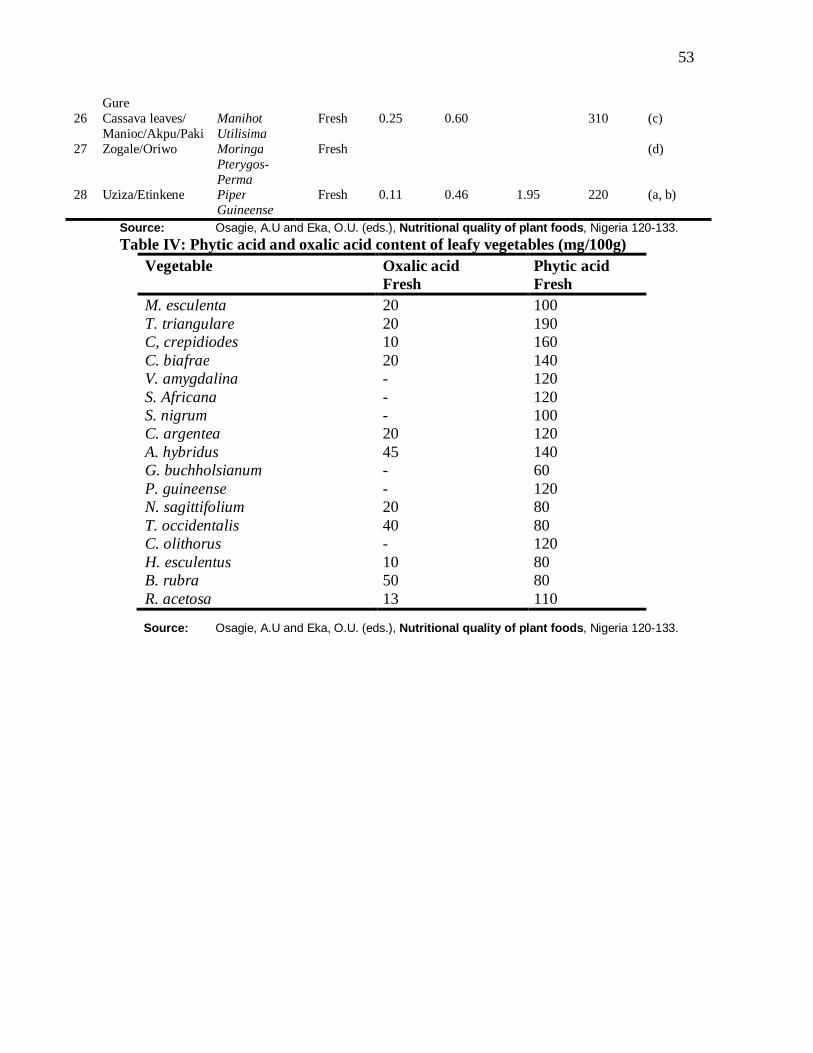
53
Gure 26 Cassava leaves/
Manioc/Akpu/Paki Manihot Utilisima
Fresh 0.25 0.60 310 (c)
27 Zogale/Oriwo Moringa Pterygos- Perma
Fresh (d)
28 Uziza/Etinkene Piper Guineense
Fresh 0.11 0.46 1.95 220 (a, b)
Source: Osagie, A.U and Eka, O.U. (eds.), Nutritional quality of plant foods, Nigeria 120-133. Table IV: Phytic acid and oxalic acid content of leafy vegetables (mg/100g)
Vegetable Oxalic acid Fresh
Phytic acid Fresh
M. esculenta 20 100 T. triangulare 20 190 C, crepidiodes 10 160 C. biafrae 20 140 V. amygdalina - 120 S. Africana - 120 S. nigrum - 100 C. argentea 20 120 A. hybridus 45 140 G. buchholsianum - 60 P. guineense - 120 N. sagittifolium 20 80 T. occidentalis 40 80 C. olithorus - 120 H. esculentus 10 80 B. rubra 50 80 R. acetosa 13 110
Source: Osagie, A.U and Eka, O.U. (eds.), Nutritional quality of plant foods, Nigeria 120-133.
54
2.7 Vegetable production and utilization
Vegetables are plants usually herbaceous that contain edible portion for soups, stews and
dishes served at daily meals in Nigeria, especially in Aguata local government area
(LGA) Anambra state. Herbs are seasonal vegetable. Classification is based on the
portion of the plant that is consumed. The edible portions include the root, tuber, flowers,
immature seeds and grains, stem and leaves (Mc Willians, 1979).
FAO (1988) reported that vegetables are large class of plant foods, rather difficult to
define but well understood by those who prepare and consume them. Vegetables give a
variety of flavour and colour to food items and relish. They are not consumed in large
quantities as the staple cereals and root/tuber. However, when vegetables are not
included in meals, the meals are said to be incomplete or bare in Aguata LGA.
Green leafy vegetables are important in the diet of many African countries. An
international plant production and protection group research irrigation (IPGRI) project on
traditional African leafy vegetables is yielding important insights into diversity, uses and
farmer management of germplasm that is challenging conventional beliefs about their
underutilized species. Development specialists did not think that green leafy vegetables
are cultivated very widely but gathered from the wild. The reverse was the case when
socioeconomic research sponsored by IPGRI released its report. The report maintained
that farmers actively cultivated green leafy vegetables and managed them according to
the diversity they knew was within the species. Farmers would select the material they
plant depending on who would be buying and consuming the leaves (i.e. bitter herb of
several distinct genotypes with different degrees of bitterness that different cultural
groups prefer (Audu et al; 2000).
55
The wide variation in environment within a location, the level and
scope of different vegetables depend on major factors that affect plant growth such as the
hot tropical environment, water, soil, and pest condition (Eka, 1998). Most vegetables are
cultivated much more for income and very little for home consumption. Some leafy
vegetables are cultivated and harvested within few weeks (Audu et al; 2000).
2.8 Staple foods
These are foods that are commonly available in communities and consumed by every
family as their major source of nutrients for maintenance of good health. Staples common
in Igbo-Ukwu community include cooked cereals (such as maize, rice, etc), starchy roots
(such as cassava, sweet potato, yams and Irish potatoes), and starchy fruits
(banana/plantain). Nni-oka and akidi are among the local names of cooked staples
(Burgess, 2003).
2.8.1 Roots and tubers
Roots and tubers belong to the class of foods that basically provide energy in human diet
in form of carbohydrate. The term refer to any growing plant that stores edible material in
subterranean root, corn or tuber.
The development of root crops in the tropics was accelerated by the introduction of gari
processing technology in West Africa followed by promotion of cassava as a famine
reserve by several colonial governments such as the Dutch in Java and the British in West
Africa and India.
56
A further reason for the spread was the fact that during tribal warfare and invasions, the
invaders could not destroy or remove the food reserve, which could be kept conveniently
under the ground thus giving added food security to population.
Historically, very little attention has been paid to root crops by policy-makers and
researchers as most of their effort have been concentrated on cash crops or the more
familiar grains. Root crops were regarded as food mainly for the poor. They have played
very minor role in international trade. This misconception has lingered for so long
because of the lack of appreciation of the number of people who depend on these root
crops, and the number of lives that have been saved during famine or disasters by root
crops.
The fact that these root crops are mainly starchy has led to the disparagement of their
protein content, which is low compared to cereals. However, considering the quantities of
root crops consumed a day, their protein contribution is often significant (Onwueme,
1978).
In addition, root crops contain an appreciable amount of vitamins and minerals and may
have a competitive production advantage in terms of energy yield per hectare over cereals
produced in ecologically difficult conditions.
2.8.2 Yam origins and distribution
Yams are the only root crops in which the Asian and African species developed
independently of each other. The genus Dioscorea (a variety of yam) has a wider
diversity of origin with different species adapted to different ecosystems. Dioscorea
trifida is indigenous to tropical America. Dioscorea rotundata, dioscorea cayenesis,
dioscorea bulbifera and dioscorea dumentorum are native to West Africa. Dioscorea
57
alata, dioscorea esculenta and dioscorea opposita are indigenous to South Asia.
Dioscorea opposita and dioscorea japonica have their centre of origin in China. They
learned of the value of dioscorea alata from the Indian and Malayan seafarers who used
it on their ships on long voyages because it stored well and had antisorbutic properties.
The Portuguese soon adopted it and introduced it into Elmina and Sao Tome in West
Africa. Subsequently, through the Atlantic Slave Trade, the Portuguese carried the
African species, dioscorea rotundata and Dioscorea cayenesis, and the Asian species,
Dioscorea alata to the Caribbean where they became important staple foods (Coursey,
1976).
According to Coursey (1967), Dioscorea alata seems to have arisen from the wild
relatives, Dioscorea hamiltoni and Dioscorea persimilis, in the north and central parts of
the south east Asian peninsula, probably Burna or Assam. So also Dioscorea esculenta,
while Dioscorea hispida, Dioscorea pentaphylla and dioscorea bulbifera originated from
an Indo-Malayan centre. Dioscorea rotundata is of African origin, where it is known as
“water yam” indicating that it was brought across the water or sea. Dioscorea rotundata
is the most important African yam, especially in the forest zone, and is probably a hybrid
of the other African yam, Dioscorea cayensis, which is a savannah species. In West
Africa, it is grown in the roots and tubers belt, which extends 15oN and 15oS of the
equator (Coursey, 1976; Okigbo, 1978; Nweke, 1981).
Little is known about the origin of new world yams. They were of secondary importance
in the pre-Colombian era. Dioscorea trifida, an American domesticate, appears to have
originated on the borders of Brazil and Guyana, followed by a dispersion through the
Caribbean (Ayensu and Coursey, 1972). Yams were taken to the Americas through pre-

58
colonial Portuguese and Spanish expansion that began around 500 years ago. Historical
records of Dioscorea alata in West Africa and of African yams in the Americas date back
to the sixteenth century (Coursey, 1967).
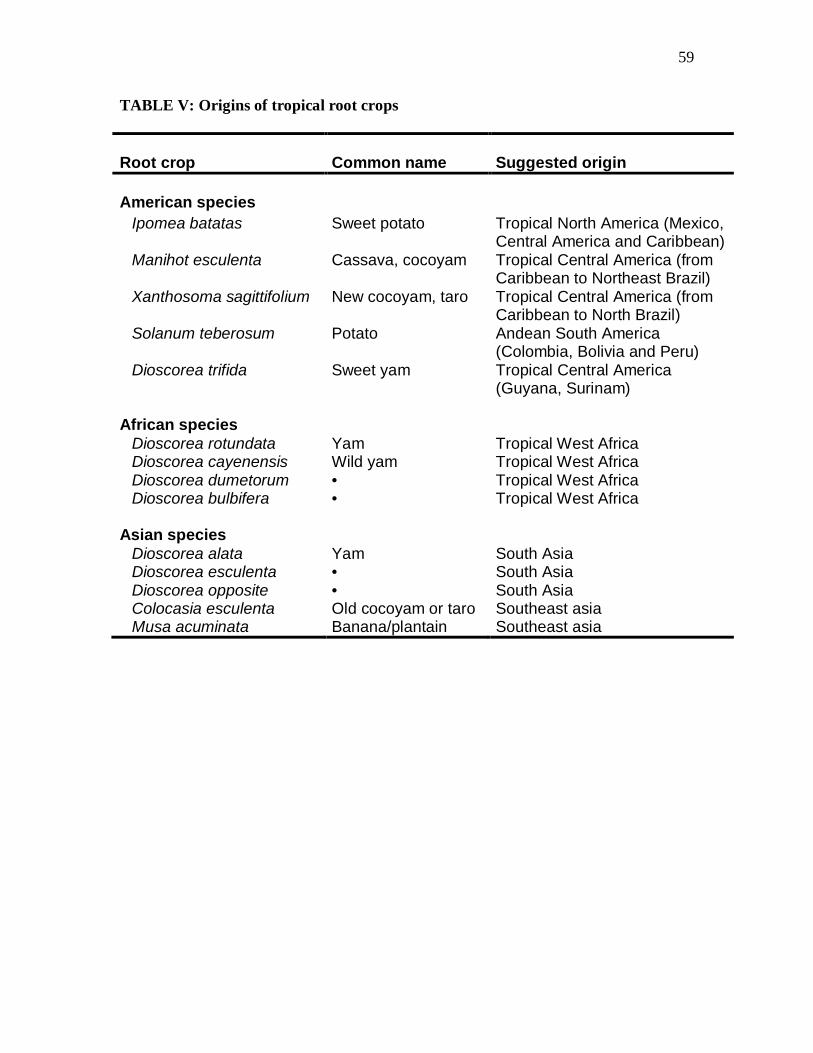
59
TABLE V: Origins of tropical root crops
Root crop
Common name
Suggested origin
American species
Ipomea batatas Sweet potato Tropical North America (Mexico, Central America and Caribbean)
Manihot esculenta Cassava, cocoyam Tropical Central America (from Caribbean to Northeast Brazil)
Xanthosoma sagittifolium New cocoyam, taro Tropical Central America (from Caribbean to North Brazil)
Solanum teberosum Potato Andean South America (Colombia, Bolivia and Peru)
Dioscorea trifida Sweet yam Tropical Central America (Guyana, Surinam)
African species Dioscorea rotundata Yam Tropical West Africa Dioscorea cayenensis Wild yam Tropical West Africa Dioscorea dumetorum • Tropical West Africa Dioscorea bulbifera • Tropical West Africa
Asian species
Dioscorea alata Yam South Asia Dioscorea esculenta • South Asia Dioscorea opposite • South Asia Colocasia esculenta Old cocoyam or taro Southeast asia Musa acuminata Banana/plantain Southeast asia
60
Morphology and organography
Dioscorea rotundata - dioscoreaceae.
This is the species with the suggested origin from Africa.
Common Names: White yam, white guinea yam.
Vernacular Name: Ji ocha (Igbo); Omifun (Yoruba) (Lawton, 1967)
This plant is usually a climber with tuberous rhizome or thick woody rootstock, palmate
leaves or rarely opposite, often cordate and digitately nerved, entire or divided small
flower, spicate, racemose or paniculate, unisexual.
Stalmens 6 or 3 reduce to staminodes, filaments free or shortly conunate; guthers 2-celled
fruit, a 3-valved capsule or berry. It is found in tropics and warm temperate regions. It is
widely cultivated for the edible tubers. The yam plant typically consists of three main
morphological parts: shoot, roots and tuber (or bulb). The tuber is the source of food in
West Africa and Nigeria in particular.
Normally the yam plant is established from tuber where the growth starts with sprouting
of the dormant tuber usually from the head end. During this growth cycle, one organ in
turn constitutes the major focus of growth (sink) to be followed by another (Sobulo,
1972).
The yam tuber is an important food crop of the tropics. Its production is hungered by the
fact that traditional agricultural methods are still being used by peasant farmers for its
cultivation, harvesting; transportation and storage. Thus, yams are generally more
important as a subsistence crop than a market vegetable, particularly in the humid areas
of West Africa.
61
All yams are presently classified as monocotyledons in spite of some evidence of the
occurrence of a second vestigial cotyledon in a number of species.
Yams are the most important food crops in West Africa, except for cereal (Coursey,
1967; Onwueme, 1978). They also form an important food source in other tropical
countries including East Africa, the Caribbean, South America, India and South East
Asia. However, West Africa remains the most important yam producing region in the
world.
62
CHAPTER THREE
3.0 MATERIALS AND METHOD
3.1 MATERIALS
Six (6) green leafy vegetables were selected for the study. Three common and popular
vegetables included broad pumpkin leaves (Curcubita pepo), “ugbogulu” (Celosia
argentea) “elieminoun” (Amaranthacease) and Corchorus trieus; “ariraa” (Tiliacese) and
three (3) other lesser known vegetables “okpa okuko” (Uvaria chamae), sweet potato
leaves (Ipomoea batatas), “abuba ji nwannu” and “ugu oyibo” (Jatropha aconitifolia)
leaves were used to prepare yam dishes
These vegetables and yam needed for the preparation of the dishes and sensory
evaluation were purchased from the local market in bulk for the entire study. Some of the
vegetables were obtained from family farm in Igbo-Ukwu. Other ingredients such as
palm oil, fermented oil bean, and salt were be purchased from Nsukka urban main
market. These vegetables were visually inspected to remove defective leaves.
3.2 Sample identification
A questionnaire was developed, validated and distributed to 30 house wives randomly
selected across the 3 quarters/zones (Ngo, Obiuno and Ifite) in Igbo-Ukwu. The subjects
represented those residing within and outside the town Igbo-ukwu).
This was necessary to obtain baseline information concerning their knowledge of
availability, accompanying staples, ingredients processing, preparation and utilization of
these 6 vegetables (Curcubita pepo, Celosia argentea, corchorus trideus, Uvaria chamae,
Ipomoea batatas and Jatropha aconitifolia leaves).
63
3.3 Sample preparation
The vegetables were each treated according to its type, as fellows:
3.3.1 Broad pumpkin leaves - “ugbogulu” (Curcubita pepo)
The tender leaves of “ugbogulu” were washed with clean water three times to remove
sand, dirt and waxy parts. The water was allowed to drain off completely before drying to
avoid spoilage and development of off flavour.
The clean leaves were divided into 3 portions. The first position served as the control
(fresh leaves). The remaining 2 portions were shredded, shade and sun dried,
respectively. Some of the dried leaves were pulverized into fine powder, name labeled
and packaged for various analysis.
3.3.2 “Eliemionu” (Celosia argentea)
The tender leaves of Celosia argentea were purchased in bulk, washed with the stalk to
avoid clamping together of the leaves and for easy drainage of water. The leaves were
picked out of stalk and the whole bulk was divided into 3 portions. The first portion
served as the control (fresh leaves). The remaining two portions were shredded, shade
and sun dried after drying, some of the leaves were pulverized to fine powder, name
labeled and packaged for various chemical analysis.
64
3.3.3 “Ariraa” (Corchorus trideus)
The tender leaves of “ariraa” were purchased in bulk, washed with the stalk to avoid the
leaves clamping and for easy drainage.
These clean washed leaves were slimy. This slimy property and mucilage provided their
binding capability when combined with other vegetables.
The clean drained vegetables were divided into three portions. The first portion serve as
the control (fresh leaves). The remaining two portions were shredded, sun and shade
dried, respectively. After drying, some of the dried leaves were pulverized into fine
powder, name labeled and packaged in polythene bags for chemical analysis.
3.3.4 “Akwukwo ji-nwannu (Ipomeoa batatas)
The tender leaves of Ipomoa batatas were purchased in bulk and washed, picked and
divided into three portions. The first portion served as the control (fresh), the remaining
two portions were shredded, shade and sun dried and some of the dried leaves were
pulverized into fine powder and name labeled for packing in polythene bags for chemical
analysis.
3.3.5 “Okpa okuku” (Uvaria chamae)
The tender leaves of Uvaria chamae were purchased in bulk and washed three times in
clean water. These clean leaves were picked and divided into 3 portions.
The first portion was shredded, shade and sun dried. Some of the dried leaves were
pulverized into fine powder, name labeled and packaged in polythene bags for chemical
analysis.
65
3.3.6 “Ugu oyibo” (Jatropha aconitifolia)
The tender leaves of ugu oyibo were washed properly with clean water two to three
times. The liquid content of the stalk of these vegetables were are scratchy and sensitive
to the skin. The researcher was very careful to avoid this whitish fluid when picking the
leaves. These clean leaves were drained before shredding.
The leaves were divided into 3 portions. The first portion served as the control (fresh).
The remaining two portions were shredded, shade and sun dried. Some of the dried leaves
were pulverized into fine powder and preserved for analysis

66
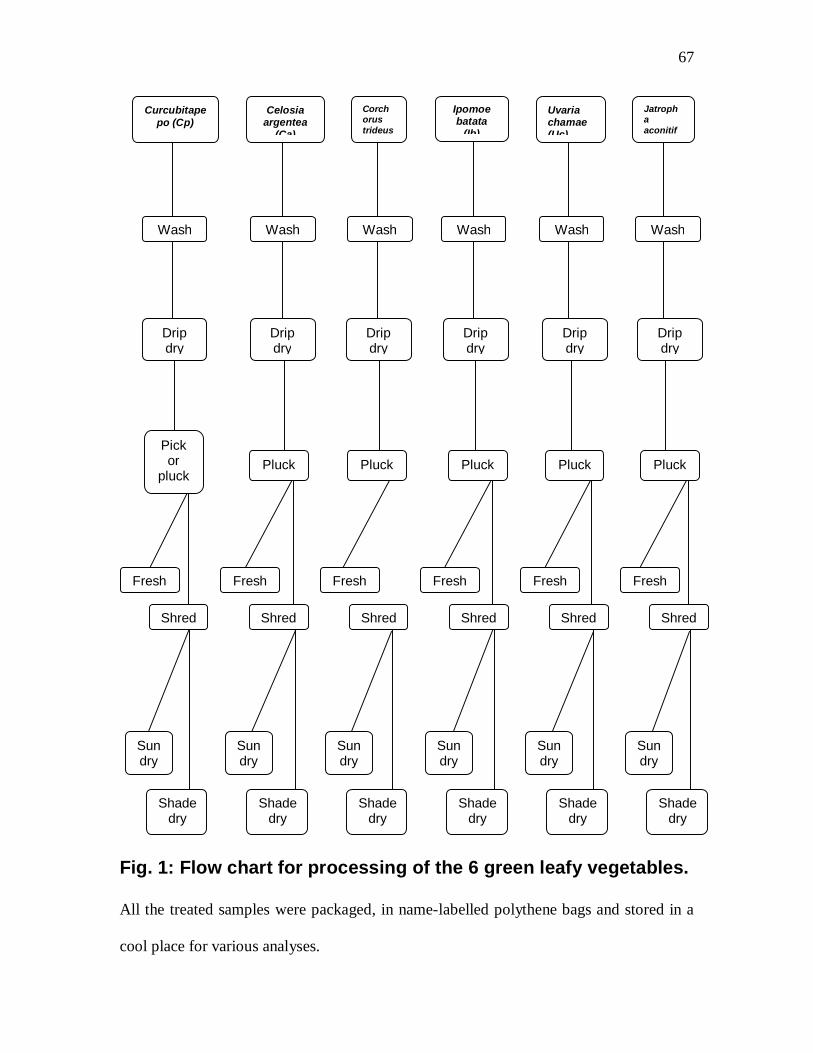
67
Fig. 1: Flow chart for processing of the 6 green leafy vegetables. All the treated samples were packaged, in name-labelled polythene bags and stored in a
cool place for various analyses.
Curcubitapepo (Cp)
Celosia argentea
(Ca)
Corchorus trideus
Ipomoe batata
(Ib)
Uvaria chamae (Uc)
Jatropha aconitif
Wash Wash Wash Wash Wash Wash
Drip dry
Drip dry
Drip dry
Drip dry
Drip dry
Drip dry
Pick or
pluck
Pluck
Pluck
Pluck
Pluck
Pluck
Fresh Fresh Fresh Fresh Fresh Fresh
Shred Shred Shred Shred Shred Shred
Sun dry
Sun dry
Sun dry
Sun dry
Sun dry
Sun dry
Shade dry
Shade dry
Shade dry
Shade dry
Shade dry
Shade dry
68
3.4 Chemical analysis
The proximate composition of the fresh, shade and sun-dried vegetables was determined
using the standard methods of AOAC (1995).
Iron (Fe), iodine (I2), zinc (Zn), calcium (Ca) and vitamin A (b-carotene) were
determined using AOAC method (1995).
3.4.1 Crude protein determination
Crude protein was determined by automatic micro-Kjeldahl methods of AOAC (1995).
One gramme (1g) of each sample was weighed into the micro-Kjeldahl flask for
digestion. About 20ml conc. (H2SO4 and Kjeldahl catalyst mercury tablets) were added
into the flask. The flask was heated on an electric heater and boiled till the speck
disappeared. The digest was made up to 100ml with distilled water.
The sample was distilled by placing 5ml of the sample in the micro-Kjeldahl distillation
flask. Five millilitres (5ml) of boric acid mixed indicator (1.2 methyl blue and 2 drops of
methyl red) were placed in a 100ml conical flask. The conical flask will be placed under
the condenser such that the condenser tip was under the mixture. Ten millilitres of 60%
NaOH will be carefully added and closed with glass cork steam to prevent the escape of
ammonia. Steam was allowed to pass through for 5 minutes until the volume of the
distillate in the conical flask doubled its size. At this point, the distillate was titrated with
0.01 NHCl until a faint pink colour persisted.
The % protein was calculated with the formula:
% N = Titre x 00.1 x 20 x 14 x 6.25 x 100
1g x 1000
69
3.4.2 Fat determination (Soxhlet method)
The fat content of the samples was determined using the Soxhlet extraction method
AOAC (1995).
The extraction flask was washed, dried, cooled and weighed prior to adding 2g of the
sample. The sample was weighed into filter paper and introduced into thumble.
Petroleum ether was added to the flask for extraction in the Soxhlet apparatus. After this,
the extract was dried in an oven for 15 minutes at 100OC to remove any remaining
solvent, cooled in a desiccator and reweighed.
Calculation:
% fat = Weight of extract + cup-weight of cup x 100
Original weight of sample
3.4.3 Ash determination
The ash content of the samples was determined using the method of AOAC (1995). Two
grammes (2g) of each of the samples were weighed into crucibles, heated in a furnace at
600OC for about three hours, cooled in desiccator and reweighed.
The percentage ash was calculated using the formula below:
% ash = (weight of crucible + ash) - (weight of crucible) x 100
weight of sample 1
70
3.4.4 Moisture determination
The moisture content of the samples was determined using the air oven method of AOAC
(1995). Washed porcelain dishes were dried in a Gallenkemp oven at 100OC
for about 2 hours, cooled in desiccator and reweighed. Two grammes (2g) of each of the
samples were weighed into the weighed dishes and placed in an oven at 100OC for 24
hours. The dishes containing the samples were cooled in desiccator, weighed and dried
repeated similarly until a constant weight was obtained.
The percentage moisture was calculated using the formula below:
Moisture content = Initial weight of dish + sample – final wt. of dish + sample
Weight of sample
Percentage moisture = Moisture content x 100
Weight of sample 1
3.4.5 Crude fibre content
Crude fibre was determined after digesting a known weight of fat-free sample in
refluxing sulphuric acid and sodium hydroxide. About 3g macerated sample were treated
with light petroleum ether (boiling point range 40-60OC), dilute sulphuric was, and
boiling diluted sodium hydroxide. The first 30 or 40ml of the sulphuric acid will be used
to disperse the samples. The mixture was heated to boiling point within one minute (the
flask was heated with a Liebig reflux condenser). The whole insoluble materials were
transferred to the filter paper by means of dilute hydrochloric acid. This was then washed
with alcohol (95% v/v) and ether.
The insoluble salt was transferred to a dried weighed ashless filter paper and dried at
100OC to a constant weight. A dull red heat was used to incinerate the paper and content
71
to an ash, the weight of which was subtracted from the increase in weight on the paper
due to the insoluble material. The difference in weight was reported as crude fibre.
3.4.6 Carbohydrate content
Total carbohydrate was determined by difference (subtracting crude protein, moisture,
fat, fibre and ash content from 100). Water-soluble carbohydrate was determined by
mixing 50ml of distilled water with duplicate (5g samples).
The mixture was agitated for two hours at room temperature (25oC) and filtered. The
residue was washed twice with 20ml of distilled water. The combined extracts was made
up to 100ml in a volumetric flask. The total soluble carbohydrate content of the extracts
was determined by the phenol-sulphuric acid method.
3.4.7 Energy
Gross energy was calculated using Atwater factor (1964) (4 x protein, 9 x fat, and 4 x
carbohydrate) expressing the sum of the products in kilojoules (kj).
3.4.8 Mineral determination
Mineral content of the samples was analyzed by the method described by AOAC (1995).
The samples were wet digested with concentrated nitrate and perchlorate.
Iron (Fe), copper (Cu) and zinc (Zn) were determined by polarized Zeeman atomic
absorption spectrophotometer and iodine (I2) was determined by titration method.
3.4.9 Vitamin content
Vitamin content of fresh and dried vegetables, b-carotene (provitamin A), folate and
72
ascorbate were determined by column chromatography method of AOAC (1995) B-
carotene (vitamin A), folic acid and vitamin C.
3.5 Anti-nutrients
3.5.1 Tannins
Tannins was determined by using the spectrophotometric method of Price et al (1989).
About 0.5g of each sample was extracted with 3ml methanol. The filtrate was mixed with
50ml water. Three millilitres (3ml) of 0.1m FeCl2 in 0.1 NHCl and 0.8m K2Fe(en)6 were
added to 0.1 ml of the solution. The extract was read at 720nm on a spectrophotometer.
3.5.2 Phytate
The phytate was determined by photometric method adapted from the method of Latta
and Eskin (1980). Five grammes (5g) of each sample were extracted with 2.46 HCl. One
tenth sodium chloride was (0.1m NaCl) will be added to elude inorganic phosphorus and
seven tenths mol of sodium chloride was added to elude phytate. One millilitre (1ml) of
Wade reagent was added and read at 500nm on a spectrophometer.
3.5.3 Food toxicant
The food toxicant that was analyzed was oxalic acid. Oxalate was determined by the
method of Munroad Bassir (1969) as described by Amadi et al (2004).
Organoleptic properties of dishes prepared with fresh,sun and shade dried and
pulverised Vegetables
73
After the chemical analysis and nutrient determination, vegetables with high nutrient
profile amongst the lesser known vegetables namely Sweet Potato leaves, Okpa okuko
and Ugu oyibo were used to prepare yam dishes.Fresh ,sun and Shade dried as well as
pulverised sample were used.The dishes were presented to the panel drawn from the
Nsukka community. The Diet therapy laboratory of the Department of Home Science,
Nutrition and Dietetics served as the venue.The panel members rated and scored the
dishes using 9 –point Likart/Hedonic scale Eight yam dishes consiting of Yam porridge
and casserole were prepared .The score was based on colour, texture, flavour and general
acceptability.
Recipe for yam dishes
Yam porradge
500g yam
1 table spoon ground crayfish
1 teaspoon ground pepper
1 medium shopped onions
2 tablespoons palm oil
Salt to taste
10 g fresh vegetable or 20grms for sun and shade dried samples sweet potato leaves
Method
Wash and peel yam
cut to cubes cooking sizes
74
Add 1 water little above level of yam
Add other ingredients including salt to taste
Boil till tender
Serve the members of the panel in a clean clear bowl placed on white background.
Yam casserole
500g yam
1 table spoon ground crayfish
1 teaspoon ground pepper
2 wrapps of oil bean seed
1 medium shopped onions
2 tablespoon palm oil
10g fresh vegetable or 20 g processed okpa okuko leaves
METHOD
Wash and peel yam
Cut into small equal sizes
Add about 1 litre clean water.Add wrapped oil bean seed
Add wrapped vegetables either fresh, or processed in fresh clean banana leaves
Boil till tender
Pound the vegetables with oil bean seed
Add other ingredients aaaaaaand turn with the yam until properly mixed
Serve the panel in a clear dish placed on white background
Pulverised dishes

75
The dish was prepared the same ingredients and method with yam porridge except that
the vegetables were pulverised
Yam Dish without vegetable
The dish was prepared with the same ingredients in yam casserole without any vegetable
76
CHAPTER FOUR
4.0 RESULTS
4.1 Survey on consumption pattern, processing and utilization of six vegetables
Table 4.1 presents Survey on consumption pattern, processing and utilization of three
common and popular vegetables “ugbogulu” (Curcubita pepo), “eliemionu” (Celosia
argentea) and “ariraa” (Corchorus trieus tiliacese) and three (3) other lesser – known
vegetables; “okpa okuku” (Uvaria chamae), “abuba ji nwannu” (Ipomoea batatas), and
“ugu oyibo” (Jatropha aconitifolia) leaves. The lesser – known vegetables were used to
prepare 8 yam dishes. Tables 4 1-7 present the results of the survey.
4.1.1 Identification of vegetables consumed in Igbo -ukwu
Table 4. 1. 1. depicted identification of vegetables consumed in Igbo -ukwu.
Thirty (30) subjects (100%) identified the vegetables commonly known to them. These
vegetables were ; “ugu” fluted pumkin (Teferia accidentalis) “ugbogulu” broad pumpkin
leaves (Curcubita pepo), “mgbolodi” (water leaves) “Inine” green, (Amaranthus spp),
“Onugbu” bitter leaf, “okazi”, “abuba ofe, anara, garden egg, “nchu anwu” (ocinum
viridian). This showed that most of the subjects were familiar with these nine vegetables.
On the other hand, 29 subjects (96.7%) identified :anara” (Corchorus trideus tiliaceae)
and “eliemionu” (Celosia argentea). This showed that majority of the subjects were
familiar with these vegetables. Only one subject was unable to identify any of the
vegetables. Twenty two (22) subjects (73.3%) identified “abuba ji – nwanu” “nduku”,
sweet potato leaves, (Ipomoa batata) and eight subjects (26.7%) were un able to identify
them. Ten (33.3%) and five (16.7%) of the subjects were able to identify “okpa okuku”
(Uvarae chamae) and “ugu oyibo’ ugu Cameroon (Jatropha aconinifolia, respectively).
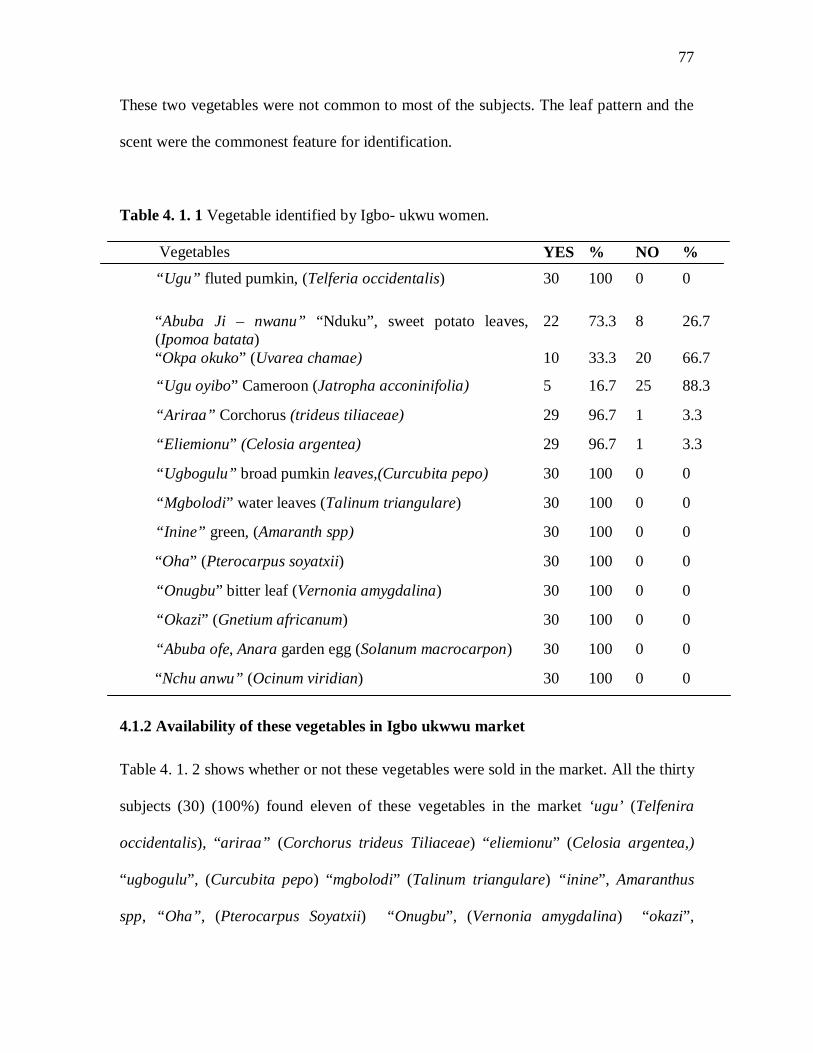
77
These two vegetables were not common to most of the subjects. The leaf pattern and the
scent were the commonest feature for identification.
Table 4. 1. 1 Vegetable identified by Igbo- ukwu women.
Vegetables YES % NO % “Ugu” fluted pumkin, (Telferia occidentalis) 30 100 0 0
“Abuba Ji – nwanu” “Nduku”, sweet potato leaves,
(Ipomoa batata) 22 73.3 8 26.7
“Okpa okuko” (Uvarea chamae) 10 33.3 20 66.7
“Ugu oyibo” Cameroon (Jatropha acconinifolia) 5 16.7 25 88.3
“Ariraa” Corchorus (trideus tiliaceae) 29 96.7 1 3.3
“Eliemionu” (Celosia argentea) 29 96.7 1 3.3
“Ugbogulu” broad pumkin leaves,(Curcubita pepo) 30 100 0 0
“Mgbolodi” water leaves (Talinum triangulare) 30 100 0 0
“Inine” green, (Amaranth spp) 30 100 0 0
“Oha” (Pterocarpus soyatxii) 30 100 0 0
“Onugbu” bitter leaf (Vernonia amygdalina) 30 100 0 0
“Okazi” (Gnetium africanum) 30 100 0 0
“Abuba ofe, Anara garden egg (Solanum macrocarpon) 30 100 0 0
“Nchu anwu” (Ocinum viridian) 30 100 0 0
4.1.2 Availability of these vegetables in Igbo ukwwu market
Table 4. 1. 2 shows whether or not these vegetables were sold in the market. All the thirty
subjects (30) (100%) found eleven of these vegetables in the market ‘ugu’ (Telfenira
occidentalis), “ariraa” (Corchorus trideus Tiliaceae) “eliemionu” (Celosia argentea,)
“ugbogulu”, (Curcubita pepo) “mgbolodi” (Talinum triangulare) “inine”, Amaranthus
spp, “Oha”, (Pterocarpus Soyatxii) “Onugbu”, (Vernonia amygdalina) “okazi”,
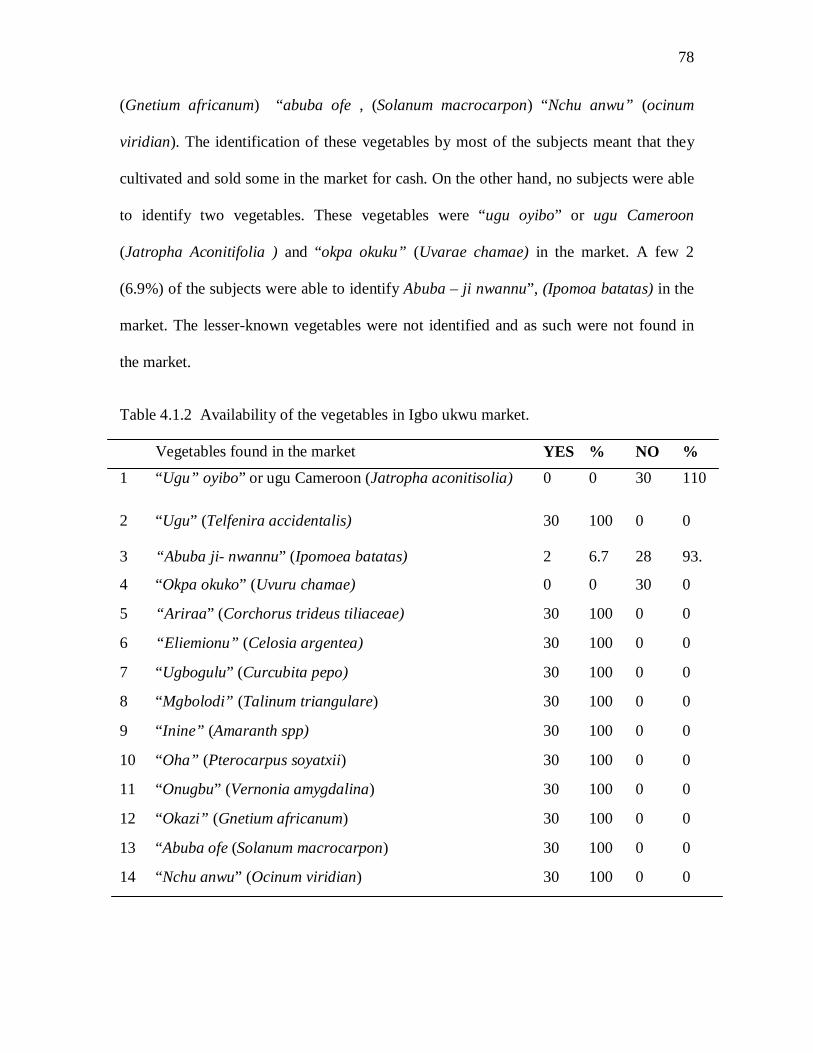
78
(Gnetium africanum) “abuba ofe , (Solanum macrocarpon) “Nchu anwu” (ocinum
viridian). The identification of these vegetables by most of the subjects meant that they
cultivated and sold some in the market for cash. On the other hand, no subjects were able
to identify two vegetables. These vegetables were “ugu oyibo” or ugu Cameroon
(Jatropha Aconitifolia ) and “okpa okuku” (Uvarae chamae) in the market. A few 2
(6.9%) of the subjects were able to identify Abuba – ji nwannu”, (Ipomoa batatas) in the
market. The lesser-known vegetables were not identified and as such were not found in
the market.
Table 4.1.2 Availability of the vegetables in Igbo ukwu market.
Vegetables found in the market YES % NO % 1 “Ugu” oyibo” or ugu Cameroon (Jatropha aconitisolia) 0 0 30 110
2 “Ugu” (Telfenira accidentalis) 30 100 0 0
3 “Abuba ji- nwannu” (Ipomoea batatas) 2 6.7 28 93.
4 “Okpa okuko” (Uvuru chamae) 0 0 30 0
5 “Ariraa” (Corchorus trideus tiliaceae) 30 100 0 0
6 “Eliemionu” (Celosia argentea) 30 100 0 0
7 “Ugbogulu” (Curcubita pepo) 30 100 0 0
8 “Mgbolodi” (Talinum triangulare) 30 100 0 0
9 “Inine” (Amaranth spp) 30 100 0 0
10 “Oha” (Pterocarpus soyatxii) 30 100 0 0
11 “Onugbu” (Vernonia amygdalina) 30 100 0 0
12 “Okazi” (Gnetium africanum) 30 100 0 0
13 “Abuba ofe (Solanum macrocarpon) 30 100 0 0
14 “Nchu anwu” (Ocinum viridian) 30 100 0 0
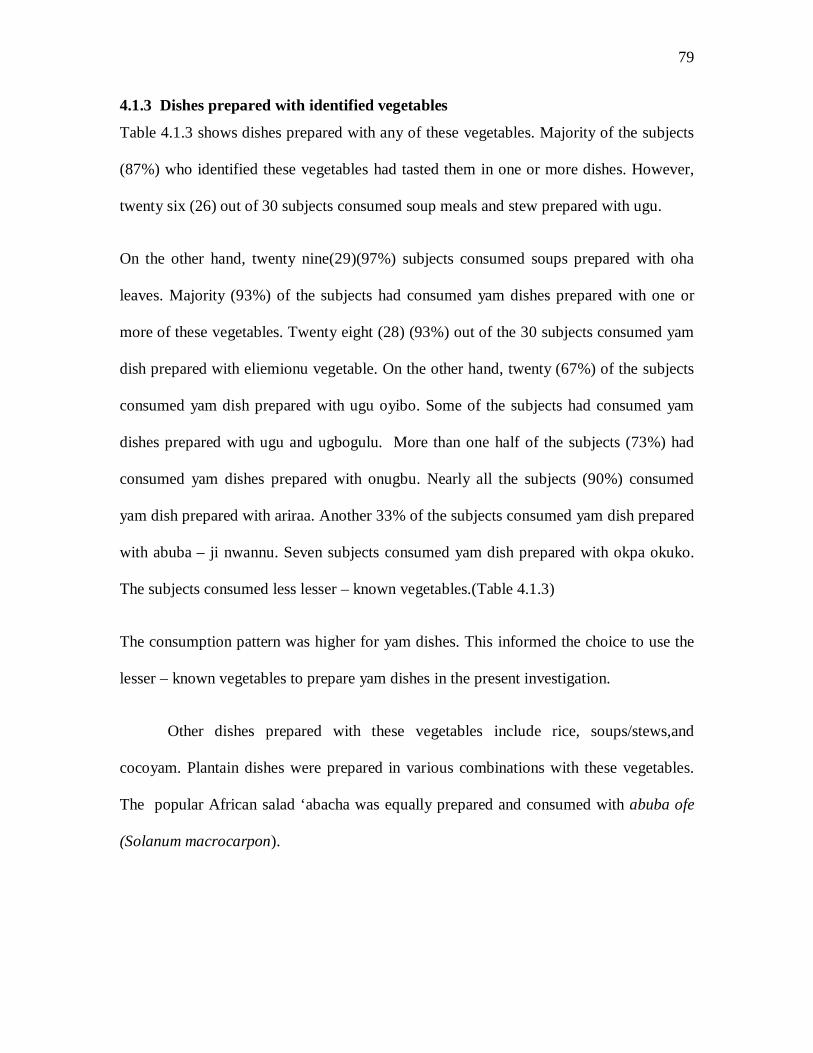
79
4.1.3 Dishes prepared with identified vegetables
Table 4.1.3 shows dishes prepared with any of these vegetables. Majority of the subjects
(87%) who identified these vegetables had tasted them in one or more dishes. However,
twenty six (26) out of 30 subjects consumed soup meals and stew prepared with ugu.
On the other hand, twenty nine(29)(97%) subjects consumed soups prepared with oha
leaves. Majority (93%) of the subjects had consumed yam dishes prepared with one or
more of these vegetables. Twenty eight (28) (93%) out of the 30 subjects consumed yam
dish prepared with eliemionu vegetable. On the other hand, twenty (67%) of the subjects
consumed yam dish prepared with ugu oyibo. Some of the subjects had consumed yam
dishes prepared with ugu and ugbogulu. More than one half of the subjects (73%) had
consumed yam dishes prepared with onugbu. Nearly all the subjects (90%) consumed
yam dish prepared with ariraa. Another 33% of the subjects consumed yam dish prepared
with abuba – ji nwannu. Seven subjects consumed yam dish prepared with okpa okuko.
The subjects consumed less lesser – known vegetables.(Table 4.1.3)
The consumption pattern was higher for yam dishes. This informed the choice to use the
lesser – known vegetables to prepare yam dishes in the present investigation.
Other dishes prepared with these vegetables include rice, soups/stews,and
cocoyam. Plantain dishes were prepared in various combinations with these vegetables.
The popular African salad ‘abacha was equally prepared and consumed with abuba ofe
(Solanum macrocarpon).
80
Table 4.1.3 Dishes prepared with vegetables
* Vegetables dishes Yam rice Soups/St
ew Cocoyam Plantain
“Ugu” oyibo” or ugu Cameroon (Jatropha aconitisolia)
20 20 22 12 15
“Ugu” fluted pumpkin leaves (Telfenira occidentalis)
25 21 26 21 22
“Abuba ji- nwannu” nduko sweet potato leaves, (Ipomoa batata)
10 0 5 4 4
“Okpa okuku” (Uvarae chamae)
7 1 4 3 3
“Ariraa” (Corchorus trideus tiliaceae)
27 15 12 1
“Eliemionu” (Celosia argentea)
28 28 18 12 4
“Ugbogulu” broad pumpkin leaves, (Curcubita pepo)
25 0 4 8 2
“Mgbolodi” (Talinum triangulare)
21 10 19 13 6
“Inine” (Amaranth spp) 18 13 15 15 12
“Oha”(Pterocarpus Soyatxii)
0 0 29 1 0
“Onugbu” (Vernonia amygdalina)
22 5 24 11 0
“Okazi (Gnetium africanum)
10 4 19 1 0
“Abuba ofe (Solanum macrocarpon)
17 4 17 4 2
“Nchu anwu” (Ocinum viridian)
14 14 23 8 10
Total 244 120 240 125 81
* n = 30
81
Majority of the subjects knew all the vegetables from their mothers.
A few (4) of the subjects were taught about these vegetables by their grandmothers. A
fewer (2) of the subjects were informed about the vegetables by the public health
workers. A smaller percentage of the subjects knew these vegetables through mass media
(television and radio). The other sources of information about these vegetables were;
schools, colleges, husbands, experience from other users, friends, church members and
siblings.
4.1.4 Perception of taste and pattern of consumption of these vegetables
Table 4.1.4 shows that majority of the respondents who identified eleven vegetables
“Ugu” (Telfenira accidentalis), “ariraa” (Corchorus trieus tilaceae), “eliemionu”
(Celosia argentea), “ugbogulu” (Curcubita pepo), “mgbolodi” water leaf, “inine” green,
Amaranth spp, “oha”, “onugbu” bitter leaf, “okazi”, “abuba ofe (anara) Garden egg
leaves, and “nchuanwu” (Ocinum viridian) vegetables had tasted them. All the subjects
(100%) had tasted the identified vegetables. This showed that these vegetables were
much more popularly known and utilized to prepare soups, rice and yam dishes. On the
other hand, twelve out of 30 of the subjects had tasted “ugu” oyibo or ugu Cameroon
(Jatropha.aconitisolia) and more of the subjects (60%) had not tasted any of the
vegetables. This showed that many of the subjects never knew and used “ugu” oyibo” or
ugu Cameroon (Jatropha. aconitifolia). A few of the subjects had tasted” abuba ji –
nwannu”,(Ipomoea batatas) and “okpa okuku” Uvarae chamae, respectively. Only a very
few of the subjects had tasted and utilized these two vegetables. Majority of the subjects
had never used ipomoa batata and “okpa okuku” leaves as vegetables.

82
The conclusion on Table 4.1.4 is that all the respondents (100%) perceived the yam
dishes prepared with ugu (fluted pumpkin leaves), ariraa, eliemionu, ugbogulu, mgbolodi,
inene, onugbu, okazi, abuba ofe, and ncha anwu to be tasty.
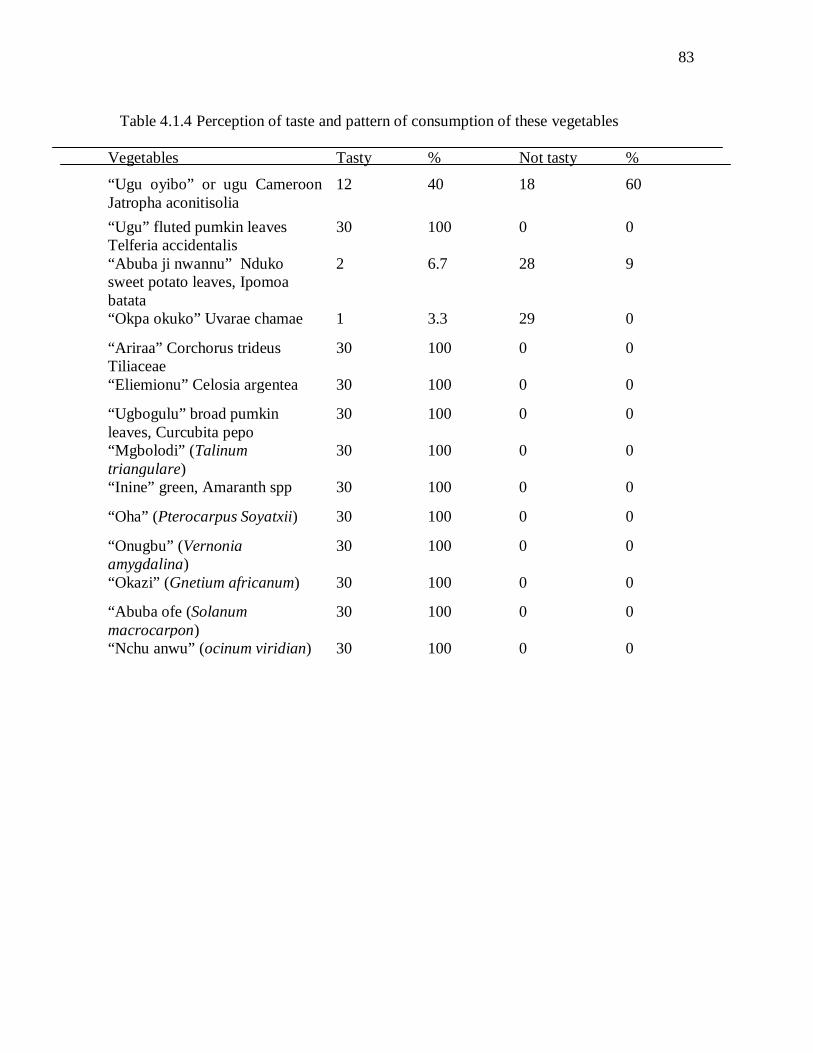
83
Table 4.1.4 Perception of taste and pattern of consumption of these vegetables
Vegetables Tasty % Not tasty %
“Ugu oyibo” or ugu Cameroon Jatropha aconitisolia
12 40 18 60
“Ugu” fluted pumkin leaves Telferia accidentalis
30 100 0 0
“Abuba ji nwannu” Nduko sweet potato leaves, Ipomoa batata
2 6.7 28 9
“Okpa okuko” Uvarae chamae 1 3.3 29 0
“Ariraa” Corchorus trideus Tiliaceae
30 100 0 0
“Eliemionu” Celosia argentea 30 100 0 0
“Ugbogulu” broad pumkin leaves, Curcubita pepo
30 100 0 0
“Mgbolodi” (Talinum triangulare)
30 100 0 0
“Inine” green, Amaranth spp 30 100 0 0
“Oha” (Pterocarpus Soyatxii) 30 100 0 0
“Onugbu” (Vernonia amygdalina)
30 100 0 0
“Okazi” (Gnetium africanum) 30 100 0 0
“Abuba ofe (Solanum macrocarpon)
30 100 0 0
“Nchu anwu” (ocinum viridian) 30 100 0 0
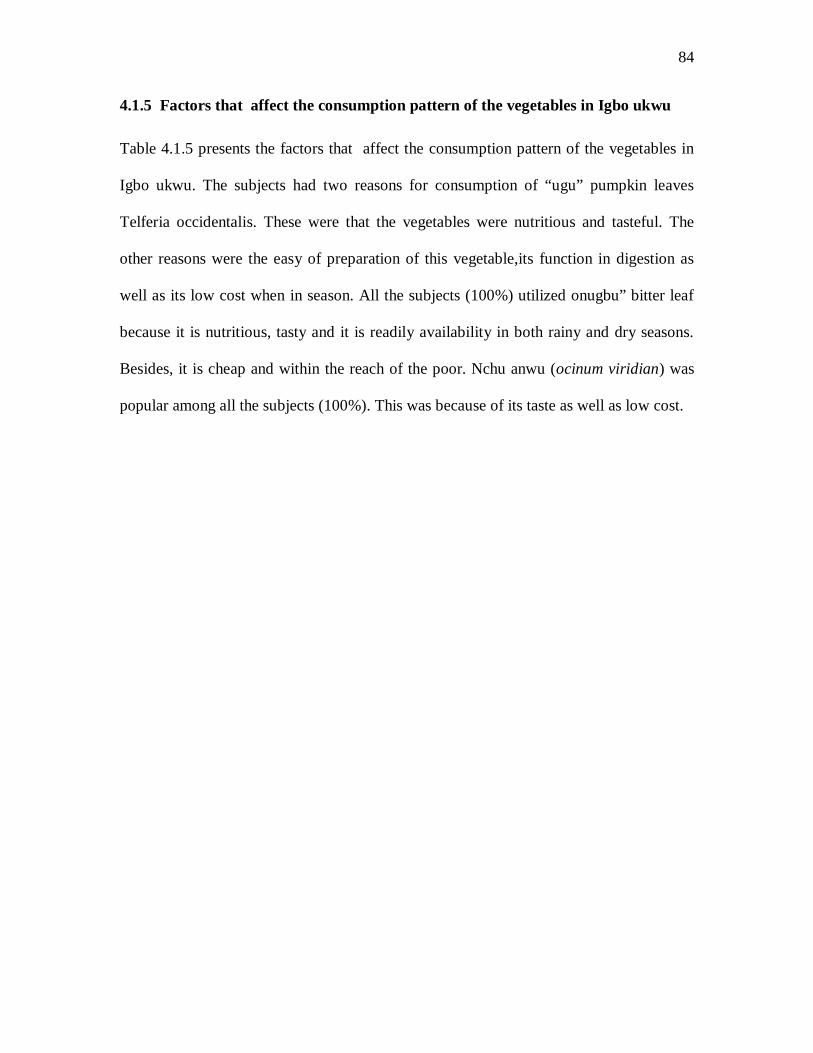
84
4.1.5 Factors that affect the consumption pattern of the vegetables in Igbo ukwu
Table 4.1.5 presents the factors that affect the consumption pattern of the vegetables in
Igbo ukwu. The subjects had two reasons for consumption of “ugu” pumpkin leaves
Telferia occidentalis. These were that the vegetables were nutritious and tasteful. The
other reasons were the easy of preparation of this vegetable,its function in digestion as
well as its low cost when in season. All the subjects (100%) utilized onugbu” bitter leaf
because it is nutritious, tasty and it is readily availability in both rainy and dry seasons.
Besides, it is cheap and within the reach of the poor. Nchu anwu (ocinum viridian) was
popular among all the subjects (100%). This was because of its taste as well as low cost.
85
Table4.1. 5 Factors that affect consumption pattern of the vegetables in Igbo- ukwu
Vegetables Nutritious (Give blood)
Tasty Cheap Always available (rainy and dry season)
Easy to prepare
“Ugu” oyibo” or ugu Cameroon (Jatropha aconitisolia)
1 0 20 28 4
“Ugu” (Telfenira occidentalis)
21 1 1 24 30
“Abuba ji- nwannu” (ipomoea batatas)
1 30 18 0 0
“Okpa okuku” (Uvarae chamae)
30 0 1 1 0
“Ariaa” (Corchorus trideus tiliaceae)
0 4 28 28 8
“Eliemionu” (Celosia argentea)
8 0 0 0 0
“Ugbogulu” (Curcubita pepo)
0 0 0 0 0
“Mgbolodi” (Talinum triangulare)
4 8 18 21 4
“Inine” (Amaranthus spp)
1 1 1 1 1
“Oha” (Pterocarpus Soyatxii)
18 19 24 15 26
“Onugbu” (Vernonia amygdalina)
1 1 1 0 1
“Okazi” (Gnetium africanum)
28 28 18 21 26
“Abuba ofe (Solanum macrocarpon)
1 0 1 0 2
“Nchu anwu” (Ocinum viridian)
14 19 17 13 21
Total 261 187 342 332 397
86
4.1.6 Frequency of consumption of the identified vegetables in Igbo-ukwu
Table 4.1.6 presents the frequency of consumption of the identified vegetables in Igbo-
ukwu. All the subjects ,30 (100%) consumed inine (Amaranthus spp) frequently. This
indicates that 30 (100%) who identified this vegetable (Table 4.1.1) were familiar with
the vegetable and they consume it. Twenty nine (96.67%) of 30 subjects utilize
nchuanwu leaves. Majority of the subjects (93.33%) consume onugbu, abuba –ofe and,
ugu (fluted pumpkin leaves) frequently respectively. On the other hand,more than a half
of the respondents (86.67, 80, 76,.67.70.66,67 and 66,67% ,respectively) frequently
consume oha, mgbolodi, waterleaf, ariraa, eliemionu,ugbogulu and okazi.
Twenty seven (90%) out of 30 subjects consumed abuba-ji nwannu and okpa okuku less
frequently. This shows that they do not know them (Table 4.1.1) and therefore, do not
cultivate and consumed them often. In addition, 24 (80%) out of 30 subjects consume
uguoyibo sparingly. This also confirms the fact that majority of the subjects did not
identify this vegetable.
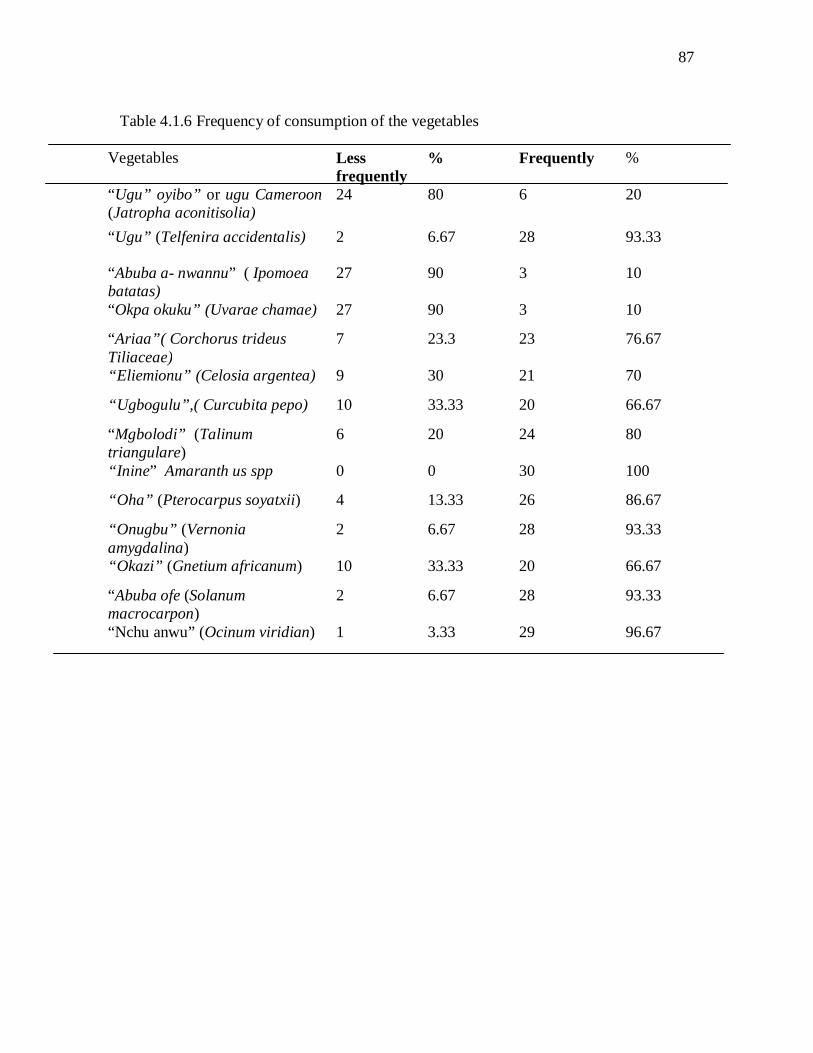
87
Table 4.1.6 Frequency of consumption of the vegetables
Vegetables Less frequently
% Frequently %
“Ugu” oyibo” or ugu Cameroon (Jatropha aconitisolia)
24 80 6 20
“Ugu” (Telfenira accidentalis) 2 6.67 28 93.33
“Abuba a- nwannu” ( Ipomoea batatas)
27 90 3 10
“Okpa okuku” (Uvarae chamae) 27 90 3 10
“Ariaa”( Corchorus trideus Tiliaceae)
7 23.3 23 76.67
“Eliemionu” (Celosia argentea) 9 30 21 70
“Ugbogulu”,( Curcubita pepo) 10 33.33 20 66.67
“Mgbolodi” (Talinum triangulare)
6 20 24 80
“Inine” Amaranth us spp 0 0 30 100
“Oha” (Pterocarpus soyatxii) 4 13.33 26 86.67
“Onugbu” (Vernonia amygdalina)
2 6.67 28 93.33
“Okazi” (Gnetium africanum) 10 33.33 20 66.67
“Abuba ofe (Solanum macrocarpon)
2 6.67 28 93.33
“Nchu anwu” (Ocinum viridian) 1 3.33 29 96.67
88
4.1.7 Respondents knowledge of availability and common habitats of the identified
vegetables
Table 4.1.7 showed the respondents knowledge of availability and common
habitats of the identified vegetables. Some of these vegetables are found around
homesteads and gardens. Twenty nine (29) (97%) out of 30 subjects indicated that ugu is
found in gardens around the house Twenty eight (28) (93%) out of 30 and 27(90%)
stated that Ariraa, inine and nchuanwu, respectively, are found around the house.Twenty
four (80%) out of 30, 23 (77%) out of 30 and 21 (70%) out of 30 respondents indicated
that abuba ofe, elimionu, onugbu and 18 (60%) respondents stated that ugbuogulu and
okazi, respectively are not found close or around the house. On the other hand, 23 (77%)
out of 30, 25 (83%) out of 30 and 27 (90%) out of 30 respondents indicated that abuba –
ji –nwa unu, okpa okuku and ugu oyibo are not found around the home stead. Very few
subjects reported that lesser-known vegetables can be found around home-steads.
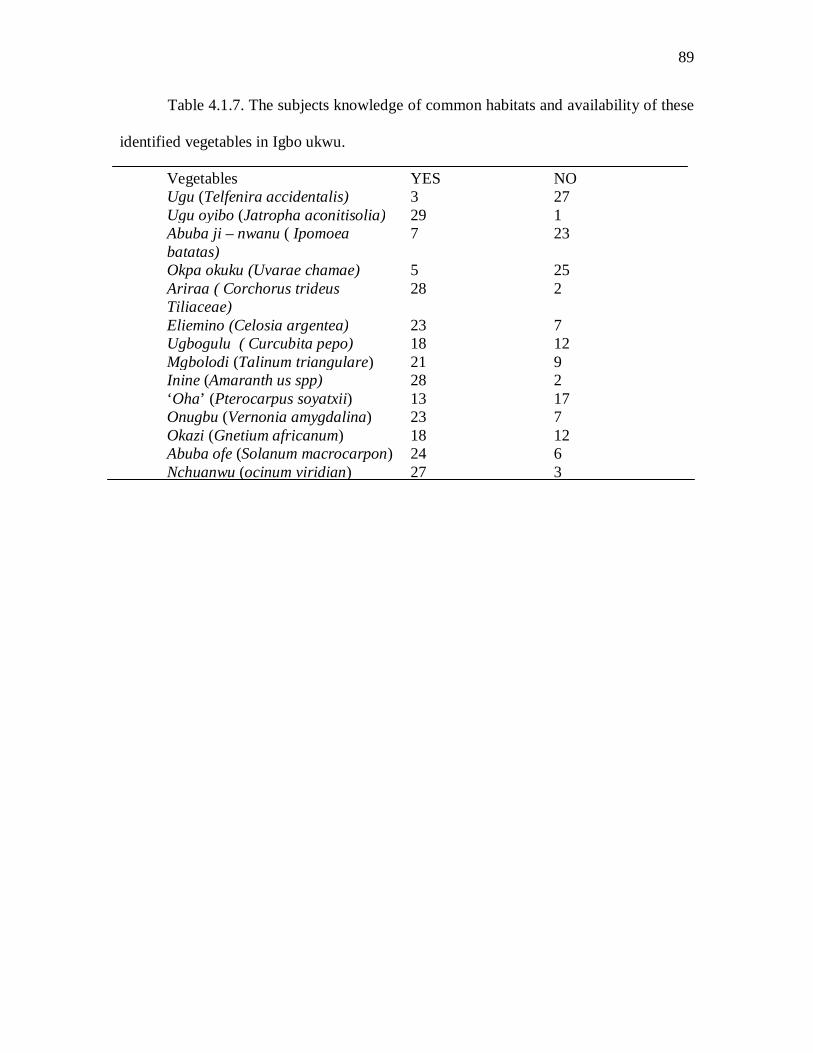
89
Table 4.1.7. The subjects knowledge of common habitats and availability of these
identified vegetables in Igbo ukwu.
Vegetables YES NO Ugu (Telfenira accidentalis) 3 27 Ugu oyibo (Jatropha aconitisolia) 29 1 Abuba ji – nwanu ( Ipomoea
batatas) 7 23
Okpa okuku (Uvarae chamae) 5 25 Ariraa ( Corchorus trideus
Tiliaceae) 28 2
Eliemino (Celosia argentea) 23 7 Ugbogulu ( Curcubita pepo) 18 12 Mgbolodi (Talinum triangulare) 21 9 Inine (Amaranth us spp) 28 2 ‘Oha’ (Pterocarpus soyatxii) 13 17 Onugbu (Vernonia amygdalina) 23 7 Okazi (Gnetium africanum) 18 12 Abuba ofe (Solanum macrocarpon) 24 6 Nchuanwu (ocinum viridian) 27 3
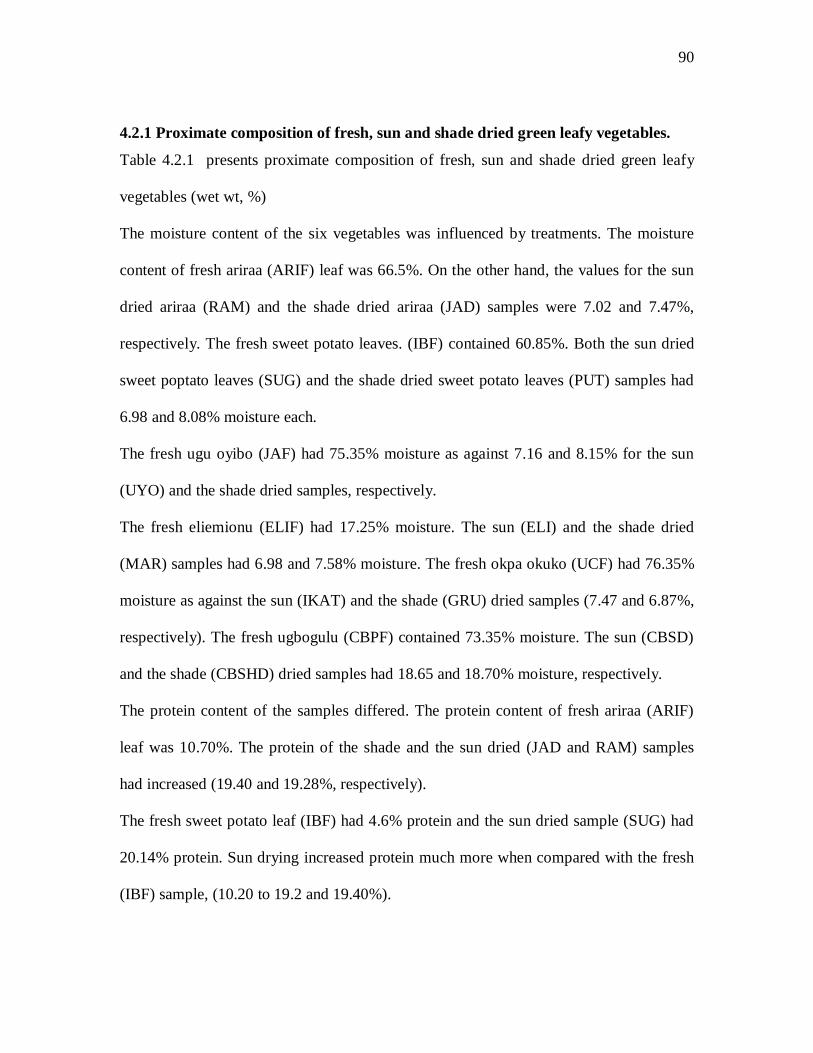
90
4.2.1 Proximate composition of fresh, sun and shade dried green leafy vegetables.
Table 4.2.1 presents proximate composition of fresh, sun and shade dried green leafy
vegetables (wet wt, %)
The moisture content of the six vegetables was influenced by treatments. The moisture
content of fresh ariraa (ARIF) leaf was 66.5%. On the other hand, the values for the sun
dried ariraa (RAM) and the shade dried ariraa (JAD) samples were 7.02 and 7.47%,
respectively. The fresh sweet potato leaves. (IBF) contained 60.85%. Both the sun dried
sweet poptato leaves (SUG) and the shade dried sweet potato leaves (PUT) samples had
6.98 and 8.08% moisture each.
The fresh ugu oyibo (JAF) had 75.35% moisture as against 7.16 and 8.15% for the sun
(UYO) and the shade dried samples, respectively.
The fresh eliemionu (ELIF) had 17.25% moisture. The sun (ELI) and the shade dried
(MAR) samples had 6.98 and 7.58% moisture. The fresh okpa okuko (UCF) had 76.35%
moisture as against the sun (IKAT) and the shade (GRU) dried samples (7.47 and 6.87%,
respectively). The fresh ugbogulu (CBPF) contained 73.35% moisture. The sun (CBSD)
and the shade (CBSHD) dried samples had 18.65 and 18.70% moisture, respectively.
The protein content of the samples differed. The protein content of fresh ariraa (ARIF)
leaf was 10.70%. The protein of the shade and the sun dried (JAD and RAM) samples
had increased (19.40 and 19.28%, respectively).
The fresh sweet potato leaf (IBF) had 4.6% protein and the sun dried sample (SUG) had
20.14% protein. Sun drying increased protein much more when compared with the fresh
(IBF) sample, (10.20 to 19.2 and 19.40%).
91
The shade dried sample (PUT) had the protein content of 18.91%. Shade drying increased
protein much more when compared with the fresh sample. The increase was not as much
as that of sun drying. The fresh ugu oyibo (JAF) had 8.5% protein as against 16.80% and
20.5% for the sun (UYO) and the shade dried (YAM) samples, respectively. The protein
of the shade dried sample (YAM) (20.50%) was much higher than those of the fresh and
the sun dried samples 20.50% vs 8.51 and 16.80%.
The fresh eliemionu (ELIF) had 18.0% protein. The sun (ELI) and the shade dried
(MAR) samples had 19.36 and 19.80% protein, respectively.
The fresh okpa okuko (UCF) had 6.8% protein as against the sun (IKAT) and the shade
dried (GRU) samples (18.58 and 18.65% respectively).
The fresh ugbogulu (CBPF) had 2.16% protein. Sun (CBPSD) and the shade dried
(CBPSHD) samples on the other hand, had 9.42 and 8.21%, respectively. The Sun and
shade drying increased protein remarkably when compared with the one of the fresh (2.16
Vs 9.42 and 8.21%, respectively. The fat content of fresh ariraa leaf (ARIF) was 2.00%.
The sun (RAM) and the shade dried (JAD) samples had 2.32 and 1.91% respectively. Sun
drying increased fat from 2.00 in the fresh (ARIF) sample to 2.32% in the sun dried
sample. However, shade drying decreased fat from 2.00 to 1.91%.
The fresh sweet potato leaf (IBF) had 4.45% fat. The sun (SUG) and the shade dried
(PUT) samples had 2.22 and 2.00% fat, respectively.
The fresh okpa okuko leaf (JAF) contained 3.5% fat. Both the sun (UYO) and the shade
dried (YAM) samples had 1.95 and 1.91% fat, respectively.
The fresh eliemionu leaf (ELIF) had 2.15% fat as against those of the sun (ELI) and the
shade dried (MAR) samples (2.10 and 2.40%, respectively). The fresh okpa okuko leaf
92
(UCF) had 0.65% fat. The sun (IKAT) and the shade dried (GRU) samples had 2.38 and
2.09%, respectively. The fresh ugbogulu leaf (CBPF) had 1.02% fat as against those of
the sun (CBPSD) and the shade dried (CBPSHD) samples (2.96 and 2.0%, respectively).
The fresh ariraa leaf (ARIF) had 13.7% ash. The sun (RAM) and the shade dried (JAD)
samples contained 17.18 and 18.80% ash, respectively. Sun and shade drying increased
ash remarkably. The fresh sweet leaf (IBF) had 22.7% ash as against that of the sun
(SUG) and the shade dried (PUT) samples (15.15 and 19.25%, respectively). Sun and
shade drying decreased the values when compared with the fresh sample (22.70 vs 15.15
and 19.25%, respectively).
The fresh okpa okuko leaf (JAF) had 7.2% ash. The sun (UYO) and the shade dried
(YAM) samples had 19.35 and 18.25% ash. The increases in ash of the vegetables were
attributed to sun and shade drying.
The fresh eliemionu leaf (ELIF) had 13.3% ash as against those of the sun (ELI) and the
shade dried (MAR) samples (18.95 and 16.08%, respectively).
The fresh okpa okuko leaf (UCF) had 12.6% ash as against those of the sun (IKAT) and
the shade dried (GRU) samples (16.36 and 17.47%, respectively).
The fresh ugbogulu leaf (CBPF) had 2.51% ash. On the other hand, the sun (CBPSD) and
the shade dried (CBOSHD) samples had 16.43 and 15.04%, respectively.
The fresh ariraa leaf (ARIF) had 5.00% fibre as against the sun (RAM) and the shade
dried (JAD) samples that had18.91 and 41.04%, respectively.
The fresh sweet potato leaf (IBF) contained 6.6% fibre. The sun (SUG) and the shade
dried (PUT) samples had 45.45 and 42. 07%, respectively.
93
Sun and shade drying increased fibre six folds when compared with the value for the
fresh (IBF)(45.54 and 42.07 vs 6.60%).
The carbohydrate (CHO) values for all the vegetables differed. The fresh ariraa (ARIF),
the sun dried (RAM) and the shade dried samples (JAD) had 2.0, 42.31 and 11.34%
CHO, respectively. Both sun and shade drying increased CHO from 2.0 to 42.31 and
11.34% (Table 4.2.1).
The fresh sweet potato (IBF), the sun (SUG) and the shade dried (PUT) samples
each had 2.0, 9.97 and 9.66% CHO respectively. Sun and shade drying increased CHO
value more than a fourfold.
The fresh ugu oyibo leaf (JAF), the sun (UYO) and the shade dried (YAM) samples had
2.0, 42.52 and 40.98% CHO, respectively. Both sun and shade drying increased CHO
more than twenty folds (4.52 and 40.98%) as against the fresh that had 2.0%.
The fresh eliemionu (ELIF), the sun (ELI) and the shade dried (MAR) samples had 4.54,
6.97 and 9.89% CHO. Shade dried eliemionu had higher CHO (9.89%) than the sun dried
sample (6.97%).
The fresh okpa okuko leaf (UCF), the sun (IKAT) and the shade dried (GRU) samples
had 0.5, 35.91 and 42.79% CHO each. However, shade drying had much more increase in
CHO than sun drying (42.79 vs 35.91%). The fresh ugbogulu leaf (CBPF), the sun
(CBPSD) and the shade dried (CBSHD) samples had 0.52, 32.62 and 34.62% CHO,
respectively. Shade drying increased CHO in ugbogulu more than sun drying by two
percentage (34.62 – 32.262%).
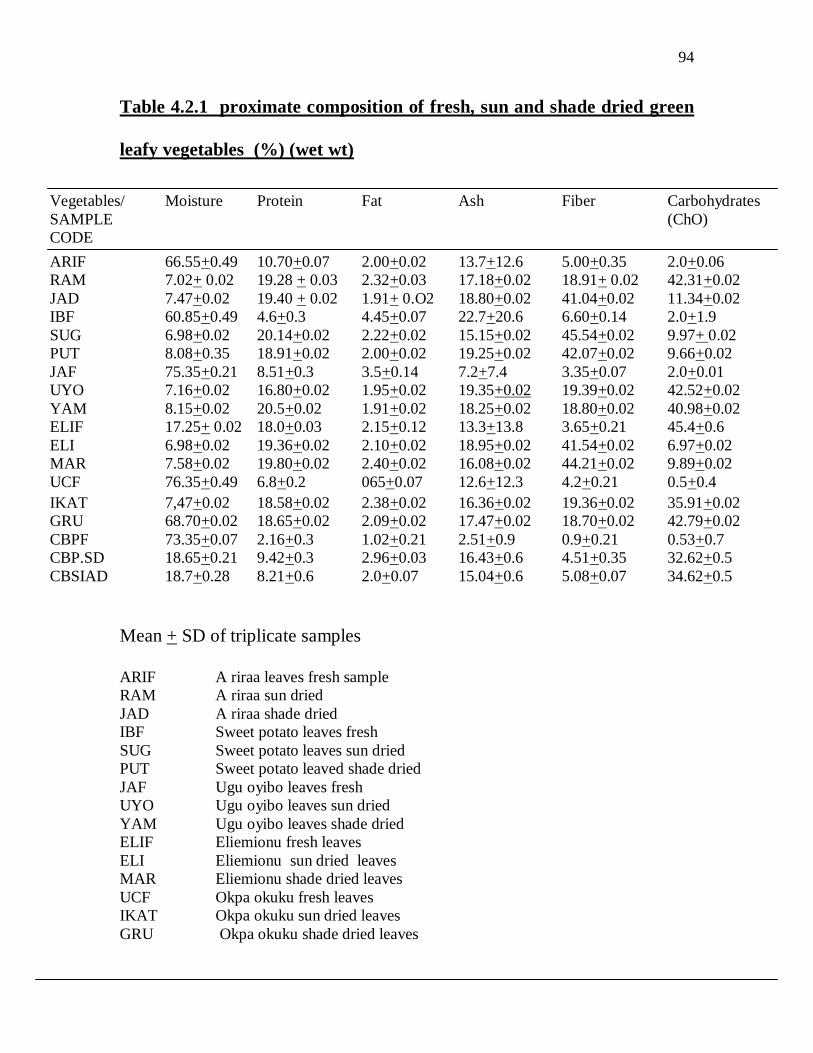
94
Table 4.2.1 proximate composition of fresh, sun and shade dried green
leafy vegetables (%) (wet wt)
Mean + SD of triplicate samples ARIF A riraa leaves fresh sample RAM A riraa sun dried JAD A riraa shade dried IBF Sweet potato leaves fresh SUG Sweet potato leaves sun dried PUT Sweet potato leaved shade dried JAF Ugu oyibo leaves fresh UYO Ugu oyibo leaves sun dried YAM Ugu oyibo leaves shade dried ELIF Eliemionu fresh leaves ELI Eliemionu sun dried leaves MAR Eliemionu shade dried leaves UCF Okpa okuku fresh leaves IKAT Okpa okuku sun dried leaves GRU Okpa okuku shade dried leaves
Vegetables/ SAMPLE CODE
Moisture Protein Fat Ash Fiber Carbohydrates (ChO)
ARIF 66.55+0.49 10.70+0.07 2.00+0.02 13.7+12.6 5.00+0.35 2.0+0.06 RAM 7.02+ 0.02 19.28 + 0.03 2.32+0.03 17.18+0.02 18.91+ 0.02 42.31+0.02 JAD 7.47+0.02 19.40 + 0.02 1.91+ 0.O2 18.80+0.02 41.04+0.02 11.34+0.02 IBF 60.85+0.49 4.6+0.3 4.45+0.07 22.7+20.6 6.60+0.14 2.0+1.9 SUG 6.98+0.02 20.14+0.02 2.22+0.02 15.15+0.02 45.54+0.02 9.97+ 0.02 PUT 8.08+0.35 18.91+0.02 2.00+0.02 19.25+0.02 42.07+0.02 9.66+0.02 JAF 75.35+0.21 8.51+0.3 3.5+0.14 7.2+7.4 3.35+0.07 2.0+0.01 UYO 7.16+0.02 16.80+0.02 1.95+0.02 19.35+0.02 19.39+0.02 42.52+0.02 YAM 8.15+0.02 20.5+0.02 1.91+0.02 18.25+0.02 18.80+0.02 40.98+0.02 ELIF 17.25+ 0.02 18.0+0.03 2.15+0.12 13.3+13.8 3.65+0.21 45.4+0.6 ELI 6.98+0.02 19.36+0.02 2.10+0.02 18.95+0.02 41.54+0.02 6.97+0.02 MAR 7.58+0.02 19.80+0.02 2.40+0.02 16.08+0.02 44.21+0.02 9.89+0.02 UCF 76.35+0.49 6.8+0.2 065+0.07 12.6+12.3 4.2+0.21 0.5+0.4 IKAT 7,47+0.02 18.58+0.02 2.38+0.02 16.36+0.02 19.36+0.02 35.91+0.02 GRU 68.70+0.02 18.65+0.02 2.09+0.02 17.47+0.02 18.70+0.02 42.79+0.02 CBPF 73.35+0.07 2.16+0.3 1.02+0.21 2.51+0.9 0.9+0.21 0.53+0.7 CBP.SD 18.65+0.21 9.42+0.3 2.96+0.03 16.43+0.6 4.51+0.35 32.62+0.5 CBSIAD 18.7+0.28 8.21+0.6 2.0+0.07 15.04+0.6 5.08+0.07 34.62+0.5
95
CBPF Ugbogulu fresh leaves CBPSD Ugbogulu leaves sun dried CBPSHD Ugbogulu leaves shade dried
4.2.2 Effects of sun and shade drying on proximate composition of fresh, sun and
shade green leafy vegetables.
Table 4.2.2 shows the effects of sun and shade drying on the proximate composition of
fresh, sun and shade dried green leafy vegetables based on residual moisture (%) .The
loss of moisture generally increased dry matter content of the vegetables. The protein
content of the fresh ariraa (ARIF), the sun (RAM) and the shade dried (JAD) samples
were 12.30. 20.74 and 20.98% protein, respectively.
The protein content of the fresh sweet potato leaf (IBF), the sun (SUG) and the hade
dried (PUT) samples were 18.10, 22.30, and 20.57% protein, respectively. The fresh ugu
oyibo (JAF), the sun (UYO) and the shade dried (YAM) samples had 8.51, 18.09 and
21.83% protein each. The fresh eliemionu (ELIF), the sun (ELI) and the shade dried
(MAR) samples had each 18.00, 19.36 and 19.80% protein. The fresh okpa okuku leaf
(UCF), the sun (IKAT) and the shade dried (GRU) samples had 6.80, 18.58 and 18.65%
protein, respectively.
On the other hand, the fresh ugbogulu leaf (CBF), the sun (CBPSD) and the shade dried
(CBPSHD) samples had 8.10, 11.20 and 10.10% protein, respectively.
Fat values for all the vegetables varied. The fresh ariraa (ARIF), the sun (RAM) as well
as the shade dried (JAD) samples had 3.05, 2.45 and 2.08% fat each. Sun and shade
drying caused reduction in fat (3.05-2.45 and 2.08%). Fresh sweet potato leaf (IBF), the
sun (SUG) and the shade dried (PUT) samples had 1.68% fat as against the higher values
for the sun (SUG) and the shade dried (PUT) samples (2.39 and 2.18%).
96
The fresh ugu oyibo leaf (JAF), the sun (UYO) and the shade dried (YAM)
samples had 3.5, 2.10 and 2.80% fat each. The fresh elimionu (ELIF), the sun (ELI) and
the shade dried (MAR) samples had 2.15, 2.10 and 2.40% fat, respectively. The fresh
okpa okuko leaf (UCF), the sun (IKAT) and the shade dried (GRU) samples had 0.65,
2.38 and 2.09% fat, respectively.
Fresh ugbogulu leaf (CBPF), sun (CBPSD) and shade dried (CBPSHD) samples had
comparable fat (3.95, 3.65 and 3.65%, respectively). Fresh ariraa (ARIF) , sun (RAM)
and shade dried (JAD) samples had 21.7, 18.49 and 19.67% ash.
Shade drying caused less decrease in ash when compared with sun drying (19.67 vs 18.
49%) relative to the control (21.70%).
Fresh ariraa (ARIF), sun (RAM) and the shade dried (JAD) samples had 21.7, 18.49 and
19.67% ash. Sun drying (RAM) decreased ash more than shade drying (18.49 vs
19.67%). Fresh sweet potato leaf (IBF), sun (SUG) and shade dried samples (PUT) had
9.72, 18.22, and 20.94% ash, respectively.
Fresh ugu oyibo (JAD), sun (UYO) and shade dried (YAM) samples had. 7.2, 20.84 and
19.87% ash, respectively. Sun drying again increased ash more than shade drying relative
to the control (20.90 vs 18.22 and 9.72%).
Fresh eliemionu leaf (ELIF), sun (ELI) and shade dried (MAR) samples had each 13.3,
18.95 and 16.08%. While fresh okpa okuko (UCF), sun (IKAT) and shade dried (GRU)
samples had 12.6, 16.36 and 17.47% ash, respectively.
On the other hand, fresh ugbogulu (CBPF), sun (CBPSD) and shade dried (CBPSHD)
samples had 9.41, 20.20 and 18.45% ash. Sun dried samples had more ash than the shade
dried samples, relative to the control (20.20 vs 18.54 and 9.41%).
97
The fibre for the fresh ariraa leaf (ARIF), the sun (RAM) and the shade dried (JAD)
samples were 5.05. 20.40 and 19.67%, respectively.
Fresh sweet potato leaf (IBF), sun (SUG) and shade dried (PUT) samples had 6.60, 4.35
and 5.85% fibre.
Fresh ugu oyibo (JAF) leaf, sun (UYO) and shade dried (YAM) samples had 3.35, 20.88
and 20.47% fibre each.Similarly Fresh eliemionu (ELIF), sun (ELI) and shade dried
(MAR) samples had 3.65, 41.54 and 44.21% fibre and those of sun (IKAT) and shade
dried (GRU) samples had 19.36 and 18.7% each. The fibre for the fresh (ELIF), the sun
(IKAT) and the shade dried (GRU) samples of okpa-okuku: were 4.20, 19.36 and 18.7%
each.
Fresh ugbogulu leaf (CBPF) had 3.5% fibre. While sun (CBPSD) and the shade dried
samples (CBPSHD) had 5.55 and 6.25% fibre each. Sun and shade drying increased fibre
four folds in eliemionu (19.36 aand 18.70 vs 4.20%).
Carbohydrates values varied for the six vegetables. The fresh ariraa (ARIF) had 57. 90%
CHO and the sun (RAM) and the shade dried (JAD) samples had each 37.92 and 37.60%
CHO.
Fresh sweet potato leaf (IBF), sun (SUG) and shade dried (PUT) samples had 63.90,
52.75 and 50.50% each, where as fresh ugu oyibo leaf (JAF) had 77.44% CHO and
values for the sun (UYO) and the shade dried (YAM) samples were 38.19 and 35.71%,
respectively. Fresh eliemionu (ELIF) had 62.90% CHO and the sun and the shade dried
samples had 18.05 and 16.79% each.
The fresh ugbogulu leaf (CBPF) sample had 75.09% CHO. The sun (CBPSD) and the
shade dried (CBPSHD) samples had 59.40 and 61.46% CHO each.

98
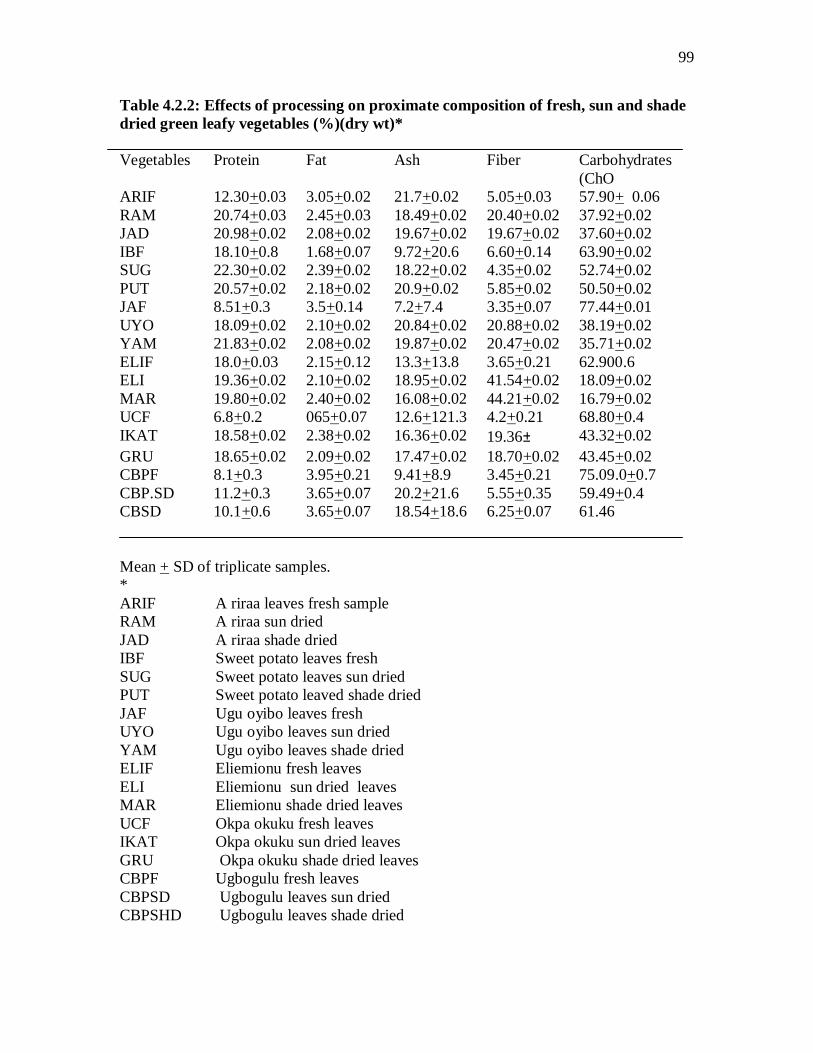
99
Table 4.2.2: Effects of processing on proximate composition of fresh, sun and shade dried green leafy vegetables (%)(dry wt)* Vegetables
Protein Fat Ash Fiber Carbohydrates (ChO
ARIF 12.30+0.03 3.05+0.02 21.7+0.02 5.05+0.03 57.90+ 0.06 RAM 20.74+0.03 2.45+0.03 18.49+0.02 20.40+0.02 37.92+0.02 JAD 20.98+0.02 2.08+0.02 19.67+0.02 19.67+0.02 37.60+0.02 IBF 18.10+0.8 1.68+0.07 9.72+20.6 6.60+0.14 63.90+0.02 SUG 22.30+0.02 2.39+0.02 18.22+0.02 4.35+0.02 52.74+0.02 PUT 20.57+0.02 2.18+0.02 20.9+0.02 5.85+0.02 50.50+0.02 JAF 8.51+0.3 3.5+0.14 7.2+7.4 3.35+0.07 77.44+0.01 UYO 18.09+0.02 2.10+0.02 20.84+0.02 20.88+0.02 38.19+0.02 YAM 21.83+0.02 2.08+0.02 19.87+0.02 20.47+0.02 35.71+0.02 ELIF 18.0+0.03 2.15+0.12 13.3+13.8 3.65+0.21 62.900.6 ELI 19.36+0.02 2.10+0.02 18.95+0.02 41.54+0.02 18.09+0.02 MAR 19.80+0.02 2.40+0.02 16.08+0.02 44.21+0.02 16.79+0.02 UCF 6.8+0.2 065+0.07 12.6+121.3 4.2+0.21 68.80+0.4 IKAT 18.58+0.02 2.38+0.02 16.36+0.02 19.36± 43.32+0.02 GRU 18.65+0.02 2.09+0.02 17.47+0.02 18.70+0.02 43.45+0.02 CBPF 8.1+0.3 3.95+0.21 9.41+8.9 3.45+0.21 75.09.0+0.7 CBP.SD 11.2+0.3 3.65+0.07 20.2+21.6 5.55+0.35 59.49+0.4 CBSD 10.1+0.6 3.65+0.07 18.54+18.6 6.25+0.07 61.46 Mean + SD of triplicate samples. * ARIF A riraa leaves fresh sample RAM A riraa sun dried JAD A riraa shade dried IBF Sweet potato leaves fresh SUG Sweet potato leaves sun dried PUT Sweet potato leaved shade dried JAF Ugu oyibo leaves fresh UYO Ugu oyibo leaves sun dried YAM Ugu oyibo leaves shade dried ELIF Eliemionu fresh leaves ELI Eliemionu sun dried leaves MAR Eliemionu shade dried leaves UCF Okpa okuku fresh leaves IKAT Okpa okuku sun dried leaves GRU Okpa okuku shade dried leaves CBPF Ugbogulu fresh leaves CBPSD Ugbogulu leaves sun dried CBPSHD Ugbogulu leaves shade dried

100
101
4.2.3 Mineral composition of six green leafy vegetables
Table 4.2.3 presents the mineral composition of six green leafy vegetables. However,
only the sun and the shade dried samples are presented and value for the fresh was not
available due to some technical difficulties during analysis. The sun (RAM) and the
shade dried (JAD) ariraa had comparable iron (1.21mg). The sun (SUG) and the shade
dried (PUT) sweet potato leaves also had comparable values (1.36mg and 1.40mg).
Shade drying had a slight edge in Fe over the sun dried sample (1.40 vs. 1.36mg). The
sun (UYO) and shade dried (RAM) ugu oyibo iron (Fe) value differed. The shade dried
had higher value than sun dried (2.58 vs 1.36mg).
The sun (ELI) and the shade dried (MAR) eliemionu followed the same trend of Fe as in
ugu oyibo. The sun (ELI) and the shade dried (MAR) samples had 1.21 and 1.26mg.
Again shade drying had an edge in iron over sun drying (1.26 vs 1.21mg).
Sun dried okpa okuko (IKAT) and shade dried (GRU) samples had 1.28 and 1.20mg. On
the other hand, the CBPSD (sun) and the shade dried (CBPSHD) ugbogulu samples had
38.5mg Fe each.
The zinc values for the sun (SUG) and the shade dried (PUT) sweet potato leaves
were 0.08 and 0.15mg. Shade dried samples had higher zinc than the sun dried samples
(0.15 vs 0.08mg). The sun (UYO) and the shade dried (YAM) ugu oyibo had 4.6 and
0.10mg. The sun drying had an edge over the shade drying with respect to zinc (4.6 vs.
0.10mg).
The sun (ELI) and the shade dried (MAR) samples of eliemionu were 4.2 and 4.5mg. The
shade dried sample had 0.03mg edge over the sun dried (4.5 – 4.2mg). The sun (IKAT)
and the shade dried (GRU) okpa okuko samples had 3.70 and 4.50mg zinc, respectively.
Again shade drying had slightly higher value than the sun dried 4.5 vs. 3.7mg.
102
The sun (CBPSD) and the shade dried (CBPSHD) ugbogulu samples had varied values
for zinc (4.8 and 2.2mg).The sun dried (CBPSD) had a twofold zinc when compared
with the shade dried (CBPSHD) value (4.8 and 2.2mg).
The iodine (I2) values for the vegetables were very encouraging. The sun (RAM) and the
shade dried (JAD) ariraa had 6.38 and 6.28mg. The sun (SUG) and the shade dried (PUT)
sweet potato leaves samples had 5.08 and 4.83mg iodine.
The sun (UYO) and the shade dried (YAM) ugu oyibo leaves samples had appreciable
level of the nutrient (3.90 and 5.61mg). The sun (ELI) and the shade dried (MAR)
samples of eliemionu had 2.71 ad 4.30mg. Shade drying had an edge over sun drying
(4.30 vs 2.71mg).
The sun (IKAT) and the shade dried (GRU) okpa okuku leaf samples had 1.0 and 1.40mg
iodine. The iodine values for sun (CBPSD) and the shade dried (CBPSHD) samples of
ugbogulu were comparable (1.3 and 1.2mg, respectively). Copper (CU) values for all the
vegetables varied. The values were influenced by treatments. The sun (RAM) and the
shade dried (JAD) values for ariraa were 1.0 and 6.60mg each. Shade drying had a
slight edge in CU value (1.60 vs. 1.40mg). Copper values for the sun (SUG) and the
shade dried (PUT) samples of sweet potato leaves were 2.40 and 1.70mg. Shade drying
had an adverse effect on copper when compared with the sun dried (SUG) sample. The
sun dried (UYO) and the shade dried (YAM) ugu oyibo samples followed the same trend
as that of sweet potato. Shade drying reduced copper as against sun drying (2.4 vs
1.20mg). The values for the sun (ELI) and the shade dried (MAR) samples of eliemionu
were 1.5 and 1.3mg, respectively. Sun drying had an edge over shade drying (1.5 vs
1.3mg).
103
Sun and shade drying had different effects on copper content. Shade drying (GRU)
decreased copper to zero and sun dried samples had 1.5mg copper. Shade drying of
ugbogulu (CBPSHD) had an edge over the sun dried (CBPSHD) sample (5.0 vs 1.3mg).
This indicated that shade drying of ugbogulu provides better source of copper than sun
drying.
Calcium content of the vegetables varied. The sun (RAM) and the shade dried (JAD)
ariraa had 14.0 and 16.00mg. The variation was 2mg. This showed that shade dried ariraa
was a better source of the nutrient than its counterpart. The sun dried sweet potato (SUG)
leaves and the shade dried sweet potato leaves (PUT) samples had each 11.5 and 22.0mg.
Sun drying increased calcium in sweet potato leaves nearly 2 fold that of sun drying
22.0mg versus 11.5mg. The sun (UYO) and the shade dried ugu oyibo (YAM) samples
had comparable values (5.7 and 5.5mg). The sun (ELI) and the shade dried (MAR)
samples of eliemionu had varied values. The shade dried sample had 10.5mg calcium and
the sun dried samples had 4.5mg which was twice the value for the shade dried samples.
(10.5 vs 4.5mg).
The sun and the shade drying of okpa okuko had comparative calcium 12.0 and 11.5mg,
respectively. On the other hand, the sun dried ugbogulu (CBPSD) had 12.5mg calcium
which was more than three times the value for the shade dried ugbogulu 12.5 vs 3.5mg-a
commonly observed phenomenon.
Selenium values for all the vegetables appeared to be food specific. Both the sun
(RAM) and shade dried (JAD) samples had no selenium. However,the sun (SUG) and the
shade dried sweet potato leaves had 4.5 and 3.0mg selenium, respectively (Table 4.2.3).
The sun (UYO) and the shade dried (YAM) ugu oyibo samples had 2.0 and 5.5mg
104
selenium . Shade drying increased selenium more than sun drying in ugu oyibo (5.5 vs
2.0mg) (Table 4.2.3).Sun and shade drying produced comparable selenium in eliemionu
(5.5mg) (Table 4.2.3)
Sun dried (IKAT) sample had no selenium in okpa okuku .On the other hand, the shade
dried sample had 5.5mg selenium. The selenium content of the sun (CBPSD) and the
shade dried (CBPSHD) samples had interesting selenium values. The sun dried sample
had 5.0mg as against that of the shade dried sample that had 1.3mg.
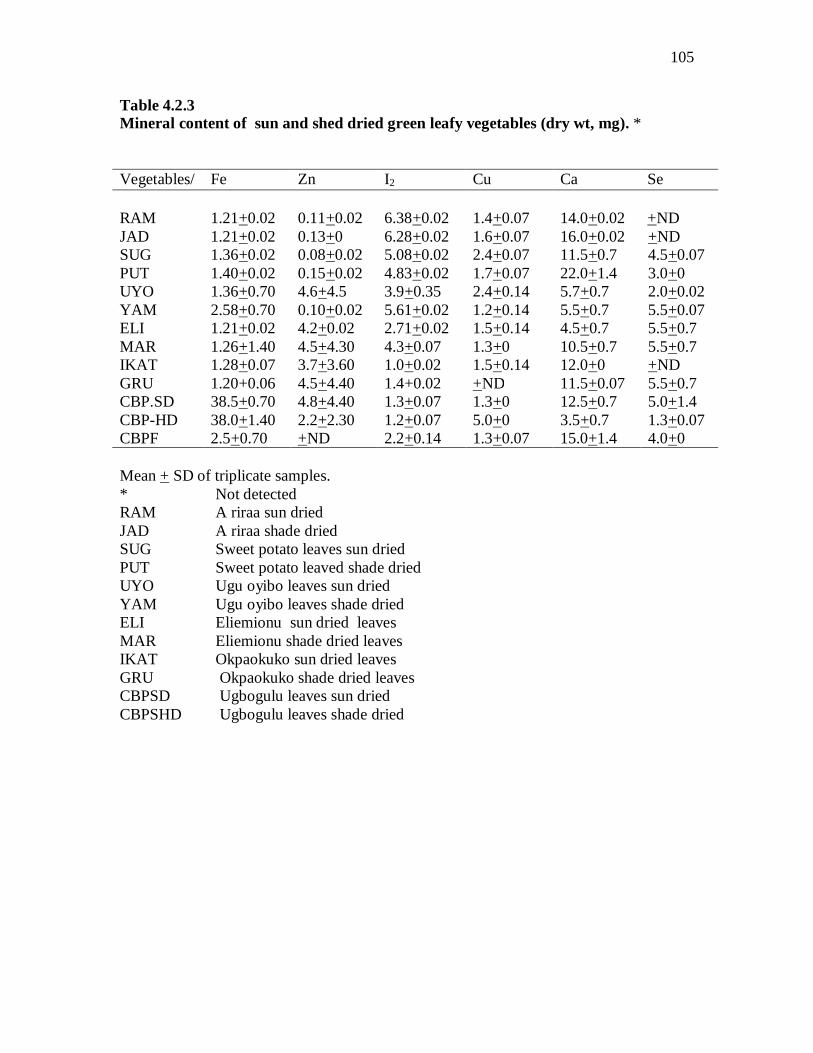
105
Table 4.2.3 Mineral content of sun and shed dried green leafy vegetables (dry wt, mg). * Vegetables/ Fe Zn I2 Cu Ca Se RAM 1.21+0.02 0.11+0.02 6.38+0.02 1.4+0.07 14.0+0.02 +ND JAD 1.21+0.02 0.13+0 6.28+0.02 1.6+0.07 16.0+0.02 +ND SUG 1.36+0.02 0.08+0.02 5.08+0.02 2.4+0.07 11.5+0.7 4.5+0.07 PUT 1.40+0.02 0.15+0.02 4.83+0.02 1.7+0.07 22.0+1.4 3.0+0 UYO 1.36+0.70 4.6+4.5 3.9+0.35 2.4+0.14 5.7+0.7 2.0+0.02 YAM 2.58+0.70 0.10+0.02 5.61+0.02 1.2+0.14 5.5+0.7 5.5+0.07 ELI 1.21+0.02 4.2+0.02 2.71+0.02 1.5+0.14 4.5+0.7 5.5+0.7 MAR 1.26+1.40 4.5+4.30 4.3+0.07 1.3+0 10.5+0.7 5.5+0.7 IKAT 1.28+0.07 3.7+3.60 1.0+0.02 1.5+0.14 12.0+0 +ND GRU 1.20+0.06 4.5+4.40 1.4+0.02 +ND 11.5+0.07 5.5+0.7 CBP.SD 38.5+0.70 4.8+4.40 1.3+0.07 1.3+0 12.5+0.7 5.0+1.4 CBP-HD 38.0+1.40 2.2+2.30 1.2+0.07 5.0+0 3.5+0.7 1.3+0.07 CBPF 2.5+0.70 +ND 2.2+0.14 1.3+0.07 15.0+1.4 4.0+0 Mean + SD of triplicate samples. * Not detected RAM A riraa sun dried JAD A riraa shade dried SUG Sweet potato leaves sun dried PUT Sweet potato leaved shade dried UYO Ugu oyibo leaves sun dried YAM Ugu oyibo leaves shade dried ELI Eliemionu sun dried leaves MAR Eliemionu shade dried leaves IKAT Okpaokuko sun dried leaves GRU Okpaokuko shade dried leaves CBPSD Ugbogulu leaves sun dried CBPSHD Ugbogulu leaves shade dried
106
4.2.4 Vitamin composition of fresh, sun and shade dried (dry weight basis)
vegetables
Table 4.2.4 contains vitamin composition of fresh, sun and shade dried (dry weight basis)
vegetables. The fresh ariraa (ARIF) had 38.50mg bata carotene. The sun dried sample
(RAM) had traces of beta carotene (0.00mg).Shade dried sample had 27.21mg beta
carotene. The fresh sweet potato leaves (IBF) sample had 85.34mg. The sun (SUG) and
the shade dried (PUT) samples had 35.29 and 2.83mg beta carotene, respectively. Fresh
ugu oyibo (JAF) had 16.99mg beta-carotene. The sun (UYO) and the shade dried (YAM)
samples had decreased values 0.23mg and traces (0.00mg) as against their controls (16.99
vs 0.23 and 0.00mg). The fresh eliemionun (ELF) had 96.49mg beta-carotene. The sun
(ELI) and the shade (MAR) dried samples had each 20 56 and 31.74mg. The fresh okpa
okuko (UCF) had 23.00mg, the sun (IKAT) and the shade (GRU) dried samples had 3
8.10 and 20. 67mg beta-carotene. On the other hand, the fresh ugbogulu (CBPF) had
2.51mg beta carotene. The sun (CBPSD) and the shade (CBPSHD) dried samples had 46.
35 and 37 90mg. Both the sun and the shade drying increased beta-carotene in ugbogulu
leaves (46.35 and 37.90mg vs 2.51mg). The sun dried sample, however, had much more
increase than the shade dried sample as compared with the control (46.35 and 37.90mg,
respectively). The fresh ariraa (ARIF), the sun (RAM) and the shade dried (JAD) samples
had comparable riboflavin values (0.29, 032 and 0.22mg, respectively).
The fresh sweet potato (IBF) leaves had 6.92mg riboflarin. The sun (SUG) and
the shade (PUT) dried samples had each 0.22 and 4. 68mg. The decrease in riboglavin
was less in the shade dried sample and much more in the sun dried samples (4.68 vs 0.
22mg)(Table 4.2.4). The fresh. ugu oyibo (JAF), the sun (UYO) and the shade dried
(YAM) samples had 1.42, 0.22 and 0.66mg riboflavin. Both treatments reduced
107
riboflavin, however, sun drying had much more adverse effect on riboflavin when
compared with the control (1.42 vs 0.22 and 0.66mg). The fresh eliemionu (ELIF) had
3.50mg. The sun (ELI) dried sample had 3. 68mg and the shade (MAR) dried sample had
4.10mg. Shade drying again, increased riboflavin more than sun drying when compared
with the control (4.10,3.68 vs 3.51mg, respectively). The fresh okpa okuku (UCF) had
2.79mg riboflavin. The sun (IKAT) and the shade (GRU) dried samples had 3.48 and
1.80mg each. Sun drying increased riboflavin and shade drying decreased it as against the
control (3.48 vs 2.70 and 2.79 vs 1. 80mg), (Table 4:2.4)
The fresh ugbogulu (CBPF) had traces (0.00mg) of riboflavin. On the other hand, the sun
(CBPSD) and the shade dried (CBPSHD) samples had 4.79 and 2.20mg. Both treatments
increased riboflavin, however, sun drying had much more increase than shade drying (4.
79 vs 2. 20mg).
Niacin values for all the vegetables differed. The values were a function of treatments
and types of vegetable.
The fresh ariraa (ARIF), the sun (RAM) and the shade dried (JAD) samples had 1.20,
0.43 and 0.43mg. Both treatments had equal reduction of niacin (0.43mg) (Table 4:2.4
The fresh sweet potato leaves (IBF), the sun (SUG) and the shade dried (PUT) samples
had 3.07, 3.44 and 1.34mg , respectively. Shade drying drastically reduced niacin in
sweet potato leaves when compared with the control (3.07 vs 1.34mg). Sun drying (SUG)
caused an increase of 0.44mg in niacin content of sweet potato leaves (3.44 vs 3.07mg).
Fresh ugu oyibo (JAF), the sun (UYO) and the shade dried (YAM) samples had 0.00,
3.57 and 0.00mg each. The control and the shade dried samples had comparable value
(0.00mg). However, sun drying increased the nutrient from 0.00-3. 57mg. The fresh
108
eliemionu (ELIF) ,the sun (ELI) and the shade dried (MAR) samples had 4.21 ,2.37 and
3.90mg niacin. Both sun and shade drying decreased the value when compared with the
control (4.21 vs 2.37 and3.80mg, respectively). Fresh okpa okuku (UCF) ,the sun (IKAT)
and the shade dried (GRU) samples had 0.04 ,0.96 and 0. 56mg niacin each. Sun drying
(IKAT) increased niacin more than shade drying (0.96 vs 0.6mg). The fresh ugbogulu
(CBPF), the sun (CBPSD) and the shade dried (CBPSHD) samples had 2.21, 1.30 and
4.28mg each. Shade drying caused highest increase in niacin(4.28 vs 2.2mg) and sun
drying caused a decrease when compared with the control (2.21 vs 1.30mg ) (Table 4.2.
4.). The fresh ariraa (ARIF), the sun (RAM) and the shade dried (JAD) samples had
10.46, 4.73 and 2.38mg vitamin C. Both the sun (RAM) and the shade drying (JAD)
decreased vitamin C. However, the decrease was higher in the JAD sample when
compared with the control (2.38 and 4.73 vs 10.46mg). The fresh sweet potato leaves
(IBF), the sun (SUG) and the shade (PUT) dried samples had 78.7, 10.41 and 1.62 mg
vitamin C each. Treatments precipitated decreases. The decrease was higher in the shade
dried sample (1.62mg) as against the sun dried (SUG) 10. 41mg.
The fresh ugu oyibo (JAF) had 1.70mg vitamin C. Sun drying (UYO) increased this value
from 1.70 to 15.49mg. On the other hand, shade drying decreased the value from 1.70 to
1.16mg relative to the control(1.70mg)(Table 4.2.4). The fresh eliemionu (ELF) had
19.33mg vitamin C. This value decreased to 1.31mg and 1.20mg by sun and shade
drying.
The fresh okpa okuku, the sun (IKAT) and the shade dried (GRU) samples had
2.58 and 1.42 and traces, 0.00mg of vitamin C. Shade drying drastically reduced the
value to only 0 00mg when compared with the control and the sun dried samples
109
(0.00mg vs 1. 42 and 2. 58mg) each .The fresh ugbogulu (CBPF) sample had 1.31mg
vitamin C. The sun (CBPSD) and the shade (CBPSHD) dried samples had 1.31 and
0.81mg each. Shade drying had equal increase in vitamin C as sun drying as against the
control (0.81 vs 1.30 and 1.31mg) each. Actually ,sun drying had little or no effect on
vitamin C. content of fresh ugbogulu leaves (1.30 vs 1.31mg) (Table 4.2.4)
Fresh ariraa (ARIF) had 1.52mg vitamin E. Both sun (RAM) and shade (JAD) drying
reduced the value to zero (0mg) (1.52 to 0.00mg). Fresh sweet potato (IBF) leaves had no
(0.00mg) vitamin E. However, sun (SUG) and shade (PUT) drying caused 15. 59 and 20.
94 vs 0.00mg increases in vitamin E when compared with the control (15.59 and 20. 94
mg). The fresh ugu oyibo (JAF), the sun (UYO) and the shade (YAM) dried samples had
12.98, 17.33 and 5.30mg vitamin E. Shade drying reduced the value to 5. 30mg as against
12. 98mg for the control. However, sun drying (UYO) increased the value from 12.98 to
17.33mg. The fresh eliemionu (ELIF) had 39.5mg vitamin E. .The sun (ELI) and the
shade dried (MAR) samples had each 39.93 and 9.52mg. vitamin E
Shade drying caused less decrease in vitamin E. than sun drying (ELI) as against the
control (9.52, 3.93 vs 39. 53mg, respectively).
The fresh okpa okuko had 10.9mg vitamin E. The sun (IKAT) and the shade dried
(GRU) samples had each 11.29 and 4.62mg of vitamin E. Sun drying slightly increased
the value from 10.91 to 11. 29mg. However, shade drying decreased it from 10.91 to
4.62mg. The fresh ugbogulu (CBPF) had 14.97mg vitamin E. Both sun and shade drying
reduced it from 14.87 to 12.46 and 5.01mg when compared with the control (14.97 and
12. 46 vs 5.01mg).
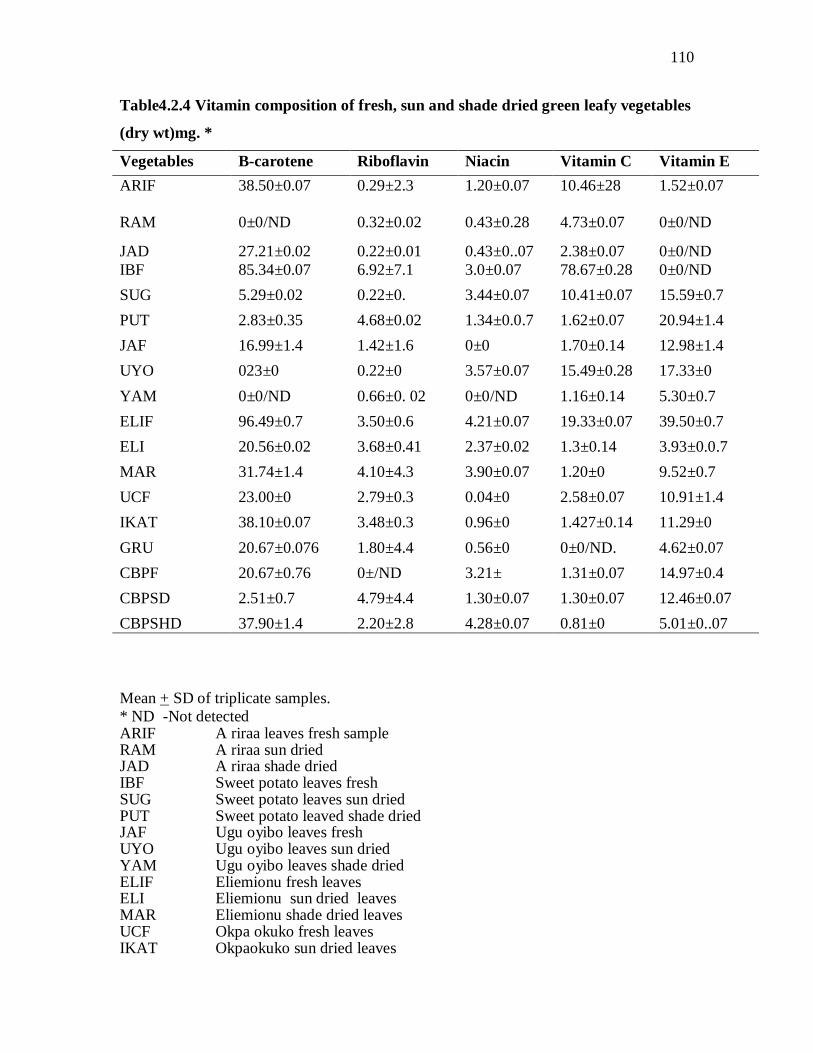
110
Table4.2.4 Vitamin composition of fresh, sun and shade dried green leafy vegetables
(dry wt)mg. *
Vegetables B-carotene Riboflavin Niacin Vitamin C Vitamin E ARIF
38.50±0.07 0.29±2.3 1.20±0.07 10.46±28 1.52±0.07
RAM 0±0/ND 0.32±0.02 0.43±0.28 4.73±0.07 0±0/ND
JAD 27.21±0.02 0.22±0.01 0.43±0..07 2.38±0.07 0±0/ND IBF 85.34±0.07 6.92±7.1 3.0±0.07 78.67±0.28 0±0/ND SUG 5.29±0.02 0.22±0. 3.44±0.07 10.41±0.07 15.59±0.7 PUT 2.83±0.35 4.68±0.02 1.34±0.0.7 1.62±0.07 20.94±1.4 JAF 16.99±1.4 1.42±1.6 0±0 1.70±0.14 12.98±1.4 UYO 023±0 0.22±0 3.57±0.07 15.49±0.28 17.33±0 YAM 0±0/ND 0.66±0. 02 0±0/ND 1.16±0.14 5.30±0.7 ELIF 96.49±0.7 3.50±0.6 4.21±0.07 19.33±0.07 39.50±0.7 ELI 20.56±0.02 3.68±0.41 2.37±0.02 1.3±0.14 3.93±0.0.7 MAR 31.74±1.4 4.10±4.3 3.90±0.07 1.20±0 9.52±0.7 UCF 23.00±0 2.79±0.3 0.04±0 2.58±0.07 10.91±1.4 IKAT 38.10±0.07 3.48±0.3 0.96±0 1.427±0.14 11.29±0 GRU 20.67±0.076 1.80±4.4 0.56±0 0±0/ND. 4.62±0.07 CBPF 20.67±0.76 0±/ND 3.21± 1.31±0.07 14.97±0.4 CBPSD 2.51±0.7 4.79±4.4 1.30±0.07 1.30±0.07 12.46±0.07 CBPSHD 37.90±1.4 2.20±2.8 4.28±0.07 0.81±0 5.01±0..07
Mean + SD of triplicate samples. * ND -Not detected ARIF A riraa leaves fresh sample RAM A riraa sun dried JAD A riraa shade dried IBF Sweet potato leaves fresh SUG Sweet potato leaves sun dried PUT Sweet potato leaved shade dried JAF Ugu oyibo leaves fresh UYO Ugu oyibo leaves sun dried YAM Ugu oyibo leaves shade dried ELIF Eliemionu fresh leaves ELI Eliemionu sun dried leaves MAR Eliemionu shade dried leaves UCF Okpa okuko fresh leaves IKAT Okpaokuko sun dried leaves
111
GRU Okpaokuko shade dried leaves CBPF Ugbogulu fresh leaves CBPSD Ugbogulu leaves sun dried CBPSHD Ugbogulu leaves shade dried 4.2.5 Antinutrient composition of fresh, sun and shade dried green leafy vegetables
(dry wt, mg). Table 4.2.5 contains anti nutrient composition of fresh, sun and shade dried green leafy
vegetables (dry wt, mg).
Fresh ariraa (ARIF) did not contain phytate, oxalate, tannins and sapponins (Table 4.2.5).
Sun and shade drying increased in ariaa phyrtate more than 100 folds (135.58 and
125.96mg, respectively).
Sun drying increased phytate more than shade drying (135.58 vs 125.96mg). Fresh sweet
potato leaf (IBF) had 99.30mg phytate. The values for the sun (SUG) and the shade dried
(PUT) vegetables were 133.38 and 180.88mg. Shade drying increased phytate more than
sun drying (180.88 vs 133.38mg).
The fresh ugu oyibo leaf (JAF) had 89.74mg phytate. The sun (UYO) and the shade dried
(YAM) samples had comparable values (129.32 and 128.08mg, respectively).
The fresh eliemionu (ELIF) sample had 102.33mg phytate. The sun (ELI) and the shade
dried (MAR) samples had 133.46 and 128.95mg, respectively. The sun dried sample had
more phytate than the shade dried sample 133.46 vs 128.95mg, respectively.
The fresh okpa okuko (UCF) had 101.8mg phytate. The sun (IKAT) and the shade dried
(GRU) samples had higher phytate than the control (101.08 vs 145.96 and 135.71mg,
respectively).
Sun drying (IKAT) increased phytate more than shade drying (GRU) (145.96 vs
135.71mg (Table 4.2.5)
112
The fresh ugbogulu leaf (CBPF) had 117.0mg phytate. The sun (CBPSD) and the shade
dried (CBPSHD) samples had 118.3 and 120.7mg each.
Sun and shade drying did not increase phytate very much when compared with the
control (117.0 vs 118.3 and 120.7mg). Fresh ariraa had no oxalate. Sun and shade drying
increased oxalate from zero (0) to 132.5 and 113.23mg each (Table 4.2.5). Shade drying
had less increase in oxalate than sun drying. Fresh potato leaf had 94.20mg oxalate.
However, the sun (SUG) and the shade dried (PUT) samples caused decreases in oxalate
(121.32 vs 113.51mg).
The fresh ugu oyibo (JAF) leaf contained 8.0mg oxalate. However, when the vegetables
were sun and shade dried the value increased from 8.0 to 111.28 and 120.04mg,
respectively. The fresh eliemionu (ELIF) had 6.5mg oxalate. The sun (ELI) and the shade
dried (MAR) samples had 121.81 and 95.73mg each. Shade drying had less increase
(95.7mg) than sun dried (ELI) sample 121.81mg. The fresh okpa okuku (UCF) contained
97.84mg oxalate as against those of the sun (IKAT) and the shade dried (GRU) samples
(132.22 and 105.66mg).
The fresh ugbogulu leaves (CBPF) had 4.8mg oxalate. The sun (CBPSD) and the shade
dried (CBPSHD) samples had 9.9 and 5.31mg each. Shade drying caused less increase in
oxalate (5.31mg) than sun drying (9.90mg). Sun and shade drying caused little increase in
tannins when compared with the control (0.00, vs 0.17 and 0.16mg). Sun or shade drying
had no edge over each other as regards increase in tannins content of fresh sweet potato
leaf (IBF) (Table 4.2.5). The sun (SUG) and the shade (PUT) drying had similar impact
on tannins (0.16 and 0.16mg).
113
The fresh ugu oyibo leaf (JAF) had very small tannins 0.10mg. On the other hand, the
sun (UYO) and the shade dried (YAM) samples had comparable tannins (0.10 and
0.15mg).
The fresh eliemionu (ELIF) had 2.70mg tannins. The sun (ELI) and the shade dried
(MAR) samples had 0.13 and 0.15mg each.
The fresh okpa okuku (UCF) had 0.17mg. The sun (IKAT) and the shade dried (GRU)
samples had 0.17 and 0.13mg each.
The fresh ugbogulu (CBPF) had 1.89mg tannins. The tannins values for the sun and the
shade dried (CBPSD and CBPSHD) samples were 8.60 and 2.20mg, respectively. As
mentioned before, fresh ariraa (ARIF) had zero (0) saponins. Sun (RAM) and shade
drying caused very little increase (0.06 and 0.05mg each). Fresh sweet potato leaf had no
sapponins. However, sun (SUG) and shade drying (PUT) increased saponins from 0 to
0.6 and 0.7mg, respectively. The fresh ugu oyibo (JAF) had no saponins. The sun (UYO)
and the shade drying (YAM) caused 0.06 and 0.04mg increase in saponins (Table 4.2.5).
The fresh eliemionu had 12.71mg saponins. Sun (ELI) and shade (MAR) drying
drastically reduced saponins from 12.71 to 0.06 and 0.07mg, respectively.
The fresh okpa okuko leaf (UCF) had comparable value with those of sun (IKAT) and
shade (GRU) drying (0.06 vs 0.06 and 0.05mg). The fresh ugbogulu leaf (CBF) had low
saponins (0.08mg). However, the sun (CBPSD) and the shade drying (CBPSHD)
increased the values (4.5 and 4.7mg, respectively). Neither sun nor shade drying had an
edge over each other as regards increase in saponins concentration.
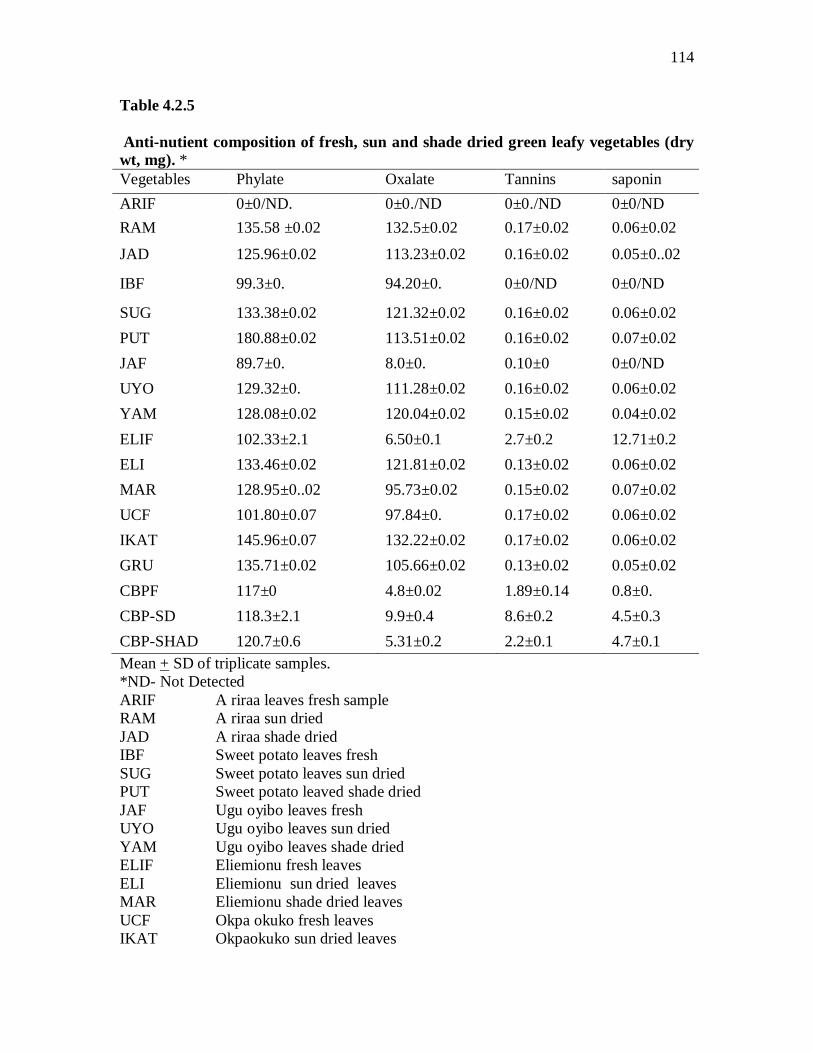
114
Table 4.2.5
Anti-nutient composition of fresh, sun and shade dried green leafy vegetables (dry wt, mg). * Vegetables Phylate Oxalate Tannins saponin ARIF 0±0/ND. 0±0./ND 0±0./ND 0±0/ND RAM 135.58 ±0.02 132.5±0.02 0.17±0.02 0.06±0.02
JAD 125.96±0.02 113.23±0.02 0.16±0.02 0.05±0..02
IBF 99.3±0. 94.20±0. 0±0/ND 0±0/ND
SUG 133.38±0.02 121.32±0.02 0.16±0.02 0.06±0.02 PUT 180.88±0.02 113.51±0.02 0.16±0.02 0.07±0.02 JAF 89.7±0. 8.0±0. 0.10±0 0±0/ND UYO 129.32±0. 111.28±0.02 0.16±0.02 0.06±0.02 YAM 128.08±0.02 120.04±0.02 0.15±0.02 0.04±0.02 ELIF 102.33±2.1 6.50±0.1 2.7±0.2 12.71±0.2 ELI 133.46±0.02 121.81±0.02 0.13±0.02 0.06±0.02 MAR 128.95±0..02 95.73±0.02 0.15±0.02 0.07±0.02 UCF 101.80±0.07 97.84±0. 0.17±0.02 0.06±0.02 IKAT 145.96±0.07 132.22±0.02 0.17±0.02 0.06±0.02 GRU 135.71±0.02 105.66±0.02 0.13±0.02 0.05±0.02 CBPF 117±0 4.8±0.02 1.89±0.14 0.8±0. CBP-SD 118.3±2.1 9.9±0.4 8.6±0.2 4.5±0.3 CBP-SHAD 120.7±0.6 5.31±0.2 2.2±0.1 4.7±0.1 Mean + SD of triplicate samples. *ND- Not Detected ARIF A riraa leaves fresh sample RAM A riraa sun dried JAD A riraa shade dried IBF Sweet potato leaves fresh SUG Sweet potato leaves sun dried PUT Sweet potato leaved shade dried JAF Ugu oyibo leaves fresh UYO Ugu oyibo leaves sun dried YAM Ugu oyibo leaves shade dried ELIF Eliemionu fresh leaves ELI Eliemionu sun dried leaves MAR Eliemionu shade dried leaves UCF Okpa okuko fresh leaves IKAT Okpaokuko sun dried leaves
115
GRU Okpaokuko shade dried leaves CBPF Ugbogulu fresh leaves CBPSD Ugbogulu leaves sun dried CBPSHD Ugbogulu leaves shade dried
Table 4.3.1: Proximate composition of yam dishes prepared plain, with fresh, sun
and shade dried and pulverized vegetables.
Table 4.3.1 presents proximate composition of yam dishes, prepared plain, with fresh,
sun and shade dried and pulverized vegetables. The moisture content of the yam dishes
differed. It ranged from 22.15 to 71. 20% . The YPP, the B106, the A104 and the B105
had comparable moisture (71.00, 71.2, 70.7 and 69. 0o%, respectively). The A-102. had
the least value 22.15 %.The A-101 and the YCP had 65.70 and 61.5 9% each . On the
other hand ,the A-103 and B-107 had comparable moisture (46.85 and 53.35%). The
protein content of the dishes varied. It ranged from 5.4 to 12.6%. The A-101, the YCP
and the A-103 had 12.6, 11.8 and 10.1% protein, respectively. On the other hand, the
YPP, the B-105, the A-104 and the B-106 had comparable values ( 6.0, 6.2 6.3 and 6.5%
each).
The A-102 had the least (5.4% protein). The B-107 however, had 8.3% protein .Fat
values for the dishes varied. The variation ranged from 5.5 to 35.6%. The B-105, the B-
106, the B-105, the B-107 and the YCP samples had 19.00 , 15.8, 13.6 and 11.75% fat.
The A-103 had the highest fat 35. 6%. The A-102 and the A-104 had the least values
(5.95 and 5.50%).On the other hand ,the YPP had 6.35% fat.
The ash values varied. It ranged from 4.6 to 9.5%. The A-102, and the B-106 samples
had comparable ash (5.1%). The B-105 had the highest ash and the A-103 had the least
(9.5 and 4.6%, each). The A-104, the YCP and the B-107 had comparable values 8.2,
8.3 and 7.8%. The YPP and the A-101 samples also had similar ash (6.2 and 6.9%).
116
Fibre values for the dishes differed. It ranged from 1.60 to 4.65%. The YPP , however,
had the least (1.60%) .The A-102 and the B-107 had 2.7,2.4 and 2.05%,respectively.
The A-104 and the YCP had highest and comparable values (4.64, and 4.65%) (Table
4.3.1)
The A-101, the A-103 and the B-105 samples had also comparable values (3.65, 3.50
and 3.45%, respectively) .Carbohydrate (CHO) values for the dishes differed, it ranged
from 0.00 to 58.60%. CHO levels were influenced by protein, fat, ash and moisture
composition of the dishes.
The high moisture, fibre, fat and protein of the dishes (the B-105 and the B-106
and the A-103 )led to traces and low CHO except for the A-102, the A-103, the B-107
and the YPP (58.60,31.44,15.2 and 8.20%, respectively
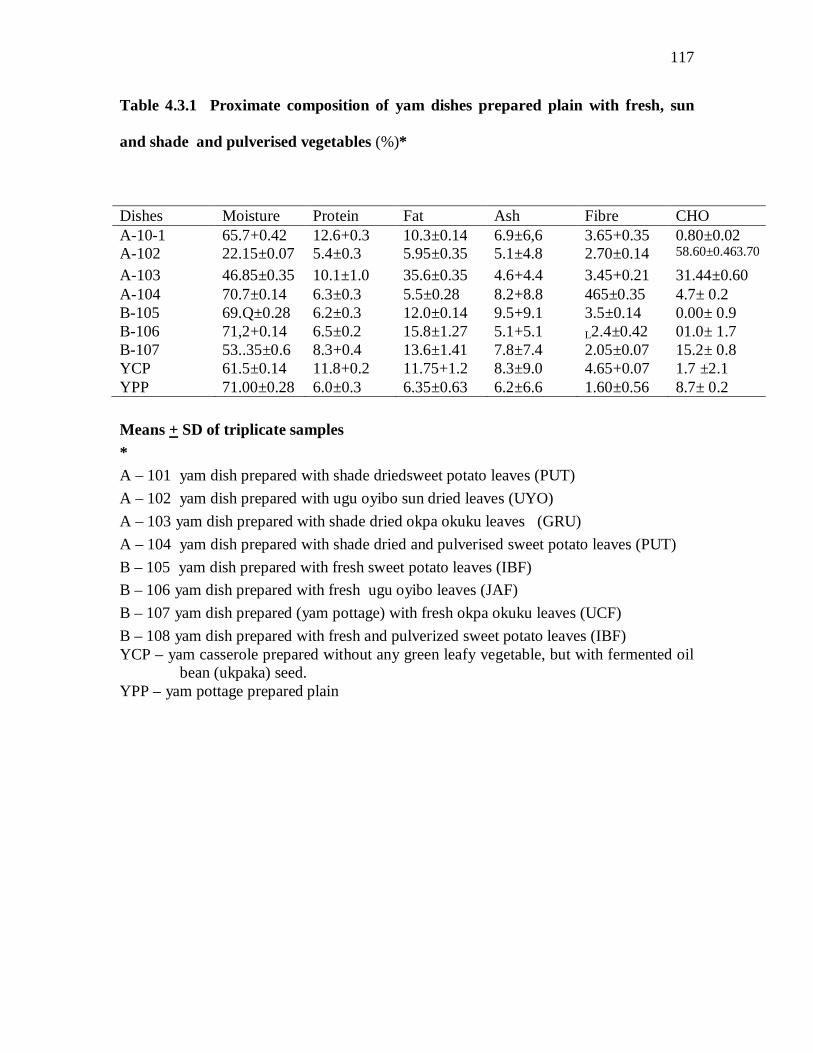
117
Table 4.3.1 Proximate composition of yam dishes prepared plain with fresh, sun
and shade and pulverised vegetables (%)*
Dishes Moisture Protein Fat Ash Fibre CHO A-10-1 65.7+0.42 12.6+0.3 10.3±0.14 6.9±6,6 3.65+0.35 0.80±0.02 A-102 22.15±0.07 5.4±0.3 5.95±0.35 5.1±4.8 2.70±0.14 58.60±0.463.70
A-103 46.85±0.35 10.1±1.0 35.6±0.35 4.6+4.4 3.45+0.21 31.44±0.60 A-104 70.7±0.14 6.3±0.3 5.5±0.28 8.2+8.8 465±0.35 4.7± 0.2 B-105 69.Q±0.28 6.2±0.3 12.0±0.14 9.5+9.1 3.5±0.14 0.00± 0.9 B-106 71,2+0.14 6.5±0.2 15.8±1.27 5.1+5.1 L2.4±0.42 01.0± 1.7 B-107 53..35±0.6 8.3+0.4 13.6±1.41 7.8±7.4 2.05±0.07 15.2± 0.8 YCP 61.5±0.14 11.8+0.2 11.75+1.2 8.3±9.0 4.65+0.07 1.7 ±2.1 YPP 71.00±0.28 6.0±0.3 6.35±0.63 6.2±6.6 1.60±0.56 8.7± 0.2 Means + SD of triplicate samples * A – 101 yam dish prepared with shade driedsweet potato leaves (PUT) A – 102 yam dish prepared with ugu oyibo sun dried leaves (UYO) A – 103 yam dish prepared with shade dried okpa okuku leaves (GRU) A – 104 yam dish prepared with shade dried and pulverised sweet potato leaves (PUT) B – 105 yam dish prepared with fresh sweet potato leaves (IBF) B – 106 yam dish prepared with fresh ugu oyibo leaves (JAF) B – 107 yam dish prepared (yam pottage) with fresh okpa okuku leaves (UCF) B – 108 yam dish prepared with fresh and pulverized sweet potato leaves (IBF) YCP – yam casserole prepared without any green leafy vegetable, but with fermented oil
bean (ukpaka) seed. YPP – yam pottage prepared plain
118
The antimutrient and food toxicants composition of yam dishes prepared plain, with
fresh, sun and shade dried and pulverized vegetables differed.
All the yam dishes prepared with various vegetables had traces of phytate, oxalate,
tannins and saponins. However, the dish prepared with sun dried ugu oyibo (A-102) had
121.30 .4.3 ,16.6 and 14.5mg phytate, oxalate, tannins and sapoins, respectively.
Table 4.3.2 Mineral composition of yam dishes prepared plain with fresh, sun and
shade dried and pulverised vegetables(mg)*.
Table 4.3.2 Presents mineral composition of yam dishes prepared plain, with fresh, sun
and shade dried and pulverized vegetables.
The iron (Fe) content of the dishes varied. The variation was a function of the type of
vegetables used to prepare the dishes. The dishes prepared with shade dried sweet potato
leaves (A-104), and that prepared with shade dried and pulverized vegetables (A-
101and A-104) had 15. 5 and 13.00mg of iron each. The dish prepared with fresh sweet
potato leaves (B-105) had the highest iron 33.50mg, followed by that prepared with
fresh okpa okuko leaves (B-107) (16.00mg). The A-101 had 15.5mg and the shade dried
and pulverized sweet potato leaves (A-104) had 13.00mg. The yam pottage prepared
plain and that prepared with sun dried ugu oyibo (A-102) leaves had the least Fe (3.5 and
6.5mg, respectively). On the other hand, the dish prepared with fresh and pulverized
sweet potato leaves (B-108) and yam casserole prepared without any green leafy
vegetables but with fermented oil bean seeds (YCP) had 11.51 and 10.01mg Fe ,
respectively.The yam dish prepared with shade dried okpa okuku (A-103) and that
prepared with fresh ugu oyibo leaves (B-106) had comparable Fe (8.51 and 8.00mg,
respectively) (Table 4.3.2).
119
The zinc content of the yam dishes prepared with shade, shade and pulverized sweet
potato vegetables (A-101and A-104) had varied values.(1.3 and 1.00mg). The dishes
prepared with sun dried ugu oyibo (A-102) and that prepared with shade dried okpa
okuku (A-103)hadtraces of zinc(0.00mg).
On the other hand ,the dishes prepared with shade dried sweet potato leaves (A-
101 ) and those prepared with shade dried and pulverized sweet potato (A-104), fresh
sweet leaves (A-105) and fresh okpa okuku (B-107) had 1.30 , 1.00 ,4.2 and 1.60mg,
respectively (Table 4.4.3). The dishes prepared with shade dried okpa okuku leaves (A-
103) and fresh okpa okuku leaves (B-107) had traces of copper (0.00mg).The dishes
prepared with sun dried (A-102 ), fresh sweet potato leaves ( B-105), fresh ugu oyibo
leaves (B-106) and fresh and pulverized sweet potato leaves (B-108) had higher and
comparable values(1.4.1.3,1.2 and 1.4mg, respectively) than the other dishes. The dish
prepared with shade dried and pulverized sweet potato leaves (A-104) had the least
copper (0.3mg).The dishes prepared with shade dried sweet potato leaves (A-101), yam
casserole prepared with fermented oil bean seeds instead of green leafy vegetables (YCP)
and yam pottage prepared plain( YPP) also had comparable copper (0.6, 0.8 and 0.8mg
each)(Table 4.3.2)
The dishes prepared plain, with fermented oil bean and those prepared with
treated vegetables had calcium that ranged from 2.0 to 25.50mg (Table 4.3.2). The dishes
that contained sun dried ugu oyibo (A-102), shade dried sweet potato leaves (A-101) and
yam casserole prepared with fermented oil bean seeds instead of green leafy vegetables
(YCP) had comparable calcium (24,5 25.5and 23.50mg, respectively). The dishes
120
prepared with shade dried sweet potato (A-104),fresh sweet potato leaves (B-105) and
fresh ugu oyibo leaves (B-106) had comparable calcium (13.5 , 14.0 and 13.50mg each
).The dish prepared with shade dried okpa okuku (A-103) had the least value (2.0mg)
followed by the (B-107)(3.0mg).On the other hand, the dish prepared with fresh and
pulverized sweet potato leaves (B-108) had 8.50mg calcium.
The selenium levels varied. The dishes prepared with shade dried sweet potato leaves (A-
101) , shade dried okpa okuko (A-103), fresh okpa okuko leaves (B-107) and that of dish
prepared with fermented oil bean seeds (YCP) had traces of selenium(0.00mg)
The dish prepared with sun dried ugu oyibo (A-102) had the highest selenium (3.5mg).
The dishes prepared with shade dried and pulverized sweet potato leaves (A -104 ),
fresh sweet potato leaves (B-105) and fresh ugu oyibo leaves (B-106) had comparable
values (1.0mg)(Table 4.3.2).The dishes prepared with fresh and pulverized sweet potato
leaves (B-108) and yam pottage prepared plain (YPP) also had similar values (2.0mg,
respectively). Most of the dishes prepared with different vegetables contained traces of
iodine (0.00mg).However, the dishes prepared with shade dried sweet potato leaves (A-
101), fresh okpa okuku leaves (B-107) and yam dish prepared with fermented oil bean
seeds instead of green leafy vegetables (YCP) had 1.3,1.1 and 1.0mg iodine, respectively
(Table 4 .3.2)
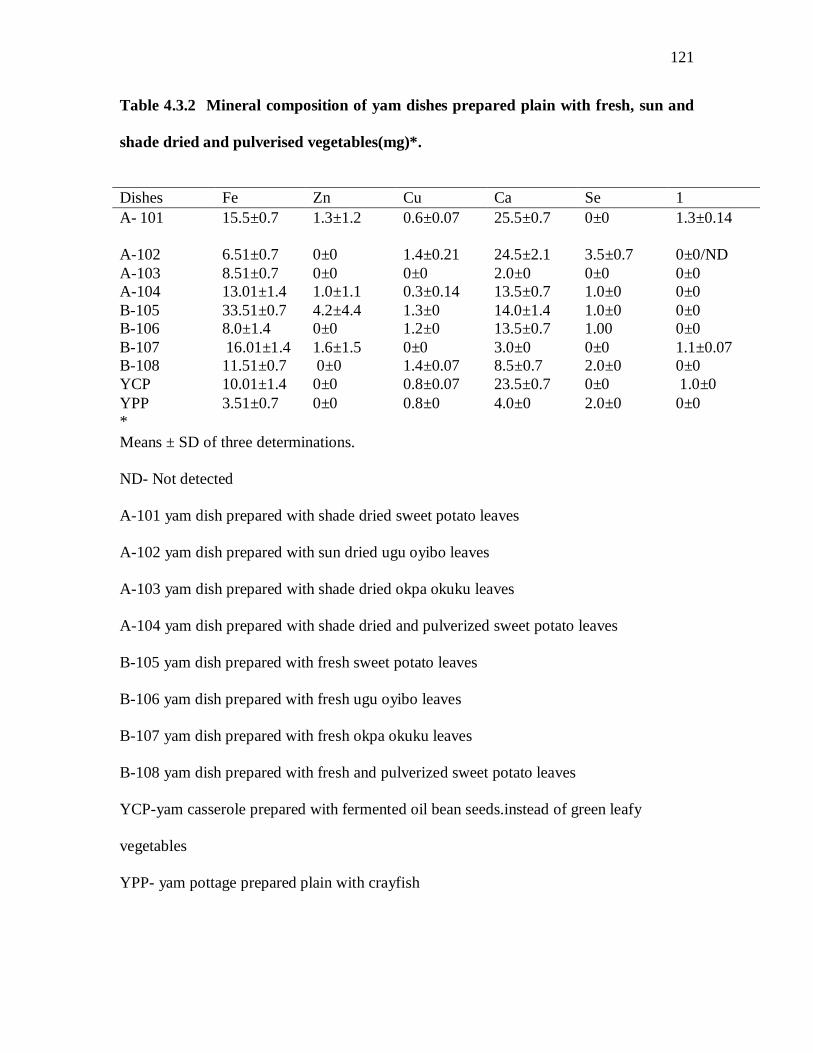
121
Table 4.3.2 Mineral composition of yam dishes prepared plain with fresh, sun and
shade dried and pulverised vegetables(mg)*.
Dishes Fe Zn Cu Ca Se 1 A- 101
15.5±0.7
1.3±1.2
0.6±0.07
25.5±0.7
0±0
1.3±0.14
A-102 6.51±0.7 0±0 1.4±0.21 24.5±2.1 3.5±0.7 0±0/ND A-103 8.51±0.7 0±0 0±0 2.0±0 0±0 0±0 A-104 13.01±1.4 1.0±1.1 0.3±0.14 13.5±0.7 1.0±0 0±0 B-105 33.51±0.7 4.2±4.4 1.3±0 14.0±1.4 1.0±0 0±0 B-106 8.0±1.4 0±0 1.2±0 13.5±0.7 1.00 0±0 B-107 16.01±1.4 1.6±1.5 0±0 3.0±0 0±0 1.1±0.07 B-108 11.51±0.7 0±0 1.4±0.07 8.5±0.7 2.0±0 0±0 YCP 10.01±1.4 0±0 0.8±0.07 23.5±0.7 0±0 1.0±0 YPP 3.51±0.7 0±0 0.8±0 4.0±0 2.0±0 0±0 * Means ± SD of three determinations.
ND- Not detected
A-101 yam dish prepared with shade dried sweet potato leaves
A-102 yam dish prepared with sun dried ugu oyibo leaves
A-103 yam dish prepared with shade dried okpa okuku leaves
A-104 yam dish prepared with shade dried and pulverized sweet potato leaves
B-105 yam dish prepared with fresh sweet potato leaves
B-106 yam dish prepared with fresh ugu oyibo leaves
B-107 yam dish prepared with fresh okpa okuku leaves
B-108 yam dish prepared with fresh and pulverized sweet potato leaves
YCP-yam casserole prepared with fermented oil bean seeds.instead of green leafy
vegetables
YPP- yam pottage prepared plain with crayfish
122
Table 4.3.3: Vitamin composition of yam dishes prepared plain, with fresh, sun and
shade dried and pulverized vegetables
Table 4.3.3 presents vitamin composition of yam dishes prepared plain, with fresh, sun
and shade dried and pulverized vegetables The yam dishes prepared with shade dried
okpa okuko (A-103) had the highest beta-carotene(52.0mg). The dishes prepared with
shade dried sweet potato leaves (A-101),fresh okpa okuku leaves (B-107) and yam
casserole prepared with fermented oil bean seeds instead of green leafy vegetables (YCP)
had comparable and high beta-carotene levels (24.1,24.9 and 25.3mg).The yam pottage
prepared plain (YPP) had traces of beta-carotene as well as that prepared with fresh and
pulverized sweet potato leaves (B-108) (0.00mg). On the other hand, the shade dried and
pulverized sweet potato dish (A-104) had 8. 9mg beta-carotene. The dishes prepared
with sun dried ugu oyibo leaves (A-102) and fresh ugu oyibo leaves (B-106) had
comparable values (4.3 and 4.6 mg, respectively). However, the (B-105) fresh sweet
potato leaves based yam dish had 11.4 mg beta-carotene.
All the dishes regardless of the vegetables used for the preparation had riboflavin
values less than 1.00mg (Table4.3.3).. The range was from 0.1 to 0.7mg. However, sun
dried ugu oyibo (A-102) had the highest riboflavin 0.70mg. The dishes that contained
fresh vegetables had riboflavin values that ranged from 0.1 to 0.4mg. The fresh
pulverized sweet potato leaves (A-108), however, had the highest value (0.4mg). The
dishes that contained fermented oil bean seed (YCP) and the pottage prepared plain
(YPP) had each 0.2 and 0.3mg. The dishes that contained shade dried and pulverized
sweet potato leaves (A-104) had niacin values that ranged from 0.6 to 3.10mg. The sun
dried ugu oyibo (A-102) dish and the shade dried and pulverized sweet potato leaves (A-
104) had 2.3 and 2.2mg niacin each (Table 4.3.3).Among the dishes prepared with fresh
123
vegetables ,the fresh and pulverized sweet potato leaves dish (B-108) had the highest
niacin (3.1mg) The dish prepared with fresh ugu oyibo ( B-106) had traces of niacin.
The dish prepared with fresh sweet potato leaves (B-105) and (B-107) had
0.20 and 0.10mg niacin , respectively. The dish prepared with fermented oil bean seeds
(YCP) and that of the dish prepared plain (YPP) had comparable value (0.4mg) among
the dishes prepared with processed vegetables. The shade dried okpa okuku (A-103) had
traces of vitamin C. The sun dried ugu oyibo (A-102) dish had the highest vitamin C
(18.1mg). However, shade dried sweet potato dish (A101) and the shade dried pulverized
sweet potato leaves dish (A-104) had each 4.3 and 2.2mg. Pulverization of sweet potato
leaves caused a decrease in vitamin C when compared with that of the shade dried (2.2
and 4.2mg). Among dishes prepared with fresh vegetables, the fresh ugu oyibo dish (B-
106) had the highest ascorbate ( 12.40mg). The other dishes had traces of vitamin C
(Table 4.3.3). The dish prepared with fermented oil bean seeds (YCP) and that prepared
plain (YPP) had 2.2 and 4.4mg each. The dish prepared with sun dried ugu oyibo (A-102)
had 10.5mg vitamin E, the other dishes had traces of the nutrient (Table 4.3.3).
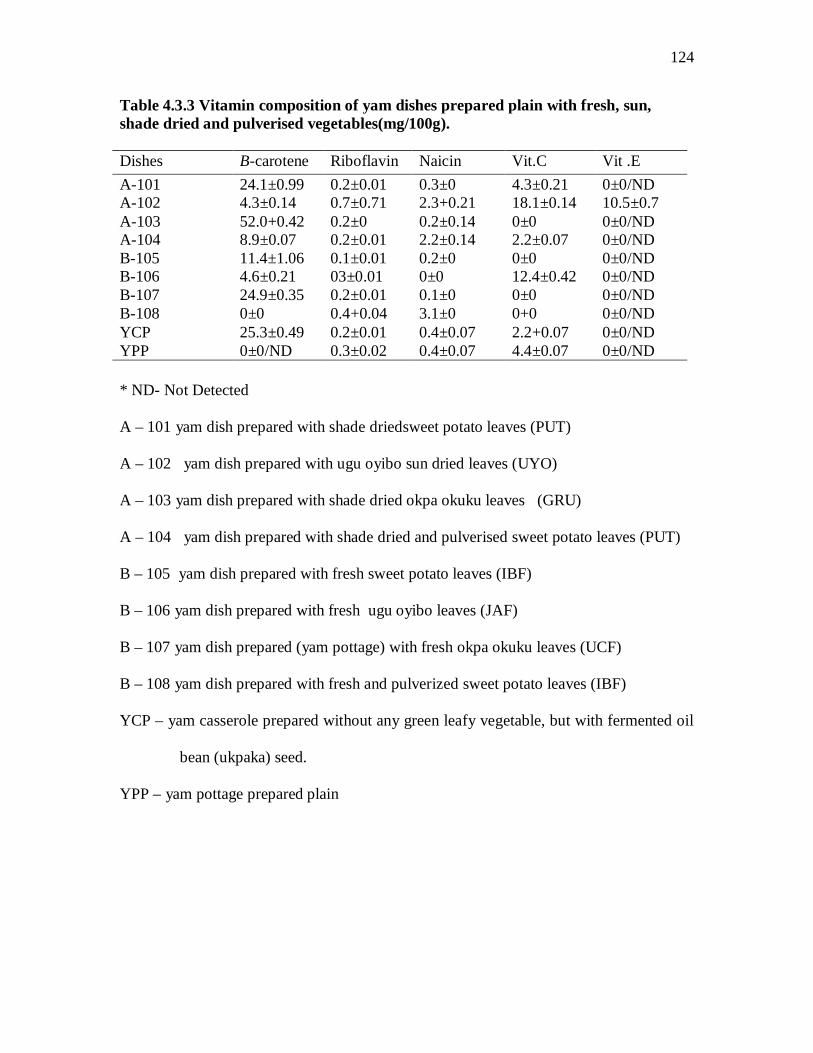
124
Table 4.3.3 Vitamin composition of yam dishes prepared plain with fresh, sun, shade dried and pulverised vegetables(mg/100g). Dishes B-carotene Riboflavin Naicin Vit.C Vit .E A-101 24.1±0.99 0.2±0.01 0.3±0 4.3±0.21 0±0/ND A-102 4.3±0.14 0.7±0.71 2.3+0.21 18.1±0.14 10.5±0.7 A-103 52.0+0.42 0.2±0 0.2±0.14 0±0 0±0/ND A-104 8.9±0.07 0.2±0.01 2.2±0.14 2.2±0.07 0±0/ND B-105 11.4±1.06 0.1±0.01 0.2±0 0±0 0±0/ND B-106 4.6±0.21 03±0.01 0±0 12.4±0.42 0±0/ND B-107 24.9±0.35 0.2±0.01 0.1±0 0±0 0±0/ND B-108 0±0 0.4+0.04 3.1±0 0+0 0±0/ND YCP 25.3±0.49 0.2±0.01 0.4±0.07 2.2+0.07 0±0/ND YPP 0±0/ND 0.3±0.02 0.4±0.07 4.4±0.07 0±0/ND * ND- Not Detected
A – 101 yam dish prepared with shade driedsweet potato leaves (PUT)
A – 102 yam dish prepared with ugu oyibo sun dried leaves (UYO)
A – 103 yam dish prepared with shade dried okpa okuku leaves (GRU)
A – 104 yam dish prepared with shade dried and pulverised sweet potato leaves (PUT)
B – 105 yam dish prepared with fresh sweet potato leaves (IBF)
B – 106 yam dish prepared with fresh ugu oyibo leaves (JAF)
B – 107 yam dish prepared (yam pottage) with fresh okpa okuku leaves (UCF)
B – 108 yam dish prepared with fresh and pulverized sweet potato leaves (IBF)
YCP – yam casserole prepared without any green leafy vegetable, but with fermented oil
bean (ukpaka) seed.
YPP – yam pottage prepared plain
125
Table 4.4 1: Organoleptic attributes of the 8 yam dishes.
Table 4.4 1 presents the organoleptic attributes of the 8 yam dishes.
COLOUR
The colour of yam dishes prepared with shade dried sweet potato leaves (101) fresh
sweet potato leaves(105), fresh ugu oyibo leaves (106) and fresh okpa okuku leaves
(107) had 7.5, 7.9 and 7.4, respectively. The dishes prepared with sun dried ugu oyibo
leaves (102) had 4.6. The yam dish prepared with shade dried okpa okuku leaves (103)
had (6.40), shade dried and pulverized sweet potato leaves (104) had 3.4.
However, the yam dish prepared with fresh and pulverized sweet potato leaves (108) had
the least colour (2.7).
The colour of the dish prepared with sun dried ugu oyibo leaves (102) and the dish
prepared with shade dried okpa okuko, (103) had 4.6 and 6.4, these values were higher
than half of the 9 point hedonic scale used (4.5). The dishes prepared with shade dried
and pulverized sweet potato leaves(104) and that prepared with fresh and pulverized
sweet potato leaves (108) had one half of hedonic scale used (4.5).(4.5) vs 3.4 and 2.7,
respectively.
TEXTURE
The texture of the dishes varied. It ranged from 4.7 to 7.2. The texture of the dish
prepared with fresh ugu oyibo leaves (106) and that prepared with fresh okpa okuku
(107) leaves had comparable values (7.20 and 6.9). The texture of dishes prepared with
shade dried sweet potato leaves (101)and that prepared with shade dried okpa okuku
126
(103) and another dish prepared with fresh sweet potato leaves (105) and yam dish
prepared with fresh okpa okuko (107) had comparable values (5.60, 5.40, 5.40 and 4.70,
respectively).On the other hand, the texture of yam dishes prepared with sun dried ugu
oyibo leaves (102) and that prepared with shade dried and pulverized sweet potato
leaves (104) had varied values that were comparable (6.00 and 6.50)
FLAVOUR
The flavour of the products differed. The flavour of yam dish prepared with fresh sweet
potato leaves(105) and dish prepared with fresh and pulverized sweet potato leaves
(108) had comparable values (6.30 and 6.70). The yam dish prepared with fresh ugu
oyibo leaves ( 106) had 7.60 which was the highest when compared with the rest (P
< 0.05) (Table 4.4.1). The dish prepared with shade dried sweet potato leaves ( 101), sun
dried ugu oyibo leaves (102) , shade dried and pulverized sweet potato leaves (104),
dish prepared with fresh okpa okuko leaves (107), as well as that prepared with shade
dried okpa okuko (103) had varied and comparable values (5.8, 5.7, 5.0, 4.8 and 5.6
respectively).
General acceptability
The general acceptability of the product was interesting. The dish prepared with shade
dried sweet potato leaves ( 101) and the dish prepared with shade dried and pulverized
sweet potato leaves ( 104) had the least value s (5.8 and 5.5).The yam dish prepared with
sun dried ugu oyibo leaves (102) and that prepared with sun dried okpa okuko (103) had
comparable values (6.10 and 6.00).
The yam dish prepared with fresh ugu oyibo leaves (106) as well as that prepared with
fresh and pulverized sweet potato leaves (108) had equal acceptability (6.7 and 6.9).
However, yam dish prepared with fresh sweet potato leaves (105) and that prepared with

127
fresh okpa okuko leaves (107) had the highest acceptability and comparable values (7.50
and 7.30, respectively).
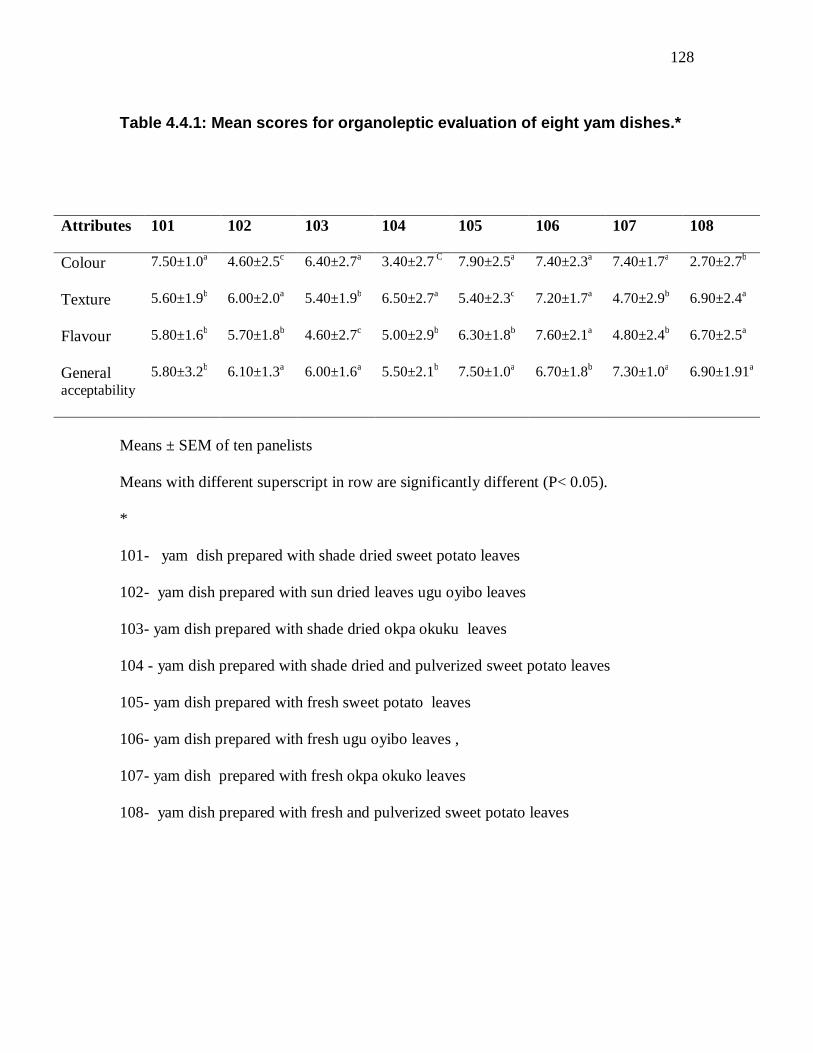
128
Table 4.4.1: Mean scores for organoleptic evaluation of eight yam dishes.*
Means ± SEM of ten panelists
Means with different superscript in row are significantly different (P< 0.05).
*
101- yam dish prepared with shade dried sweet potato leaves
102- yam dish prepared with sun dried leaves ugu oyibo leaves
103- yam dish prepared with shade dried okpa okuku leaves
104 - yam dish prepared with shade dried and pulverized sweet potato leaves
105- yam dish prepared with fresh sweet potato leaves
106- yam dish prepared with fresh ugu oyibo leaves ,
107- yam dish prepared with fresh okpa okuko leaves
108- yam dish prepared with fresh and pulverized sweet potato leaves
Attributes
101
102
103
104
105
106
107
108
Colour
7.50±1.0a
4.60±2.5c
6.40±2.7a
3.40±2.7 C
7.90±2.5a
7.40±2.3a
7.40±1.7a
2.70±2.7b
Texture
5.60±1.9b
6.00±2.0a
5.40±1.9b
6.50±2.7a
5.40±2.3c
7.20±1.7a
4.70±2.9b
6.90±2.4a
Flavour
5.80±1.6b
5.70±1.8b
4.60±2.7c
5.00±2.9b
6.30±1.8b
7.60±2.1a
4.80±2.4b
6.70±2.5a
General acceptability
5.80±3.2b
6.10±1.3a
6.00±1.6a
5.50±2.1b
7.50±1.0a
6.70±1.8b
7.30±1.0a
6.90±1.91a
129
CHAPTER FIVE
5.0 DISCUSSION
5.1 Study on Identification, Consumption Pattern and Utilization of 6 Leafy
Vegetables
The lower consumption values (16.7 and 33.3%) for ugu oyibo and okpa okuku)
suggested that these two vegetables were not commonly known and consumed when
compared with the other popular vegetables. The slightly higher value 73.3%, for sweet
potato leaves as compared with ugu oyibo and okpa okuku suggested that more than
70% of the subjects identified it as one of the commonly and popularly consumed
vegetables in Igbo-ukwu.
On the other hand, the comparable values (96.7 to 100%) for the other vegetables
indicated that on the average, that 99.5% of the subjects were able to identify these
vegetables as commonly available and consumed in Igbo-ukwu community (Table 4.1.1)
The traces (0.00%) and less than 10% (6.7%) indicates that these vegetables had lesser
status in the community as against the other vegetables (Table 4.1.2)
The higher percentage of the subjects (100%) (Table 4.1.2) indicated that these
vegetables were commonly available in the market for sale and vice versa.
The higher response with regards to the six dishes prepared with the 14 vegetables (Table
4.1.3) indicated that yam, and soup / stews were the dishes that the community used these
vegetables to prepare and consume (244 and 240, respectively). On the other hand, the
least value, 81 for plantain indicated that only a few of the community members prepared
plantain dishes with these 14 vegetables (Table 4.1.3).
130
Rice and cocoyam had nearly the same responses (120 and 125) for use of these 14
vegetables for preparation of dishes commonly available in the market and consumed in
Igbo-ukwu.
The higher responses (364) from the subjects as the sources of information and
availability of these vegetables in Igbo- ukwu appeared to suggest that most of the
subjects interviewed obtained their information from parents (Table 4.1.4).
Grandmothers (60) were the next high sources of information on the availability of these
vegetables in Igbo-ukwu for purchase, processing, preparation and utilization of dishes
based on these vegetables for maintenance of good health..
The lower percentages (3.3 and 6.7 %) for the perception of tastes and pattern of
consumption of these vegetables strongly suggested that sweet potato and okpa okuko
leaves had the least perception for taste and pattern for consumption of these vegetables
in Igbo-ukwu community.
On the other hand, the higher and comparable values (93.3 to 100%) for those, who had
perception of taste, and consumption pattern of the 14 vegetables selected for study
indicated that these vegetables were commonly available, cost effective when these
vegetables are in season and consumed by nearly every household in Igbo-ukwu.
However, the lower percentage (0.00%) for perception of taste and consumption pattern
of these vegetables implied that every member of the family was familiar with the
vegetables in Igbo-ukwu community (Table 4.1.5)
The highest frequency of consumption (93.3%) for ugu leaves suggested that nearly all
the households in Igbo-ukwu use ugu for preparation of most of their dishes.
131
The purpose for use of this vegetable for preparation of most or their dishes, was what
they learned from their parents. Bitter leaf, nchuanwu, inine, oha and mgbolodi that had
86.7, 83.3 80.0 and 76.7% each indicated that these vegetables were the next popular
vegetables, each household in Igbo-ukwu cherished and used for various dishes.
The practice for use of these vegetables were handed over to them mostly by parents and
grandmothers.
The low values (6.7, 20.0 and 30.0%) for sweet potato leaves, okpa okukuo and ugu
oyibo indicated that these vegetables were the least frequently used for preparation of
various dishes in Igbo-ukwu households. The high values (93.80 and 40%) indicated that
sweet potato leaves, okpa okuku, ariiraa, eleimionu and ugbogulu were the vegetables
that were frequently used for preparation of various dishes in Igbo-ukwu community.
This is because the parents and grandmothers who taught them the use of these
vegetables for dish preparation never used these vegetables often for dish preparation.
5.2 Factors that Influenced Consumption Pattern of these Vegetables:
The highest responses (397, 342 and 332) suggested that the factors that promote
vegetable consumption in Igbo-ukwu community are ease of preparation, cost
effectiveness and availability all year round.
The second and third factors that influence vegetable consumption in Igbo-ukwu were
that vegetable increases blood and taste of the vegetables (Table 4.1.7).
However, the factor that had least influence on vegetable consumption was taste (Table
4.1.7) The factors that militated against consumption of these vegetables in Igbo- ukwu
were that the subjects did not know about the vegetables as well as not readily available
132
in Igboukwu. Off taste had little or no adverse influence on consumption of these
vegetables in Igbo ukwu
Not nutritious and long cooking time with (0.00) responses from the subjects indicated
that these factors were never a problem militating against vegetable consumption in Igbo
ukwu community .The higher average percent responses (29.67%) for those who knew
that these vegetables were cultivated around their home than those who had no
knowledge (18.67%) appeared to indicate that only a few (11%) of those subjects
interviewed had no knowledge that vegetables were around their homes.
As judged by the results, most of the inhabitants of each household in Igbo -ukwu knew
much about commonly available, edible vegetables, their cultivation, harvesting,
preparation and utilization in various dishes (soups and stews for various festivals).
5.3 Proximate Composition, Micronutrient and antinutrient content of the 6 Fresh
and Processed Vegetables.
The decrease in moisture level of six vegetables (Table 4.2.1) sun and shade dried
samples was expected when compared with the control (fresh). It is a common
phenomenon that foods including fruits and vegetables exposed to either sun or shade
drying lose moisture along with volatile materials. The lower moisture for all the sun died
samples except for the shade dried eliemionu (MAR) and okpa okuku (GRU) might be
associated with higher heat generated by the sun. It might also be attributed to the type
and initial moisture content of the vegetables.
The lower protein for the six fresh vegetable is simple to explain when compared
with the values for either the sun or the shade dried samples. Fresh vegetable contain
more moisture and less protein as such heat from any source is applied to them the
133
moisture is lost. However, the lower the moisture content of any given foods (animals or
plants), the higher is the protein value and vice versa (Table 4.2.1).
The decreases in fat for the six vegetables (shade dried samples) (Table 4.2.1)
except for those of eliemioun (MAR) and ugbogulu leaves (CBPSHD), unlike in the sun
dried samples might be attributed to the level of volatile compound components of the
vegetables. These results showed that shade dying had an edge over sun drying with
respect to fat levels in various edible vegetables.
The increases in ash values for the sun and the shade dried samples were not a
surprise (Table 4.2.1). It is known that the lower the loss of moisture of a given food, the
higher is the dry matter of which ash is one. The higher fibre for the sun and the shade
dried samples of the six vegetables is normal. Vegetables are very good source of fibre in
our diets. Based on this, when the moisture content of these vegetables was lost, it caused
increases in dry matter including fibre. However, the increases in fibre for these
vegetables were not equal. The unequal in fibre values was a function of the type and
initial fibre values for the fresh samples prior to the sun and the shade drying a commonly
observed fact.
The low carbohydrate values for all the six fresh vegetables was not a surprise.
Fresh vegetables are not good sources of carbohydrate. The shade dried samples of the
six vegetables had lower carbohydrates than the sun dried samples (Table 4.2.1). This is
because the sun has higher heat intensity that reduced moisture faster to increase dry
matter of which carbohydrate is one than shade drying that has lower heat intensity a
commonly observed phenomenon.
134
The increases in protein of the sun (RAM) and the shade (JAD) dried samples of
ariraa as compared with the control (20.74, 20.98 vs 12.30%) was due to loss of moisture
(Table 4.2.2). The increase also in the sun (SUG) and the shade dried (PUT) samples of
sweet potato leaves (22.3 20.57 vs 18.10%) (IBF) control was again due to loss of
moisture. The increases in protein content of UYO, YAM., ELI .MAR. IKAT. GRU.
CBPSD and CBPSHD (Table 4.2.2) as against their controls IBF, JAF, ELIF, UCF and
CBPFD (18.09 ,21.83, 19.36, 19.80 ,18. 58 ,18.65 and 11. 20, 10.10 vs 8.5,1.00, 6.8 and
8.1mg, respectively were due to loss of moisture. It is known that loss of moisture in any
given food increases dry matter of which protein is among.
The decreases in fat, in the sun (RAM) and the shade dried (JAD) ariraa might be
due to increase in temperature during processing when compared with the control (2.45
and 2.08 vs 3.05%, respectively).Equally, the increases in fat content of the sun (SUG)
and shade (PUT) dried sweet potato leaves as against the control (1.68%) might be that
increase in temperature hydrolyzed complex fat molecules to release more free fat-a
commonly observed phenomenon
The decrease in the sun (UYO) and the shade dried (YAM) ugu oyibo samples
(2.1 and 2. 08 vs 3.5%)(JAF).might be due to evaporation during high temperature. Fats
are known to contain volatile materials that evaporate easily upon increase in temperature
.This lower fat values for the six green leafy vegetables (Table 4.2.1) was not a surprise.
In general, vegetable contain little fat. The fat is meant for protection and maintenance of
cell wall integrity. The decreases in the sun and the shade dried samples, the (RAM) and
the (JAD) (18.49 and 19. 67%) as against the control 21.7% (ARIF) (Table 4.2.2 ) might
be due to loss of vegetative part of the leaves due to effect of processing. However, the
135
increases in the sun and the shade dried sweet potato leaves (SUG) and (PUT) as well as
those of the sun and the shade dried ugu oyibo (UYO) and (YAM) (18.22,20.94, 20. 84
and 19. 87% as against their controls (9. 72 and 7. 2%, respectively) might be due to
hydrolysis of complex fat to release more free fatty acids..
Equally, the increase in ash for the sun and the shade dried eliemionu (ELI and
MAR) as well as those of okpa okuku (IKAT and GRU and ugbogulu (CBPSD)
(CBPSHD) as against their controls ( ELIF UCF and CBPF) (19.36, 19.80 18.58 18.65
11. 20 and 10. 10% vs 19.0, 6.8 and 8.1%, respectively) might be due to release of more
ash as a result of hydrolysis to reduce fibre and increase ash.
The increases in fibre of all the sun and the shade dried vegetables as against their
controls (Table 4.2.2) was due to loss of moisture. The various increases in fibre content
of the different sun and shade dried vegetables were not the same. This was due to
varietal differences. For example, the sun dried sweet potato leaves (SUG) and the shade
dried sweet potato leaves (PUT) as well as the sun dried ugbogulu leaves (CBPSD) and
the shade dried samples (CBPSHD) had increased values when compared with their
controls. However, the increase was not the same in the other vegetables. The lower CHO
for some of the treated samples was due to loss of moisture during drying.. However, the
vegetables whose carbohydrate values ranged from 16.79 to 77.44 %)(Table 4.2.1) were
because they had low moisture as such less moisture was lost which led to increase in
CHO values.
136
The comparable iron for the sun and the shade dried ariraa leaves (RAM) and
(JAD) (1.21mg) clearly suggested that none of the processing methods had an edge over
the other (Table 4.2. 3).
The slightly higher (Fe) for the shade dried sweet potato leaves (PUT) than the
sun dried leaves (SUG)( 1.40 vs 1.36mg) suggested that shade drying is a better method
of increasing Fe in sweet potato leaves
The increase in Fe for the shade dried ugu oyibo leaves (YAM)(2.58mg) as
against the sun dried sample (UYO) (1.26mg) suggested that shade drying is a better
domestic food processing technique to increase Fe in vegetables than sun drying. It also
confirmed that ugu oyibo is rich in Fe as previously reported by many workers (Udofia
,2005; Umoh,2006).
The higher Fe 1.26mg for the shade dried eliemionu (MAR) as against the sun
dried (ELI) sample (1.21mg) showed that shade drying had an edge over sun drying.
The lower Fe (1.20mg) for the shade dried okpa okuku (GRU) than that of the
sun dried okpa okuku leaves (IKAT)( 1.28mg) showed that the sun dried elimionu is a
better source of Fe than its counterpart. The higher Fe 43.5mg for the sun dried
ugbogulu leaves (CBSD) as against 38.0mg for the shade dried (CBPSHD) showed that
even if sun drying had an edge over shade drying (43.5 vs 38.0mg) both processes
increased Fe.
The higher zinc values for the shade dried ariraa (JAD) and the shade dried sweet
potato leaves (PUT) (0.13 and 0.15mg) as against the sun dried ariara (RAM) and the
sun dried sweet potato leaves (SUG)( 0.11 and 0.08mg) suggested that shade drying had
an edge over sun drying as food processing technique to increase zinc in these two
137
vegetables .On the other hand, the high zinc (4.6mg) for the sun dried ugu oyibo leaves
(UYO) as well as the shade dried ugbogulu leaves (CBPSD) (4.8mg) showed that sun
drying was a better means of processing these vegetables.
The higher iodine (6.38mg)for the sun dried ariraa ( RAM) and 5.08mg for the sun dried
sweet potato leaves (SUG) and (1.3mg) for the sun dried ugbogulu leaves (CBPSD)
indicated that sun drying had an edge over shade drying as the better source of iodine.
This might due to varietal differences among the vegetables. The comparable increase
(2.4mg) in copper for the sun dried sweet potato (SUG)/ and the sun dried ugu oyibo
leaves indicated that sun drying had an edge over shade drying as a method to increase
copper in these two vegetables. The equal increases in Cu(1.5mg) for the sun dried
eliemionu ( ELI) and the shade dried okpa okuko (IKAT) indicated that sun drying
again had advantage as a better source of the nutrient (copper). The trace values 0.00mg
for copper of the shade dried okpa okuku (GRU ) meant that shade drying did not
produce enough heat to extract copper from okpa okuku as compared with sun drying.
On the other hand, the higher copper (5.0mg) for the shade dried ugbogulu leaves
(CBPSHD) indicated that shade drying was a much better process to increase copper in
ugbogulu leaves (5.00mg vs 1.3mg) (Table 4.2.3)
The higher calcium value for shade dried ariraa (JAD) as against the sun dried ariraa
(RAM) (16.00 vs 14.00mg) as well as 22.00mg for the shade dried sweet potato leaves
(PUT) and the sun dried 11.50 mg sweet potato leaves (SUG )showed that shade drying
had an advantage over sun drying with respect to increase in calcium (Table 4.2.3 ).
Conversely, the lower calcium (5.5mg 11.5mg and 3.5mg for the shade dried sweet
potato leaves (YAM), the shade dried ugu oyibo leaves (GRU) and the shade dried
138
ugbogulu (CBPSHD) indicated that shade drying is not a beneficial process to increase
calcium in these green leafy vegetables. These values are at variance with those of
(Udofia, 2005) in atama vegetables.
The traces (0 .00mg) in selenium for both the sun and the shade dried ariraa (RAM and
JAD) indicated that these vegetables may be deficient in selenium. This might be due to
low selenium in the soil where these vegetables were grown. The higher selenium
(4.5mg)for the sun dried sweet potato leaves (SUG) and (5.0mg) for the sun dried
ugbogulu leaves ( CBPSD) indicated that sum drying is a better process to increase
selenium in these two varieties of vegetables. The comparable values (5.5mg) the for sun
dried eliemionu (ELI) and the shade dried eliemionu (MAR) indicated that either of the
processes can equally increase selenium in any of the vegetables. Surprisingly, the trace
value for the sun dried okpa okuku leaves (IKAT ) as against 5.5mg for the shade dried
(GRU) okpa okuku leaves indicated that shade drying had an edge over sun drying with
respect to increase in selenium in these vegetables.
The traces of beta-carotene in the sun dried ariraa (RAM) and the sun dried ugu oyibo
leaves (UYO) might be due to the volatile nature of pro-vitamin A It is known that
volatile compounds evaporate at the least increase in temperature. This might be the case
in these sun dried vegetables. The high beta-carotene values for the shade dried ariraa
(JAD)(27.210mg) and the shade dried eliemionu (MAR)(31.74mg) indicated that shade
drying was specific in increasing pro-vitamin A in these two vegetables. The lower
values for beta-carotene in all the sun dried samples regardless of varietal differences
might be associated with evaporation of β-carotene at least increase in temperature
139
observed previously in this laboratory (Wachap, 2005) . The higher value for riboflavin
of the sun dried ariraa (RAM) (0.32mg) as against the shade dried(JAD (0.22mg) as well
as those of the sun dried okpa okuku (IKAT) (3.48mg vs 1.80mg)for the shade dried okpa
okuku leaves (GRU) and ugbogulu leaves (CBPSD) (4.79mg as against shade dried
ugbogulu leaves (CBPSHD) (2.20mg) showed the superiority of sun over shade drying
for these vegetables.
On the other hand, the higher riboflavin for shade dried sweet potato leaves (PUT)
(4.68mg) against the sun dried sweet potato leaves (SUG)(0.22mg) the shade dried
uguoyibo (YAM) leaves (0.66mg) the sun dried ugu oyibo leaves (UYO) (0.22mg) and
the shade dried eliemionu (MAR) leaves (4.10mg) as against the sun dried eliemionu
(ELI) (3.68mg) indicated that this process was specific to increase this nutrient.
The comparable niacin (0.48mg) for the sun and the shade dried ariraa samples indicated
that treatments did not have advantage over the untreated samples (fresh) because they
decreased the value from 1.20 to 0.48mg (Table 4 .2.4)
It is a surprise to observe that the fresh (JAF) and the shade dried (YAM) ugu oyibo
leaves had traces of niacin. This is because niacin is stable in many food processing
techniques. On the other hand ,the higher niacin for the sun dried ugu oyibo leaves
(UYO)(3.57mg), the sun dried sweet potato leaves (SUG) – 3.44mg , the sun dried okpa
okuku leaves (IKAT), (0.96mg) was not a surprise because heat from the sun would not
affect niacin content of any given vegetables (Udofia, 2005). The higher ascorbate for
the fresh (IBF) sweet potato leaves and the fresh eliemionu (ELIF) was not a surprise. A
worker had shown that some fresh vegetables contain more ascorbate than the sun or the
shade dried samples (Udofia, 2005).
140
However, the higher ascorbate for the sun dried ariraa (RAM)(4,75mg), the sun dried ugu
oyibo leaves (UYO) (15.48mg), the sun dried okpa okuku (IKAT) (1.43mg) and the sun
dried ugbogulu leaves ( CBPSD) (1.30mg) as against the fresh ugbogulu (CBPF)
(1.31mg) and the shade dried ugbogulu (CBPSHD) (0.81mg) were not a surprise. It might
be attributed to loss of moisture, which is known to increase dry matter. However,
ascorbate is one of these dry matters.
The traces of vitamin E in the sun and the shade dried samples as against their controls is
simple to explain. Vitamin E is fat soluble and contains some volatile compounds. These
compounds are known to evaporate when vitamin E rich- foods are subjected to heat
treatment. On the other hand, the increases in vitamin E due to sun and shade drying for
sweet potato leaves(SUG and PUT), ugu oyibo(UYO and YAM), okpa okuku (IKAT and
GRU) and ugbogulu(CBPSD and CBPSHD)15.59,20.94;17.53 and 5.30;11.29 and 4.62
and 12.46 and 5.01mg, respectively) (Table 4.2.4a) might be that heat melted organic
compounds containing alpha tocopherol (vitamin E precursor) and hydrolyzed organic
compounds to release more free vitamin E..
The lower beta-carotene for the sun and the shade dried samples of all the vegetables was
due to losses based on residual moisture. The higher beta-carotene for ariraa, sweet
potato leaves, ugu oyibo and eliemionu leaves confirmed earlier observation in this
laboratory (Udofia, 2005; Mefoh, 2008). They reported that some vitamins or their
precursors were much more concentrated in their fresh as against their dry forms .On the
other hand, the trace values for beta-carotene of ariraa, sweet potato and ugu oyibo
leaves might be attributed to volatility of beta-carotene .On the other hand, the increases
141
in beta-carotene due to sun and shade drying in ugbogulu, could be due to varietal
differences.
Ugbogulu leaves have hair that protects it against direct heat, as such protects it against
loss of some volatile substances .The decreases and increases in riboflavin of all the
vegetables were a function of varietal differences. The higher value for fresh sweet potato
leaves(IBF) (6.92mg) and that of fresh ugu oyibo leaves (JAF) (1.42mg) as against their
treated samples, might be associated with loss due to residual moisture.
The increases in riboflavin for the sun dried ariraa (RAM) (0.32mg) and the sun dried
ugbogulu (CBPSD) (4.79mg) were due to types of vegetables. The comparable decreases
in niacin value for the sweet potato leaves the sun and the shade dried ( SUG and PUT)
shade dried ugu oyibo leaves (YAM) (0.00mg) sun dried eliemionu leaves (ELI) and
shade dried eliemionu leaves (MAR) (2.37 and 3.90mg and sun dried ugbogulu leaves
(CBPSD) (1.30mg) as against their controls, (Table 4.2.4)(3.07,0.00.2.21mg,respectively)
indicated that these two treatments (sun and shade drying) were not beneficial with
respect to niacin content of these vegetables. The increases of niacin in these vegetables
might be associated with loss of residual moisture – a commonly observed fact (Udofia,
2005).
The higher ascorbate for the fresh ariraa (ARIF) (10.46mg) the fresh sweet potato leaves
(IBF)(78.67mg), the fresh eliemionu (ELIF) (19.33mg) ,the fresh okpa okuku (UCF )
(2.58mg) and the fresh ugbogulu (CBPF)(1.3mg) confirmed that vitamin C is high in
fresh vegetables than in either the sun or the shade dried samples (Table 4.2.4).
The traces of vitamin E in the sun and the shade dried ariraa samples (RAM and
JAD(0.00mg) might be associated with volatibility of the precursor of vitamin E during
142
increased in temperature. On the other hand, the higher vitamin E values for the sun and
the shade dried sweet potato leaves(SUG and PUT) (15.59mg and 20.94mg), as against
the control (0.00mg) might be ascribed to treatments. The much higher vitamin E for the
shade dried sweet potato leaves (PUT) (20.94mg) suggested its superiority over sun
drying(15.59mg)(Table4.2 4).
The lower vitamin E for the sun dried eliemionu (ELI) and the shade dried eliemionu
(MAR) (3.93 and 9.52mg) suggested that these processes were not beneficial as regards
vitamin E content of eliemionu. The lower vitamin E values for the shade dried okpa
okuku (GRU) (4.62mg) and the shade dried ugbogulu leaves (CBPSHD) (5.01mg) as
against the fresh and the sun dried ugbogulu (UCF and CBPF) (10.91 and 14.97mg )
suggested that fresh and sun drying of these vegetables are better sources of the vitamin
as against the shade drying.
Fresh ariraa (ARIF) had traces of phytate, oxalate, tannins and saponins which appeared
to indicate that the fresh ariraa is devoid of these anti nutrients and food toxicants. The
increase in phytate due to sun and shade drying except for that of eliemonu was not a
surprise. Sun and shade drying are expected to lower these anti nutrients. However, it is
recently observed in many vegetables subjected to sun and shade drying or other
treatments showed increase in value when compared with the control (Udofia, 2005;
Umoh, 2006). The explanation was that during this treatment these vegetables contain
other compounds other than phytate. Unfortunately, the analysis was specific for phytate,
as such it was not able to detect the new and unknown compounds
143
The increases in all the sun dried vegetables as against the shade dried samples indicated
that sun drying was not beneficial as a means of reducing the ant-nutrient in these
vegetables. It is of interest, to note that fresh ugbogulu (CBPF) had 4.8mg oxalate.
However, the shade dried ugbogulu leaves (CBPSHD) had value two times lower than
that of the sun dried (CBPSD) (5.39 vs 9.90mg) an indication that the former process had
an advantage over the latter, with respect to decrease of oxalate.
The various effects on tannins content of the vegetables were solely attributed to varietal
differences. On the other hand, the higher values for the shade dried ariraa (JAD)
(0.16mg), the shade dried sweet potato leaves (PUT) (0.16mg),the shade dried ugu oyibo
leaves (MAR)(0.15mg), and the shade dried ugbogulu leaves (CBPSHD)(2.20mg)
indicated that shade drying is a lesser beneficial process as compared with sun drying in
lowering tannins levels in these vegetables.
Recent report indicated that tannins besides its adverse effect on bio availability of
minerals, it has potentially beneficial effects on lowering serum cholesterol in both
human and animal studies (Bender, 2002).
The lower values for saponins for all the shade dried vegetables (JAD, SUG, YAM,
MAR, GRU and CBPSHD) (0.05, 0.04, 0.07, 0.05, 4.70mg, respectively) as against
higher values for the counterpart (sun drying), indicated that shade drying is much more
beneficial to reduce levels of saponins in vegetables.
The variation in phytate values for the vegetables is solely attributable to types of
vegetable. The increase in phytate in the sun dried ariraa (RAM) (135.58 vs 125.96mg)
and the sun dried ugu oyibo leaves (UYO)(129.32 vs 128.08mg) the sun dried eliemonu
(ELI)(133.46 vs 128.95mg),the shade dried okpa okuku leaves (IKAT)( 145.96 vs
144
135.71mg ,respectively) indicated that shade drying was not beneficial in reduction of
phytate in these vegetables. However, the lower levels of phytate in the shade dried
vegetables except that of sweet potato (PUT) (180.88mg) and the shade dried ugbogulu
leaves (CBPSHD) (120.7mg) indicated that shade drying was not beneficial to reduce
phytate in these specific vegetables. This variation was due to varietal specificity.
The low oxalate values for all shade dried vegetables except for that of ugu oyibo (YAM)
(113.23mg), 113.51mg, 95.73mg, 105.66mg, 120.04mg and 5.31mg, respectively, as
against the higher values for the sun dried samples depicted the superiority of shade
drying over sun drying.
The lower tannins values for all shade dried samples except for the comparable value
(0.16mg) for the sum (SUG) and the shade (PUT) dried sweet potato leaves)
demonstrated that shade drying had an edge over sun drying in reduction of tannins in
these selected vegetables.
The lower and higher saponins for all the vegetables were attributable to varietal
differences. The lower saponins values for the SUG, the ELI and the CBPSD (sun dried
sweet potato leaves, sun dried ugbogulu, and sun dried eliemionu leaves) showed that sun
drying had an advantage in reduction of saponins in these vegetables as compared with
other treatments. On the other hand, the lower saponins for the shade dried ariraa leaves
(JAD), the shade dried ugu oyibo (YAM ) and the shade dried okpa okuku ( GRU)
(0.05, 0.04 and 0.05mg, respectively) as against those of the sun dried values clearly
suggested that shade drying was superior to sun drying with respect to reduction of
saponins in these vegetables (Table 4.2.5).
145
5.4 Organoleptic Studies
The yam dish prepared with shade dried sweet potato leaves (A-101) that had the highest
protein (12.60%) was due to its added ingredients. The lower CHO for 101 dish (1.85%)
and fat (10.3%) are easy to explain. Vegetables have low CHO as such the higher
vegetable content of the dish precipitated low CHO value.
The high fat was solely attributed to the added oil during preparation of the dish. The low
protein for dish prepared with the sun dried ugu oyibo leaves (A – 102) (5.4%) indicated
that the supplementation was not mutual.
The similarity in protein for yam dish prepared with the shade dried and pulverized sweet
potato (A – 104)(6.3%), yam dish prepared with the fresh sweet potato leaves ( B – 105)
(6.2%), yam dish prepared with the fresh ugu oyibo leaves (JAF) (B- 106 (6.5%) and
yam pottage prepared plain (without vegetables )but with crayfish (YPP) 6.0% indicated
that any of the dishes could supply equal amount of protein The slightly higher protein
for the yam casserole prepared with fermented oil bean seeds instead of green
vegetables (YCP)(11.8%) than( A- 10 3) dish prepared with the shade dried okpa okuku
(10.10%) equally showed that either of the dish has comparable protein (11.80vs10.10%,
respectively)
The variations in fat that ranged from 5.5% - 35.6% were due to various sources of
vegetables that accompanied the yam dishes. The higher fat for (A – 103) (prepared with
the shade dried okpa okuku leaves) (35.6%) might be associated with the softness of yam
used for the preparation. It is known that the softer the yam for preparation of vegetable
dish, the more oil is absorbed. The variation in fibre and moisture followed the same
trend and explanation of the variation in values. The higher fibre for (A – 104) (4.45%)
146
dish prepared with the shade dried and pulverized sweet potato leaves and the (YCP)
dish prepared with fermented oil been seed instead of green vegetables (4.6 5%,
respectively) was due to high fibre content of the shade dried pulverized sweet potato
leaves (A -104). The yam dish prepared with fresh ugu oyibo leaves (B –106) and yam
dish prepared with fermented oil been seed (YCP) were high in fibre due to vegetables
content of the dish.
The considerable high ash value for all the dishes that ranged from 4.60 to 9.50%was not
a surprise because vegetables are good sources of minerals (ash). The dishes were
prepared with abundant vegetables because the time the dishes were prepared, vegetables
were abundant and cheap in markets. The low CHO that ranged from zero 0.00mg to
63.7% was a function of type of vegetable. Vegetables in general are not good sources of
carbohydrate.
The high CHO 63.73% for( A – 102) dish prepared with sun dried ugu oyibo leaves was
because of loss of moisture .
The traces (0.00) of phytate, oxalate, tannins and saponins in all the dishes except for the
dish prepared with the sun dried (ugu oyibo leaves (A- 102) (Table 4.3.2) indicated that
both the yam and vegetables used to prepare the dishes had traces of these anti -nutrients
and food toxicants. The values for antinutrient and food toxicant in dish (A – 102),
prepared with the sun dried ugu oyibo leaves might be much more attributable to the
various vegetables used for the preparation of the dish. The yam might not contain any of
the antinutrients and food toxicants or if they contain them in the leaves ,the values
were too low to be detected from the equipment used for analysis.
147
The low iron values for yam dishes prepared with the sun dried ugu oyibo leaves (A
102), (A – 103) yam dish prepared with the shade dried okpa okuku leaves ( B – 106),
yam dish prepared with the fresh ugu oyibo leaves (YPP), yam pottage prepared plain
with cray fish (6.5, 8.5, 8.0 and 3.5mg, respectively) indicated that the vegetables used
for the preparation of the dishes were in the form in which iron would not be available.
The highest iron (33.5mg) for (B-105) dish prepared with fresh sweet potato leaves
suggested that it is a better source of the nutrient as compared with other vegetables.
The traces of zinc (0.00mg) in ( A-102) yam dish prepared with the sun dried ugu oyibo
leaves( A-103), yam dish prepared with the shade dried okpa okuku leaves ( B-106) yam
dish prepared with the fresh ugu oyibo leaves (B -108), yam dish prepared with the fresh
and the pulverized sweet potato leaves might be that neither the vegetables nor the
ingredients used for the preparation contained appreciable zinc.
The (YCP) yam casserole prepared with fermented oil bean seed instead of green
vegetables and (YPP) – yam pottage prepared with crayfish appeared to suggest that
these vegetables either due to their processing or the combinations militated against the
detection of zinc in these dishes.
The higher zinc (4.20mg) (Table 4.3.3) for (B-105) yam dish prepared with fresh sweet
potato leaves as compared with other dishes was not a surprise. Fresh sweet potato
leaves is a good source of zinc (Table 4.2.2), this dish was prepared with large quantities
of fresh sweet potato leaves. The higher and comparable copper values (1.4,1.3,1.2,and
1.4mg) for ( A-102) yam dish prepared with the sun dried ugu oyibo leaves (B-105) dish
prepared with fresh sweet potato leaves and (B-108) yam dish prepared with the fresh
and pulverized sweet potato leaves showed that the vegetables that accompanied the yam
148
dish had better copper content than the other vegetables. The higher and comparable
calcium (25.5, 24.5 and 23.5mg) for (A-101) yam dish prepared with the shade dried
sweet potato leaves, (A – 102) yam dish prepared with the sun dried ugu oyibo leaves and
(YCP) the yam casserole dish prepared with fermented oil bean seeds instead of green
vegetables indicated that they have superiority over other dishes as source of calcium.
The higher selenium for (A-102) yam dish prepared with the sun dried ugu oyibo leaves,
(B-108) yam dish prepared with the fresh and pulverized sweet potato leaves and (YPP)
yam pottage prepared plain (3.5, 2.0 and 2,0mg) was due to the type of vegetable used for
preparation and the type of dish.
The traces of iodine in all the dishes except for the A -101 yam dish prepared with the
shade sweet potato leaves ( B- 107) yam dish prepared with fresh okpa okuku leaves and
(YCP) yam casserole prepared with fermented oil bean seed instead of green
vegetables(1.3, 1,1 and 1.0mg) was due to the type of vegetable used for the preparation
and type of dish (casserole or pottage) (Table 4.3.3).
The traces of beta-carotene for (B- 108) and (YCP) (0.00mg) yam dishes appeared to
suggest that the components of the dishes were devoid of beta-carotene .
The highest beta-carotene value (52.0mg) for (A – 103) yam dish prepared with shade
dried okpa okuku and that prepared with fresh okpa okuku (B-107) (24.9mg) suggested
that both the fresh and the shade dried okpa okuku leaves have high beta-carotene
potentials. However, the dish (A-103) prepared with the shade dried okpa okuku leaves
has twice beta-carotene value (52.0mg) than (B-107) dish prepared with fresh okpa
okuku leaves (24.9mg).
149
Equally, the high beta – carotene (25.3 and 24.1mg) for (YCP) yam dishes prepared with
fermented oil bean seeds instead of green vegetables (A- 101) and yam dish prepared
with shade dried sweet potato leaves suggested that the use of dried sweet potato leaves
and fermented oil bean seed would be a good food based approach to improve beta-
carotene content of traditional dishes.
The low riboflavin value (less than 1 00mg) for all the dishes suggested that these dishes,
the yam and the vegetables need riboflavin supplementation to meet adequate riboflavin
requirements.
The high niacin levels (2.3, 2.2 and 3.1 mg) for (A 102) yam dish prepared with sun dried
ugu oyibo leaves (A – 104) ,yam dish prepared with shade dried and pulverized sweet
potato leaves and (B- 108) yam dish, prepared with fresh and pulverized sweet potato
leaves indicated that these dishes were better sources of niacin than others. The (B-108)
yam dish prepared with fresh and pulverized sweet potato leaves was, particularly high in
the nutrient (3.1mg).This was an indicative of its edge over other dishes prepared with
other vegetables.
The traces of ascorbate in (A – 103) yam dish prepared with shade dried okpa okuku
leaves (B-105) yam dish prepared with fresh sweet potato leaves. (B-107) yam dish
prepared with fresh okpa okuku leaves and (B-108) yam dished prepared with fresh and
pulverized sweet potato leaves showed that these vegetables were not good sources of
ascorbate in these dishes. On the other hand, the high ascorbate values for ( A-
102)(18.1mg), yam dish prepared with sun dried ugu oyibo leaves (B-106(12.4mg)), yam
dish prepared with fresh ugu oyibo indicated that regardless of form of ugu oyibo and
150
mostly the sun dried leaves, (18.1 and 12.4mg) are better sources of ascorbate as
compared with other vegetables.
On the other hand, the comparable ascorbate (4.3 and 4.4mg) as well as 2.2mg for( A –
101) yam dish prepared with shade dried sweet potato leaves and (YPP) yam pottage
prepared plain as well as (A – 104) yam dish prepared with shade dried and pulverized
sweet potato leaves and yam casserole (YCP)prepared with fermented oil bean seeds
instead of green vegetables indicated that any of the dishes could equally substitute each
other as a source of ascorbic acid (Table 4.3.4)
The traces of vitamin E in all dishes except for the dish( A – 102)(0.50mg) prepared
with sun dried ugu oyibo leaves indicated that sun dried ugu oyibo was a good source of
vitamin E (Table 4.3.4)
The high and comparable values for colour of (101) (7.50)yam dish prepared with shade
dried sweet potato leaves (105)(7.95 ) yam dish prepared with fresh sweet potato leaves (
B – 106) (7.40),yam dish prepared with fresh ugu oyibo leaves and (B – 107)(6.40), yam
dish prepared with fresh okpa okuku leaves(7.50, 7.90, 7.40 and 7.40 respectively)
indicated that the colour of these products were highly appreciated by the judges. On the
other hand, the lower values 3.4 and 2. 7 that were lower than half of the 9 point hedonic
scale (4.5), indicated that the colours were not enticing to the judges. The higher and
comparable values (7.20, 6.90 and 6.50) for (106, 108 and 104) dishes indicated that the
texture of any of the dishes were accepted by the judges.
Although, the rest of the dishes had low values, the values were more than half of the
reference scale (4.5.)
151
The higher flavour 7.6 for (106) yam dish prepared with fresh ugu oyibo leaves indicated
that the flavour of this dish was much more appealing to the judges as compared with
other dishes
The higher and comparable acceptability (7.5) for yam dish prepared with fresh sweet
potato leaves (105) and dish prepared with fresh okpa okuku (107) ( 7.3) indicated that
any of these two dishes were acceptable to the judges.
When all the attributes were summed up, the value for the ( 106) (28.9) yam dish
prepared with fresh ugu oyibo leaves was higher than those of the other dishes followed
by(105) (27.10), the yam dish prepared with fresh sweet potato leaves)(Table 4.4.1)
5.5 CONCLUSION
The Igbo-ukwu households were able to identify many wild and cultivated edible green
leafy vegetables. They were knowledgeable on how to harvest, process, and prepare
these vegetables for various traditional dishes.
They learned about these vegetables mostly and directly from their parents and
grandmothers .Surprisingly, the knowledge about these vegetables is now on the verge of
extinction. This is because, many children and young mothers do not live together with
their parents and grandparents as before to allow for handing over the knowledge about
production and utilization of these vegetables in Igbo-ukwu. This poor knowledge of
importance of vegetables in our diets is one of the major causes of micronutrients
deficiency. The deficiency is currently taking tolls mostly among children, young adults
and women of child bearing age in Igbo -ukwu community
152
Sun and shade drying improved nutrient potentials of these vegetables, especially protein,
ash, fibre and carbohydrate, iron ,zinc , copper ,iodine , calcium and selenium.
Sun and shade drying increased phytate, oxalate, tannins and saponins content of these
vegetables due to loss of moisture. Beta –carotene, riboflavin, niacin, ascorbic acid and
vitamin E were higher in some of the fresh vegetables as well as in the sun and the shade
dried samples.
Yam dishes based on these vegetables as well as fermented oil bean seeds regardless of
treatments increased protein , ash and fibre content of the dishes.There were traces of ant-
nutrients and food toxicants content of the dishes except for the yam dish prepared with
sun dried ugu oyibo leaves. The dishes prepared with fresh sweet potato leaves had high
iron, zinc and calcium .
Shade dried sweet potato leaves, sun dried ugu oyibo, yam casserole prepared with
fermented oil bean seed, exceptionally increased calcium. Selenium and iodine were
low in the dishes except for the sun dried ugu oyibo and shade dried sweet potato leaves.
All the dishes had traces of Vitamin E except the dish prepared with shade dried sweet
potato leaves.
Beta –carotene was much higher in the dishes prepared with shade dried okpa okuku.
Yam casserole based on fermented oil bean seeds increased beta-carotene. Riboflavin
was less than 1.00mg in all the dishes . Niacin was low in all the dishes except for yam
dish prepared with fresh sweet potato leaves, yam dish prepared with sun dried ugu oyibo
as well as dish prepared with shade dried and pulverized sweet potato leaves .
The dishes prepared with both the fresh and the sun dried ugu oyibo had the highest
ascorbate. The dishes prepared with fresh sweet potato leaves and that prepared with

153
fresh ugu oyibo leaves had the highest organoleptic attributes as judged by the results of
judges selected from outside Igboukwu community
154
RECOMMENDATIONS.
1. Further research is imperative beyond Igbo-ukwu community to investigate many
more wild and cultivated vegetables whose nutrient potentials were ignored due to
poor nutrition education.
2. Other traditional dishes need to be produced with these vegetables to diversify
their food use
3. These vegetables need the technology to produce them in pulverized form to
supplement complementary foods. This is because children generally do not
consume whole fresh, sun and shade dried vegetables as adults without
persuasion.
155
REFERENCES
Ajakaiye, C. O.; Bako, S.P and Abun, J.B (1995). Concentration of macro and
micronutrient in the leaves of cabbage and lettuce in relation to age. Nigeria J. Bot. 8: 77-82.
Alelor, M.V.A & Adeogun, O.A (1995). Some tropical leafy vegetables, Fd. Chem. 53:
3775-329 Anyika, J.U (2002). Micromineral composition of some green leafy vegetables eaten
in south eastern Nigeria. Proceedings of the 26th Annual Conference of Nigeria Institute of Food Science and Technology, p30-31
AOAC (1995). Official methods of analysis Association of Official Chemists (15th
Ed.) Association of Analytical Chemists, Washington, D.C., USA. Audu, A.; Igwe, E.C and Ijomah, T.U. (2000). The nutrient composition of “draw”
leafy vegetables of Adamawa, Nigeria, Global of Pure Applied Science, 6.3, 547-15 Ref.
Barker, D.J.P. (1993). Type 2 (non-insulin dependent) diabetes mellitus, hypertension
and hyperlipidaemia syndrome X: Relation to reduced foetal growth. Diabetologia, 36:62 – 67
Barker, D.J.P. (1989). Weight in infancy and death from ischaemic heart disease.
Lancet. 2:577 – 580. Bender, D.A (2002). Introduction to Human Nutrition edited by Michael .J. Gilney,
Hester H. Vorster and Franc .J. KOK. Blackwell Publishing London. Coursey, D.G. (1968). The edible avoids world crops. 20-4: 25-30. Coursey, D.G. (1976). “The origins and domestication of yams in Africa”, in Havlan, J.R,
Wet de J. & Stember, A.B. (eds.), Origins of African plant domestication, p.383 -408. The Hague, Mouton
Coursey, D.G (1967). Yams. London, Longmans. de Onis M. Blossner, M.; Villar, J. (1996). Levels and patterns of intrauterine growth
retardation in developing countries. Eur J Clin Nutr, 52 (Supp.1):S5 – S15
Drewnowski, A.; Popkin, B. M (1997). The nutrition transition: new trends in the
global diet. Nutr. Rev, 55: 31-43
156
Dupriez, H. and Leener, P.D (1992). African garden and orchards growing vegetables and fruits. The Macmillan Press Ltd., London.
Eboh, L (2000). Basic food processing and preservation techniques. Education Media
Centre, Egerton University, Kenya. Eka, O.U and Osagie, A.U (1998). Nutritional quality of plant, Pubay Post Harvest
Research Unit, Department of Biochemistry, University of Benin, Benin City, Nigeria.
Enwere, N.J (1998). Foods of plant origin. Afro-Orbis Publications, Nsukka. Fafunso, M. and Bassir O. (1977) Variations in the loss of vitamins in leafy vegetables
with various methods of food preparation. Fd. Chem. 2: 51-55. FAO (1988). Food and Agricultyure Organization of the United Nation, Traditional
plants, 42. FAO/WHO (1973). Energy and protein requirement of a joint FAO/WHO Ad-Hoc
expert committee. WHO Tech. Reports Series, 522: 1-118 Ferroluzzi, A.; Martino, L. (1996). Obesity and physical activity. Ciba Foundation
Symposium, 201: 207-221 Godson Osuji (ed.). Advances in yam research the biochemistry and technology of
the yam tuber, Biochemical Society of Nigeria in collaboration with Anambra State University of Technology.
Huxley, Lean, Crozier, John and Neil (2004). Mineral processing for healthy
traditional foods, pg.1. Ihekoronye, A.I and Ngoddy, P.O (1985). Integrated food science and technology for
tropics, Macmillan Publishers Ltd, Hong Kong. IITA (2004). Nigerian food consumption and nutrition survey 2001 – 2003.
International Institute for Tropical Agriculture. Johnson, N.E; Nitzke, S. and Vande Berg, D.L (1974). A reporting system for Nutrient
Academy, Home Econ. Res. J. 2:211 Krause, M.V. and Mahan, L.K (1979). Food nutrition and diet therapy, (6th Ed), W.B
Saunders Company, Philadelphia. Ladan, M.J.; Bilbis, L.S and Lawal, M. (1996). Nutritive composition of some green
leafy vegetables consumed in Sokoto. Nig J. Basic Appl. Sci. 5: 39-44.
157
LARC (2003). Handbook on fruit and vegetables consumption and cancer prevention, Geneva, WHO.
Latta, M.C and Eskin, M (1980). A simple colometric method for phytate
determination. J. Agr. Fd. Chem. 28:1513 Mc-Williams, (1979). Food fundamentals: vegetables, (3rd Ed) John Willey &
Sons, New York. Munro, A. and Bassir, I.O. (1969). Oxalate in Nigerian vegetables, W. Afr. J. Biol.
Appl. Chem. 12:14 Nahar, N.; Mosihuzzaman, M. and Dey S.K. (1992). Analysis of free sugar dietary
fibre of some vegetables of Bangladesh J. Fd. Chem. 46: 397-400. National Primary Health Care Development Agency (NPHDA) (2004), Operational
training manual and guidelines for the development of primary health care system in Nigeria, NPHDA, Abuja.
NDHS (1990). Nigerian Demographic and Health Survey, UNICEF Publication Series,
25:60 Nnanyelugo, D.O (1980). The nutritional status of children in Anambra state,
Monograph prepared for University of Nigeria Senate Research Grant: 00141/76, p.1
Nweke, F.I (1981). “Consumption patterns and their implications for research and
production in tropical Africa”, in Terry, E.R, Oduro, K.A & Caveness, F. (eds.), Tropical root crops: research strategies for the 1980s. Tri Root Crops Sym. I, 8-12 Sept 1980, Proc. Int. Soc Trop. Root Crops, Africa Branch, Ibadan, Nigeria. P. 88-94. Ottawa, IDRC (IDRC-163e)
Obizoba, I. C (1998). “Fermented foods”, in Osagie A.U. And Eka O. U. (eds.),
Nutritional quality of plant foods, Nigeria 160-198 Oguntona, T. (1998). “Green leafy vegetables,” in Osagie, A.U and Eka, O.U. (eds.),
Nutritional quality of plant foods, Nigeria 120-133. Oguntona, T. and Oguntona, C.R.B (1986). Proximate composition of three leafy
vegetables commonly consumed in north-eastern Nigeria. Paper presented at the 1st national workshop of food composition, 1-5 April 1986, University of Ibadan, Nigeria.
Oguntona, T.; Oguntona, C.R.B and Williams, I, (1989). Survey of food and nutrient
intake of Kanuri of Borno, Nigeria. Savanna 10(2): 86-91.
158
Okaka, J.C.; Akobundu, E.N.T.; Okaka, A.N.C. (1992). Human nutrition: An integrated approach, Enugu, ESUT
Okigbo, B.N. (1978). Cropping systems and related research in Africa. AAASA
Occasional Publ. Ser OT-1 81pp Okoli E.C.; Nmorka, O.O. and Unaegbu (1988). Blanching and storage of some Nigeria
vegetables. Int. J. Fd. Sci. Tech. 23: 639-641 Onwueme, I.C (1976). Influence of the weight of the planted tuber on the vegetative
performance of white yam (Dioscorea rotundata pair) plants, Niger. Agric Science Club J. 81: 375-379.
Onwueme, I.C (1978). The tropical tuber crops: yam, cassava, sweet potato and
cocoyam, Chichester, W.K, Wiley, p.234 Onwuka, G.I.; Nwabara, C.C.; Nwokedi, P.M.; Echendu, C.A.; Asumugha, V. U. and
Igboekwe, M.U (2002). Comparative studies of the efficacy of sun-drying, solar dryer and hot air oven in the preservation of tomatoes, okra, pepper and onions. Nig, Fd. J. 20:10-4
Onyezili, F. N; Alo, I. S and Tirnorgah, A (2005). “Micronutrient deficiency control and
child survival in Nigeria,” in Akinyele, I.D and Onimawo, I, Proceeding of 34th annual conference and scientific meeting of Nutrition Society of Nigeria.
Pacey, A. (1980). Gardening for better nutrition. The Russel Press Ltd., Nottingham. Rogis, J.F. (1997). Drying foodstuffs. Backhugs Publishers, Leiden Smith, L.C and Haddad, I. (2002). Overcoming child malnutrition in developing
countries: past achievement and future choices. Sobande, O.A. (2005). Chemical analysis of cocoyam leaves and plantain male bud.
Proceedings of the 29th Annual conference of Nigeria Institutes of Food Science and Technology, pp 125-126.
Sobulor. A (1972). Studies on white yam (Dioscoria rotundata) growth analysis, expl.
Agric, 8, 99-106. Solanke, O.E and Awonorin, S.O. (2002). Kinetic of vitamin c degradation in some
tropical green leafy vegetables during blanching. nig. ed j. 20:24-32 Suberu, H.A and Shinkafi, S.A (2004). Microbial evaluation of ‘zogala’, a locally
prepared salad with leaves of moringa oleifera lam, in Sokoto, Nigeria, Nig. J. Nutr. Sci. 25: 29-32
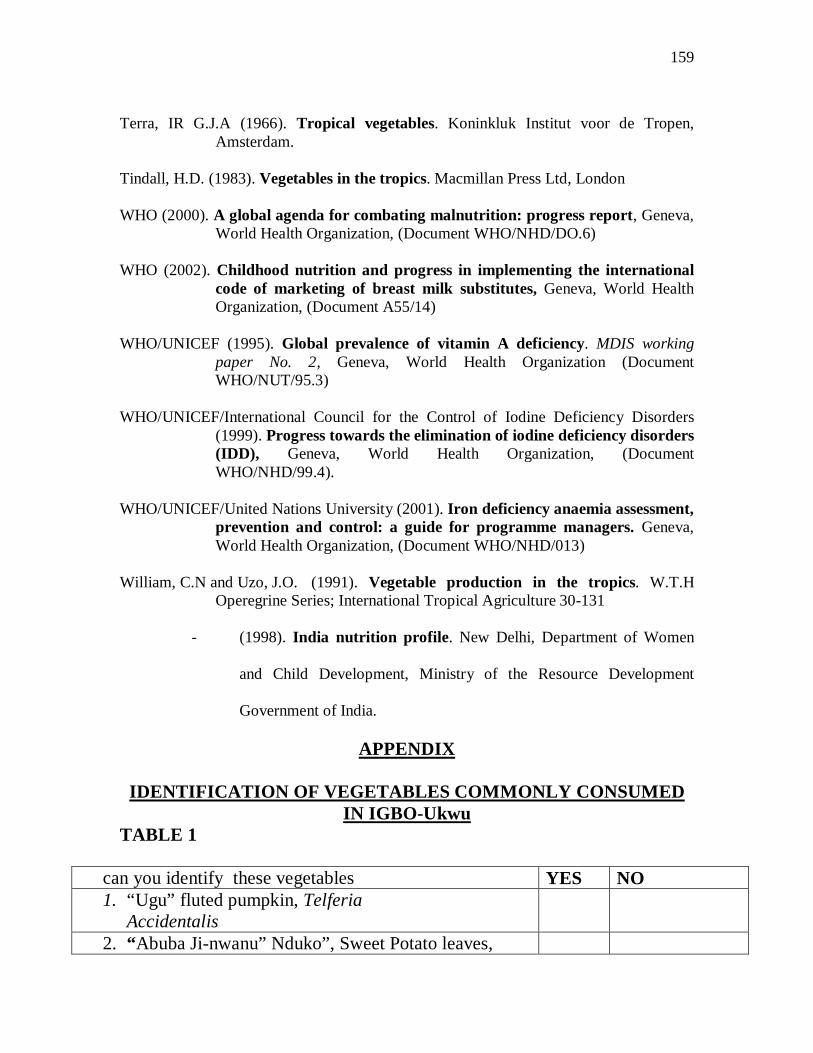
159
Terra, IR G.J.A (1966). Tropical vegetables. Koninkluk Institut voor de Tropen,
Amsterdam. Tindall, H.D. (1983). Vegetables in the tropics. Macmillan Press Ltd, London WHO (2000). A global agenda for combating malnutrition: progress report, Geneva,
World Health Organization, (Document WHO/NHD/DO.6) WHO (2002). Childhood nutrition and progress in implementing the international
code of marketing of breast milk substitutes, Geneva, World Health Organization, (Document A55/14)
WHO/UNICEF (1995). Global prevalence of vitamin A deficiency. MDIS working
paper No. 2, Geneva, World Health Organization (Document WHO/NUT/95.3)
WHO/UNICEF/International Council for the Control of Iodine Deficiency Disorders
(1999). Progress towards the elimination of iodine deficiency disorders (IDD), Geneva, World Health Organization, (Document WHO/NHD/99.4).
WHO/UNICEF/United Nations University (2001). Iron deficiency anaemia assessment,
prevention and control: a guide for programme managers. Geneva, World Health Organization, (Document WHO/NHD/013)
William, C.N and Uzo, J.O. (1991). Vegetable production in the tropics. W.T.H
Operegrine Series; International Tropical Agriculture 30-131
- (1998). India nutrition profile. New Delhi, Department of Women
and Child Development, Ministry of the Resource Development
Government of India.
APPENDIX
IDENTIFICATION OF VEGETABLES COMMONLY CONSUMED IN IGBO-Ukwu
TABLE 1
can you identify these vegetables YES NO 1. “Ugu” fluted pumpkin, Telferia
Accidentalis
2. “Abuba Ji-nwanu” Nduko”, Sweet Potato leaves,
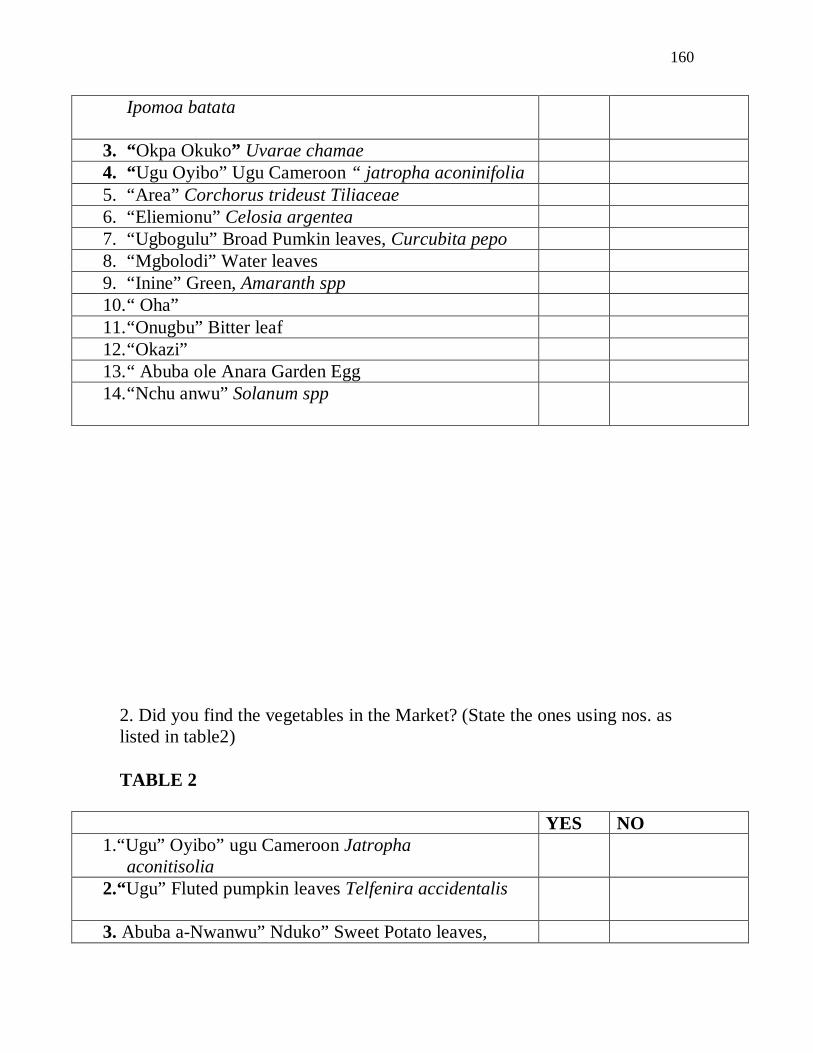
160
Ipomoa batata 3. “Okpa Okuko” Uvarae chamae 4. “Ugu Oyibo” Ugu Cameroon “ jatropha aconinifolia 5. “Area” Corchorus trideust Tiliaceae 6. “Eliemionu” Celosia argentea 7. “Ugbogulu” Broad Pumkin leaves, Curcubita pepo 8. “Mgbolodi” Water leaves 9. “Inine” Green, Amaranth spp 10. “ Oha” 11. “Onugbu” Bitter leaf 12. “Okazi” 13. “ Abuba ole Anara Garden Egg 14. “Nchu anwu” Solanum spp
2. Did you find the vegetables in the Market? (State the ones using nos. as listed in table2) TABLE 2
YES NO 1.“Ugu” Oyibo” ugu Cameroon Jatropha
aconitisolia
2.“Ugu” Fluted pumpkin leaves Telfenira accidentalis
3. Abuba a-Nwanwu” Nduko” Sweet Potato leaves,
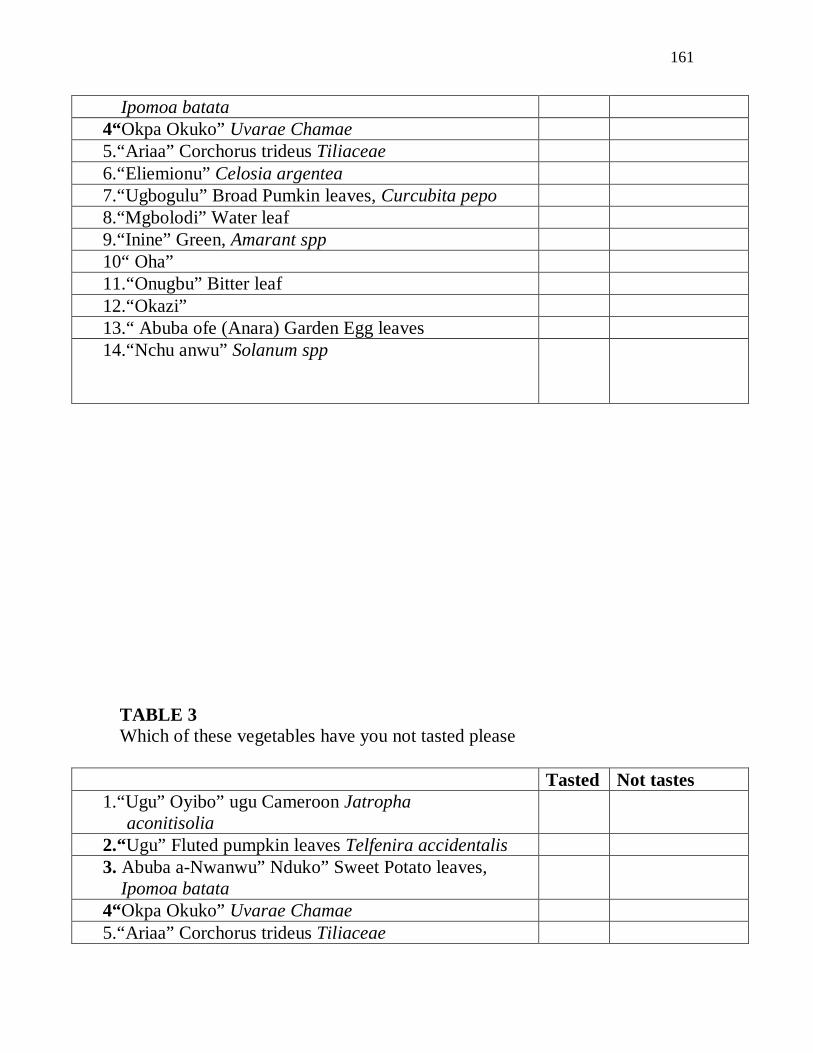
161
Ipomoa batata 4“Okpa Okuko” Uvarae Chamae 5.“Ariaa” Corchorus trideus Tiliaceae 6.“Eliemionu” Celosia argentea 7.“Ugbogulu” Broad Pumkin leaves, Curcubita pepo 8.“Mgbolodi” Water leaf 9.“Inine” Green, Amarant spp 10“ Oha” 11.“Onugbu” Bitter leaf 12.“Okazi” 13.“ Abuba ofe (Anara) Garden Egg leaves 14.“Nchu anwu” Solanum spp
TABLE 3 Which of these vegetables have you not tasted please
Tasted Not tastes 1.“Ugu” Oyibo” ugu Cameroon Jatropha
aconitisolia
2.“Ugu” Fluted pumpkin leaves Telfenira accidentalis 3. Abuba a-Nwanwu” Nduko” Sweet Potato leaves,
Ipomoa batata
4“Okpa Okuko” Uvarae Chamae 5.“Ariaa” Corchorus trideus Tiliaceae
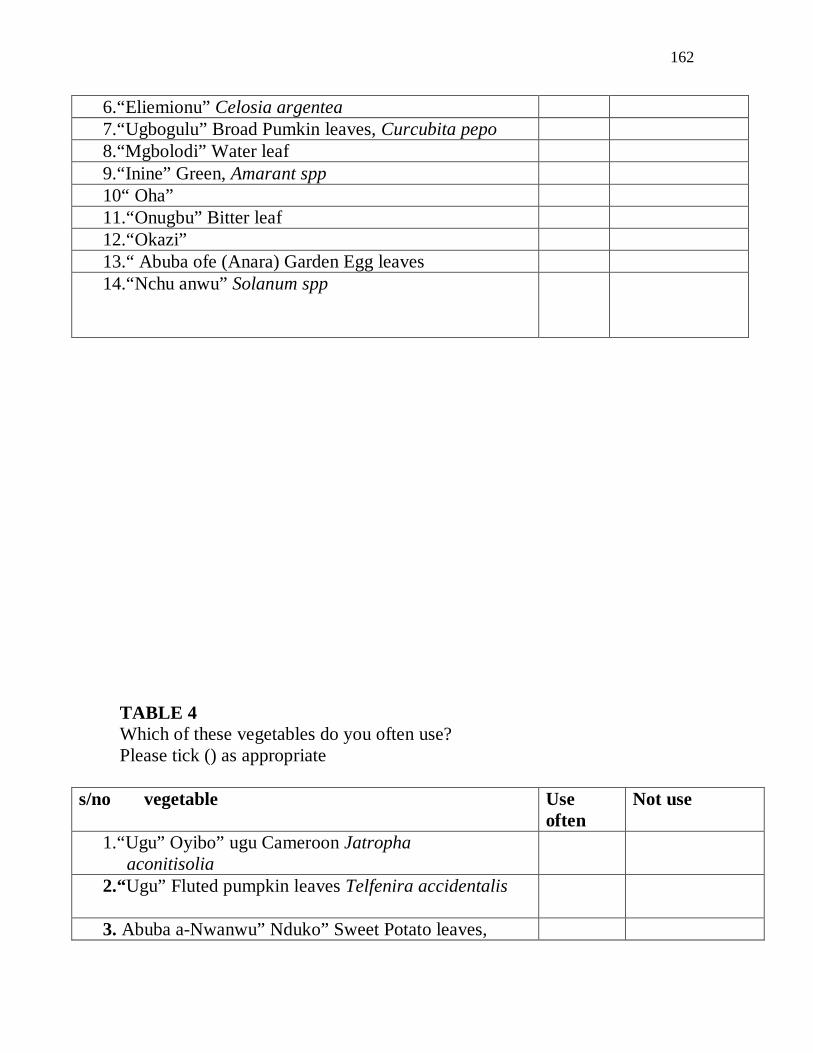
162
6.“Eliemionu” Celosia argentea 7.“Ugbogulu” Broad Pumkin leaves, Curcubita pepo 8.“Mgbolodi” Water leaf 9.“Inine” Green, Amarant spp 10“ Oha” 11.“Onugbu” Bitter leaf 12.“Okazi” 13.“ Abuba ofe (Anara) Garden Egg leaves 14.“Nchu anwu” Solanum spp
TABLE 4 Which of these vegetables do you often use? Please tick () as appropriate
s/no vegetable Use
often Not use
1.“Ugu” Oyibo” ugu Cameroon Jatropha aconitisolia
2.“Ugu” Fluted pumpkin leaves Telfenira accidentalis
3. Abuba a-Nwanwu” Nduko” Sweet Potato leaves,
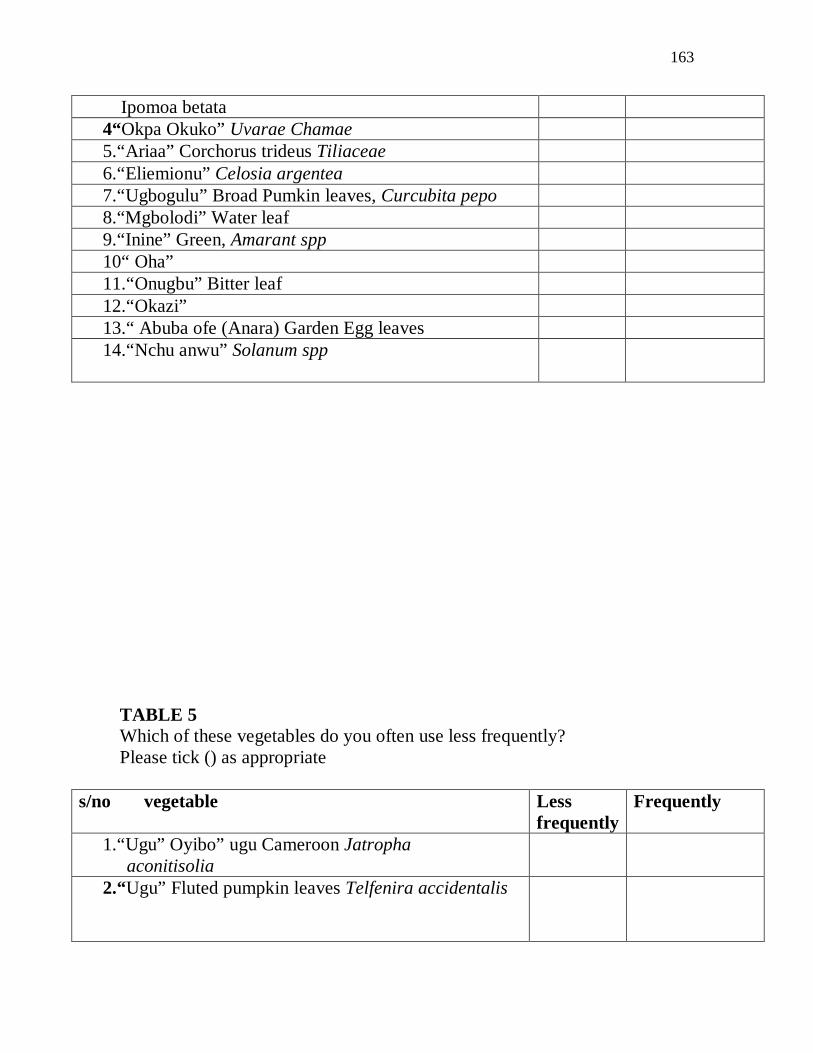
163
Ipomoa betata 4“Okpa Okuko” Uvarae Chamae 5.“Ariaa” Corchorus trideus Tiliaceae 6.“Eliemionu” Celosia argentea 7.“Ugbogulu” Broad Pumkin leaves, Curcubita pepo 8.“Mgbolodi” Water leaf 9.“Inine” Green, Amarant spp 10“ Oha” 11.“Onugbu” Bitter leaf 12.“Okazi” 13.“ Abuba ofe (Anara) Garden Egg leaves 14.“Nchu anwu” Solanum spp
TABLE 5 Which of these vegetables do you often use less frequently? Please tick () as appropriate
s/no vegetable Less
frequently Frequently
1.“Ugu” Oyibo” ugu Cameroon Jatropha aconitisolia
2.“Ugu” Fluted pumpkin leaves Telfenira accidentalis
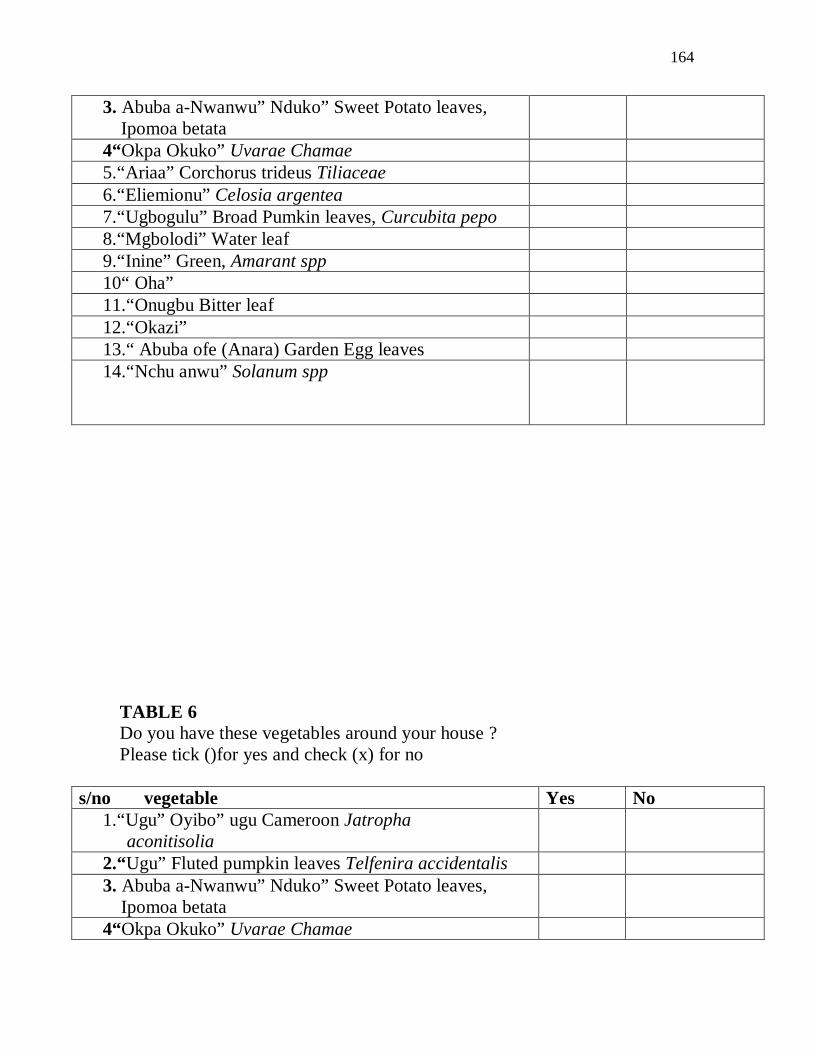
164
3. Abuba a-Nwanwu” Nduko” Sweet Potato leaves, Ipomoa betata
4“Okpa Okuko” Uvarae Chamae 5.“Ariaa” Corchorus trideus Tiliaceae 6.“Eliemionu” Celosia argentea 7.“Ugbogulu” Broad Pumkin leaves, Curcubita pepo 8.“Mgbolodi” Water leaf 9.“Inine” Green, Amarant spp 10“ Oha” 11.“Onugbu Bitter leaf 12.“Okazi” 13.“ Abuba ofe (Anara) Garden Egg leaves 14.“Nchu anwu” Solanum spp
TABLE 6 Do you have these vegetables around your house ? Please tick ()for yes and check (x) for no
s/no vegetable Yes No
1.“Ugu” Oyibo” ugu Cameroon Jatropha aconitisolia
2.“Ugu” Fluted pumpkin leaves Telfenira accidentalis 3. Abuba a-Nwanwu” Nduko” Sweet Potato leaves,
Ipomoa betata
4“Okpa Okuko” Uvarae Chamae

165
5.“Ariaa” Corchorustrident 6.“Eliemionu” Corchorus trideus Tiliaceae 7.“Ugbogulu” Broad Pumkin leaves, curcubita pepo 8.“Mgbolodi” Water leaf 9.“Inine” Green, Amarant spp 10“ Oha” 11.“Onugbu” Bitter leaf 12.“Okazi” 13.“ Abuba ofe (Anara) Garden Egg leaves 14.“Nchu anwu” Solanum spp
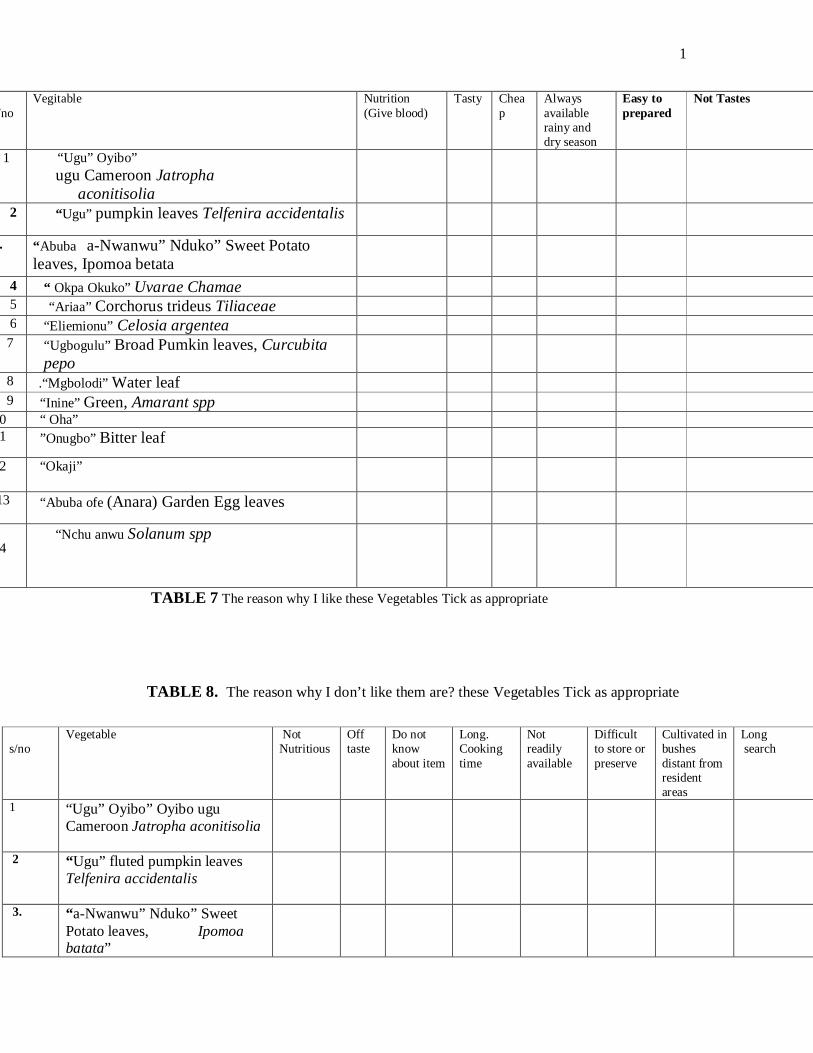
1
TABLE 7 The reason why I like these Vegetables Tick as appropriate TABLE 8. The reason why I don’t like them are? these Vegetables Tick as appropriate
s/no
Vegitable Nutrition (Give blood)
Tasty Cheap
Always available rainy and dry season
Easy to prepared
Not Tastes
1 “Ugu” Oyibo” ugu Cameroon Jatropha
aconitisolia
2 “Ugu” pumpkin leaves Telfenira accidentalis
3. “Abuba a-Nwanwu” Nduko” Sweet Potato leaves, Ipomoa betata
4 “ Okpa Okuko” Uvarae Chamae 5 “Ariaa” Corchorus trideus Tiliaceae 6 “Eliemionu” Celosia argentea 7 “Ugbogulu” Broad Pumkin leaves, Curcubita
pepo
8 .“Mgbolodi” Water leaf 9 “Inine” Green, Amarant spp 10 “ Oha” 11 ”Onugbo” Bitter leaf
12 “Okaji”
13 “Abuba ofe (Anara) Garden Egg leaves
14
“Nchu anwu Solanum spp
s/no
Vegetable Not Nutritious
Off taste
Do not know about item
Long. Cooking time
Not readily available
Difficult to store or preserve
Cultivated in bushes distant from resident areas
Long search
1
“Ugu” Oyibo” Oyibo ugu Cameroon Jatropha aconitisolia
2 “Ugu” fluted pumpkin leaves Telfenira accidentalis
3.
“a-Nwanwu” Nduko” Sweet Potato leaves, Ipomoa batata”
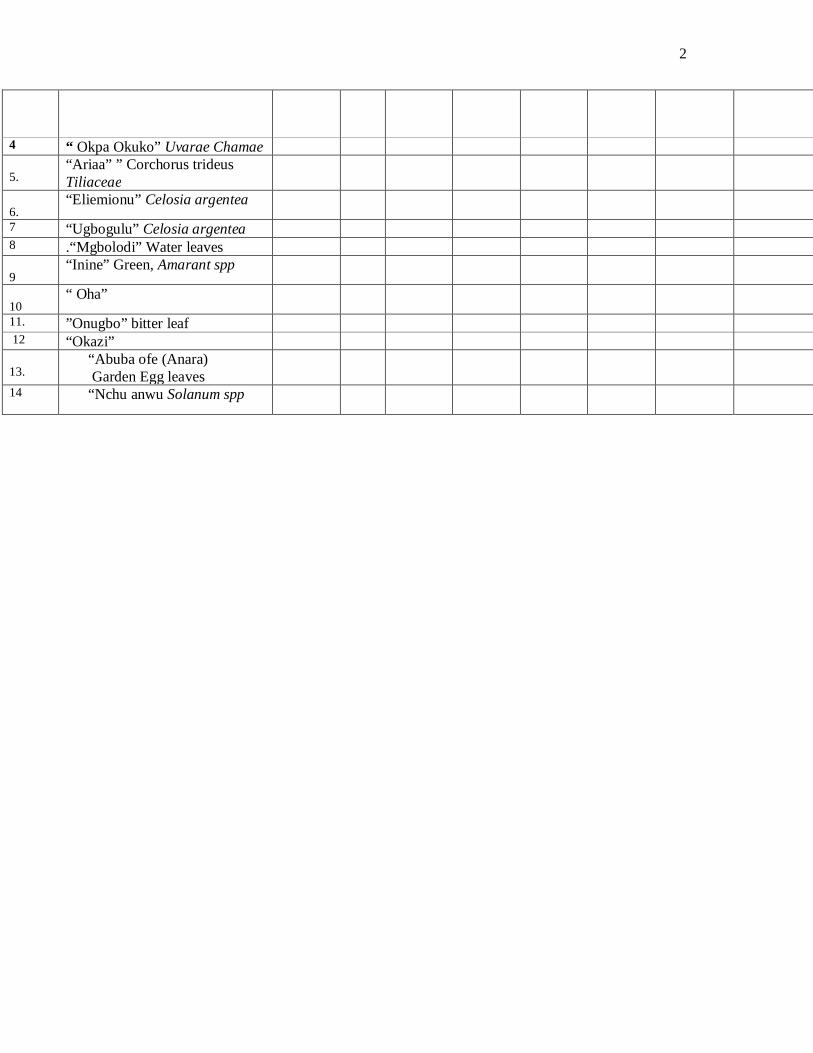
2
4 “ Okpa Okuko” Uvarae Chamae 5.
“Ariaa” ” Corchorus trideus Tiliaceae
6.
“Eliemionu” Celosia argentea
7 “Ugbogulu” Celosia argentea 8 .“Mgbolodi” Water leaves 9
“Inine” Green, Amarant spp
10
“ Oha”
11. ”Onugbo” bitter leaf 12 “Okazi” 13.
“Abuba ofe (Anara) Garden Egg leaves
14
“Nchu anwu Solanum spp

3
APPENDIX