Embed Size (px)
Citation preview
By: Jeana Mascio
The PointWant to be more accurate with estimating
rainfall amounts from Z/R relationships
The PointWant to be more accurate with estimating
rainfall amounts from Z/R relationships
Drop Size Distribution (DSD) variations in storms causes most inaccuracies
The PointWant to be more accurate with estimating
rainfall amounts from Z/R relationships
Drop Size Distribution (DSD) variations in storms causes most inaccuracies
Use meteorological parameters that may infer DSD
The PointWant to be more accurate with estimating
rainfall amounts from Z/R relationships
Drop Size Distribution (DSD) variations in storms causes most inaccuracies
Use meteorological parameters that may infer DSD
Determine if these parameters can explain the discrepancies from Z/R relationship
The PointWant to be more accurate with estimating
rainfall amounts from Z/R relationships
Drop Size Distribution (DSD) variations in storms causes most inaccuracies
Use meteorological parameters that may infer DSD
Determine if these parameters can explain the discrepancies from Z/R relationship
If results are found, could change the relationship
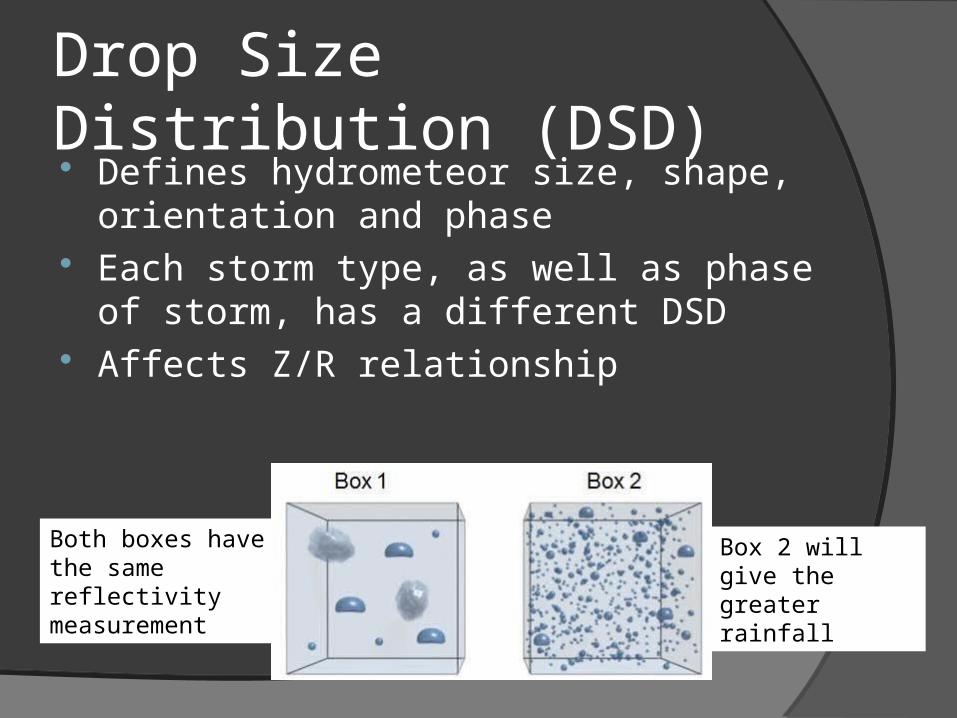
Drop Size Distribution (DSD) Defines hydrometeor size, shape,
orientation and phase Each storm type, as well as phase of
storm, has a different DSD Affects Z/R relationship
Box 2 will give the greater rainfall
Both boxes have the same reflectivity measurement
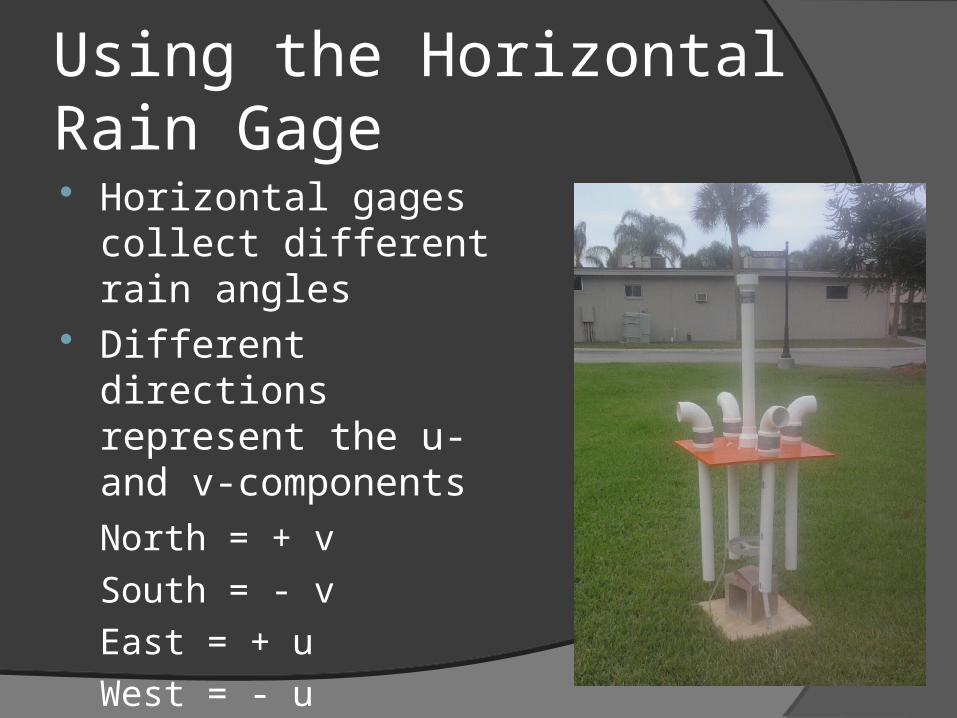
Using the Horizontal Rain Gage Horizontal gages
collect different rain angles
Different directions represent the u- and v-components
North = + v
South = - v
East = + u
West = - u
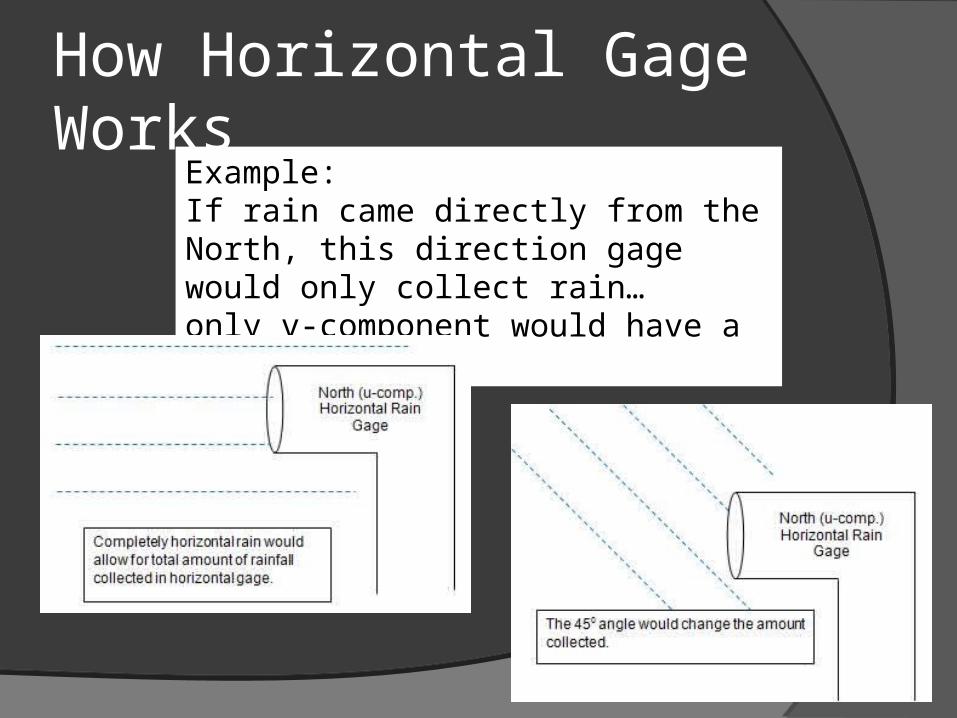
How Horizontal Gage Works
Example: If rain came directly from the North, this direction gage would only collect rain…only v-component would have a value.
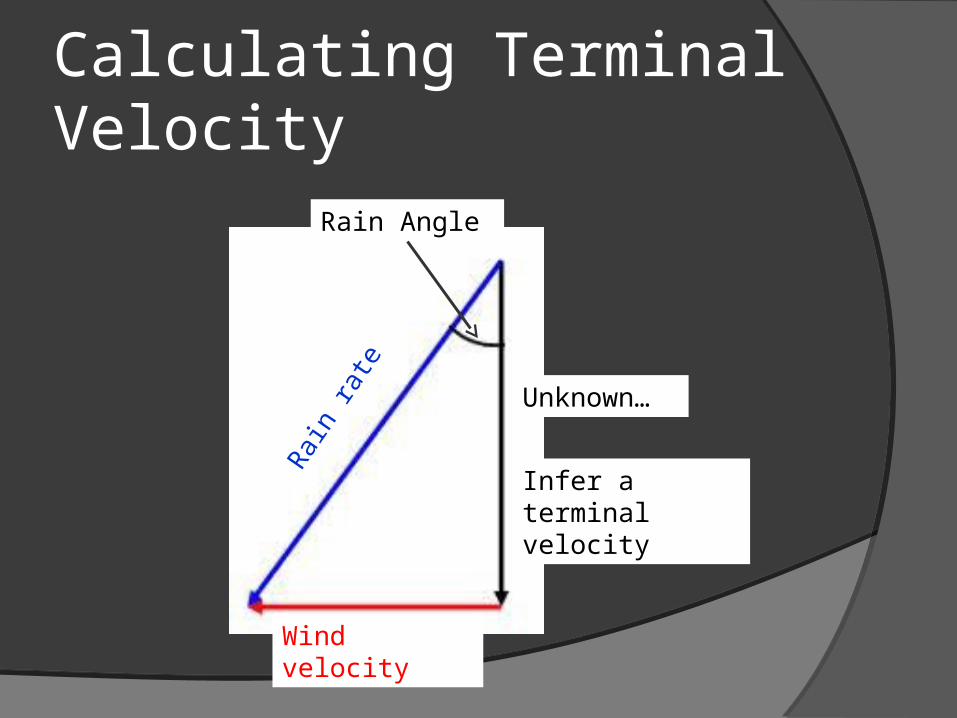
Calculating Terminal Velocity
Wind velocity
Rai
n ra
te Unknown…
Infer a terminal velocity
Rain Angle
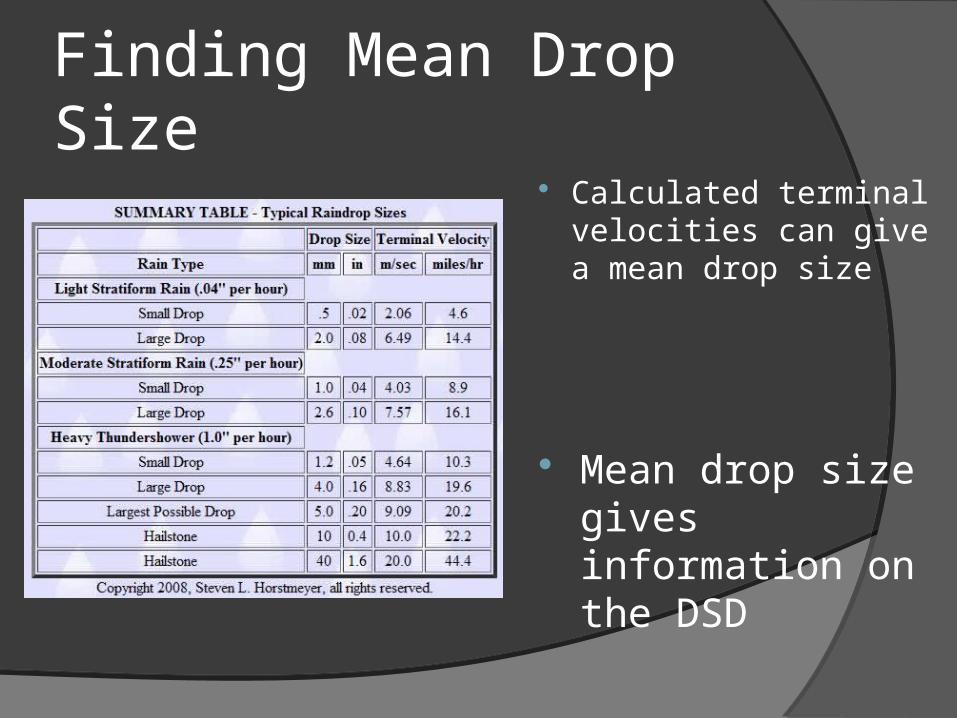
Finding Mean Drop Size
Calculated terminal velocities can give a mean drop size
Mean drop size gives information on the DSD
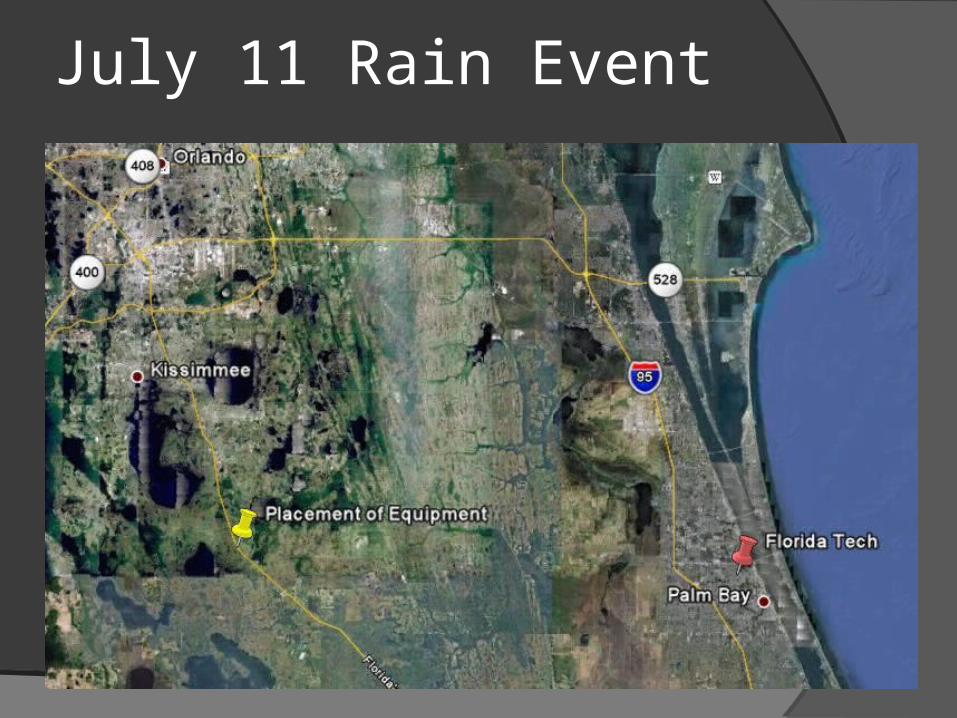
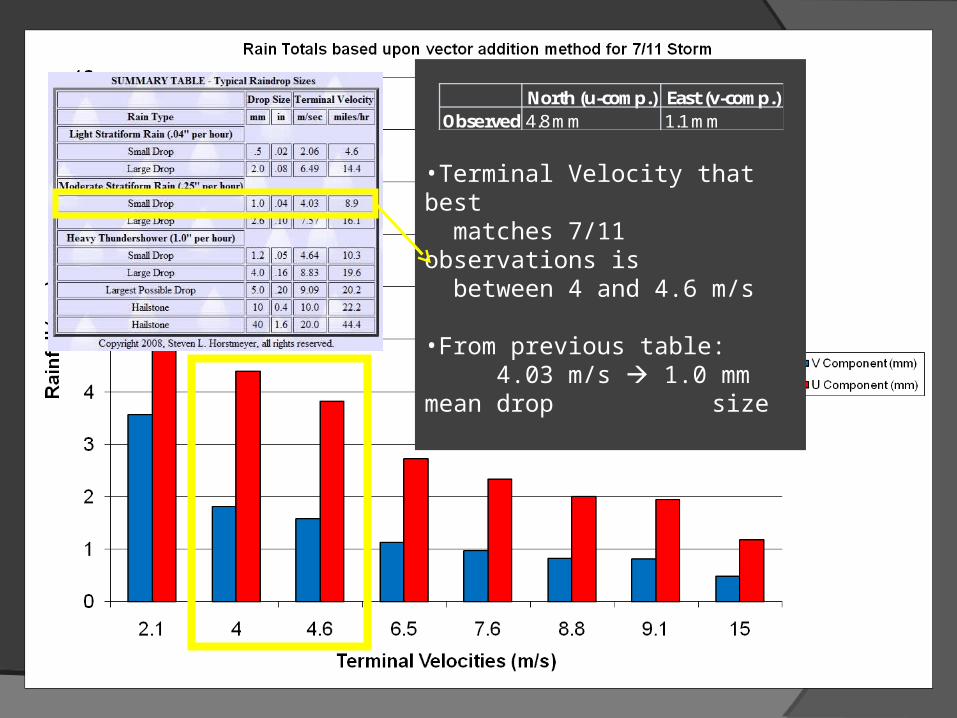
July 11 Rain Event
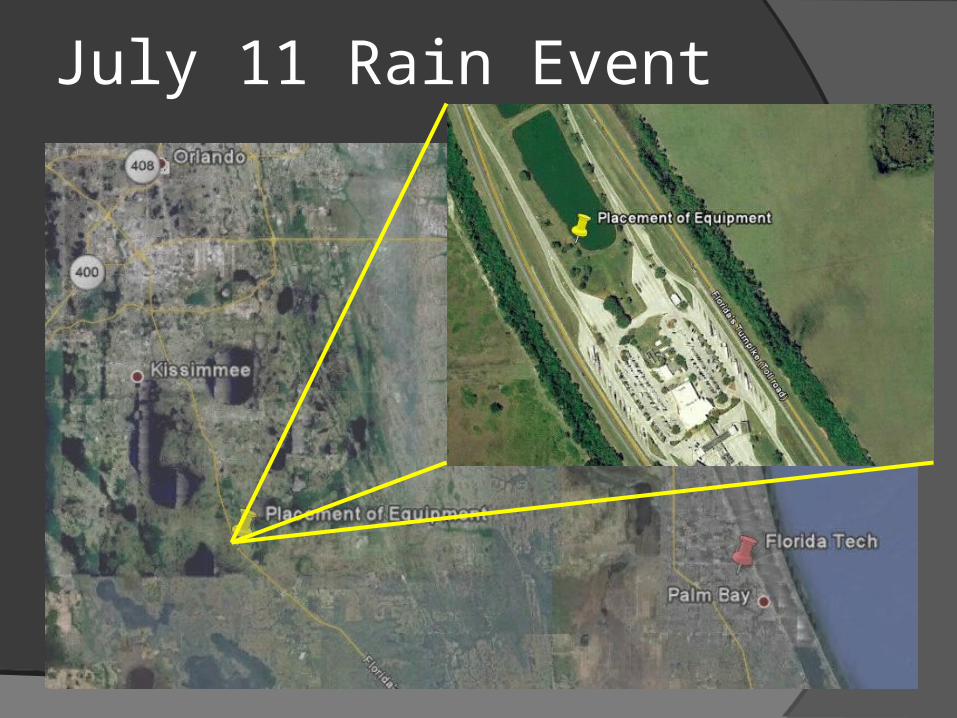
July 11 Rain Event
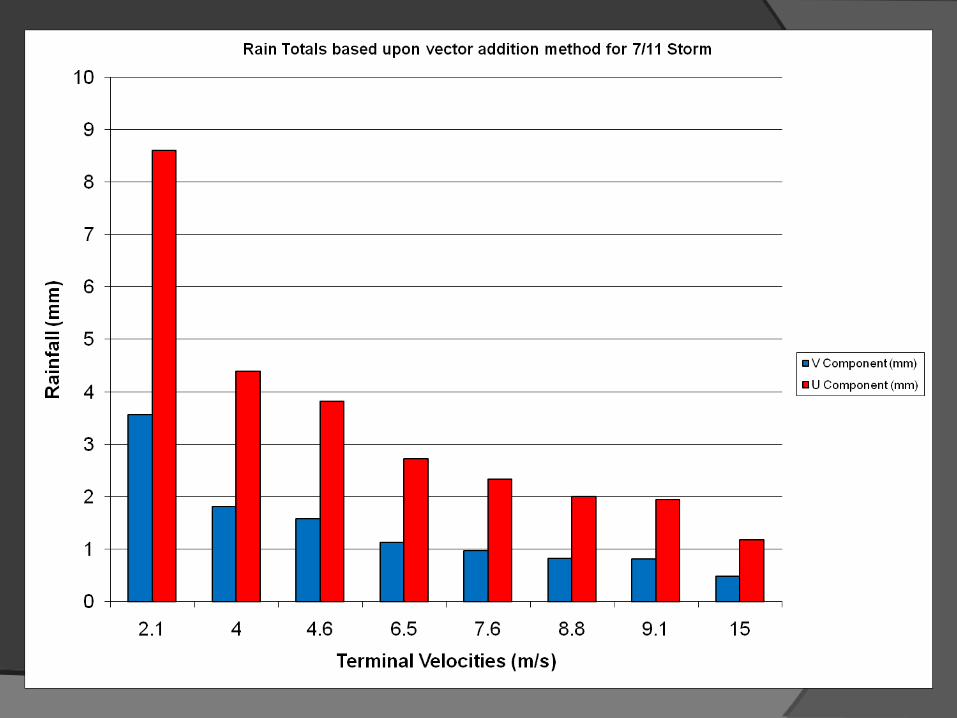
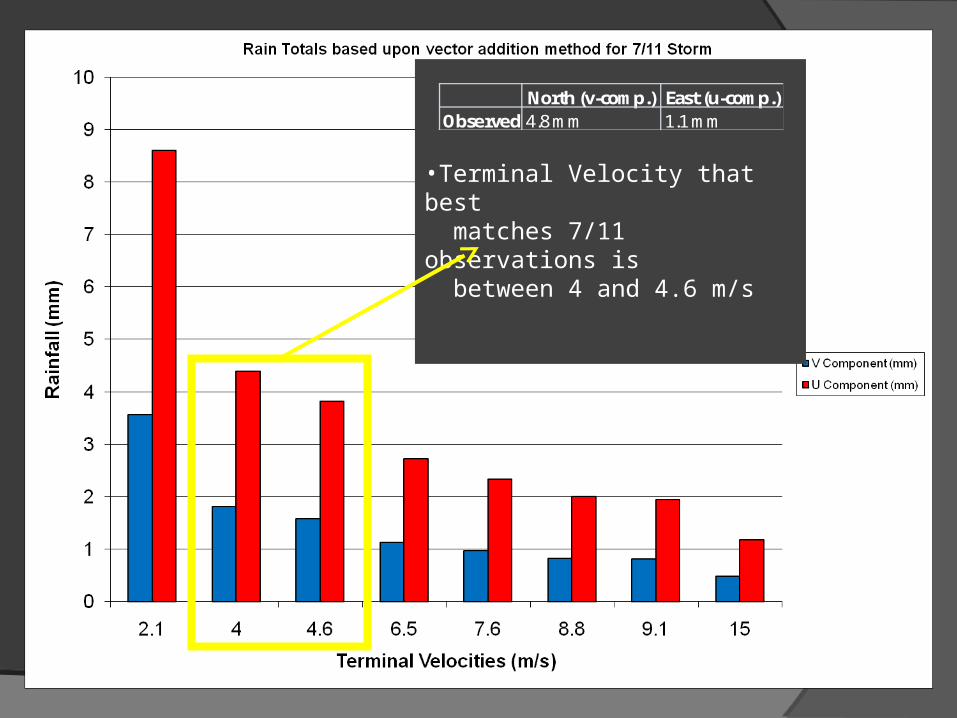
•Terminal Velocity that best matches 7/11 observations is between 4 and 4.6 m/s
North (v-comp.) East (u-comp.)Observed 4.8 mm 1.1 mm
•Terminal Velocity that best matches 7/11 observations is between 4 and 4.6 m/s
•From previous table: 4.03 m/s 1.0 mm mean drop
size
North (u-comp.) East (v-comp.)Observed 4.8 mm 1.1 mm
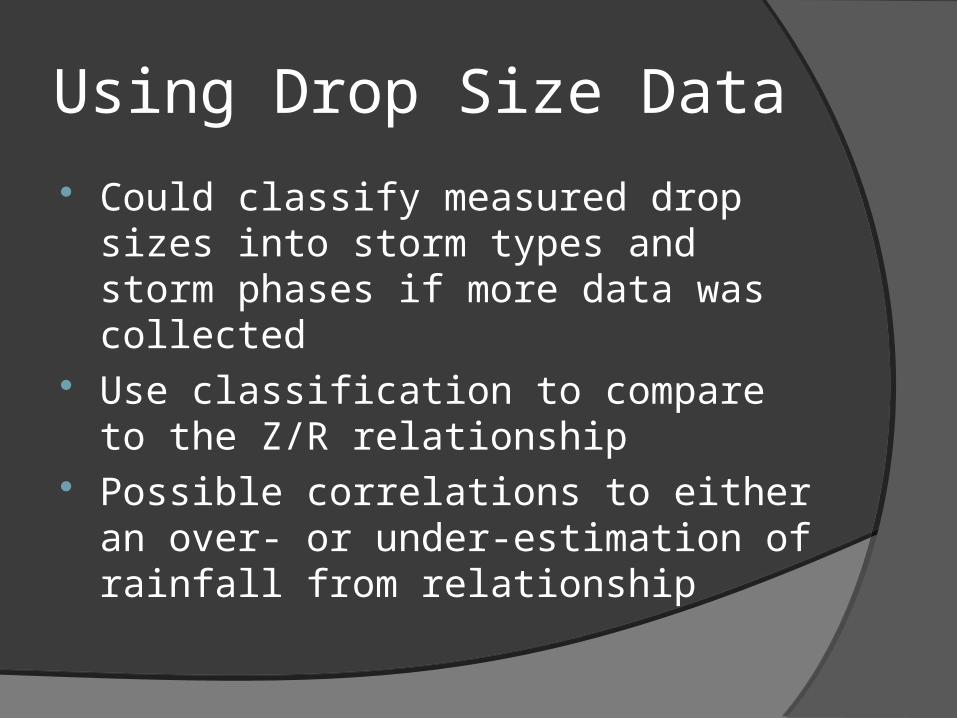
Using Drop Size Data
Could classify measured drop sizes into storm types and storm phases if more data was collected
Use classification to compare to the Z/R relationship
Possible correlations to either an over- or under-estimation of rainfall from relationship
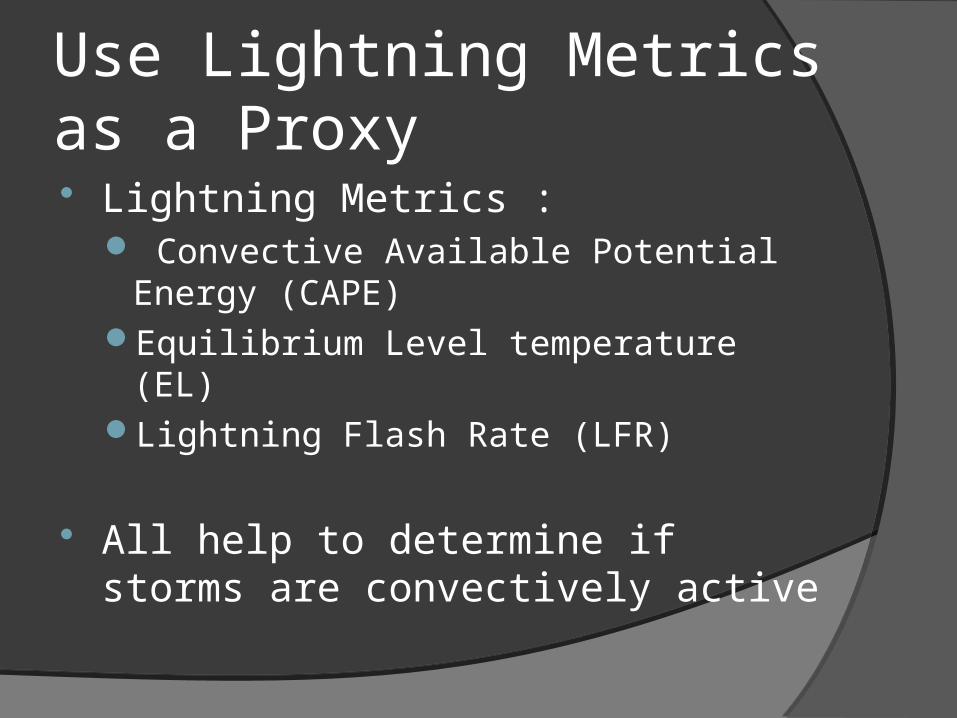
Use Lightning Metrics as a Proxy Lightning Metrics :
Convective Available Potential Energy (CAPE)
Equilibrium Level temperature (EL)Lightning Flash Rate (LFR)
All help to determine if storms are convectively active
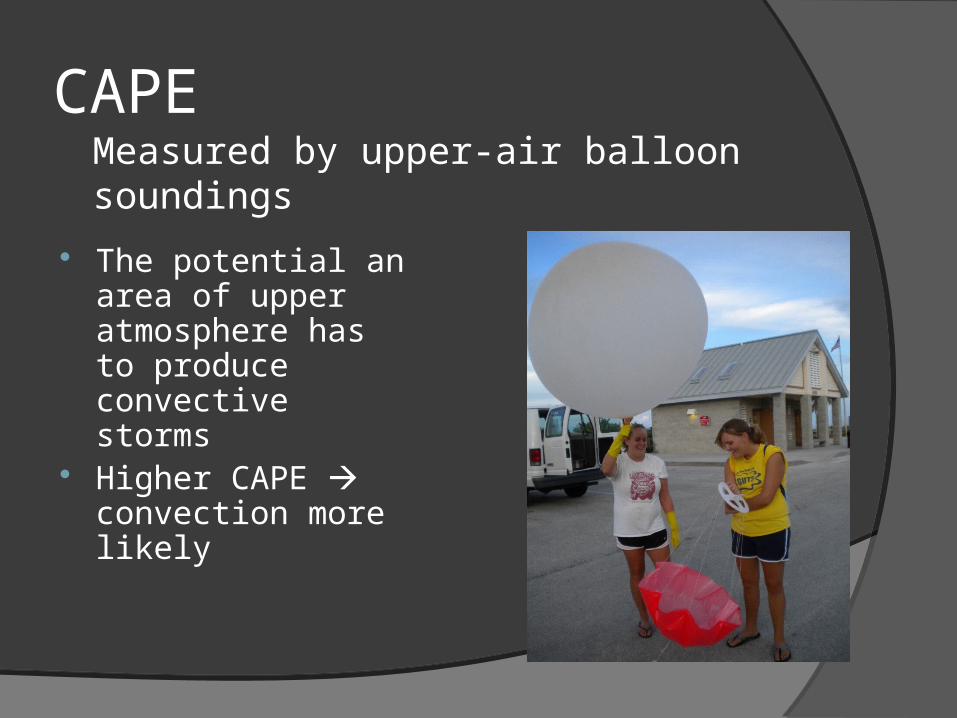
CAPE
The potential an area of upper atmosphere has to produce convective storms
Higher CAPE convection more likely
Measured by upper-air balloon soundings
Measured by upper-air balloon soundings
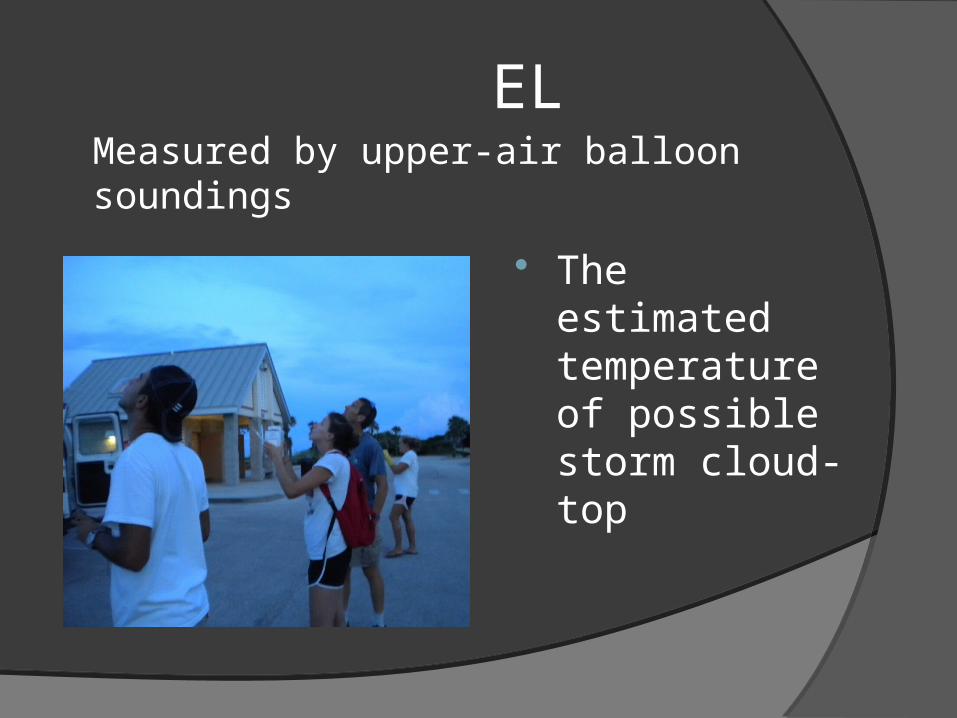
EL
The estimated temperature of possible storm cloud-top
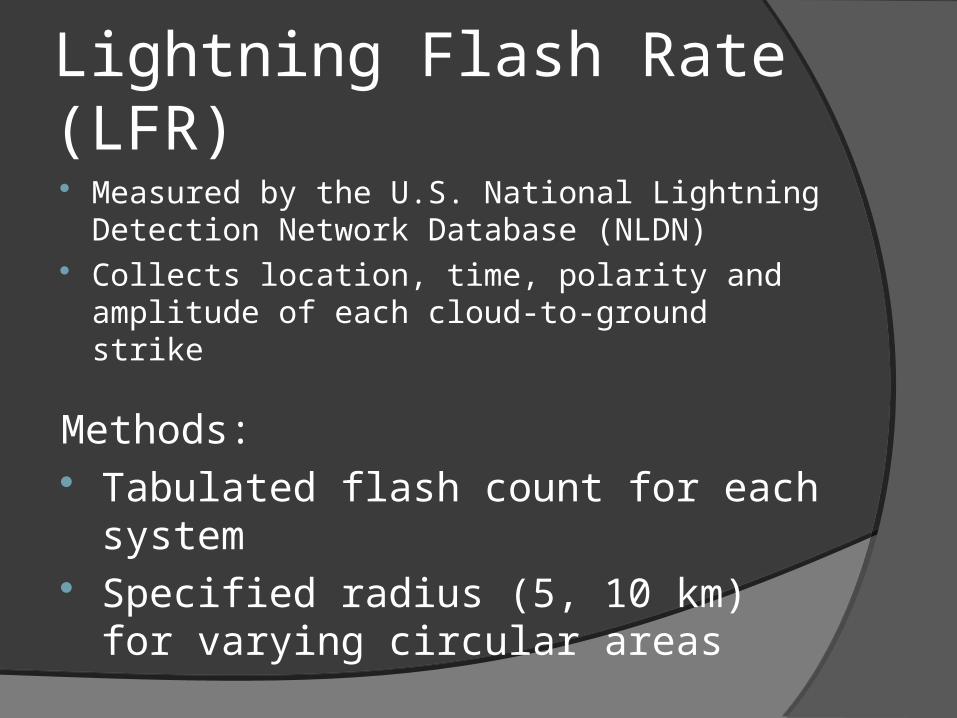
Lightning Flash Rate (LFR) Measured by the U.S. National Lightning
Detection Network Database (NLDN) Collects location, time, polarity and
amplitude of each cloud-to-ground strike
Methods: Tabulated flash count for each system Specified radius (5, 10 km) for varying
circular areas
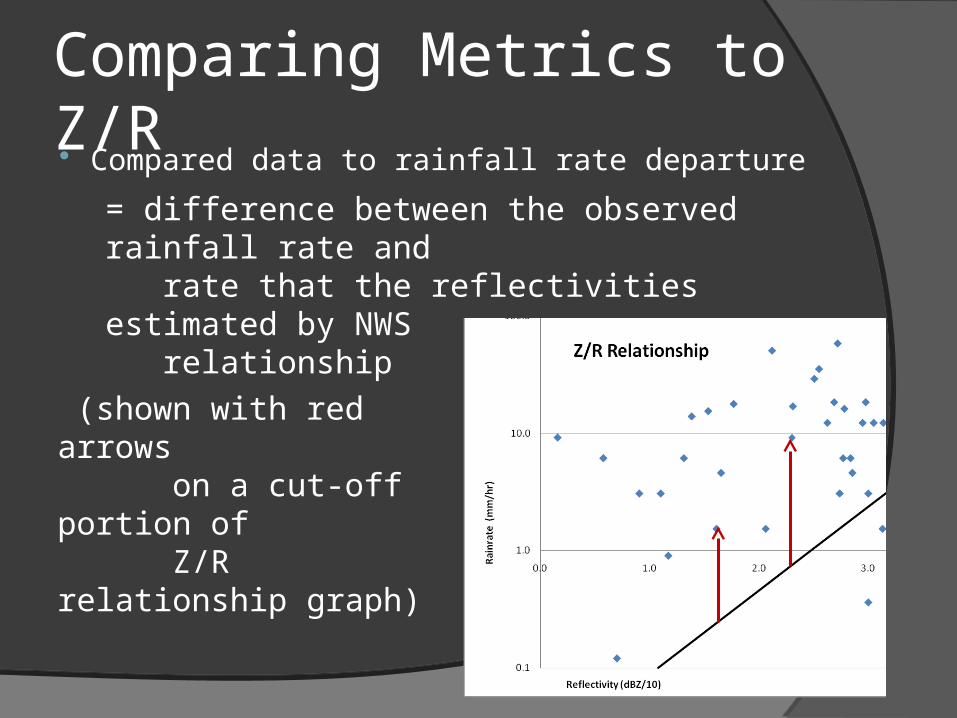
Comparing Metrics to Z/R Compared data to rainfall rate departure
(shown with red arrows on a cut-off portion of Z/R relationship graph)
= difference between the observed rainfall rate and rate that the reflectivities estimated by NWS relationship
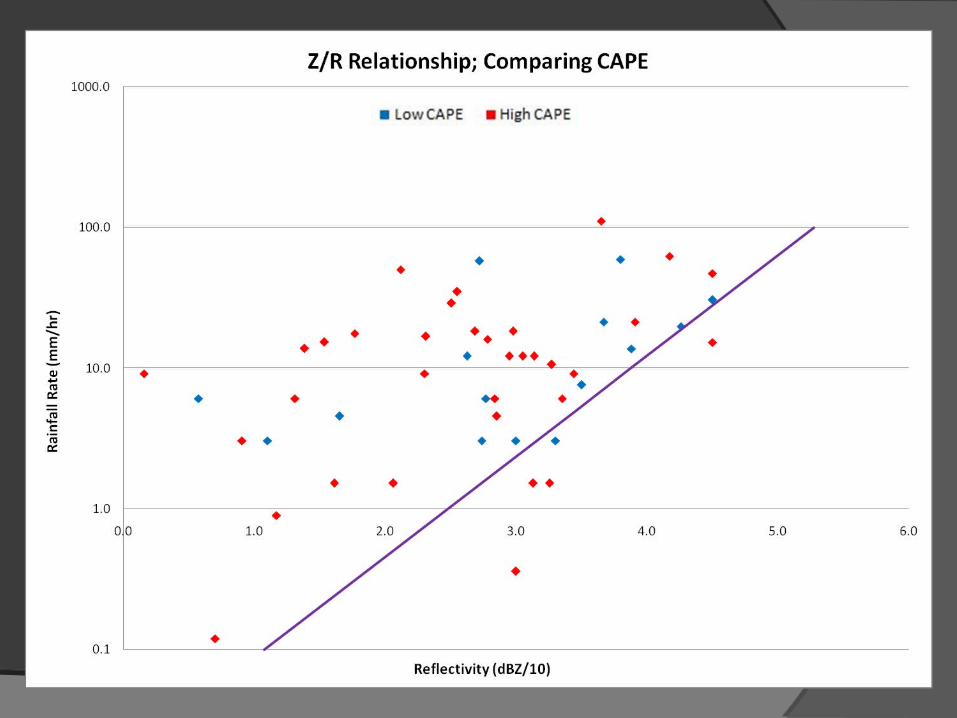
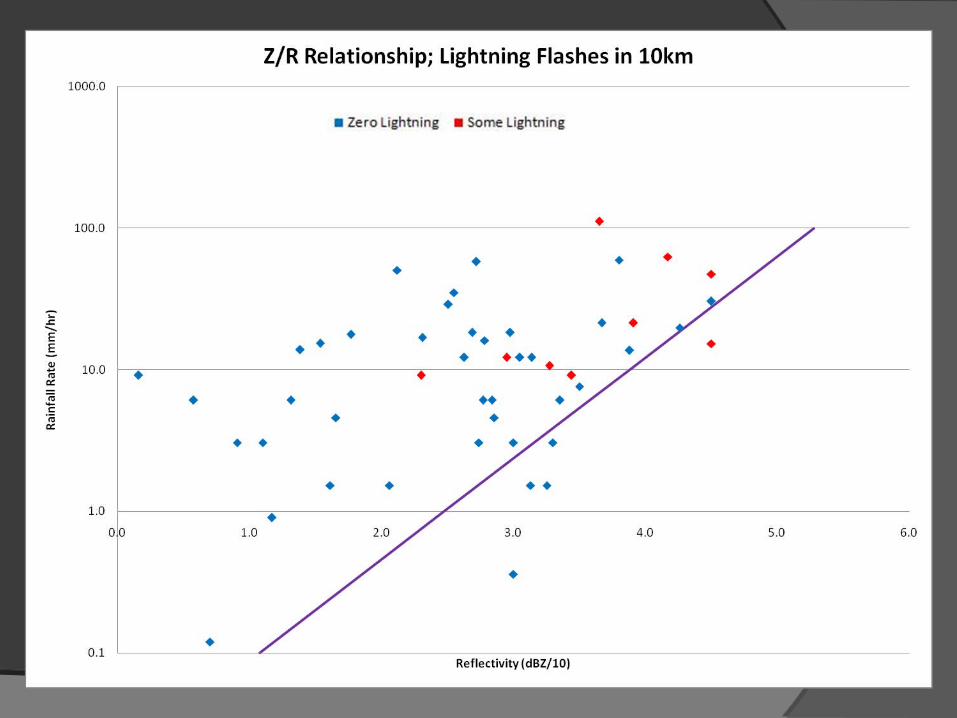
Comparing Metrics to Z/R Compared data to rainfall rate departure
Best results came from CAPE and
10 km LFR
Divided CAPE/10 km LFR into 2 groups:CAPE: high and low (dividing value = 2950 J/kg)
10 km LFR: zero and some lightning
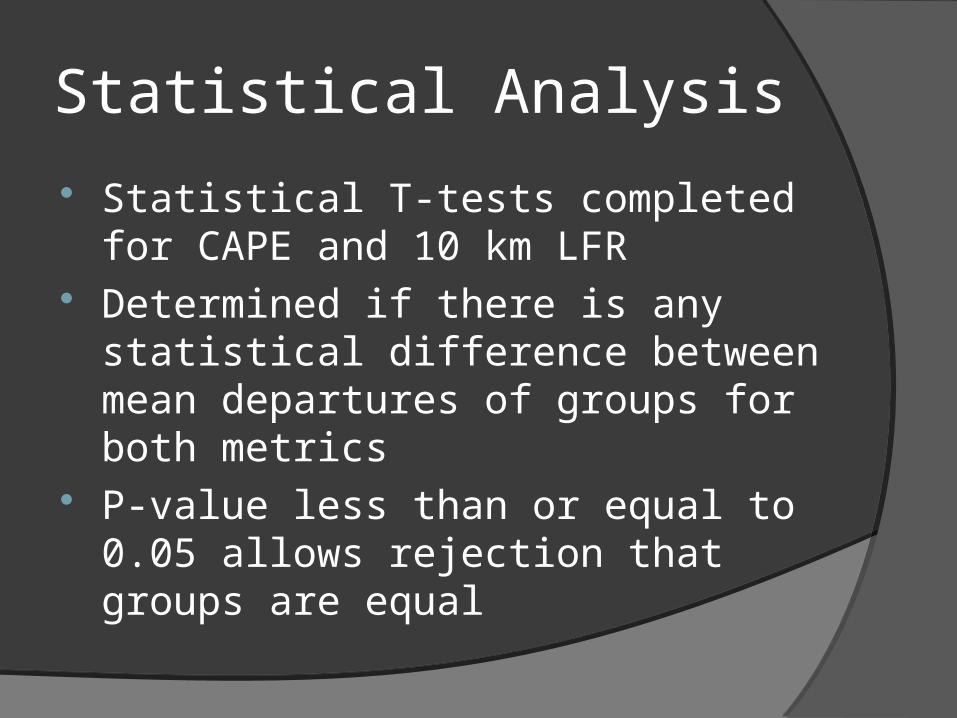
Statistical Analysis
Statistical T-tests completed for CAPE and 10 km LFR
Determined if there is any statistical difference between mean departures of groups for both metrics
P-value less than or equal to 0.05 allows rejection that groups are equal

CAPE T-test Results
Low CAPE High CAPEMean 10.73 13.6Variance 318.27 427.53P-Value 0.643
No statistical support allows the statement that these two means are different
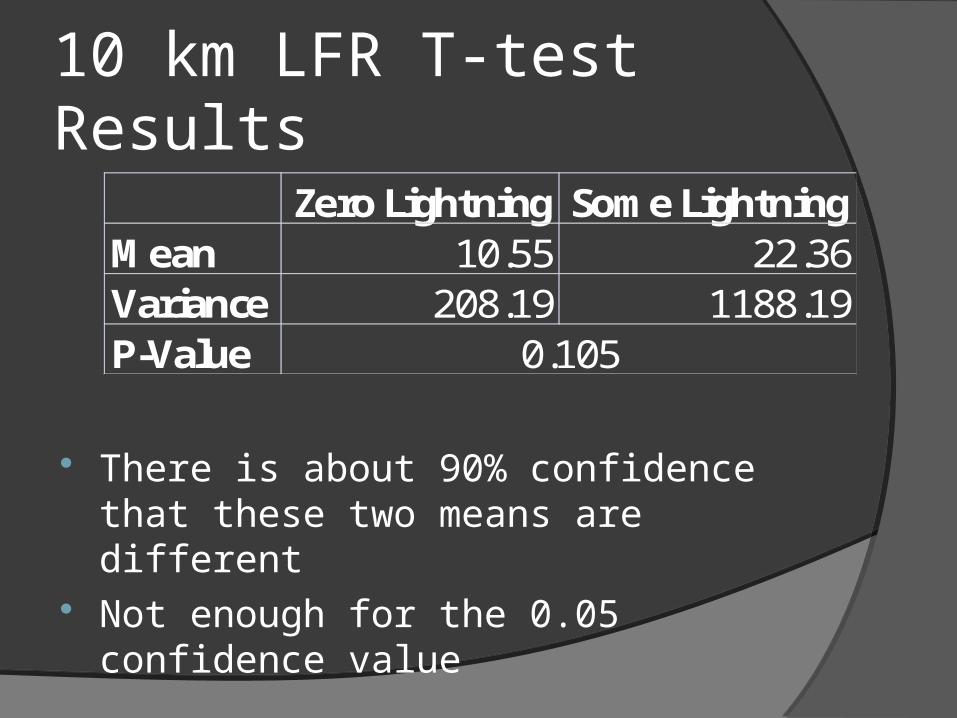
10 km LFR T-test Results
There is about 90% confidence that these two means are different
Not enough for the 0.05 confidence value
Zero Lightning Some LightningMean 10.55 22.36Variance 208.19 1188.19P-Value 0.105
Conclusions Rainfall rate mean departures for both
groups in both metrics cannot be claimed different
But results of 10 km LFR were close to confidence value
No new Z/R relationships can be inferred from the results
Could study other seasons throughout entire year; different storm types
Measure DSD with a disdrometer

Questions?
Next: Sarah Collins