Embed Size (px)
Citation preview

brought with it the beginning to severe weather season across the southeast United States. The first significant se-vere weather event of the season oc-curred on March 26th, when two torna-does, one an EF0 and another an EF1, touched down in Bulloch county. The two tornadoes carved paths between the towns of Rocky Ford and Portal, resulting in significant damage to sev-eral mobile homes and snapping or uprooting hundreds of trees. Quickly on the heels of the Tornado event, the first widespread severe weather event of the season occurred the very next day, March 27th, 2011, when numerous reports of large hail (golf ball to tennis ball size) and some isolated reports of wind damage were received. Severe weather season continued in early April when a strong cold front swept through the region on April 5th. The cold front
The 2011 calendar year was a weath-er roller coaster ride of sorts, featuring a number of unusual and extreme weather events across southern South Carolina and southeast Georgia. The events in combination with day to day forecasting operations, kept Meteorol-ogists at the National Weather Service (NWS) office in Charleston, South Carolina busy issuing a plethora of weather related watches, warnings and advisories.
Winter 2010/2011
Low country residents will certainly remember the cold arctic grip which was placed on the southeast United States during the winter months of December, January and February. In fact, the months of December and January went down in the history books as the second coldest on record at both the Charleston and Savannah International airports. The average temperature for the two month period was 43.7 degrees at the Charleston airport, finishing second to the 1939-1940 period where the average tem-perature for two month period was 42.9 degrees. At the Savannah air-port, the average temperature for the same two month period was 44.4 de-grees, just shy of the 1917-1918 stretch where the temperature aver-aged 44.3 degrees. In addition to the
cold start to the year, much of southern South Carolina and southeast Georgia experienced a significant ice storm on the 10th of January. An area of low pressure off the southeast coast spread rain into the region which froze on contact with the ground due to the presence of a cold dense airmass as a result of high pressure in the lee of the Appalachians. Most locations away from the immediate coast received a thin glaze of ice accumulation, while areas further inland along and west of a Moncks Corner to Walterboro to Met-ter line received 0.50 to 1.00 inches of ice accumulation. The ice storm had a tremendous impact on the area, caus-ing numerous power outages, closures of roads and bridges, and numerous traffic accidents. The grip of old man winter was released somewhat during the month of February, with average temperatures 2.9 degrees above nor-mal for the month at the Savannah airport and 4.1 degrees above normal for the month at the Charleston airport.
Spring 2011
The warming trend which was ob-served in February continued into spring. March, April and May all rec-orded average temperatures which were above climatology at the Charles-ton and Savannah airports. The warm-er weather, as is usually the case,
STORM COURIER
Special points of interest:
Hurricane Season mainly quiet for U.S.
Website full of information for your weather needs.
Summer scholarships awarded to college students
How clouds received names.
A nation prepared to respond to and recover from disasters.
Hurricane Awareness Tour makes a stop in Savannah, GA.
NWS Charleston represented in Australia?
Inside this issue:
2011 Hurricane Season / NWS and Social Media… 3
Your New Years Resolution: Bookmark our website... 4
Meteorologists of the future at NWS Charleston… 4
Science Corner: The Naming of Clouds… 5-6
The NWS Weather Ready Nation Initiative… 7
Hurricane Hunter Aircraft Showcased n Savannah… 8
NWS On-Site Support / Drought Conditions... 9
Significant Weather Events of 2011 By Jon Jelsema - Meteorologist
led to the development of a line of severe thunder-storms which produced widespread wind damage inc lud ing numerous downed trees and power lines across southern South Carolina and south-east Georgia. On the 16th of April, an approaching cold front moving into a moist unstable environ-ment resulted in the touch-down of a Tornado near St. Stephen, South Caroli-na. The Tornado formed over Lake Moultrie, came onshore just south of the town of Russellville and tracked just south of the town of St. Stephen before lifting. A church was com-pletely demolished, sever-al homes were damaged or destroyed and hun-dreds of trees were snapped off or uprooted. Another significant severe weather event occurred across Charleston and Berkeley counties on May 10th. Numerous reports of golf ball size hail were received, with hail the size of baseballs falling on the Isle of Palms. The spring months also featured a less frequent occurrence, when warm, dry and windy conditions resulted in the development of several large wildfires. The Windy Fire which occurred near McClellanville, SC burned nearly 2600 acres and destroyed 16 non-residential structures over the 3 day period beginning March 23rd and ending on March 25th. The Sand Ridge Fire burned nearly 1250 acres just west of Dorchester, SC on the 23rd and 24th of March. Finally, the Elim Church Road Fire occurred near Ludowici, GA and burned over 4000
acres of land and destroyed 10 structures, 3 of which were occupied homes, be-tween March 24th and March 31st. The fires which oc-curred over southern South Carolina and southeast Georgia were so large that they were clearly visible in satellite imagery.
Summer 2011
Heat and humidity returned to the South Carolina and Georgia low country over the summer months of June, July and August, along with the typical development of afternoon and evening show-ers and thunderstorms. The heat experienced across the region was quite unusual. In fact, summer 2011 will go down in the record books as the warmest in recorded history, with the average temperatures at both the Charleston and Savannah airports rounding out at 83.4 degrees and 84.0 degrees respectively. Another rather remarkable record was es-tablished at the Savannah airport, where the mercury rose to 90 degrees or above for a record 56 consecutive days beginning on May 20th and ending on July 15th. This broke the previous rec-ord of 44 consecutive 90+ degree days which occurred back in 1993. There was one stretch of days in partic-ular where the combination of heat and humidity was unbearable to most individu-als. The period of August 3rd through 9th saw daily heat index values climb above 105 degrees, and as high as 120 degrees in a few loca-tions. Despite the historic heat, the thunderstorm activi-ty was quite typical of the summer months, and kept NWS forecasters busy watching the radar and as-
sessing storm severity on most days. Numerous se-vere weather events im-pacted the area, with these events featuring sporadic reports of wind damage such as downed trees and power lines, large hail, and flash flooding. One severe weather event which stands out in particular occurred over the two day period of August 8th and 9th, following the extremely hot episode mentioned earlier. Wide-spread reports of severe weather were received from across southern South Car-olina and southeast Geor-gia of trees and power lines down as well as structural damage to several homes and businesses. Another event that many residents will remember was a visit from an infrequent guest on August 26th. This uninvited visitor was Hurricane Irene. Although the worst impacts from the Hurricane were felt across the Mid-Atlantic and Northeast States, Tropical Storm conditions did impact portions of coastal South Carolina. Winds as high as 50 mph, power outages from downed trees and power lines, elevated surf as high as 10 to 12 feet and minor salt water flooding, impacted portions of south-ern South Carolina and southeast Georgia as Irene passed by roughly 300 miles east of Charleston, SC.
Fall 2011
Quieter conditions prevailed through the fall months of September, October and November following the typically active yet unusual-ly hot summer time period. The fall months did feature several severe weather
Signifcant Weather Events of 2011 continued…
“Summer 2011 will
go down in the
record books as the
warmest in
recorded history at
both the Charleston
and Savannah
airports”
Page 2 STORM COURIER
Sweltering Heat affected the southeast United States during the summer of 2011.
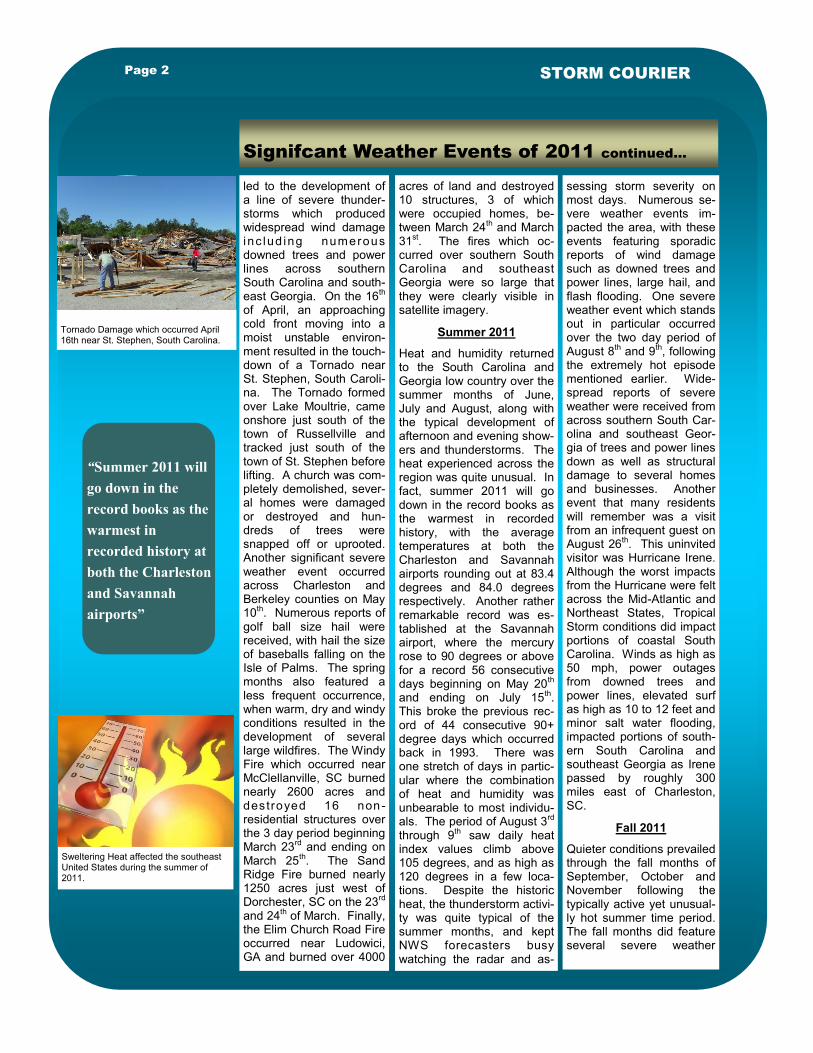
Tornado Damage which occurred April 16th near St. Stephen, South Carolina.

perature in December 2011 was 54.9 degrees at the Charleston airport, which was 4.1 degrees above normal and a shocking 12.2 degrees milder than December 2010. The story was similar at the Savannah airport, where the average temperature in December 2011 was 55.8 degrees, 4.1 degrees above normal and a re-markable 12.1 degrees warmer than December 2010. For a more thor-ough review of several of the more significant weather events which im-
pacted the low country in 2011, visit:
h t tp : / /www.erh .noaa.gov/chs / /events.shtml
Throughout 2011, a total of 299 Se-vere Thunderstorm Warnings, 10 Tornado Warnings, 172 Special Ma-rine Warnings, 10 Flash Flood Warn-ings and a host of other warning and advisory products were issued by the Charleston, SC NWS Forecast Of-fice.
events where wind damage and hail were reported. Additionally, there were several strong wind events which occurred in advance of strong cold fronts that resulted in sporadic reports of downed trees and power lines.
Following a rather inactive fall period, the winter months began drastically different than the previous year, with average temperatures running above seasonal levels. The average tem-
Page 3
It was another busy Atlantic Hurricane
season in 2011 with 19 tropical storms,
the third highest total since records began
in 1851. However, only 7 of these sys-
tems became hurricanes, with 3 of these
becoming major hurricanes (Category 3,
4, or 5 on the Saffir-Simpson Hurricane
Wind Scale. Hurricane Irene (Category 1)
was the only Hurricane to make landfall
in the United States, the first since Hurri-
cane Ike in 2008. This marks a record
sixth straight season in which no major
Hurricanes have made landfall in the
United States. An average season pro-
duces 11 Tropical Storms, 6 Hurricanes
and 2 major Hurricanes.
As expected by the National Oceanic and
Atmospheric Administration (NOAA),
some of the more favorable factors for an
active season included the El Nino South-
ern Oscillation (ENSO) being in a neu-
tral/La Nina phase and exceptionally
warm ocean temperatures. However,
despite the unusual number of tropical
storms, the weather patterns through the
summer and fall were such that most
systems were steered away from the
United States. This included high pres-
sure over the East Coast, which kept the
region mainly warmer and drier than
normal. Hurricane Irene was the only
tropical system to impact the southern
South Carolina/northern Georgia coast,
mainly in the form of beach erosion.
For more information on the 2011 Atlan-
tic hurricane season, check out the Na-
tional Hurricane Center’s website. For a
local tropical cyclone climatology, check
out http://weather.gov/chs/tropical/
hurrstats_web.shtml.
Significant Weather Events 2011 continued...
Hurricane Season - Mostly Quiet for the U.S.
By Robert Bright - Meteorologist
NWS Charleston and Social Media
By Jonathan Lamb - Meteorologist
If you're on Facebook, be sure to "Like" our page so you get informed about local weather stories, outreach events, and more. We also occasion-ally post interesting radar/satellite images and weather photos.
The best part is that it's interactive. You can post your own photos, vide-os, or messages, or comment on our posts.
We are also participating in an experi-mental Twitter service. We occasion-ally post short snippets about weather or climate, and you can send us your severe weather reports via the @ N W S C h a r l e s t o n S C t a g . Find our pages by clicking on the links at the top of our website:
http://www.weather.gov/chs
Visible Satellite Image of Hurricane Irene as the storm passed by off the southeast U.S. coast..
“If you’re on Facebook be
sure to “Like” our page”
Inside Story Headline
“Forecasts” on the left menu)
was developed to assist you.
You are encouraged to try
each of these display tools to
see which one best suits your
needs.
Besides the “one stop fore-
cast” page, the left menu
contains links to obtain infor-
mation such as current condi-
tions/hazards, climate data,
weather safety (including our
SKYWARN spotter page),
significant local weather
events and frequently asked
questions (FAQ). There is
also a new science and tech-
nology page that highlights
local forecast challenges
along with the technology we
utilize every day. Further-
more, many of our office
programs have their own web
pages where you can find
links to observations, fore-
casts and other pertinent
information. Examples in-
clude Aviation, Fire Weather,
Hydrology, Marine, and
Tropical. One of the most
popular sections of our web-
site is the climate web page,
which can be accessed by
clicking on “Local” below
“Climate” on the left menu.
Besides viewing climate
outlooks from the Climate
Prediction Center under the
“Climate Prediction” tab
you can also obtain past
climate data for many loca-
tions across southern South
Carolina and southeast
Georgia by selecting the
“NOWData” tab.
If you have any questions
and/or comments while
surfing our website do not
hesitate to contact us. You
can send an email to
and we will respond as soon
as possible. A short online
survey can also be accessed
near the bottom of the left
menu.
Maybe you have an event
planned over the next 7 days
and need the weather fore-
cast. Maybe your son or
daughter is doing a school
project and needs the high
and low temperatures for the
last year. Maybe you are
wondering if the upcoming
summer is more likely to be
warmer or cooler than nor-
mal. Well, answers to all of
these questions and more can
be found on our website:
h t tp : / /wea th e r .go v/ch s .
Don’t forget to bookmark us!
Starting on our home page
you will find a map which
you can click on if you want
a forecast for a particular
location. Any watches, warn-
ings, advisories or statements
that are in effect for hazard-
ous weather will also be
highlighted on the map.
Since there are numerous
ways to access and display
the forecast, a “One Stop
Forecast” web page (under
“One of the
most popular
sections on
our website is
the climate
web page”
Page 4 STORM COURIER
While we have the best of the best here at the Na-tional Weather Service Forecast o ff ice in Charleston, we will not all be working forever. Therefore, it is important that we introduce the brightest meteorology students to the discipline of our field. The Earnest F. Hollings Undergradu-ate Scholarship Program allows us to do just that.
The Holling’s scholarship program is designed to, among other things, in-crease undergraduate training in atmospheric sciences and recruit and prepare students for pub-lic service careers with
the National Oceanic and Atmospheric Administra-tion (NOAA). The pro-gram has a rigorous ap-plication process that weighs academic perfor-mance, experience, lead-ership, student essays, and academic or profes-sional references.
Since 2007, we have hosted several students for a 9 week training pro-gram during the summer that involves both partici-pation in an operational NWS setting and comple-tion of a research project. The students have come from a variety of higher education institutions, including the University of
Oklahoma, Central Michi-gan University, University of Missouri, and Pennsyl-vania State University. At the end of the 9 weeks, the students travel to Silver Spring, MD to make a presentation at NOAA headquarters. Some of the students continue working on their projects after the intern-ship is complete and present the results at conferences for the American Meteorological Society (AMS) and the National Weather Associ-ation (NWA), with some of the presentations of results garnering coveted awards at those confer-ences.
Your New Years Resolution: Bookmark Our Website!
By Robert Bright - Meteorologist
Meteorologists of the Future at NWS Charleston
By Frank Alsheimer - Science and Operations Officer
Science Corner: The Naming of Clouds
By Peter Mohlin - Meteorologist
Page 5
How Do Clouds Form?
Clouds develop when rising air is cooled to its con-densation or dew point. Once the air cools enough, the invisible water vapor present in the air will con-dense to form the visible liquid water drops. This is similar to moisture that develops on the outside of a glass of ice water.
While some clouds such as fog will form due to evap-oration, most clouds that occur will be the result of rising air. This ascent of air usually develops from the following processes:
From vertical instability or convection, due to
unequal heating of the ground.
From undulating (or wavelike) motions at an in-
version surface.
From orographic lifting due to mountains.
Forced lifting by a front.
The Origin of Naming Clouds
While an untold number of people observed, painted, sketched or wrote about clouds before the early 19th century, it took until 1802 for someone to classify or name them.
In December of that year, a meeting of a small socie-ty of the Askesians met in London. (Askesian is de-rived from the Greek word, askesis, which means self-discipline, searches after knowledge or intellectual exercise.) Each member of the society was required to prepare and read a scientific paper to the other members. That evening it was the turn of a 30 year pharmacist (not a meteorologist) to read his paper. It was an essay called “On the Modification of Clouds”. (In our modern language, modification means classifi-cation.)
The paper proposed that clouds have many shapes, but only a few basic forms, and that they can change from one form to another. The essay was so well re-ceived that it was thereafter soon published, and would later be reprinted in various journals and ency-clopedias. Even today, more than 200 years later we are still using the essence of this classification of clouds.
Who Was This Man Who Named the Clouds?
He has been called “The Godfather of Clouds” or
“The Man Who Named the Clouds”. But this English-men was actually named Luke Howard. He was born in London on November 28, 1772. Educated at Bur-ford in Oxfordshire, he later became apprenticed to a retail chemist in Stockport. From there he would be-come a London businessman that developed a firm that manufactured pharmaceutical chemicals. It was in London that Luke Howard became friends with William Allen, another pharmacist, who decided in March of 1796 to establish the Askesian Society. It was at one of their meetings almost 6 years later that Luke How-ard who said that “meteorology is my real penchant”, would present his paper on the naming of clouds. Little did anyone probably know at the time that his paper would have such a major effect on the world of mete-orology.
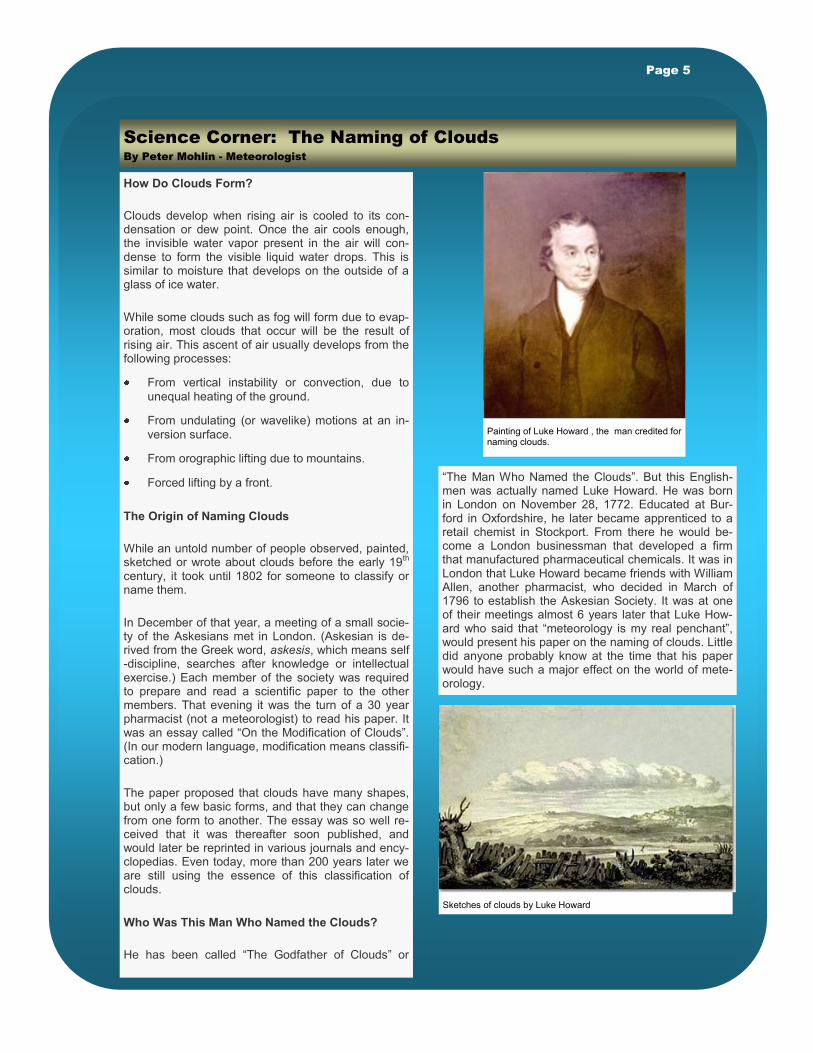
Painting of Luke Howard , the man credited for naming clouds.
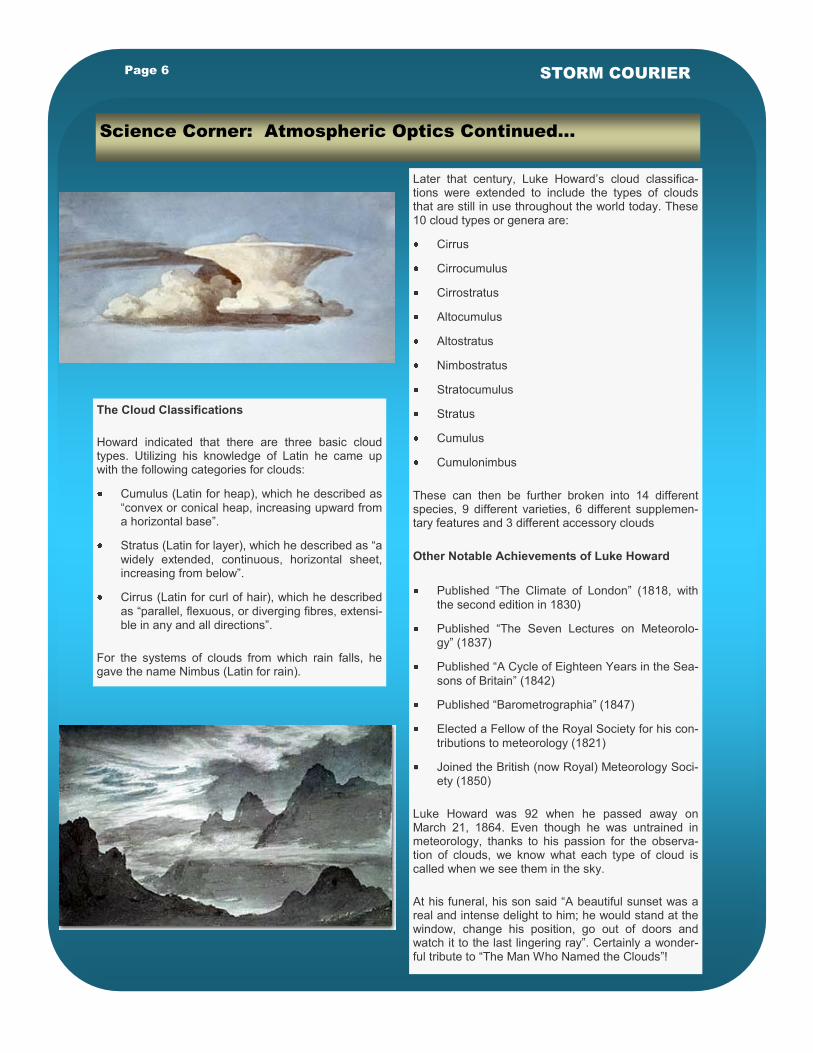
Sketches of clouds by Luke Howard
Page 6 STORM COURIER
Science Corner: Atmospheric Optics Continued...
The Cloud Classifications
Howard indicated that there are three basic cloud types. Utilizing his knowledge of Latin he came up with the following categories for clouds:
Cumulus (Latin for heap), which he described as
“convex or conical heap, increasing upward from a horizontal base”.
Stratus (Latin for layer), which he described as “a
widely extended, continuous, horizontal sheet, increasing from below”.
Cirrus (Latin for curl of hair), which he described
as “parallel, flexuous, or diverging fibres, extensi-ble in any and all directions”.
For the systems of clouds from which rain falls, he gave the name Nimbus (Latin for rain).
Later that century, Luke Howard’s cloud classifica-tions were extended to include the types of clouds that are still in use throughout the world today. These 10 cloud types or genera are:
Cirrus
Cirrocumulus
Cirrostratus
Altocumulus
Altostratus
Nimbostratus
Stratocumulus
Stratus
Cumulus
Cumulonimbus
These can then be further broken into 14 different species, 9 different varieties, 6 different supplemen-tary features and 3 different accessory clouds
Other Notable Achievements of Luke Howard
Published “The Climate of London” (1818, with
the second edition in 1830)
Published “The Seven Lectures on Meteorolo-
gy” (1837)
Published “A Cycle of Eighteen Years in the Sea-
sons of Britain” (1842)
Published “Barometrographia” (1847)
Elected a Fellow of the Royal Society for his con-
tributions to meteorology (1821)
Joined the British (now Royal) Meteorology Soci-
ety (1850)
Luke Howard was 92 when he passed away on March 21, 1864. Even though he was untrained in meteorology, thanks to his passion for the observa-tion of clouds, we know what each type of cloud is called when we see them in the sky.
At his funeral, his son said “A beautiful sunset was a real and intense delight to him; he would stand at the window, change his position, go out of doors and watch it to the last lingering ray”. Certainly a wonder-ful tribute to “The Man Who Named the Clouds”!
Page 7
The National Weather Service Moves Toward a
more “Weather-Ready” Nation
NOAA’s National Weather Service has launched a comprehensive initiative to build a more “Weather-Ready” nation to make America safer by saving more lives and protecting livelihoods as communities across the country become increasingly vulnerable to severe weather events, such as tornado outbreaks, intense heat waves, flooding, active Hurricane sea-sons, and solar storms that threaten electrical and communication systems. This initiative comes on the heels of a record breaking year for weather related disasters. In 2011, there were 12 such disasters that resulted in at least one billion dollars of damage each, which broke the previous record of 9 in 2008. Some of the record breaking events in 2011 included the historic spring tornado outbreaks across the east and southeast U.S., Hurricane Irene, which impacted much of the U.S. east coast, wild fires across Texas, and major flooding across the Ohio River Valley re-gion.
In order to move toward a more weather-ready na-tional, the National Weather Service, in partnership with other government agencies, researchers, and the private sector, is focusing on the following initia-tives:
Improved precision of weather and water fore-
casts and effective communication of risk to local authorities;
Improved weather decision support services with
new initiatives such as the development of mo-bile-ready emergency response specialist teams;
Innovative science and technological solutions
such as the nationwide implementation of Dual Pol radar technology, Integrated Water Re-sources Science and Services, and the Joint Polar Satellite System;
Strengthening joint partnerships to enhance com-
munity preparedness;
Working with weather enterprise partners and the
emergency management community to enhance safety and economic output and effectively man-age environmental resources.
The National Weather Service has also established nine separate innovative, community-based test pro-jects across the country, ranging in focus from emer-gency response to ecological forecasting, to enhance the agency’s preparedness efforts to better address the impacts of extreme weather. Some of these pilot projects have already been launched, and it is ex-
pected that the remaining sites will be launched within a year or so at strategic locations across the Gulf Coast, South and Mid-Atlantic regions of the country.
“Severe weather represents a very real threat to pub-lic safety that requires additional robust action,” said Dr. John “Jack” Hayes, director of NOAA’s National Weather Service. “The increasing impacts of natural disasters, as seen this year (2011), are a stark re-minder of the lives and livelihoods at risk.” Overall, the key to the success of the Weather-Ready initiative for the National Weather Service will be to sustain weather support and data for high-impact services, continue evolving into an agile, progressive organiza-tion within a challenging budget environment, while helping to foster a culture of innovation across the agency.
For more information about the National Weather
Service’s Weather-Ready Nation efforts, please visit:
http://www.nws.noaa.gov/com/weatherreadynation/
The NWS Weather Ready Nation Initiative
By Ron Morales - Warning Coordination Meteorologist
Building a Weather-Ready Nation
National Weather Service
Page 8 STORM COURIER
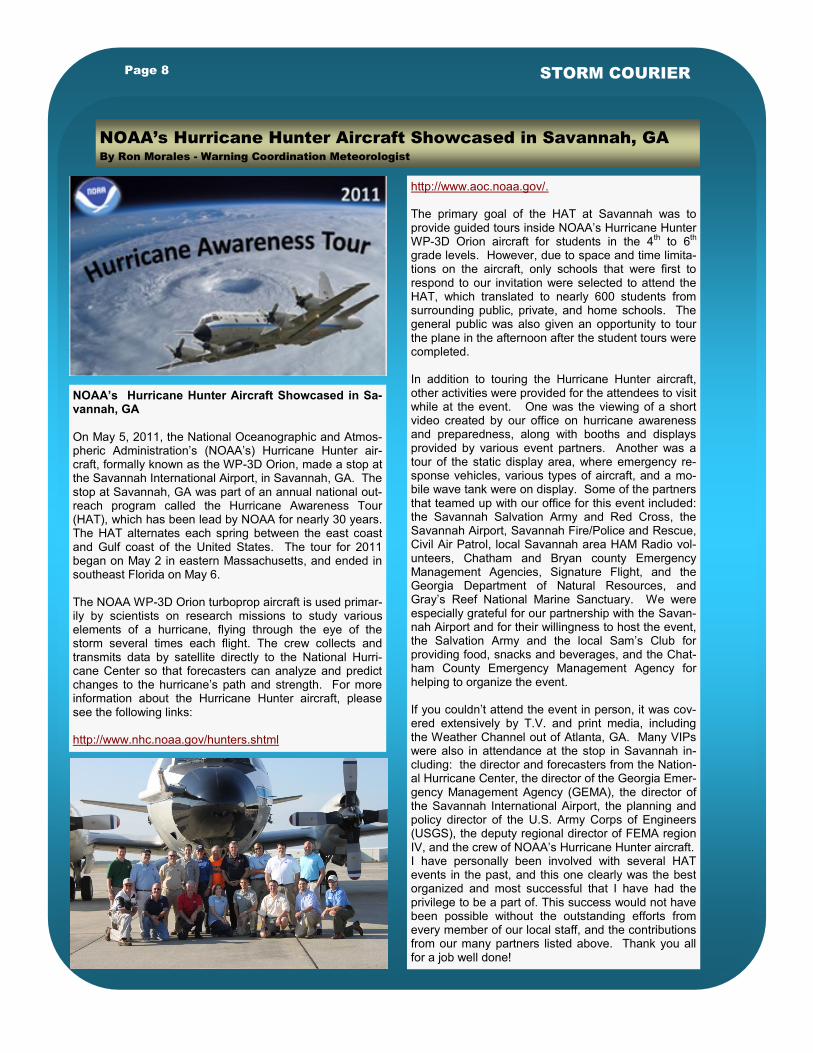
NOAA’s Hurricane Hunter Aircraft Showcased in Sa-vannah, GA On May 5, 2011, the National Oceanographic and Atmos-pheric Administration’s (NOAA’s) Hurricane Hunter air-craft, formally known as the WP-3D Orion, made a stop at the Savannah International Airport, in Savannah, GA. The stop at Savannah, GA was part of an annual national out-reach program called the Hurricane Awareness Tour (HAT), which has been lead by NOAA for nearly 30 years. The HAT alternates each spring between the east coast and Gulf coast of the United States. The tour for 2011 began on May 2 in eastern Massachusetts, and ended in southeast Florida on May 6. The NOAA WP-3D Orion turboprop aircraft is used primar-ily by scientists on research missions to study various elements of a hurricane, flying through the eye of the storm several times each flight. The crew collects and transmits data by satellite directly to the National Hurri-cane Center so that forecasters can analyze and predict changes to the hurricane’s path and strength. For more information about the Hurricane Hunter aircraft, please see the following links: http://www.nhc.noaa.gov/hunters.shtml
http://www.aoc.noaa.gov/. The primary goal of the HAT at Savannah was to provide guided tours inside NOAA’s Hurricane Hunter WP-3D Orion aircraft for students in the 4th to 6th grade levels. However, due to space and time limita-tions on the aircraft, only schools that were first to respond to our invitation were selected to attend the HAT, which translated to nearly 600 students from surrounding public, private, and home schools. The general public was also given an opportunity to tour the plane in the afternoon after the student tours were completed. In addition to touring the Hurricane Hunter aircraft, other activities were provided for the attendees to visit while at the event. One was the viewing of a short video created by our office on hurricane awareness and preparedness, along with booths and displays provided by various event partners. Another was a tour of the static display area, where emergency re-sponse vehicles, various types of aircraft, and a mo-bile wave tank were on display. Some of the partners that teamed up with our office for this event included: the Savannah Salvation Army and Red Cross, the Savannah Airport, Savannah Fire/Police and Rescue, Civil Air Patrol, local Savannah area HAM Radio vol-unteers, Chatham and Bryan county Emergency Management Agencies, Signature Flight, and the Georgia Department of Natural Resources, and Gray’s Reef National Marine Sanctuary. We were especially grateful for our partnership with the Savan-nah Airport and for their willingness to host the event, the Salvation Army and the local Sam’s Club for providing food, snacks and beverages, and the Chat-ham County Emergency Management Agency for helping to organize the event. If you couldn’t attend the event in person, it was cov-ered extensively by T.V. and print media, including the Weather Channel out of Atlanta, GA. Many VIPs were also in attendance at the stop in Savannah in-cluding: the director and forecasters from the Nation-al Hurricane Center, the director of the Georgia Emer-gency Management Agency (GEMA), the director of the Savannah International Airport, the planning and policy director of the U.S. Army Corps of Engineers (USGS), the deputy regional director of FEMA region IV, and the crew of NOAA’s Hurricane Hunter aircraft. I have personally been involved with several HAT events in the past, and this one clearly was the best organized and most successful that I have had the privilege to be a part of. This success would not have been possible without the outstanding efforts from every member of our local staff, and the contributions from our many partners listed above. Thank you all for a job well done!
NOAA’s Hurricane Hunter Aircraft Showcased in Savannah, GA
By Ron Morales - Warning Coordination Meteorologist

Each year numerous incidents rang-ing from wildfires to hazardous ma-terials disasters to devastating acts of nature occur across the country and the world. The incidents which occur will vary in size, but can be large enough to require oversight by Incident Management teams which help communities respond to and recover from these disasters.
The National Weather Service (NWS) plays a key role in the re-sponse and recovery efforts remote-ly and occasionally on-site, helping to ensure the safety of all assigned incident personnel. The larger inci-dents often require the assistance of NWS Incident Meteorologists (IMETs) to respond to and recover from the disaster at hand. IMETs are specially trained Meteorologists that integrate into the Incident Man-agement Team and provide weather forecasts as well as weather alerts
and updates to ensure the safety of all incident personnel.
This year the NWS office in Charles-ton, SC dispatched IMETs John Quagliariello and Jon Jelsema to support the suppression efforts of the large wildfires in the southeast United States on 5 separate occa-sions for a total of 59 days. The IMETs were dispatched to the southeast Georgia wildfires which many residents may remember sent periodic episodes of smoke, poor air quality and reduced visibility into southern South Carolina and south-east Georgia during the spring and summer months. The wildfires that the IMETs supported in 2011 includ-ed the Race Pond Fire which burned 21,000 acres, the Sweat Farm Again Fire which consumed 19,725 acres, the Elim Church Road Fire which burned 4,035 acres, and the Honey Prairie Fire which burned 309,200
acres of land and has continued to burn into early 2012.
NWS Charleston, SC IMET support continued in early 2012 when IMET John Quagliariello was dispatched in early January for a month long assignment to assist our Southern Hemisphere partners in Australia. John’s assignment is part of an In-ternational exchange program famil-iarizing a select group of Meteorolo-gists from each country with each other’s operations in order to enable quick assistance in the event of a long campaign fire or busy fire sea-son in either country. He was as-signed to work for the Australian Bureau of Meteorology in the city of Adelaide, Australia where his duties included working the Fire Weather desk in the office’s Severe Weather Unit. A more thorough description detailing John’s assignment can be expected in the 2013 Office News-letter.
Page 9
“He was assigned to work for the Australian Bureau of Meteorology in the city of Ade-
laide, Australia”
National Weather Service Charleston On-Site Incident Support
By Jon Jelsema - Meteorologist
Severe to Extreme Drought Conditions across SC and GA
By Jonathan Lamb - Meteorologist
2011 was a year for the record books regarding the lack of precipi-tation. The Charleston Airport re-ceived a total of 37.01" of precipita-tion which was 14.02" below nor-mal. This made 2011 the sixth driest year on record. At the Savannah Airport, the total for the year was 34.61" which was 13.35" below nor-mal. Savannah had the seventh driest year on record. The U.S. Drought Monitor has maintained much of southeast Georgia and southern South Carolina in Severe
to Extreme drought status for the last nine months. Streams and riv-ers have been at near-record low levels since the summer. Only six River Flood Warnings were issued by our office in 2011, all of which were during the late winter and spring months. Unfortunately, the drought will probably continue for the foreseeable future. The latest three-month outlook from the Cli-mate Prediction Center indicates a 40-50% chance for below-normal rainfall through April 2012.

NATIONAL WEATHER SERVICE
CHARLESTON, SOUTH CAROLINA
Mission: “Protection of Life and Property and Enhancement of the National Economy”
5777 South Aviation Avenue North Charleston, SC 29406
Phone: (843) 744-0303
We’re on the Web!
www.weather.gov/chs
clouds or waterspouts, pick up the phone and give us a call. In addition, if you see or hear of any injuries, fatalities, or damage from lightning, give us a call.
Your valuable reports help us confirm what we’re detecting on radar, and could make a life-or-death difference for the people in the next town or in the next coun-ty in the path of the severe storm that just went over your home.
Whenever severe weather strikes, remember, as a trained weather spotter we want to hear from you!
If you measure or estimate winds of 50 mph or greater, observe trees and/or power lines down, structures damaged, hail (any size), flooding (water running across the road, ditches over-flowing, creeks/streams out of their banks), tornadoes, funnel
When in doubt, please call us!
You can reach us by calling the toll free number which we provid-ed to you during the spotter train-ing session you attended.
You can also leave a report on our severe weather answering machine: 1-888-383-2024.
For Forecast and Current Condi-tions call: 1-843-744-0303.
Your Report Makes a Difference!