Embed Size (px)
Citation preview
The effect of organisational culture on strategy execution
By
Melissa Reddy
Student No: 15391834
A research project submitted to the Gordon Institute of Business Science,
University of Pretoria in preliminary fulfilment of the requirement for the degree
of
MASTERS OF BUSINESS ADMINISTRATION
18 January 2017
© University of Pretoria
i
Abstract
This report documents research, on the effect of organisational culture on strategy execution.
Organisational culture refers to a “set of beliefs, values, norms and assumptions that are
shared by members of an organization”. The process of converting strategy into action is
referred to as strategy execution. Although organisational culture has become almost
synonymous with strategy to maintain a competitive edge, the impact of such variation on
strategy execution remains relatively unexplored. This research was therefore aimed at
adding to the body of knowledge and aiding management to operate effectively.
The research aim of this paper was to determine if there was a significant effect between the
dimensions of organisational culture (uncertainty avoidance, gender egalitarianism,
assertiveness, institutional collectivism, in-group collectivism, humane, future and
achievement orientation and power distance) and dimensions of strategy execution
(information sharing, leadership, rewards, performance, structure, employee commitment 1,
employee commitment 2 and coordination). The research was conducted at a FMCG
company and the research design was a quantitative. A survey strategy was used. A
questionnaire comprising of a demographics, organisation culture and strategy execution
section was distributed via an electronic system. Data analysis was carried out on SPSS.
Descriptive statistics and Pearson correlation were conducted to understand the sample’s
basic feature and the significance of the association.
It was found that the dimensions of organisational culture have a variation of strong, medium
and weak associations to the dimensions of strategy execution. There were eight associations
tested between the organisational culture dimensions and the strategy execution dimensions.
There was only one association where the alternative hypothesis was fully accepted and
seven associations where the alternate hypothesis was partially accepted. Achievement
orientation was found to have the highest effect on strategy execution dimensions.
This study provides some ground work to prove to management of companies that it is time
to place a considerable emphasis on developing organisational culture dimensions that have a
positive impact on strategy execution and leads to the success thereof.
KEYWORDS: Organisational culture, Strategy execution, Dimensions
© University of Pretoria
ii
Declaration
I declare that this research project is my own work. It is submitted in partial fulfilment of the
requirements for the degree of Master of Business Administration at the Gordon Institute of
Business Science, University of Pretoria. It has not been submitted before for any degree or
examination in any other University. I further declare that I have obtained the necessary
authorisation and consent to carry out this research.
____________________ Melissa Reddy 18 January 2017
© University of Pretoria
iii
Table of Contents
CHAPTER 1 .............................................................................................................................. 1
DEFINITION OF THE PROBLEM ...................................................................................... 1
1.1 INTRODUCTION ................................................................................................... 1
1.2 RESEARCH GAP ................................................................................................... 2
1.3 MOTIVATION FOR RESEARCH ......................................................................... 2
1.4 OBJECTIVES OF RESEARCH .............................................................................. 4
1.5 SCOPE OF STUDY ................................................................................................ 4
1.6 INTRODUCTION TO DOCUMENT ..................................................................... 5
CHAPTER 2 .............................................................................................................................. 6
LITERATURE REVIEW ....................................................................................................... 6
2.1 CULTURE .................................................................................................................... 7
2.2 ORGANISATIONAL CULTURE ............................................................................... 7
2.3 STRATEGY ............................................................................................................... 21
2.4 STRATEGY EXECUTION ....................................................................................... 23
2.5 ORGANISATIONAL CULTURE AND STRATEGY EXECUTION ...................... 31
CHAPTER 3 ............................................................................................................................ 35
RESEARCH PROBLEM ..................................................................................................... 35
3.1 PRIMARY RESEARCH OBJECTIVE ...................................................................... 35
3.2 SECONDARY RESEARCH OBJECTIVE................................................................ 38
CHAPTER 4 ............................................................................................................................ 39
RESEARCH METHODOLOGY ......................................................................................... 39
4.1 RESEARCH SETTING .............................................................................................. 39
4.2 METHODOLOGY ..................................................................................................... 40
4.3 RESEARCH PROCESS ............................................................................................. 41
4.4 POPULATION ........................................................................................................... 41
4.5 SAMPLING METHOD .............................................................................................. 41
4.6 MEASUREMENT INSTRUMENT ........................................................................... 42
4.7 MEASUREMENT INSTRUMENT PRE-TESTING ................................................. 46
4.8 DATA COLLECTION AND MANAGEMENT ....................................................... 46
4.9 RELIABILITY AND VALIDITY.............................................................................. 47
4.10 DATA ANALYSIS .................................................................................................. 64
4.11 POTENTIAL RESEARCH LIMITATIONS ............................................................ 65
CHAPTER 5 ............................................................................................................................ 67
RESULTS............................................................................................................................. 67
5.1 INTRODUCTION ...................................................................................................... 67
© University of Pretoria
iv
5.2 DEMOGRAPHIC INFORMATION .......................................................................... 67
5.3 EFFECT ON ORGANISATIONAL CULTURE ON STRATEGY EXECUTION .. 80
5.4 OVERALL EFFECT OF CULTURE ON STRATEGY EXECUTION .................... 97
5.5 CONTROL VARIABLES ........................................................................................ 100
5.6 SUMMARY.............................................................................................................. 105
CHAPTER 6 .......................................................................................................................... 111
DISCUSSION OF RESULTS ............................................................................................ 111
6.1 INTRODUCTION .................................................................................................... 111
CHAPTER 7 .......................................................................................................................... 132
CONCLUSION .................................................................................................................. 132
7.1 PRINCIPAL FINDINGS .......................................................................................... 132
7.2. IMPLICATIONS FOR MANAGEMENT .............................................................. 136
7.3. LIMITATIONS OF THE RESEARCH ................................................................... 138
7.4. SUGGESTIONS FOR FUTURE RESEARCH ....................................................... 138
7.5. CONCLUSION ....................................................................................................... 139
8. REFERENCES .................................................................................................................. 140
9. APPENDIX A - Questionnaire Permission Letter ......................................................... 148
10. APPENDIX B – Survey .............................................................................................. 149
11. APPENDIX C – Consent letter ................................................................................... 161
12. APPENDIX D – Ethical clearance ............................................................................. 163
13. APPENDIX D – Originality report ............................................................................. 164
© University of Pretoria

v
List of Tables
Table 1: Culture definitions ....................................................................................................... 8 Table 2: Neilson strength traits index ...................................................................................... 30 Table 3: Summary of studies on the culture and performance link ......................................... 34 Table 4: Response rate to survey ............................................................................................. 42 Table 5: Questionnaire details ................................................................................................. 42
Table 6: Project globe culture survey items ............................................................................. 44 Table 7: KMO and Bartlett’s test for strategy execution ......................................................... 47 Table 8: Total variance explained for strategy execution ........................................................ 48 Table 9: Rotated component matrix for strategy execution ..................................................... 52 Table 10: KMO and Bartlett’s test for organisational culture ................................................. 55
Table 11: Total variance explained for organisational culture ................................................ 56 Table 12: Rotated component matrix for organisational culture ............................................. 59 Table 13: Strategy execution reliability ................................................................................... 61
Table 14: Organisational culture reliability ............................................................................. 62 Table 15: Organisational culture deleted item analysis 1 ........................................................ 63 Table 16: Organisational culture deleted item analysis 2 ........................................................ 64 Table 17: Age mean score ........................................................................................................ 68
Table 18: Gender mean scores ................................................................................................. 69 Table 19: Management level mean scores ............................................................................... 71
Table 20: Department mean scores .......................................................................................... 73 Table 21: Cross tabulation between tenure and years in management .................................... 74 Table 22: Tenure descriptive statistics ..................................................................................... 75
Table 23: Number of employees’ descriptive statistics ........................................................... 76 Table 24: Cross tabulation between strategy implementation and management level ............ 77
Table 25: Strategy implementation descriptive statistics ......................................................... 78 Table 26: Organisational strategy descriptive statistics ........................................................... 79
Table 27: Pearson correlation table - culture and information sharing .................................... 82 Table 28: Pearson correlation table - culture and leadership ................................................... 84
Table 29: Pearson correlation table - culture and rewards ....................................................... 86 Table 30: Pearson correlation table - culture and rewards ....................................................... 88
Table 31: Pearson correlation table - culture and structure ..................................................... 90 Table 32: Pearson correlation table - culture and employee commitment 1 ............................ 93 Table 33: Pearson correlation table - culture and employee commitment 2 ............................ 95
Table 34: Pearson correlation table - culture and coordination ............................................... 97 Table 35: Eigenvalues and canonical correlations ................................................................... 98
Table 36: Multivariate tests of significance ............................................................................. 98 Table 37: Dimension reduction analysis .................................................................................. 99 Table 38: Univariate F-tests ..................................................................................................... 99 Table 39: Independent univariate tests .................................................................................. 100 Table 40: Control variable regression analysis – information sharing .................................. 100
Table 41: Control variable regression analysis – leadership ................................................. 101 Table 42: Control variable regression analysis – rewards ..................................................... 101
Table 43: Control variable regression analysis – performance .............................................. 102 Table 44: Control variable regression analysis – structure .................................................... 102 Table 45: Control variable regression analysis – employee commitment 1 .......................... 103 Table 46: Control variable regression analysis – employee commitment 2 .......................... 104 Table 47: Control variable regression analysis – coordination .............................................. 104 Table 48: Summary of hypothesis findings ........................................................................... 107
© University of Pretoria
vi
List of Figures
Figure 1: Gap in literature .......................................................................................................... 2 Figure 2: Approaches to culture ............................................................................................... 10 Figure 3: Levels of organisational culture ............................................................................... 11 Figure 4: Quin & Spreitzer CVF Model .................................................................................. 16
Figure 5: Cameron & Quinn CVF Model ................................................................................ 18 Figure 6: Denison model .......................................................................................................... 19 Figure 7: Strategic management process ................................................................................. 22 Figure 8: The research onion ................................................................................................... 40 Figure 9: Proposed model for two constructs .......................................................................... 45
Figure 10: Strategy Scree Plot ................................................................................................. 50
Figure 11: Organisational Culture Scree Plot .......................................................................... 58 Figure 12: Age profile .............................................................................................................. 68
Figure 13: Gender profile ......................................................................................................... 69 Figure 14: Management level profile ....................................................................................... 70 Figure 15: Department profile ................................................................................................. 72 Figure 16: Tenure of employment profile ................................................................................ 74
Figure 17: Number of employees profile ................................................................................. 76 Figure 18: Strategy implementation profile ............................................................................. 77
Figure 19: Organisational strategy profile ............................................................................... 79 Figure 20: Alternative hypothesis 1 ....................................................................................... 111 Figure 21: Alternative hypothesis 2 ....................................................................................... 114
Figure 22: Alternative hypothesis 3 ....................................................................................... 116 Figure 23: Alternative hypothesis 4 ....................................................................................... 119
Figure 24: Alternative hypothesis 5 ....................................................................................... 121
Figure 25: Alternative hypothesis 6 and 7 ............................................................................. 124
Figure 26: Alternative hypothesis 8 ....................................................................................... 127
© University of Pretoria

1
CHAPTER 1
DEFINITION OF THE PROBLEM
1.1 INTRODUCTION
With the rapid rate of globalization it is imperative that organizations maintain a competitive
advantage by understanding the latest trends to survive in the market place. There are many
ways in which the organisation can remain competitive such as deploying the latest
technology products (competencies) or utilising their resources such as talent and culture to
stay competitive (Şengül, Alpkan, & Eren, 2015).
A strong organisational culture has become almost synonymous with business strategy and
maintaining a competitive edge (Schwartz & Davis, 1981). The study of organisational
culture started in the late eighteenth and nineteenth century and today has been realised as a
new business era in organisations. “Culture refers to a set of beliefs, values, norms and
assumptions that are shared by members of an organization” (Gregory, Harris, Armenakis, &
Shook, 2009).
A central theme, highlighted by research, is the ideology that organisations which ensure
strong cultures, exude open communication and empowers employee decision making, will
thrive in the marketplace due to their favourable working atmosphere (Schneider, Ehrhart, &
Macey, 2013). This however requires leadership to understand the values, norms and
assumptions that support culture and its effect on organisational performance such as
cohesion, satisfaction and strategy execution among other factors (Hoppe & Eckert, 2015;
Kargas, Varoutas, & Nisar, 2015).
Several studies have aimed to develop models that test the effect of organisational culture on
organisational performance (Cameron & Quinn, 2006). Organisational performance is
demonstrated by the achievement of the organisations goals or key performance indicators
(Heesen, 2015). Organisation goals or key performance indicators are a subset of the
strategic management process and evaluates how well the organisation is turning their
strategy into actions that grow and sustain the organisation. The process of
turning/transforming/converting strategy into action is referred to as strategy execution or
strategy implementation. Thus by virtue of the integrated nature between organisational
© University of Pretoria

2
performance and strategy execution; it can be theorised that organisational culture is crucially
essential for strategy execution (Zheng, Yang, & McLean, 2010).
Given the importance of culture in developing a shared purpose and moulding the desired
behaviours in an organisation; it undeniably must be considered as an impetus to strategy
execution and implementation.
1.2 .RESEARCH GAP
Although there is no scarcity of literature on verifying the effects of organisational culture on
performance ranging from employee satisfaction, financial performance, and market
performance to innovation, the impact of such variation on strategy execution remains
relatively unexplored. This research is therefore aimed at examining the effect of
organisational culture on strategy execution, and to determine related implications that may
exist.
Figure 1: Gap in literature
1.3 MOTIVATION FOR RESEARCH
Managers continuously seek alternative means of increasing value to the marketplace to
maintain a competitive advantage due to the increasing competitiveness in and across most
industries (Li & Liu, 2014). Organisational culture has been realised as a resource and
competence that must be developed to create a competitive advantage and adapted to
© University of Pretoria

3
maintain a competitive advantage (Klein, 2011). This therefore suggests that organisational
culture plays a major role in how an organisation performs in the marketplace.
Several studies have investigated and tried to prove the link between organisational culture
and organisational performance. Some of these studies have been successful in proving this
hypothesis from a financial performance, employee satisfaction, innovation and market
(sales) performance perspective (Hogan & Coote, 2014; Prajogo & McDermott, 2011). It has
also been well popularised in strategic management literature that good performance, which
comprises of healthy financial performance, good sales outcomes, high innovation and happy
employees, is a measure of the organisation achieving their goals as well as how well
organisations are executing their strategy (Yesil & Kaya, 2013). The building blocks of
strategy execution range from elements like finance, sales and marketing, innovation, cost
and price to people (Igwe, Ph, Onwumere, & Ph, 2015). Be that as it may only a small
number of studies have in fact proven the effect of culture on strategy implementation
(Ahmadi, Alamzadeh, Daraei, & Akbari, 2012). Therefore; it is imperative to understand
which types of cultures will enable the organisation to execute its strategic objectives. It is
also essential to understand the effect of the components that make up culture on strategy
execution.
The influences of organisational culture on strategy execution are numerous and in some
cases can lead to major failures if companies do not take heed of the importance of this
relationship. In the mobile phone industry we have seen the fall of many giant mobile phone
makers who had developed a company culture synonymous for poor decision making, an
environment slow to change, a lacklustre approach in picking up on trends and planning for
the future. The lack of control over these organisational culture dimensions lead to the demise
of these mobile phone makers since they were unable to execute on a technologically driven
innovative strategy. There are several other examples in reality that exist which proves that
organisations unable to understand how their organisational culture affects their ability to
execute their strategy are usually setting themselves up for some type of disappointment and
failure (MacCormack, Dunn, & Kemerer, 2014).
Limited available literature on organisational culture and strategy execution, more
specifically the effect of culture on strategy leads the author to believe that there is a
significant need for this research. It is proposed that valuable insights could be achieved by
focusing the study explicitly on the impact of organisational culture on strategy execution.
© University of Pretoria

4
Therefore in summary this research will aid organisations to be in a better position to
understand how organisational culture effects business so organisations can adapt to remain
relevant and competitive. Coupled to this from an academic perspective this study will add to
the limited available literature on organisational culture and strategy execution dimensions
and more specifically the effect of culture dimensions on strategy execution dimension.
Collectively these two motivations lead the author to believe that there is a significant need
for this research. It is proposed that valuable insights could be achieved by focusing the study
explicitly on the impact of organisational culture dimensions on strategy execution
dimensions.
1.4 OBJECTIVES OF RESEARCH
The objective of this study is to address the gap in literature by investigating the relationship
between organisational culture and strategy execution; and the context of the study is within a
FMCG company with its head office in Johannesburg South Africa.
In particular, it aims to provide insight into the following within the organisational culture
and strategy execution context:
Is there is a significant relationship/influence/effect between the dimensions of
organisational culture and dimensions of strategy execution?
Understand which dimension of culture was found to have the highest effect on
strategy execution.
Simply put the overall objective is to discover the role/influence/effect of organisational
culture on organisational strategy execution and more specifically do different dimensions or
aspects of organisational culture affect strategy execution differently.
In addition to this study aiming to address the literature gap, it is also highly relevant to the
current business context of increasingly widespread and frequent change. The outcomes of
this research will inform organisations of the relevance and importance of organisational
culture to enhance productivity and performance when executing on strategy.
1.5 SCOPE OF STUDY
The scope of this study was limited to organisations that were of medium to large enterprises
i.e. more than 1000 employees so that a definitive organisational culture, strategy formulation
© University of Pretoria
5
and execution are present. As the study was conducted at a large FMCG organisation based in
South Africa, the findings may not be universally applicable to all organisations in all
contexts.
Additionally, there are numerous factors within strategy execution, with organisational
culture being only one of them. The scope of this study is therefore limited to the effect of
organisational culture on strategy execution and no conclusions can be made regarding the
prevalence or absence of other influencing factors.
Lastly, the success of the strategy formulated within the organisation under study was not
investigated, and thus no conclusions can be drawn on the effectiveness of the strategy within
the company.
1.6 INTRODUCTION TO DOCUMENT
In the following chapter, a literature review is provided which presents a critical engagement
with contemporary research in this field, and highlights the gap in research in more detail.
This is followed by a chapter describing the specific research questions and hypotheses. A
chapter describing the research methodology is then provided followed by the results, a
discussion of the results, and a conclusion. The document is concluded with a list of all
references used.
© University of Pretoria
6
CHAPTER 2
LITERATURE REVIEW
This chapter provides an extensive review of literature pertaining to the research topic. The
literature review comprises three main theoretical constructs. The first theoretical construct
and section, relates to organisational culture and aims to provide an overall understanding of
organisational culture by highlighting insights from organisational culture theory and the
different types of organisations that exist.
The second theoretical construct and section covers the principles of Strategy execution. This
sections aims to define how strategy execution fits into the strategic management process,
what exactly does it mean for an organisation, and lastly provides useful insights into the
various frameworks for strategy execution.
The third theoretical construct and section brings together the first and second theoretical
constructs with the aim to provide an overview of the link between organisational culture and
strategy execution. In addition to this; it will also document studies done to look at the
relationship between organisational culture and strategy execution or performance which is a
direct good reflection of an organisations ability to execute on its strategy.
Literature Limitations
A research study of this nature usually requires the researcher to review recent literature on
the subject matter under investigation to achieve an extensive and effective understanding of
the subject. While there is a selection of relevant articles from 2011, it was revealed that these
articles made many references to other studies done before 2011. In an attempt to go to the
original source, articles much older than the three to five year time timeframe was referred to.
This highlighted the robustness and present day relevance of the models developed in the past
literature.
© University of Pretoria

7
2.1 CULTURE
2.1.1 WHAT IS CULTURE?
The concept of culture was derived from social anthropology studies in the early twentieth
century. Social anthropology studies related to the study of "primitive" societies, such as
South Sea, African, Native American and Eskimo (Cooke & Rousseau, 1988). It was
revealed these societies differed from each other and possessed their own unique way of
adapting as a social system. From an all-encompassing viewpoint, culture thus represents the
qualities passed from one generation to the next of any specific human group because these
qualities are believed to be useful for survival and adaptation (Duncan, 1989). “Culture” is
more formally defined by The American Heritage Dictionary as the "totality of socially
transmitted behaviour patterns, arts, beliefs, institutions, and all other products of human
work and thought characteristic of a community or population” (Denison Consulting, n.d.)
2.2 ORGANISATIONAL CULTURE
2.2.1 DEFINITIONS OF ORGANISATIONAL CULTURE
Some people think of culture as the character of the organisation and this ideology has
intrigued researchers around the world. As a result the concept has grown in popularity and
has had over thousands of articles devoted to understanding the topic (Hartnell, Ou, &
Kinicki, 2011; Schneider et al., 2013). There are various definitions and connotations about
organizational culture, however most researchers have developed a shared understanding of
culture which defines culture as “a set of beliefs, values, norms and assumptions that are
shared by members of an organization” (Gregory et al., 2009). Culture exists at multiple
levels of the organisation (group and operating divisions) where the underlying
values/norms/assumptions have an influence on the organizational employees behaviour,
since people use these values/norms/assumptions in guiding their decisions and behaviours
(Gregory et al., 2009). Culture also plays a role in influencing employees’ attitudes. This can
have a major impact on how employees respond to the organisation and the value they deliver
to the organisation (Nayak & Barik, 2013).
Organisational values refer to the things that are believed to be important to the organisation
which underpins the culture and acts as an ethical compass for decision making and conduct
of organisational members. Much of organisational culture is concerned with how things get
© University of Pretoria

8
done in an organization. According to Nayak & Barik (2013), this can be felt in the implicit
rules and expectations of organisational behaviour where even though the rules are not
formally written down or directly communicated, employees know what is expected of them.
These rules are often defined by management whose decisions on policy usually set up the
culture of the organization.
As explained above the concept of culture has been researched for decades; however the
fundamentals have remained robust with even the latest research still making use of the late
nineteenth and early twentieth century definitions. Table 1, shown below illustrates the
various definitions of organisational culture which have been developed by several
researchers.
Table 1: Culture definitions (Cooke & Rousseau, 1988)
Becker & Greer (1970) Set of common understandings, expressed in language
Kroeber & Kluckholm (1952) Organisational behaviour that is shaped by the values, ideas and
other symbolic systems conveyed within the organisation.
Louis (1983) Three aspects: (1) some content (meaning and interpretation) (2)
peculiar to (3) a group
Martin & Siehl (1983) Constitutes of three elements: core values, forms
(communication/language, e.g. jargon), strategies to reinforce
content (e.g., rewards, training programs) which form shared
meaning throughout the organisation and can be thought of as the
glue that keeps the organization together.
Ouchi (1981) Refers to the underlying values and beliefs of the organization which
are communicated to employees through a set of symbols,
formalities and myths.
Swartz & Jordon (1980) Refers to the underlying values and beliefs of the organization which
are communicated to employees through a set of symbols,
formalities and myths.
Uttal (1983) The behavioural norms (the way we do things around here) which is
a result of the interaction between what is important (shared
values) and how things work (beliefs) with the organisation’s control
systems, procedures and structures.
Van Maanen & Schein (1979) Shared values, beliefs and expectations of members within the
organisation
© University of Pretoria
9
2.2.2 IMPORTANCE OF ORGANISATIONAL CULTURE
When an organisation achieves success or needs to adapt to survive, the ideas and values
underpinning the success or survival become institutionalised and part of the organisation
culture resulting in a “system of shared values (defining what is important) and norms
(defining appropriate attitudes and behaviours)” (Chatman & Cha, 2003). There are two
important functions that culture serves in an organisation: (1) allows for integration between
organisation members so they know how to relate to one another; (2) assists the organisation
to adapt to its external environment (Chen, hen, & Meindl, 1998).
Internal integration assists the organisations employees in developing a collective identity so
they can work together effectively. It is the organisation culture that guides day to day
working relationships, how communication occurs, acceptable and not acceptable behaviour
as well as the allocation of power and status within the organisation (Raza, Mehmood, &
Sajjid, 2013). Culture is also a determinate of how the organisation meets goals and conducts
relationships with external parties outside the organisation. The appropriate cultural values
help organisations rapidly respond to customer needs and wants or competitor actions
therefore making it strategically relevant (Linnenluecke & Griffiths, 2010). It shapes and
coordinates employee behaviour to encourage commitment to achieve organisational goals
(Aryasri & Aijaz, 2013); this was proved in the case of South West Airlines whereby the
employees showed a self-commitment to ensuring the success of the low cost airline carrier.
The right culture is determined by what an organisation needs to meet external challenges and
succeed in its environment. All effective organisational cultures are closely related to the
business strategy and encourage adaptation to the changing environment so a healthy and
profitable organisation can be maintained (Schwartz & Davis, 1981).
2.2.3 APPROACHES TO ORGANISATIONAL CULTURE
To further develop an understanding of culture; it can be distinguished by two approaches
that is those who study and view culture as directly observable patterns of behaviour, and
those who look at what is shared in the minds of members of a community (Bernard, 1992).
Put simply, culture is something an “organisation has” rather than something the
“organisation is”.
© University of Pretoria

10
The perspective of “organizations have cultures” describes ways in which organizations
contrast each other and analyses attributes of these organizations that distinguish the effective
from the less effective. This perspective is normally researched via an exploratory
methodology (Schneider et al., 2013).
On the other hand, the perspective of “organizations are cultures” describes how
“organizational members develop meaning and come to share the very basic assumptions—
the root metaphors—that guide the way they as the organization function”. This research
approach tends to be inductive using a “native-view paradigm” to report how insiders
experience their organizations (Schneider et al., 2013). Figure 2 below is a visual illustration
of the two approaches to organisational culture.
Figure 2: Approaches to culture (Smircich, 1983)
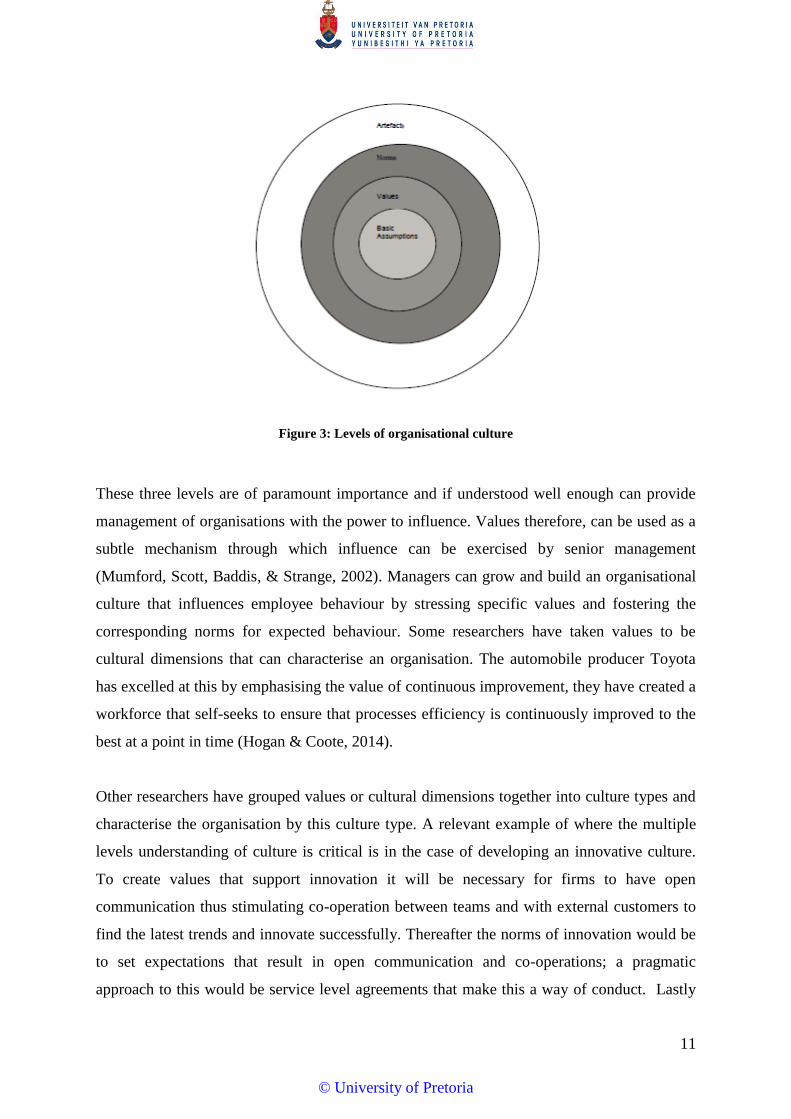
2.2.4 MULTIPLE LEVELS OF ORGANISATIONAL CULTURE
Culture in the organisation can be viewed as comprising of three levels shown below in
figure 3. At the surface levels are the visible artefacts – all things one can hear, see and
observe by watching the members of the organisation. At a deeper level, values and beliefs
are expressed which are not observable but can be discerned from how people explain and
justify their actions. At the core level, some values become so deeply embedded in a culture
that they can be defined as basic assumptions which are less open to question and guide the
language and social interaction of organisational members (Cheung, Wong, & Wu, 2011).
© University of Pretoria
11
Figure 3: Levels of organisational culture
These three levels are of paramount importance and if understood well enough can provide
management of organisations with the power to influence. Values therefore, can be used as a
subtle mechanism through which influence can be exercised by senior management
(Mumford, Scott, Baddis, & Strange, 2002). Managers can grow and build an organisational
culture that influences employee behaviour by stressing specific values and fostering the
corresponding norms for expected behaviour. Some researchers have taken values to be
cultural dimensions that can characterise an organisation. The automobile producer Toyota
has excelled at this by emphasising the value of continuous improvement, they have created a
workforce that self-seeks to ensure that processes efficiency is continuously improved to the
best at a point in time (Hogan & Coote, 2014).
Other researchers have grouped values or cultural dimensions together into culture types and
characterise the organisation by this culture type. A relevant example of where the multiple
levels understanding of culture is critical is in the case of developing an innovative culture.
To create values that support innovation it will be necessary for firms to have open
communication thus stimulating co-operation between teams and with external customers to
find the latest trends and innovate successfully. Thereafter the norms of innovation would be
to set expectations that result in open communication and co-operations; a pragmatic
approach to this would be service level agreements that make this a way of conduct. Lastly
© University of Pretoria
12
with respect to artefacts of innovation, organisations would need to create innovation
platforms and related activities that are visible to all and that organisational members can
partake in as well as share good stories about how organisational members who have solved
issues in innovative ways (Hogan & Coote, 2014).
2.2.5 ORGANISATIONAL CULTURE DIMENSIONS AND TYPES
2.2.5.1 HOFSTEDE CULTURE DIMENSIONS
Culture researchers often thought of culture as a single variable before Hofstede’s work.
Several researchers believed that culture is too multifaceted to be thought of as a single
variable, yet the de-bundling of culture was an intimidating task that many researchers
preferred to shy away from. Hofstede on the other hand took on the challenge and his
research showed how organisational culture can be unpacked into independent dimensions
(Minkov & Hofstede, 2011).
Hofstede (1984) “Culture’s Consequences” explores culture by researching international
organizations. Data was collected and analysed from IBM, a large multinational corporation
across forty different countries. The data analysis, found that “organizations are cultural-
bounded” even though they may lie in different locations worldwide. Additionally, four
culture dimensions were identified to analyse cultural values in different countries i.e., power
distance, uncertainty avoidance, individualism and masculinity (Wu, 2006).
The power distance dimension, refers to the “power inequality between superiors and
subordinates” (Drogendijk & Slangen, 2006). Organisational hierarchy is obvious in “high
power distance organizations” where there is a clear distinction between managers and
subordinates. On the other hand, “low power distance organizations” tend to have a flat
organization structure. The uncertainty avoidance dimension, refers to “people’s tolerance of
ambiguity” (Drogendijk & Slangen, 2006). In “high uncertainty avoidance organizations”, to
reduce uncertainty there is more formal rules and procedures. In “low uncertainty avoidance
organizations”, there are fewer formal rules and procedures. The individualism-collectivism
dimension, refers to “how people value themselves and their groups/organizations”
(Drogendijk & Slangen, 2006). People with “high individualistic values” are more concerned
with their fulfilling their own potential and career progression in the organization, while
people with “low individualistic values” tend to place a higher importance on organizational
© University of Pretoria

13
benefits rather than their own interests. The masculinity (MAS) dimension, describes gender
roles in companies. In “high MAS organizations”, high paying high level jobs are prioritised
for men whereas in “low MAS organizations”, women are able to secure more equitable
organizational status (Wu, 2006).
Hofstede’s approach on “cultural dimensions” inspired many researchers and was utilised in
many studies, with the most popular study being the GLOBE research program (R. J. House,
Hanges, Javidan, Dorfman, & Gupta, 2004). Despite the repeated use and evidence
compilation of Hofstede’s cultural dimensions; some academic houses still regarded it a
contentious topic and showed doubt towards the findings since it was believed that culture
must be treated as a package (Minkov & Hofstede, 2011).
2.2.5.2 GLOBE CULTURE DIMENSIONS
The GLOBE study, which began in 1991, was considered the brainchild of Robert J. House.
The study was initially aimed at international research on leadership and was later expanded
into other core elements of organizational cultures (R. J. House et al., 2004).
The GLOBE research program consisted of three organisational culture phases. Phase 1
activities comprised of the “development of research instruments”. Phase 2 activities
comprised of the “assessment of nine dimensions of organisational cultures” and the testing
of propositions relating to the relationships that may exist among these cultural dimensions.
Phase 3 activities were aimed at investigating and establishing causality, as well as extend
previous findings from Hofstede’s work (R. House, Javidan, & Dorfman, 2001).
Project GLOBE used a mixed research methodology (quantitative and qualitative methods),
to provide “richly descriptive, yet scientifically valid accounts of cultural influences on
organisational processes”. The quantitative elements included the measurement of
organisational culture and behaviours (Dorfman, Javidan, Hanges, Dastmalchian, & House,
2012).
There has been no common agreed to definition on organisational culture among the social
scientist society. Organisational culture refers to a set of “shared” parameters that
differentiate one organisation from another (R. J. House et al., 2004). The GLOBE research
program defines organisational culture as, “shared motives, values, beliefs, identities, and
© University of Pretoria

14
interpretations or meanings of significant events that result from common experiences of
members of the organisation”. Organisational culture is often represented in two ways: (a) the
shared view among members of the organisation relating to the organisational values, beliefs,
etc.; and (b) the agreement among members of the organisation relating to the observed
practices of the organisation (R. House et al., 2001).
The GLOBE research program can be thought of as an expansion of Hofstede’s five culture
dimension paradigm. Shown below are the changes that the GLOBE research program
instituted to Hofstede’s five culture dimension:
The dimensions referred to as power distance and uncertainty avoidance were maintained,
however their meaning or definition was changed (R. House et al., 2001).
The dimension referred to as collectivism was split into institutional collectivism and in-
group collectivism (R. House et al., 2001).
The dimension referred to as masculinity–femininity was split into assertiveness and
gender egalitarianism (R. House et al., 2001).
The dimension referred to as long-Term orientation became future orientation (R. House
et al., 2001).
Lastly, two new culture dimensions were added namely, humane orientation and
performance orientation (R. House et al., 2001).
The nine culture dimensions, as defined by the GLOBE research program, were the founding
principles for the culture items in the GLOBE questionnaire. Related to each of the
dimensions the GLOBE research program distinguished between cultural practices and
cultural values (R. House, Javidan, Hanges, & Dorfman, 2002). The cultural practices are
captured by the “as is” questionnaire and the cultural values are captured by the “should be”
questionnaire.
Shown below is the meaning of the nine cultural dimensions as defined in the GLOBE
research program (R. House et al., 2001; R. J. House et al., 2004):
Uncertainty Avoidance: refers to the extent by which members of an organisation rely on,
“social norms, rituals, and bureaucratic practices” as a means to avoid uncertainty and the
unpredictability of future events (R. House et al., 2001).
© University of Pretoria
15
Power Distance: refers to the degree by which members of an organisation understand and
expect that power in an organisation should be unequally shared (R. House et al., 2001).
Collectivism I: Societal Collectivism refers to the degree by which organisational practices
and behaviour encourage team work and reward, “collective distribution of resources” (R.
House et al., 2001).
Collectivism II: In-Group Collectivism refers to the degree by which members of an
organisation express pride, loyalty, cohesiveness and commitment in their organisations (R.
House et al., 2001).
Gender Egalitarianism: refers to the extent by which an organisation, “minimises gender
role differences and gender discrimination” (R. House et al., 2001).
Assertiveness: refers to the degree by which members in an organisation are assertive,
confrontational, and aggressive in work and social relationships (R. House et al., 2001).
Future Orientation: refers to the degree by which members in an organisation engage in
behaviours which delay instant gratification and focus on future-oriented behaviour such as
planning and investing in the future (R. House et al., 2001).
Performance Orientation: refers to the extent by which an organisation supports and
rewards group members for striving for continuous improvement and excellence in
performance (R. House et al., 2001).
Humane Orientation: refers to the degree by which members in an organisation support and
reward individuals for being, “fair, altruistic, friendly, generous, caring, and kind to others”
(R. House et al., 2001).
2.2.5.1 COMPETING VALUES FRAMEWORK (Quin and Spreitzer)
The “Competing Values Framework (CVF)” was developed in 1991 by Quin and Spreitzer
and has since seen a few iterations and revisions by other researches. It remains in present
one of the most prominent and widely used models in the area of organizational culture
research.
The CVF model (shown below in figure 4) encapsulates four different cultural dimensions
located on two axes. The first axis represents flexibility and control whereby, flexibility
refers to spontaneity and development and control refers to stability and continuity (Prajogo
& McDermott, 2011). The second axis represents internal and external orientations with the
internal axis being oriented towards, “maintenance and improvement of the existing
organization” and the external axis being focused on, “adaptation and interaction with the
© University of Pretoria

16
external environment”. The result of the two axes is four quadrants of cultural characteristics
forming four culture types, namely group, developmental, hierarchical, and rational, as shown
in Figure 4 (Prajogo & McDermott, 2011). The research done by Quin and Spreitzer in 1991
found that while these culture types represent the ideal state of an organisation, in reality it is
not uncommon that organizations display dimensions of each of the culture types
independently (Prajogo & McDermott, 2011).
Figure 4: Quin & Spreitzer CVF Model
2.2.5.1.1 Group culture
Group culture links to the quadrant recognised by internal focus and high flexibility. Group
dynamics is a value that is imperative since it promotes, “cohesiveness, participatory
decision-making, and considerate support among co-workers in an organisation”. According
to Gregory et al. (2009), managers through empowerment, mentoring and teamwork support
and leverage these values.
2.2.5.1.2 Developmental culture
The development quadrant is characterised by an emphasis on flexibility which is externally-
focused. The development culture is normally most relevant to an organisation with growth
aspirations and thus is positioning itself for change and adaptation. Entrepreneurial ventures
is supported by leadership since it invokes creativity within employees and organisations
stand to gain from the development of new resources and profits (Gregory et al., 2009).
2.2.5.1.3 Rational culture
© University of Pretoria
17
The rational quadrant highlights control that is externally-focused. In this type of culture,
goal realisation is an essential value. Organisational goals embody guiding employees’
behaviour towards adapting for the external environment by encouraging proactive employee
actions. “These cultures tend to value productivity, achievement, and competition towards
well-established criteria” (Gregory et al., 2009).
2.2.5.1.4 Hierarchical culture
In the hierarchical quadrant, an importance is placed on control that is internally-focused.
This culture is characterised by strict guidelines which can lead to a somewhat rigid work
environment. These guidelines are put in place to regulate employee behaviours where
employees place a high importance on job security (Gregory et al., 2009).
2.2.5.2 COMPETING VALUES FRAMEWORK (Cameron and Quin)
Cameron & Quinn (2006) research was aimed at further developing the organizational culture
theoretical model commonly known as the, "Competing Values Framework" (CVF). Similar
to the Quin and Spreitzer framework; this framework has four dominant culture types i.e.,
clan, adhocracy, market, and hierarchy (Wiewiora, Trigunarsyah, Murphy, & Coffey, 2013).
The implications of each culture type are summarized as follows, also shown in figure 5.
2.2.5.2.1 Clan cultures
Clan cultures develop a common understanding and pledge and do not rely on a structured
communication processes. Teamwork and employee involvement programmes are typical
characteristics of clan cultures with the core values representing, “participation, loyalty and
commitment” (Wiewiora et al., 2013).
2.2.5.2.2 Adhocracy cultures
Adhocracy cultures place a high importance on flexibility and external competitive position.
From a cultural dimension perspective there is a focus on creativity, entrepreneurship and
adaptability (Wiewiora et al., 2013).
2.2.5.2.3 Hierarchy culture
© University of Pretoria

18
Hierarchy cultures are pigeon-holed by certainty and an internal focus. There is a focus on,
“information management, documentation, stability, routines, centralization, continuity and
control”. In hierarchy cultures members are governed and rely heavily on procedure. Internal
controls keep members together by guiding their behaviour. The glue that keeps the
organisation together are the principles of stability, formal rules and policies (Wiewiora et al.,
2013).
2.2.5.2.4 Market culture
Market cultures are similar to the rational goal culture, since it relates to a strong external
focus and in particular the external environment. Importance is placed on competitiveness,
productivity, goal clarity, efficiency and accomplishments ensuring through goal orientation
and competition members work together (Wiewiora et al., 2013).
Figure 5: Cameron & Quinn CVF Model
2.2.5.3 SCHEIN MODEL
Schein (1992) one of the leading researchers on the differentiating factors between the
multiple layers of the culture within an organisation, (see Fig. 1). According to Schein, the
© University of Pretoria
19
misunderstanding in the definitions of culture and the lack of consensus between researchers
is a result of failing to distinguish and differentiate between the levels at which organizational
culture reveals itself correctly. As shown earlier figure 1 illustrates, values determine
observed patterns of behaviour and underlie norms and artefacts. Norms refer to the
expectations of acceptable behaviours held by organisational members and are subject to
social obligation or pressure. Organizational norms are derived from values and are
manifested in artefacts. Although values are considered to be the least visible since it’s not
tangible, artefacts represent the, “visible layer of the organisational culture” and can be found
in the organisational symbols, ceremonies, language, and physical workspace arrangements
(Hogan & Coote, 2014).
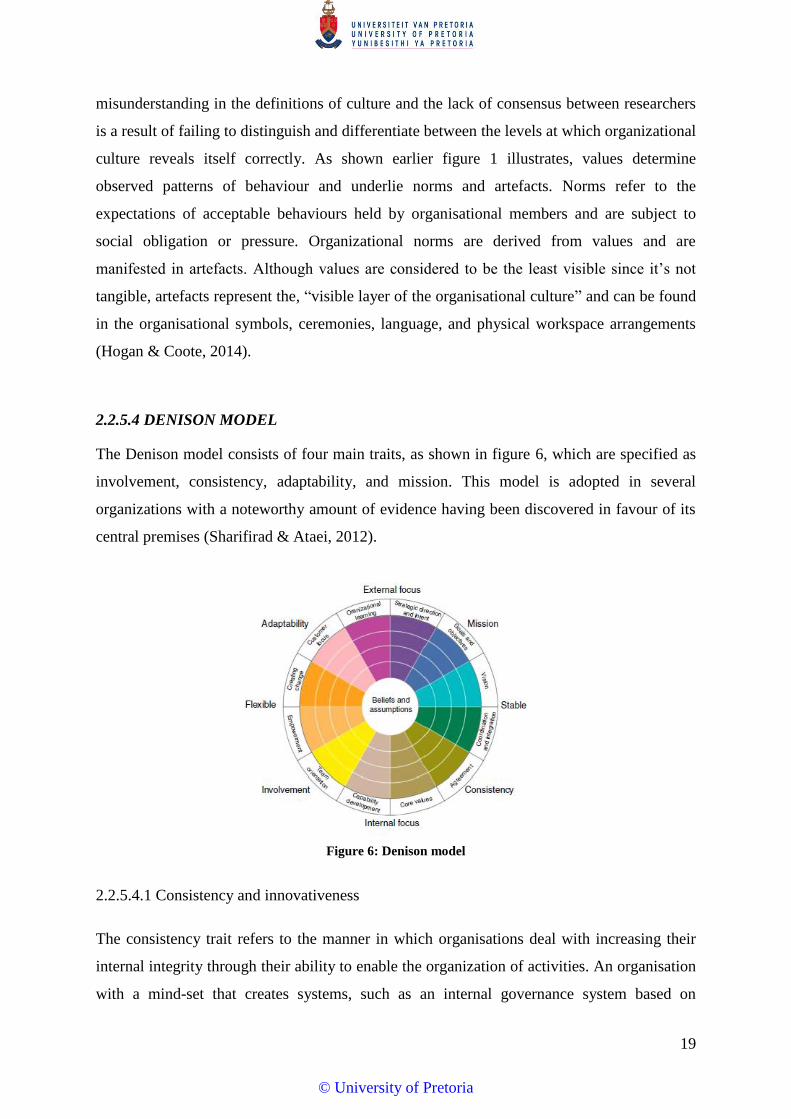
2.2.5.4 DENISON MODEL
The Denison model consists of four main traits, as shown in figure 6, which are specified as
involvement, consistency, adaptability, and mission. This model is adopted in several
organizations with a noteworthy amount of evidence having been discovered in favour of its
central premises (Sharifirad & Ataei, 2012).
Figure 6: Denison model
2.2.5.4.1 Consistency and innovativeness
The consistency trait refers to the manner in which organisations deal with increasing their
internal integrity through their ability to enable the organization of activities. An organisation
with a mind-set that creates systems, such as an internal governance system based on
© University of Pretoria
20
consensual support, is considered consistent. The consistency trait take into consideration the
core values, agreement and coordination as well as integration within the organisation
(Sharifirad & Ataei, 2012). High scores in this trait means sharing a set ability to reach
consensus on key issues and settle on differences when they happen (Sharifirad & Ataei,
2012).
2.2.5.4.2 Adaptability
Organisations considered adaptable, transform the changing needs of the organizational
environment into executable tasks. They tend to be risk-taking with a learning culture where
past learning is critical and have the competence and experience to generate change
(Sharifirad & Ataei, 2012).
2.2.5.4.3 Mission
The mission trait relates to the organisations sense of a shared purpose together with direction
that informs goals and strategic intents which articulates a vision for the organisations future
state. It places importance on stability, direction and takes into consideration the impact of
the organisation on the world (Sharifirad & Ataei, 2012).
2.2.6 ORGANISATIONAL CULTURE AS A COMPETITIVE ADVANTAGE
Most recent literature has migrated from a resource based view - resources offer a
competitive advantage to an organization if they assist in, “confronting environmental threats,
are rare in the competitive marketplace and cannot be easily imitated or substituted for by
competitors” (VRIO) – to a dynamic capabilities view (Klein, 2011). Dynamic capabilities
refer to an “organisations ability to incorporate, build and redistribute internal and external
competences to address fast changing environments” (Li & Liu, 2014).
Organization’s culture can be regarded as both an internal resource and a dynamic capability.
From a strategy perspective culture can be utilised for its potential strategic value, since it is
regarded as a complicated internal social phenomenon that is difficult to replicate and has
unique characteristics or dimensions. Organisational resources such as trust, reputation,
collaboration, teamwork, and friendship are considered socially complex assets. These
© University of Pretoria
21
dimensions are difficult to replicate and could be beneficial to managers because they could
lead to the development of that function as an influential and supporting capability that takes
advantage of environmental opportunities and threats (Klein, 2011).
2.2.7 ORGANISATIONAL CULTURE CONCLUSIONS
A number of different studies have been conducted over the past two decades with the aim to
understand organisational culture at a deeper level. This highlights the longevity and
relevance of culture as a factor to be considered in modern business society. In addition to
this, the culture models developed in the early 90’s on culture continue to be used in present
day culture investigations. This once again proves the robustness and relevance of these
models in modern business. Both of these revelations from literature provide sufficient
confirmation that this study is of critical relevance and could make a significant contribution
to the already existing body of knowledge.
2.3 STRATEGY
Strategy is derived from the Greek word ‘strategos,’ meaning ‘general in command of an
army’. In the 1950s the study of strategy as a concept integrated with business management
gained traction when the Ford Foundation and Carnegie Corporation subsidized research into
the programmes of schools of business administration (Ronda-Pupo & Luis A´ Ngel Guerras-
Martin, 2012).
2.3.1 STRATEGIC MANAGEMENT
Strategic management is defined as a management system that links decision making as well
as long term strategic planning with the tactical day-to-day business of operational
management. Strategic management is more than the creation and evolution of a strategic
plan. It is also the distribution and execution of the strategic plan and measurement and
evaluation of the results.
2.3.2 STRATEGIC MANAGEMENT APPROACH
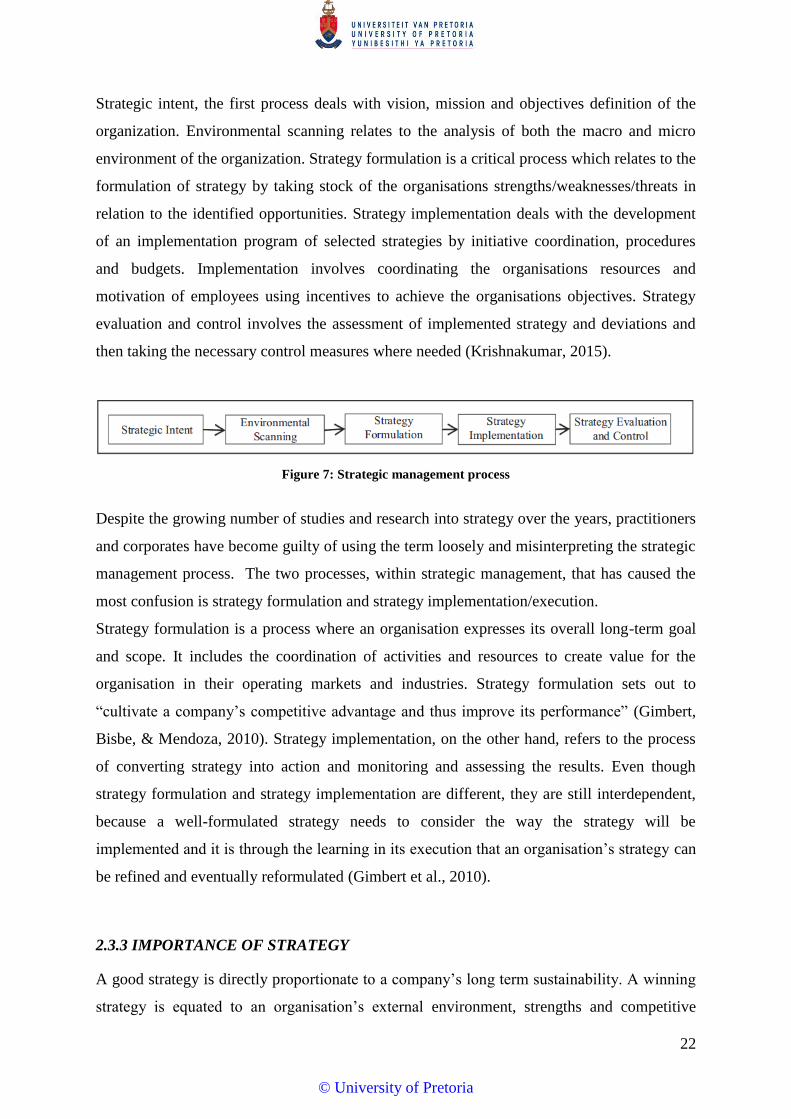
The strategic management approach comprises of five sub-processes, as shown in Fig. 6,
which according to Krishnakumar (2015), includes “strategic intent, environmental scanning,
strategy formulation, strategy implementation/execution and strategy evaluation and control”.
© University of Pretoria
22
Strategic intent, the first process deals with vision, mission and objectives definition of the
organization. Environmental scanning relates to the analysis of both the macro and micro
environment of the organization. Strategy formulation is a critical process which relates to the
formulation of strategy by taking stock of the organisations strengths/weaknesses/threats in
relation to the identified opportunities. Strategy implementation deals with the development
of an implementation program of selected strategies by initiative coordination, procedures
and budgets. Implementation involves coordinating the organisations resources and
motivation of employees using incentives to achieve the organisations objectives. Strategy
evaluation and control involves the assessment of implemented strategy and deviations and
then taking the necessary control measures where needed (Krishnakumar, 2015).
Figure 7: Strategic management process
Despite the growing number of studies and research into strategy over the years, practitioners
and corporates have become guilty of using the term loosely and misinterpreting the strategic
management process. The two processes, within strategic management, that has caused the
most confusion is strategy formulation and strategy implementation/execution.
Strategy formulation is a process where an organisation expresses its overall long-term goal
and scope. It includes the coordination of activities and resources to create value for the
organisation in their operating markets and industries. Strategy formulation sets out to
“cultivate a company’s competitive advantage and thus improve its performance” (Gimbert,
Bisbe, & Mendoza, 2010). Strategy implementation, on the other hand, refers to the process
of converting strategy into action and monitoring and assessing the results. Even though
strategy formulation and strategy implementation are different, they are still interdependent,
because a well-formulated strategy needs to consider the way the strategy will be
implemented and it is through the learning in its execution that an organisation’s strategy can
be refined and eventually reformulated (Gimbert et al., 2010).
2.3.3 IMPORTANCE OF STRATEGY
A good strategy is directly proportionate to a company’s long term sustainability. A winning
strategy is equated to an organisation’s external environment, strengths and competitive
© University of Pretoria

23
capabilities of internal resources, ability to sustain competitive advantage, performance of the
organisation. A winning strategy also allows the company to continue growing regardless of
economic and markets fluctuations/changes. An organisation winning or losing in the
marketplace is directly impacted by the superiority of the organisation’s strategy as well as
the capability with which the strategy is implemented (Miller, Eisenstat, & Foote, 2002).
2.4 STRATEGY EXECUTION
2.4.1 DEFINITION OF STRATEGY EXECUTION
Strategy execution, also known as strategy implementation in literature, has been an unclear
term and the boundaries of the subject are indistinct. Strategy execution is the process
through which the organisation indirectly manipulates the pattern of resource and market
interactions within its environment in order to achieve its overall goals. Strategy execution
involves the use of frameworks to achieve an organization’s overall objective (MacLennan,
2010).
Strategies normally fail on execution due to the fact that managers think about execution
from tactical perspective and thus delegate it onto subordinates while they focus on other
bigger issues. Execution involves much more than just tactics — it is a discipline and a
system. Strategy execution must be integrated into company’s strategy, goals, and most
importantly culture. It is also critical for leaders of the organisation to be deeply involved
with the execution such that an example of accountability is set. According to Bossidy,
Charan, & Burck (2011), execution which is about getting things done requires a distinct set
of behaviours and techniques organisations need to master in order to have competitive
advantage.
2.4.2 DIMENSIONS AFFECTING STRATEGY EXECUTION
Several factors contribute to a company’s success or failure during strategy execution;
however some factors have a greater impact on success or failure than others. These factors
that significantly impact strategy execution include the absence of effective leadership,
suitable organizational alignment, and suitable technology. Additionally, the lack of
performance measurement that leads to continuous improvement can also hinder strategy
execution (Patten, 2015).
© University of Pretoria
24
Beer & Eisenstat (2000), identified six killers of strategy execution defined below as follows:
(Crittenden & Crittenden, 2008)
1. “Top-down or laissez-fair senior management style”,
2. “Unclear strategy and conflicting priorities”,
3. “An ineffective senior management team”,
4. “Poor vertical communication”,
5. “Poor coordination across functions, businesses, or borders”, and
6. “Inadequate down-the-line leadership skills and development”
The idea behind the six killers of execution is that managers who confront these killers
instead of avoiding them or using managerial replacement techniques, could overcome them
and therefore allow for a capable organization (Crittenden & Crittenden, 2008).
From an overall perspective, organisations lack the knowhow with respect to transforming
strategy into an implementation process that assures accountability and is able to keep up
with an ever changing business environment. Organisations which are cognisant of any
strategy execution inhibiting and driving dimensions can develop methods to maximize the
whole strategic management process and increase the chances of the organization achieving
its goals (Patten, 2015). After an extensive review of the dimensions driving strategy
execution, what follows is what the author found to be the key dimensions driving the
successful execution of strategy:
Coordination - Successful strategy execution requires good coordination within the
organisation. Coordination refers to the participation and collaboration between
members within the organisation’s labour force, whether the implementation involves
the expansion of a product line, new product development, or the merger and
acquisition of a new company to enable the organisation to remain relevant in the
marketplace. (Crittenden & Crittenden, 2008). Achieving good coordination can be a
complex matter for many organisations but is important for execution success (L.
Hrebiniak, 2005; Schaap, 2012; Beer & Eisenstat, 2000).
Information sharing - Successful strategy execution requires good sharing of
information. Information sharing can take the form of knowledge transfer but it is
important to maintain a clear line of responsibility and accountability. Good
© University of Pretoria

25
information sharing should be a rule instituted across organizational business units
since it is a vital ingredient for good coordination. Complex strategies are usually
founded on three principles that are good information sharing, coordination and
cooperation. The deployment of critical information is usually made easier when there
is no confusion of roles and responsibilities between members within the organisation
(Hrebiniak, 2006; Patten, 2015).
Competence - Successful strategy execution requires the development of world class
capabilities or competencies that lead to organisations developing a sustainable
competitive advantage and could be applied across numerous business functions
(Pryor, Anderson, Toombs, & Humphreys, 2007). In understanding competencies, the
concept of core competencies was developed. Core competency refers to what an
organisation does best along the dimensions of people, management practices,
processes, systems, technology, and customer relationships (Kaplan, 2005;
Radomska, 2014)
Employee’s Commitment - Successful strategy execution requires employee
commitment regardless of management level. Employee commitment refers to the
degree to which employees are determined to see the strategy successfully executed,
ultimately becoming part of the organization. In most organisations it has been
observed that the emphasis with respect to employee commitment has been placed on
gaining commitment to “how things are done”; little emphasis has been placed on
gaining commitment to “what is done”. (Parnell, 2008; Okumus, 2006)
Leadership - Successful strategy execution requires effective leadership to implement
strategic initiatives, reinforce the strategy with lower employee levels, allocate
resources to the strategic initiatives, deal effectively with resistance to the strategic
changes and influence the mind-set of employees to buy into the strategic change
since it may be imperative for the organisations survival and in the employees' best
interests to support the strategic change (O’Reilly, Caldwell, Chatman, Lapiz, & Self,
2010; Rajasekar & Khoud, 2014).
Change - Successful strategy implementation requires strategic changes/change
management to be done very fast and very often within a short period of time.
Strategy execution is a continuous, dynamic, never-ending, integrated and interactive
process requiring continuous reassessment and reformulation. Therefore it requires
© University of Pretoria

26
change strategies which are robust in gaining the confidence and support of
employees which is needed to make the change a reality (Krishnakumar, 2015).
Structure - Successful strategy execution requires good organisational structures and
managerial skills. Structural variables of an organisation include the actual design of
the organisation, the management levels, controls and procedures, etc. These variables
combined provide a framework in which companies operate effectively. Structural
variables offer an execution toolkit for highlighting key levers that could affect the
formulation-implementation process. Strategies are cascaded and implemented
through the organisational structure (Olson, Slater, & Hult, 2005; Bonoma &
Crittenden, 1988)
A good rewards system. Reward systems are an important part of strategy execution
since it motivates employees to contribute their best. Reward systems play an
important role in developing, “commitment, loyalty and interest” in employees and
must not be underestimated. The effectiveness of a reward system can be judged on
the willingness of employees to move beyond their day-to-day jobs and voluntarily
commit to implement strategic initiatives to the best of their abilities. Therefore, it is
imperative for organisations to link rewards to successful strategy execution processes
(Shah, 2005; Schaap, 2012).
Performance - Successful strategy implementation requires a performance process. A
focus of setting goals and measuring those critical success factors that assures goal
attainment and strategy execution. These performance goals need to stretch people
reflecting the ever changing competitive landscape that organisations are expected to
operate in (Schneier, Shaw, & Beatty, 1991).
2.4.3 STRATEGY EXECUTION FRAMEWORKS
Shown below is a list of well popularised strategy execution frameworks that have become
widely used management tools. It is important to note that these frameworks mimic very
closely the strategy execution dimensions that have been explained and extensively
researched above.
2.4.3.1 McKinsey 7s
In search for business excellence McKinsey partners Tom Peters and Robert Waterman
developed and introduced the business world to the, “7-S model”. The model, describes the
© University of Pretoria

27
seven key factors that are considered to be critical for effective strategy execution (Kaplan,
2005).
1. Strategy – refers to the strategic position, choices and actions taken by an organisation
to manage the changes in the external environment. The strategy is generally
speaking, intended to achieve competitive advantage (Kaplan, 2005).
2. Structure – refers to the manner in which tasks and people within an organisation are
divided, specialized, power is distributed; activities grouped, reporting relationships
defined and the tools and processes by which tasks and activities are organised
(Kaplan, 2005).
3. Systems – refers to the procedures and controls which are used to manage the
organization. Systems in an organisation can include performance measurement,
management control systems, planning and budgeting systems and reward systems
(Kaplan, 2005).
4. Staff – refers to the background and competencies of the employees in the
organisation. Also includes aspects of recruitment, selection, training, socialising,
career management and promotion (Kaplan, 2005).
5. Skills – refers to the core competencies within the organization. Core competency
refers to what an organisation performs best at such as people management, processes,
systems, technology and customer relationships (Kaplan, 2005).
6. Style/Culture – refers to the leadership style of managers ie, their time management,
prioritisation of tasks, dialogue with employees and decision making capabilities. The
organizational culture on the other hand refers to the core values, beliefs and norms,
as well as the, “conscious and unconscious symbolic” acts taken by leaders (Kaplan,
2005).
7. Shared values – refers to the core values that are widely shared in the organization
and serve as, “guiding principles of what is important; vision, mission, and values
statements that provide a broad sense of purpose for all employees” (Kaplan, 2005).
The 7-S model hypothesises that an integrated co-ordination among three ‘‘hard’’ ‘‘S’s’’ of
strategy, structure, and systems, and four ‘‘soft’’ ‘‘S’s’’ of skills, staff, style, and shared
values will lead to a successful strategy execution for the organisation. The 7-S model
continues to “remain valid in present day and is used in practice and in business school
teaching as a diagnostic and prescriptive framework for organizational alignment” (Kaplan,
2005).
© University of Pretoria

28
2.4.3.2 BALANCED SCORECARD MODEL
Dave Norton and Kaplan introduced the balanced scorecard (BSC) model about 10 years post
the introduction of the 7-S model by Peters and Waterman. The BSC was considered to be a
quantification tool for strategy execution which organises performance objectives and
measures into four perspectives:
1. The financial perspective (Kaplan, 2005) comprises of traditional financial
measurements which are regarded as tangible outcomes of the strategy. Traditional
financial measurements are EBITDA, return on net assets, return on investment
(ROI), profitability, cost of goods sold and revenue (Kaplan, 2012).
2. The customer perspective (Kaplan, 2005) defines the key factors influencing revenue
growth. It includes customer performance measurements, such as customer
acquisition, growth, retention and satisfaction as well as the compelling value
proposition that the organization expects to attract new sales and loyalty (Kaplan,
2012).
3. The internal process perspective (Kaplan, 2005) “identifies the operating, customer
management, innovation, regulatory and social process objectives for creating and
delivering the customer value proposition and improving the quality and productivity
of operating processes” (Kaplan, 2012).
4. The learning and growth perspective (Kaplan, 2005) identifies the “intangible assets”
that are considered to be critical to the strategy. The objectives in this perspective
“identify which jobs (the human capital), which systems (the information capital) and
what kind of climate (the organization capital) is required to support the value
creating internal processes” (Kaplan, 2012).
The scorecard is used as a communication tool by organisations and aims to describe the
organisational strategy. It is also used to align business units with headquarters, to define
strategic initiative priorities and to report on the progress of the execution of the strategy
(Kaplan, 2012).
© University of Pretoria

29
2.4.3.3 EIGHT S MODEL
The 8 ‘S’s model uses the 7 ‘S’s model as a basis but differentiates itself in two primary
ways:
Skills have been replaced by resources. Skills are regarded to be of high importance
since an organisational strategy cannot be successfully executed without organising
additional resources such as capital, people, information, technology and time (Bhatti,
2011).
o People; technology and capital are considered the three most important
resources which must be of an adequate level to allow organisations to achieve
its strategy successfully. Resources may include capital funding for research
and development departments or technology platforms, or learning and
development systems. Organisations can leverage their resources to gain
competitive advantage in the marketplace (Bhatti, 2011).
An eighth ‘S’, Strategic Performance, has been added. Strategic performance allows
management to focus on the outcomes of the strategy since this is what really matters.
It can also be for defining and setting strategic objectives to measuring results
(Bhatti, 2011).
2.4.3.4 NEILSON STEPS TO STRATEGY EXECUTION MODEL
Neilson highlighted four key pillars that executives can utilise to influence strategic execution
– “clarifying decision rights, designing information flows, aligning motivators and making
changes to structure” (Martin & Powers, n.d.).
Neilson identified a list of 17 traits that are considered to be most effective in enabling an
organization to implement strategy (shown in Table. 2). Traits include information sharing
across organizational boundaries and the extent to which senior leaders avoid involvement in
operating decisions (Martin & Powers, n.d.). Table 2 below shows the findings, in terms of
strength of a trait towards strategy execution, from several organisations around the world:
© University of Pretoria
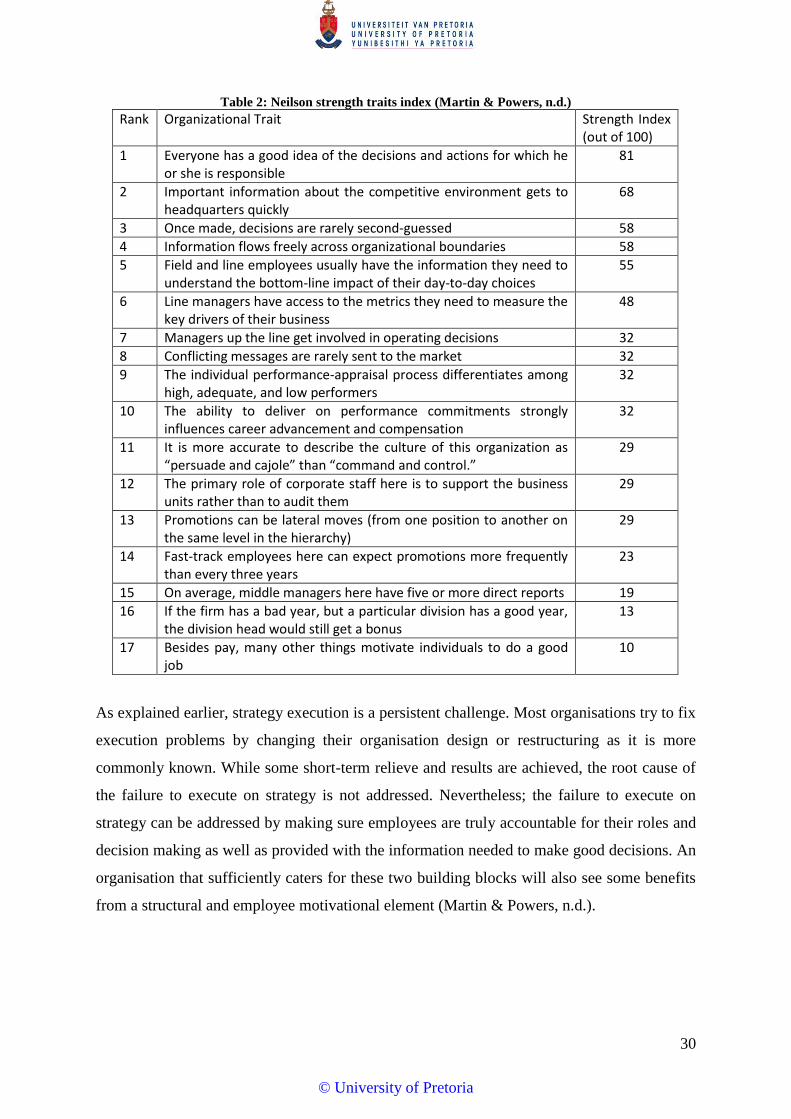
30
Table 2: Neilson strength traits index (Martin & Powers, n.d.)
As explained earlier, strategy execution is a persistent challenge. Most organisations try to fix
execution problems by changing their organisation design or restructuring as it is more
commonly known. While some short-term relieve and results are achieved, the root cause of
the failure to execute on strategy is not addressed. Nevertheless; the failure to execute on
strategy can be addressed by making sure employees are truly accountable for their roles and
decision making as well as provided with the information needed to make good decisions. An
organisation that sufficiently caters for these two building blocks will also see some benefits
from a structural and employee motivational element (Martin & Powers, n.d.).
Rank Organizational Trait Strength Index (out of 100)
1 Everyone has a good idea of the decisions and actions for which he or she is responsible
81
2 Important information about the competitive environment gets to headquarters quickly
68
3 Once made, decisions are rarely second-guessed 58
4 Information flows freely across organizational boundaries 58
5 Field and line employees usually have the information they need to understand the bottom-line impact of their day-to-day choices
55
6 Line managers have access to the metrics they need to measure the key drivers of their business
48
7 Managers up the line get involved in operating decisions 32
8 Conflicting messages are rarely sent to the market 32
9 The individual performance-appraisal process differentiates among high, adequate, and low performers
32
10 The ability to deliver on performance commitments strongly influences career advancement and compensation
32
11 It is more accurate to describe the culture of this organization as “persuade and cajole” than “command and control.”
29
12 The primary role of corporate staff here is to support the business units rather than to audit them
29
13 Promotions can be lateral moves (from one position to another on the same level in the hierarchy)
29
14 Fast-track employees here can expect promotions more frequently than every three years
23
15 On average, middle managers here have five or more direct reports 19
16 If the firm has a bad year, but a particular division has a good year, the division head would still get a bonus
13
17 Besides pay, many other things motivate individuals to do a good job
10
© University of Pretoria
31
2.4.3.5 STRATEGY EXECUTION CONCLUSIONS
Similarly to the organisational culture findings and conclusions, the strategy execution
literature provides confirmation with respect to the relevance of the subject matter in the
sense that strategy execution is a matter that businesses in present still day grapple with.
Strategy execution models such as the McKinsey 7S and the Balanced Scorecard continue to
be used by organisations worldwide; once again confirming the relevance of these models in
modern business society and thereby implying that this research could make a significant
contribution to the already existing body of knowledge.
2.5 ORGANISATIONAL CULTURE AND STRATEGY EXECUTION
2.5.1 INTRODUCTION
Several authors advocate organisational culture is essential for sustained organisational
performance. Organisational performance is demonstrated by the achievement of the
organisations goals or key performance indicators (Heesen, 2015). These organisational goals
or key performance indicators form a subset of the strategic management process and
evaluates how well the organisation is turning their strategy into actions that grow and sustain
the organisation. As explained earlier the process of turning/transforming/converting strategy
into action is referred to as strategy execution or strategy implementation. Thus by virtue of
the integrated nature between organisational performance and strategy execution; it can be
theorised that organisational culture is crucially essential for strategy execution (Ahmadi et
al., 2012).
The extent, of which organization performance and strategy execution is related to
organization culture is reliant on how well culture is integrated into the organisation and the
effective set of values, beliefs and behaviours in the organisation. Some researchers suggest
that the culture link with superior performance is dependent on the organisations ability to
adapt their culture to changes in environmental conditions. Culture in addition to this must
not only be extensively shared but must also have distinct qualities which cannot be imitated
(Rose, 2008).
© University of Pretoria
32
2.5.2 REVIEW OF THE LINK BETWEEN ORGANISATIONAL CULTURE AND
STRATGEY EXECUTION
Several studies have generally accepted the notion that organizational culture has a positive
relationship with organizational performance and hence strategy execution (Yesil & Kaya,
2013). There are two schools of thought when it comes to the impact of organisational culture
on performance and strategy execution, though research is fairly limited, the first that has
been theorised is that there are particular dimensions of culture which are linked to
performance (Cheung, Wong, & Lam, 2012) and strategy execution and the second is that
certain types of organisational culture are linked to improved performance and strategy
execution (Ahmadi et al., 2012). The section below, though research is fairly limited, aims to
explain the organisational culture dimensions that are regarded as beneficial to enhancing
organisational performance and executing strategy. The following section, which seems to be
better researched, aims to explain the organisational culture types that are regarded as
beneficial to enhancing organisational performance and strategy execution.
2.5.2.1 ACHIEVEMENT AND STRATEGY EXECUTION
The cultural dimension of achievement from an overall perspective refers to the extent to
which an organisation principles itself on success, aims for highest standards in performance
and supports the implementation of challenging goals which encourages employees to stretch
themselves to excel (R. House et al., 2001). An organisation valuing the cultural dimension of
achievement also encourages rewards to employees for excellent performance towards
strategy execution (Alamsjah, 2011).
This dimension of organisational culture, achievement, is directly linked to performance and
strategy execution since it creates a sense of ownership in relation to organisational goal
among employees (R. J. House et al., 2004). This sense of ownership increases the
employee’s own performance expectations as well as enhances intrinsic motivation and
feelings of self-efficacy thus, driving employees to work towards the successful achievement
of the organisation’s strategy (Alamsjah, 2011). Organisations placing high value on the
cultural dimension of achievement also create an environment that motivates employees to
find solutions to enable strategy execution even though market conditions may be tough. This
also plays to the element of innovation which many researchers consider a core element to
strategy execution. The aspect of monetary of rewards is often a sweetener to employees to
© University of Pretoria

33
keep them striving through the hardships of executing the strategy but more importantly gives
the employee the recognition deserved for a job well done.
In summary, the cultural dimension of achievement is undoubtedly linked to organisational
performance and strategy. It is one of the most important aspects that speak to employees’
inherent need to be successful and promotes this need to ensure delivery of organisational
goals while rewarding success in a manner so that employees feel recognised and
appreciated.
2.5.2.1 FUTURE PLANNING AND STRATEGY EXECUTION
The cultural dimension of future planning refers to the extent to which an organisation values
proactive-ness and initiative towards planning and investing for the future success of the
organisation (R. J. House et al., 2004). An organisation valuing the cultural dimension of
future also encourages employees to assume responsibility and accountability for their
decisions and actions at present and how it will impact the strategy execution process which
aims to define the future state of the organisation (R. J. House et al., 2004).
This dimension of organisational culture, future planning, is directly linked to performance
and strategy execution since it creates an environment which takes careful consideration in
making sound decisions with accurate information to ensure the sustainability and success of
the organisation in the future (L. Hrebiniak, 2005). Information accuracy and decision
making are two very important elements needed for good strategy execution. Organisations
placing high value on the cultural dimension of future planning tend to take full stock of
current conditions and how they affect future business and industry trends. This creates a
better understanding of how trends impact and could possibly change the organisational
strategy created and hence the execution thereof.
In summary, the cultural dimension of future planning is undoubtedly linked to organisational
performance and strategy. It is an important aspect that relates to creating an environment
that carefully consider decisions in the present, and plan for the future sustainability of the
organisation taking into account accurate information and business trends. Both of which are
critical to successfully executing organisational strategy.
© University of Pretoria
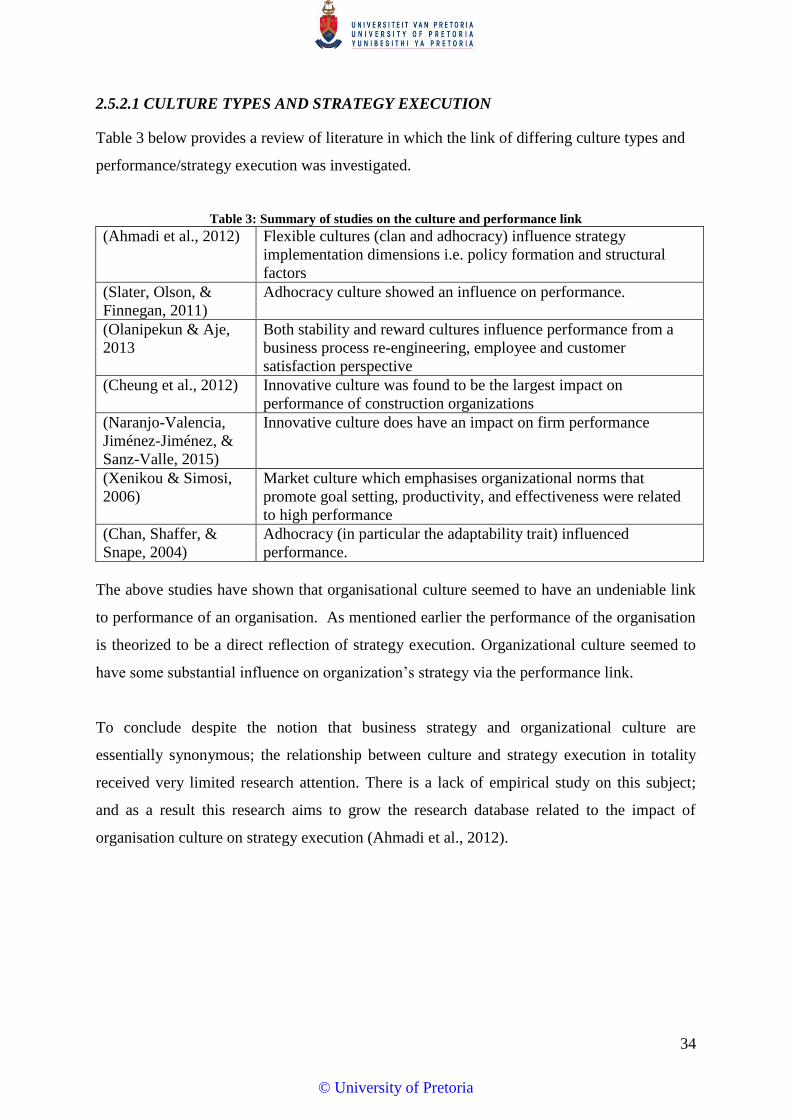
34
2.5.2.1 CULTURE TYPES AND STRATEGY EXECUTION
Table 3 below provides a review of literature in which the link of differing culture types and
performance/strategy execution was investigated.
Table 3: Summary of studies on the culture and performance link
(Ahmadi et al., 2012) Flexible cultures (clan and adhocracy) influence strategy
implementation dimensions i.e. policy formation and structural
factors
(Slater, Olson, &
Finnegan, 2011)
Adhocracy culture showed an influence on performance.
(Olanipekun & Aje,
2013
Both stability and reward cultures influence performance from a
business process re-engineering, employee and customer
satisfaction perspective
(Cheung et al., 2012) Innovative culture was found to be the largest impact on
performance of construction organizations
(Naranjo-Valencia,
Jiménez-Jiménez, &
Sanz-Valle, 2015)
Innovative culture does have an impact on firm performance
(Xenikou & Simosi,
2006)
Market culture which emphasises organizational norms that
promote goal setting, productivity, and effectiveness were related
to high performance
(Chan, Shaffer, &
Snape, 2004)
Adhocracy (in particular the adaptability trait) influenced
performance.
The above studies have shown that organisational culture seemed to have an undeniable link
to performance of an organisation. As mentioned earlier the performance of the organisation
is theorized to be a direct reflection of strategy execution. Organizational culture seemed to
have some substantial influence on organization’s strategy via the performance link.
To conclude despite the notion that business strategy and organizational culture are
essentially synonymous; the relationship between culture and strategy execution in totality
received very limited research attention. There is a lack of empirical study on this subject;
and as a result this research aims to grow the research database related to the impact of
organisation culture on strategy execution (Ahmadi et al., 2012).
© University of Pretoria
35
CHAPTER 3
RESEARCH PROBLEM
Based on the research objectives described in Chapter 1 together with the literature review
presented in Chapter 2, the following research questions and hypotheses were developed.
At a high level, the research objective seeks to determine the influence or effect of
organisational culture on strategy execution.
3.1 PRIMARY RESEARCH OBJECTIVE
The primary objective of the research was:
Objective 1: To determine the effect of the dimensions of organisational culture on the
dimensions of strategy execution
Hypothesis 1
H01: There is no association (variables are independent) between culture dimensions
(uncertainty avoidance, gender egalitarianism, assertiveness, institutional collectivism, in-
group collectivism (Minkov & Blagoev, 2012), humane orientation, future orientation,
achievement orientation and power distance) (Minkov & Blagoev, 2012) and the strategy
execution dimension of information sharing.
HA1: There is an association between the culture dimensions (uncertainty avoidance,
gender egalitarianism, assertiveness, institutional collectivism, in-group collectivism
(Minkov & Blagoev, 2012), humane orientation, future orientation, achievement
orientation and power distance) (Minkov & Blagoev, 2012) and the strategy execution
dimension of information sharing.
Hypothesis 2
H02: There is no association (variables are independent) between culture dimensions
(uncertainty avoidance, gender egalitarianism, assertiveness, institutional collectivism,
in-group collectivism (Minkov & Blagoev, 2012), humane orientation, future orientation,
achievement orientation and power distance) (Minkov & Blagoev, 2012) and the strategy
execution dimensions of leadership.
© University of Pretoria
36
HA2: There is an association between the culture dimensions (uncertainty avoidance,
gender egalitarianism, assertiveness, institutional collectivism, in-group collectivism
(Minkov & Blagoev, 2012), humane orientation, future orientation, achievement
orientation and power distance) (Minkov & Blagoev, 2012) and the strategy execution
dimensions of leadership.
Hypothesis 3
H03: There is no association (variables are independent) between culture dimensions
(uncertainty avoidance, gender egalitarianism, assertiveness, institutional collectivism,
in-group collectivism (Minkov & Blagoev, 2012), humane orientation, future orientation,
achievement orientation and power distance) (Minkov & Blagoev, 2012) and the strategy
execution dimension of rewards.
HA3: There is an association between the culture dimensions (uncertainty avoidance,
gender egalitarianism, assertiveness, institutional collectivism, in-group collectivism
(Minkov & Blagoev, 2012), humane orientation, future orientation, achievement
orientation and power distance) (Minkov & Blagoev, 2012) and the strategy execution
dimension of rewards.
Hypothesis 4
H04: There is no association (variables are independent) between culture dimensions
(uncertainty avoidance, gender egalitarianism, assertiveness, institutional collectivism,
in-group collectivism (Minkov & Blagoev, 2012), humane orientation, future orientation,
achievement orientation and power distance) (Minkov & Blagoev, 2012) and strategy
execution dimension of performance.
HA4: There is an association between the culture dimensions (uncertainty avoidance,
gender egalitarianism, assertiveness, institutional collectivism, in-group collectivism
(Minkov & Blagoev, 2012), humane orientation, future orientation, achievement
orientation and power distance) (Minkov & Blagoev, 2012) and strategy execution
dimension of performance.
Hypothesis 5
H05: There is no association (variables are independent) between culture dimensions
(uncertainty avoidance, gender egalitarianism, assertiveness, institutional collectivism,
© University of Pretoria
37
in-group collectivism (Minkov & Blagoev, 2012), humane orientation, future orientation,
achievement orientation and power distance) (Minkov & Blagoev, 2012) and the strategy
execution dimension of structure.
HA5: There is an association between the culture dimensions (uncertainty avoidance,
gender egalitarianism, assertiveness, institutional collectivism, in-group collectivism
(Minkov & Blagoev, 2012), humane orientation, future orientation, achievement
orientation and power distance) (Minkov & Blagoev, 2012) and the strategy execution
dimension of structure.
Hypothesis 6
H06: There is no association (variables are independent) between culture dimensions
(uncertainty avoidance, gender egalitarianism, assertiveness, institutional collectivism,
in-group collectivism (Minkov & Blagoev, 2012), humane orientation, future orientation,
achievement orientation and power distance) (Minkov & Blagoev, 2012) and the strategy
execution dimension of employee commitment 1.
HA6: There is an association between the culture dimensions (uncertainty avoidance,
gender egalitarianism, assertiveness, institutional collectivism, in-group collectivism
(Minkov & Blagoev, 2012), humane orientation, future orientation, achievement
orientation and power distance) (Minkov & Blagoev, 2012) and the strategy execution
dimensions of employee commitment 1.
Hypothesis 7
H07: There is no association (variables are independent) between culture dimensions
(uncertainty avoidance, gender egalitarianism, assertiveness, institutional collectivism,
in-group collectivism (Minkov & Blagoev, 2012), humane orientation, future orientation,
achievement orientation and power distance) (Minkov & Blagoev, 2012) and the strategy
execution dimension of employee commitment 2.
HA7: There is an association between the culture dimensions (uncertainty avoidance,
gender egalitarianism, assertiveness, institutional collectivism, in-group collectivism
(Minkov & Blagoev, 2012), humane orientation, future orientation, achievement
orientation and power distance) (Minkov & Blagoev, 2012) and the strategy execution
dimension of employee commitment 2.
© University of Pretoria
38
Hypothesis 8
H08: There is no association culture dimensions (uncertainty avoidance, gender
egalitarianism, assertiveness, institutional collectivism, in-group collectivism (Minkov &
Blagoev, 2012), humane orientation, future orientation, achievement orientation and
power distance) (Minkov & Blagoev, 2012) and the strategy execution dimension of
coordination.
HA8: There is an association between culture dimensions (uncertainty avoidance, gender
egalitarianism, assertiveness, institutional collectivism, in-group collectivism (Minkov &
Blagoev, 2012), humane orientation, future orientation, achievement orientation and
power distance) (Minkov & Blagoev, 2012) and the strategy execution dimension of
coordination.
3.2 SECONDARY RESEARCH OBJECTIVE
The secondary objective of the research was:
Investigates which dimension of culture was found to have the highest effect on strategy
execution.
© University of Pretoria
39
CHAPTER 4
RESEARCH METHODOLOGY
Based on the research questions posed in Chapter 3, this chapter describes the way in which the
research was conducted. In particular, it describes the research setting and method, the population
and unit of analysis, the sampling technique, the data collection method, the analysis method, as
well as the assumptions and limitations of the process.
4.1 RESEARCH SETTING
The research was conducted within a large South African company in the FMCG industry.
Through its diverse portfolio of product offerings, the organisation has many operations spread
across multiple geographical regions within South Africa.
The company was founded in 1820 with a rich history spanning more than 195 years and is
entering a new and exciting period in its journey. The past two years have seen a series of
changes where the company moved from the traditional milling and baking business into sugar
confectionery with brands such as Manhattan and Super C as well as home and personal care
with brands such as Lil-Lets, Dove cotton wool and Vulco. The strategic intent is to be a leading
FMCG player in chosen geographies.
The research was conducted within the four management levels of this company i.e. executive
management, senior management, middle management and first line management. This was done
since it is these four lines of management that are predominantly responsible for the cascading of
strategy and execution of strategy within the several business units in the company. The
managers are geographically spread across, South Africa, within all operations and headquarters.
There are over 5000 employees within the company, with a management compliment of 600
people. The majority of the staff is on a non-management level that is located in the milling and
production environment.
© University of Pretoria

40
4.2 METHODOLOGY
As the aim of the research was to describe the effect of organisational culture on strategy
execution, the research methodology used was of a descriptive nature. The research design was
therefore a quantitative design to investigate whether the relationship between organisational
culture and strategy execution are statistically significant for a given population, i.e. the data
obtained was numerical in nature (Saunders & Lewis, 2012). This method can also be described
using the “Research onion”, a metaphor used to describe the layers of the research process
(Saunders & Lewis, 2012). A positivism philosophy using deduction as the approach was used,
with a survey strategy, chosen as a mono method. The data was cross sectional and was then
collected and analysed using statistical techniques.
Figure 8: The research onion
The positivism philosophy is a highly structure research method used to facilitate replication in
the body of knowledge which results in law like generalisation. A deductive approach involves
the testing of a theoretical proposition; this approach was considered since the intent of the
research study is to add more value to the existing body of knowledge and does not specifically
involve the development of theory. From a strategy perspective, due to the quantitative nature of
the study the survey method was selected to be the most suitable research strategy (Saunders &
Lewis, 2012).
© University of Pretoria
41
4.3 RESEARCH PROCESS
As mentioned above a survey research strategy was used where data is collected from a sizeable
population (Saunders & Lewis, 2012). Data collection may take the form of questionnaires,
structured observation and structured interviews (Saunders & Lewis, 2012), and in this study a
mono method was chosen, that is using an online survey questionnaire as the strategy. A survey
was chosen as it allows the collection of data on the same set of standardised statements from a
large sample group, affordably (Saunders & Lewis, 2012).
4.4 POPULATION
The population of the study included all employees in specific management levels of the FMCG
company. The specific management levels (first line managers, middle managers and senior
managers and executives) were selected in order to ensure variance of responses. Formal written
permission was granted from the FMCG Company for the survey. The researcher has a
relationship with the HR Executive of the FMCG Company, who provided a route to facilitate
access to the population and who distributed the online survey to the target population. As the
researcher was able to obtain a complete list of the members of the population, the population
was also the sampling frame (Saunders & Lewis, 2012). The unit of analysis for the study was
organisations management and was therefore the same as the population.
4.5 SAMPLING METHOD
The sampling technique employed was probability sampling (Saunders & Lewis, 2012). The
request to participate in the survey was sent to every member within the sampling frame (all
management employees within the business unit). As a result, the probability of each case being
selected from the sampling frame was equal and known, making the sampling technique a
probability sampling technique (Saunders, Lewis, & Thornhill, 2009).
The probability sampling technique was suited to this particular investigation, as the aim of the
research was to make an inference about the population from the sample in order to confirm or
reject the research hypotheses (Saunders et al., 2009).
© University of Pretoria

42
The population was composed of 600 employees on a management level from all areas of the
FMCG Company.
Table 4: Response rate to survey
Number of people
approached
Number of responses
received
Response
rate
600 281 48%
4.6 MEASUREMENT INSTRUMENT
A questionnaire comprising of three parts shown in Appendix A, was utilised in the study. The
questionnaire contained a demographics, organisation culture and strategy execution section as
shown below in Table 5. (More detail on the organizational culture and strategy execution
questionnaire is explained below). These questionnaires were distributed at the FMCG Company
via an electronic system known as “Survey Monkey”. As a result anonymity of the participants
can be maintained.
Table 5: Questionnaire details
Section Construct Number of items Reliability
(Cronbach) Article
1 Demographics TBC N/A Not applicable
2 Organisation Culture 18 0.77 House, Robert J., et
al., eds. Culture,
leadership, and
organizations: The
GLOBE study of 62
societies. Sage
publications, 2004.
© University of Pretoria
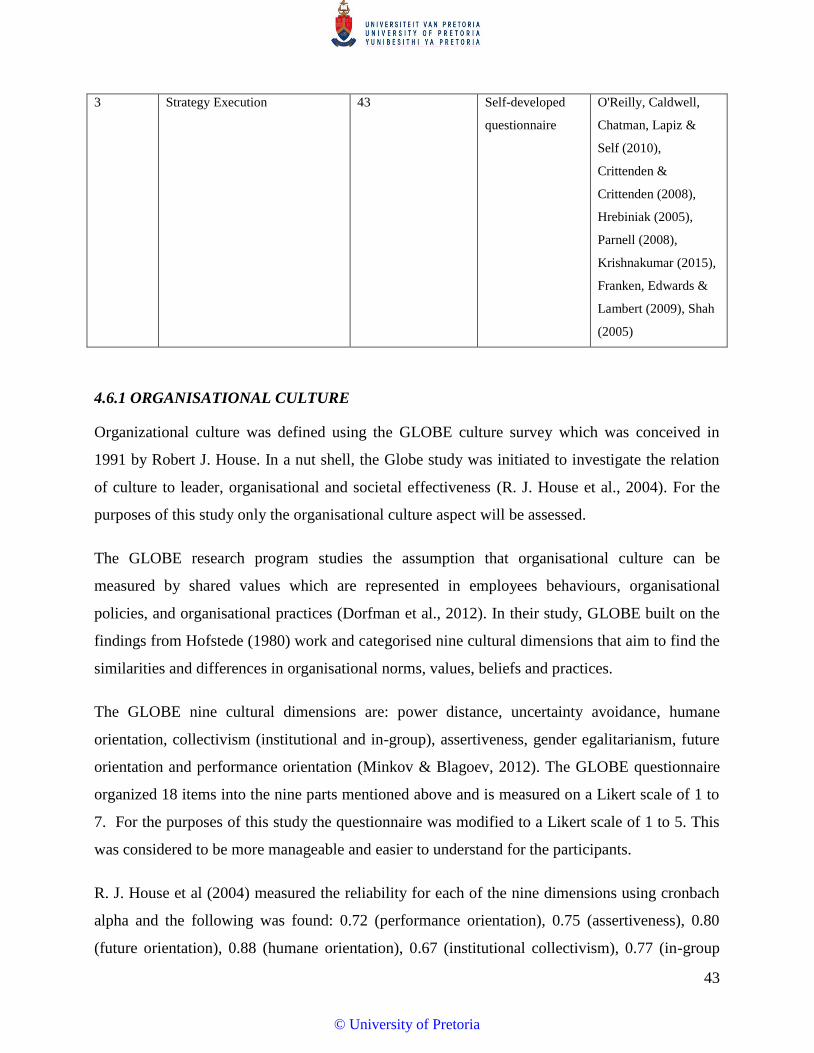
43
3 Strategy Execution 43 Self-developed
questionnaire
O'Reilly, Caldwell,
Chatman, Lapiz &
Self (2010),
Crittenden &
Crittenden (2008),
Hrebiniak (2005),
Parnell (2008),
Krishnakumar (2015),
Franken, Edwards &
Lambert (2009), Shah
(2005)
4.6.1 ORGANISATIONAL CULTURE
Organizational culture was defined using the GLOBE culture survey which was conceived in
1991 by Robert J. House. In a nut shell, the Globe study was initiated to investigate the relation
of culture to leader, organisational and societal effectiveness (R. J. House et al., 2004). For the
purposes of this study only the organisational culture aspect will be assessed.
The GLOBE research program studies the assumption that organisational culture can be
measured by shared values which are represented in employees behaviours, organisational
policies, and organisational practices (Dorfman et al., 2012). In their study, GLOBE built on the
findings from Hofstede (1980) work and categorised nine cultural dimensions that aim to find the
similarities and differences in organisational norms, values, beliefs and practices.
The GLOBE nine cultural dimensions are: power distance, uncertainty avoidance, humane
orientation, collectivism (institutional and in-group), assertiveness, gender egalitarianism, future
orientation and performance orientation (Minkov & Blagoev, 2012). The GLOBE questionnaire
organized 18 items into the nine parts mentioned above and is measured on a Likert scale of 1 to
7. For the purposes of this study the questionnaire was modified to a Likert scale of 1 to 5. This
was considered to be more manageable and easier to understand for the participants.
R. J. House et al (2004) measured the reliability for each of the nine dimensions using cronbach
alpha and the following was found: 0.72 (performance orientation), 0.75 (assertiveness), 0.80
(future orientation), 0.88 (humane orientation), 0.67 (institutional collectivism), 0.77 (in-group
© University of Pretoria
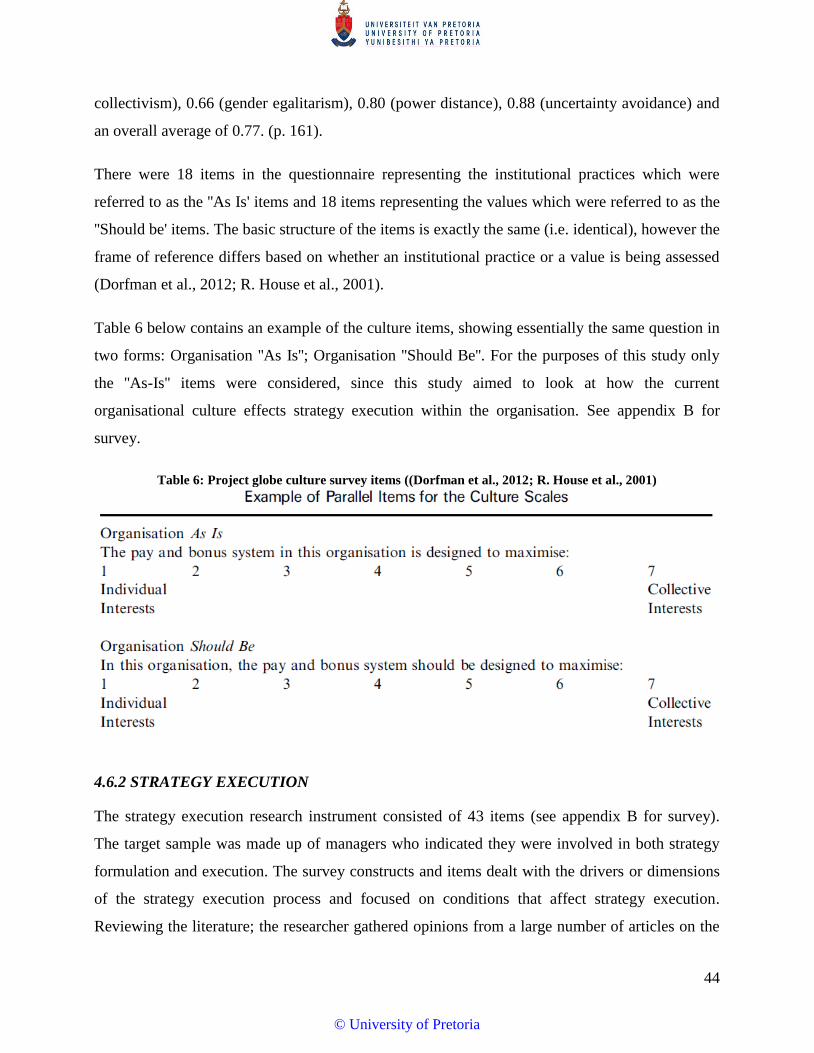
44
collectivism), 0.66 (gender egalitarism), 0.80 (power distance), 0.88 (uncertainty avoidance) and
an overall average of 0.77. (p. 161).
There were 18 items in the questionnaire representing the institutional practices which were
referred to as the ''As Is' items and 18 items representing the values which were referred to as the
''Should be' items. The basic structure of the items is exactly the same (i.e. identical), however the
frame of reference differs based on whether an institutional practice or a value is being assessed
(Dorfman et al., 2012; R. House et al., 2001).
Table 6 below contains an example of the culture items, showing essentially the same question in
two forms: Organisation ''As Is''; Organisation ''Should Be''. For the purposes of this study only
the ''As-Is'' items were considered, since this study aimed to look at how the current
organisational culture effects strategy execution within the organisation. See appendix B for
survey.
Table 6: Project globe culture survey items ((Dorfman et al., 2012; R. House et al., 2001)
4.6.2 STRATEGY EXECUTION
The strategy execution research instrument consisted of 43 items (see appendix B for survey).
The target sample was made up of managers who indicated they were involved in both strategy
formulation and execution. The survey constructs and items dealt with the drivers or dimensions
of the strategy execution process and focused on conditions that affect strategy execution.
Reviewing the literature; the researcher gathered opinions from a large number of articles on the
© University of Pretoria
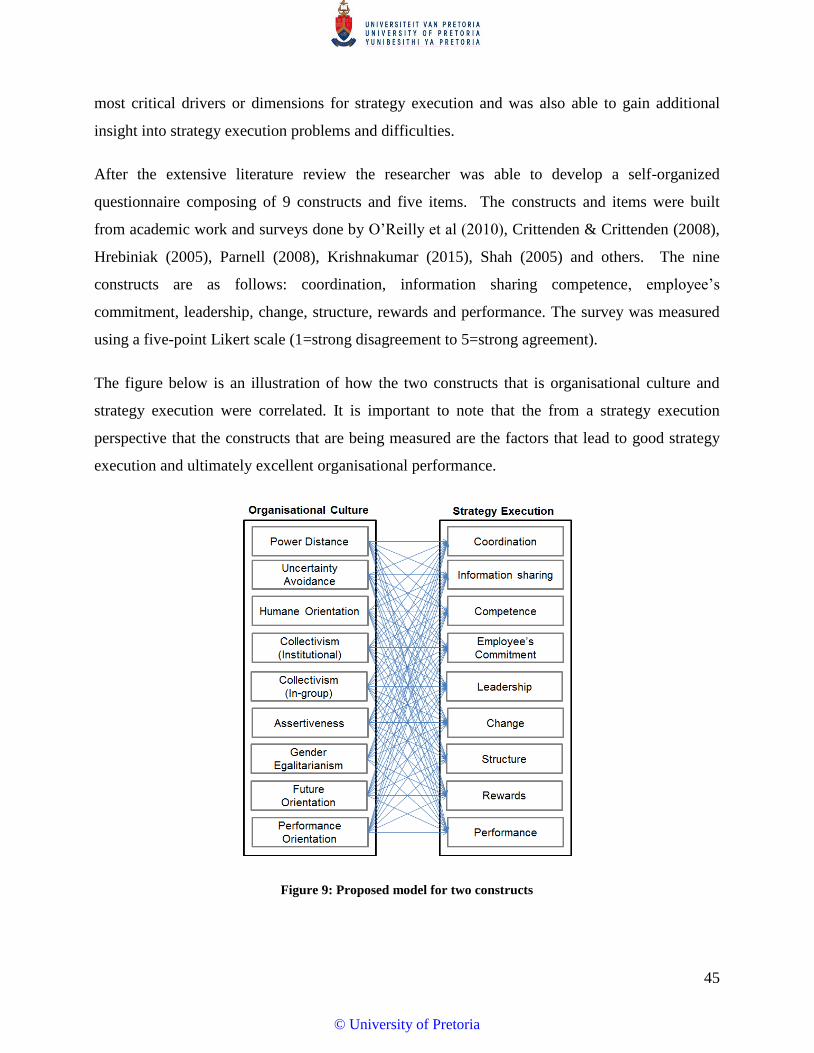
45
most critical drivers or dimensions for strategy execution and was also able to gain additional
insight into strategy execution problems and difficulties.
After the extensive literature review the researcher was able to develop a self-organized
questionnaire composing of 9 constructs and five items. The constructs and items were built
from academic work and surveys done by O’Reilly et al (2010), Crittenden & Crittenden (2008),
Hrebiniak (2005), Parnell (2008), Krishnakumar (2015), Shah (2005) and others. The nine
constructs are as follows: coordination, information sharing competence, employee’s
commitment, leadership, change, structure, rewards and performance. The survey was measured
using a five-point Likert scale (1=strong disagreement to 5=strong agreement).
The figure below is an illustration of how the two constructs that is organisational culture and
strategy execution were correlated. It is important to note that the from a strategy execution
perspective that the constructs that are being measured are the factors that lead to good strategy
execution and ultimately excellent organisational performance.
Figure 9: Proposed model for two constructs
© University of Pretoria

46
4.7 MEASUREMENT INSTRUMENT PRE-TESTING
Pilot testing is used as a "dress rehearsal" testing the survey and is implemented to determine
whether there are any issues that need to be dealt with before the survey has been sent out for the
study (Rothgeb, 2008). The objective is that after addressing the potential issues that are
identified in the pilot test, the amount of non-sampling measurement error produced by the
survey should be reduced (Rothgeb, 2008).
The questionnaire was sent out to three individuals before the official data collection process was
initiated. The purpose of this was to perform pre-testing, whereby spelling, grammar, ease of
understanding and use, as well as functionality of the system was tested. Once these issues were
addressed, the questionnaire was sent out to the entire population.
A general theme between the respondents emerged where it was stated that the organisational
culture section did not need the construct headings to be added in. Since this made the survey
monotonous and it was evident of what the questions were looking for. The construct headings
were removed but the item order remained the same to ensure some level of consistency with the
original GLOBE organisational culture survey.
4.8 DATA COLLECTION AND MANAGEMENT
Survey data using questionnaires can be collected using a number technique which include web,
post, hand, telephone or face to face by an interviewer (Saunders & Lewis, 2012). Data in this
survey was collected by web, through distributing a hyperlink of the web survey via an email
distribution. This method was chosen since the collection of data through the web will allow for
the data to be collated without the need for recapturing, as the other methods would require. A
cut-off date of four weeks was noted on the survey, and the total number of respondents for the
FMCG company was 339 with 41 of these responses incomplete.
© University of Pretoria

47
4.9 RELIABILITY AND VALIDITY
4.9.1 VALIDITY
4.9.1.1 STRATEGY EXECUTION VALIDITY
Due to the fact that the strategy execution survey instrument was self-organised, a validity
analysis needed to be conducted. The validity was conducted using a factor analysis of the 43
items from the strategy execution survey. Comrey & Lee (1992) recommends at least five
observations per variable that is subjected to factor analysis. This recommendation was met in
this study as there were 281 observations or survey responses. The factor analysis was also
possible in this study due to the following: the 43 variables were all in ordinal data, there was a
linear relationship between the variables and all these variables were found to be correlated, with
a minimum of 0.3.
To determine the suitability of factor analysis, a “ΚΜΟ” or Kaiser-Meyer-Olkin and a “Bartlett
test for sphericity” had to be conducted (Sekaran, 2005; Hair, Black, Babin, Anderson, &
Tatham, 2006). KMO measures, “sampling adequacy which compares the sizes of the observed
correlation coefficients to the sizes of the partial correlation coefficients for the sum of analysis
variables” (John E. Exner, 2013). The Bartlett test is an, “indication of the strength of the
relationship among variables” (Pandey, 2016). This tests that the null hypothesis correlation
matrix is an identity matrix. An identity matrix is a matrix in which all of the diagonal elements
are 1 and all off diagonal elements are close to 0 (Pandey, 2016).
For acceptability the KMO test should be higher than 0.6, while the Bartlett test should have a p
<0.0005.
Table 7: KMO and Bartlett’s test for strategy execution
KMO and Bartlett's Test
Kaiser-Meyer-Olkin Measure of Sampling Adequacy. .936
Bartlett's Test of Sphericity Approx. Chi-Square 8528.353
Df 903
Sig. .000
© University of Pretoria

48
As shown in Table 7, the KMO index for sampling adequacy was 0.936, which was above the 0.6
recommendation, while the test of sphericity by the Bartlett test was statistical significance
p<0.0005 for approx. Chi-Square=8528.353. Thus, there is a relationship between the variables
since the KMO is high and the Bartlett test is significant so we can proceed with the factor
analysis or the principal component analysis.
Principal components
There are three ways that can be used to determine how many components to retain for rotation
and interpretation.
Eigen value – method one
Eigenvalue shows the, “number of extracted factors whose sum should be equal to the number of
items which are subjected to factor analysis” (Priya Chetty & Datt, 2015). Table 8 shows all the
factors extractable from the analysis along with their eigenvalues.
The Eigenvalue reflects three sub-sections, i.e. “Initial Eigen Values, Extracted Sums of Squared
Loadings and Rotation of Sums of Squared Loadings”. For analysis and interpretation purposes
only the Extracted Sums of Squared Loadings is looked at. In this method, there are ten
components extracted. This is the preferred method of extraction as it is automatic and not forced.
(Priya Chetty & Datt, 2015)
Table 8: Total variance explained for strategy execution
Component
Initial Eigenvalues Extraction Sums of Squared Loadings Rotation Sums of Squared Loadings
Total % of
Variance Cumulative
% Total
% of Variance
Cumulative %
Total % of
Variance Cumulative
%
1 17.415 40.501 40.501 17.415 40.501 40.501 5.276 12.269 12.269
2 2.427 5.644 46.144 2.427 5.644 46.144 4.519 10.510 22.779
3 1.908 4.436 50.581 1.908 4.436 50.581 4.146 9.641 32.420
4 1.845 4.291 54.872 1.845 4.291 54.872 4.060 9.443 41.862
5 1.612 3.749 58.621 1.612 3.749 58.621 3.632 8.447 50.309
6 1.362 3.166 61.787 1.362 3.166 61.787 2.518 5.855 56.164
7 1.222 2.842 64.629 1.222 2.842 64.629 1.864 4.336 60.500
8 1.104 2.566 67.196 1.104 2.566 67.196 1.825 4.244 64.744
9 1.074 2.498 69.694 1.074 2.498 69.694 1.653 3.844 68.588
10 1.037 2.411 72.105 1.037 2.411 72.105 1.512 3.517 72.105
11 .854 1.987 74.093
12 .730 1.698 75.790
© University of Pretoria
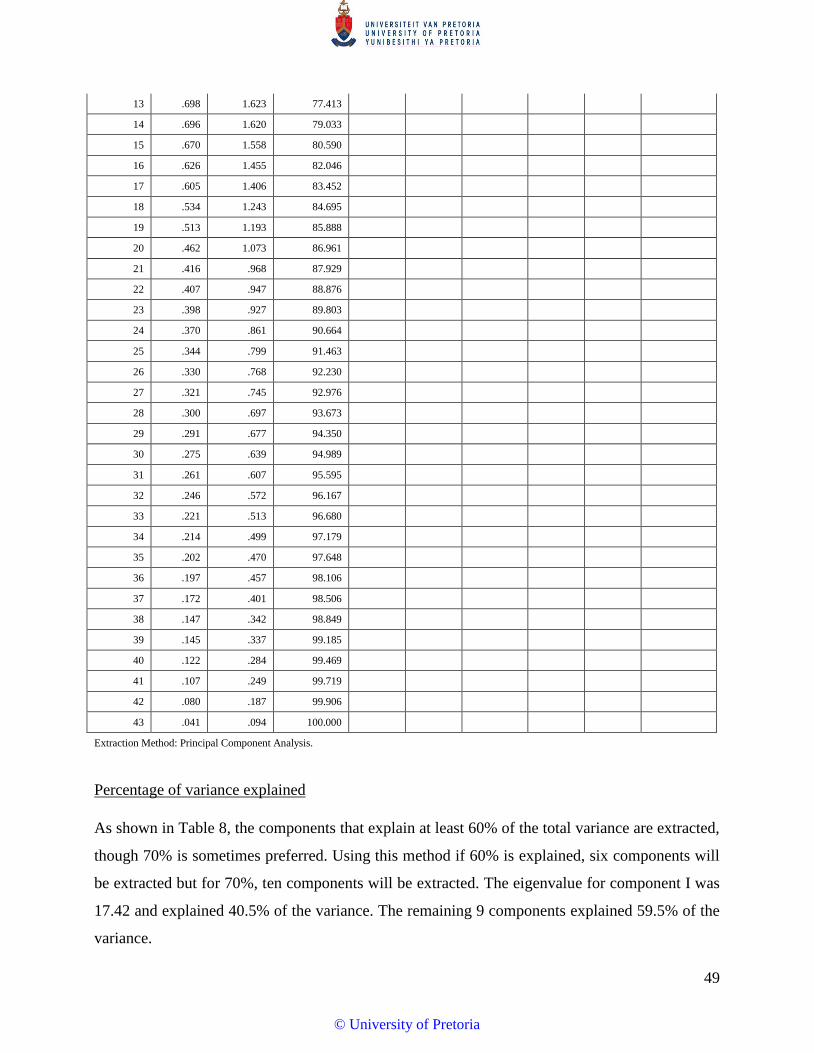
49
Percentage of variance explained
As shown in Table 8, the components that explain at least 60% of the total variance are extracted,
though 70% is sometimes preferred. Using this method if 60% is explained, six components will
be extracted but for 70%, ten components will be extracted. The eigenvalue for component I was
17.42 and explained 40.5% of the variance. The remaining 9 components explained 59.5% of the
variance.
13 .698 1.623 77.413
14 .696 1.620 79.033
15 .670 1.558 80.590
16 .626 1.455 82.046
17 .605 1.406 83.452
18 .534 1.243 84.695
19 .513 1.193 85.888
20 .462 1.073 86.961
21 .416 .968 87.929
22 .407 .947 88.876
23 .398 .927 89.803
24 .370 .861 90.664
25 .344 .799 91.463
26 .330 .768 92.230
27 .321 .745 92.976
28 .300 .697 93.673
29 .291 .677 94.350
30 .275 .639 94.989
31 .261 .607 95.595
32 .246 .572 96.167
33 .221 .513 96.680
34 .214 .499 97.179
35 .202 .470 97.648
36 .197 .457 98.106
37 .172 .401 98.506
38 .147 .342 98.849
39 .145 .337 99.185
40 .122 .284 99.469
41 .107 .249 99.719
42 .080 .187 99.906
43 .041 .094 100.000
Extraction Method: Principal Component Analysis.
© University of Pretoria
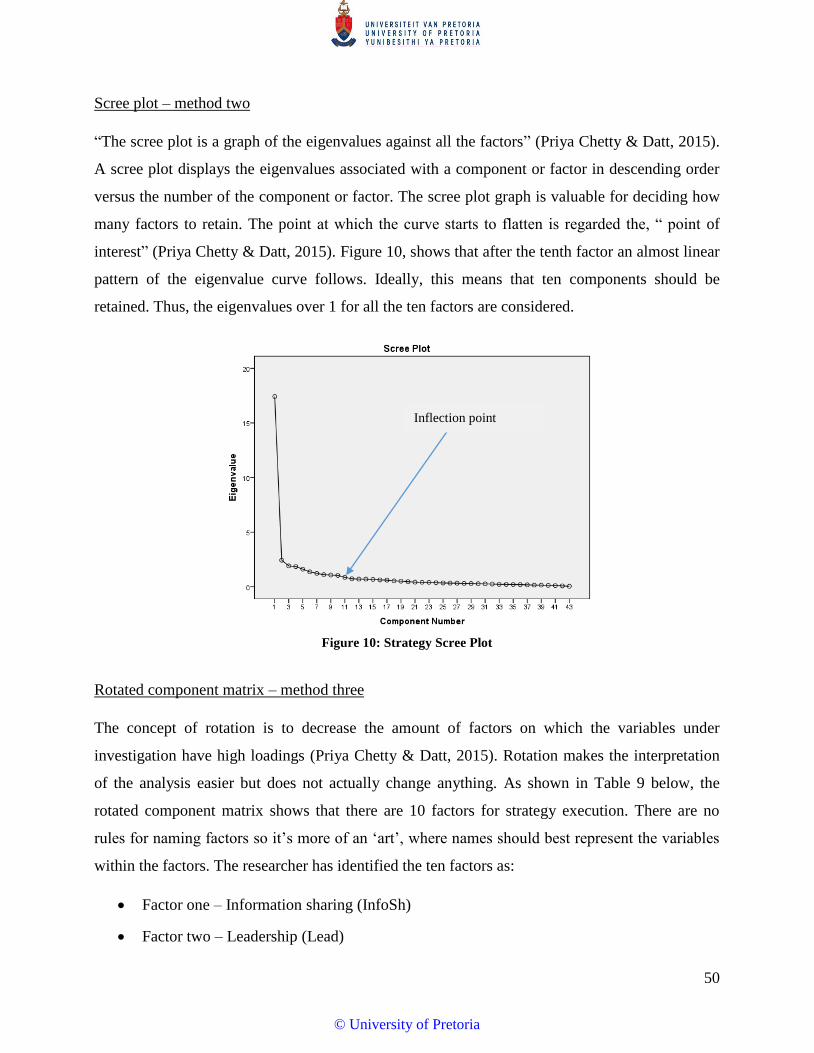
50
Scree plot – method two
“The scree plot is a graph of the eigenvalues against all the factors” (Priya Chetty & Datt, 2015).
A scree plot displays the eigenvalues associated with a component or factor in descending order
versus the number of the component or factor. The scree plot graph is valuable for deciding how
many factors to retain. The point at which the curve starts to flatten is regarded the, “ point of
interest” (Priya Chetty & Datt, 2015). Figure 10, shows that after the tenth factor an almost linear
pattern of the eigenvalue curve follows. Ideally, this means that ten components should be
retained. Thus, the eigenvalues over 1 for all the ten factors are considered.
Figure 10: Strategy Scree Plot
Rotated component matrix – method three
The concept of rotation is to decrease the amount of factors on which the variables under
investigation have high loadings (Priya Chetty & Datt, 2015). Rotation makes the interpretation
of the analysis easier but does not actually change anything. As shown in Table 9 below, the
rotated component matrix shows that there are 10 factors for strategy execution. There are no
rules for naming factors so it’s more of an ‘art’, where names should best represent the variables
within the factors. The researcher has identified the ten factors as:
Factor one – Information sharing (InfoSh)
Factor two – Leadership (Lead)
Inflection point
© University of Pretoria
51
Factor three – Performance (Per)
Factor four – Rewards (Rew)
Factor five – Structure (Str)
Factor six – Employee commitment 1 (EmpCom1)
Factory seven – Employee commitment 2 (EmpCom2)
Factor eight – Change (Cha)
Factor nine – Coordination (Coord)
Factor ten – Competence (Comp)
© University of Pretoria

52
Table 9: Rotated component matrix for strategy execution
dimension items on strategy execution no.
component
1 2 3 4 5 6 7 8 9 10
information sharing
we believe that our sources of information are reliable
7 ,761 ,142 ,140 ,066 ,149 ,035 ,162 -,088 -,039 ,147
information
sharing
we willing share information or
knowledge with others
6 ,738 ,101 ,084 ,163 ,154 ,081 ,110 ,081 ,034 ,031
information
sharing
our information reaches people who
need it within the organisation
9 ,682 ,222 ,248 ,234 ,130 ,062 ,061 ,045 ,146 ,072
coordination we divide tasks and activities among
and across business units in the
organisation
5 ,635 ,112 ,192 ,174 ,127 ,049 ,023 ,250 ,280 ,094
information
sharing
employees understand and evaluate
the usefulness of available information
10 ,568 ,257 ,359 ,174 ,199 ,041 ,033 ,101 ,112 ,092
information sharing
our managers trust information generated from sources outside their
own departments
8 ,562 ,120 ,242 ,181 ,098 ,124 -,188 -,012 -,075 ,250
change employees understand what the changes will be and why they are
being undertaken
26 ,520 ,331 ,196 ,285 ,155 ,054 ,034 ,273 -,074 -,066
coordination we foster company collaboration 4 ,510 ,117 ,088 ,107 ,235 ,137 ,144 ,112 ,307 ,387
competence we have access to adequate
resources/tools
13 ,441 ,323 ,285 -,002 -,052 -
,114
,261 ,254 ,228 -,030
competence we focus on improving the capability
base in the organisation
14 ,383 ,383 ,293 ,085 ,320 ,023 ,372 ,044 ,181 ,051
leadership our leaders provide a compelling
vision
21 ,200 ,790 ,244 ,250 ,180 ,150 ,098 ,071 ,076 ,072
leadership our leaders provide measurable
objectives for implementing the vision
22 ,213 ,784 ,205 ,263 ,197 ,073 ,086 ,105 ,114 ,039
leadership our leaders personally inspire and motivate for us to change
24 ,261 ,739 ,190 ,290 ,223 ,128 ,076 ,070 ,057 ,060
leadership our leaders clearly articulates the strategy
20 ,150 ,739 ,215 ,214 ,217 ,200 ,135 ,029 ,076 ,192
leadership our leaders respond effectively to
resistance to change
23 ,258 ,567 ,102 ,270 ,319 ,076 -,126 ,216 -,037 ,003
performance we have accomplished our goals 40 ,208 ,176 ,834 ,117 ,118 ,111 ,016 ,091 ,041 ,037
performance we have adapted our business to
maximise our goals
41 ,201 ,157 ,801 ,240 ,158 -
,013
,090 ,105 ,023 ,048
performance we have done what we have planned to
39 ,259 ,187 ,734 ,184 ,242 ,141 ,067 ,082 ,107 ,055
performance we have executed our strategy well 43 ,299 ,257 ,715 ,226 ,241 ,038 ,134 ,137 ,100 ,012
© University of Pretoria

53
performance we have the best people and capability to sustain our success
42 ,449 ,221 ,477 ,191 ,286 -,032
,169 ,148 ,029 -,088
rewards our rewards motivate us to contribute our best
35 ,176 ,259 ,118 ,847 ,183 ,071 ,131 ,065 ,083 ,002
rewards our rewards motivate us to go the
extra mile to implement strategic decisions to the best of our abilities
36 ,181 ,215 ,121 ,840 ,215 ,079 ,182 ,064 ,068 -,013
rewards our organisation rewards us for the
successful implementation of the
strategic plan
34 ,143 ,302 ,290 ,711 ,073 ,146 ,095 ,183 ,078 ,118
rewards we recognise commitment and
excellence in strategy execution in
both teams and individuals
38 ,322 ,254 ,331 ,644 ,112 ,063 ,123 ,155 ,199 ,112
rewards we celebrate strategic execution success publicly/openly across all
business units
22 ,377 ,199 ,279 ,639 ,143 ,057 ,066 ,162 ,169 ,085
structure our organisational structure nurtures the few critical competencies for
competitive advantage
32 ,122 ,211 ,247 ,164 ,761 ,115 ,038 ,085 ,030 ,206
structure our organisational structure meets the
requisite demands of the strategy. for example, if your strategy is to be a low
cost provider - a structure that fosters
low cost should be implemented
30 ,126 ,106 ,122 ,111 ,740 -
,018
-,009 ,103 ,099 ,149
structure our organisational structure
encourages both teamwork and
individuality
33 ,205 ,292 ,208 ,186 ,614 ,106 ,259 -,036 ,122 ,075
structure our organisational structure
encourages clear accountability for
delivery of strategic initiatives
31 ,409 ,173 ,344 ,179 ,609 ,136 ,155 ,059 ,095 ,004
change our leaders in the organisation seek to manage the on-going change portfolio,
conflict resolution, resources and
interdependencies
29 ,179 ,373 ,078 ,131 ,568 ,045 ,118 ,449 ,046 ,006
change our organisation is in a state of
readiness to accept the changes that
would be resulted by the strategy
25 ,322 ,383 ,136 ,085 ,535 ,091 ,117 ,251 -,083 -,221
employee commitment
i don’t concern myself with implementing strategies if they are not
beneficial to my department
17 -,044 -,216 -,041 -,089 -,022 -,825
-,079 ,029 -,064 -,103
employee
commitment
i tend to be less concerned with
working together and more concerned
with competing to be best
18 -,096 ,044 -,056 ,018 -,045 -
,815
-,012 -,131 -,136 ,011
employee
commitment
i don’t worry about implementing
strategy; i just do my job
16 -,038 -,162 -,062 -,133 -,091 -
,798
-,217 ,040 -,030 ,037
employee
commitment
i believe that my organisation is most
successful when everyone works to
implement a common strategy
19 ,033 ,002 ,044 ,162 ,059 ,214 ,720 ,142 -,035 -,005
competence we have competencies that build a 12 ,226 ,372 ,296 ,153 ,179 ,045 ,525 ,094 ,180 ,176
© University of Pretoria
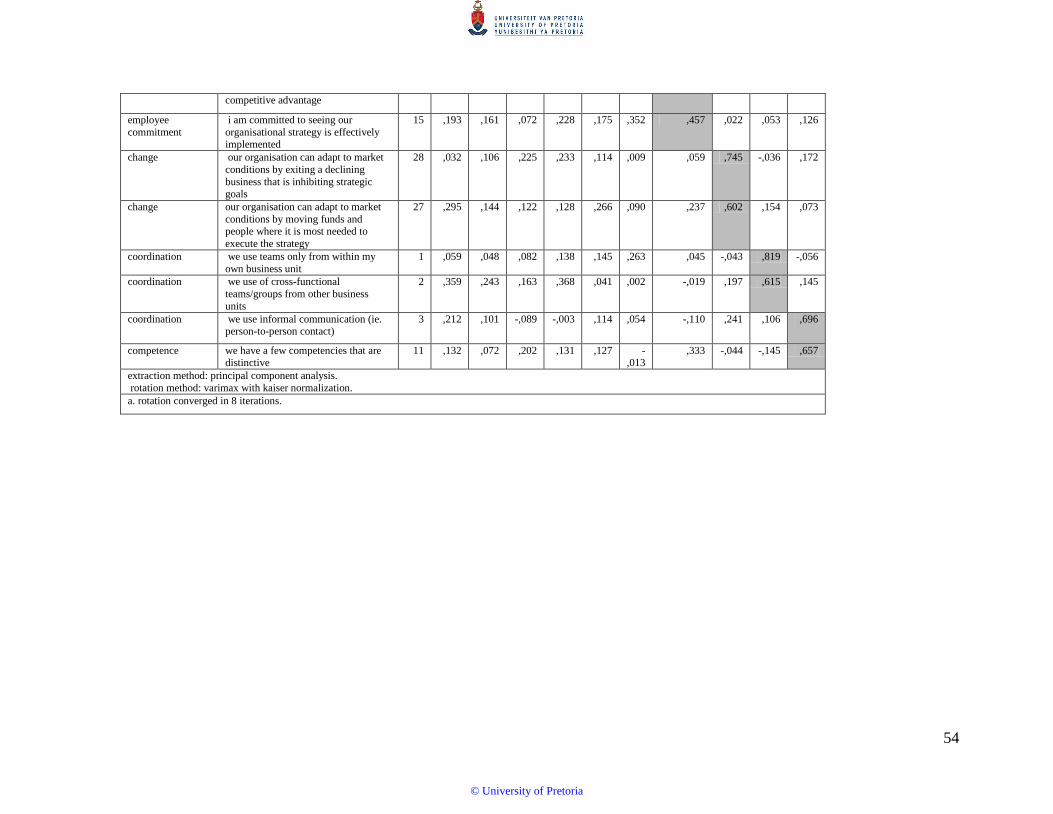
54
competitive advantage
employee
commitment
i am committed to seeing our
organisational strategy is effectively implemented
15 ,193 ,161 ,072 ,228 ,175 ,352 ,457 ,022 ,053 ,126
change our organisation can adapt to market
conditions by exiting a declining
business that is inhibiting strategic goals
28 ,032 ,106 ,225 ,233 ,114 ,009 ,059 ,745 -,036 ,172
change our organisation can adapt to market
conditions by moving funds and people where it is most needed to
execute the strategy
27 ,295 ,144 ,122 ,128 ,266 ,090 ,237 ,602 ,154 ,073
coordination we use teams only from within my
own business unit
1 ,059 ,048 ,082 ,138 ,145 ,263 ,045 -,043 ,819 -,056
coordination we use of cross-functional
teams/groups from other business
units
2 ,359 ,243 ,163 ,368 ,041 ,002 -,019 ,197 ,615 ,145
coordination we use informal communication (ie. person-to-person contact)
3 ,212 ,101 -,089 -,003 ,114 ,054 -,110 ,241 ,106 ,696
competence we have a few competencies that are distinctive
11 ,132 ,072 ,202 ,131 ,127 -,013
,333 -,044 -,145 ,657
extraction method: principal component analysis.
rotation method: varimax with kaiser normalization.
a. rotation converged in 8 iterations.
© University of Pretoria

55
4.9.1.2 ORGANISATIONAL CULTURE VALIDITY
R. J. House et al (2004) founders of the GLOBE culture survey tested validity of their survey
which can be found on pg. 159 of their research book. They found an overall reliability of
0.77 for their survey instrument. However, despite the validity being tested, the researcher
conducted a validity test using a factor analysis where there were a total of 18 questionnaire
items for culture. There was a linear relationship between 12 of the questionnaire items with
correlation of more than 0.3 and six questionnaire items where the correlation was less than
0.3 (weak correlation). These six questionnaire items are as follows:
In this organisation, orderliness and consistency are stressed, even at the expense of
experimentation and innovation (Minkov & Blagoev, 2012).
In this organisation, men are encouraged to participate in professional development
activities more than women In this organisation, physically demanding tasks are
usually performed by men (Minkov & Blagoev, 2012).
In this organisation, people are generally men or women (Minkov & Blagoev, 2012).
In this organisation, managers encourage group loyalty even if individual goals suffer
(Minkov & Blagoev, 2012).
The remuneration (pay and bonus) system in this organisation is designed to
maximize (individual interest / collective interest) (Minkov & Blagoev, 2012)
To determine the suitability of factor analysis, a sample adequacy index ΚΜΟ or Kaiser-
Meyer-Olkin, which compares the sizes of the observed correlation coefficients to the sizes of
the partial correlation coefficients for the sum of analysis variables (John E. Exner, 2013) was
conducted. In addition to this, a Bartlett test for sphericity was also conducted (Sekaran,
2005; Hair et al., 2006). For acceptability the KMO test should be higher than 0.6, while the
Bartlett test should have a p <0.0005.
Table 10: KMO and Bartlett’s test for organisational culture
KMO and Bartlett's Test
Kaiser-Meyer-Olkin Measure of Sampling Adequacy. .844
Bartlett's Test of Sphericity Approx. Chi-Square 1412.818
Df 153
Sig. .000
© University of Pretoria
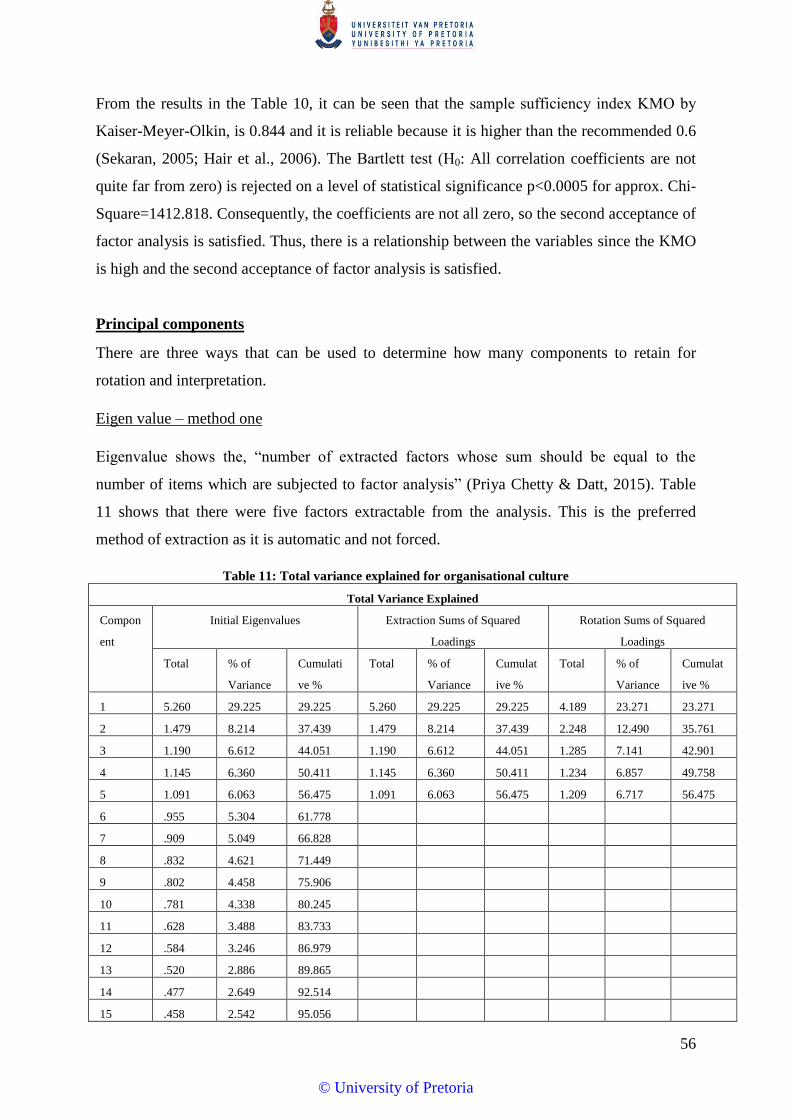
56
From the results in the Table 10, it can be seen that the sample sufficiency index ΚΜΟ by
Kaiser-Meyer-Olkin, is 0.844 and it is reliable because it is higher than the recommended 0.6
(Sekaran, 2005; Hair et al., 2006). The Bartlett test (Η0: All correlation coefficients are not
quite far from zero) is rejected on a level of statistical significance p<0.0005 for approx. Chi-
Square=1412.818. Consequently, the coefficients are not all zero, so the second acceptance of
factor analysis is satisfied. Thus, there is a relationship between the variables since the KMO
is high and the second acceptance of factor analysis is satisfied.
Principal components
There are three ways that can be used to determine how many components to retain for
rotation and interpretation.
Eigen value – method one
Eigenvalue shows the, “number of extracted factors whose sum should be equal to the
number of items which are subjected to factor analysis” (Priya Chetty & Datt, 2015). Table
11 shows that there were five factors extractable from the analysis. This is the preferred
method of extraction as it is automatic and not forced.
Table 11: Total variance explained for organisational culture
Total Variance Explained
Compon
ent
Initial Eigenvalues Extraction Sums of Squared
Loadings
Rotation Sums of Squared
Loadings
Total % of
Variance
Cumulati
ve %
Total % of
Variance
Cumulat
ive %
Total % of
Variance
Cumulat
ive %
1 5.260 29.225 29.225 5.260 29.225 29.225 4.189 23.271 23.271
2 1.479 8.214 37.439 1.479 8.214 37.439 2.248 12.490 35.761
3 1.190 6.612 44.051 1.190 6.612 44.051 1.285 7.141 42.901
4 1.145 6.360 50.411 1.145 6.360 50.411 1.234 6.857 49.758
5 1.091 6.063 56.475 1.091 6.063 56.475 1.209 6.717 56.475
6 .955 5.304 61.778
7 .909 5.049 66.828
8 .832 4.621 71.449
9 .802 4.458 75.906
10 .781 4.338 80.245
11 .628 3.488 83.733
12 .584 3.246 86.979
13 .520 2.886 89.865
14 .477 2.649 92.514
15 .458 2.542 95.056
© University of Pretoria

57
16 .364 2.022 97.078
17 .276 1.532 98.610
18 .250 1.390 100.000
Extraction Method: Principal Component Analysis.
Percentage of variance explained
As shown in Table 11, the components that can explain at least 60% of the total variance are
extracted, though 70% is sometimes preferred. Using this method if 60% is explained, six
components will be extracted but for 70%, ten components will be extracted. The following
was found:
61.77% - 6 components – challenge two of the component have only one question so
reliability cannot be done for them
66.83% - 7 components – challenge three of the components have only one question
so reliability cannot be done for them
71.45% - 8 components - challenge four of the components have only one question so
reliability cannot be done for them
75.91% - 9 components - challenge five of the components can have one question so
reliability cannot be done for them
The eigenvalue for component I was 5.26 and explained 29.2% of the variance. The
remaining four components explained 70.8% of the variance.
Scree plot – method two
The scree plot is a graph of the eigenvalues against all the factors. A scree plot displays the
eigenvalues associated with a component or factor in descending order versus the number of
the component or factor. Figure 11 presents a distinguished break up to the six and eleventh
component. Five factors can therefore be extracted and all have an eigenvalue of more than
one.
© University of Pretoria
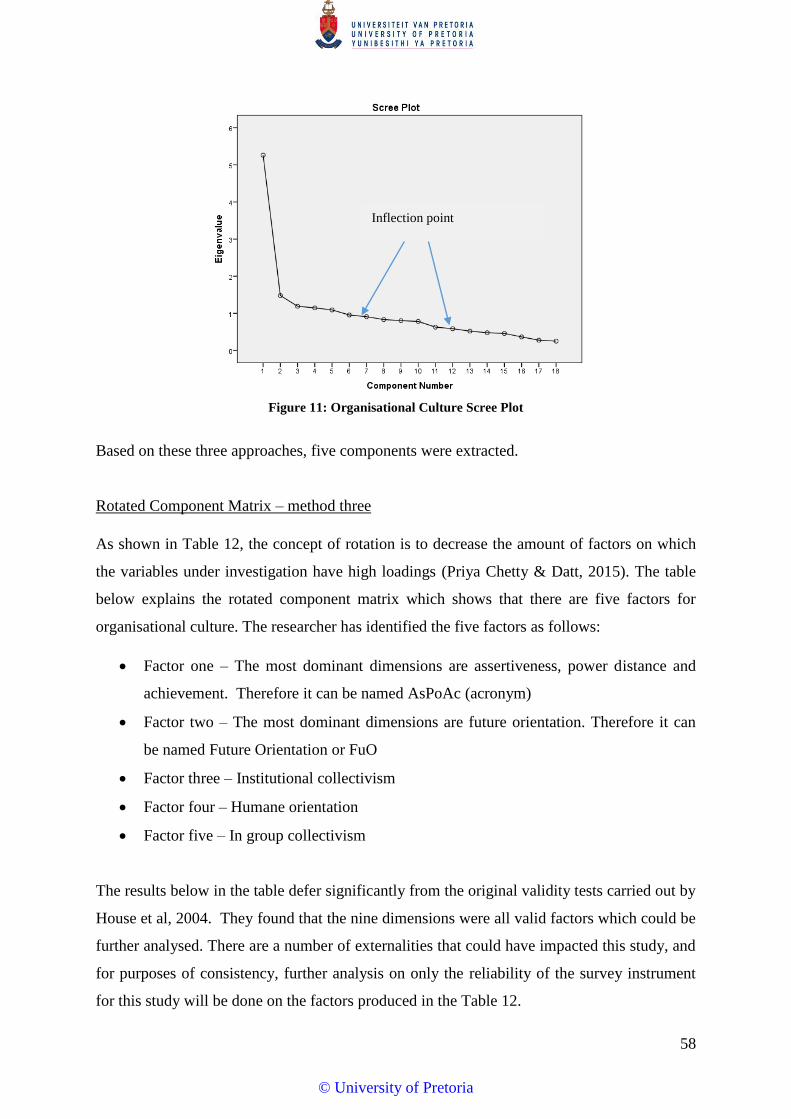
58
Figure 11: Organisational Culture Scree Plot
Based on these three approaches, five components were extracted.
Rotated Component Matrix – method three
As shown in Table 12, the concept of rotation is to decrease the amount of factors on which
the variables under investigation have high loadings (Priya Chetty & Datt, 2015). The table
below explains the rotated component matrix which shows that there are five factors for
organisational culture. The researcher has identified the five factors as follows:
Factor one – The most dominant dimensions are assertiveness, power distance and
achievement. Therefore it can be named AsPoAc (acronym)
Factor two – The most dominant dimensions are future orientation. Therefore it can
be named Future Orientation or FuO
Factor three – Institutional collectivism
Factor four – Humane orientation
Factor five – In group collectivism
The results below in the table defer significantly from the original validity tests carried out by
House et al, 2004. They found that the nine dimensions were all valid factors which could be
further analysed. There are a number of externalities that could have impacted this study, and
for purposes of consistency, further analysis on only the reliability of the survey instrument
for this study will be done on the factors produced in the Table 12.
Inflection point
© University of Pretoria
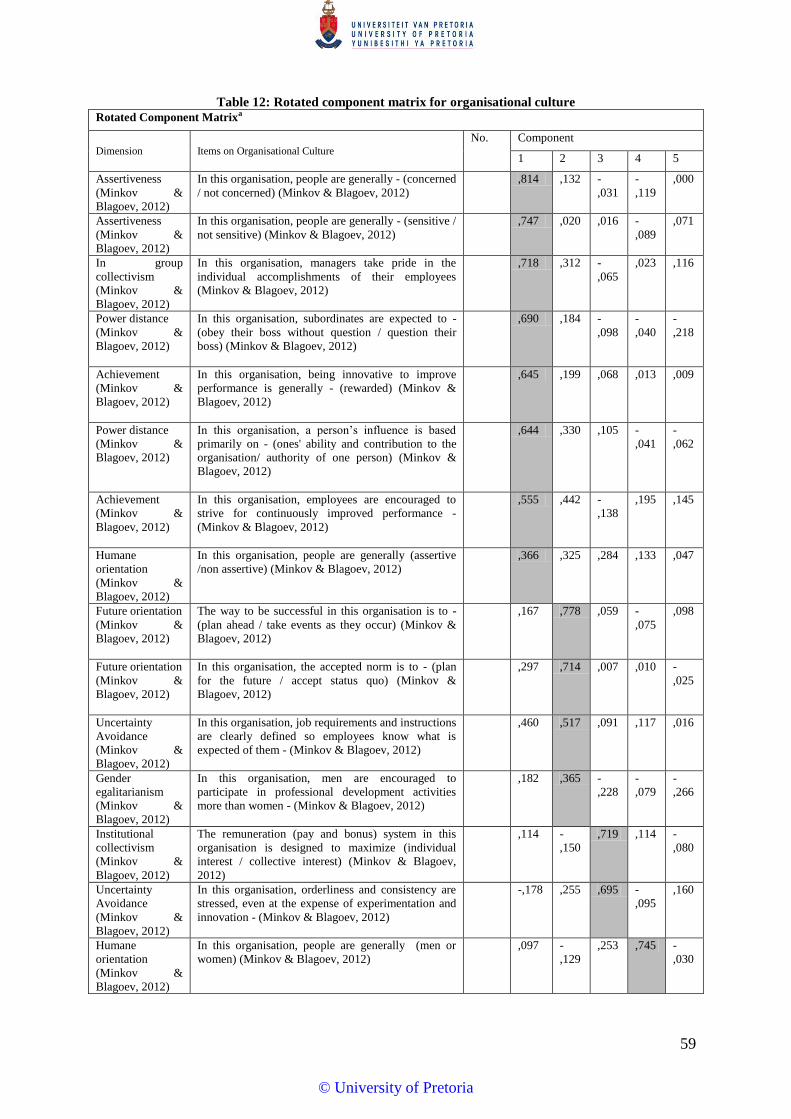
59
Table 12: Rotated component matrix for organisational culture Rotated Component Matrixa
Dimension Items on Organisational Culture
No. Component
1 2 3 4 5
Assertiveness
(Minkov &
Blagoev, 2012)
In this organisation, people are generally - (concerned
/ not concerned) (Minkov & Blagoev, 2012)
,814 ,132 -
,031
-
,119
,000
Assertiveness
(Minkov &
Blagoev, 2012)
In this organisation, people are generally - (sensitive /
not sensitive) (Minkov & Blagoev, 2012)
,747 ,020 ,016 -
,089
,071
In group
collectivism
(Minkov &
Blagoev, 2012)
In this organisation, managers take pride in the
individual accomplishments of their employees
(Minkov & Blagoev, 2012)
,718 ,312 -
,065
,023 ,116
Power distance
(Minkov &
Blagoev, 2012)
In this organisation, subordinates are expected to -
(obey their boss without question / question their
boss) (Minkov & Blagoev, 2012)
,690 ,184 -
,098
-
,040
-
,218
Achievement
(Minkov &
Blagoev, 2012)
In this organisation, being innovative to improve
performance is generally - (rewarded) (Minkov &
Blagoev, 2012)
,645 ,199 ,068 ,013 ,009
Power distance
(Minkov &
Blagoev, 2012)
In this organisation, a person’s influence is based
primarily on - (ones' ability and contribution to the
organisation/ authority of one person) (Minkov &
Blagoev, 2012)
,644 ,330 ,105 -
,041
-
,062
Achievement
(Minkov &
Blagoev, 2012)
In this organisation, employees are encouraged to
strive for continuously improved performance -
(Minkov & Blagoev, 2012)
,555 ,442 -
,138
,195 ,145
Humane
orientation
(Minkov &
Blagoev, 2012)
In this organisation, people are generally (assertive
/non assertive) (Minkov & Blagoev, 2012)
,366 ,325 ,284 ,133 ,047
Future orientation
(Minkov &
Blagoev, 2012)
The way to be successful in this organisation is to -
(plan ahead / take events as they occur) (Minkov &
Blagoev, 2012)
,167 ,778 ,059 -
,075
,098
Future orientation
(Minkov &
Blagoev, 2012)
In this organisation, the accepted norm is to - (plan
for the future / accept status quo) (Minkov &
Blagoev, 2012)
,297 ,714 ,007 ,010 -
,025
Uncertainty
Avoidance
(Minkov &
Blagoev, 2012)
In this organisation, job requirements and instructions
are clearly defined so employees know what is
expected of them - (Minkov & Blagoev, 2012)
,460 ,517 ,091 ,117 ,016
Gender
egalitarianism
(Minkov &
Blagoev, 2012)
In this organisation, men are encouraged to
participate in professional development activities
more than women - (Minkov & Blagoev, 2012)
,182 ,365 -
,228
-
,079
-
,266
Institutional
collectivism
(Minkov &
Blagoev, 2012)
The remuneration (pay and bonus) system in this
organisation is designed to maximize (individual
interest / collective interest) (Minkov & Blagoev,
2012)
,114 -
,150
,719 ,114 -
,080
Uncertainty
Avoidance
(Minkov &
Blagoev, 2012)
In this organisation, orderliness and consistency are
stressed, even at the expense of experimentation and
innovation - (Minkov & Blagoev, 2012)
-,178 ,255 ,695 -
,095
,160
Humane
orientation
(Minkov &
Blagoev, 2012)
In this organisation, people are generally (men or
women) (Minkov & Blagoev, 2012)
,097 -
,129
,253 ,745 -
,030
© University of Pretoria

60
Gender
egalitarianism
(Minkov &
Blagoev, 2012)
In this organisation, physically demanding tasks are
usually performed by (men / women) (Minkov &
Blagoev, 2012)
-,218 ,130 -
,165
,741 ,056
Institutional
collectivism
In this organisation, managers encourage group
loyalty even if individual goals suffer - (Minkov &
Blagoev, 2012)
-,065 ,000 ,027 ,016 ,835
In group
collectivism
(R. House et al., 2001)
In this organisation, group members take pride in the
individual accomplishments of their manager -
(Minkov & Blagoev, 2012)
,486 ,121 -
,001
-
,015
,549
Extraction Method: Principal Component Analysis.
Rotation Method: Varimax with Kaiser Normalization.
a. Rotation converged in 6 iterations.
4.9.2 RELIABILITY
Reliability measures whether an instrument has the ability to produce the same results under
the same conditions over time as well as quantifies the precision of measurement instruments
and thus, the trustworthiness of the scores produced with the instrument (Gushta & Rupp,
2010). Cronbach’s alpha was used as a measure of internal consistency. A reliable and
acceptable instrument or questionnaire is one which scores as a rule of thumb between of 0.6
to 0.7 whereas a reliability of 0.8 or higher is regarded as good. As all items in the survey
were measured using the Likert-scale, the raw cronbach alpha score was deemed appropriate.
Following on from the factor analysis, the main factors (or constructs) for organisational
culture and strategy execution were tested in terms of cronbach’s alpha. An item analysis was
conducted, where the correlation with the total construct of each item was measured, and the
effect of deleting each variable was assessed. In instances where the ‘cronbach alpha score’
increased considerably after removing the item, it was decided to remove these items from
the analysis. In instances where the correlation with the total construct was low, these items
were also removed from the analysis.
4.9.2.1 STRATEGY EXECUTION RELIABILITY
Due to the fact that the strategy execution survey instrument was self-organised, a reliability
analysis needed to be conducted.
© University of Pretoria
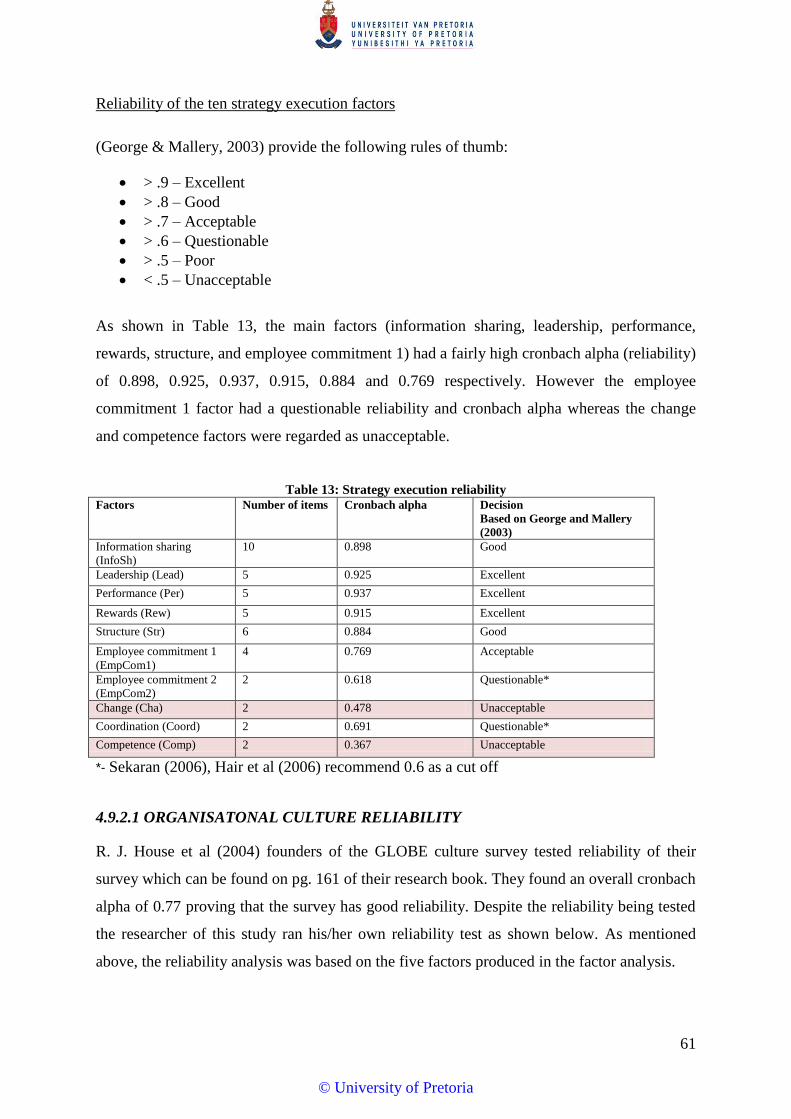
61
Reliability of the ten strategy execution factors
(George & Mallery, 2003) provide the following rules of thumb:
> .9 – Excellent
> .8 – Good
> .7 – Acceptable
> .6 – Questionable
> .5 – Poor
< .5 – Unacceptable
As shown in Table 13, the main factors (information sharing, leadership, performance,
rewards, structure, and employee commitment 1) had a fairly high cronbach alpha (reliability)
of 0.898, 0.925, 0.937, 0.915, 0.884 and 0.769 respectively. However the employee
commitment 1 factor had a questionable reliability and cronbach alpha whereas the change
and competence factors were regarded as unacceptable.
Table 13: Strategy execution reliability Factors Number of items Cronbach alpha Decision
Based on George and Mallery
(2003)
Information sharing
(InfoSh)
10 0.898 Good
Leadership (Lead) 5 0.925 Excellent
Performance (Per) 5 0.937 Excellent
Rewards (Rew) 5 0.915 Excellent
Structure (Str) 6 0.884 Good
Employee commitment 1
(EmpCom1)
4 0.769 Acceptable
Employee commitment 2
(EmpCom2)
2 0.618 Questionable*
Change (Cha) 2 0.478 Unacceptable
Coordination (Coord) 2 0.691 Questionable*
Competence (Comp) 2 0.367 Unacceptable
*- Sekaran (2006), Hair et al (2006) recommend 0.6 as a cut off
4.9.2.1 ORGANISATONAL CULTURE RELIABILITY
R. J. House et al (2004) founders of the GLOBE culture survey tested reliability of their
survey which can be found on pg. 161 of their research book. They found an overall cronbach
alpha of 0.77 proving that the survey has good reliability. Despite the reliability being tested
the researcher of this study ran his/her own reliability test as shown below. As mentioned
above, the reliability analysis was based on the five factors produced in the factor analysis.
© University of Pretoria
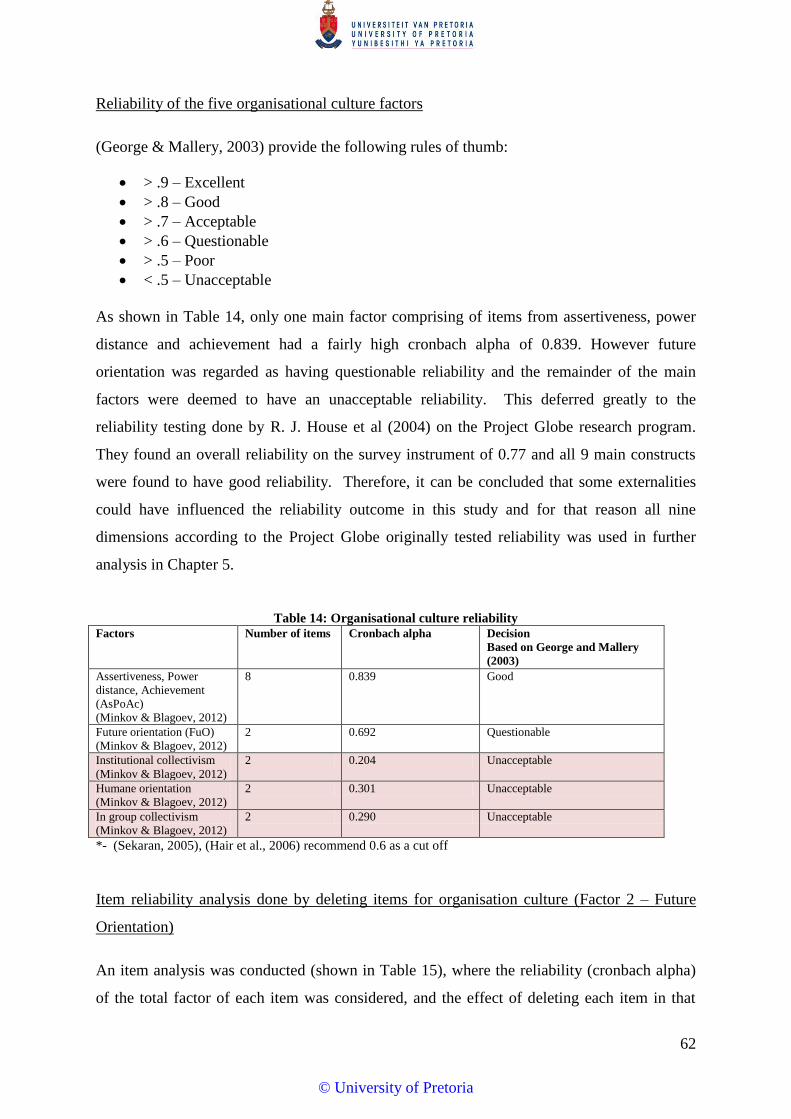
62
Reliability of the five organisational culture factors
(George & Mallery, 2003) provide the following rules of thumb:
> .9 – Excellent
> .8 – Good
> .7 – Acceptable
> .6 – Questionable
> .5 – Poor
< .5 – Unacceptable
As shown in Table 14, only one main factor comprising of items from assertiveness, power
distance and achievement had a fairly high cronbach alpha of 0.839. However future
orientation was regarded as having questionable reliability and the remainder of the main
factors were deemed to have an unacceptable reliability. This deferred greatly to the
reliability testing done by R. J. House et al (2004) on the Project Globe research program.
They found an overall reliability on the survey instrument of 0.77 and all 9 main constructs
were found to have good reliability. Therefore, it can be concluded that some externalities
could have influenced the reliability outcome in this study and for that reason all nine
dimensions according to the Project Globe originally tested reliability was used in further
analysis in Chapter 5.
Table 14: Organisational culture reliability Factors Number of items Cronbach alpha Decision
Based on George and Mallery
(2003)
Assertiveness, Power
distance, Achievement
(AsPoAc)
(Minkov & Blagoev, 2012)
8 0.839 Good
Future orientation (FuO)
(Minkov & Blagoev, 2012)
2 0.692 Questionable
Institutional collectivism
(Minkov & Blagoev, 2012)
2 0.204 Unacceptable
Humane orientation
(Minkov & Blagoev, 2012)
2 0.301 Unacceptable
In group collectivism
(Minkov & Blagoev, 2012)
2 0.290 Unacceptable
*- (Sekaran, 2005), (Hair et al., 2006) recommend 0.6 as a cut off
Item reliability analysis done by deleting items for organisation culture (Factor 2 – Future
Orientation)
An item analysis was conducted (shown in Table 15), where the reliability (cronbach alpha)
of the total factor of each item was considered, and the effect of deleting each item in that
© University of Pretoria
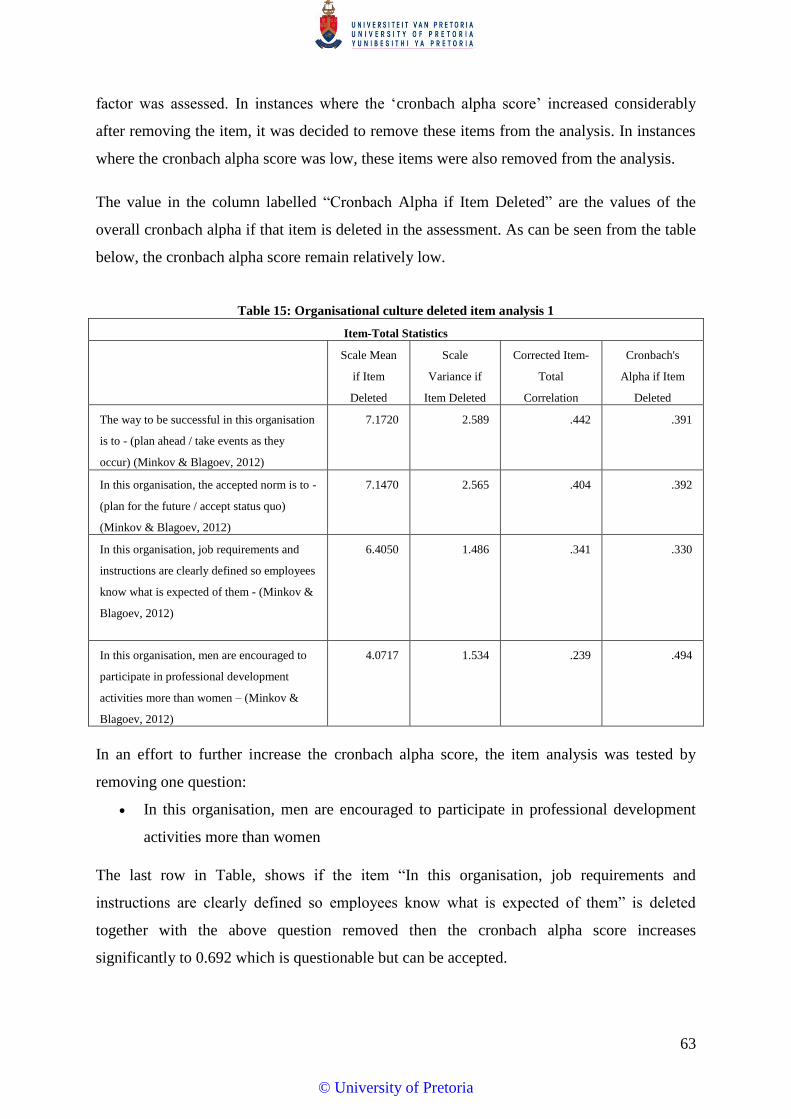
63
factor was assessed. In instances where the ‘cronbach alpha score’ increased considerably
after removing the item, it was decided to remove these items from the analysis. In instances
where the cronbach alpha score was low, these items were also removed from the analysis.
The value in the column labelled “Cronbach Alpha if Item Deleted” are the values of the
overall cronbach alpha if that item is deleted in the assessment. As can be seen from the table
below, the cronbach alpha score remain relatively low.
Table 15: Organisational culture deleted item analysis 1
Item-Total Statistics
Scale Mean
if Item
Deleted
Scale
Variance if
Item Deleted
Corrected Item-
Total
Correlation
Cronbach's
Alpha if Item
Deleted
The way to be successful in this organisation
is to - (plan ahead / take events as they
occur) (Minkov & Blagoev, 2012)
7.1720 2.589 .442 .391
In this organisation, the accepted norm is to -
(plan for the future / accept status quo)
(Minkov & Blagoev, 2012)
7.1470 2.565 .404 .392
In this organisation, job requirements and
instructions are clearly defined so employees
know what is expected of them - (Minkov &
Blagoev, 2012)
6.4050 1.486 .341 .330
In this organisation, men are encouraged to
participate in professional development
activities more than women – (Minkov &
Blagoev, 2012)
4.0717 1.534 .239 .494
In an effort to further increase the cronbach alpha score, the item analysis was tested by
removing one question:
In this organisation, men are encouraged to participate in professional development
activities more than women
The last row in Table, shows if the item “In this organisation, job requirements and
instructions are clearly defined so employees know what is expected of them” is deleted
together with the above question removed then the cronbach alpha score increases
significantly to 0.692 which is questionable but can be accepted.
© University of Pretoria
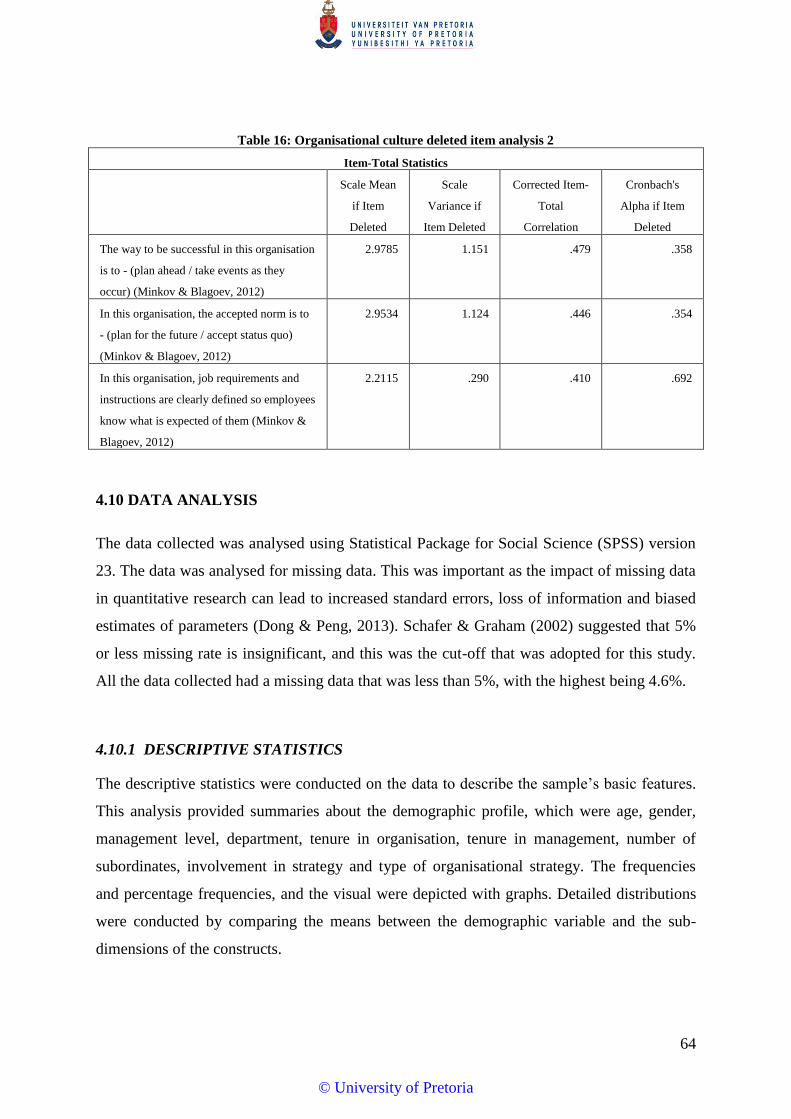
64
Table 16: Organisational culture deleted item analysis 2
Item-Total Statistics
Scale Mean
if Item
Deleted
Scale
Variance if
Item Deleted
Corrected Item-
Total
Correlation
Cronbach's
Alpha if Item
Deleted
The way to be successful in this organisation
is to - (plan ahead / take events as they
occur) (Minkov & Blagoev, 2012)
2.9785 1.151 .479 .358
In this organisation, the accepted norm is to
- (plan for the future / accept status quo)
(Minkov & Blagoev, 2012)
2.9534 1.124 .446 .354
In this organisation, job requirements and
instructions are clearly defined so employees
know what is expected of them (Minkov &
Blagoev, 2012)
2.2115 .290 .410 .692
4.10 DATA ANALYSIS
The data collected was analysed using Statistical Package for Social Science (SPSS) version
23. The data was analysed for missing data. This was important as the impact of missing data
in quantitative research can lead to increased standard errors, loss of information and biased
estimates of parameters (Dong & Peng, 2013). Schafer & Graham (2002) suggested that 5%
or less missing rate is insignificant, and this was the cut-off that was adopted for this study.
All the data collected had a missing data that was less than 5%, with the highest being 4.6%.
4.10.1 DESCRIPTIVE STATISTICS
The descriptive statistics were conducted on the data to describe the sample’s basic features.
This analysis provided summaries about the demographic profile, which were age, gender,
management level, department, tenure in organisation, tenure in management, number of
subordinates, involvement in strategy and type of organisational strategy. The frequencies
and percentage frequencies, and the visual were depicted with graphs. Detailed distributions
were conducted by comparing the means between the demographic variable and the sub-
dimensions of the constructs.
© University of Pretoria

65
4.10.2 ASSOCIATION BETWEEN THE CONSTRUCTS
The measure of the association for examining the relationship between the sub-dimensions of
culture (uncertainty avoidance, gender egalitarianism, assertiveness, institute collectivism, in
group collectivism, humane orientation, future orientation, achievement orientation and
power distance) (Minkov & Blagoev, 2012) and strategy execution (information sharing,
leadership, rewards, performance, structure, employee commitment 1, employee commitment
2 and coordination) was performed using Pearson Correlation (r). The Pearson’s correlation
is a, “measure of the strength and direction of association that exists between two variables
measured on at least an interval scale”. This test also focuses on whether the relationship was
linear or not, (Diamantopoulos, A. Schlegelmilch, 2000). To access the direction of the
relationship, the sign would be positive (+) or negative (-) with the strength analysed based
on guidelines by Pallant (2010). The r value of <0.29 indicates a weak relationship, 0.3 – 0.49
indicates a medium relationship and ≥0.5 indicates a strong relationship. No correlation is
found at 0 while perfect correlation is found with the r value of 1.
As the Pearson correlation test is a uni-variant statistical test (Bujang & Baharum, 2016);
canonical correlation analysis was also performed to identify the measure of association
among two sets of variables that is the sub-dimensions of the organisational culture and
strategy execution. Canonical correlation is appropriate in the same situations where multiple
regression would be, but where there are multiple inter-correlated outcome variables.
Canonical correlation analysis determines a set of canonical variants and orthogonal linear
combinations of the variables within each set that best explain the variability both within and
between sets (Bruin, 2016).
4.11 POTENTIAL RESEARCH LIMITATIONS
The sample was restricted to one FMCG company and therefore the findings will be
limited for use as a guide for FMCG companies and cannot be generalised to all
companies.
The research was conducted as a cross-sectional study due to time constraints, which
does not provide the depth of analysis of a longitudinal study.
The research was limited to the focus on organisational culture dimensions, and did
not provide an analysis of the impact of the different types of organisational cultures.
© University of Pretoria
66
The research only investigated the relationships between organisational culture, and
strategy execution, but did not examine the other factors that influence strategy
execution such as strategy formulation.
The most significant bias introduced was that of non-response bias primarily due to
refusal to respond in this case (Saunders et al., 2009). The non-respondents could
represent a portion of the population which could skew the results; and thus could
result in a type I error.
Similarly, there is a risk of self-selection bias, whereby it is possible that the people
who chose to respond are those who felt strongly about the subject, thereby skewing
the result (Saunders & Lewis, 2012).
Other biases may have been introduced as a result of the collection procedure,
whereby the order of questions on the questionnaire could have resulted in certain
questions having influenced the responses to other questions.
© University of Pretoria

67
67
CHAPTER 5
RESULTS
5.1 INTRODUCTION
The aim of this research was to investigate the effect of organisational culture on the strategy
execution. A quantitative method survey was used for the investigation with the overall
methodology and design presented in Chapter 4. A total of 281 respondents were completed
the survey, which was equivalent to a response rate of ~48% based on the calculation
provided by Zikmund, Babin, Carr, & Griffin (2010). In this chapter, the research findings are
presented, with the flow from the profile of the respondents, followed by answering the
research questions with both descriptive and inferential statistics. At the end the summary of
the research finding are provided in preparation of the chapter 6, where the results are
discussed.
5.2 DEMOGRAPHIC INFORMATION
There were nine demographic information variables that were used to profile the respondents.
These were age, gender, management level, department, tenure in organisation, tenure in
management, number of subordinates, involvement in strategy and type of organisational
strategy.
5.2.1 BIOGRAPHIC INFORMATION OF RESPONDENTS
5.2.1.1 AGE
The age distribution of the sample is presented in Figure 12. The majority respondents were
between the age of 31 – 40 years, which constituted for 35.6% (N = 100). This was followed
by 41 – 50 years age category which constituted for 29.5%. The lowest age group was 30
years or less, which constituted for 16.7% (N = 47).
© University of Pretoria

68
68
Figure 12: Age profile
Table 17 shown below presents the mean scores of organisational culture and strategy
execution dimensions across the ages of respondents. From a culture perspective, the
respondents for all the ages strongly agreed or agreed with future orientation and achievement
orientation as their mean values range from 1.0-1.8 than gender egalitarianism with a mean
range of 3.1 – 3.3. From a strategy execution perspective, the respondents of the age category
51 years or more strongly agreed more with employee commitment1 (Mean= 1.96) than
employee commitment2. The respondents from all the age groups showed agreement with
employee commitment 1.
Table 17: Age mean score
Age 0-30 years 31-40 years 41-50 years 51 years and
older
Number of respondents 47 98 83 51
Culture
Uncertainty Avoidance 2,1383 2,2806 2,2590 2,3627
Gender Egalitarianism 3,2660 3,3265 3,1867 3,1961
Assertiveness 2,1915 2,0816 2,1205 2,1078
Institutional Collectivism 2,2447 2,2551 2,3133 2,3627
In-group Collectivism 2,5213 2,4388 2,2952 2,3431
Humane Orientation 2,3830 2,4898 2,1566 2,0196
Future Orientation 1,1383 1,1173 1,0964 1,0686
Achievement Orientation 1,8404 1,7755 1,5904 1,6176
Power Distance 3,9149 3,7959 3,8012 3,7353
Number of respondents 44 95 79 50
Strategy execution
Information Sharing 2,1818 2,1505 2,1165 2,0640
Leadership 2,19091 1,95368 1,83797 1,78400
Rewards 2,0227 2,0253 1,9316 1,8720
Performance 2,0318 2,0758 1,8582 1,9000
Structure 2,0379 2,0439 2,0021 1,8933
Employee Commitment 1 1,8182 1,7184 1,6804 1,6500
Employee Commitment 2 2,0568 2,0895 1,9873 2,0300
Coordination 2,4659 2,5684 2,4684 2,6500
© University of Pretoria

69
69
5.2.1.2 GENDER
The gender profile shown in Figure 13 illustrated that the respondents were split almost two is
to one when it came to the gender. Figure 13 shows that 65.1% (N=183) were males and
34.9% (N=98) females.
Figure 13: Gender profile
Table 18 shown below, illustrates the mean scores of culture and strategy execution across
gender. From an organisational culture perspective both genders strongly agreed to future
orientation and achievement orientation and disagreed to power distance. From a strategy
execution perspective, both genders also agreed to leadership; performance and employee
commitment 1. Females agreed with rewards and structure while males neither agreed nor
disagreed.
Table 18: Gender mean scores Gender Female Male
Number of respondents 97 182
Culture
Uncertainty Avoidance (Minkov &
Blagoev, 2012) 2,3918 2,1978
Gender Egalitarianism (Minkov & Blagoev,
2012) 3,4278 3,1566
Assertiveness (Minkov & Blagoev, 2012) 2,2732 2,0330
Institutional Collectivism (Minkov &
Blagoev, 2012) 2,3660 2,2500
In-group Collectivism (Minkov & Blagoev,
2012) 2,3969 2,3901
Humane Orientation (Minkov & Blagoev,
2012) 2,5361 2,1538
Future Orientation (Minkov & Blagoev,
2012) 1,1392 1,0879
Achievement Orientation (Minkov &
Blagoev, 2012) 1,7680 1,6676
© University of Pretoria

70
70
Power Distance (Minkov & Blagoev, 2012) 3,8454 3,7857
Number of respondents
91 177
Strategy execution
Information Sharing 2,2209 2,0825
Leadership 1,99560 1,89153
Rewards 2,0308 1,9367
Performance 1,9978 1,9582
Structure 2,0092 1,9991
Employee Commitment 1 1,7445 1,6935
Employee Commitment 2 2,1264 2,0000
Coordination 2,5275 2,5424
5.2.2 ORGANISATION PROFILE
5.2.2.1 MANAGEMENT LEVEL
All these participants were in management positions. The range of management level was
junior management to executive management (as shown below in Figure 14). The largest
management group that participated in this research was junior management and constituted
for 45.9% (N=129) of the total sample of 281, followed by the middle management with
34.5% (N = 97), then senior management and executive management. The senior and
executive management constituted for 14.95% (N=42) and 4.6% (N = 13) of the respondents,
respectively. The general trend was the decrease in respondents with increase in management
level.
Figure 14: Management level profile
© University of Pretoria
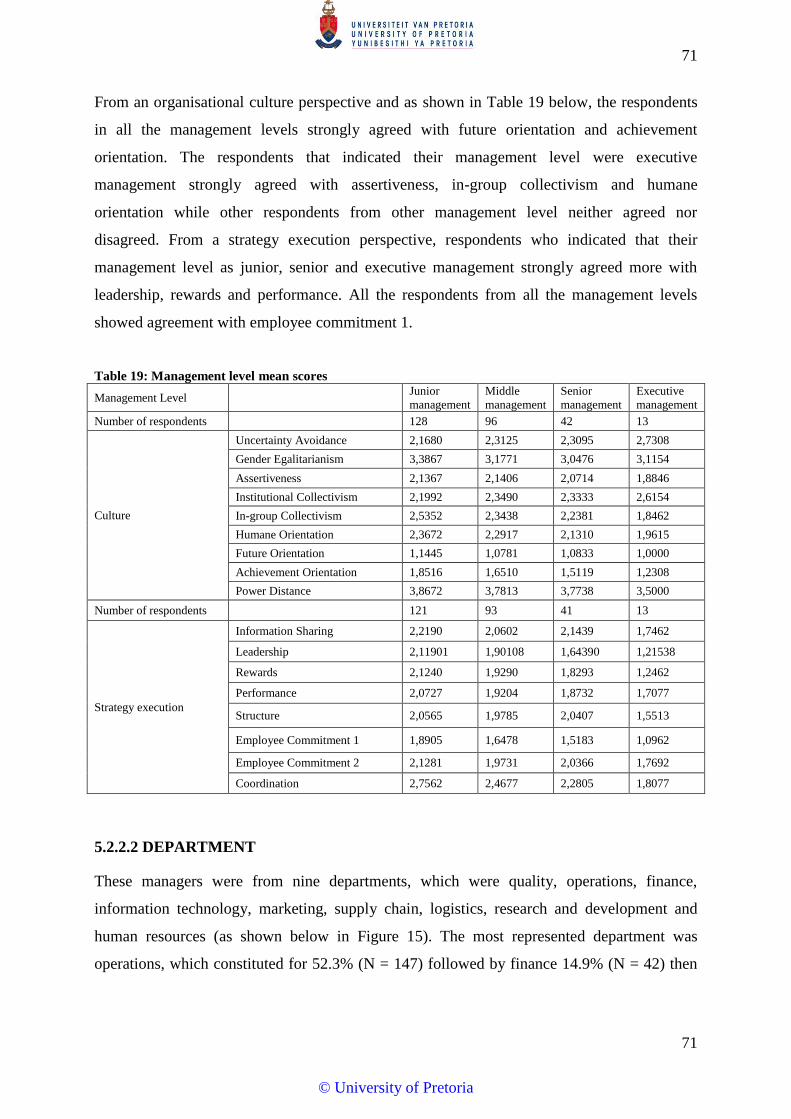
71
71
From an organisational culture perspective and as shown in Table 19 below, the respondents
in all the management levels strongly agreed with future orientation and achievement
orientation. The respondents that indicated their management level were executive
management strongly agreed with assertiveness, in-group collectivism and humane
orientation while other respondents from other management level neither agreed nor
disagreed. From a strategy execution perspective, respondents who indicated that their
management level as junior, senior and executive management strongly agreed more with
leadership, rewards and performance. All the respondents from all the management levels
showed agreement with employee commitment 1.
Table 19: Management level mean scores
Management Level Junior
management
Middle
management
Senior
management
Executive
management
Number of respondents 128 96 42 13
Culture
Uncertainty Avoidance 2,1680 2,3125 2,3095 2,7308
Gender Egalitarianism 3,3867 3,1771 3,0476 3,1154
Assertiveness 2,1367 2,1406 2,0714 1,8846
Institutional Collectivism 2,1992 2,3490 2,3333 2,6154
In-group Collectivism 2,5352 2,3438 2,2381 1,8462
Humane Orientation 2,3672 2,2917 2,1310 1,9615
Future Orientation 1,1445 1,0781 1,0833 1,0000
Achievement Orientation 1,8516 1,6510 1,5119 1,2308
Power Distance 3,8672 3,7813 3,7738 3,5000
Number of respondents 121 93 41 13
Strategy execution
Information Sharing 2,2190 2,0602 2,1439 1,7462
Leadership 2,11901 1,90108 1,64390 1,21538
Rewards 2,1240 1,9290 1,8293 1,2462
Performance 2,0727 1,9204 1,8732 1,7077
Structure 2,0565 1,9785 2,0407 1,5513
Employee Commitment 1 1,8905 1,6478 1,5183 1,0962
Employee Commitment 2 2,1281 1,9731 2,0366 1,7692
Coordination 2,7562 2,4677 2,2805 1,8077
5.2.2.2 DEPARTMENT
These managers were from nine departments, which were quality, operations, finance,
information technology, marketing, supply chain, logistics, research and development and
human resources (as shown below in Figure 15). The most represented department was
operations, which constituted for 52.3% (N = 147) followed by finance 14.9% (N = 42) then
© University of Pretoria
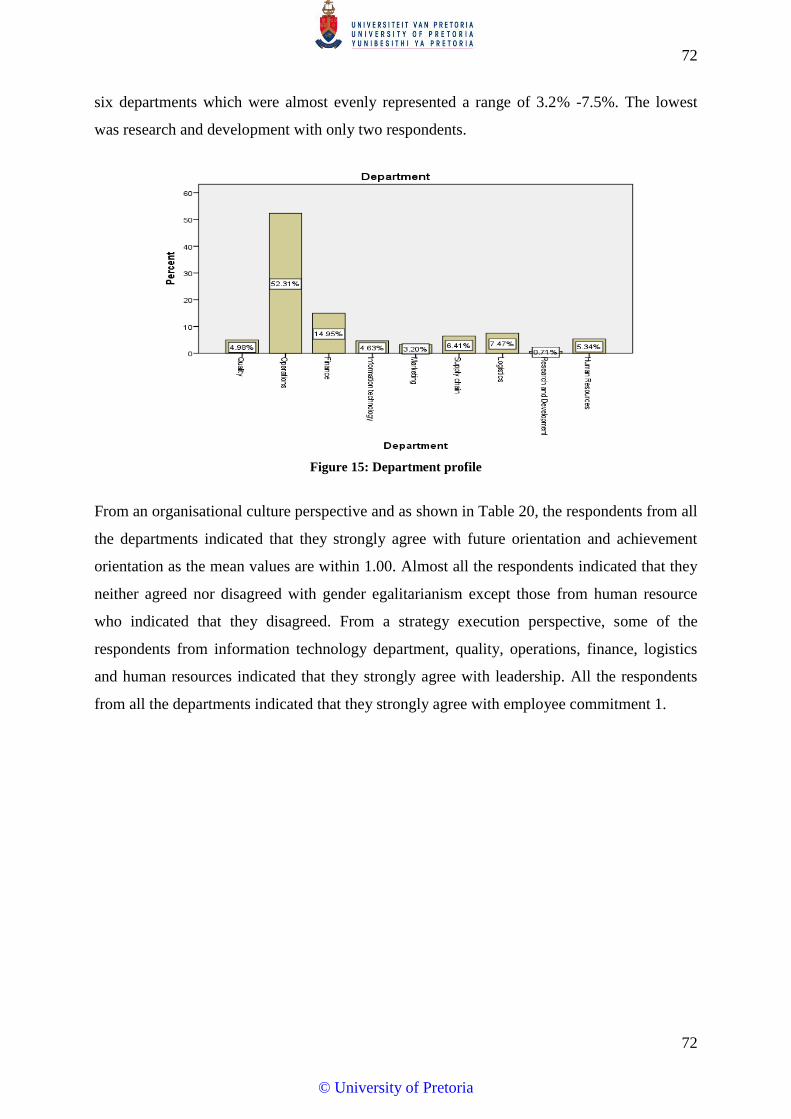
72
72
six departments which were almost evenly represented a range of 3.2% -7.5%. The lowest
was research and development with only two respondents.
Figure 15: Department profile
From an organisational culture perspective and as shown in Table 20, the respondents from all
the departments indicated that they strongly agree with future orientation and achievement
orientation as the mean values are within 1.00. Almost all the respondents indicated that they
neither agreed nor disagreed with gender egalitarianism except those from human resource
who indicated that they disagreed. From a strategy execution perspective, some of the
respondents from information technology department, quality, operations, finance, logistics
and human resources indicated that they strongly agree with leadership. All the respondents
from all the departments indicated that they strongly agree with employee commitment 1.
© University of Pretoria

73
73
Table 20: Department mean scores
Department
Quality Operations Finance Information
technology
Marketing Supply
chain
Logistics Research and
Development
Human
Resources
Number of
respondents
14 146 41 13 9 18 21 2 15
Culture
Uncertainty
Avoidance 2,3929 2,2397 2,1341 2,5000 3,1111 2,2778 2,0476 2,7500 2,2667
Gender
Egalitarianism 3,3929 3,2432 3,3293 3,1923 3,4444 3,0278 3,4048 3,2500 2,9667
Assertiveness 2,0357 2,0753 2,2683 2,1154 2,1111 2,2222 1,9286 2,7500 2,2333
Institutional
Collectivism 2,5714 2,2911 2,3049 2,4231 2,1111 2,2500 2,0952 1,5000 2,4000
In-group
Collectivism 2,3571 2,3767 2,4268 1,9615 2,5000 2,6944 2,3571 3,0000 2,4000
Humane
Orientation 2,3929 2,2740 2,4024 2,0385 2,7778 2,4444 1,8571 2,7500 2,2667
Future Orientation 1,1786 1,0959 1,1098 1,1538 1,1667 1,1111 1,0952 1,0000 1,0667
Achievement
Orientation 1,5714 1,7055 1,7927 1,4615 1,7222 1,9167 1,5714 1,7500 1,6667
Power Distance 3,7857 3,7911 3,8537 3,6923 3,8889 4,0000 3,7143 4,0000 3,7667
14 141 39 12 9 18 21 2 14
Strategy execution
Information
Sharing 2,1143 2,1113 2,3051 1,9250 2,5444 2,2944 1,8211 1,8500 1,9929
Leadership 1,8857 1,9404 1,933 1,5666 2,3777 2,0000 1,7157 3,2000 1,8428
Rewards 1,8143 1,9560 2,1231 1,6500 2,2222 2,2000 1,9053 1,8000 1,7429
Performance 1,8000 2,0156 2,0410 1,9333 2,2444 2,1111 1,6000 1,9000 1,7000
Structure 1,9643 1,9976 2,0427 1,9306 2,2222 2,1111 1,8246 2,4167 1,9405
Employee
Commitment 1 1,8036 1,7181 1,7500 1,7708 1,4167 1,5000 1,9342 1,6250 1,5536
Employee
Commitment 2 2,1786 2,0355 2,0897 2,0000 2,4444 2,0000 1,7895 1,5000 2,1071
Coordination 2,4286 2,4823 2,5000 2,5000 3,1667 2,9444 2,8421 1,2500 2,1786
© University of Pretoria

74
5.2.2.3 TENURE OF EMPLOYMENT IN THE ORGANISATION
Figure 16 shows that, respondents that had a tenure of eight or more years constituted for
32.74%. Respondents that had a tenure of three to seven years constituted for 42.0% (N =
118) and lastly respondents that had a tenure of zero to two years constituted for 25.27% of
the sample.
Figure 16: Tenure of employment profile
Table 21 as shown below, illustrates the cross tabulation between the number of years in
management and the duration of employment. Majority of the respondents were in the
management for 5 years or less (N=148) followed by 15 years and more (N =53) and 6-10
years (N = 51). The highest number of people within management had been employed for 3 –
7 years in the organisation (N = 118).
Table 21: Cross tabulation between tenure and years in management
How long have you been employed with the organisation? * Number of years in Management Cross tabulation
Count
Number of years in Management
Total 0-5 years 6-10years 11-15 years
15 years or
more
How long have you been
employed with the
organisation?
0-2 years 43 11 8 9 71
3-7 years 75 12 14 17 118
8 or more years 30 28 7 27 92
Total 148 51 29 53 281
© University of Pretoria
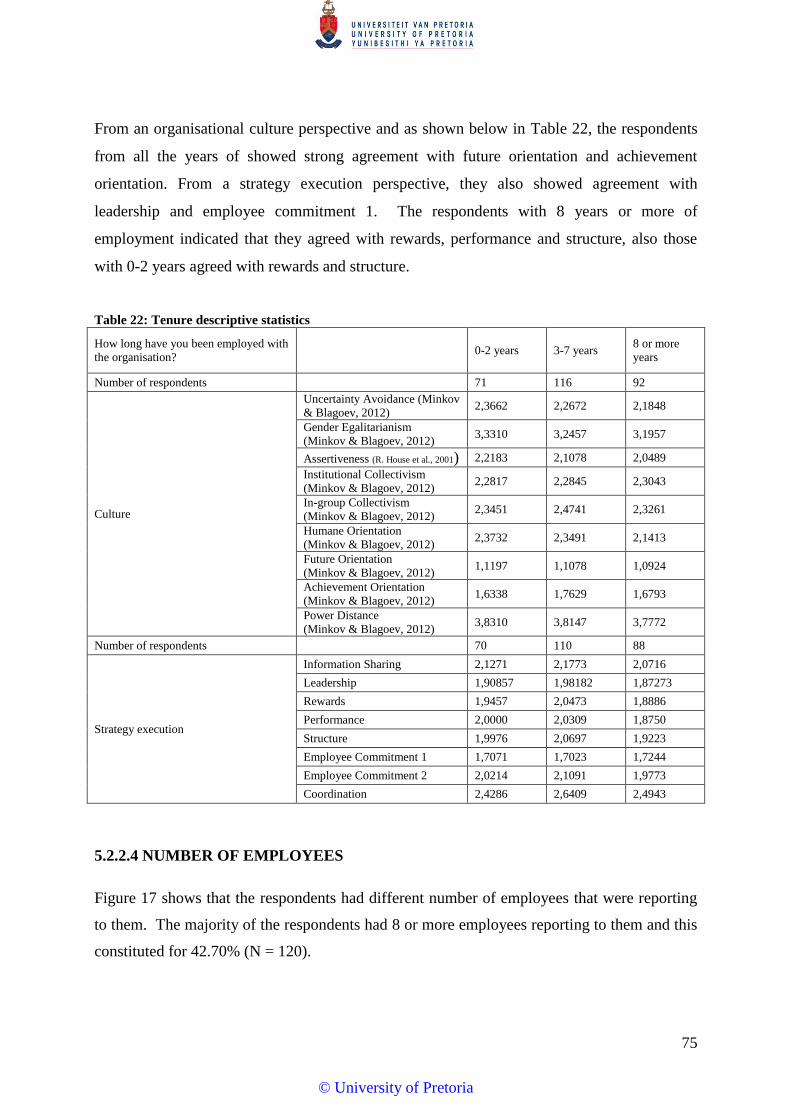
75
From an organisational culture perspective and as shown below in Table 22, the respondents
from all the years of showed strong agreement with future orientation and achievement
orientation. From a strategy execution perspective, they also showed agreement with
leadership and employee commitment 1. The respondents with 8 years or more of
employment indicated that they agreed with rewards, performance and structure, also those
with 0-2 years agreed with rewards and structure.
Table 22: Tenure descriptive statistics
How long have you been employed with
the organisation? 0-2 years 3-7 years
8 or more
years
Number of respondents 71 116 92
Culture
Uncertainty Avoidance (Minkov
& Blagoev, 2012) 2,3662 2,2672 2,1848
Gender Egalitarianism
(Minkov & Blagoev, 2012) 3,3310 3,2457 3,1957
Assertiveness (R. House et al., 2001) 2,2183 2,1078 2,0489
Institutional Collectivism
(Minkov & Blagoev, 2012) 2,2817 2,2845 2,3043
In-group Collectivism
(Minkov & Blagoev, 2012) 2,3451 2,4741 2,3261
Humane Orientation
(Minkov & Blagoev, 2012) 2,3732 2,3491 2,1413
Future Orientation
(Minkov & Blagoev, 2012) 1,1197 1,1078 1,0924
Achievement Orientation
(Minkov & Blagoev, 2012) 1,6338 1,7629 1,6793
Power Distance
(Minkov & Blagoev, 2012) 3,8310 3,8147 3,7772
Number of respondents 70 110 88
Strategy execution
Information Sharing 2,1271 2,1773 2,0716
Leadership 1,90857 1,98182 1,87273
Rewards 1,9457 2,0473 1,8886
Performance 2,0000 2,0309 1,8750
Structure 1,9976 2,0697 1,9223
Employee Commitment 1 1,7071 1,7023 1,7244
Employee Commitment 2 2,0214 2,1091 1,9773
Coordination 2,4286 2,6409 2,4943
5.2.2.4 NUMBER OF EMPLOYEES
Figure 17 shows that the respondents had different number of employees that were reporting
to them. The majority of the respondents had 8 or more employees reporting to them and this
constituted for 42.70% (N = 120).
© University of Pretoria
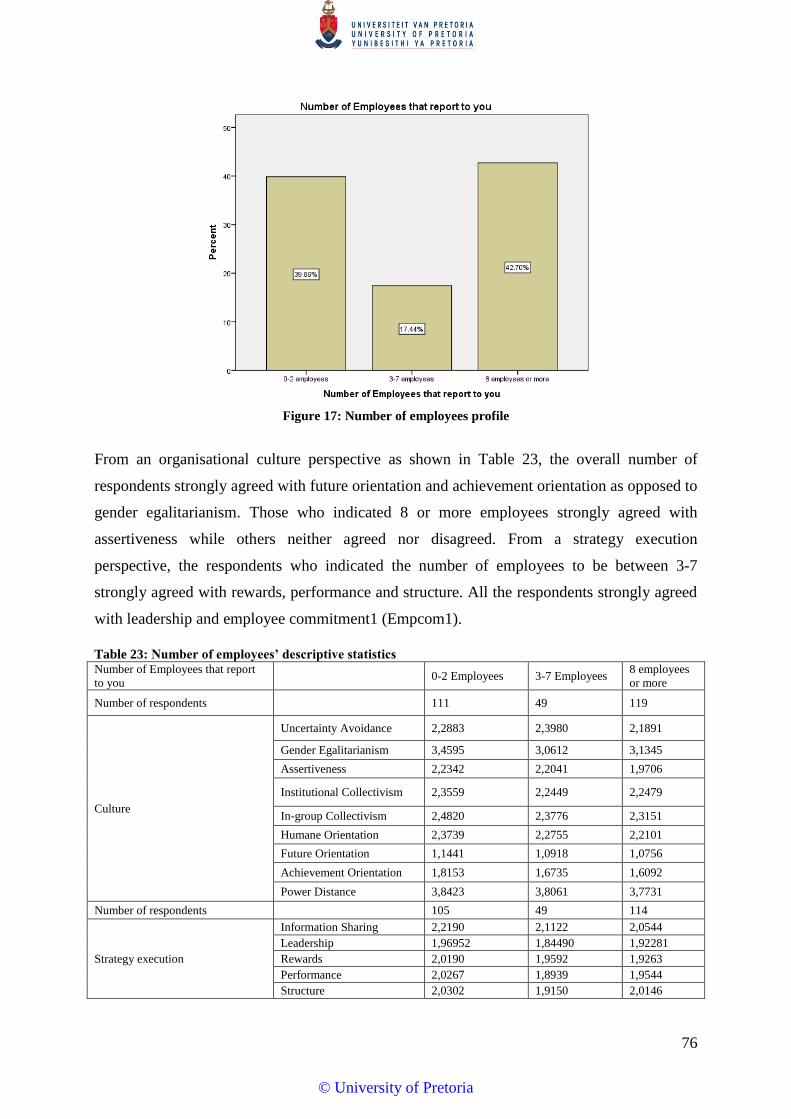
76
Figure 17: Number of employees profile
From an organisational culture perspective as shown in Table 23, the overall number of
respondents strongly agreed with future orientation and achievement orientation as opposed to
gender egalitarianism. Those who indicated 8 or more employees strongly agreed with
assertiveness while others neither agreed nor disagreed. From a strategy execution
perspective, the respondents who indicated the number of employees to be between 3-7
strongly agreed with rewards, performance and structure. All the respondents strongly agreed
with leadership and employee commitment1 (Empcom1).
Table 23: Number of employees’ descriptive statistics Number of Employees that report
to you 0-2 Employees 3-7 Employees
8 employees
or more
Number of respondents 111 49 119
Culture
Uncertainty Avoidance 2,2883 2,3980 2,1891
Gender Egalitarianism 3,4595 3,0612 3,1345
Assertiveness 2,2342 2,2041 1,9706
Institutional Collectivism 2,3559 2,2449 2,2479
In-group Collectivism 2,4820 2,3776 2,3151
Humane Orientation 2,3739 2,2755 2,2101
Future Orientation 1,1441 1,0918 1,0756
Achievement Orientation 1,8153 1,6735 1,6092
Power Distance 3,8423 3,8061 3,7731
Number of respondents 105 49 114
Strategy execution
Information Sharing 2,2190 2,1122 2,0544
Leadership 1,96952 1,84490 1,92281
Rewards 2,0190 1,9592 1,9263
Performance 2,0267 1,8939 1,9544
Structure 2,0302 1,9150 2,0146
© University of Pretoria

77
Employee Commitment 1 1,8143 1,7194 1,6118
Employee Commitment 2 2,0762 2,0000 2,0307
Coordination 2,6952 2,3367 2,4781
5.2.3 STRATEGY EXECUTION INFORMATION
5.2.3.1 STRATEGY IMPLEMENTATION
Figure 18 shows that the majority of respondents were involved in the strategy
implementation and constituted for 69.8% (N = 196), while the other 30.2% (N=85) were not
involved in the strategy implementation.
Figure 18: Strategy implementation profile
Table 24 shows that, of the 85 respondents that were not involved in strategy implementation,
majority were junior management (N=64) and this constituted for 72.29% of the respondents.
The other 21.18% (N = 18) respondents who were not involved in strategy implementation
were middle management.
Table 24: Cross tabulation between strategy implementation and management level
Management Level * Have you been involved in strategy implementation? Cross tabulation
Count
Have you been involved in strategy
implementation?
Total Yes No
Management Level Junior management 65 64 129
Middle management 79 18 97
© University of Pretoria
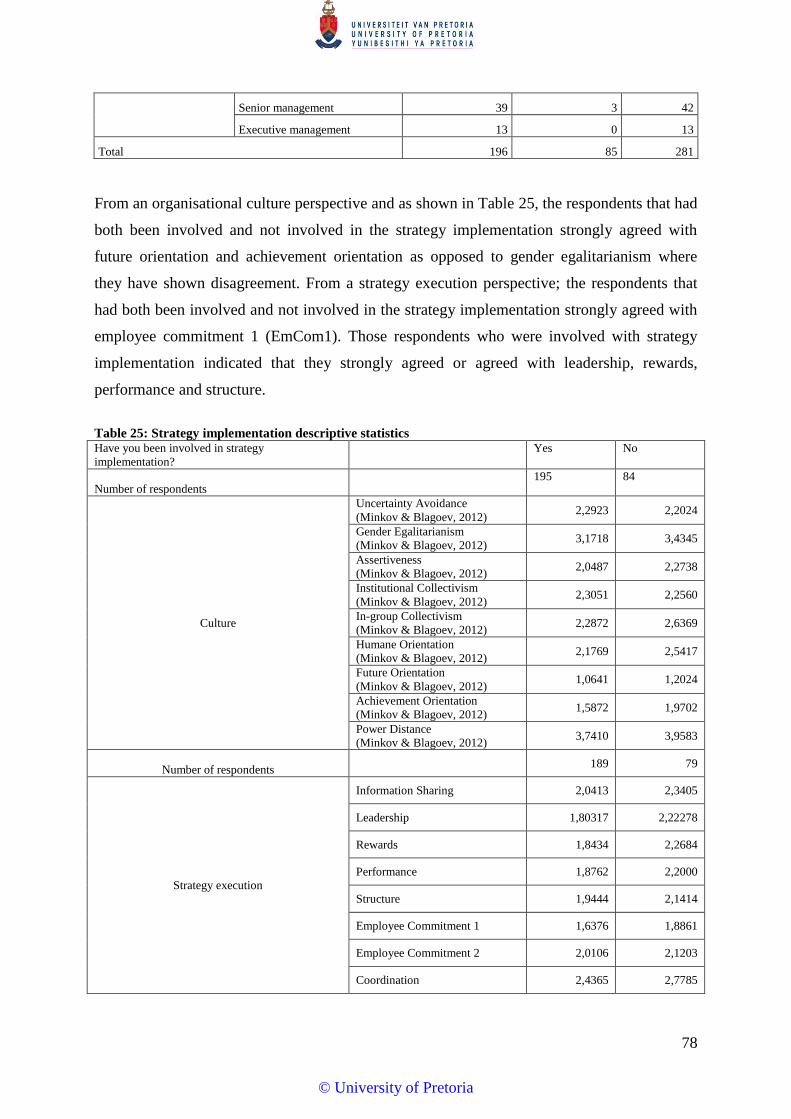
78
Senior management 39 3 42
Executive management 13 0 13
Total 196 85 281
From an organisational culture perspective and as shown in Table 25, the respondents that had
both been involved and not involved in the strategy implementation strongly agreed with
future orientation and achievement orientation as opposed to gender egalitarianism where
they have shown disagreement. From a strategy execution perspective; the respondents that
had both been involved and not involved in the strategy implementation strongly agreed with
employee commitment 1 (EmCom1). Those respondents who were involved with strategy
implementation indicated that they strongly agreed or agreed with leadership, rewards,
performance and structure.
Table 25: Strategy implementation descriptive statistics Have you been involved in strategy
implementation?
Yes No
Number of respondents 195 84
Culture
Uncertainty Avoidance
(Minkov & Blagoev, 2012) 2,2923 2,2024
Gender Egalitarianism
(Minkov & Blagoev, 2012) 3,1718 3,4345
Assertiveness
(Minkov & Blagoev, 2012) 2,0487 2,2738
Institutional Collectivism
(Minkov & Blagoev, 2012) 2,3051 2,2560
In-group Collectivism
(Minkov & Blagoev, 2012) 2,2872 2,6369
Humane Orientation
(Minkov & Blagoev, 2012) 2,1769 2,5417
Future Orientation
(Minkov & Blagoev, 2012) 1,0641 1,2024
Achievement Orientation
(Minkov & Blagoev, 2012) 1,5872 1,9702
Power Distance
(Minkov & Blagoev, 2012) 3,7410 3,9583
Number of respondents 189 79
Strategy execution
Information Sharing 2,0413 2,3405
Leadership 1,80317 2,22278
Rewards 1,8434 2,2684
Performance 1,8762 2,2000
Structure 1,9444 2,1414
Employee Commitment 1 1,6376 1,8861
Employee Commitment 2 2,0106 2,1203
Coordination 2,4365 2,7785
© University of Pretoria
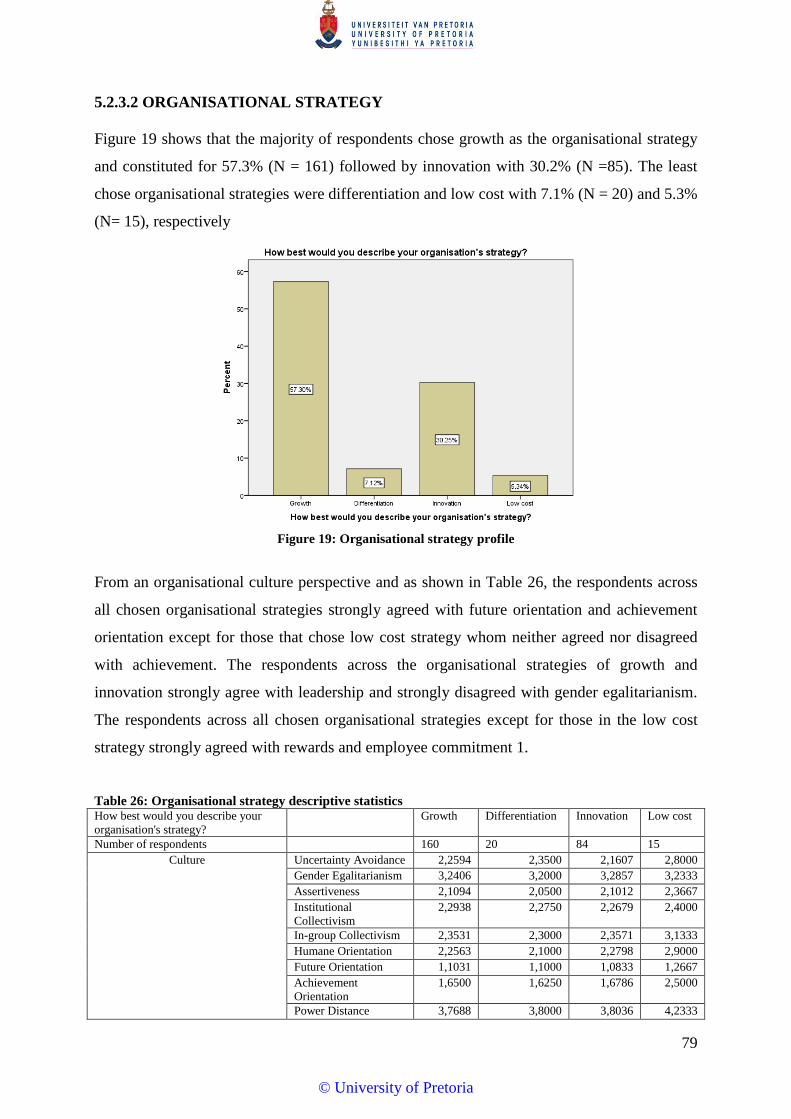
79
5.2.3.2 ORGANISATIONAL STRATEGY
Figure 19 shows that the majority of respondents chose growth as the organisational strategy
and constituted for 57.3% (N = 161) followed by innovation with 30.2% (N =85). The least
chose organisational strategies were differentiation and low cost with 7.1% (N = 20) and 5.3%
(N= 15), respectively
Figure 19: Organisational strategy profile
From an organisational culture perspective and as shown in Table 26, the respondents across
all chosen organisational strategies strongly agreed with future orientation and achievement
orientation except for those that chose low cost strategy whom neither agreed nor disagreed
with achievement. The respondents across the organisational strategies of growth and
innovation strongly agree with leadership and strongly disagreed with gender egalitarianism.
The respondents across all chosen organisational strategies except for those in the low cost
strategy strongly agreed with rewards and employee commitment 1.
Table 26: Organisational strategy descriptive statistics How best would you describe your
organisation's strategy?
Growth Differentiation Innovation Low cost
Number of respondents 160 20 84 15
Culture Uncertainty Avoidance 2,2594 2,3500 2,1607 2,8000
Gender Egalitarianism 3,2406 3,2000 3,2857 3,2333
Assertiveness 2,1094 2,0500 2,1012 2,3667
Institutional
Collectivism
2,2938 2,2750 2,2679 2,4000
In-group Collectivism 2,3531 2,3000 2,3571 3,1333
Humane Orientation 2,2563 2,1000 2,2798 2,9000
Future Orientation 1,1031 1,1000 1,0833 1,2667
Achievement
Orientation
1,6500 1,6250 1,6786 2,5000
Power Distance 3,7688 3,8000 3,8036 4,2333
© University of Pretoria
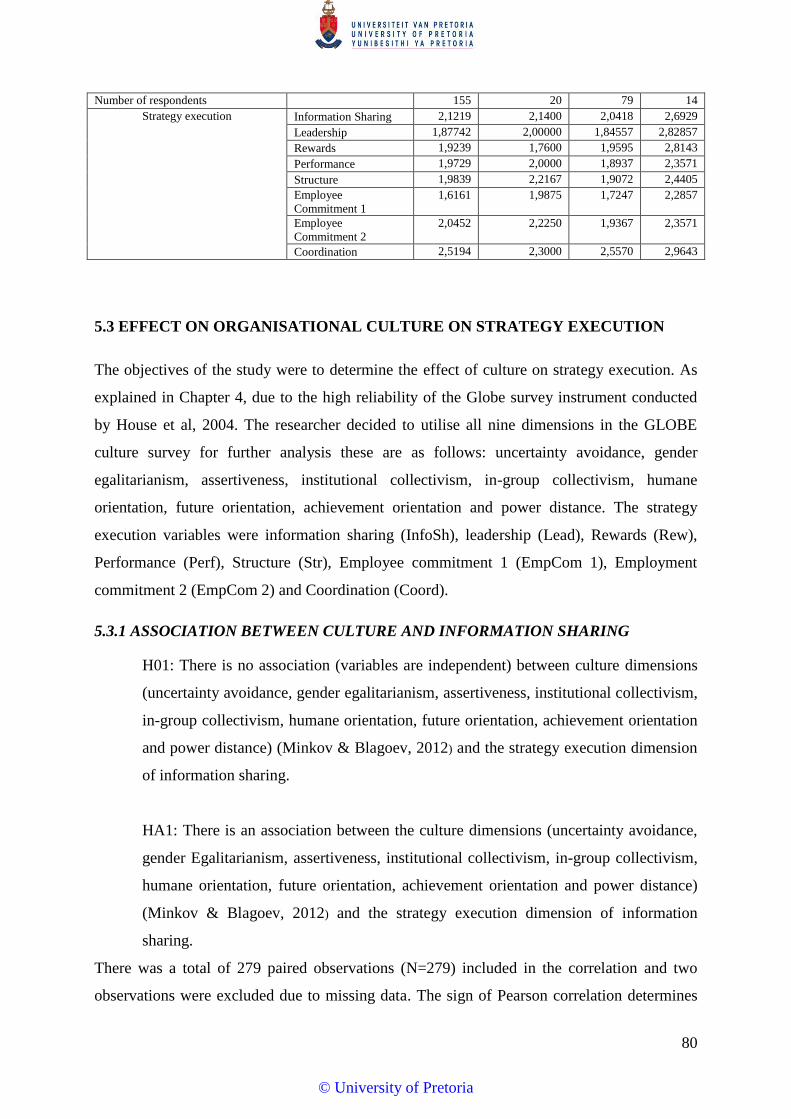
80
Number of respondents 155 20 79 14
Strategy execution Information Sharing 2,1219 2,1400 2,0418 2,6929
Leadership 1,87742 2,00000 1,84557 2,82857
Rewards 1,9239 1,7600 1,9595 2,8143
Performance 1,9729 2,0000 1,8937 2,3571
Structure 1,9839 2,2167 1,9072 2,4405
Employee
Commitment 1
1,6161 1,9875 1,7247 2,2857
Employee
Commitment 2
2,0452 2,2250 1,9367 2,3571
Coordination 2,5194 2,3000 2,5570 2,9643
5.3 EFFECT ON ORGANISATIONAL CULTURE ON STRATEGY EXECUTION
The objectives of the study were to determine the effect of culture on strategy execution. As
explained in Chapter 4, due to the high reliability of the Globe survey instrument conducted
by House et al, 2004. The researcher decided to utilise all nine dimensions in the GLOBE
culture survey for further analysis these are as follows: uncertainty avoidance, gender
egalitarianism, assertiveness, institutional collectivism, in-group collectivism, humane
orientation, future orientation, achievement orientation and power distance. The strategy
execution variables were information sharing (InfoSh), leadership (Lead), Rewards (Rew),
Performance (Perf), Structure (Str), Employee commitment 1 (EmpCom 1), Employment
commitment 2 (EmpCom 2) and Coordination (Coord).
5.3.1 ASSOCIATION BETWEEN CULTURE AND INFORMATION SHARING
H01: There is no association (variables are independent) between culture dimensions
(uncertainty avoidance, gender egalitarianism, assertiveness, institutional collectivism,
in-group collectivism, humane orientation, future orientation, achievement orientation
and power distance) (Minkov & Blagoev, 2012) and the strategy execution dimension
of information sharing.
HA1: There is an association between the culture dimensions (uncertainty avoidance,
gender Egalitarianism, assertiveness, institutional collectivism, in-group collectivism,
humane orientation, future orientation, achievement orientation and power distance)
(Minkov & Blagoev, 2012) and the strategy execution dimension of information
sharing.
There was a total of 279 paired observations (N=279) included in the correlation and two
observations were excluded due to missing data. The sign of Pearson correlation determines
© University of Pretoria

81
the nature of the association between the two variables. Thus in the case of a positive signs it
can be concluded that there is a positive association between these variables, this means that
both variables tend to get better or increase together. A negative sign indicates a negative
relationship or an inverse relationship, this means that when one variable increases the other
worsens. The magnitude of Pearson’s correlation determines the strength of the association.
Based on the guidelines of Pallant (2010) a r-value of 0.5 or greater between two variables
suggests a strong association, while a r-value of 0.3 to 0.49 suggests a medium association
and a r-value of 0.29 or less suggests a weak relationship. Association are regarded as
statistically significant with a p <.05.
The Pearson correlation table shown below for the nine organisational culture dimensions and
information sharing suggests that there are seven relationships that is uncertainty avoidance,
assertiveness, in-group collectivism, humane orientation, future orientation, achievement
orientation and power distance (R. House et al., 2001) with information sharing which are
statistically significant and two relationship that is gender egalitarianism and institutional
collectivism with information sharing that is not statistically significant.
Below is a description of the nature of the relationship (i.e. positive or negative) and strength
of the relationship for the seven statistically significant relationships between the culture
variables and information sharing (data based on Table 27:
Significant relationship between uncertainty avoidance and information sharing (strength
of the relationship- medium strength - 0.365). The relationship was positive.
Significant correlation between assertiveness and information sharing (weak strength -
0.268) and uncertainty avoidance (weak strength - 0.248). The relationships were positive.
Significant relationship between in-group collectivism and information sharing (strong
strength - 0.528); uncertainty avoidance (weak strength - 0.280); and assertiveness (weak
strength - 0.232). The relationships were positive.
Significant relationship between humane orientation and information sharing (strong
strength - 0.586); uncertainty avoidance (weak strength - 0.206); gender egalitarianism
(weak strength-0.126) assertiveness (weak strength - 0.255); in-group collectivism
(medium strength - 0.461). The relationships were positive.
Significant relationship between future orientation and information sharing (medium
strength - 0.476); uncertainty avoidance (weak strength - 0.285); gender egalitarianism
© University of Pretoria

82
(weak strength - 0.170); assertiveness (weak strength - 0.244); in-group collectivism
(medium strength - 0.366); humane orientation (medium strength - 0.337). The
relationships were positive.
Significant relationship between achievement orientation and information sharing (strong
strength - 0.692); uncertainty avoidance (weak strength - 0.264); assertiveness (medium
strength - 0.327); in-group collectivism (strong strength - 0.539); humane orientation
(strong strength - 0.552); future orientation (medium strength - 0.492). All the
relationships were positive.
Significant relationship between power distance and information sharing (strong strength -
0.568); uncertainty avoidance (weak strength - 0.248); gender egalitarianism (weak
strength - 0.121); assertiveness (weak strength - 0.235); in-group collectivism (medium
strength - 0.490); humane orientation (strong strength - 0.582); future orientation (medium
strength - 0.439); achievement orientation (strong strength - 0.553). All the relationships
were positive.
Table 27: Pearson correlation table - culture and information sharing Correlations
1 2 3 4 5 6 7 8 9 10
1. Information Sharing - - - - - - - - - -
2. Uncertainty Avoidance .365** - - - - - - - - -
3. Gender Egalitarianism ,098 ,082 - - - - - - - -
,108 ,173 - - - - - - - -
4. Assertiveness .268** .248** ,108 - - - - - - -
5. Institutional Collectivism -,088 ,070 -,081 ,101 - - - - - -
,150 ,247 ,179 ,091 - - - - - -
6. In-group Collectivism .528** .280** ,069 .232** ,071 - - - - -
7. Humane Orientation .586** .206** .126* .255** ,032 .461** - - - -
8. Future Orientation .476** .285** .170** .244** ,053 .366** .337** - - -
9. Achievement Orientation .692** .264** ,117 .327** ,014 .539** .552** .492** - -
10. Power Distance .568** .248** .121* .235** -,063 .490** .582** .439** .553** -
**. Correlation is significant at the 0.01 level (2-tailed).
In summary there were four strong positive associations between in-group collectivism,
humane orientation, achievement orientation and power distance and information sharing.
There were two medium associations between uncertainty avoidance, future orientation and
information sharing. And there was lastly one weak association between assertiveness and
information sharing. This means that the null hypothesis is rejected, and the alternative
hypothesis is partially accepted since seven out of the nine relationships are statistically
significant.
© University of Pretoria
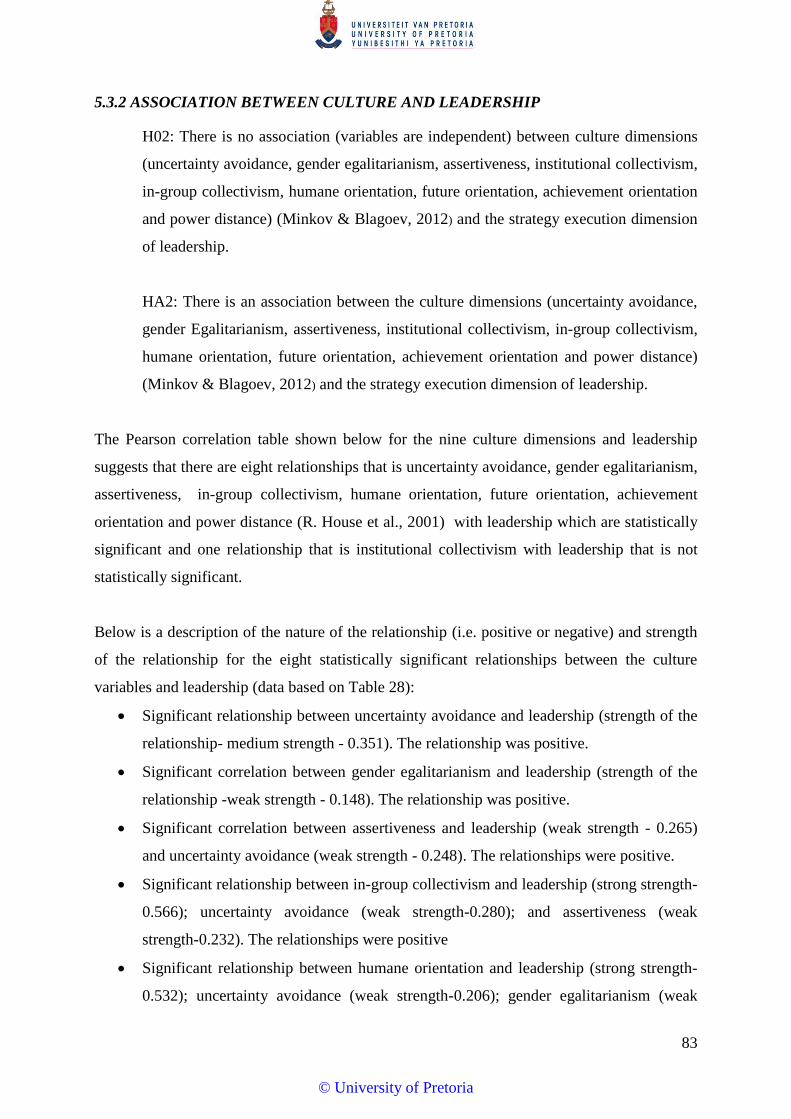
83
5.3.2 ASSOCIATION BETWEEN CULTURE AND LEADERSHIP
H02: There is no association (variables are independent) between culture dimensions
(uncertainty avoidance, gender egalitarianism, assertiveness, institutional collectivism,
in-group collectivism, humane orientation, future orientation, achievement orientation
and power distance) (Minkov & Blagoev, 2012) and the strategy execution dimension
of leadership.
HA2: There is an association between the culture dimensions (uncertainty avoidance,
gender Egalitarianism, assertiveness, institutional collectivism, in-group collectivism,
humane orientation, future orientation, achievement orientation and power distance)
(Minkov & Blagoev, 2012) and the strategy execution dimension of leadership.
The Pearson correlation table shown below for the nine culture dimensions and leadership
suggests that there are eight relationships that is uncertainty avoidance, gender egalitarianism,
assertiveness, in-group collectivism, humane orientation, future orientation, achievement
orientation and power distance (R. House et al., 2001) with leadership which are statistically
significant and one relationship that is institutional collectivism with leadership that is not
statistically significant.
Below is a description of the nature of the relationship (i.e. positive or negative) and strength
of the relationship for the eight statistically significant relationships between the culture
variables and leadership (data based on Table 28):
Significant relationship between uncertainty avoidance and leadership (strength of the
relationship- medium strength - 0.351). The relationship was positive.
Significant correlation between gender egalitarianism and leadership (strength of the
relationship -weak strength - 0.148). The relationship was positive.
Significant correlation between assertiveness and leadership (weak strength - 0.265)
and uncertainty avoidance (weak strength - 0.248). The relationships were positive.
Significant relationship between in-group collectivism and leadership (strong strength-
0.566); uncertainty avoidance (weak strength-0.280); and assertiveness (weak
strength-0.232). The relationships were positive
Significant relationship between humane orientation and leadership (strong strength-
0.532); uncertainty avoidance (weak strength-0.206); gender egalitarianism (weak
© University of Pretoria
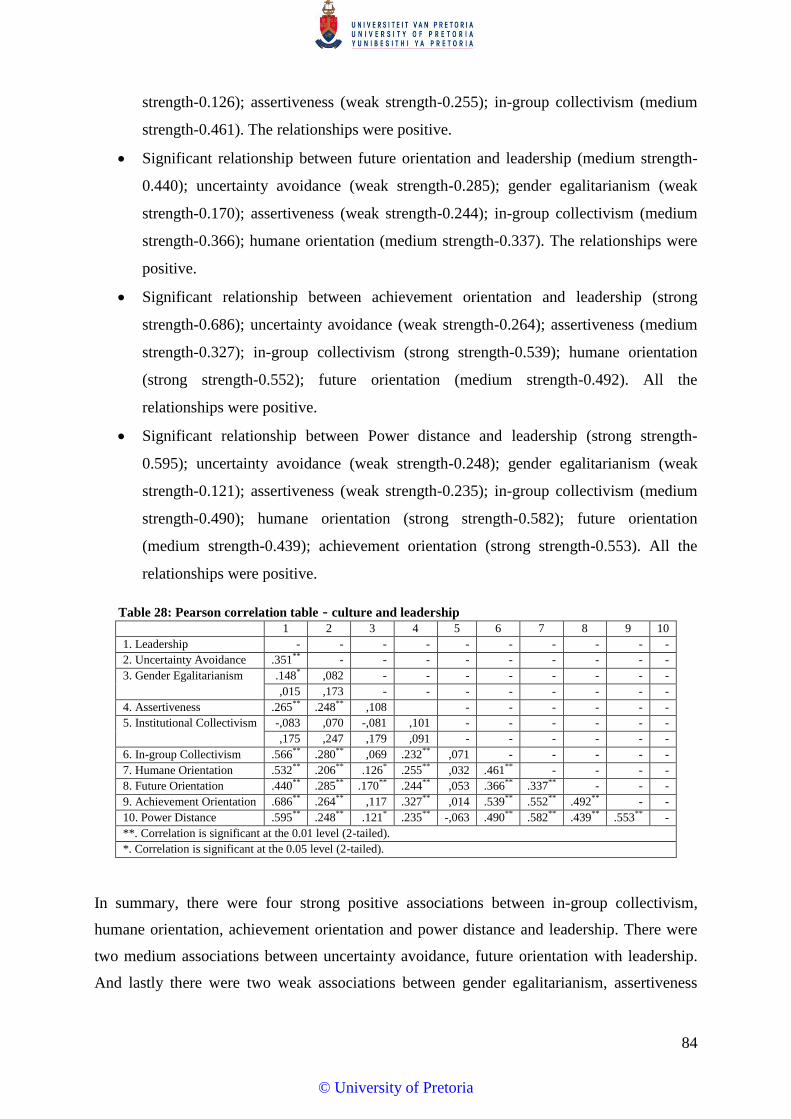
84
strength-0.126); assertiveness (weak strength-0.255); in-group collectivism (medium
strength-0.461). The relationships were positive.
Significant relationship between future orientation and leadership (medium strength-
0.440); uncertainty avoidance (weak strength-0.285); gender egalitarianism (weak
strength-0.170); assertiveness (weak strength-0.244); in-group collectivism (medium
strength-0.366); humane orientation (medium strength-0.337). The relationships were
positive.
Significant relationship between achievement orientation and leadership (strong
strength-0.686); uncertainty avoidance (weak strength-0.264); assertiveness (medium
strength-0.327); in-group collectivism (strong strength-0.539); humane orientation
(strong strength-0.552); future orientation (medium strength-0.492). All the
relationships were positive.
Significant relationship between Power distance and leadership (strong strength-
0.595); uncertainty avoidance (weak strength-0.248); gender egalitarianism (weak
strength-0.121); assertiveness (weak strength-0.235); in-group collectivism (medium
strength-0.490); humane orientation (strong strength-0.582); future orientation
(medium strength-0.439); achievement orientation (strong strength-0.553). All the
relationships were positive.
Table 28: Pearson correlation table - culture and leadership 1 2 3 4 5 6 7 8 9 10
1. Leadership - - - - - - - - - -
2. Uncertainty Avoidance .351** - - - - - - - - -
3. Gender Egalitarianism .148* ,082 - - - - - - - -
,015 ,173 - - - - - - - -
4. Assertiveness .265** .248** ,108 - - - - - -
5. Institutional Collectivism -,083 ,070 -,081 ,101 - - - - - -
,175 ,247 ,179 ,091 - - - - - -
6. In-group Collectivism .566** .280** ,069 .232** ,071 - - - - -
7. Humane Orientation .532** .206** .126* .255** ,032 .461** - - - -
8. Future Orientation .440** .285** .170** .244** ,053 .366** .337** - - -
9. Achievement Orientation .686** .264** ,117 .327** ,014 .539** .552** .492** - -
10. Power Distance .595** .248** .121* .235** -,063 .490** .582** .439** .553** -
**. Correlation is significant at the 0.01 level (2-tailed).
*. Correlation is significant at the 0.05 level (2-tailed).
In summary, there were four strong positive associations between in-group collectivism,
humane orientation, achievement orientation and power distance and leadership. There were
two medium associations between uncertainty avoidance, future orientation with leadership.
And lastly there were two weak associations between gender egalitarianism, assertiveness
© University of Pretoria

85
with leadership. This means that the null hypothesis is rejected, and the alternative hypothesis
is partially accepted since eight out of the nine relationships are statistically significant.
5.3.3 ASSOCIATION BETWEEN CULTURE AND REWARDS
H03: There is no association (variables are independent) between culture dimensions
(uncertainty avoidance, gender egalitarianism, assertiveness, institutional collectivism,
in-group collectivism, humane orientation, future orientation, achievement orientation
and power distance) (Minkov & Blagoev, 2012) and the strategy execution dimension
of rewards.
HA3: There is an association between the culture dimensions (uncertainty avoidance,
gender Egalitarianism, assertiveness, institutional collectivism, in-group collectivism,
humane orientation, future orientation, achievement orientation and power distance)
(Minkov & Blagoev, 2012) and the strategy execution dimension of rewards.
The Pearson correlation table shown below for the nine culture dimensions and rewards
suggests that there are seven relationships that is uncertainty avoidance, assertiveness, in-
group collectivism, humane orientation, future orientation, achievement orientation and power
distance (R. House et al., 2001) with rewards which are statistically significant and two
relationship that is gender egalitarianism and institutional collectivism with rewards that is not
statistically significant.
Below is a description of the nature of the relationship (i.e. positive or negative) and strength
of the relationship for the seven statistically significant relationships between the culture
variables and rewards (data based on Table 29):
Significant relationship between uncertainty avoidance and rewards (strength of the
relationship - weak strength - 0.240). The relationships were positive.
Significant relationship between assertiveness and rewards (medium strength - 0.336)
and uncertainty avoidance (weak strength - 0.248)
Significant relationship between in-group collectivism and rewards (strong strength -
0.525); uncertainty avoidance (weak strength - 0.280); and assertiveness (weak
strength - 0.232). All the relationships were positive.
© University of Pretoria

86
Significant relationship between humane orientation and rewards (medium strength -
0.494); uncertainty avoidance (weak strength - 0.206); gender egalitarianism (weak
strength - 0.126); assertiveness (weak strength - 0.255); in-group collectivism
(medium strength - 0.461). All the relationships were positive.
Significant relationship between future orientation and rewards (medium strength -
0.454); uncertainty avoidance (weak strength - 0.285); gender egalitarianism (weak
strength-0.170); assertiveness (medium strength - 0.244); in-group collectivism
(strong strength - 0.366); humane orientation (strong strength - 0.337). All the
relationships were positive.
Significant relationship between achievement orientation and rewards (strong strength
- 0.691); uncertainty avoidance (weak strength - 0.264); assertiveness (weak strength -
0.327); in-group collectivism (strong strength - 0.539); humane orientation (strong
strength - 0.552); future orientation (medium strength - 0.492). All the relationships
were positive.
Significant relationship between Power distance and rewards (strong strength - 0.536);
uncertainty avoidance (weak strength - 0.248); gender egalitarianism (weak strength -
0.121); assertiveness (weak strength - 0.235); in-group collectivism (medium strength
- 0.490); humane orientation (strong strength - 0.582); future orientation (medium
strength - 0.439); achievement orientation (strong strength - 0.553). All the
relationships were positive.
Table 29: Pearson correlation table - culture and rewards 1 2 3 4 5 6 7 8 9 10
1. Rewards - - - - - - - - - -
2. Uncertainty Avoidance .240** - - - - - - - - -
3. Gender Egalitarianism ,118 ,082 - - - - - - - -
,053 ,173 - - - - - - - -
4. Assertiveness .336** .248** ,108 - - - - - - -
5. Institutional Collectivism -,054 ,070 -,081 ,101 - - - - - -
,382 ,247 ,179 ,091 - - - - - -
6. In-group Collectivism .525** .280** ,069 .232** ,071 - - - - -
7. Humane Orientation .494** .206** .126* .255** ,032 .461** - - - -
8.Future Orientation .454** .285** .170** .244** ,053 .366** .337** - - -
9. Achievement Orientation .691** .264** ,117 .327** ,014 .539** .552** .492** - -
10. Power Distance .536** .248** .121* .235** -,063 .490** .582** .439** .553** -
**. Correlation is significant at the 0.01 level (2-tailed).
*. Correlation is significant at the 0.05 level (2-tailed).
In summary, there were three strong positive associations between in-group collectivism,
achievement orientation and power distance and rewards. There were three medium
associations between assertiveness, humane orientation, and future orientation with rewards.
© University of Pretoria
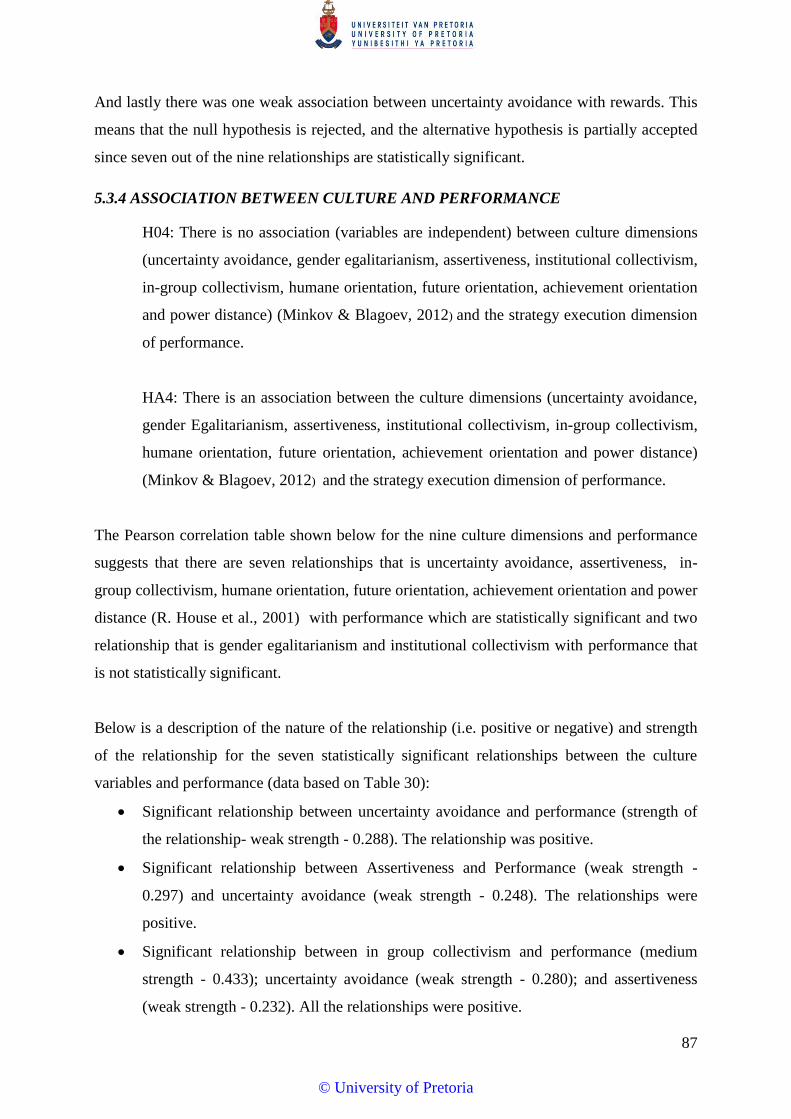
87
And lastly there was one weak association between uncertainty avoidance with rewards. This
means that the null hypothesis is rejected, and the alternative hypothesis is partially accepted
since seven out of the nine relationships are statistically significant.
5.3.4 ASSOCIATION BETWEEN CULTURE AND PERFORMANCE
H04: There is no association (variables are independent) between culture dimensions
(uncertainty avoidance, gender egalitarianism, assertiveness, institutional collectivism,
in-group collectivism, humane orientation, future orientation, achievement orientation
and power distance) (Minkov & Blagoev, 2012) and the strategy execution dimension
of performance.
HA4: There is an association between the culture dimensions (uncertainty avoidance,
gender Egalitarianism, assertiveness, institutional collectivism, in-group collectivism,
humane orientation, future orientation, achievement orientation and power distance)
(Minkov & Blagoev, 2012) and the strategy execution dimension of performance.
The Pearson correlation table shown below for the nine culture dimensions and performance
suggests that there are seven relationships that is uncertainty avoidance, assertiveness, in-
group collectivism, humane orientation, future orientation, achievement orientation and power
distance (R. House et al., 2001) with performance which are statistically significant and two
relationship that is gender egalitarianism and institutional collectivism with performance that
is not statistically significant.
Below is a description of the nature of the relationship (i.e. positive or negative) and strength
of the relationship for the seven statistically significant relationships between the culture
variables and performance (data based on Table 30):
Significant relationship between uncertainty avoidance and performance (strength of
the relationship- weak strength - 0.288). The relationship was positive.
Significant relationship between Assertiveness and Performance (weak strength -
0.297) and uncertainty avoidance (weak strength - 0.248). The relationships were
positive.
Significant relationship between in group collectivism and performance (medium
strength - 0.433); uncertainty avoidance (weak strength - 0.280); and assertiveness
(weak strength - 0.232). All the relationships were positive.
© University of Pretoria
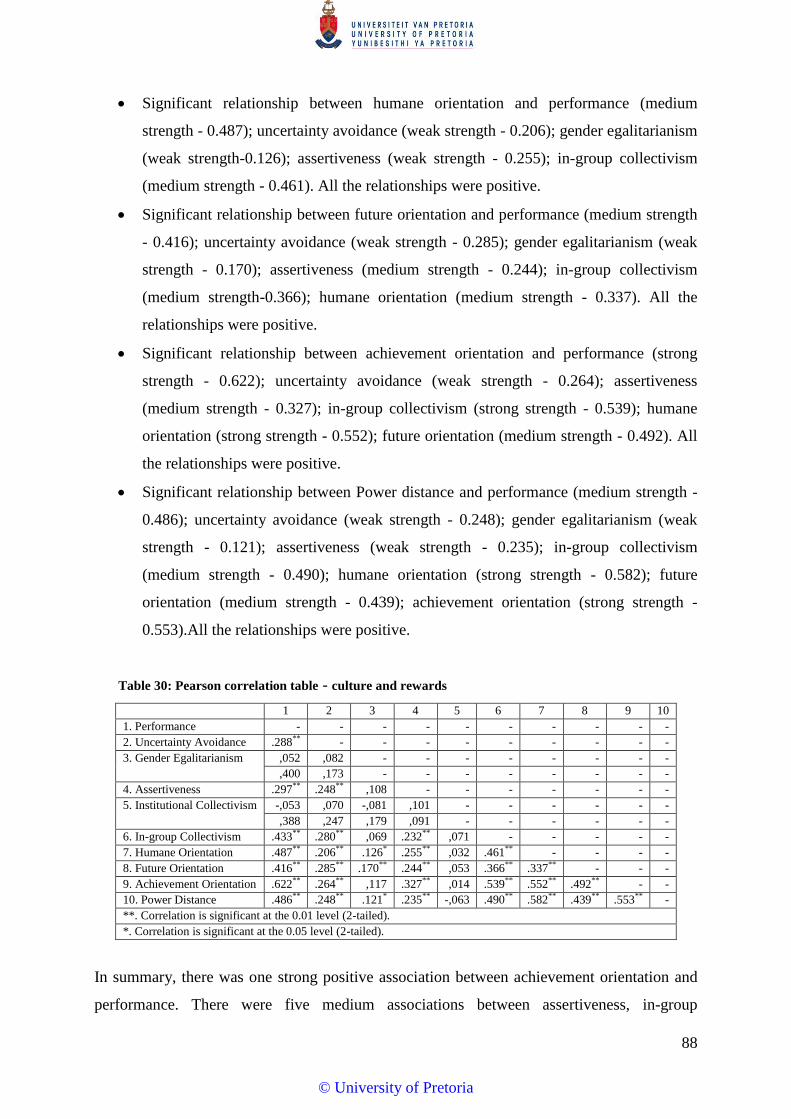
88
Significant relationship between humane orientation and performance (medium
strength - 0.487); uncertainty avoidance (weak strength - 0.206); gender egalitarianism
(weak strength-0.126); assertiveness (weak strength - 0.255); in-group collectivism
(medium strength - 0.461). All the relationships were positive.
Significant relationship between future orientation and performance (medium strength
- 0.416); uncertainty avoidance (weak strength - 0.285); gender egalitarianism (weak
strength - 0.170); assertiveness (medium strength - 0.244); in-group collectivism
(medium strength-0.366); humane orientation (medium strength - 0.337). All the
relationships were positive.
Significant relationship between achievement orientation and performance (strong
strength - 0.622); uncertainty avoidance (weak strength - 0.264); assertiveness
(medium strength - 0.327); in-group collectivism (strong strength - 0.539); humane
orientation (strong strength - 0.552); future orientation (medium strength - 0.492). All
the relationships were positive.
Significant relationship between Power distance and performance (medium strength -
0.486); uncertainty avoidance (weak strength - 0.248); gender egalitarianism (weak
strength - 0.121); assertiveness (weak strength - 0.235); in-group collectivism
(medium strength - 0.490); humane orientation (strong strength - 0.582); future
orientation (medium strength - 0.439); achievement orientation (strong strength -
0.553).All the relationships were positive.
Table 30: Pearson correlation table - culture and rewards
1 2 3 4 5 6 7 8 9 10
1. Performance - - - - - - - - - -
2. Uncertainty Avoidance .288** - - - - - - - - -
3. Gender Egalitarianism ,052 ,082 - - - - - - - -
,400 ,173 - - - - - - - -
4. Assertiveness .297** .248** ,108 - - - - - - -
5. Institutional Collectivism -,053 ,070 -,081 ,101 - - - - - -
,388 ,247 ,179 ,091 - - - - - -
6. In-group Collectivism .433** .280** ,069 .232** ,071 - - - - -
7. Humane Orientation .487** .206** .126* .255** ,032 .461** - - - -
8. Future Orientation .416** .285** .170** .244** ,053 .366** .337** - - -
9. Achievement Orientation .622** .264** ,117 .327** ,014 .539** .552** .492** - -
10. Power Distance .486** .248** .121* .235** -,063 .490** .582** .439** .553** -
**. Correlation is significant at the 0.01 level (2-tailed).
*. Correlation is significant at the 0.05 level (2-tailed).
In summary, there was one strong positive association between achievement orientation and
performance. There were five medium associations between assertiveness, in-group
© University of Pretoria
89
collectivism, humane orientation, future orientation and power distance and performance.
And lastly there was one weak association between uncertainty avoidance with performance.
This means that the null hypothesis is rejected, and the alternative hypothesis is partially
accepted since seven out of the nine relationships are statistically significant.
5.3.5 ASSOCIATION BETWEEN CULTURE AND STRUCTURE
H05: There is no association (variables are independent) between culture dimensions
(uncertainty avoidance, gender egalitarianism, assertiveness, institutional collectivism,
in-group collectivism, humane orientation, future orientation, achievement orientation
and power distance) (Minkov & Blagoev, 2012) and the strategy execution dimension
of structure.
HA5: There is an association between the culture dimensions (uncertainty avoidance,
gender Egalitarianism, assertiveness, institutional collectivism, in-group collectivism,
humane orientation, future orientation, achievement orientation and power distance)
(Minkov & Blagoev, 2012) and the strategy execution dimension of structure.
The Pearson correlation table shown below for the nine culture dimensions and structure
suggests that there are eight relationships that is uncertainty avoidance, gender egalitarianism,
assertiveness, in-group collectivism, humane orientation, future orientation, achievement
orientation and power distance (R. House et al., 2001) with structure which are statistically
significant and one relationship that is institutional collectivism with structure that is not
statistically significant.
Below is a description of the nature of the relationship (i.e. positive or negative) and strength
of the relationship for the eight statistically significant relationships between the culture
variables and structure (data based on Table 31):
Significant relationship between uncertainty avoidance and structure (strength of the
relationship - medium strength - 0.358). The relationship was positive.
Significant relationship between gender egalitarianism and structure (weak strength -
0.141). Positive relationship.
Significant relationship between Assertiveness and structure (weak strength - 0.249)
and uncertainty avoidance (weak strength - 0.248). The relationship was positive.
© University of Pretoria

90
Significant relationship in group collectivism and structure (medium strength - 0.488);
uncertainty avoidance (weak strength - 0.280); and assertiveness (weak strength -
0.232). The relationships were found positive.
Significant relationship between humane orientation and structure (medium strength -
0.416); uncertainty avoidance (weak strength - 0.206); gender egalitarianism (weak
strength - 0.126); assertiveness (weak strength - 0.255); in-group collectivism
(medium strength - 0.461). All the relationships were found positive.
Significant relationship between future orientation and structure (medium strength -
0.399); uncertainty avoidance (weak strength - 0.285); gender egalitarianism (weak
strength - 0.170); assertiveness (weak strength - 0.244); in-group collectivism
(medium strength - 0.366); humane orientation (medium strength - 0.337). All the
relationships were found positive.
Significant relationship between achievement orientation and structure (strong
strength-0.574); uncertainty avoidance (weak strength - 0.264); assertiveness (medium
strength -0.327); in-group collectivism (strong strength - 0.539); humane orientation
(strong strength - 0.552); future orientation (medium strength - 0.492). All the
relationships were found positive.
Significant relationship between Power distance and structure (strong strength -0.511);
uncertainty avoidance (weak strength - 0.248); gender egalitarianism (weak strength -
0.121); assertiveness (weak strength - 0.235); in-group collectivism (medium strength
- 0.490); humane orientation (strong strength - 0.582); future orientation (medium
strength - 0.439); achievement orientation (strong strength - 0.553). All the
relationships were found positive.
Table 31: Pearson correlation table - culture and structure
1 2 3 4 5 6 7 8 9 10
1. Structure - - - - - - - - - -
2. Uncertainty Avoidance .358** - - - - - - - - -
3. Gender Egalitarianism .141* ,082 - - - - - - - -
,021 ,173 - - - - - - - -
4. Assertiveness .249** .248** ,108 - - - - - - -
5. Institutional Collectivism -,067 ,070 -,081 ,101 - - - - - -
,276 ,247 ,179 ,091 - - - - - -
6. In-group Collectivism .488** .280** ,069 .232** ,071 - - - - -
7. Humane Orientation .416** .206** .126* .255** ,032 .461** - - - -
8. Future Orientation .399** .285** .170** .244** ,053 .366** .337** - - -
9. Achievement Orientation .574** .264** ,117 .327** ,014 .539** .552** .492** - -
10.Power Distance .511** .248** .121* .235** -,063 .490** .582** .439** .553** -
**. Correlation is significant at the 0.01 level (2-tailed).
*. Correlation is significant at the 0.05 level (2-tailed).
© University of Pretoria
91
In summary, there were two strong positive associations between achievement orientation,
power distance and structure. There were four medium associations between uncertainty
avoidance, in-group collectivism, humane orientation, future orientation and structure. And
lastly there were two weak associations between gender egalitarianism, assertiveness and
structure. This means that the null hypothesis is rejected, and the alternative hypothesis is
partially accepted since eight out of the nine relationships are statistically significant.
5.3.6 ASSOCIATION BETWEEN CULTURE AND EMPLOYEE’s COMMITMENT 1
H06: There is no association (variables are independent) between culture dimensions
(uncertainty avoidance, gender egalitarianism, assertiveness, institutional collectivism,
in-group collectivism, humane orientation, future orientation, achievement orientation
and power distance) (Minkov & Blagoev, 2012) and the strategy execution dimension
of employee commitment 1.
HA6: There is an association between the culture dimensions (uncertainty avoidance,
gender egalitarianism, assertiveness, institutional collectivism, in-group collectivism,
humane orientation, future orientation, achievement orientation and power distance)
(Minkov & Blagoev, 2012) and the strategy execution dimension of employee
commitment 1.
The Pearson correlation table shown below for the nine culture dimensions and employee
commitment 1 suggests that there are nine relationships that is uncertainty avoidance, gender
egalitarianism, assertiveness, institutional collectivism, in-group collectivism, humane
orientation, future orientation, achievement orientation and power distance (R. House et al.,
2001) with employee commitment 1 which are statistically significant.
Below is a description of the nature of the relationship (i.e. positive or negative) and strength
of the relationship for the nine statistically significant relationships between the culture
variables and employee commitment 1 (data based on Table 32):
Significance between uncertainty avoidance and employee commitment 1 (strength of
the relationship - weak strength - 0.121)
© University of Pretoria
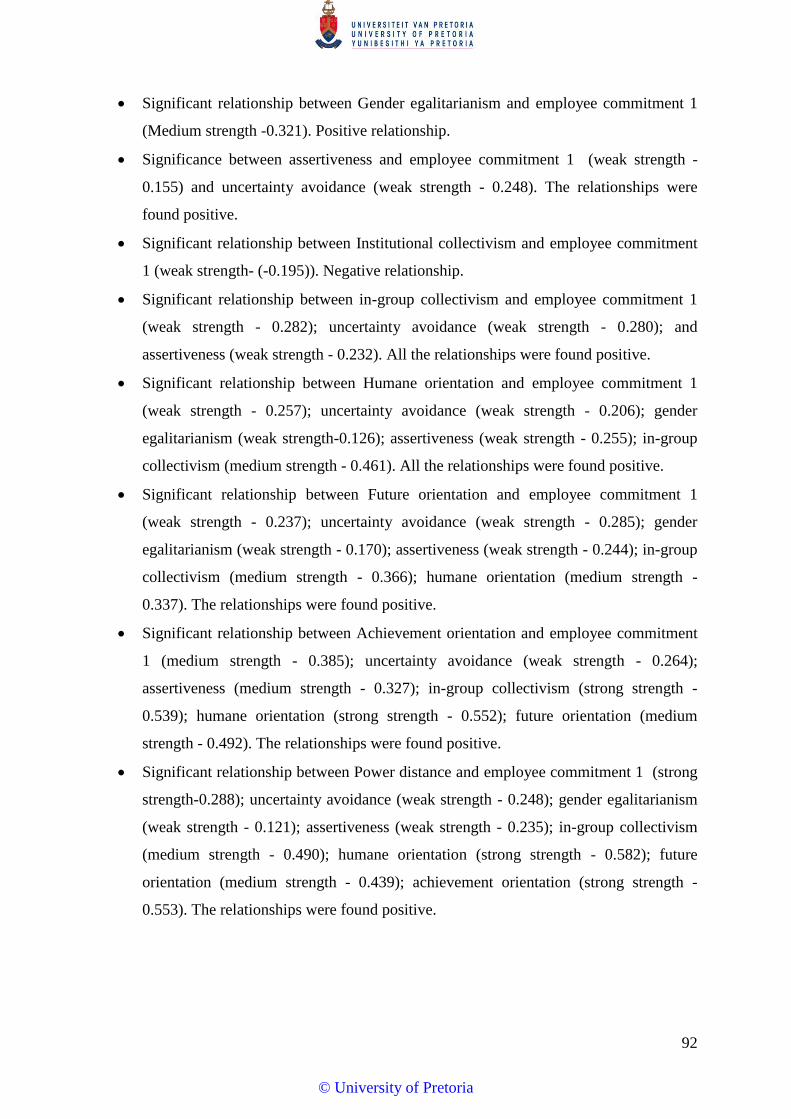
92
Significant relationship between Gender egalitarianism and employee commitment 1
(Medium strength -0.321). Positive relationship.
Significance between assertiveness and employee commitment 1 (weak strength -
0.155) and uncertainty avoidance (weak strength - 0.248). The relationships were
found positive.
Significant relationship between Institutional collectivism and employee commitment
1 (weak strength- (-0.195)). Negative relationship.
Significant relationship between in-group collectivism and employee commitment 1
(weak strength - 0.282); uncertainty avoidance (weak strength - 0.280); and
assertiveness (weak strength - 0.232). All the relationships were found positive.
Significant relationship between Humane orientation and employee commitment 1
(weak strength - 0.257); uncertainty avoidance (weak strength - 0.206); gender
egalitarianism (weak strength-0.126); assertiveness (weak strength - 0.255); in-group
collectivism (medium strength - 0.461). All the relationships were found positive.
Significant relationship between Future orientation and employee commitment 1
(weak strength - 0.237); uncertainty avoidance (weak strength - 0.285); gender
egalitarianism (weak strength - 0.170); assertiveness (weak strength - 0.244); in-group
collectivism (medium strength - 0.366); humane orientation (medium strength -
0.337). The relationships were found positive.
Significant relationship between Achievement orientation and employee commitment
1 (medium strength - 0.385); uncertainty avoidance (weak strength - 0.264);
assertiveness (medium strength - 0.327); in-group collectivism (strong strength -
0.539); humane orientation (strong strength - 0.552); future orientation (medium
strength - 0.492). The relationships were found positive.
Significant relationship between Power distance and employee commitment 1 (strong
strength-0.288); uncertainty avoidance (weak strength - 0.248); gender egalitarianism
(weak strength - 0.121); assertiveness (weak strength - 0.235); in-group collectivism
(medium strength - 0.490); humane orientation (strong strength - 0.582); future
orientation (medium strength - 0.439); achievement orientation (strong strength -
0.553). The relationships were found positive.
© University of Pretoria
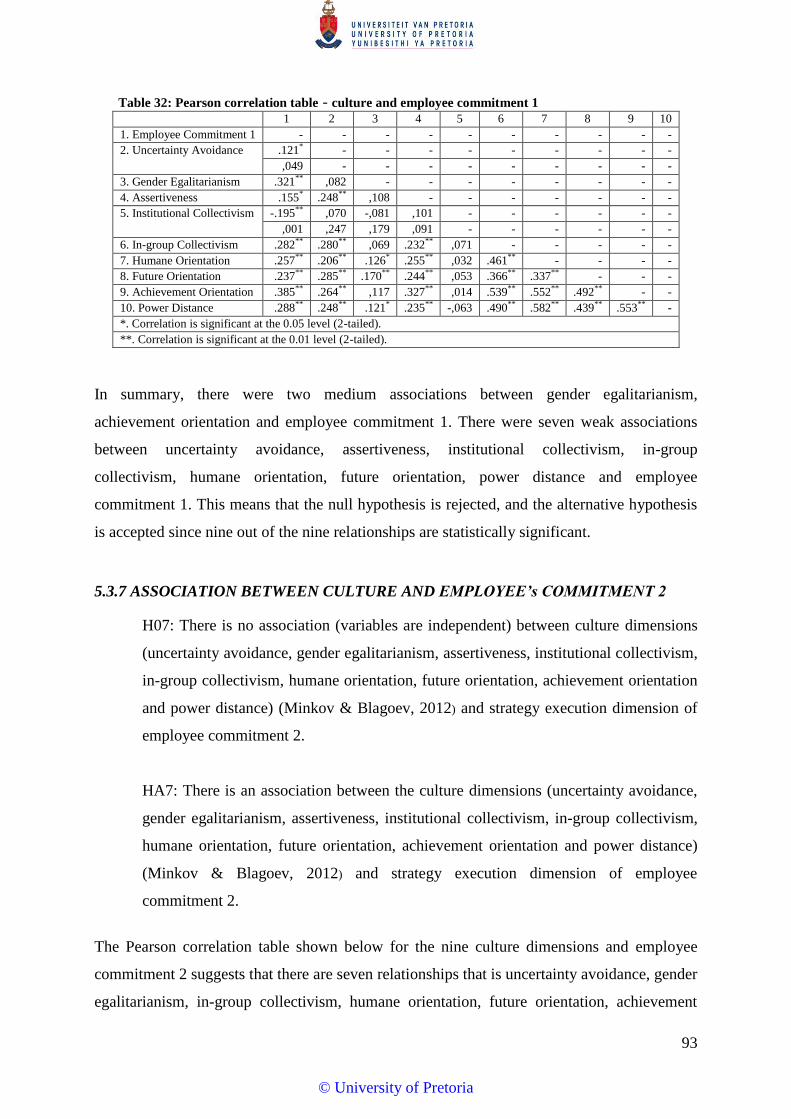
93
Table 32: Pearson correlation table - culture and employee commitment 1 1 2 3 4 5 6 7 8 9 10
1. Employee Commitment 1 - - - - - - - - - -
2. Uncertainty Avoidance .121* - - - - - - - - -
,049 - - - - - - - - -
3. Gender Egalitarianism .321** ,082 - - - - - - - -
4. Assertiveness .155* .248** ,108 - - - - - - -
5. Institutional Collectivism -.195** ,070 -,081 ,101 - - - - - -
,001 ,247 ,179 ,091 - - - - - -
6. In-group Collectivism .282** .280** ,069 .232** ,071 - - - - -
7. Humane Orientation .257** .206** .126* .255** ,032 .461** - - - -
8. Future Orientation .237** .285** .170** .244** ,053 .366** .337** - - -
9. Achievement Orientation .385** .264** ,117 .327** ,014 .539** .552** .492** - -
10. Power Distance .288** .248** .121* .235** -,063 .490** .582** .439** .553** -
*. Correlation is significant at the 0.05 level (2-tailed).
**. Correlation is significant at the 0.01 level (2-tailed).
In summary, there were two medium associations between gender egalitarianism,
achievement orientation and employee commitment 1. There were seven weak associations
between uncertainty avoidance, assertiveness, institutional collectivism, in-group
collectivism, humane orientation, future orientation, power distance and employee
commitment 1. This means that the null hypothesis is rejected, and the alternative hypothesis
is accepted since nine out of the nine relationships are statistically significant.
5.3.7 ASSOCIATION BETWEEN CULTURE AND EMPLOYEE’s COMMITMENT 2
H07: There is no association (variables are independent) between culture dimensions
(uncertainty avoidance, gender egalitarianism, assertiveness, institutional collectivism,
in-group collectivism, humane orientation, future orientation, achievement orientation
and power distance) (Minkov & Blagoev, 2012) and strategy execution dimension of
employee commitment 2.
HA7: There is an association between the culture dimensions (uncertainty avoidance,
gender egalitarianism, assertiveness, institutional collectivism, in-group collectivism,
humane orientation, future orientation, achievement orientation and power distance)
(Minkov & Blagoev, 2012) and strategy execution dimension of employee
commitment 2.
The Pearson correlation table shown below for the nine culture dimensions and employee
commitment 2 suggests that there are seven relationships that is uncertainty avoidance, gender
egalitarianism, in-group collectivism, humane orientation, future orientation, achievement
© University of Pretoria
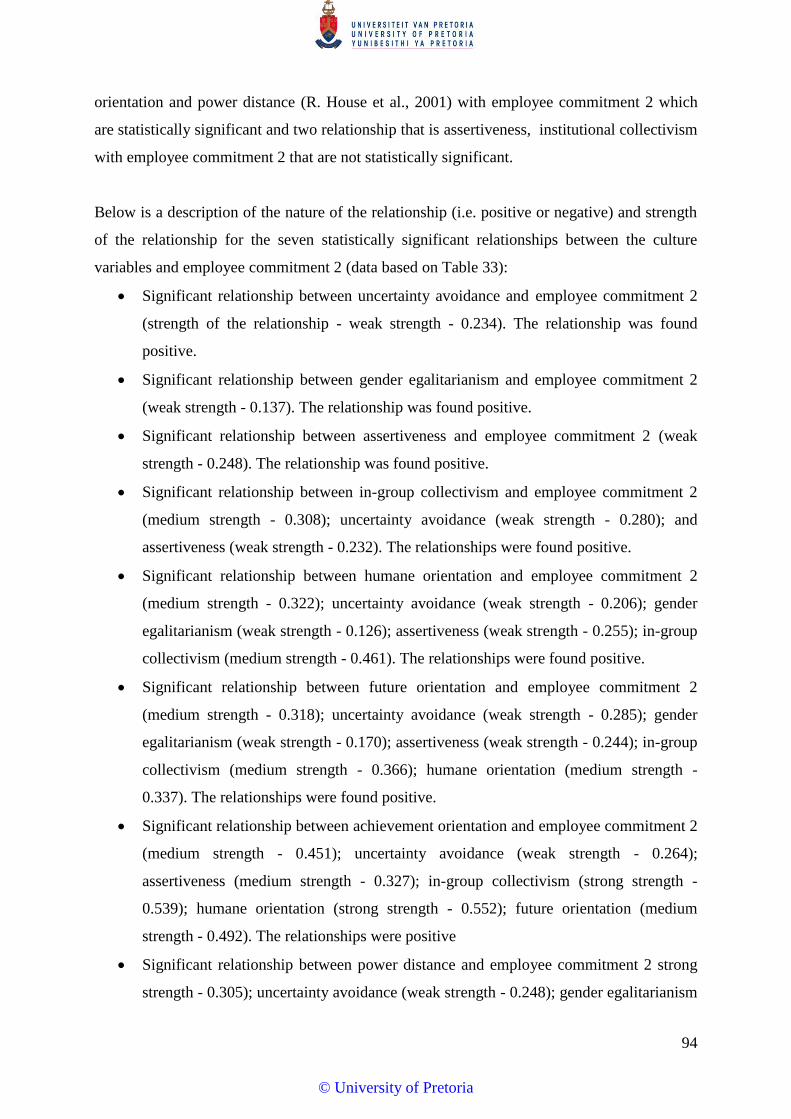
94
orientation and power distance (R. House et al., 2001) with employee commitment 2 which
are statistically significant and two relationship that is assertiveness, institutional collectivism
with employee commitment 2 that are not statistically significant.
Below is a description of the nature of the relationship (i.e. positive or negative) and strength
of the relationship for the seven statistically significant relationships between the culture
variables and employee commitment 2 (data based on Table 33):
Significant relationship between uncertainty avoidance and employee commitment 2
(strength of the relationship - weak strength - 0.234). The relationship was found
positive.
Significant relationship between gender egalitarianism and employee commitment 2
(weak strength - 0.137). The relationship was found positive.
Significant relationship between assertiveness and employee commitment 2 (weak
strength - 0.248). The relationship was found positive.
Significant relationship between in-group collectivism and employee commitment 2
(medium strength - 0.308); uncertainty avoidance (weak strength - 0.280); and
assertiveness (weak strength - 0.232). The relationships were found positive.
Significant relationship between humane orientation and employee commitment 2
(medium strength - 0.322); uncertainty avoidance (weak strength - 0.206); gender
egalitarianism (weak strength - 0.126); assertiveness (weak strength - 0.255); in-group
collectivism (medium strength - 0.461). The relationships were found positive.
Significant relationship between future orientation and employee commitment 2
(medium strength - 0.318); uncertainty avoidance (weak strength - 0.285); gender
egalitarianism (weak strength - 0.170); assertiveness (weak strength - 0.244); in-group
collectivism (medium strength - 0.366); humane orientation (medium strength -
0.337). The relationships were found positive.
Significant relationship between achievement orientation and employee commitment 2
(medium strength - 0.451); uncertainty avoidance (weak strength - 0.264);
assertiveness (medium strength - 0.327); in-group collectivism (strong strength -
0.539); humane orientation (strong strength - 0.552); future orientation (medium
strength - 0.492). The relationships were positive
Significant relationship between power distance and employee commitment 2 strong
strength - 0.305); uncertainty avoidance (weak strength - 0.248); gender egalitarianism
© University of Pretoria

95
(weak strength - 0.121); assertiveness (weak strength - 0.235); in-group collectivism
(medium strength - 0.490); humane orientation (strong strength - 0.582); future
orientation (medium strength - 0.439); achievement orientation (strong strength -
0.553). The relationships were positive.
Table 33: Pearson correlation table - culture and employee commitment 2 1 2 3 4 5 6 7 8 9 10
1. Employee Commitment 2 - - - - - - - - - -
2. Uncertainty Avoidance .234** - - - - - - - - -
3. Gender Egalitarianism .137* .082 - - - - - - - -
.025 .173 - - - - - - - -
4. Assertiveness .102 .248** .108 - - - - - - -
5. Institutional Collectivism -.038 .070 -.081 .101 - - - - - -
.534 .247 .179 .091 - - - - - -
6. In-group Collectivism .308** .280** .069 .232** .071 - - - - -
7. Humane Orientation .322** .206** .126* .255** .032 .461** - - - -
8. Future Orientation .318** .285** .170** .244** .053 .366** .337** - - -
9. Achievement Orientation .451** .264** .117 .327** .014 .539** .552** .492** - -
10. Power Distance .305** .248** .121* .235** -.063 .490** .582** .439** .553** -
**. Correlation is significant at the 0.01 level (2-tailed).
*. Correlation is significant at the 0.05 level (2-tailed).
In summary, there were five medium associations between in-group collectivism, humane
orientation, future orientation, achievement orientation, power distance and employee
commitment 2. There were two weak associations between uncertainty avoidance, gender
egalitarianism and employee commitment 2. This means that the null hypothesis is rejected,
and the alternative hypothesis is partially accepted since seven out of the nine relationships
are statistically significant.
5.3.8 ASSOCIATION BETWEEN CULTURE AND COORDINATION
H08: There is no association (variables are independent) between culture dimensions
(uncertainty avoidance, gender egalitarianism, assertiveness, institutional collectivism,
in-group collectivism, humane orientation, future orientation, achievement orientation
and power distance) (Minkov & Blagoev, 2012) and the strategy execution dimension
of coordination.
HA8: There is an association between the culture dimensions (uncertainty avoidance,
gender egalitarianism, assertiveness, institutional collectivism, in-group collectivism,
humane orientation, future orientation, achievement orientation and power distance)
(Minkov & Blagoev, 2012) and the strategy execution dimension of coordination.
© University of Pretoria

96
The Pearson correlation table shown below for the nine culture dimensions and coordination
suggests that there are seven relationships that is gender egalitarianism, institutional
collectivism, in-group collectivism, humane orientation, future orientation, achievement
orientation and power distance (R. House et al., 2001) with coordination which are
statistically significant and two relationship that is uncertainty avoidance, assertiveness and
coordination that are not statistically significant.
Below is a description of the nature of the relationship (i.e. positive or negative) and strength
of the relationship for the seven statistically significant relationships between the culture
variables and coordination (data based on Table 34):
Significant relationship between gender egalitarianism and coordination (weak
strength - 0.225). The relationship was found positive.
Significant relationship between assertiveness and uncertainty avoidance (weak
strength - 0.248). The relationship was found
Significant relationship between Institutional collectivism and coordination (weak
strength: (- 0.169). The relationship was found negative.
Significant relationship between in-group collectivism and coordination (medium
strength - 0.331); uncertainty avoidance (weak strength - 0.280); and assertiveness
(weak strength -0.232). The relationships were found positive.
Significant relationship between humane orientation and coordination (medium
strength - 0.328); uncertainty avoidance (weak strength - 0.206); gender egalitarianism
(weak strength - 0.126); assertiveness (weak strength - 0.255); in-group collectivism
(medium strength - 0.461). The relationships were found positive.
Significant relationship between future orientation and coordination (medium strength
-0.312); uncertainty avoidance (weak strength - 0.285); gender egalitarianism (weak
strength - 0.170); assertiveness (weak strength - 0.244); in-group collectivism
(medium strength - 0.366); humane orientation (medium strength - 0.337). The
relationships were found positive.
Significant relationship between achievement orientation and coordination (medium
strength - 0.419); uncertainty avoidance (weak strength - 0.285); assertiveness
(medium strength - 0.327); in-group collectivism (strong strength - 0.539); humane
© University of Pretoria
97
orientation (strong strength - 0.552); future orientation (medium strength - 0.492). The
relationships were found positive.
Significant relationship between power distance and coordination (strong strength -
0.363); uncertainty avoidance (weak strength - 0.248); gender egalitarianism (weak
strength-0.121); assertiveness (weak strength - 0.235); in-group collectivism (medium
strength - 0.490); humane orientation (strong strength - 0.582); future orientation
(medium strength - 0.439); achievement orientation (strong strength - 0.553). The
relationships were found positive.
Table 34: Pearson correlation table - culture and coordination 1 2 3 4 5 6 7 8 9 10
1. Coordination - - - - - - - - - -
2. Uncertainty Avoidance .068 - - - - - - - - -
3. Gender Egalitarianism .225** .082 - - - - - - - -
4. Assertiveness .086 .248** .108 - - - - - - -
5. Institutional Collectivism -.169** .070 -.081 .101 - - - - - -
.006 .247 .179 .091 - - - - - -
6. In-group Collectivism .331** .280** .069 .232** .071 - - - - -
7. Humane Orientation .328** .206** .126* .255** .032 .461** - - - -
8. Future Orientation .312** .285** .170** .244** .053 .366** .337** - - -
9. Achievement Orientation .419** .264** .117 .327** .014 .539** .552** .492** - -
10. Power Distance .363** .248** .121* .235** -.063 .490** .582** .439** .553** -
**. Correlation is significant at the 0.01 level (2-tailed).
*. Correlation is significant at the 0.05 level (2-tailed).
In summary, there were five medium associations between in-group collectivism, humane
orientation, future orientation, achievement orientation, power distance and coordination.
There were two weak associations between gender egalitarianism, institutional collectivism
and coordination. This means that the null hypothesis is rejected, and the alternative
hypothesis is partially accepted since seven out of the nine relationships are statistically
significant.
5.4 OVERALL EFFECT OF CULTURE ON STRATEGY EXECUTION
A canonical correlation analysis was conducted using the nine dimensions of organisational
culture (uncertainty avoidance, gender egalitarianism, assertiveness, institutional collectivism,
in-group collectivism, humane orientation, future orientation, achievement orientation and
power distance) (R. House et al., 2001) as predictors of the eight strategy execution variables
to evaluate the multivariate shared relationship between the two variable sets (i.e., culture and
strategy execution). There were 268 cases that were accepted with 13 cases rejected because
of missing data
© University of Pretoria
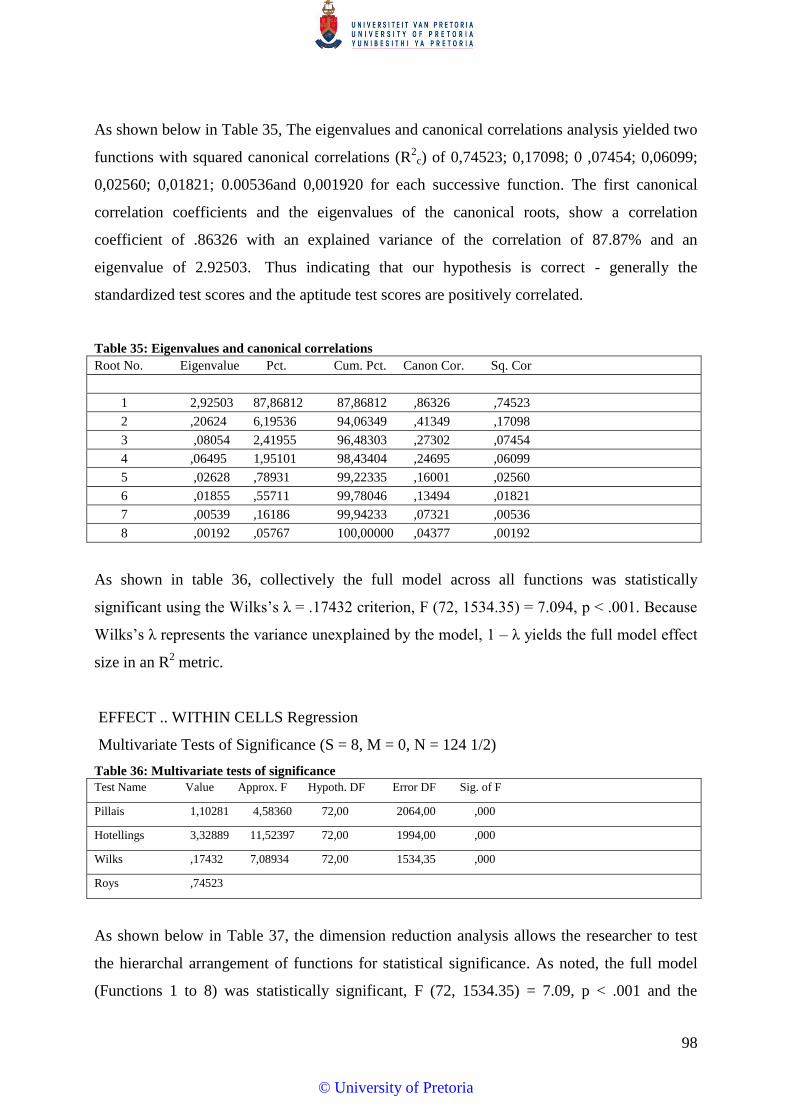
98
As shown below in Table 35, The eigenvalues and canonical correlations analysis yielded two
functions with squared canonical correlations (R2
c) of 0,74523; 0,17098; 0 ,07454; 0,06099;
0,02560; 0,01821; 0.00536and 0,001920 for each successive function. The first canonical
correlation coefficients and the eigenvalues of the canonical roots, show a correlation
coefficient of .86326 with an explained variance of the correlation of 87.87% and an
eigenvalue of 2.92503. Thus indicating that our hypothesis is correct - generally the
standardized test scores and the aptitude test scores are positively correlated.
Table 35: Eigenvalues and canonical correlations Root No. Eigenvalue Pct. Cum. Pct. Canon Cor. Sq. Cor
1 2,92503 87,86812 87,86812 ,86326 ,74523
2 ,20624 6,19536 94,06349 ,41349 ,17098
3 ,08054 2,41955 96,48303 ,27302 ,07454
4 ,06495 1,95101 98,43404 ,24695 ,06099
5 ,02628 ,78931 99,22335 ,16001 ,02560
6 ,01855 ,55711 99,78046 ,13494 ,01821
7 ,00539 ,16186 99,94233 ,07321 ,00536
8 ,00192 ,05767 100,00000 ,04377 ,00192
As shown in table 36, collectively the full model across all functions was statistically
significant using the Wilks’s λ = .17432 criterion, F (72, 1534.35) = 7.094, p < .001. Because
Wilks’s λ represents the variance unexplained by the model, 1 – λ yields the full model effect
size in an R2 metric.
EFFECT .. WITHIN CELLS Regression
Multivariate Tests of Significance (S = 8, M = 0, N = 124 1/2)
Table 36: Multivariate tests of significance Test Name Value Approx. F Hypoth. DF Error DF Sig. of F
Pillais 1,10281 4,58360 72,00 2064,00 ,000
Hotellings 3,32889 11,52397 72,00 1994,00 ,000
Wilks ,17432 7,08934 72,00 1534,35 ,000
Roys ,74523
As shown below in Table 37, the dimension reduction analysis allows the researcher to test
the hierarchal arrangement of functions for statistical significance. As noted, the full model
(Functions 1 to 8) was statistically significant, F (72, 1534.35) = 7.09, p < .001 and the
© University of Pretoria

99
Function 2 to 8was also statistically significant, F (56,1362.37) = 1.78, p < .001. The function
3 to 8, 4 to 8, 5 to 8, 6 to 8, 7 to 8 and 8 to 8 were all not statistical significant with all p value
>.05. Given the effects for each function, only the first two functions were considered
important in the context of the analysis since it had a shared variance of .916 (.745 +.171),
which is 91.6%.
Table 37: Dimension reduction analysis Roots Wilks L. F Hypoth. DF Error DF Sig. of F
1 TO 8 ,17432 7,08934 72,00 1534,35 ,000
2 TO 8 ,68420 1,77628 56,00 1362,37 ,000
3 TO 8 ,82531 1,18396 42,00 1190,13 ,198
4 TO 8 ,89179 ,98563 30,00 1018,00 ,489
5 TO 8 ,94971 ,66384 20,00 846,69 ,864
6 TO 8 ,97466 ,55048 12,00 677,60 ,882
7 TO 8 ,99273 ,31291 6,00 514,00 ,930
8 TO 8 ,99808 ,24767 2,00 258,00 ,781
As shown below in Table 38, the univariate analysis shows that all eight strategy execution
dimensions were statistically significant with p-value <.001, indicating that single or
combination of the nine culture dimensions predicted this relationship.
EFFECT .. WITHIN CELLS Regression (Cont.)
Univariate F-tests with (9;258) D. F.
Table 38: Univariate F-tests Variable Sq. Mul. R Adj. R-sq. Hypoth. MS Error MS F Sig. of F
Information sharing ,60166 ,58776 6,79321 ,15689 43,29856 ,000
Leadership ,58964 ,57533 12,01863 ,29178 41,19091 ,000
Rewards ,54645 ,53063 11,82625 ,34240 34,53879 ,000
Performance ,45389 ,43484 6,58568 ,27641 23,82592 ,000
Structure ,44042 ,42090 5,65737 ,25075 22,56195 ,000
Employee Commitment 2 ,26600 ,24039 3,12068 ,30040 10,38850 ,000
Employee Commitment 1 ,24563 ,21932 3,33666 ,35747 9,33418 ,000
Coordination ,27624 ,25100 7,32436 ,66941 10,94152 ,000
© University of Pretoria
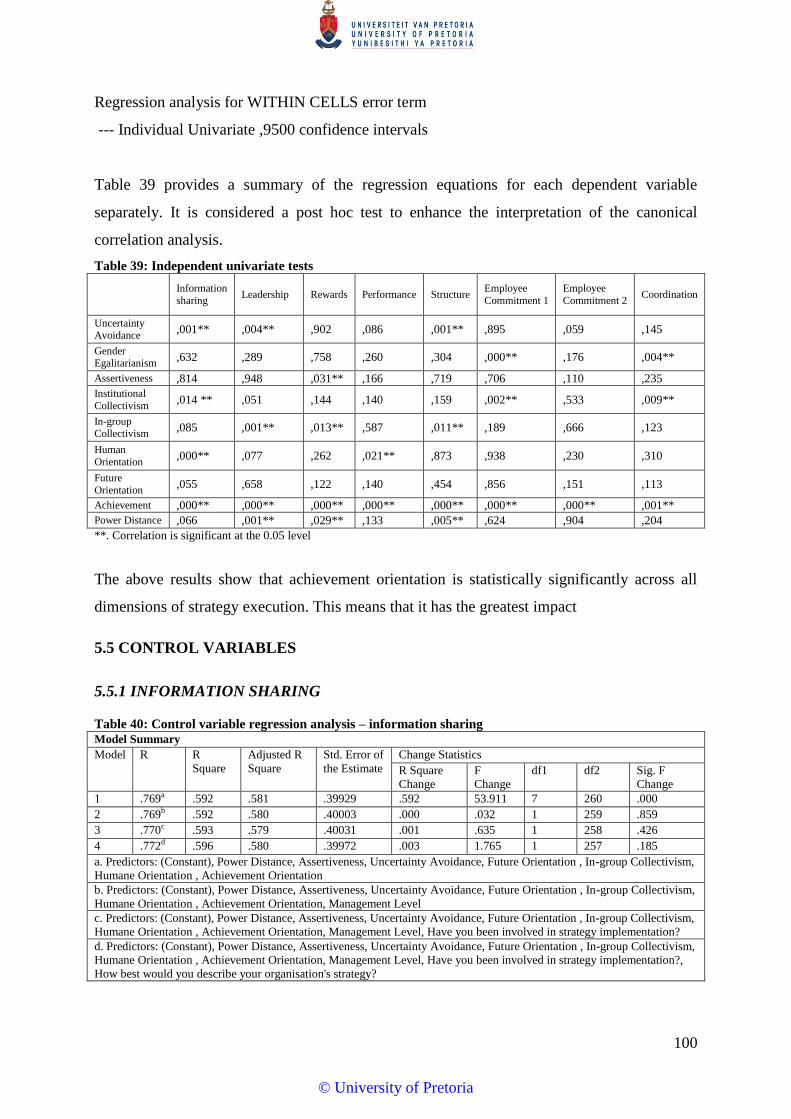
100
Regression analysis for WITHIN CELLS error term
--- Individual Univariate ,9500 confidence intervals
Table 39 provides a summary of the regression equations for each dependent variable
separately. It is considered a post hoc test to enhance the interpretation of the canonical
correlation analysis.
Table 39: Independent univariate tests
Information
sharing Leadership Rewards Performance Structure
Employee
Commitment 1
Employee
Commitment 2 Coordination
Uncertainty Avoidance
,001** ,004** ,902 ,086 ,001** ,895 ,059 ,145
Gender Egalitarianism
,632 ,289 ,758 ,260 ,304 ,000** ,176 ,004**
Assertiveness ,814 ,948 ,031** ,166 ,719 ,706 ,110 ,235
Institutional
Collectivism ,014 ** ,051 ,144 ,140 ,159 ,002** ,533 ,009**
In-group Collectivism
,085 ,001** ,013** ,587 ,011** ,189 ,666 ,123
Human
Orientation ,000** ,077 ,262 ,021** ,873 ,938 ,230 ,310
Future
Orientation ,055 ,658 ,122 ,140 ,454 ,856 ,151 ,113
Achievement ,000** ,000** ,000** ,000** ,000** ,000** ,000** ,001**
Power Distance ,066 ,001** ,029** ,133 ,005** ,624 ,904 ,204
**. Correlation is significant at the 0.05 level
The above results show that achievement orientation is statistically significantly across all
dimensions of strategy execution. This means that it has the greatest impact
5.5 CONTROL VARIABLES
5.5.1 INFORMATION SHARING
Table 40: Control variable regression analysis – information sharing Model Summary
Model R R
Square
Adjusted R
Square
Std. Error of
the Estimate
Change Statistics
R Square
Change
F
Change
df1 df2 Sig. F
Change
1 .769a .592 .581 .39929 .592 53.911 7 260 .000
2 .769b .592 .580 .40003 .000 .032 1 259 .859
3 .770c .593 .579 .40031 .001 .635 1 258 .426
4 .772d .596 .580 .39972 .003 1.765 1 257 .185
a. Predictors: (Constant), Power Distance, Assertiveness, Uncertainty Avoidance, Future Orientation , In-group Collectivism,
Humane Orientation , Achievement Orientation
b. Predictors: (Constant), Power Distance, Assertiveness, Uncertainty Avoidance, Future Orientation , In-group Collectivism,
Humane Orientation , Achievement Orientation, Management Level
c. Predictors: (Constant), Power Distance, Assertiveness, Uncertainty Avoidance, Future Orientation , In-group Collectivism,
Humane Orientation , Achievement Orientation, Management Level, Have you been involved in strategy implementation?
d. Predictors: (Constant), Power Distance, Assertiveness, Uncertainty Avoidance, Future Orientation , In-group Collectivism,
Humane Orientation , Achievement Orientation, Management Level, Have you been involved in strategy implementation?,
How best would you describe your organisation's strategy?
© University of Pretoria

101
Variance explained - (r2 = .592) which means that 59.2% of the variance in the
information sharing was explained by culture dimensions (a)
Control variables have no influence on the relationships since none are significant (Sig F
change – p-values > .05), with the R2 change being .000, .001 (0.1%) and .003 (0.3%) for
management level, strategy involvement and organisation strategy, respectively.
5.5.2 LEADERSHIP
Table 41: Control variable regression analysis – leadership Model Summary
Model R R
Square
Adjusted R
Square
Std. Error of
the Estimate
Change Statistics
R Square
Change
F
Change
df1 df2 Sig. F
Change
1 .764a .584 .571 .543126 .584 45.360 8 259 .000
2 .773b .598 .584 .534714 .014 9.214 1 258 .003
3 .773c .598 .582 .535751 .000 .002 1 257 .966
4 .773d .598 .581 .536721 .000 .072 1 256 .789
a. Predictors: (Constant), Gender Egalitarianism, In-group Collectivism, Assertiveness, Uncertainty Avoidance, Future
Orientation , Humane Orientation , Power Distance, Achievement Orientation
b. Predictors: (Constant), Gender Egalitarianism, In-group Collectivism, Assertiveness, Uncertainty Avoidance, Future
Orientation , Humane Orientation , Power Distance, Achievement Orientation, Management Level
c. Predictors: (Constant), Gender Egalitarianism, In-group Collectivism, Assertiveness, Uncertainty Avoidance, Future
Orientation , Humane Orientation , Power Distance, Achievement Orientation, Management Level, Have you been involved
in strategy implementation?
d. Predictors: (Constant), Gender Egalitarianism, In-group Collectivism, Assertiveness, Uncertainty Avoidance, Future
Orientation , Humane Orientation , Power Distance, Achievement Orientation, Management Level, Have you been involved
in strategy implementation?, How best would you describe your organisation's strategy?
Variance explained - (r2 = .584) which means that 58.4% of the variance in the leadership
was explained by culture dimensions (a)
Control variables management level had influence with p-value = .001 and r2 change of
1.4%. This means that management level positively influence the relationship between
culture dimensions (a) and leadership. The other variables had no influence on the
relationship (Sig F change – p-values > .05), with the R2 change being .000 for both
strategy involvement and organisation strategy.
5.5.3 REWARDS
Table 42: Control variable regression analysis – rewards Model Summary
Model R R Square Adjusted R
Square
Std. Error of the
Estimate
Change Statistics
R Square
Change
F Change df1 df2 Sig. F
Change
1 .736a .542 .530 .58557 .542 44.006 7 260 .000
2 .737b .543 .529 .58599 .001 .632 1 259 .427
3 .737c .543 .528 .58708 .000 .038 1 258 .845
4 .737d .544 .526 .58813 .000 .074 1 257 .786
a. Predictors: (Constant), Power Distance, Assertiveness, Uncertainty Avoidance, Future Orientation , In-group Collectivism,
Humane Orientation , Achievement Orientation
© University of Pretoria

102
b. Predictors: (Constant), Power Distance, Assertiveness, Uncertainty Avoidance, Future Orientation , In-group Collectivism,
Humane Orientation , Achievement Orientation, Management Level
c. Predictors: (Constant), Power Distance, Assertiveness, Uncertainty Avoidance, Future Orientation , In-group Collectivism,
Humane Orientation , Achievement Orientation, Management Level, Have you been involved in strategy implementation?
d. Predictors: (Constant), Power Distance, Assertiveness, Uncertainty Avoidance, Future Orientation , In-group Collectivism,
Humane Orientation , Achievement Orientation, Management Level, Have you been involved in strategy implementation?,
How best would you describe your organisation's strategy?
Variance explained - (r2 = .542) which means that 54.2% of the variance in the rewards
was explained by culture dimensions (a)
Control variables have no influence on the relationship since none are significant (Sig F
change – p-values > .05), with the R2 change being .001 (0.1%) for management level and
.000 for both strategy involvement and organisation strategy, respectively.
5.5.4 PERFORMANCE
Table 43: Control variable regression analysis – performance Model Summary
Model R R
Square
Adjusted R
Square
Std. Error of
the Estimate
Change Statistics
R Square
Change
F
Change
df1 df2 Sig. F
Change
1 .669a .447 .432 .52690 .447 30.052 7 260 .000
2 .669b .447 .430 .52792 .000 .000 1 259 .983
3 .669c .448 .429 .52861 .001 .321 1 258 .571
4 .674d .454 .433 .52674 .006 2.832 1 257 .094
a. Predictors: (Constant), Power Distance, Assertiveness, Uncertainty Avoidance, Future Orientation , In-group Collectivism,
Humane Orientation , Achievement Orientation
b. Predictors: (Constant), Power Distance, Assertiveness, Uncertainty Avoidance, Future Orientation , In-group Collectivism,
Humane Orientation , Achievement Orientation, Management Level
c. Predictors: (Constant), Power Distance, Assertiveness, Uncertainty Avoidance, Future Orientation , In-group Collectivism,
Humane Orientation , Achievement Orientation, Management Level, Have you been involved in strategy implementation?
d. Predictors: (Constant), Power Distance, Assertiveness, Uncertainty Avoidance, Future Orientation , In-group Collectivism,
Humane Orientation , Achievement Orientation, Management Level, Have you been involved in strategy implementation?,
How best would you describe your organisation's strategy?
Variance explained - (r2 = .447) which means that 44.7% of the variance in the
performance was explained by culture dimensions (a)
Control variables have no influence on the relationship since none are significant (Sig F
change – p-values > .05), with the R2 change being .000, .001 (0.1%) and .006 (0.6%) for
management level, strategy involvement and organisation strategy, respectively.
5.5.5 STRUCTURE
Table 44: Control variable regression analysis – structure Model Summary
Model R R Square Adjusted R
Square
Std. Error of
the Estimate
Change Statistics
R Square
Change
F Change df1 df2 Sig. F
Change
1 .660a .436 .419 .50171 .436 25.037 8 259 .000
2 .661b .437 .417 .50241 .001 .283 1 258 .595
3 .662c .438 .416 .50297 .001 .424 1 257 .516
© University of Pretoria
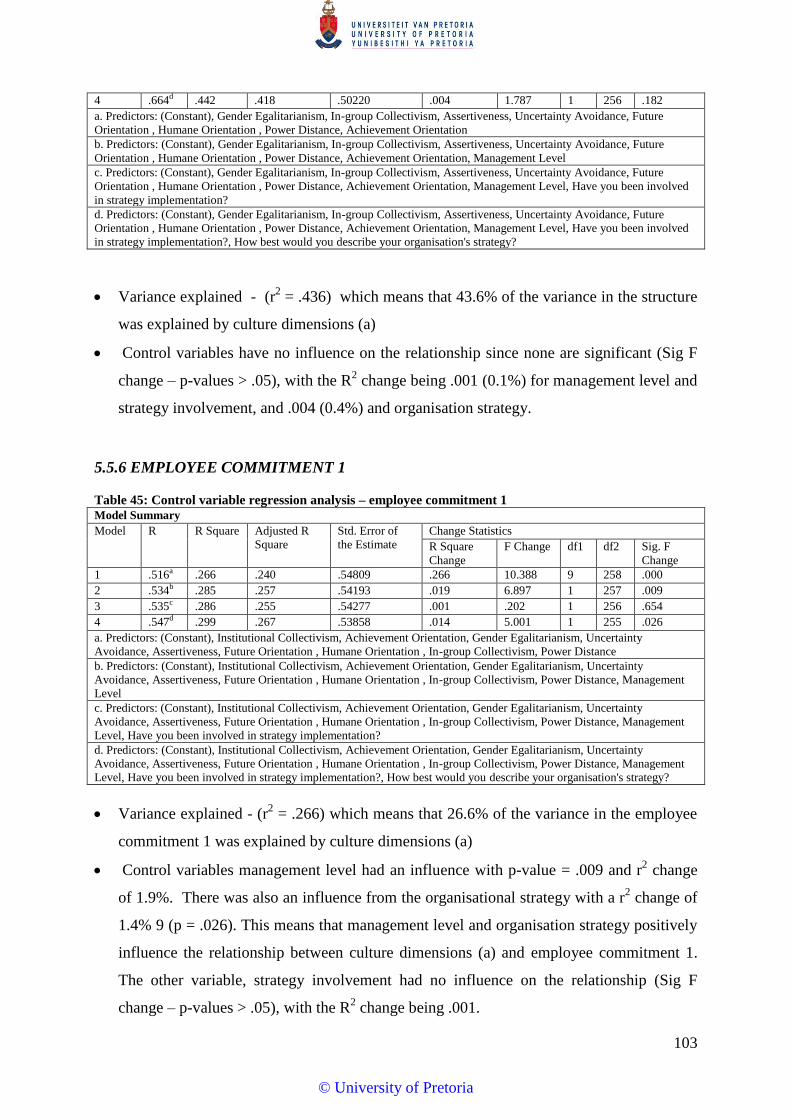
103
4 .664d .442 .418 .50220 .004 1.787 1 256 .182
a. Predictors: (Constant), Gender Egalitarianism, In-group Collectivism, Assertiveness, Uncertainty Avoidance, Future
Orientation , Humane Orientation , Power Distance, Achievement Orientation
b. Predictors: (Constant), Gender Egalitarianism, In-group Collectivism, Assertiveness, Uncertainty Avoidance, Future
Orientation , Humane Orientation , Power Distance, Achievement Orientation, Management Level
c. Predictors: (Constant), Gender Egalitarianism, In-group Collectivism, Assertiveness, Uncertainty Avoidance, Future
Orientation , Humane Orientation , Power Distance, Achievement Orientation, Management Level, Have you been involved
in strategy implementation?
d. Predictors: (Constant), Gender Egalitarianism, In-group Collectivism, Assertiveness, Uncertainty Avoidance, Future
Orientation , Humane Orientation , Power Distance, Achievement Orientation, Management Level, Have you been involved
in strategy implementation?, How best would you describe your organisation's strategy?
Variance explained - (r2 = .436) which means that 43.6% of the variance in the structure
was explained by culture dimensions (a)
Control variables have no influence on the relationship since none are significant (Sig F
change – p-values > .05), with the R2 change being .001 (0.1%) for management level and
strategy involvement, and .004 (0.4%) and organisation strategy.
5.5.6 EMPLOYEE COMMITMENT 1
Table 45: Control variable regression analysis – employee commitment 1 Model Summary
Model R R Square Adjusted R
Square
Std. Error of
the Estimate
Change Statistics
R Square
Change
F Change df1 df2 Sig. F
Change
1 .516a .266 .240 .54809 .266 10.388 9 258 .000
2 .534b .285 .257 .54193 .019 6.897 1 257 .009
3 .535c .286 .255 .54277 .001 .202 1 256 .654
4 .547d .299 .267 .53858 .014 5.001 1 255 .026
a. Predictors: (Constant), Institutional Collectivism, Achievement Orientation, Gender Egalitarianism, Uncertainty
Avoidance, Assertiveness, Future Orientation , Humane Orientation , In-group Collectivism, Power Distance
b. Predictors: (Constant), Institutional Collectivism, Achievement Orientation, Gender Egalitarianism, Uncertainty
Avoidance, Assertiveness, Future Orientation , Humane Orientation , In-group Collectivism, Power Distance, Management
Level
c. Predictors: (Constant), Institutional Collectivism, Achievement Orientation, Gender Egalitarianism, Uncertainty
Avoidance, Assertiveness, Future Orientation , Humane Orientation , In-group Collectivism, Power Distance, Management
Level, Have you been involved in strategy implementation?
d. Predictors: (Constant), Institutional Collectivism, Achievement Orientation, Gender Egalitarianism, Uncertainty
Avoidance, Assertiveness, Future Orientation , Humane Orientation , In-group Collectivism, Power Distance, Management
Level, Have you been involved in strategy implementation?, How best would you describe your organisation's strategy?
Variance explained - (r2 = .266) which means that 26.6% of the variance in the employee
commitment 1 was explained by culture dimensions (a)
Control variables management level had an influence with p-value = .009 and r2 change
of 1.9%. There was also an influence from the organisational strategy with a r2 change of
1.4% 9 (p = .026). This means that management level and organisation strategy positively
influence the relationship between culture dimensions (a) and employee commitment 1.
The other variable, strategy involvement had no influence on the relationship (Sig F
change – p-values > .05), with the R2 change being .001.
© University of Pretoria
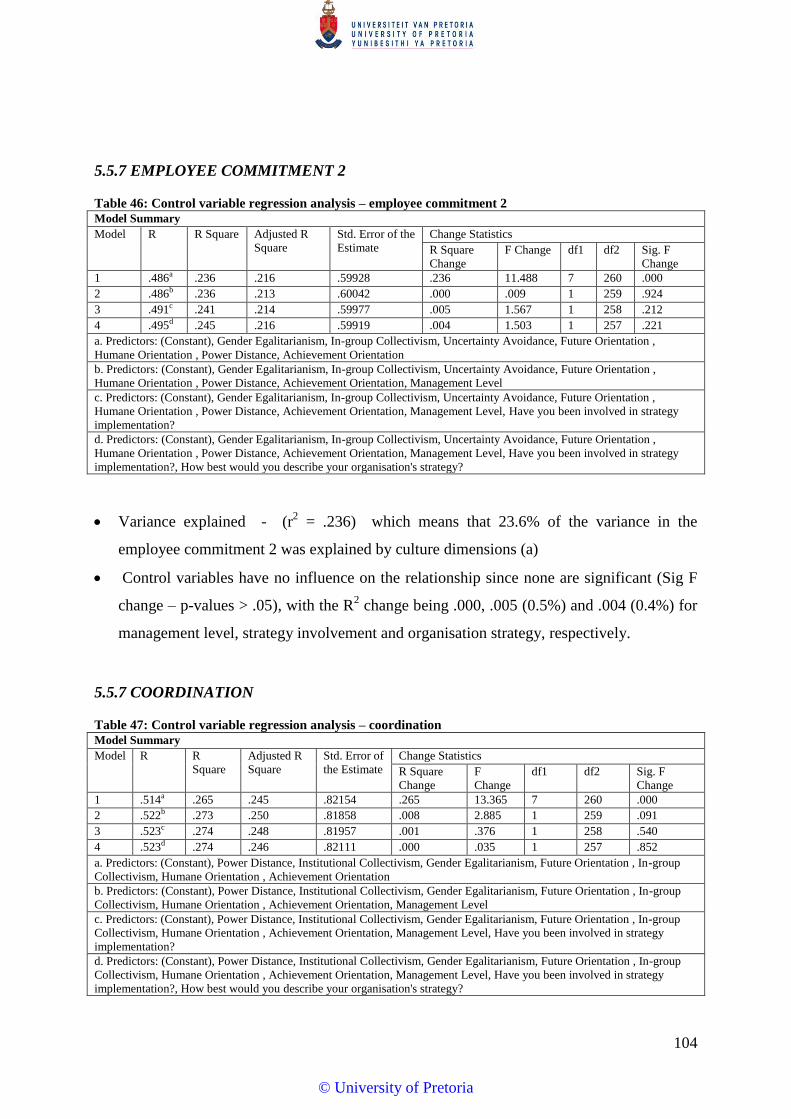
104
5.5.7 EMPLOYEE COMMITMENT 2
Table 46: Control variable regression analysis – employee commitment 2 Model Summary
Model R R Square Adjusted R
Square
Std. Error of the
Estimate
Change Statistics
R Square
Change
F Change df1 df2 Sig. F
Change
1 .486a .236 .216 .59928 .236 11.488 7 260 .000
2 .486b .236 .213 .60042 .000 .009 1 259 .924
3 .491c .241 .214 .59977 .005 1.567 1 258 .212
4 .495d .245 .216 .59919 .004 1.503 1 257 .221
a. Predictors: (Constant), Gender Egalitarianism, In-group Collectivism, Uncertainty Avoidance, Future Orientation ,
Humane Orientation , Power Distance, Achievement Orientation
b. Predictors: (Constant), Gender Egalitarianism, In-group Collectivism, Uncertainty Avoidance, Future Orientation ,
Humane Orientation , Power Distance, Achievement Orientation, Management Level
c. Predictors: (Constant), Gender Egalitarianism, In-group Collectivism, Uncertainty Avoidance, Future Orientation ,
Humane Orientation , Power Distance, Achievement Orientation, Management Level, Have you been involved in strategy
implementation?
d. Predictors: (Constant), Gender Egalitarianism, In-group Collectivism, Uncertainty Avoidance, Future Orientation ,
Humane Orientation , Power Distance, Achievement Orientation, Management Level, Have you been involved in strategy
implementation?, How best would you describe your organisation's strategy?
Variance explained - (r2 = .236) which means that 23.6% of the variance in the
employee commitment 2 was explained by culture dimensions (a)
Control variables have no influence on the relationship since none are significant (Sig F
change – p-values > .05), with the R2 change being .000, .005 (0.5%) and .004 (0.4%) for
management level, strategy involvement and organisation strategy, respectively.
5.5.7 COORDINATION
Table 47: Control variable regression analysis – coordination Model Summary
Model R R
Square
Adjusted R
Square
Std. Error of
the Estimate
Change Statistics
R Square
Change
F
Change
df1 df2 Sig. F
Change
1 .514a .265 .245 .82154 .265 13.365 7 260 .000
2 .522b .273 .250 .81858 .008 2.885 1 259 .091
3 .523c .274 .248 .81957 .001 .376 1 258 .540
4 .523d .274 .246 .82111 .000 .035 1 257 .852
a. Predictors: (Constant), Power Distance, Institutional Collectivism, Gender Egalitarianism, Future Orientation , In-group
Collectivism, Humane Orientation , Achievement Orientation
b. Predictors: (Constant), Power Distance, Institutional Collectivism, Gender Egalitarianism, Future Orientation , In-group
Collectivism, Humane Orientation , Achievement Orientation, Management Level
c. Predictors: (Constant), Power Distance, Institutional Collectivism, Gender Egalitarianism, Future Orientation , In-group
Collectivism, Humane Orientation , Achievement Orientation, Management Level, Have you been involved in strategy
implementation?
d. Predictors: (Constant), Power Distance, Institutional Collectivism, Gender Egalitarianism, Future Orientation , In-group
Collectivism, Humane Orientation , Achievement Orientation, Management Level, Have you been involved in strategy
implementation?, How best would you describe your organisation's strategy?
© University of Pretoria
105
Variance explained - (r2 = .265) which means that 26.5% of the variance in the
coordination was explained by culture dimensions (a)
Control variables have no influence on the relationship since none are significant (Sig F
change – p-values > .05), with the R2 change being .008 (0.8%), .001 (0.1%) and .00 for
management level, strategy involvement and organisation strategy, respectively.
5.6 SUMMARY
A total of 281 respondents were completed, which was equivalent to a response rate of
~48%.
The table below (i.e. Table 48) summarises the Pearson correlation outcome. There
was a statistically significant association between the culture dimensions (uncertainty
avoidance, gender egalitarianism, assertiveness, institutional collectivism, in-group
collectivism, humane orientation, future orientation, achievement orientation and
power distance) (R. House et al., 2001) and strategy execution variables (information
sharing, leadership, rewards, performance, structure, employee commitment 1,
employee commitment 2 and coordination) in all eight hypotheses. However, in seven
of the eight hypotheses there was a partial acceptance of the alternative hypothesis and
in only one of the hypothesis there was a full acceptance of the alternative hypothesis.
The canonical correlation shows that the full model across all functions was
statistically significant using the Wilk’s criterion. The dimension reduction analysis
which tests the hierarchal arrangement of functions for statistical significance, showed
that the full model (Functions 1 to 8) was statistically significant, F (72, 1534.35) =
7.09, p < .001 and the Function 2 to 8 was also statistically significant, F (56,1362.37)
= 1.78, p < .001. These two functions were considered important in the context of the
analysis in that it had a shared variance of .916 (.745 +.171), which is 91.6%. The
regression equations for each dependent variable separately showed that achievement
orientation is statistically significantly across all dimensions of strategy execution.
This means that it had the greatest impact.
The control variable analysis showed that management level had an influence on the
organisational culture dimensions (uncertainty avoidance, gender egalitarianism,
assertiveness, institutional collectivism, in-group collectivism, humane orientation,
future orientation, and power distance) (Minkov & Blagoev, 2012) and the strategy
© University of Pretoria

106
execution dimension of leadership. In addition to the organisation strategy influences
culture dimensions (uncertainty avoidance, gender egalitarianism, assertiveness,
institutional collectivism, in-group collectivism, humane orientation, future
orientation, and power distance) (Minkov & Blagoev, 2012) and the strategy execution
dimension of employee commitment.
© University of Pretoria

107
Table 48: Summary of hypothesis findings
Hypotheses Variables r-value Association
Conclusion Significant
Yes/No Positive/
Negative
Strong/
Medium/Weak
Hypothesis 1
H01: There is no association (variables are independent) between
culture dimensions (uncertainty avoidance, gender egalitarianism,
assertiveness, institutional collectivism, in-group collectivism, humane
orientation, future orientation, achievement orientation and power
distance) (Minkov & Blagoev, 2012) and the strategy execution
dimension of information sharing
HA1: There is an association between the culture dimensions
(uncertainty avoidance, gender egalitarianism, assertiveness,
institutional collectivism, in-group collectivism, humane orientation,
future orientation, achievement orientation and power distance)
(Minkov & Blagoev, 2012) and the strategy execution dimension of
information sharing
Uncertainty avoidance &
Information sharing
0.365 Yes Positive Medium Decision:
The null hypothesis is rejected, and the
alternative hypothesis is partially accepted
since seven out of the nine relationships are
statistically significant
Gender egalitarianism &
Information sharing
0.098 No
Positive Weak
Assertiveness 0.268 Yes Positive Weak
Institutional collectivism &
Information sharing
-0.088 No Negative Weak
In-group collectivism &
Information sharing
0.528 Yes Positive Strong
Humane orientation &
Information sharing
0.586 Yes Positive Strong
Future orientation&
Information sharing
0.476 Yes Positive Medium
Achievement orientation &
Information sharing
0.692 Yes Positive Strong
Power distance & Information
sharing
0.568 Yes Positive Strong
Hypothesis 2
H02: There is no association (variables are independent) between
culture dimensions (uncertainty avoidance, gender egalitarianism,
assertiveness, institutional collectivism, in-group collectivism, humane
orientation, future orientation, achievement orientation and power
distance) (Minkov & Blagoev, 2012) and the strategy execution
dimension of leadership
HA2: There is an association between the culture dimensions
(uncertainty avoidance, gender egalitarianism, assertiveness,
institutional collectivism, in-group collectivism, humane orientation,
future orientation, achievement orientation and power distance)
(Minkov & Blagoev, 2012) and the strategy execution dimension of
leadership
Uncertainty avoidance &
Leadership
0.351 Yes Positive Medium
Decision:
This means that the null hypothesis is
rejected, and the alternative hypothesis is
partially accepted since eight out of the nine
relationships are statistically significant.
Gender egalitarianism &
Leadership
0.148 Yes Positive Weak
Assertiveness & Leadership 0.265 Yes Positive Weak
Institutional collectivism &
Leadership
-0.83 No Negative Weak
In-group collectivism &
Leadership
0.566 Yes Positive Strong
Humane orientation &
Leadership
0.532 Yes Positive Strong
Future orientation &
Leadership
0.440 Yes Positive Medium
Achievement orientation &
Leadership
0.686 Yes Positive Strong
Power distance & Leadership 0.595 Yes Positive Strong
© University of Pretoria

108
Hypotheses Variables r-value Association
Conclusion Significant
Yes/No
Positive/
Negative
Strong/
Medium/Weak
Hypothesis 3
H03: There is no association (variables are independent) between
culture dimensions (uncertainty avoidance, gender egalitarianism,
assertiveness, institutional collectivism, in-group collectivism, humane
orientation, future orientation, achievement orientation and power
distance) (Minkov & Blagoev, 2012) and the strategy execution
dimension of rewards
HA3: There is an association between the culture dimensions
(uncertainty avoidance, gender egalitarianism, assertiveness,
institutional collectivism, in-group collectivism, humane orientation,
future orientation, achievement orientation and power distance)
(Minkov & Blagoev, 2012) and the strategy execution dimension of
rewards
Uncertainty avoidance &
Rewards
0.240 Yes Positive Weak Decision:
This means that the null hypothesis is
rejected, and the alternative hypothesis is
partially accepted since seven out of the
nine relationships are statistically
significant.
Gender egalitarianism &
Rewards
0.118 No Positive Weak
Assertiveness & Rewards 0.336 Yes Positive Medium
Institutional collectivism &
Rewards
-0.54 No Negative Strong
In-group collectivism &
Rewards
0.525 Yes Positive Strong
Humane orientation &
Rewards
0.494 Yes Positive Medium
Future orientation & Rewards 0.454 Yes Positive Medium
Achievement orientation &
Rewards
0.691 Yes Positive Strong
Power distance & Rewards 0.536 Yes Positive Strong
Hypothesis 4
H04: There is no association (variables are independent) between
culture dimensions (uncertainty avoidance, gender egalitarianism,
assertiveness, institutional collectivism, in-group collectivism, humane
orientation, future orientation, achievement orientation and power
distance) (Minkov & Blagoev, 2012) and the strategy execution
dimension of rewards
HA4: There is an association between the culture dimensions
(uncertainty avoidance, gender egalitarianism, assertiveness,
institutional collectivism, in-group collectivism, humane orientation,
future orientation, achievement orientation and power distance)
(Minkov & Blagoev, 2012) and the strategy execution dimension of
rewards
Uncertainty avoidance &
Performance
0.288 Yes Positive Weak Decision:
This means that the null hypothesis is
rejected, and the alternative hypothesis is
partially accepted since seven out of the
nine relationships are statistically
significant.
Gender egalitarianism &
Performance
0.052 No Positive Weak
Assertiveness & Performance 0.297 Yes Positive Medium
Institutional collectivism &
Performance
-0.53 No Negative Strong
In-group collectivism &
Performance
0.433 Yes Positive Medium
Humane orientation &
Performance
0.487 Yes Positive Medium
Future orientation &
Performance
0.416 Yes Positive Medium
Achievement orientation &
Performance
0.622 Yes Positive Strong
Power distance &
Performance
0.486 Yes Positive Strong
© University of Pretoria
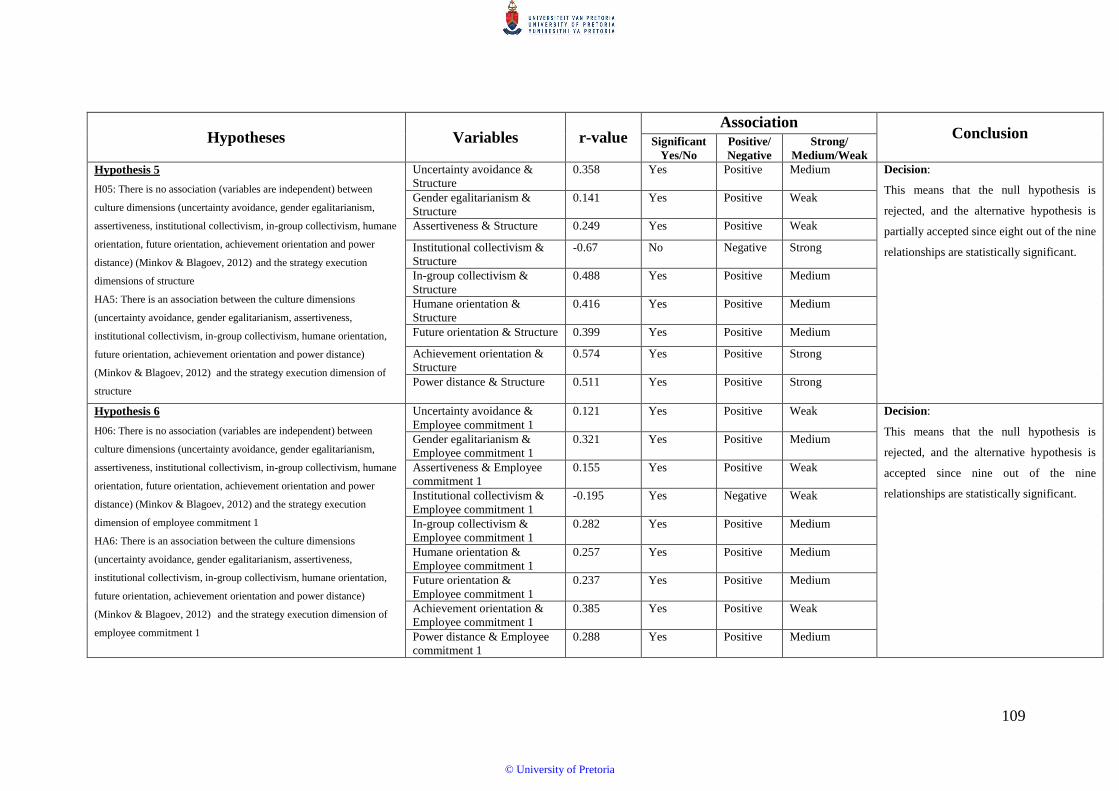
109
Hypotheses Variables r-value Association
Conclusion Significant
Yes/No
Positive/
Negative
Strong/
Medium/Weak
Hypothesis 5
H05: There is no association (variables are independent) between
culture dimensions (uncertainty avoidance, gender egalitarianism,
assertiveness, institutional collectivism, in-group collectivism, humane
orientation, future orientation, achievement orientation and power
distance) (Minkov & Blagoev, 2012) and the strategy execution
dimensions of structure
HA5: There is an association between the culture dimensions
(uncertainty avoidance, gender egalitarianism, assertiveness,
institutional collectivism, in-group collectivism, humane orientation,
future orientation, achievement orientation and power distance)
(Minkov & Blagoev, 2012) and the strategy execution dimension of
structure
Uncertainty avoidance &
Structure
0.358 Yes
Positive Medium Decision:
This means that the null hypothesis is
rejected, and the alternative hypothesis is
partially accepted since eight out of the nine
relationships are statistically significant.
Gender egalitarianism &
Structure
0.141 Yes Positive Weak
Assertiveness & Structure 0.249 Yes Positive Weak
Institutional collectivism &
Structure
-0.67 No Negative Strong
In-group collectivism &
Structure
0.488 Yes Positive Medium
Humane orientation &
Structure
0.416 Yes Positive Medium
Future orientation & Structure 0.399 Yes Positive Medium
Achievement orientation &
Structure
0.574 Yes Positive Strong
Power distance & Structure 0.511 Yes Positive Strong
Hypothesis 6
H06: There is no association (variables are independent) between
culture dimensions (uncertainty avoidance, gender egalitarianism,
assertiveness, institutional collectivism, in-group collectivism, humane
orientation, future orientation, achievement orientation and power
distance) (Minkov & Blagoev, 2012) and the strategy execution
dimension of employee commitment 1
HA6: There is an association between the culture dimensions
(uncertainty avoidance, gender egalitarianism, assertiveness,
institutional collectivism, in-group collectivism, humane orientation,
future orientation, achievement orientation and power distance)
(Minkov & Blagoev, 2012) and the strategy execution dimension of
employee commitment 1
Uncertainty avoidance &
Employee commitment 1
0.121 Yes Positive Weak Decision:
This means that the null hypothesis is
rejected, and the alternative hypothesis is
accepted since nine out of the nine
relationships are statistically significant.
Gender egalitarianism &
Employee commitment 1
0.321 Yes Positive Medium
Assertiveness & Employee
commitment 1
0.155 Yes Positive Weak
Institutional collectivism &
Employee commitment 1
-0.195 Yes Negative Weak
In-group collectivism &
Employee commitment 1
0.282 Yes Positive Medium
Humane orientation &
Employee commitment 1
0.257 Yes Positive Medium
Future orientation &
Employee commitment 1
0.237 Yes Positive Medium
Achievement orientation &
Employee commitment 1
0.385 Yes Positive Weak
Power distance & Employee
commitment 1
0.288 Yes Positive Medium
© University of Pretoria
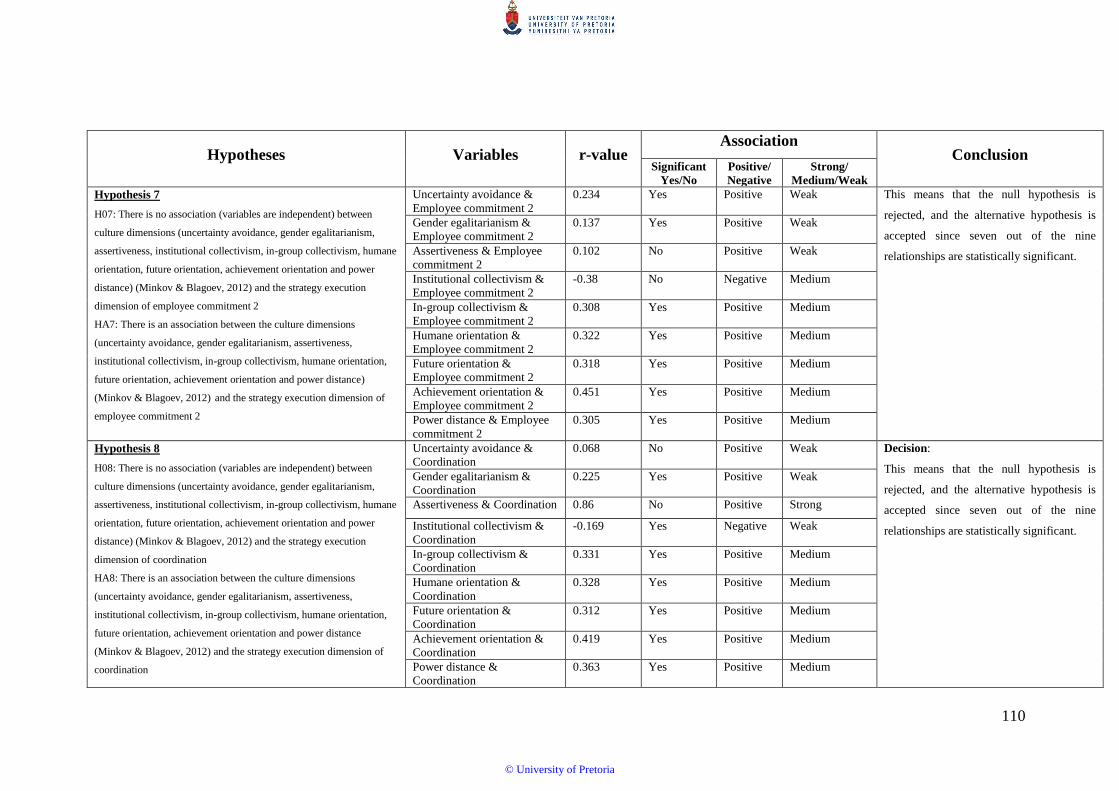
110
Hypotheses Variables r-value Association
Conclusion Significant
Yes/No
Positive/
Negative
Strong/
Medium/Weak
Hypothesis 7
H07: There is no association (variables are independent) between
culture dimensions (uncertainty avoidance, gender egalitarianism,
assertiveness, institutional collectivism, in-group collectivism, humane
orientation, future orientation, achievement orientation and power
distance) (Minkov & Blagoev, 2012) and the strategy execution
dimension of employee commitment 2
HA7: There is an association between the culture dimensions
(uncertainty avoidance, gender egalitarianism, assertiveness,
institutional collectivism, in-group collectivism, humane orientation,
future orientation, achievement orientation and power distance)
(Minkov & Blagoev, 2012) and the strategy execution dimension of
employee commitment 2
Uncertainty avoidance &
Employee commitment 2
0.234 Yes Positive Weak This means that the null hypothesis is
rejected, and the alternative hypothesis is
accepted since seven out of the nine
relationships are statistically significant.
Gender egalitarianism &
Employee commitment 2
0.137 Yes Positive Weak
Assertiveness & Employee
commitment 2
0.102 No Positive Weak
Institutional collectivism &
Employee commitment 2
-0.38 No Negative Medium
In-group collectivism &
Employee commitment 2
0.308 Yes Positive Medium
Humane orientation &
Employee commitment 2
0.322 Yes Positive Medium
Future orientation &
Employee commitment 2
0.318 Yes Positive Medium
Achievement orientation &
Employee commitment 2
0.451 Yes Positive Medium
Power distance & Employee
commitment 2
0.305 Yes Positive Medium
Hypothesis 8
H08: There is no association (variables are independent) between
culture dimensions (uncertainty avoidance, gender egalitarianism,
assertiveness, institutional collectivism, in-group collectivism, humane
orientation, future orientation, achievement orientation and power
distance) (Minkov & Blagoev, 2012) and the strategy execution
dimension of coordination
HA8: There is an association between the culture dimensions
(uncertainty avoidance, gender egalitarianism, assertiveness,
institutional collectivism, in-group collectivism, humane orientation,
future orientation, achievement orientation and power distance
(Minkov & Blagoev, 2012) and the strategy execution dimension of
coordination
Uncertainty avoidance &
Coordination
0.068 No Positive Weak Decision:
This means that the null hypothesis is
rejected, and the alternative hypothesis is
accepted since seven out of the nine
relationships are statistically significant.
Gender egalitarianism &
Coordination
0.225 Yes Positive Weak
Assertiveness & Coordination 0.86 No Positive Strong
Institutional collectivism &
Coordination
-0.169 Yes Negative Weak
In-group collectivism &
Coordination
0.331 Yes Positive Medium
Humane orientation &
Coordination
0.328 Yes Positive Medium
Future orientation &
Coordination
0.312 Yes Positive Medium
Achievement orientation &
Coordination
0.419 Yes Positive Medium
Power distance &
Coordination
0.363 Yes Positive Medium
© University of Pretoria
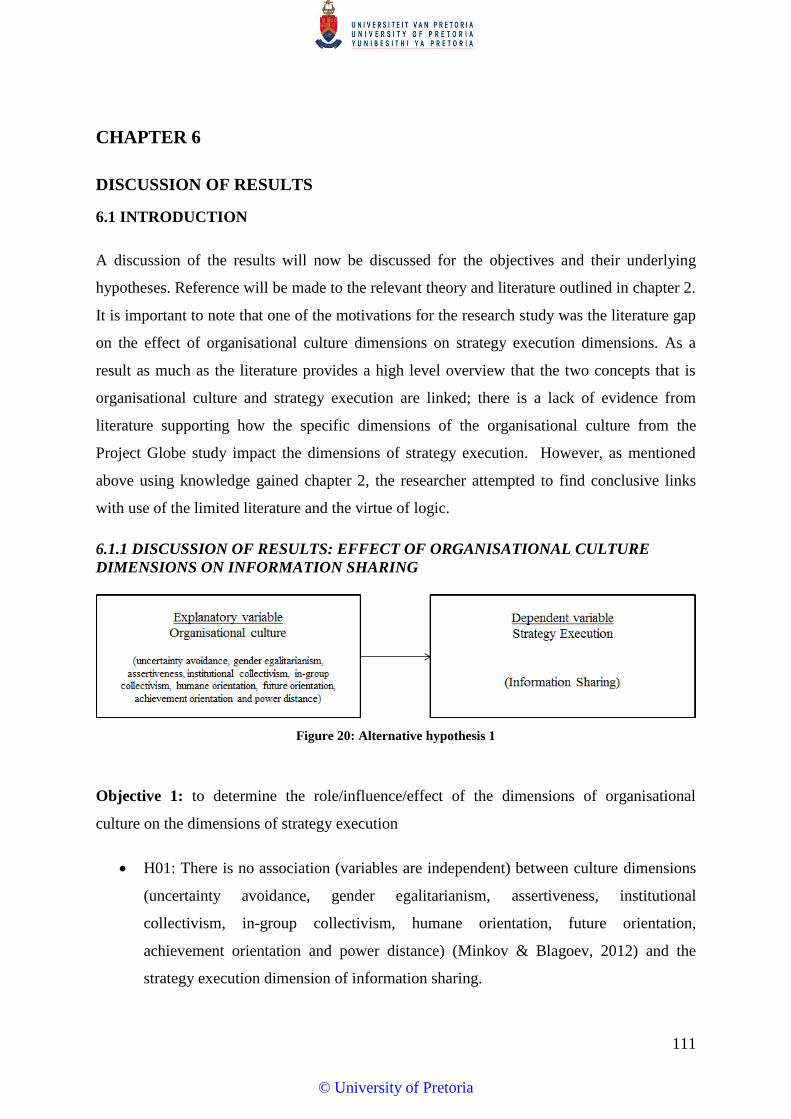
111
CHAPTER 6
DISCUSSION OF RESULTS
6.1 INTRODUCTION
A discussion of the results will now be discussed for the objectives and their underlying
hypotheses. Reference will be made to the relevant theory and literature outlined in chapter 2.
It is important to note that one of the motivations for the research study was the literature gap
on the effect of organisational culture dimensions on strategy execution dimensions. As a
result as much as the literature provides a high level overview that the two concepts that is
organisational culture and strategy execution are linked; there is a lack of evidence from
literature supporting how the specific dimensions of the organisational culture from the
Project Globe study impact the dimensions of strategy execution. However, as mentioned
above using knowledge gained chapter 2, the researcher attempted to find conclusive links
with use of the limited literature and the virtue of logic.
6.1.1 DISCUSSION OF RESULTS: EFFECT OF ORGANISATIONAL CULTURE
DIMENSIONS ON INFORMATION SHARING
Figure 20: Alternative hypothesis 1
Objective 1: to determine the role/influence/effect of the dimensions of organisational
culture on the dimensions of strategy execution
H01: There is no association (variables are independent) between culture dimensions
(uncertainty avoidance, gender egalitarianism, assertiveness, institutional
collectivism, in-group collectivism, humane orientation, future orientation,
achievement orientation and power distance) (Minkov & Blagoev, 2012) and the
strategy execution dimension of information sharing.
© University of Pretoria

112
HA1: There is an association between the culture dimensions (uncertainty avoidance,
gender egalitarianism, assertiveness, institutional collectivism, in-group collectivism,
humane orientation, future orientation, achievement orientation and power distance)
(Minkov & Blagoev, 2012) and the strategy execution dimension of information
sharing.
It was concluded that the null hypothesis was to be rejected and the alternate hypothesis was
partially confirmed or accepted. It was therefore found, that for the sample group, a
statistically significant correlation existed between seven out the nine organisational culture
dimensions and the strategy execution dimension of information sharing. There were five out
of the seven associations that exhibited a medium to strong relationship i.e. in-group
collectivism & information sharing, humane orientation & information sharing, future
orientation & information sharing, achievement orientation & information sharing and power
distance & information sharing. The coefficient of correlation was calculated at a range of r =
0.476 – 0.692, with a p value was <0.01, and implies that organisational culture can explain
between 47% - 69% of all the factors that can explain strategy execution, and as such is
notable.
These findings support the literature whereby the association between organisation culture
and the strategy execution dimension of information sharing can be explained through two
standalone lenses. This first perspective relates to information sharing’s association with
organisational culture. Denison & Mishra (1995) developed and tested a four-trait
organisational culture model. This organisational culture model defined four traits of culture
that is involvement, adaptability, consistency and mission which were believed to be
prevalent in organisations.
The consistency trait refers to the manner in which organisations deal with increasing their
internal integrity through their ability to enable the organization of activities. This generally
requires coordination and integration within the organisation (Sharifirad & Ataei, 2012). The
adaptability trait deals with how organisations transform the changing needs of the
organizational environment into executable tasks. (Sharifirad & Ataei, 2012). The mission
trait relates to the organisations sense of a shared purpose together with direction that informs
goals and strategic intents which articulates a vision for the organisations future state.
(Sharifirad & Ataei, 2012). A common thread through of all these traits is that there require
good information sharing within the organisation to achieve coordination, be able to adapt to
© University of Pretoria

113
an ever changing business landscape and good reliable information to define the future state
of the company.
The literature on information sharing, from a strategy execution perspective, posits that
successful strategy execution requires good sharing of information. Information sharing can
take the form of knowledge transfer but it is important to maintain a clear line of
responsibility and accountability. Good information sharing should be a rule instituted across
organizational business units since it is a vital ingredient for good coordination. Complex
strategies are usually founded on three principles that are good information sharing,
coordination and cooperation (Hrebiniak, 2006; Patten, 2015).
In summary given that information sharing is considered a building block of both
organisational culture and strategy execution, it is expected that an association between
organisational culture and strategy execution should be observed. This study confirms that
there is a definite association between organisational culture and the strategy execution
dimension of information. However, the results can also be explained by the simple
consideration that each of the Project Globe cultural dimensions have their own link to the
strategy execution dimension of information sharing.
Uncertainty avoidance concerns the resistance of risk and unexpected events by emphasizing
rules and norms (Minkov & Blagoev, 2012). It can be perceived that in an environment
where the strategy and execution thereof requires less risk and more policy making that good
information sharing between departments will be needed to understand and inform the risk
platforms as well as make decisions. In highly collectivistic organisations, information
sharing between teams is the key ingredient for cohesion. With respect to organisations
highly orientated towards future planning, humaneness, and achievement; once more
information sharing is vital to make decisions for the future, measure and rewards
achievement. In organisations where power is unequally distributed, good information
sharing frameworks are needed to maintain balance. This can be a key to successfully
executing the organisation strategy.
From the results of this study, it is clear that it is beneficial for companies to foster and
develop good information sharing frameworks since it critical for both organisational culture
and strategy execution. The manner in which organisations share information is unique,
© University of Pretoria
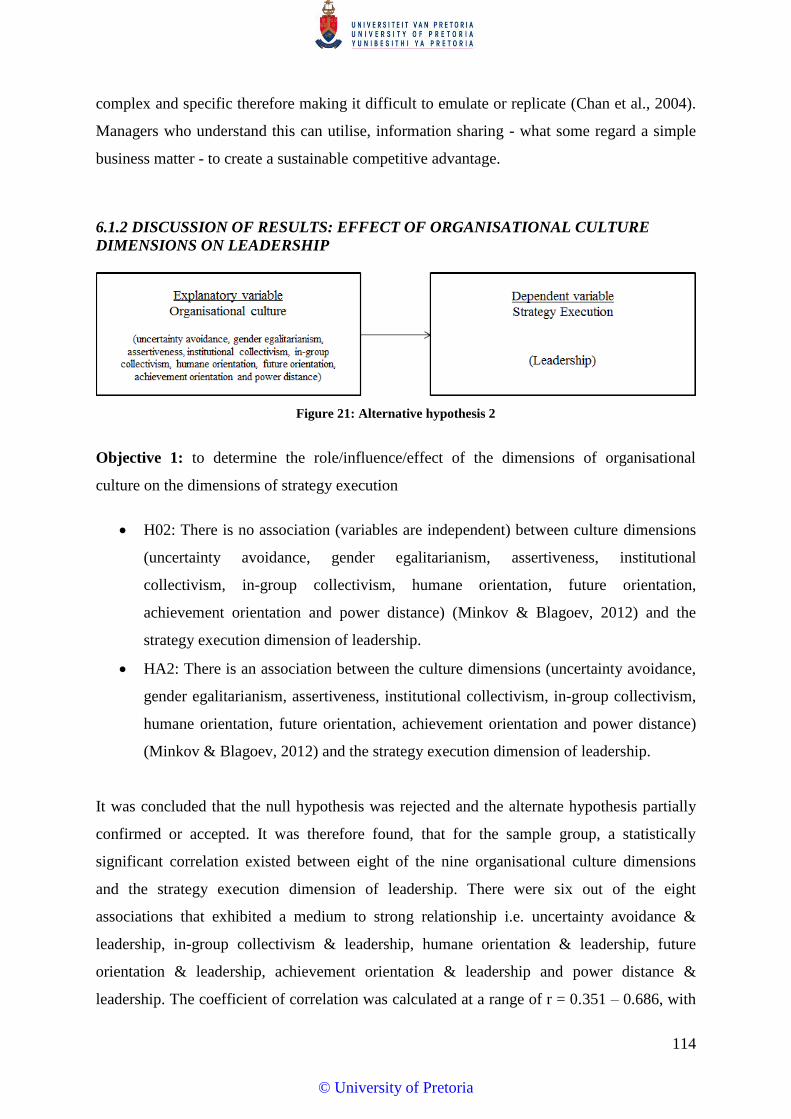
114
complex and specific therefore making it difficult to emulate or replicate (Chan et al., 2004).
Managers who understand this can utilise, information sharing - what some regard a simple
business matter - to create a sustainable competitive advantage.
6.1.2 DISCUSSION OF RESULTS: EFFECT OF ORGANISATIONAL CULTURE
DIMENSIONS ON LEADERSHIP
Figure 21: Alternative hypothesis 2
Objective 1: to determine the role/influence/effect of the dimensions of organisational
culture on the dimensions of strategy execution
H02: There is no association (variables are independent) between culture dimensions
(uncertainty avoidance, gender egalitarianism, assertiveness, institutional
collectivism, in-group collectivism, humane orientation, future orientation,
achievement orientation and power distance) (Minkov & Blagoev, 2012) and the
strategy execution dimension of leadership.
HA2: There is an association between the culture dimensions (uncertainty avoidance,
gender egalitarianism, assertiveness, institutional collectivism, in-group collectivism,
humane orientation, future orientation, achievement orientation and power distance)
(Minkov & Blagoev, 2012) and the strategy execution dimension of leadership.
It was concluded that the null hypothesis was rejected and the alternate hypothesis partially
confirmed or accepted. It was therefore found, that for the sample group, a statistically
significant correlation existed between eight of the nine organisational culture dimensions
and the strategy execution dimension of leadership. There were six out of the eight
associations that exhibited a medium to strong relationship i.e. uncertainty avoidance &
leadership, in-group collectivism & leadership, humane orientation & leadership, future
orientation & leadership, achievement orientation & leadership and power distance &
leadership. The coefficient of correlation was calculated at a range of r = 0.351 – 0.686, with
© University of Pretoria

115
a p value was <0.01, and implies that organisational culture can explain between 35% - 69%
of the explain strategy execution dimension of leadership, and as such is notable.
These findings support the literature whereby the association between organisation culture
and the strategy execution dimension of leadership can be explained through two standalone
lenses. This first perspective relates to leadership’s association with organisational culture.
The literature from an organisational culture perspective, posits organisational leadership as
the ability of an individual to influence, inspire, and empower others to contribute toward the
effectiveness and success of the organisations of which they are members (R. House et al.,
2001). In addition to this, the GLOBE research program found that leadership can impact the,
“organisational form, culture, and practices” (R. House et al., 2001). Organisational culture is
established, rooted and shaped by the founders of organisations and it is thereafter influenced
and continually improved upon by the successive leaders of the organisational. Once
organisational culture has been established and there is a definitive way with the manner in
which the organisation does things; the overall organisational practices have a major impact
on how leaders behave and what they do. Over time, successive leaders tend to change their
behaviours and leadership styles to suit the organisational culture (Chatman & Cha, 2003).
The literature on leadership, from a strategy execution perspective, posits that leadership
must drive the organization to execution success. Leadership of an organisation must
encourage employees/staff to take ownership of and exude commitment to the execution
process. Leadership’s decision on the strategy execution process generally affects how the
employees/staff respond to all of the strategy execution challenges. Leaders that take
accountability and use accurate information to make timeous decisions usually inspire the
staff to behave in the same manner towards strategy execution. Leadership that is self-seeking
and delays decisions for their own interests tend to encourage staff to look only at their own
area and not focus of the strategy execution of the organisation as a whole (L. G. Hrebiniak,
2005).
In summary given that leadership is considered a building block of both organisational
culture and strategy execution, it is expected that an association between organisational
culture and strategy execution should be observed. This study confirms that there is a definite
association between organisational culture and the strategy execution dimension of
leadership. However, the results can also be explained by the simple consideration that each
© University of Pretoria
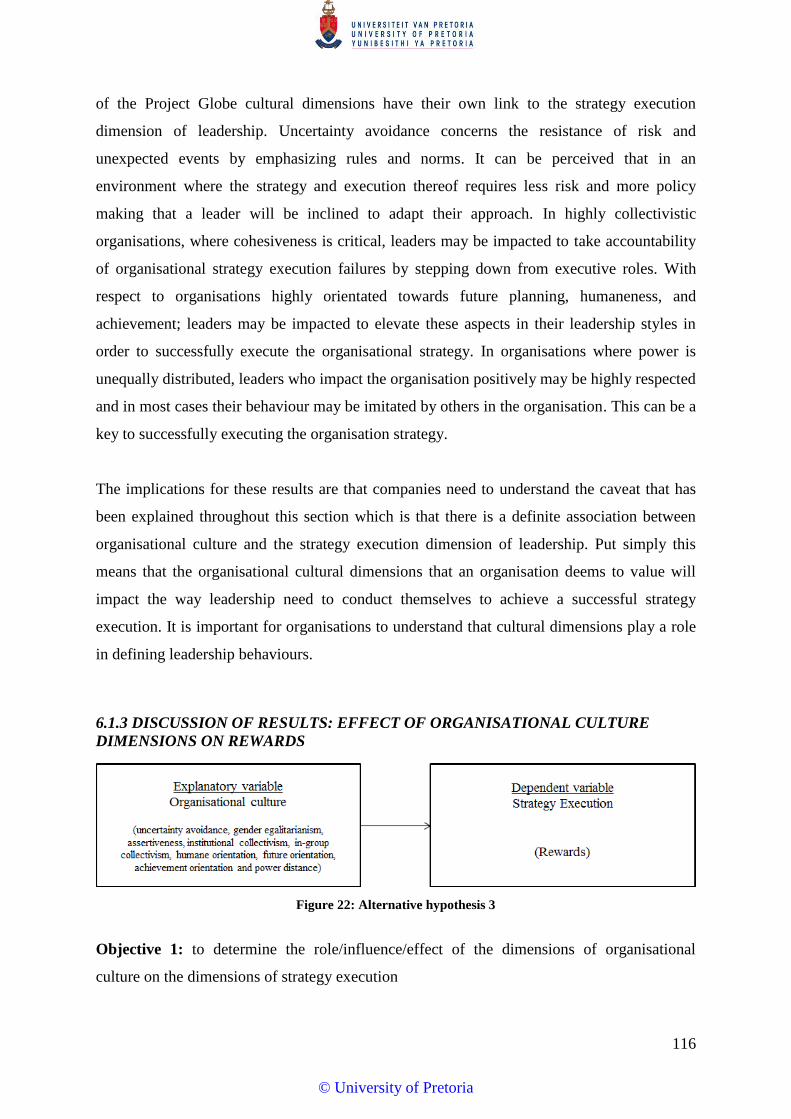
116
of the Project Globe cultural dimensions have their own link to the strategy execution
dimension of leadership. Uncertainty avoidance concerns the resistance of risk and
unexpected events by emphasizing rules and norms. It can be perceived that in an
environment where the strategy and execution thereof requires less risk and more policy
making that a leader will be inclined to adapt their approach. In highly collectivistic
organisations, where cohesiveness is critical, leaders may be impacted to take accountability
of organisational strategy execution failures by stepping down from executive roles. With
respect to organisations highly orientated towards future planning, humaneness, and
achievement; leaders may be impacted to elevate these aspects in their leadership styles in
order to successfully execute the organisational strategy. In organisations where power is
unequally distributed, leaders who impact the organisation positively may be highly respected
and in most cases their behaviour may be imitated by others in the organisation. This can be a
key to successfully executing the organisation strategy.
The implications for these results are that companies need to understand the caveat that has
been explained throughout this section which is that there is a definite association between
organisational culture and the strategy execution dimension of leadership. Put simply this
means that the organisational cultural dimensions that an organisation deems to value will
impact the way leadership need to conduct themselves to achieve a successful strategy
execution. It is important for organisations to understand that cultural dimensions play a role
in defining leadership behaviours.
6.1.3 DISCUSSION OF RESULTS: EFFECT OF ORGANISATIONAL CULTURE
DIMENSIONS ON REWARDS
Figure 22: Alternative hypothesis 3
Objective 1: to determine the role/influence/effect of the dimensions of organisational
culture on the dimensions of strategy execution
© University of Pretoria
117
H03: There is no association (variables are independent) between culture dimensions
(uncertainty avoidance, gender egalitarianism, assertiveness, institutional
collectivism, in-group collectivism, humane orientation, future orientation,
achievement orientation and power distance) (Minkov & Blagoev, 2012) and the
strategy execution dimension of rewards.
HA3: There is an association between the culture dimensions (uncertainty avoidance,
gender Egalitarianism, assertiveness, institutional collectivism, in-group collectivism,
humane orientation, future orientation, achievement orientation and power distance)
(Minkov & Blagoev, 2012) and the strategy execution dimension of rewards.
It was concluded that the null hypothesis was rejected and the alternate hypothesis partially
confirmed or accepted. It was therefore found, that for the sample group, a statistically
significant correlation existed between seven out of the nine organisational culture
dimensions and the strategy execution dimension of reward. There were five out of the seven
associations that exhibited a medium to strong relationship i.e. assertiveness & rewards, in-
group collectivism & rewards, humane orientation & rewards, future orientation & rewards,
achievement orientation & rewards and power distance & rewards. The coefficient of
correlation was calculated at a range of r = 0.336 – 0.691, with a p value was <0.01, and
implies that organisational culture can explain between 34% - 69% of the strategy execution
dimension of rewards, and as such is notable.
These findings support the literature, whereby in both organisational culture and strategy
execution reward systems for employees are a critical aspect to drive behaviour and delivery
of results (execution). From the culture literature explained in chapter two, the Cameron &
Quinn (2006) competing values as well as the Denison & Mishra (1995) organisational
culture frameworks highlight that rewarding employees for the right behaviour or display of
values is an important part of building organisational culture. For example an organisation
that places high emphasis on the value of customer management may reward employees that
exhibit excellent customer service to external customers. From a successful strategy
execution perspective, reward systems are an important part of strategy execution since it
motivates employees to contribute their best. Reward systems role in developing,
“commitment, loyalty and interest” in employees must not be underestimated. The
effectiveness of a reward system can be judged on the willingness of employees to move
© University of Pretoria

118
beyond their day-to-day jobs and voluntarily exert effort to implement strategic initiatives to
the best of their abilities. Therefore this leads to the conclusion that, organizations tie rewards
to both successful strategic plan implementation processes and organisational culture
frameworks.
The contextual literature frameworks explained above are relatable to the results of this study.
By nature of logic the associations between the cultural dimensions (in-group collectivism,
humane orientation, achievement orientation, future orientation, assertiveness and power
distance) and the strategy execution dimension of rewards can be explained as follows: it is
understandable that in-group collectivism which promotes cohesiveness will seek to reward
teamwork as opposed to individualistic goals. Human orientation which promotes fairness,
will seek to ensure and reward that employees are treated in a manner that is fair when it
comes to the implementation of the strategy. For example, when a strategy execution success
is achieved by a team, fairness could mean that each team member is rewarded fairly and
equally. Achievement and future orientation which promote excelling at goals and investing
for the future are the two most common rewards that companies emphasise. In some
organisations where there is a need for confrontational culture type due to the nature of the
business example stock exchange companies, it may be necessary to reward an aggressive
and confrontational approach in order to achieve success. Lastly it is unique that there is an
association between the organisational culture dimension of power distance and the strategy
execution dimension of rewards. However if one looks at the perspective of companies where
power is unequally shared that is there is upper management team that holds greater power
and lower management that holds little to no power then the reward system for strategy
execution be aligned accordingly. In other words, the upper management possessing more
power will receive higher rewards for strategy execution success in comparison to the lower
management possessing little to no power. This can be viewed as unfair and derail the
strategy execution success.
In summary it can be articulated that the little literature available provide sufficient evidence
to show that organisational culture is linked to the rewards systems needed for successful
strategy execution.
From the results of this study, it is clear that it is beneficial for companies to foster and
develop an organisational culture that rewards employees for the successful execution of
© University of Pretoria
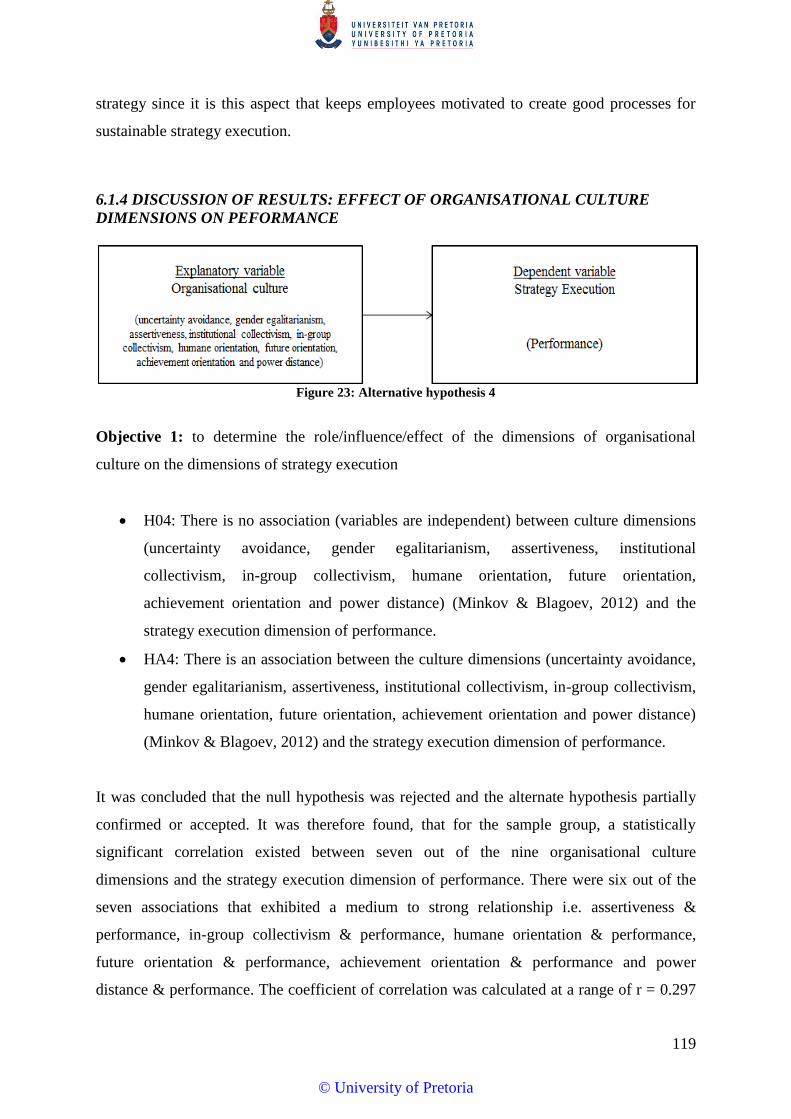
119
strategy since it is this aspect that keeps employees motivated to create good processes for
sustainable strategy execution.
6.1.4 DISCUSSION OF RESULTS: EFFECT OF ORGANISATIONAL CULTURE
DIMENSIONS ON PEFORMANCE
Figure 23: Alternative hypothesis 4
Objective 1: to determine the role/influence/effect of the dimensions of organisational
culture on the dimensions of strategy execution
H04: There is no association (variables are independent) between culture dimensions
(uncertainty avoidance, gender egalitarianism, assertiveness, institutional
collectivism, in-group collectivism, humane orientation, future orientation,
achievement orientation and power distance) (Minkov & Blagoev, 2012) and the
strategy execution dimension of performance.
HA4: There is an association between the culture dimensions (uncertainty avoidance,
gender egalitarianism, assertiveness, institutional collectivism, in-group collectivism,
humane orientation, future orientation, achievement orientation and power distance)
(Minkov & Blagoev, 2012) and the strategy execution dimension of performance.
It was concluded that the null hypothesis was rejected and the alternate hypothesis partially
confirmed or accepted. It was therefore found, that for the sample group, a statistically
significant correlation existed between seven out of the nine organisational culture
dimensions and the strategy execution dimension of performance. There were six out of the
seven associations that exhibited a medium to strong relationship i.e. assertiveness &
performance, in-group collectivism & performance, humane orientation & performance,
future orientation & performance, achievement orientation & performance and power
distance & performance. The coefficient of correlation was calculated at a range of r = 0.297
© University of Pretoria
120
– 0.622, with a p value was <0.01, and implies that organisational culture can explain
between 30% - 62% of the strategy execution dimension of performance, and as such is
notable.
These findings support the literature whereby the association between organisation culture
and strategy execution dimension of performance can be explained as follows. The literature
from an organisational culture perspective, posits that performance is an important aspect of
organisational culture that must be built into the DNA of the organisation’s form, values and
practices (R. House et al., 2001). It is for this reason that the Project GLOBE study found
achievement orientation, in other words performance, to be a culture dimension worth further
investigating. Achievement orientation refers to the extent by which an organisation supports
and rewards group members for striving for continuous improvement and excellence in
performance (R. House et al., 2001).
The literature from a strategy execution perspective, posits that successful strategy execution
requires a performance process. A focus of setting goals and measuring those critical success
factors that assures goal attainment and strategy execution. These performance goals need to
stretch people reflecting the ever changing competitive landscape that organisations are
expected to operate in (Schneider, Shaw & Beatty, 1991).
It is clear from the above excerpts from literature that the dimension of performance is an
important building block in both organisational culture and strategy. Therefore by
investigating the impact of the dimensions of organisational culture on the dimensions of
strategy execution; it is almost an expectation that there would be an association and the
outcomes of this research confirm that there is a definite association between organisational
culture and the strategy execution dimension of performance. However, the results can also
be explained by the simple consideration that each of the Project Globe cultural dimensions
(excluding achievement orientation) have their own link to the strategy execution dimension
of performance. Assertiveness concerns the degree confrontation among employees in the
organisation. It can be perceived that a big part of good performance in strategy execution
requires accountability and holding team members to task, this can often equate to having
confrontational conversations within teams which are open and honest. In highly
collectivistic organisations; cohesiveness among team members can be a make or break factor
for excellent performance in strategy execution. With respect to organisations highly
© University of Pretoria
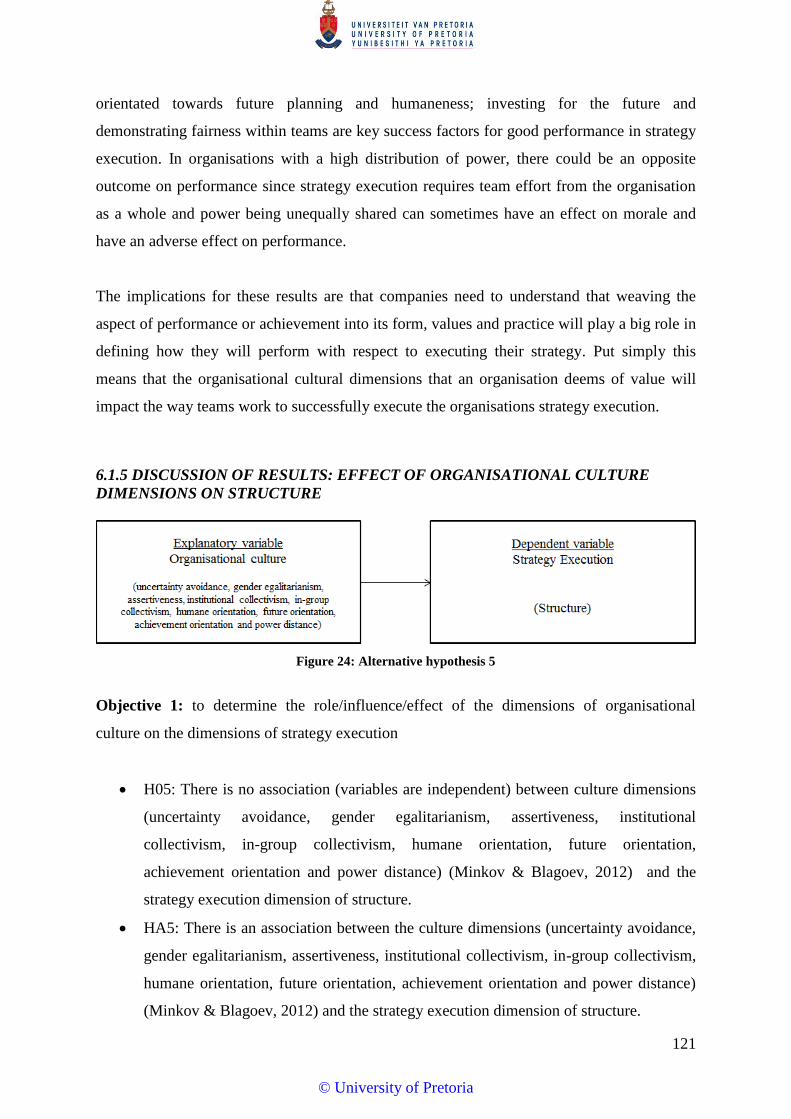
121
orientated towards future planning and humaneness; investing for the future and
demonstrating fairness within teams are key success factors for good performance in strategy
execution. In organisations with a high distribution of power, there could be an opposite
outcome on performance since strategy execution requires team effort from the organisation
as a whole and power being unequally shared can sometimes have an effect on morale and
have an adverse effect on performance.
The implications for these results are that companies need to understand that weaving the
aspect of performance or achievement into its form, values and practice will play a big role in
defining how they will perform with respect to executing their strategy. Put simply this
means that the organisational cultural dimensions that an organisation deems of value will
impact the way teams work to successfully execute the organisations strategy execution.
6.1.5 DISCUSSION OF RESULTS: EFFECT OF ORGANISATIONAL CULTURE
DIMENSIONS ON STRUCTURE
Figure 24: Alternative hypothesis 5
Objective 1: to determine the role/influence/effect of the dimensions of organisational
culture on the dimensions of strategy execution
H05: There is no association (variables are independent) between culture dimensions
(uncertainty avoidance, gender egalitarianism, assertiveness, institutional
collectivism, in-group collectivism, humane orientation, future orientation,
achievement orientation and power distance) (Minkov & Blagoev, 2012) and the
strategy execution dimension of structure.
HA5: There is an association between the culture dimensions (uncertainty avoidance,
gender egalitarianism, assertiveness, institutional collectivism, in-group collectivism,
humane orientation, future orientation, achievement orientation and power distance)
(Minkov & Blagoev, 2012) and the strategy execution dimension of structure.
© University of Pretoria
122
It was concluded that the null hypothesis was rejected and the alternate hypothesis partially
confirmed or accepted. It was therefore found, that for the sample group, a statistically
significant correlation existed between eight out of the nine organisational culture dimensions
and the strategy execution dimension of structure. There were six out of the eight associations
that exhibited a medium to strong relationship i.e. uncertainty avoidance & Structure, in-
group collectivism & structure, humane orientation & structure, future orientation &
structure, achievement orientation & structure and power distance & structure. The
coefficient of correlation was calculated at a range of r = 0.358 – 0.574, with a p value was
<0.01, and implies that organisational culture can explain between 36% - 57% of the strategy
execution dimension of structure, and as such is notable.
These findings support the literature whereby the association between organisation culture
and strategy execution dimension of structure can be explained as follows. The literature
from an organisational culture perspective, posits that structure is an important aspect of
organisational culture which is decided upfront by the initial leaders of the organisation. R.
House et al (2001) found that organisational form (structure) and practices are established by
the founders of organisations when deciding upon the initial culture of their organisations.
Thereafter subsequent leaders continue to influence the structure and may even institute an
organisational change if necessary. The Cameron and Quinn competing values framework
defines that culture types i.e. clan, adhocracy, hierarchy, and market which require that the
organisation be structured in a manner that allows the dimensions of the culture type to be
fostered. For example an organisation with a hierarchy culture type; will have a certain
degree of power distance. As a result it will need to structure itself to have a fair amount
management levels, controls and procedures in place that govern how people work and what
they do.
The literature from a strategy execution perspective, posits that successful strategy
implementation requires good organisational structures and managerial skills. Structural
variables of an organisation include the actual design of the organisation, the management
levels, controls and procedures, etc. These variables combined provide a framework in which
companies operate effectively. Structural variables offer an execution toolkit for highlighting
key levers that could affect the formulation-implementation process. Strategies are cascaded
and implemented through the organisational structure (Bonoma & Crittenden, 1988).
© University of Pretoria

123
It is clear from the above excerpts from literature that the dimension of structure is an
important building block in both organisational culture and strategy. Therefore by
investigating the impact of the dimensions of organisational culture on the dimensions of
strategy execution; it is almost an expectation that there would be an association and the
outcomes of this research confirm that there is a definite association between organisational
culture and the strategy execution dimension of structure. However, the results can also be
explained by the simple consideration that each of the Project Globe cultural dimensions have
their own link to the strategy execution dimension of structure. Uncertainty avoidance refers
to the extent by which members of an organisation rely on, “social norms, rituals, and
bureaucratic practices” as a means to avoid uncertainty and the unpredictability of future
events. In order to successfully execute on strategy; some type of formal structure is needed
within the organisation which allows the organisation to operate effectively. Within this
organisational structure for strategy execution there will be rules, norms and practices defined
as part of both the culture and critical success factors for strategy execution. This is where the
link between structure and uncertainty avoidance (culture dimension) is revealed since
successful execution plans may require employees to avoid hiding behind the rules norms and
practice of the structure. In highly collectivistic organisations; a structure (matrix structure)
that promotes cohesiveness among team members can be a deciding factor for excellent
performance in strategy execution. With respect to organisations highly orientated towards
future planning, achievement and humaneness; having a structure in place that allows the
company to seek trends for the future as well as good performance management and reward
structure are the key ingredients for successful strategy execution. In organisations with a
high degree of power distance, it can be expected that there would a large focus on structure
to enable the different levels of power to work together towards delivering the goal of
strategy execution.
The implications for these results are that companies need to understand that structure is an
important aspect for both organisational culture and strategy execution. The type of cultures
dimensions that an organisation wants to institute will be largely affect the type of structure
that the organisation puts in place. In turn, the structure put in place largely impacts the
ability to execute the strategy successfully since there are several aspects within a structure
that create a framework for the organisation to operate effectively.
© University of Pretoria
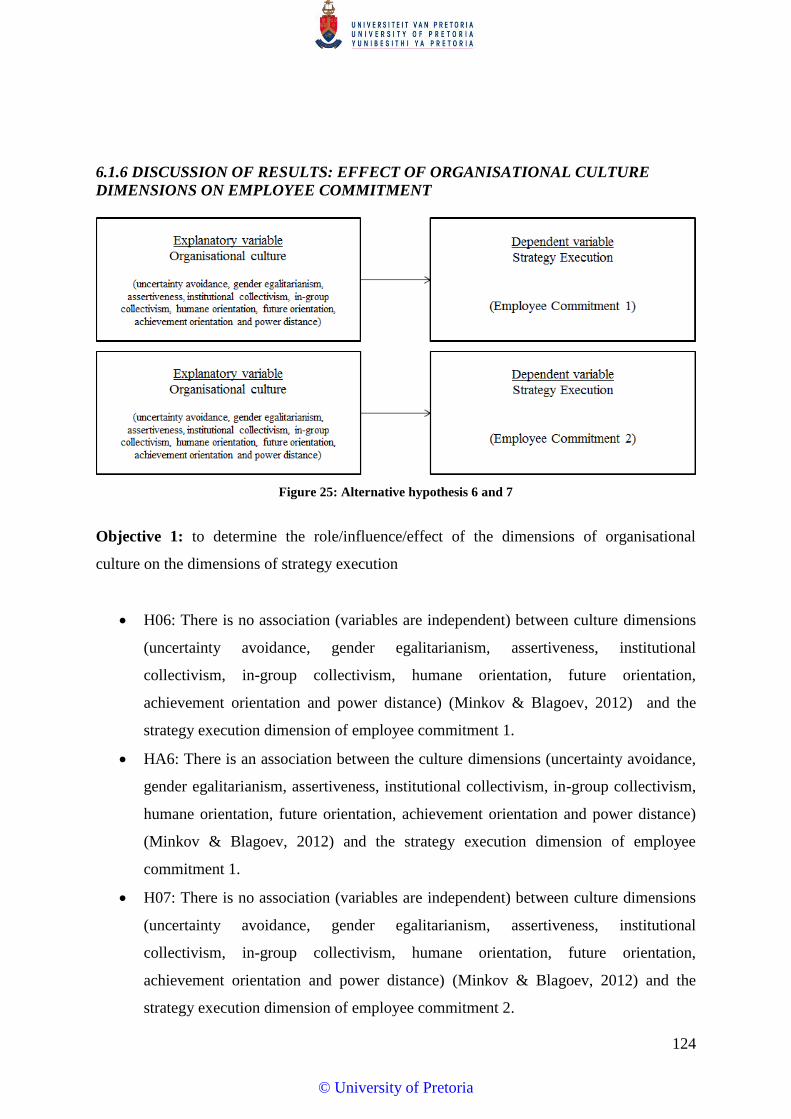
124
6.1.6 DISCUSSION OF RESULTS: EFFECT OF ORGANISATIONAL CULTURE
DIMENSIONS ON EMPLOYEE COMMITMENT
Figure 25: Alternative hypothesis 6 and 7
Objective 1: to determine the role/influence/effect of the dimensions of organisational
culture on the dimensions of strategy execution
H06: There is no association (variables are independent) between culture dimensions
(uncertainty avoidance, gender egalitarianism, assertiveness, institutional
collectivism, in-group collectivism, humane orientation, future orientation,
achievement orientation and power distance) (Minkov & Blagoev, 2012) and the
strategy execution dimension of employee commitment 1.
HA6: There is an association between the culture dimensions (uncertainty avoidance,
gender egalitarianism, assertiveness, institutional collectivism, in-group collectivism,
humane orientation, future orientation, achievement orientation and power distance)
(Minkov & Blagoev, 2012) and the strategy execution dimension of employee
commitment 1.
H07: There is no association (variables are independent) between culture dimensions
(uncertainty avoidance, gender egalitarianism, assertiveness, institutional
collectivism, in-group collectivism, humane orientation, future orientation,
achievement orientation and power distance) (Minkov & Blagoev, 2012) and the
strategy execution dimension of employee commitment 2.
© University of Pretoria
125
HA7: There is an association between the culture dimensions (uncertainty avoidance,
gender egalitarianism, assertiveness, institutional collectivism, in-group collectivism,
humane orientation, future orientation, achievement orientation and power distance)
(Minkov & Blagoev, 2012) and the strategy execution dimension of employee
commitment 2.
Employee Commitment 1
From hypothesis six outcomes, it was concluded that the null hypothesis was rejected and the
alternate hypothesis partially confirmed or accepted. It was therefore found, that for the
sample group, a statistically significant correlation existed between nine out of the nine
organisational culture dimensions and the strategy execution dimension of employee
commitment 1. There were five out of the nine associations that exhibited a medium
relationship i.e. gender egalitarianism & employee commitment 1, in-group collectivism &
employee commitment 1, humane orientation & employee commitment 1, future orientation
& employee commitment 1, and power distance & employee commitment 1. The coefficient
of correlation was calculated at a range of r = 0.237 – 0.385, with a p value was <0.01, and
implies that organisational culture can explain between 24% - 39% of the strategy execution
dimension of employee commitment 1, and as such is notable.
Employee Commitment 2
From hypothesis seven outcomes, it was concluded that the null hypothesis was to be rejected
and the alternate hypothesis was partially confirmed or accepted. It was therefore found, that
for the sample group, a statistically significant correlation existed between seven out the nine
organisational culture dimensions and the strategy execution dimension of information
sharing. There were five out of the seven associations that exhibited a medium relationship
i.e. in-group collectivism & employee commitment 2, humane orientation & employee
commitment 2, future orientation & employee commitment 2, achievement orientation &
employee commitment 2, and power distance & employee commitment 2. The coefficient of
correlation was calculated at a range of r = 0.305 – 0.451, with a p value was <0.01, and
implies that organisational culture can explain between 31% - 45% of the strategy execution
dimension of employee commitment 2, and as such is notable.
© University of Pretoria
126
These findings support the literature whereby the association between organisation culture
and strategy execution dimension of employee commitment can be explained as follows. The
literature from an organisational culture perspective, posits that employee commitment is an
important aspect of organisational culture. R. House et al (2001) found that organisational
values and practices impact the manner in which people behave and how they do things.
Over time, it was found that leaders and employees in organisations respond to the
organisational culture and alter their behaviours and styles. This is particularly evident in the
Project Globe cultural dimensions of in-group collectivism which refers to the degree by
which members of an organisation express pride, loyalty, cohesiveness and commitment in
their organisations. In other words the culture of the organisation closely affects the way
people behave and thus their commitment to the organisation which they express in the form
of pride, loyalty and the way they do things.
The literature from a strategy execution perspective, posits that successful strategy execution
requires employee commitment regardless of management level. Employee commitment
reflects the degree to which employees are determined to see the strategy effectively
implemented, ultimately becoming part of the organization. In most organisations it has been
observed that the emphasis with respect to employee commitment has been placed on gaining
commitment to “how things are done”; little emphasis has been has been placed on gaining
commitment to “what is done”(Parnell et al., 2002).
It is clear from the above excerpts from literature that the dimension of employee
commitment is an important building block in both organisational culture and strategy.
Therefore by investigating the impact of the dimensions of organisational culture on the
dimensions of strategy execution; it is almost an expectation that there would be an
association and the outcomes of this research confirm that there is a definite association
between organisational culture and the strategy execution dimension of employee
commitment. However, the results can also be explained by the simple consideration that
each of the Project Globe cultural dimensions have their own link to the strategy execution
dimension of employee commitment. In group collectivism as explained earlier refers to the
degree by which members of an organisation express pride, loyalty, cohesiveness and
commitment in their organisations. It is expected that there should be a direct association
with employee commitment in strategy execution. With respect to organisations highly
orientated towards future planning, achievement and humaneness; in order to successfully
© University of Pretoria
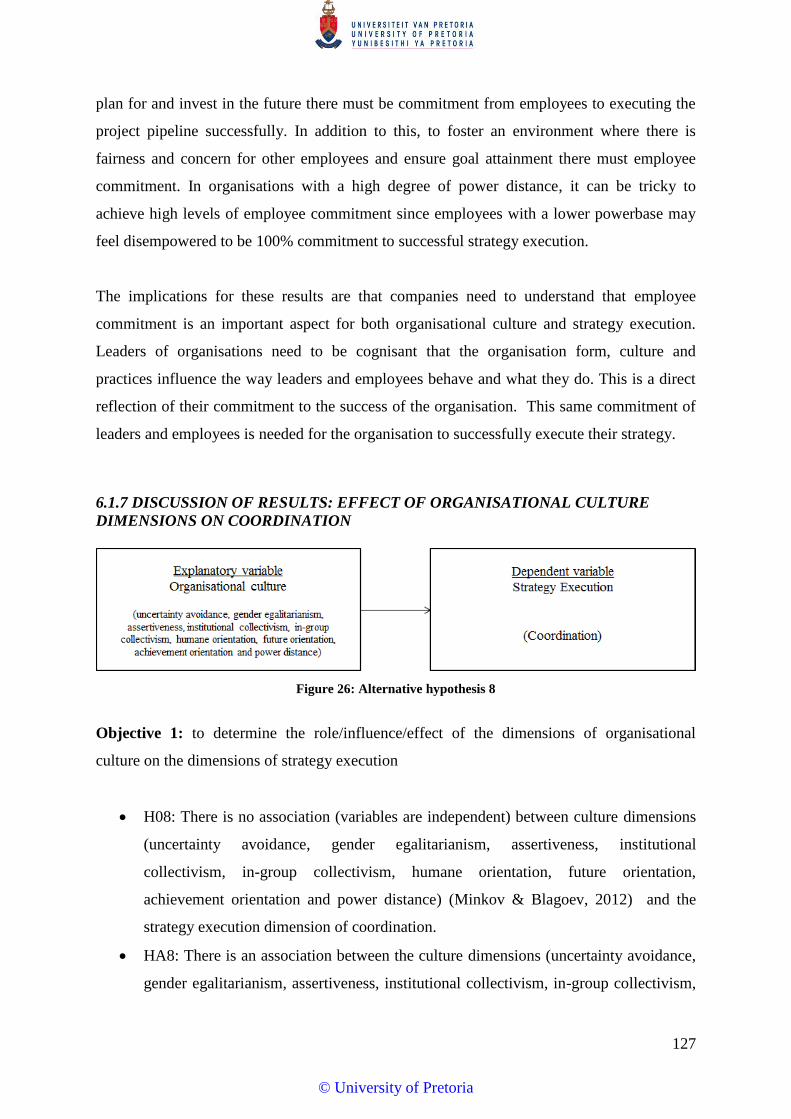
127
plan for and invest in the future there must be commitment from employees to executing the
project pipeline successfully. In addition to this, to foster an environment where there is
fairness and concern for other employees and ensure goal attainment there must employee
commitment. In organisations with a high degree of power distance, it can be tricky to
achieve high levels of employee commitment since employees with a lower powerbase may
feel disempowered to be 100% commitment to successful strategy execution.
The implications for these results are that companies need to understand that employee
commitment is an important aspect for both organisational culture and strategy execution.
Leaders of organisations need to be cognisant that the organisation form, culture and
practices influence the way leaders and employees behave and what they do. This is a direct
reflection of their commitment to the success of the organisation. This same commitment of
leaders and employees is needed for the organisation to successfully execute their strategy.
6.1.7 DISCUSSION OF RESULTS: EFFECT OF ORGANISATIONAL CULTURE
DIMENSIONS ON COORDINATION
Figure 26: Alternative hypothesis 8
Objective 1: to determine the role/influence/effect of the dimensions of organisational
culture on the dimensions of strategy execution
H08: There is no association (variables are independent) between culture dimensions
(uncertainty avoidance, gender egalitarianism, assertiveness, institutional
collectivism, in-group collectivism, humane orientation, future orientation,
achievement orientation and power distance) (Minkov & Blagoev, 2012) and the
strategy execution dimension of coordination.
HA8: There is an association between the culture dimensions (uncertainty avoidance,
gender egalitarianism, assertiveness, institutional collectivism, in-group collectivism,
© University of Pretoria
128
humane orientation, future orientation, achievement orientation and power distance)
(Minkov & Blagoev, 2012) and the strategy execution dimension of coordination.
It was concluded that the null hypothesis was rejected and the alternate hypothesis partially
confirmed or accepted. It was therefore found, that for the sample group, a statistically
significant correlation existed between seven out of the nine organisational culture
dimensions and the strategy execution dimension of coordination. There were five out of the
seven associations that exhibited a medium to strong relationship i.e. in-group collectivism &
coordination, humane orientation & coordination, future orientation & coordination,
achievement orientation & coordination and power distance & coordination. The coefficient
of correlation was calculated at a range of r = 0.312 – 0.419, with a p value was <0.01, and
implies that organisational culture can explain between 31% - 42% of the strategy execution
dimension of coordination, and as such is notable.
These findings support the literature whereby the association between organisation culture
and strategy execution dimension of coordination can be explained as follows. The literature
from an organisational culture perspective, posits that coordination is an important aspect of
organisational culture. R. House et al (2001) found that the ability to work together as a
collective which requires a great deal of co-ordination impact the manner in which people do
things (practices) within the organisation. This is particularly evident in the Project Globe
cultural dimension of collectivism refers to the degree by which organisational practices and
behaviour encourage team work and reward, “collective distribution of resources”.
The literature from a strategy execution perspective, posits that successful strategy
implementation requires good coordination within the organisation. Coordination refers to the
participation and collaboration between members within the organisation’s labour force,
whether the implementation involves the expansion of a product line, new product
development, or the merger and acquisition of a new company to enable the organisation to
remain relevant in the marketplace (Crittenden & Crittenden, 2008). Achieving good
coordination can be a complex matter for many organisations but is important for execution
success (L. G. Hrebiniak, 2005).
It is clear from the above excerpts from literature that the dimension of employee
commitment is an important building block in both organisational culture and strategy.
© University of Pretoria

129
Therefore by investigating the impact of the dimensions of organisational culture on the
dimensions of strategy execution; it is almost an expectation that there would be an
association and the outcomes of this research confirm that there is a definite association
between organisational culture and the strategy execution dimension of coordination.
However, the results can also be explained by the simple consideration that each of the
Project Globe cultural dimensions have their own link to the strategy execution dimension of
coordination. In group collectivism as explained earlier concerns the degree to which
individuals express pride, loyalty, and cohesiveness in their organisations. It is expected that
there should be a direct association with the strategy execution dimension of coordination
since in order to operate as a cohesive unit there needs to be a high level of coordination
between employees, leaders and teams. With respect to organisations highly orientated
towards future planning, achievement and humaneness; in order to successfully plan for and
invest in the future there, to foster an environment where employees are concerned with each
other’s well-being and ensure goal attainment, there must be a high degree of coordination.
This high degree of coordination will allow for teams to work to together to aptly realise their
synergies and make use of this as a competitive advantage for future planning. In addition to
this, to successfully achieve goals, teams need to be able to coordinate the use of resources to
maximise output and efficiency. In organisations with a high degree of power distance, it can
be challenging to achieve high levels of co-ordination since employees with a lower
powerbase may feel disempowered and maybe reluctant to coordinate as a result.
The implications for these results are that companies need to understand that coordination is
an important aspect for both organisational culture and strategy execution. Leaders of
organisations need to be cognisant that the organisation culture and practices influence the
way leaders and employees behave and what they do. A large part of the “what they do” in
the organisation involves streamlining resources as well as maximising output and profit; this
is generally enabled by co-ordination between employees, teams, leaders and departments to
achieve success. And in turn this co-ordination which is critical for success also leads to
success from a strategy execution perspective.
© University of Pretoria
130
6.1.7 DISCUSSION OF RESULTS: ORGANISATIONAL CULTURE DIMENSION
WITH THE HIGHEST EFFECT ON STRATEGY EXECUTION
Objective 2: to investigate which dimension of culture was found to have the highest effect
on strategy execution.
A canonical correlation analysis was conducted using the nine dimensions of culture
dimensions (uncertainty avoidance, gender egalitarianism, assertiveness, institutional
collectivism, in-group collectivism, humane orientation, future orientation, achievement
orientation and power distance) (R. House et al., 2001) as predictors of the eight strategy
execution variables to evaluate the multivariate shared relationship between the two variable
sets (i.e., culture and strategy execution).
The canonical correlation showed that the full model across all functions was statistically
significant using the Wilk’s criterion. The dimension reduction analysis which tests the
hierarchal arrangement of functions for statistical significance, showed that the full model
(Functions 1 to 8) was statistically significant, F (72, 1534.35) = 7.09, p < .001 and the
Function 2 to 8 was also statistically significant, F (56,1362.37) = 1.78, p < .001. These two
functions were considered important on the context of the analysis in that it had a shared
variance of .916 (.745 +.171), which is 91.6%. The regression equations for each dependent
variable separately showed that achievement orientation is statistically significantly across all
dimensions of strategy execution. This means that it had the greatest impact.
The above finding has not been explicitly proven in literature and has been relatively
unexamined. As mentioned in chapter 2, there has been limited research into the effects of
organisational culture dimensions on strategy execution dimensions. Therefore this finding
adds to the body of knowledge on the relationships between the constructs of organisational
culture and strategy execution, as well as the relationships between the dimensions of the
organisational culture and strategy execution.
In addition to the canonical analysis, the researcher also conducted a control variable
analysis which showed that management level has an influence on the organisational culture
dimensions (uncertainty avoidance, gender egalitarianism, assertiveness, institutional
collectivism, in-group collectivism, humane orientation, future orientation, and power
© University of Pretoria
131
distance) and the strategy execution of leadership. In addition to the organisation strategy
(i.e. growth, low cost, innovation, etc.) influences the culture dimensions (uncertainty
avoidance, gender egalitarianism, assertiveness, institutional collectivism, in-group
collectivism, humane orientation, future orientation, and power distance) and the strategy
execution dimension of employee commitment.
Similarly, the above finding has not been explicitly proven in literature and has been
relatively unexamined. Therefore this finding adds to the body of knowledge on the
relationship between the constructs of organisational culture and strategy execution, as well
as the relationship between the dimensions of the main constructs (organisational culture and
strategy execution).
© University of Pretoria

132
CHAPTER 7
CONCLUSION
This chapter consolidates the findings of the previous chapters in order to highlight
implications for management, avenues for future research, and the limitations of the research.
7.1 PRINCIPAL FINDINGS
The purpose of this study was to examine the effect of organisational culture dimensions on
strategy execution dimensions. The association between organisational culture and
performance, which is regarded an outcome of good strategy execution, has been
theoretically and empirically investigated in the past, and a positive impact has been found in
these studies. The effects of organisational culture on performance ranging from employee
satisfaction, financial performance, and market performance to innovation have been
investigated; however the impact of organisational culture on other variations of strategy
execution remains relatively unexplored.
From an overall perspective, the results from this study are similar and support the findings
from the studies which have investigated the effect of organisational culture on performance.
The overall outcome from this study has shown that the dimensions of organisational culture
have a variation of strong, medium and weak associations to the dimensions of strategy
execution.
There were eight associations tested between the organisational culture dimensions and the
strategy execution dimensions. There was only one association where the alternative
hypothesis was fully accepted and seven associations where the alternate hypothesis was
partially accepted.
The association where the null hypothesis was rejected and the alternate hypothesis
confirmed and where as follows:
Hypotheses 6A: Organisational culture dimensions (uncertainty avoidance, gender
egalitarianism, assertiveness, institutional collectivism, in-group collectivism, humane
orientation, future orientation, achievement orientation and power distance) (Minkov &
Blagoev, 2012) have an association with the strategy execution dimension of employee
commitment 1.
© University of Pretoria
133
The above is a full association since all nine organisational culture dimensions have a
statistically significant association with the strategy execution dimension of employee
commitment 1. There are four weak and five medium associations.
R. House et al (2001) found that the culture of the organisation closely affects the way people
behave and thus their commitment to the organisation which they express in the form of
pride, loyalty and the way they do things. This was encapsulated in their project globe study
in form of an organisational culture dimension known as in-group collectivism which reflects
the degree to which individuals express pride, loyalty, and commitment in their organisations.
In summary this makes employee commitment an important aspect of organisational culture.
It must be noted that for leaders to foster a good organisational culture, commitment is
required from the employees. The literature from a strategy execution perspective, posits that
successful strategy execution requires employee commitment regardless of management
level. Employee commitment reflects the degree to which employees are determined to see
the strategy effectively implemented, ultimately becoming part of the organization. In the
behavioural literature, most of the emphasis on employee commitment has been placed on
gaining commitment to how things are done (Parnell et al., 2002).
By virtue of the fact that the literature deems employee commitment to be critical aspects in
both organisational culture and strategy execution, it is expected that there should be an
association between the two constructs. The above findings, from this study, confirm the
literature of (R. House et al., 2001; Parnell et al., 2002) and prove the association between all
nine of the organisational culture dimensions and the employee commitment. From a
practical perspective, it can be concluded from these findings for this sample group, that an
increased focus on the organisational culture dimensions will have an increased impact on
employee commitment to successfully execute on the organisations strategy. A possible
explanation for all nine statistically significant associations could be linked to the nature of
the questionnaire (survey) items under employee commitment relating to one’s personal
accountability and commitment to executing strategies for the organisation irrespective of
their department, job and team. The sample group for this study is only management;
managers have a psychological contract with the organisation and are expected to deal with
cross functional execution and not be bound to their department, team, and job. It can be
considered that this resonated with the sample group when responding to the questionnaire.
© University of Pretoria

134
The objectives where the null hypothesis was rejected and the alternate hypothesis only
partially confirmed and where as follows:
Hypotheses 1A: Organisational culture dimensions (uncertainty avoidance, gender
egalitarianism, assertiveness, institutional collectivism, in-group collectivism, humane
orientation, future orientation, achievement orientation and power distance) (Minkov &
Blagoev, 2012) have a partial association with the strategy execution dimension of
information sharing.
The above is a partial association since only seven organisational culture dimensions have
a statistically significant association with the strategy execution dimension of information
sharing. There are one weak, two medium and four strong associations.
Hypotheses 2A: Organisational culture dimensions (uncertainty avoidance, gender
egalitarianism, assertiveness, institutional collectivism, in-group collectivism, humane
orientation, future orientation, achievement orientation and power distance) (Minkov &
Blagoev, 2012) have a partial association with the strategy execution dimension of
leadership.
The above is a partial association since only eight organisational culture dimensions have
a statistically significant association with the strategy execution dimension of leadership.
There are two weak, two medium and four strong associations.
Hypotheses 3A: Organisational culture dimensions (uncertainty avoidance, gender
egalitarianism, assertiveness, institutional collectivism, in-group collectivism, humane
orientation, future orientation, achievement orientation and power distance) (Minkov &
Blagoev, 2012) have a partial association with the strategy execution dimension of
rewards.
The above is a partial association since only seven organisational culture dimensions have
a statistically significant association with the strategy execution dimension of rewards.
There are one weak, three medium and three strong associations.
Hypotheses 4A: Organisational culture dimensions (uncertainty avoidance, gender
egalitarianism, assertiveness, institutional collectivism, in-group collectivism, humane
orientation, future orientation, achievement orientation and power distance) (Minkov &
Blagoev, 2012) have a partial association with the strategy execution dimension of
performance.
© University of Pretoria

135
The above is a partial association since only seven organisational culture dimensions have
a statistically significant association with the strategy execution dimension of
performance. There are one weak, four medium and two strong associations.
Hypotheses 5A: Organisational culture dimensions (uncertainty avoidance, gender
egalitarianism, assertiveness, institutional collectivism, in-group collectivism, humane
orientation, future orientation, achievement orientation and power distance) (Minkov &
Blagoev, 2012) have a partial association with the strategy execution dimension of
structure.
The above is a partial association since only eight organisational culture dimensions have
a statistically significant association with the strategy execution dimension of
performance. There are two weak, four medium and two strong associations.
Hypotheses 7A: Organisational culture dimensions (uncertainty avoidance, gender
egalitarianism, assertiveness, institutional collectivism, in-group collectivism, humane
orientation, future orientation, achievement orientation and power distance) (Minkov &
Blagoev, 2012) have a partial association with the strategy execution dimension of
employee commitment 2.
The above is a partial association since only seven organisational culture dimensions have
a statistically significant association with the strategy execution dimension of employee
commitment 2. There are two weak and five medium associations.
Hypotheses 8A: Organisational culture dimensions (uncertainty avoidance, gender
egalitarianism, assertiveness, institutional collectivism, in-group collectivism, humane
orientation, future orientation, achievement orientation and power distance) (Minkov &
Blagoev, 2012) have a partial association with the strategy execution dimension of
coordination.
The above is a partial association since only seven organisational culture dimensions have
a statistically significant association with the strategy execution dimension of
coordination. There are two weak and five medium associations.
As mentioned above the study of the effect of organisational culture on strategy execution is
still a relatively unexamined. There has also been limited research into the effects of
organisational culture dimensions on strategy execution dimensions. This study adds to the
body of knowledge on the relationship between the constructs of organisational culture and
© University of Pretoria
136
strategy execution, as well as relationship between the dimensions of the main constructs
(organisational culture and strategy execution), have not been examined before.
The partial acceptance of the alternate hypothesis and in particular the strength of the
association means that from these findings for this sample group it can be concluded that an
increased focus on the organisational culture dimensions will not in all cases have an
increased impact on the strategy execution dimensions needed to successfully execute on the
organisations strategy.
A possible explanation could be that the current study collected data from 281 employees
from the same FMCG company, where all respondents were in management level and
therefore very similar, resulting in less variety of responses. This can also be confirmed by
the findings in this study which proved that management level has an influence on the
organisational culture dimensions. The majority of the respondents (~50%) were from a
junior management level which could have resulted in the similar responses whereby certain
dimensions of organisational culture were undermined due to management level and hence
their impact on the strategy execution dimensions under-estimated. The researcher
recommends widening the scope of this study, to empirically investigate if the results are
consistent when sampling respondents from different types of companies, and with more
variety in employee roles and jobs.
7.2. IMPLICATIONS FOR MANAGEMENT
This research study highlights numerous implications for management of organisations.
These implications are discussed below:
i. The literature on organizational culture and strategy execution revealed that organisation
that understand how to cultivate good culture and operationalise the culture in an
effective way; will stand to benefit the most in terms of employee productivity towards
executing the organisational strategy.
ii. It is important that employees embrace the organizational culture and absorb the shared
values. In addition to this top management should provide precise guidelines and
direction to encourage and gain commitment from the employees to achieve the
company’s objectives.
© University of Pretoria
137
iii. Organizational culture is considered to be inherently unique, complex and specific to an
organisation therefore making it a major challenge to emulate or replicate (Chan et al.,
2004). This is predominantly the reason why organizational culture is held in such high
importance in both the academic and business world; it is valuable and if well understood
can be utilised to create a sustainable competitive advantage. Therefore management need
to focus on fostering and developing organisational culture dimensions, since
organizational culture can have a direct impact on good strategy execution.
iv. The organisational cultural dimensions that organisations deem to be valuable will impact
the way leadership conduct themselves to achieve a successful strategy execution. It is
important for management to understand that cultural dimensions play an important role
in defining leadership behaviours.
v. Management must foster and develop an organisational culture that rewards employees
for the successful execution of strategy since it is this aspect that keeps employees
motivated to create good processes for sustainable strategy execution and remain
committed.
vi. Weaving the aspect of performance or achievement into an organisation’s form, values
and practices will play a big role in defining its performance in strategy execution. Put
simply this means that the organisational cultural dimensions that management believes
holds value will impact the way teams work to successfully execute the organisations
strategy execution.
vii. The type of cultures dimensions that an organisation wants to institute will be largely
affect the type of structure that the organisation puts in place. In turn, the structure put in
place largely impacts the ability to execute the strategy successfully since there are
several aspects within a structure that create a framework for the organisation to operate
effectively.
viii. Leaders of organisations need to be cognisant that the organisation culture and practices
influence the way leaders and employees behave and what they do. A large part of the
“what they do” in the organisation involves streamlining resources as well as maximising
output and profit; this is generally enabled by co-ordination between employees, teams,
leaders and departments to achieve success. And in turn this co-ordination which is
critical for success also leads to success from a strategy execution perspective.
ix. The way leaders and employees behave and what they do is a direct reflection of their
commitment to the success of the organisation. This same commitment of leaders and
employees is needed for the organisation to successfully execute their strategy. Therefore
© University of Pretoria
138
management need to ensure that employee commitment is a building block in the
organisational culture.
7.3. LIMITATIONS OF THE RESEARCH
The limitation of the study which resulted from the process in which the study was conducted
is discussed within the contents of the previous chapters.
At a higher level, one of the main limitations results from the broad nature of the concepts
used in this investigation, namely organisational culture and strategy execution. This study
focused on a specific link between these two concepts as per definitions provided within the
study; however, perhaps much more insight can be gained by executing a similar study from
different perspectives of the two concepts. For example considering the study across a variety
of companies and not restricting it to one company. The sample was restricted to one FMCG
company and therefore the findings will be limited for use as a guide for FMCG companies
and could not be generalised to all companies. However due to cross-sectional nature of the
study; there were time constraints which lead to a lack of depth in analysis when compared to
a longitudinal study. There were also several biases at play in this study such as non-response
bias primarily due to refusal to respond in this case and self-selection bias, whereby it is
possible that the people who chose to respond are those who felt strongly about the subject,
thereby skewing the result (Saunders & Lewis, 2012).
7.4. SUGGESTIONS FOR FUTURE RESEARCH
It is suggested that further research focuses on broadening the scope of this study. In
particular, the following can be investigated:
i) A study across multiple organisations, sectors and countries in order to develop more
generally applicable conclusions.
ii) A study which takes into account other factors influencing strategy execution such as
the strategy formulation itself.
iii) A study which focuses on the particular aspects of organisational culture such as
culture types specifically suited to allow for good strategy execution, as opposed to
considering the dimensions that make up lecture from a general perspective.
© University of Pretoria
139
iv) A study on the organisational culture types which are detrimental to strategy
execution.
v) A study that explores the types of organisational culture behaviours which would have
the greatest impact on strategy execution. This would inform management of the
particular behaviours to develop within its organisational culture.
7.5. CONCLUSION
History dating back to the 1940’s has shown us that organisational culture remains a valid
ideology that is here to stay. The question is, “How do we utilise organisational culture to
create the best outcomes for strategy execution?” Strategy execution in itself has been a hot
topic since the 1970’s which many believe is one of the biggest areas that firms grapples with
and this eventually leads to their demise. Organisational culture can no longer be considered
to be a peripheral area of focus in companies that need to successful execute their strategy for
their survival, but rather, it needs to be addressed as a matter of priority. Management or
leadership needs to place a considerable emphasis on developing organisational culture
dimensions that have a positive impact on strategy execution and leads to the success thereof.
This study provides some ground work to prove to companies that there is a definite
association between the organisational culture dimensions and strategy execution dimensions.
Therefore it is time for management to act on this finding, if they are to achieve the
organisations objectives.
© University of Pretoria
140
8. REFERENCES
Ahmadi, S. A. A., Alamzadeh, ., Daraei, M., & Akbari, . (2012). Relationship between
Organizational Culture and Strategy Implementation : Typologies and Dimensions.
Global Business & Management Research: An International Journal, 4(3/4), 286–299.
Alamsjah, F. (2011). Key success factors in implementing strategy: Middle-level managers’
perspectives. Procedia - Social and Behavioral Sciences, 24, 1444–1450.
http://doi.org/10.1016/j.sbspro.2011.09.049
Aryasri, A. R., & Aijaz, S. S. (2013). Role of Organisational culture in shaping High
performing organizations, 2(1), 7–18.
Beer, M., & Eisenstat, R. A. (2000). The Silent Killers of Strategy Implementation and
Learning. Sloan Management Review. Retrieved from
http://search.ebscohost.com/login.aspx?direct=true&db=buh&AN=3358393&site=ehost
-live
Bernard, L. (1992). Examining the organizational culture and organizational performance
link. Leadership & Organization Development Journal, 16(5), 16–21.
http://doi.org/10.1108/01437739510088491
Bhatti, O. K. (2011). Strategy Implementation: an Alternative Choice of 8S ’ S. Annals of
Management Research, 1(2), 52–59.
Bonoma, T. V, & Crittenden, V. L. (1988). Managing marketing implementation. Sloan
Management Review, 29(2), 7.
Bossidy, L., Charan, R., & Burck, C. (2011). Execution: The discipline of getting things done.
Random House.
Bruin, J. (2016). SPSS Data Analysis Examples Canonical Correlation Analysis. Retrieved
January 13, 2017, from http://www.ats.ucla.edu/stat/spss/dae/canonical.htm
Bujang, M. A., & Baharum, N. (2016). Sample Size Guideline for Correlation Analysis.
World Journal of Social Science Research, 31(1), 37.
Cameron, K. s., & Quinn, R. E. (2006). Diagnosing and Changing Organizational Culture.
The Jossey-Bass Business & Management Series. http://doi.org/10.1111/j.1744-
6570.2006.00052_5.x
Chan, L. L. M., Shaffer, M. A., & Snape, E. (2004). In search of sustained competitive
advantage: the impact of organizational culture, competitive strategy and human
resource management practices on firm performance. International Journal of Human
Resource Management, 15(1), 17–35. http://doi.org/10.1080/0958519032000157320
© University of Pretoria
141
Chatman, J. A., & Cha, S. E. (2003). Leading by leveraging culture. California Management
Review, 45(4), 20–34. Retrieved from
http://faculty.haas.berkeley.edu/lyons/chatmanleveragingculture.pdf
Chen, C. C., hen, X.-P., & Meindl, J. R. (1998). How can cooperation be fostered? Academy
of Management Review, 23(2), 285–304.
Cheung, S. O., Wong, P. S. P., & Lam, A. L. (2012). An investigation of the relationship
between organizational culture and the performance of construction organizations.
Journal of Business Economics and Management, 13(4), 688–704.
http://doi.org/10.3846/16111699.2011.620157
Cheung, S. O., Wong, P. S. P., & Wu, A. W. Y. (2011). Towards an organizational culture
framework in construction. International Journal of Project Management, 29(1), 33–44.
http://doi.org/10.1016/j.ijproman.2010.01.014
Comrey, A. L., & Lee, H. B. (1992). A first course in factor analysis. Hillsdale: Erlbaum.
Cooke, R. a, & Rousseau, D. M. (1988). Behavioral Norms and Expectations. Group &
Organization Management, 13(3), 245–273.
http://doi.org/10.1177/105960118801300302
Crittenden, V. L., & Crittenden, W. F. (2008). Building a capable organization: The eight
levers of strategy implementation. Business Horizons, 51(4), 301–309.
http://doi.org/10.1016/j.bushor.2008.02.003
Denison, D. R., & Mishra, A. K. (1995). Toward a Theory of Organizational Culture and
Effectiveness, 6(2).
Diamantopoulos, A. Schlegelmilch, B. B. (2000). Taking the fear out of data analysis: a step-
by-step approach (1st ed.). engage Learning EMEA.
Dong, Y., & Peng, C. Y. J. (2013). Principled missing data methods for researchers.
SpringerPlus. Retrieved from http://dx.doi.org/10.1186/2193-1801-2-222
Dorfman, P., Javidan, M., Hanges, P., Dastmalchian, A., & House, R. (2012). GLOBE: A
twenty year journey into the intriguing world of culture and leadership. Journal of World
Business, 47(4), 504–518. http://doi.org/10.1016/j.jwb.2012.01.004
Drogendijk, R., & Slangen, A. (2006). Hofstede, Schwartz, or managerial perceptions? The
effects of different cultural distance measures on establishment mode choices by
multinational enterprises. International Business Review, 15(4), 361–380.
http://doi.org/10.1016/j.ibusrev.2006.05.003
Duncan, W. . (1989). Organizational Culture: “Getting a Fix” on an Elusive Concept.
Academy of Management Executive, 3(3), 229–236.
© University of Pretoria
142
http://doi.org/10.5465/AME.1989.4274741
George, D., & Mallery, P. (2003). SPSS for windows step by step: A simple study guide and
reference, 11.0 update. Boston, USA: Allyn & Bacon.
Gimbert, X., Bisbe, J., & Mendoza, X. (2010). The role of performance measurement systems
in strategy formulation processes. Long Range Planning, 43(4), 477–497.
http://doi.org/10.1016/j.lrp.2010.01.001
Gregory, B. T., Harris, S. G., Armenakis, A. A., & Shook, C. L. (2009). Organizational
culture and effectiveness: A study of values, attitudes, and organizational outcomes.
Journal of Business Research, 62(7), 673–679.
http://doi.org/10.1016/j.jbusres.2008.05.021
Gushta, M. M., & Rupp, A. A. (2010). Encyclopedia of Research Design. Thousand Oaks:
SAGE Publications, Inc.
Hair, J., Black, W., Babin, B., Anderson, R., & Tatham, R. (2006). Multivariate data analysis
(6th ed.). Uppersaddle River: Pearson Prentice Hall.
Hartnell, C. A., Ou, A. Y., & Kinicki, A. (2011). Organizational culture and organizational
effectiveness: a meta-analytic investigation of the competing values framework’s
theoretical suppositions. The Journal of Applied Psychology, 96(4), 677–694.
http://doi.org/10.1037/a0021987
Heesen, B. (2015). Effective Strategy Execution: Improving Performance with Business
Intelligence Management for Professionals (2nd ed.). Springer.
Hofstede, G. (1984). Culture’s Consequences: International Differences in Work-Related
Values (abridged,). SAGE.
Hogan, S. J., & Coote, L. V. (2014). Organizational culture, innovation, and performance: A
test of Schein’s model. Journal of Business Research, 67(8), 1609–1621.
http://doi.org/10.1016/j.jbusres.2013.09.007
Hoppe, M. H., & Eckert, R. (2015). Leader Effectiveness and Culture. Centre for Creative
Leadership, 1, 1–17.
House, R. J., Hanges, P. J., Javidan, M., Dorfman, P. W., & Gupta, V. (2004). “Culture,
Leadership, and Organizations: The GLOBE Study of 62 Societies.” Sage Publications.
House, R., Javidan, M., & Dorfman, P. (2001). Project GLOBE: An Introduction. Applied
Psychology, 50(4), 489–505. http://doi.org/10.1111/1464-0597.00070
House, R., Javidan, M., Hanges, P., & Dorfman, P. (2002). Understanding cultures and
implicit leadership theories across the globe: An introduction to project GLOBE.
Journal of World Business, 37(1), 3–10. http://doi.org/10.1016/S1090-9516(01)00069-4
© University of Pretoria

143
Hrebiniak, L. (2005). A Strategic Look At Strategy Execution. Optimize, 4(3), 57.
Hrebiniak, L. G. (2005). Making Strategy Work: Leading Effective Execution and Change.
Pearson Education.
Hrebiniak, L. G. (2006). Obstacles to effective strategy implementation. Organizational
Dynamics, 35(1), 12–31. http://doi.org/10.1016/j.orgdyn.2005.12.001
Igwe, A., Ph, D., Onwumere, J. U. J., & Ph, D. (2015). Building Blocks of Successful
Strategy Implementation and Execution in the Management of Organisations, 5(3), 110–
120.
John E. Exner, J. (Ed.). (2013). Issues and Methods in Rorschach Research Lea Series in
Personality and Clinical Psychology. Routledge.
Kaplan, R. S. (2005). How the balanced scorecard complements the McKinsey 7‐S model.
Strategy & Leadership, 33(3), 41–46. http://doi.org/10.1108/10878570510594442
Kaplan, R. S. (2012). The balanced scorecard: comments on balanced scorecard
commentaries. Journal of Accounting & Organizational Change, 8(4), 539–545.
http://doi.org/10.1108/18325911211273527
Kargas, A. D., Varoutas, D., & Nisar, T. (2015). On the relation between organizational
culture and leadership: An empirical analysis. Cogent Business & Management, 2(1), 1–
18. http://doi.org/10.1080/23311975.2015.1055953
Klein, A. (2011). Corporate culture: its value as a resource for competitive advantage.
Journal of Business Strategy, 32(2), 21–28. http://doi.org/10.1108/02756661111109743
Krishnakumar, M. (2015). Strategy Implementation : Strategic Change Model - A Conceptual
Frame Work, 9(2003), 77–86.
Li, D. yuan, & Liu, J. (2014). Dynamic capabilities, environmental dynamism, and
competitive advantage: Evidence from China. Journal of Business Research, 67(1),
2793–2799. http://doi.org/10.1016/j.jbusres.2012.08.007
Linnenluecke, M. K., & Griffiths, A. (2010). Corporate sustainability and organizational
culture. Journal of World Business, 45(4), 357–366.
http://doi.org/10.1016/j.jwb.2009.08.006
MacCormack, A., Dunn, B., & Kemerer, C. F. (2014). Research In Motion: The mobile OS
platform war, Harvard Bu, 1–22.
MacLennan, A. (2010). Strategy Execution: Translating Strategy Into Action in Complex
Organizations.
Martin, K. L., & Powers, E. (n.d.). The Secrets to Successful Strategy Execution Key ideas
from the Harvard Business Review article By Gary L . The Idea in Brief The Idea in
© University of Pretoria

144
Practice. Harvard Business Review, 1–4.
Miller, D., Eisenstat, R., & Foote, N. (2002). Strategy from the Inside Out: BUILDING
CAPABILITY-CREATING ORGANIZATIONS. California Management Review,
44(3), 37–54. http://doi.org/10.2307/41166131
Minkov, M., & Blagoev, V. (2012). What do Project GLOBE’s cultural dimensions reflect?
An empirical perspective. Asia Pacific Business Review, 18(1), 27–43.
http://doi.org/10.1080/13602381.2010.496292
Minkov, M., & Hofstede, G. (2011). The evolution of Hofstede’s doctrine. Cross Cultural
Management: An International Journal, 18(1), 10–20.
http://doi.org/10.1108/13527601111104269
Mumford, M. D., Scott, G. M., Baddis, B., & Strange, J. M. (2002). Leading creating people:
Orchestrating expertise and elationships. Leadership Quarterly, 13, 705–750.
http://doi.org/10.1016/S1048-9843(02)00158-3
Nayak, B., & Barik, A. (2013). Assessment of the Link Between Organizational Culture and
Job Satisfaction (Study of an Indian Public Sector). International Journal of Advanced
System and Social Engineering Research ISSN, 3, 2278–6031. Retrieved from
http://www.bipublication.com
O’Reilly, C. A., Caldwell, D. F., Chatman, . A., Lapiz, M., & Self, W. (2010). How
leadership matters: The effects of leaders’ alignment on strategy implementation.
Leadership Quarterly, 21(1), 104–113. http://doi.org/10.1016/j.leaqua.2009.10.008
Okumus, F. (2006). Towards a strategy implementation framework. International Journal of
Contemporary Hospitality Management, 13(7), 327–338.
Olson, E. M., Slater, S. F., & Hult, G. T. M. (2005). The importance of structure and process
to strategy implementation. Business Horizons, 48(1), 47–54.
http://doi.org/10.1016/j.bushor.2004.10.002
Pallant, J. (2010). SPSS Survival Manual: A Step by Step Guide to Data Analysis using SPSS
for Windows. Open University Press (4th ed.). London.
Pandey, K. N. (2016). Paradigms of Knowledge Paradigms of Knowledge Management: With
Systems Modelling Case Studies Volume 60 of Studies in Systems, Decision and Control.
Springer India, 2016.
Parnell, J. a. (2008). Strategy execution in emerging economies: assessing strategic diffusion
in Mexico and Peru. Management Decision, 46(9), 1277–1298.
http://doi.org/10.1108/00251740810911948
Patten, L. (2015). The Continued Struggle with Strategy Execution. International Journal of
© University of Pretoria

145
Business Management and Economic Research, 6(5), 288–295.
Prajogo, D. I., & McDermott, C. M. (2011). The relationship between multidimensional
organizational culture and performance. International Journal of Operations &
Production Management, 31(7), 712–735. http://doi.org/10.1108/01443571111144823
Priya Chetty, & Datt, S. (2015). Interpretation of factor analysis using SPSS. Retrieved
January 10, 2017, from https://www.projectguru.in/publications/interpretation-of-factor-
analysis-using-spss/
Pryor, M. G., Anderson, D., Toombs, L. A., & Humphreys, J. H. (2007). Strategic
Implementation as a Core Competency The 5P ’ s Model. Journal of Management
Research, 7(1), 3–17.
Radomska, . (2014). Model of Successful Strategy Execution : Revising the Concept.
Problems of Management in the 21st Century, 9(3), 213–222.
Rajasekar, J., & Khoud, A. (2014). Factors affecting Effective Strategy Implementation in a
Service Industry : A Study of Electricity Distribution Companies in the Sultanate of
Oman. International Journal of Business and Social Science, 5(9), 169–183.
Raza, a, Mehmood, S., & Sajjid, K. (2013). Impact of Organizational Culture on Employee
Performance. International Review of Management and Business Research, 2(1), 168–
176. Retrieved from
http://mustangjournals.com/MJMM/v3_MJMM_2013.pdf#page=120
Ronda-Pupo, G. A., & Luis A´ Ngel Guerras-Martin. (2012). DYNAMICS OF THE
EVOLUTION OF THE STRATEGY CONCEPT 1962–2008: A CO-WORD
ANALYSIS. Strategic Management Journal, 33, 162–188.
http://doi.org/10.1002/smj.948
Rose, R. C. (2008). Organizational Culture as a Root of Performance Improvement :
Research and Recommendations. Contemporary Management Research, 4(1), 43–56.
http://doi.org/10.1108/01409170910927578
Rothgeb, J. R. (2008). Encyclopedia of Survey Research Methods. Thousand Oaks: Sage
Publications, Inc.
Saunders, M., & Lewis, P. (2012). Doing Research in Business and Management: An
Essential Guide to Planning Your Project. Essex: Pearson Education Limited.
Saunders, M., Lewis, P., & Thornhill, A. (2009). Research Methods for Business Students.
Essex: Person Education Limited.
Schaap, J. I. (2012). Strategy Implementations—Can Organizations Attain Outstanding
Performance? Strategic Management Review, 6(1), 98–121. http://doi.org/10.4128/1930-
© University of Pretoria
146
4560-6.1.98
Schafer, . L., & Graham, . W. (2002). Missing Data : Our View of the State of the Art, 7(2),
147–177. http://doi.org/10.1037//1082-989X.7.2.147
Schein, E. H. (1992). Organizational culture and leadership. San Francisco: Jossey-Bass Inc.
Scott.
Schneider, B., Ehrhart, M. G., & Macey, W. H. (2013). Organizational climate and culture.
Annual Review of Psychology, 64, 361–88. http://doi.org/10.1146/annurev-psych-
113011-143809
Schneier, C. E., Shaw, D. G., & Beatty, R. W. (1991). Performance Measurement and
Management : A Tool for Strategy Execution. Human Resource Managemen, 30(3),
279–301.
Schwartz, H., & Davis, S. M. (1981). Matching corporate culture and business strategy.
Organizational Dynamics, 10(1), 30–48. http://doi.org/10.1016/0090-2616(81)90010-3
Sekaran, U. (2005). Research Methods for Business: A Skill-building Approach (4th ed.).
New York: John Wiley & Sons.
Şengül, M., Alpkan, L., & Eren, E. (2015). Effect of Globalization on the Operational
Performance: A Survey on SMEs in the Turkish Electric Industry. International
Business Research, 8(7), 57–67. http://doi.org/10.5539/ibr.v8n7p57
Shah, a. M. (2005). The Foundations of Successful Strategy Implementation: Overcoming
the Obstacles. Global Business Review, 6(2005), 293–302.
http://doi.org/10.1177/097215090500600208
Sharifirad, M. S., & Ataei, V. (2012). Organizational culture and innovation culture:
exploring the relationships between constructs. Leadership & Organization
Development Journal, 33(5), 494–517. http://doi.org/10.1108/01437731211241274
Smircich, L. (1983). Concepts of culture and organizational analysis. Administrative Science
Quarterly, 28, 339–358. http://doi.org/10.2307/2392246
Wiewiora, A., Trigunarsyah, B., Murphy, G., & Coffey, V. (2013). Organizational culture
and willingness to share knowledge: A competing values perspective in Australian
context. International Journal of Project Management, 31(8), 1163–1174.
http://doi.org/10.1016/j.ijproman.2012.12.014
Wu, M. (2006). Hofstede’s Cultural Dimensions 30 ears Later : A Study of Taiwan and the
United States *. Intercultural Communication Studies, XV(1), 33–42.
Xenikou, A., & Simosi, M. (2006). Organizational culture and transformational leadership as
predictors of business unit performance. Journal of Managerial Psychology, 21(6), 566–
© University of Pretoria

147
579. http://doi.org/10.1108/02683940610684409
Yesil, S., & Kaya, A. (2013). The Effect of Organizational Culture on Firm Financial
Performance: Evidence from a Developing Country. Procedia - Social and Behavioral
Sciences, 81, 428–437. http://doi.org/10.1016/j.sbspro.2013.06.455
Zheng, W., Yang, B., & McLean, G. N. (2010). Linking organizational culture, structure,
strategy, and organizational effectiveness: Mediating role of knowledge management.
Journal of Business Research, 63(7), 763–771.
http://doi.org/10.1016/j.jbusres.2009.06.005
Zikmund, W., Babin, B., Carr, J., & Griffin, M. (2010). Business research methods (9th ed.).
Mason, USA: Cengage Learning.
© University of Pretoria

148
9. APPENDIX A - Questionnaire Permission Letter
Dear Participant
You are herewith invited to participate in a research project. This research project aims to
understand the effect of organisational culture on strategy execution.
Please note that participation in this survey is completely voluntary and anonymous. Should
you wish to withdraw at any point please feel free to do so. Please note your responses will
be treated with the highest confidentiality and is to be used solely for the purpose of research.
The research findings will be available on request from Melissa Reddy
By completing this research questionnaire, it is generally accepted that you give full consent
to the researcher that you responses may be used for research purposes ONLY and that
responses will be treated in an anonymous and confidential manner.
You will note that the research questionnaire contains 3 sub-questionnaires and a total of 62
questions that need to be completed. Please answer all the questions in the questionnaire.
The questionnaire will only take between 35 - 45 minutes of your time to complete.
I sincerely appreciate your willingness to participate in this importance research project and
the valuable time you are willing to commit in completing this research questionnaire.
Kind Regards
Melissa Reddy
© University of Pretoria

149
10. APPENDIX B – Survey
© University of Pretoria
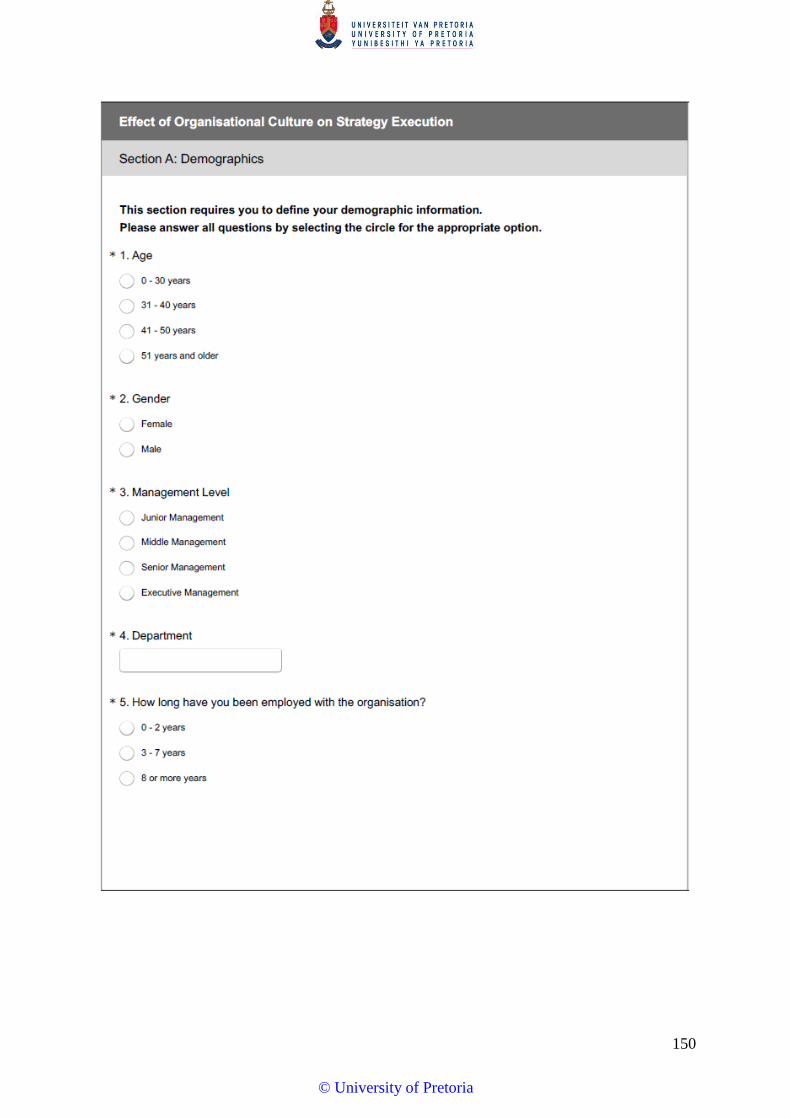
150
© University of Pretoria
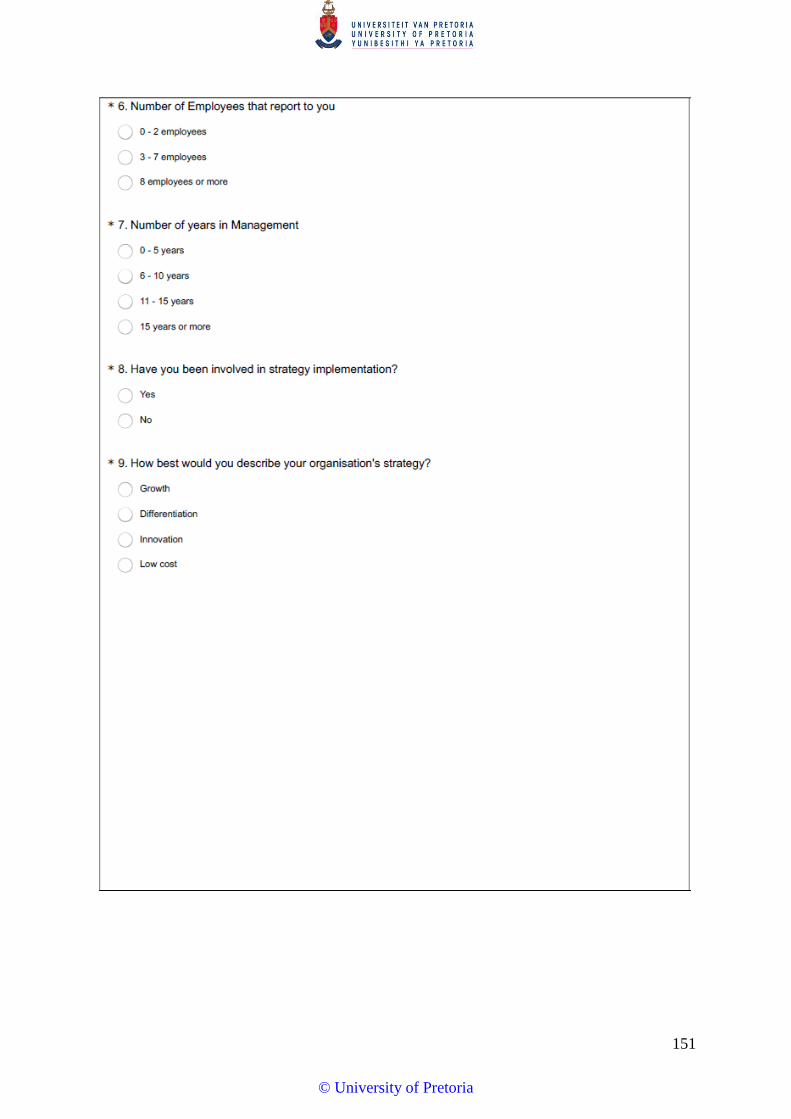
151
© University of Pretoria
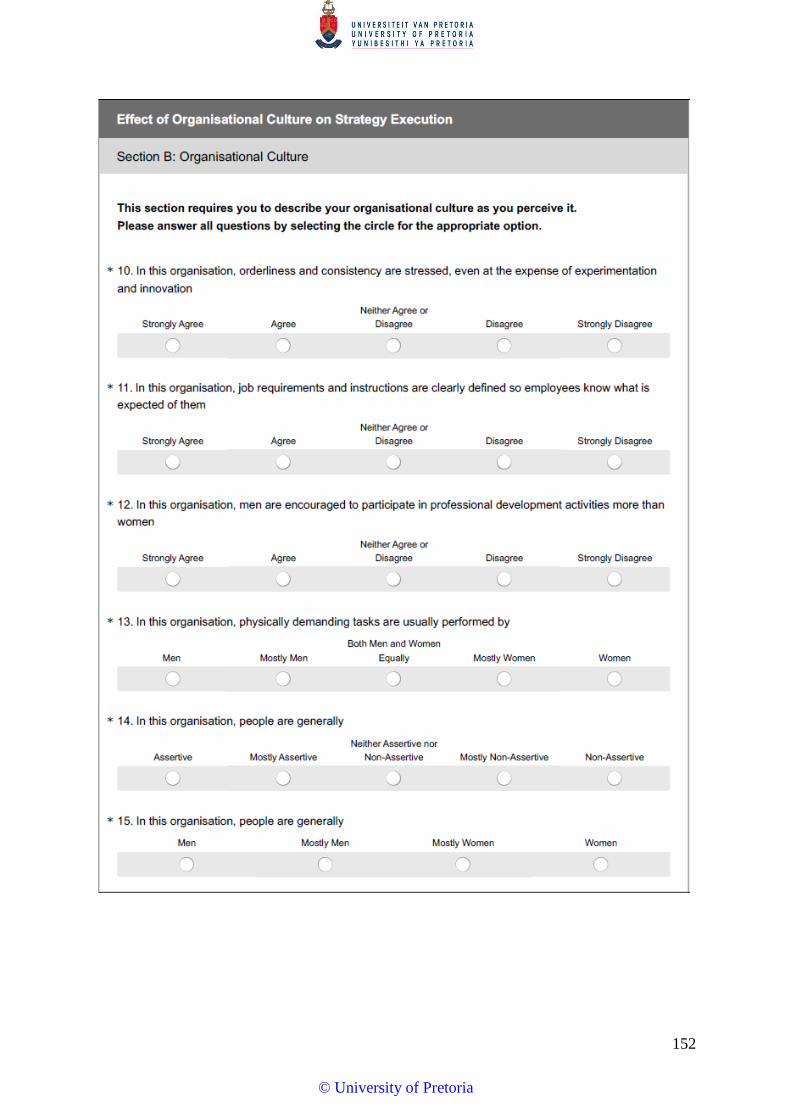
152
© University of Pretoria
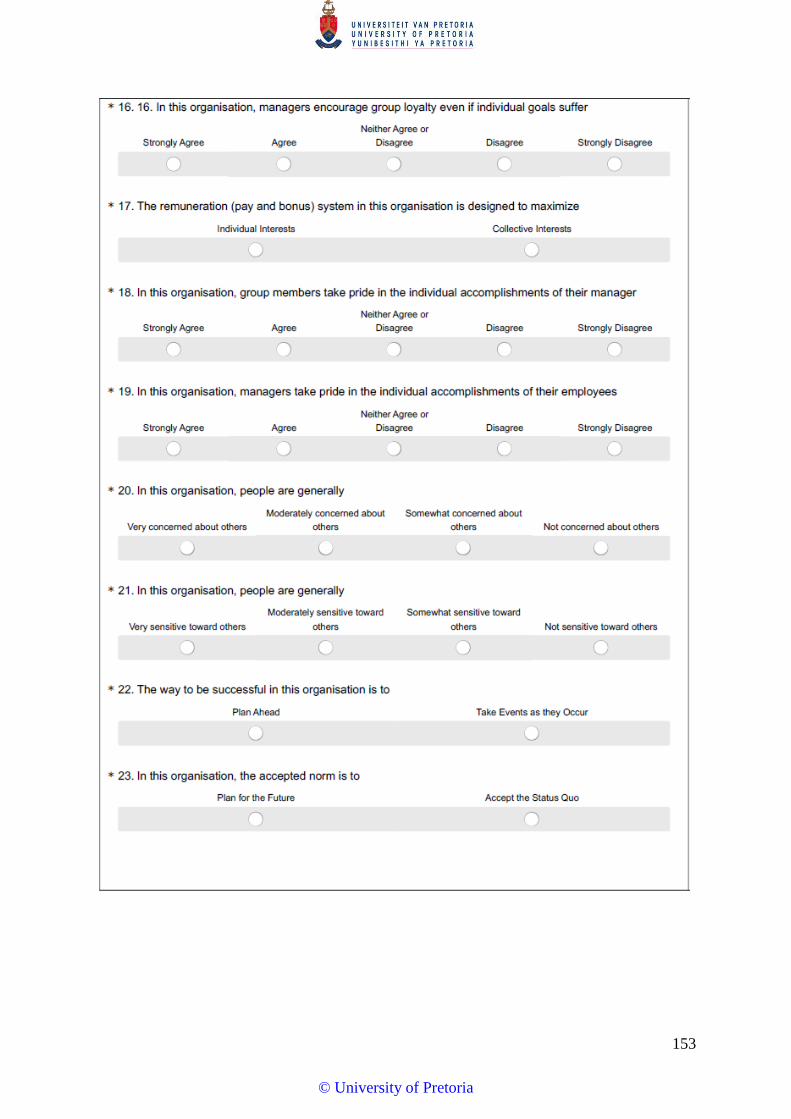
153
© University of Pretoria

154
© University of Pretoria

155
© University of Pretoria

156
© University of Pretoria
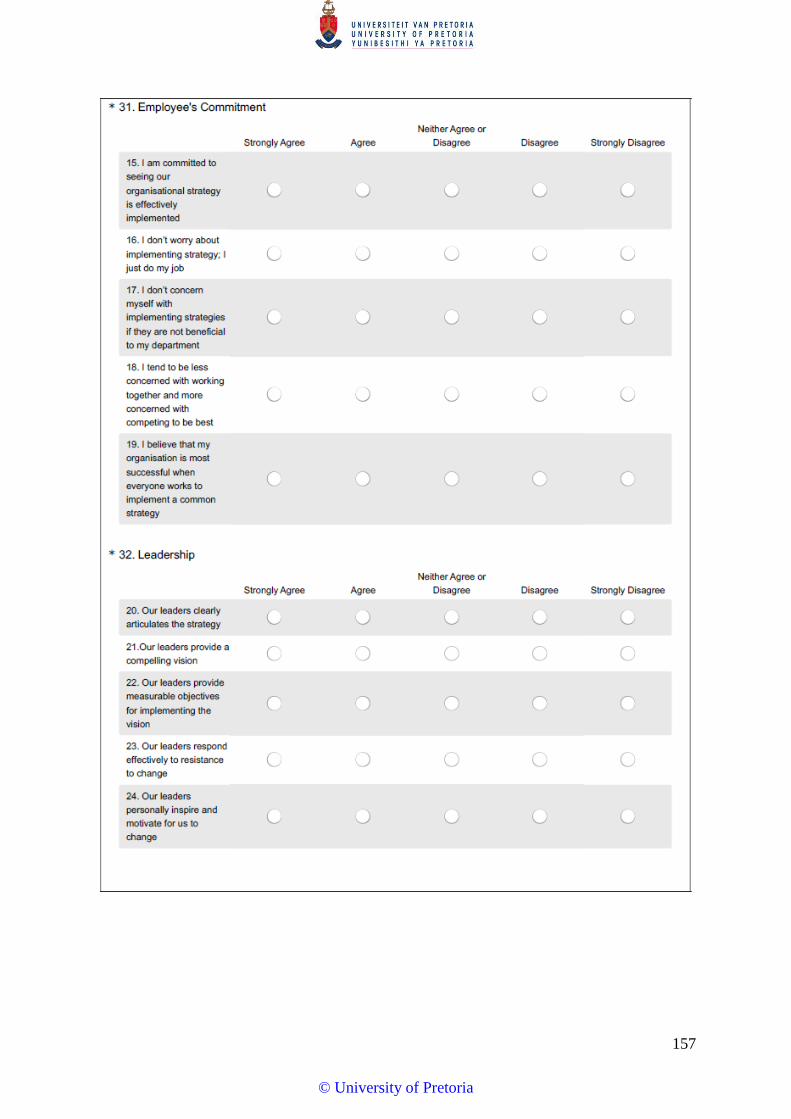
157
© University of Pretoria
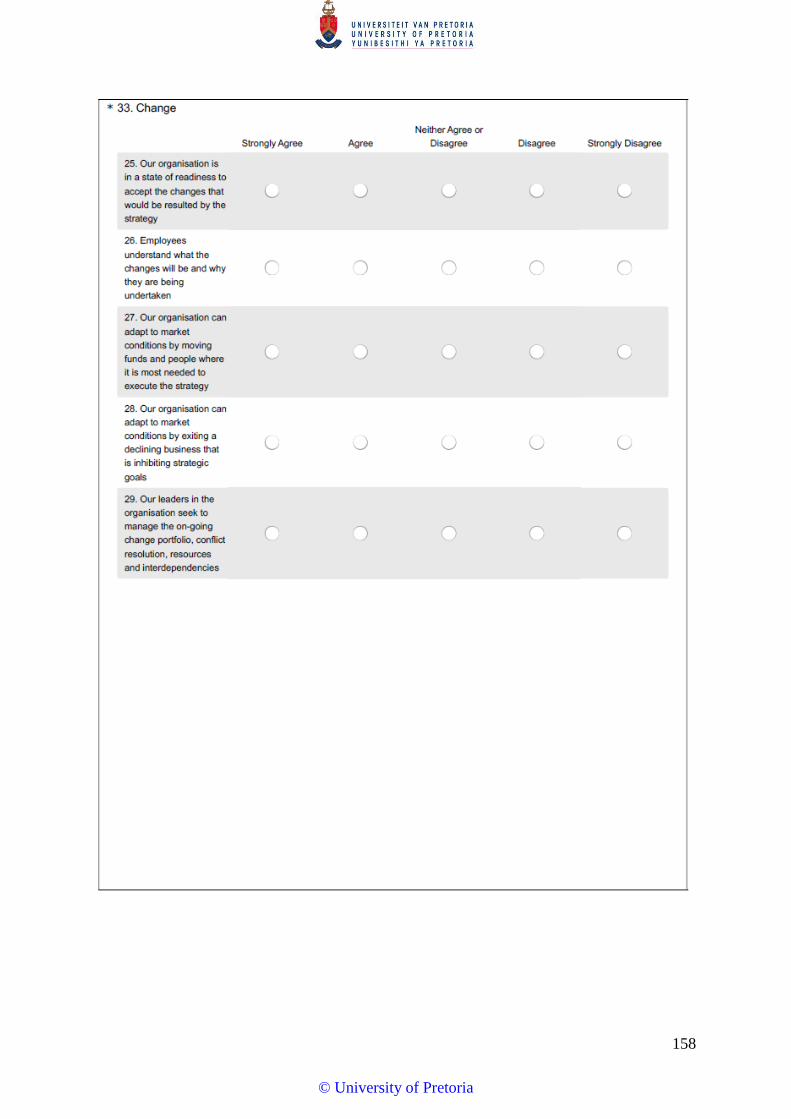
158
© University of Pretoria

159
© University of Pretoria

160
© University of Pretoria

161
11. APPENDIX C – Consent letter
© University of Pretoria
162
© University of Pretoria

163
12. APPENDIX D – Ethical clearance Dear Melissa Naidoo
Protocol Number: Temp2016-01195 Title: The effect of organisational culture on strategy
execution
Please be advised that your application for Ethical Clearance has been APPROVED. You
are therefore allowed to continue collecting your data.
We wish you everything of the best for the rest of the project.
Kind Regards,
Adele Bekker
© University of Pretoria
164
13. APPENDIX D – Originality report
© University of Pretoria

165
© University of Pretoria

166
© University of Pretoria

167
© University of Pretoria
168
© University of Pretoria
169
© University of Pretoria