Embed Size (px)
Citation preview

SIMPLIFIED DYNAMIC BARGE COLLISION ANALYSIS FOR BRIDGE PIER DESIGN
By
MICHAEL THOMAS DAVIDSON
A THESIS PRESENTED TO THE GRADUATE SCHOOL OF THE UNIVERSITY OF FLORIDA IN PARTIAL FULFILLMENT
OF THE REQUIREMENTS FOR THE DEGREE OF MASTER OF SCIENCE
UNIVERSITY OF FLORIDA
2007
1

© 2007 Michael Thomas Davidson
2

To my wife, Kiristen
3

ACKNOWLEDGMENTS
This material is based on work supported under a National Science Foundation Graduate
Research Fellowship. However, this thesis would not have been completed without the support
of several individuals. First, the insight and guidance of Dr. Gary Consolazio has proven
invaluable. His willingness to invest time in helping graduate students become effective analysts
and independent researchers will undoubtedly garner countless and vast returns. The author also
wishes to thank Dr. Marc Hoit, Dr. Petros Christou, and Dr. Jae Chung for their assistance with
extending the capabilities of FB-MultiPier. A graduate student deserving of many thanks and
much future success is David Cowan, whose brilliance seems to be limitless. Finally, the author
wishes to thank his wife Kiristen, his family, and his friends for their enduring love and
fellowship.
4
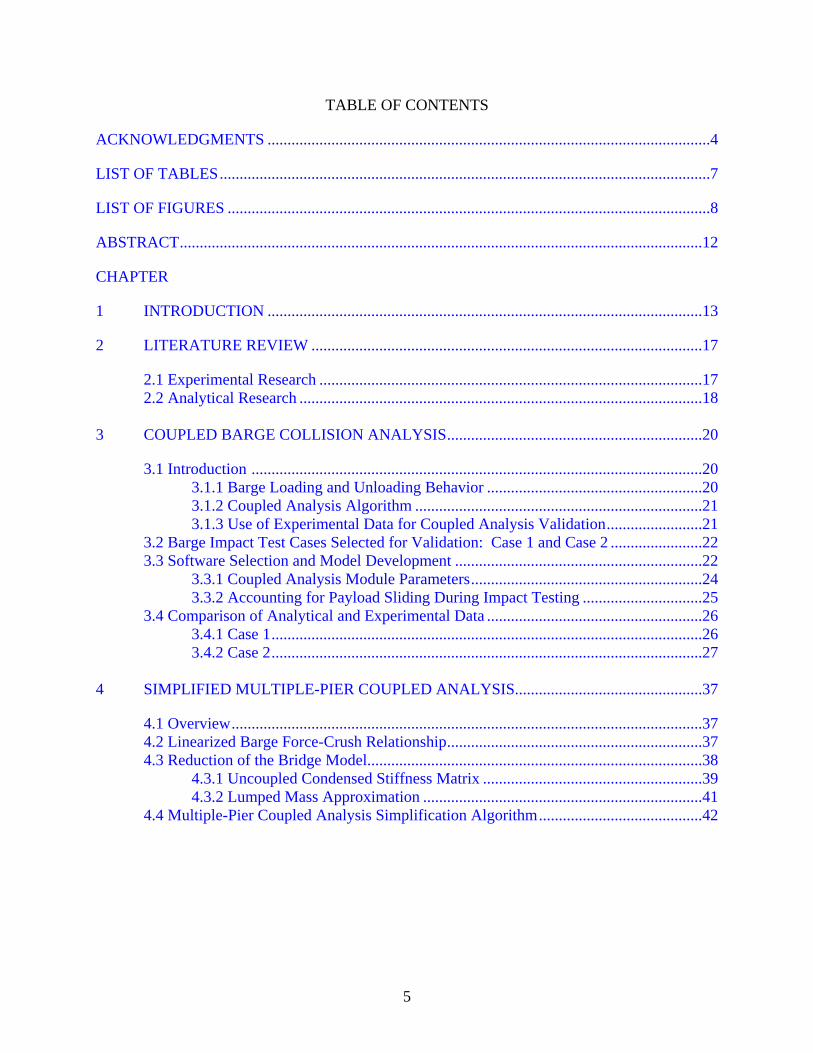
TABLE OF CONTENTS
ACKNOWLEDGMENTS ...............................................................................................................4
LIST OF TABLES...........................................................................................................................7
LIST OF FIGURES .........................................................................................................................8
ABSTRACT...................................................................................................................................12
CHAPTER
1 INTRODUCTION .............................................................................................................13
2 LITERATURE REVIEW ..................................................................................................17
2.1 Experimental Research ................................................................................................172.2 Analytical Research .....................................................................................................18
3 COUPLED BARGE COLLISION ANALYSIS................................................................20
3.1 Introduction .................................................................................................................203.1.1 Barge Loading and Unloading Behavior 20......................................................3.1.2 Coupled Analysis Algorithm 21........................................................................3.1.3 Use of Experimental Data for Coupled Analysis Validation 21........................
3.2 Barge Impact Test Cases Selected for Validation: Case 1 and Case 2 .......................223.3 Software Selection and Model Development ..............................................................22
3.3.1 Coupled Analysis Module Parameters..........................................................243.3.2 Accounting for Payload Sliding During Impact Testing 25..............................
3.4 Comparison of Analytical and Experimental Data ......................................................263.4.1 Case 1............................................................................................................263.4.2 Case 2 27............................................................................................................
4 SIMPLIFIED MULTIPLE-PIER COUPLED ANALYSIS...............................................37
4.1 Overview......................................................................................................................374.2 Linearized Barge Force-Crush Relationship................................................................374.3 Reduction of the Bridge Model....................................................................................38
4.3.1 Uncoupled Condensed Stiffness Matrix 39.......................................................4.3.2 Lumped Mass Approximation 41......................................................................
4.4 Multiple-Pier Coupled Analysis Simplification Algorithm.........................................42
5

5 SIMPLIFIED-COUPLED ANALYSIS DEMONSTRATION CASES ............................47
5.1 Introduction..................................................................................................................475.2 Geographical Information, Structural Configuration, and Impact Conditions ............48
5.2.1 Case 3 48............................................................................................................5.2.2 Case 4 49............................................................................................................5.2.3 Case 5 50............................................................................................................
5.3 Comparison of Simplified and Full-Resolution Results ..............................................515.4 Conclusions from Simplified-Coupled Analysis Demonstrations...............................525.5 Dynamic Amplification of the Impacted Pier Column Internal Forces.......................53
6 CONCLUSIONS AND RECOMMENDATIONS FOR FUTURE RESEARCH ............62
6.1 Conclusions..................................................................................................................626.2 Recommendations for Future Research .......................................................................63
APPENDIX
A SUPPLEMENTARY COUPLED ANALYSIS VALIDATION DATA ...........................64
B CONDENSED UNCOUPLED STIFFNESS MATRIX CALCULATIONS ....................72
C SIMPLIFIED-COUPLED ANALYSIS CASE OUTPUT.................................................76
D ENERGY EQUIVALENT AASHTO IMPACT CALCULATIONS................................95
REFERENCES ............................................................................................................................100
BIOGRAPHICAL SKETCH .......................................................................................................102
6

LIST OF TABLES
Table page 1-1 Case descriptions: use, configuration, and impact data ....................................................16
7
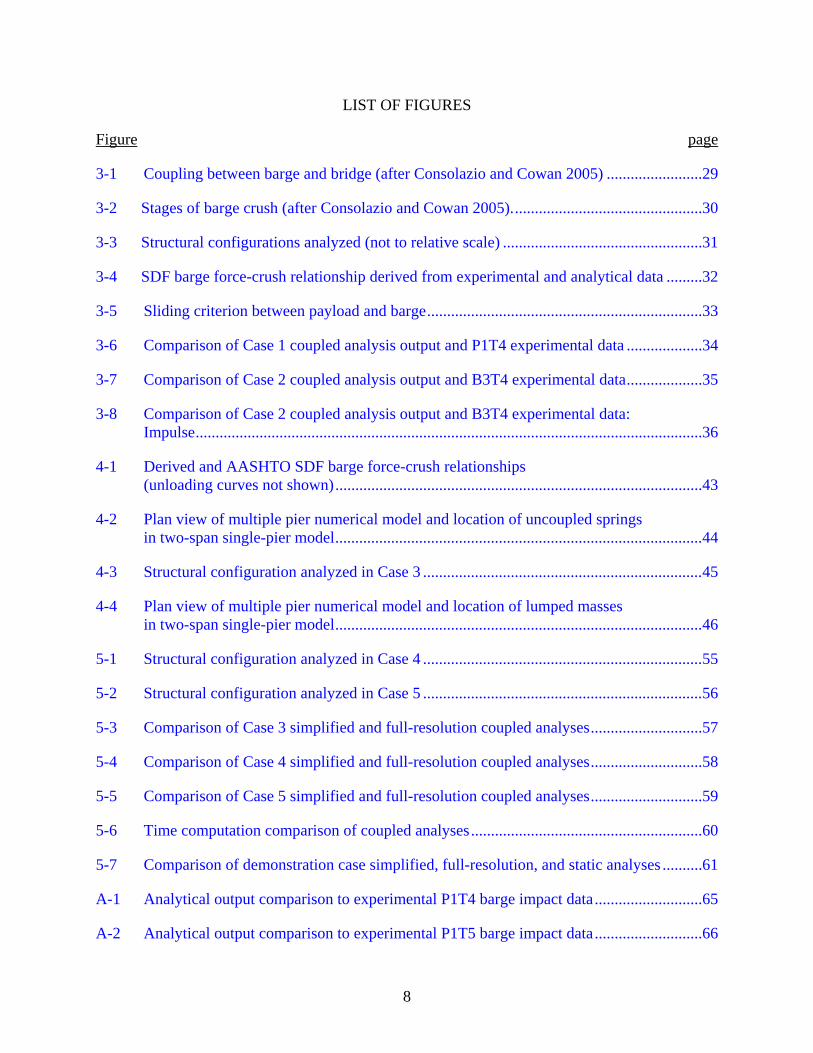
LIST OF FIGURES
Figure page
3-1 Coupling between barge and bridge (after Consolazio and Cowan 2005) ........................29
3-2 Stages of barge crush (after Consolazio and Cowan 2005)................................................30
3-3 Structural configurations analyzed (not to relative scale) ..................................................31
3-4 SDF barge force-crush relationship derived from experimental and analytical data .........32
3-5 Sliding criterion between payload and barge.....................................................................33
3-6 Comparison of Case 1 coupled analysis output and P1T4 experimental data ...................34
3-7 Comparison of Case 2 coupled analysis output and B3T4 experimental data...................35
3-8 Comparison of Case 2 coupled analysis output and B3T4 experimental data: Impulse...............................................................................................................................36
4-1 Derived and AASHTO SDF barge force-crush relationships (unloading curves not shown)............................................................................................43
4-2 Plan view of multiple pier numerical model and location of uncoupled springs in two-span single-pier model............................................................................................44
4-3 Structural configuration analyzed in Case 3 ......................................................................45
4-4 Plan view of multiple pier numerical model and location of lumped masses in two-span single-pier model............................................................................................46
5-1 Structural configuration analyzed in Case 4 ......................................................................55
5-2 Structural configuration analyzed in Case 5 ......................................................................56
5-3 Comparison of Case 3 simplified and full-resolution coupled analyses............................57
5-4 Comparison of Case 4 simplified and full-resolution coupled analyses............................58
5-5 Comparison of Case 5 simplified and full-resolution coupled analyses............................59
5-6 Time computation comparison of coupled analyses..........................................................60
5-7 Comparison of demonstration case simplified, full-resolution, and static analyses ..........61
A-1 Analytical output comparison to experimental P1T4 barge impact data...........................65
A-2 Analytical output comparison to experimental P1T5 barge impact data...........................66
8
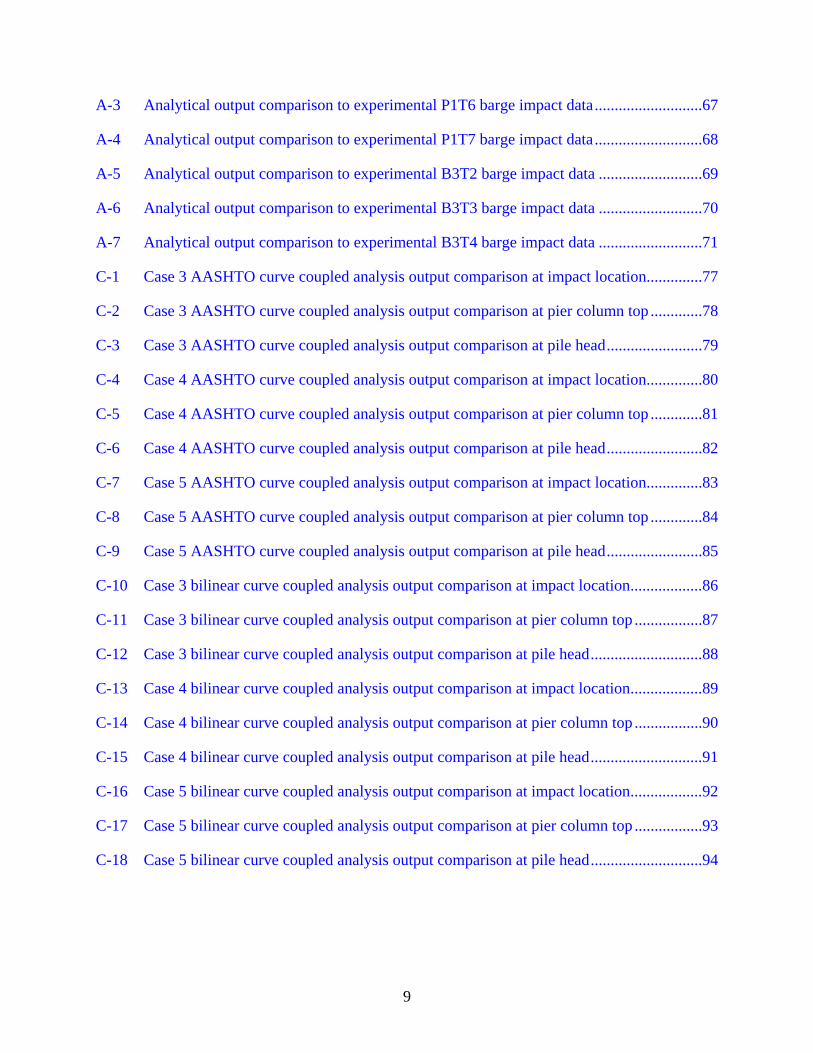
A-3 Analytical output comparison to experimental P1T6 barge impact data...........................67
A-4 Analytical output comparison to experimental P1T7 barge impact data...........................68
A-5 Analytical output comparison to experimental B3T2 barge impact data ..........................69
A-6 Analytical output comparison to experimental B3T3 barge impact data ..........................70
A-7 Analytical output comparison to experimental B3T4 barge impact data ..........................71
C-1 Case 3 AASHTO curve coupled analysis output comparison at impact location..............77
C-2 Case 3 AASHTO curve coupled analysis output comparison at pier column top .............78
C-3 Case 3 AASHTO curve coupled analysis output comparison at pile head........................79
C-4 Case 4 AASHTO curve coupled analysis output comparison at impact location..............80
C-5 Case 4 AASHTO curve coupled analysis output comparison at pier column top .............81
C-6 Case 4 AASHTO curve coupled analysis output comparison at pile head........................82
C-7 Case 5 AASHTO curve coupled analysis output comparison at impact location..............83
C-8 Case 5 AASHTO curve coupled analysis output comparison at pier column top .............84
C-9 Case 5 AASHTO curve coupled analysis output comparison at pile head........................85
C-10 Case 3 bilinear curve coupled analysis output comparison at impact location..................86
C-11 Case 3 bilinear curve coupled analysis output comparison at pier column top .................87
C-12 Case 3 bilinear curve coupled analysis output comparison at pile head............................88
C-13 Case 4 bilinear curve coupled analysis output comparison at impact location..................89
C-14 Case 4 bilinear curve coupled analysis output comparison at pier column top .................90
C-15 Case 4 bilinear curve coupled analysis output comparison at pile head............................91
C-16 Case 5 bilinear curve coupled analysis output comparison at impact location..................92
C-17 Case 5 bilinear curve coupled analysis output comparison at pier column top .................93
C-18 Case 5 bilinear curve coupled analysis output comparison at pile head............................94
9

LIST OF ABBREVIATIONS
L or L appended to symbol, indicates symbol exclusivity to left-flanking structure
R or R appended to symbol, indicates symbol exclusivity to right-flanking structure
[ ]F flexibility matrix
[ condensedK ] condensed stiffness matrix
couplingK off-diagonal (coupling) stiffness term
ΔK translational stiffness term
θK plan-view rotational stiffness term
unitM unit moment
Hm mass of half-span of superstructure
bm mass of barge
pm mass of payload
0u initial sliding velocity of payload
unitV unit shear force
couplingVθ shear due to coupled stiffness and plan-view rotation
ΔV shear due to translational stiffness and translation
pW weight of payload
Δ translation
MΔ translation due to unit moment
VΔ translation due to unit shear
μ static coefficient of friction between payload and barge
10

θ plan-view rotation
Mθ plan-view rotation due to unit moment
Vθ plan-view rotation due to unit shear
11

Abstract of Thesis Presented to the Graduate School of the University of Florida in Partial Fulfillment of the
Requirements for the Degree of Master of Science
SIMPLIFIED DYNAMIC BARGE COLLISION ANALYSIS FOR BRIDGE PIER DESIGN
By
Michael Thomas Davidson
August 2007
Chair: Gary R. Consolazio Cochair: Marc I. Hoit Major: Civil Engineering
The American Association of State and Highway Transportation Officials barge impact
provisions, pertaining to bridges spanning navigable waterways, utilize a static force approach to
determine structural demand on bridge piers. However, conclusions drawn from experimental
full-scale dynamic barge impact tests highlight the necessity of quantifying bridge pier demand
with consideration of additional forces generated from dynamic effects. Static quantification of
bridge pier demand due to barge impact ignores mass related inertial forces generated by the
superstructure which can amplify restraint of underlying pier columns.
An algorithm for efficiently performing coupled nonlinear dynamic barge impact analysis
on simplified bridge structure-soil finite element models is presented in this thesis. The term
“coupled” indicates the impact of a finite element bridge model and a respective single
degree-of-freedom barge model traveling at a specified initial velocity with a specified
force-deformation relationship. Coupled analysis is validated using experimental data. Also,
results from simplified and full-resolution analyses are compared for several cases to illustrate
robustness of the algorithm for various barge impact energies and pier types. Simplified coupled
dynamic analysis is shown to accurately capture dynamic forces and amplification effects.
12

CHAPTER 1 INTRODUCTION
Potential loss of life and detrimental economic consequences due to bridge failure from
waterway vessel collision have been realized numerous times throughout modern history.
Catastrophic bridge failure events due to vessel collision, which occur approximately once a year
worldwide (Larsen 1993), led to the development of bridge design specifications for vessel
collision. The American Association of State and Highway Transportation Officials (AASHTO)
Guide Specification and Commentary for Vessel Collision Design of Highway Bridges is used
along with characteristics of a given waterway and the accompanying waterway traffic to
determine static design loads, which are applied to respective piers for impact design purposes
(AASHTO 1991). Even though the AASHTO specifications are used for bridge pier design due
to ship and barge collision, limited barge impact data was available for use in their development.
In April 2004, Consolazio et al. (2006) conducted full-scale experimental barge impact
testing on bridge piers of the Old St. George Island Causeway Bridge located in Apalachicola,
Florida. Key findings from the experiments that are pertinent to the research presented in this
thesis include:
• Inertial forces due to acceleration of bridge component masses can contribute significantly to overall pier response during a collision event;
• Significant portions of the impact load can transfer (or “shed”) into the superstructure; and,
• Superstructure resistance is comprised of displacement-dependent and mass-dependent (inertial) forces. Inertial forces can produce a momentary increase in pier restraint during initial impact stages, and amplify structural demand on pier columns.
Restraint of a bridge pier due to acceleration of the mass of the overlying superstructure, and the
corresponding amplification of forces developed in the pier columns during initial stages of
barge collision events, are not addressed in current static design procedures. In contrast,
dynamic time-history analysis of bridges inherently accounts for such amplification effects.
13
However, due to the unique characteristics of each bridge, impact load time-histories vary from
bridge to bridge. Coupled dynamic analysis addresses this issue by employing a single
degree-of-freedom (SDF) barge mass, impact velocity, and vessel force-crush relationship to
simulate barge impact at a specified bridge pier location. This method enables efficient
time-history analysis that yields time-varying barge collision load and bridge response data
specific to each bridge structure. To validate the procedure, coupled analysis is performed and
compared with experimental data for single-pier and multiple-pier cases. A summary of all
analysis cases presented in this thesis is given in Table 1-1.
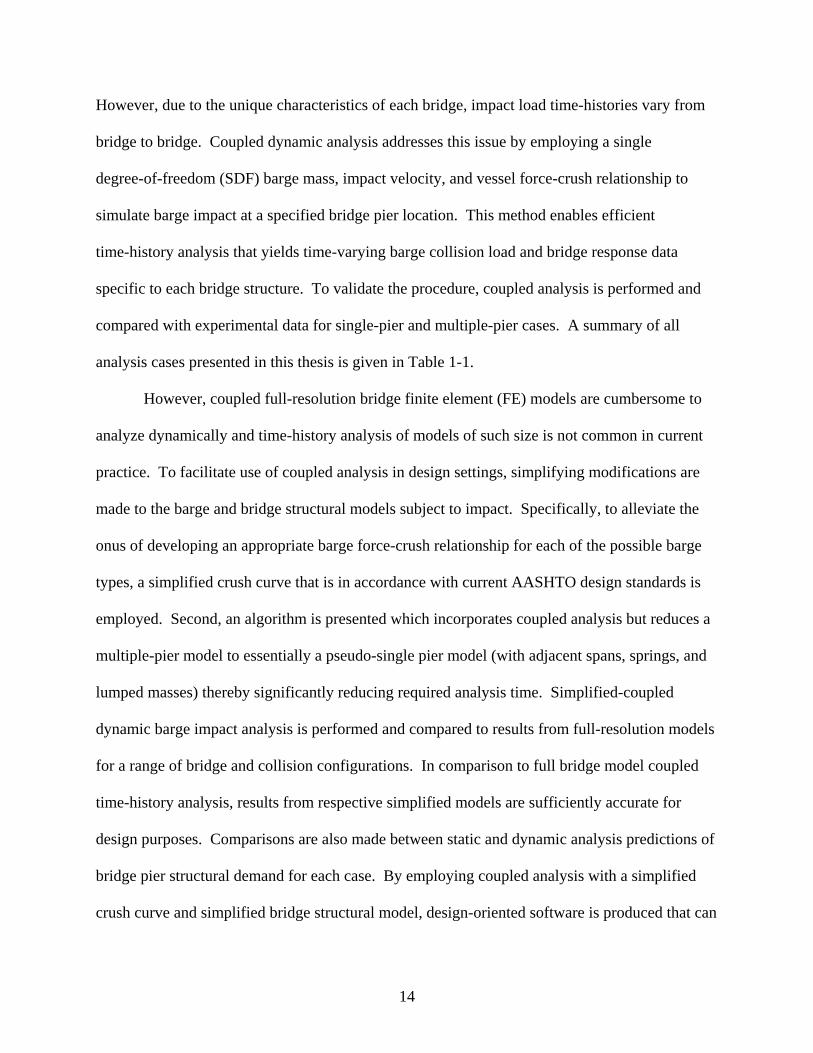
However, coupled full-resolution bridge finite element (FE) models are cumbersome to
analyze dynamically and time-history analysis of models of such size is not common in current
practice. To facilitate use of coupled analysis in design settings, simplifying modifications are
made to the barge and bridge structural models subject to impact. Specifically, to alleviate the
onus of developing an appropriate barge force-crush relationship for each of the possible barge
types, a simplified crush curve that is in accordance with current AASHTO design standards is
employed. Second, an algorithm is presented which incorporates coupled analysis but reduces a
multiple-pier model to essentially a pseudo-single pier model (with adjacent spans, springs, and
lumped masses) thereby significantly reducing required analysis time. Simplified-coupled
dynamic barge impact analysis is performed and compared to results from full-resolution models
for a range of bridge and collision configurations. In comparison to full bridge model coupled
time-history analysis, results from respective simplified models are sufficiently accurate for
design purposes. Comparisons are also made between static and dynamic analysis predictions of
bridge pier structural demand for each case. By employing coupled analysis with a simplified
crush curve and simplified bridge structural model, design-oriented software is produced that can
14

efficiently quantify collision induced bridge pier demand, including capture of dynamic
amplification effects.
15
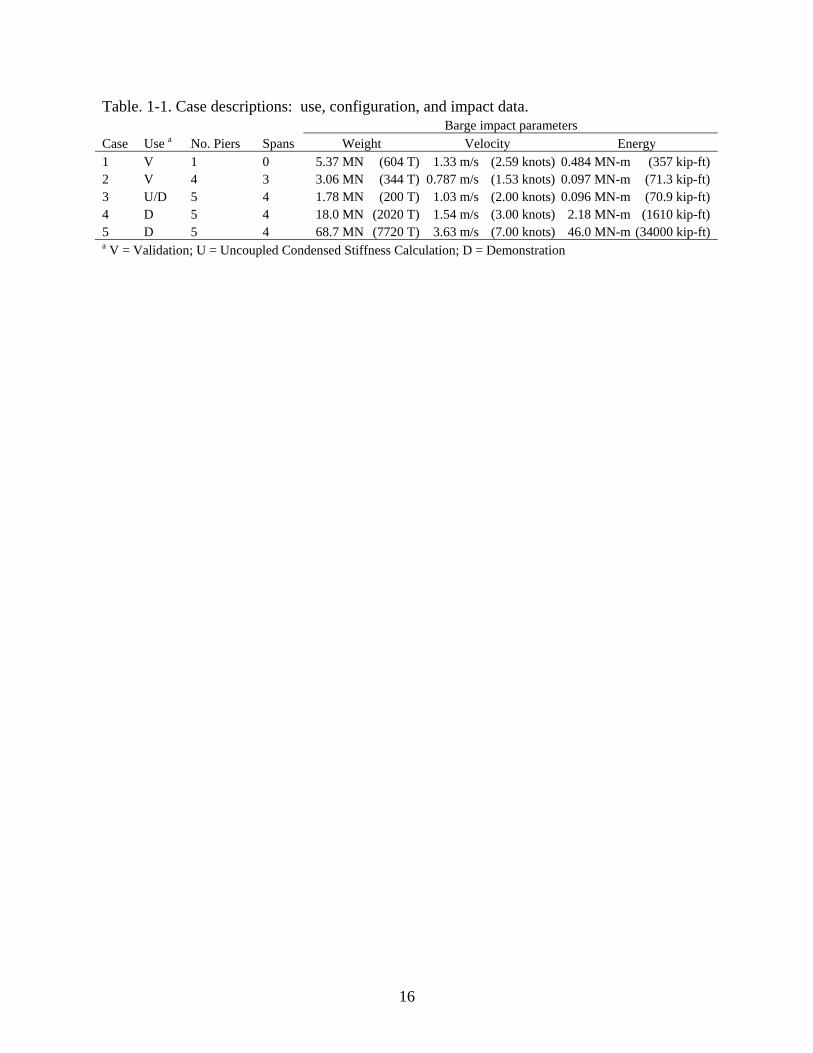
Table. 1-1. Case descriptions: use, configuration, and impact data.
Barge impact parameters Case Use a No. Piers Spans Weight Velocity Energy 1 V 1 0 5.37 MN (604 T) 1.33 m/s (2.59 knots) 0.484 MN-m (357 kip-ft) 2 V 4 3 3.06 MN (344 T) 0.787 m/s (1.53 knots) 0.097 MN-m (71.3 kip-ft) 3 U/D 5 4 1.78 MN (200 T) 1.03 m/s (2.00 knots) 0.096 MN-m (70.9 kip-ft) 4 D 5 4 18.0 MN (2020 T) 1.54 m/s (3.00 knots) 2.18 MN-m (1610 kip-ft) 5 D 5 4 68.7 MN (7720 T) 3.63 m/s (7.00 knots) 46.0 MN-m (34000 kip-ft) a V = Validation; U = Uncoupled Condensed Stiffness Calculation; D = Demonstration
16
CHAPTER 2 LITERATURE REVIEW
2.1 Experimental Research
In 1983, Meier-Dörnberg conducted reduced scale impact tests on barge bows using a
pendulum impact hammer. Static crush tests were also performed on reduced scale barge bows.
Results from this study were used to develop relationships between kinetic energy, barge bow
crush depth, and static impact force. These relationships comprise a major portion of the
collision-force calculation procedure adopted in the AASHTO specifications (1991). However,
this research did not address phenomena such as bridge superstructure effects and dynamic
amplification, nor did the tests involve pier or bridge response.
During this same time and afterward, full-scale experimental barge collision tests were
conducted in connection with the U.S. Army Corps of Engineers (USACE). In 1989, lock gate
impact tests were performed with a nine-barge flotilla traveling at low velocities at Lock and
Dam 26 near Alton, Illinois (Goble et al. 1990). In 1997, four-barge flotilla impact tests were
conducted on concrete lock walls at Old Lock and Dam 2, near Pittsburgh, Pennsylvania (Patev
et al. 2003). Additional lock wall tests were conducted with a fifteen-barge flotilla in 1998 at the
Robert C. Byrd Lock and Dam in West Virginia (Arroyo et al. 2003). All of these tests were
performed on lock walls and lock gates, which produce fundamentally different structural
responses to collision loading in comparison to that of bridge piers.
The impact testing (Consolazio et al. 2006) of the old St. George Island Bridge,
constructed in the 1960s, constitutes the only experimental research that explicitly measured
barge impact forces on bridge piers using full-scale tests. The experiments were divided into
three series of impact tests using a single barge and various pier/bridge structural configurations.
The first series (termed the P1 series) consisted of eight impacts on a single, stiff channel pier
17
(termed Pier 1-S) by a loaded barge with an impact weight of 5.37 MN (604 T) and impact
velocities approaching 1.8 m/s (3.5 knots). The second series of tests (termed the B3 series)
consisted of four impacts on a multi-span, multi-pier partial bridge structure by an empty barge
with an impact weight of 3.06 MN (344 T) and impact velocities approaching 0.78 m/s
(1.5 knots). The third series (termed the P3 series) consisted of three impacts on a single,
flexible pier (termed Pier 3-S) by an empty barge with an impact weight of 3.06 MN (344 T) and
impact velocities approaching 0.95 m/s (1.8 knots). These tests form an important dataset for
validating barge collision analysis methods.
2.2 Analytical Research
Development and analysis of very high-resolution contact-impact FE models (those with
tens to hundreds of thousands of elements) that simulate nonlinear dynamic barge impact on
bridge piers have been feasible as a research tool for approximately a decade. In preparation for
the full-scale St. George Island experimental barge impact testing, high-resolution FE pier
models were developed to determine appropriate experimental conditions with respect to barge
impact velocity and safety (Consolazio et al. 2002). Reanalysis of the models using
experimental data complimented the research findings from the experimental program
(Consolazio et al. 2006).
High-resolution FE models of single-barges and multi-barge flotillas were analyzed when
pier columns of various shape and dimension were subject to a variety of barge impact
simulations (Yuan 2005). These analytical results were used to develop a set of empirical
formulas for barge impact force quantification as an improvement to the current static design
procedures. Also, high-resolution FE single-barge models were developed and subjected to
quasi-static loading by various stiff impactors in an effort to better quantify barge force-crush
relationships (Consolazio and Cowan 2003).
18

As an alternative to very high resolution contact-impact FE analysis, coupled barge-pier
analysis was developed (Consolazio et al. 2004a, Consolazio et al. 2004b). Coupled analysis
simulates a SDF barge model (with specified mass, velocity, and force-crush relationship)
colliding with a multiple degree-of-freedom (MDF) bridge-pier-soil model. The coupled
analysis required the use of a barge force-crush relationship, which was developed for a common
barge type using high-resolution FE models. The force-crush curves encompass loading and
unloading behavior derived from quasi-static cyclic loading (Consolazio and Cowan 2005).
19
CHAPTER 3 COUPLED BARGE COLLISION ANALYSIS
3.1 Introduction
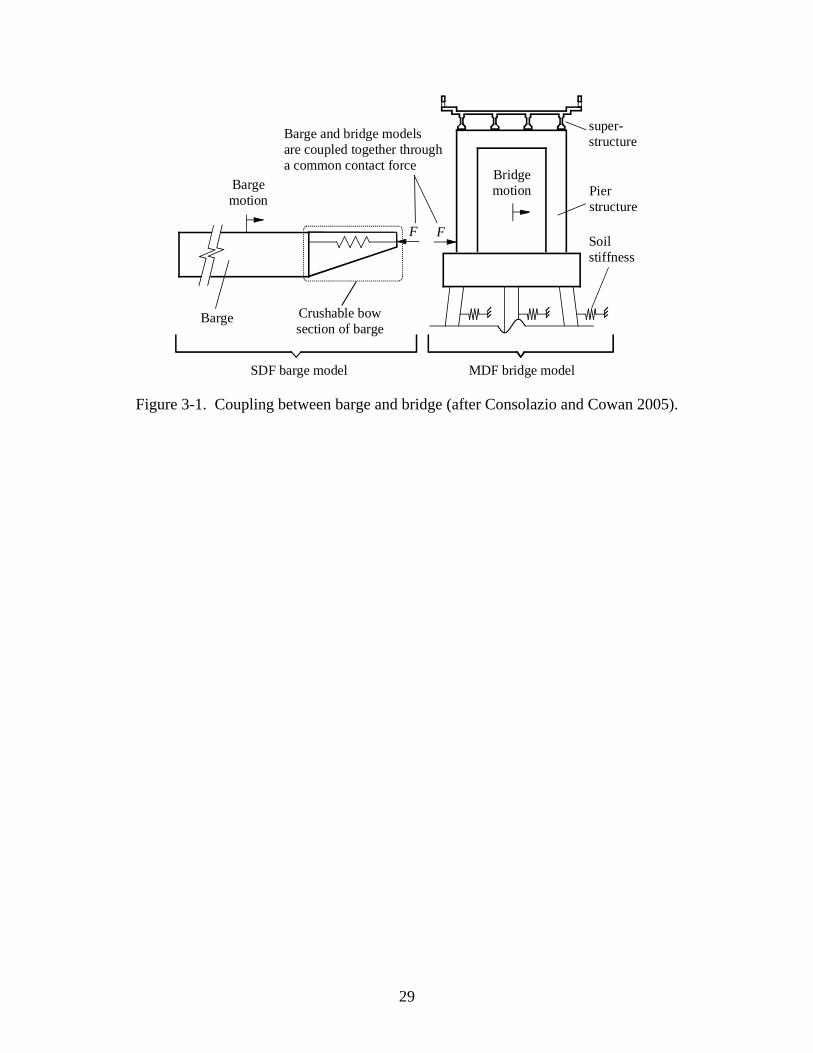
Within the context of coupled analysis, the term “coupled” refers to the use of a shared
contact force between the barge and impacted bridge structure (Fig. 3-1). The impacting barge is
assigned a mass, initial velocity, and bow force-crush relationship. Traveling at the prescribed
initial velocity, the barge impacts a specified location on the bridge structure and generates a
time-varying impact force in accordance with the force-crush relationship of the barge and the
relative displacements of the barge and bridge model at the impact location. The barge is
represented by a SDF model, and the pier structural configurations and soil parameters of the
impacted bridge structure constitute a MDF model. The MDF pier-soil model, subject to the
shared time-varying impact force, displaces, develops internal forces, and interacts with the SDF
barge model through the shared impact force during the analysis. Hence, coupled analysis
automatically generates the barge impact load time-history specific to each bridge structural
configuration and impacting barge type. This overcomes the challenge of pre-quantifying the
time-varying barge impact load as a necessary component of time-history analysis.
3.1.1 Barge Loading and Unloading Behavior
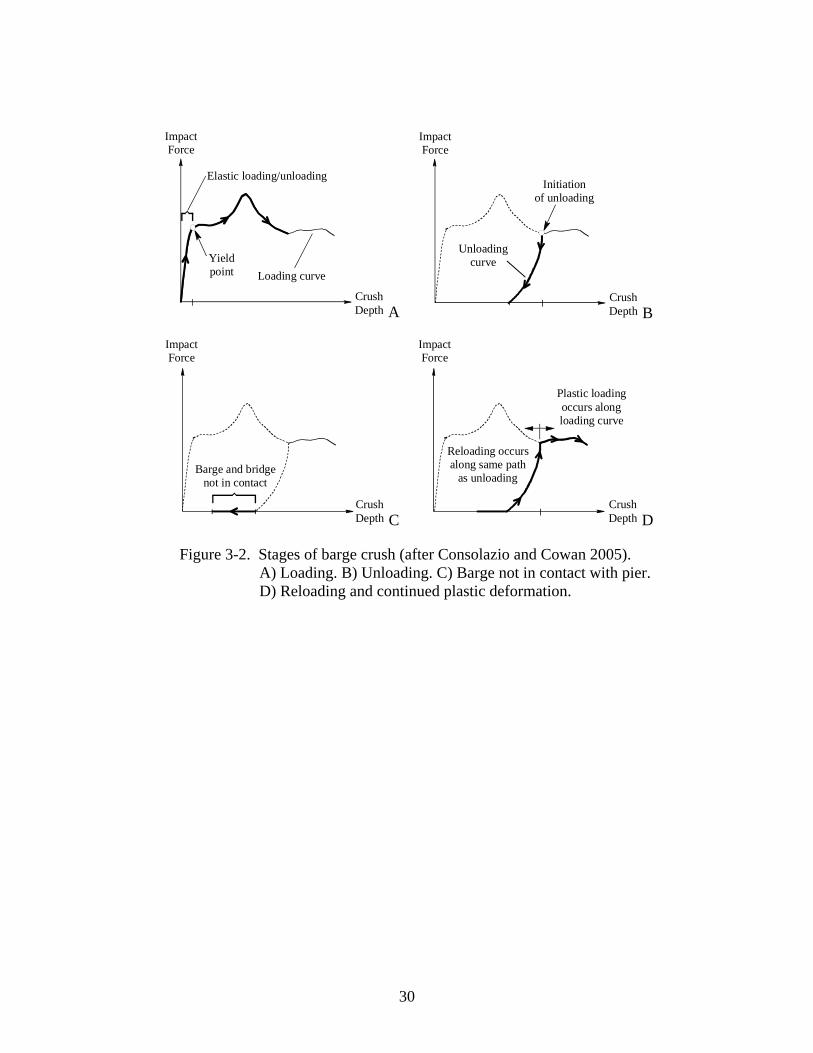
Barge behavior is represented by a force-crush relationship, consisting of a loading curve,
unloading curves, and a specified yield point (Fig. 3-2). The yield point represents the crush
depth beyond which plastic deformations occur. Any subsequent unloading beyond this point is
determined according to the specified unloading curves. Until the crush depth corresponding to
yield is reached, loading and unloading occurs elastically along the specified curve (Fig. 3-2A).
A series of unloading curves represent the unloading behavior at various attained maximum
crush depths (Fig. 3-2B). After unloading, if the barge is no longer in contact with the pier, no
20

impact force is generated (Fig. 3-2C). Alternatively, if reloading occurs (Fig. 3-2D), it is
assumed to occur along the previously traveled unloading curve. Plastic deformation subsequent
to complete reloading occurs along the originally specified loading curve (Fig. 3-2D).
Additional details of this model are given in Consolazio and Cowan (2005).
3.1.2 Coupled Analysis Algorithm
Algorithmically, the coupled analysis procedure involves a SDF barge code interacting
with a separate nonlinear dynamic pier-soil analysis code at a specified node of the MDF
pier-soil model. Specifically, coupled analysis utilizes an explicit time-step barge impact force
determination procedure and links the output, the resulting impact force, with a respective
numerical MDF pier-soil model analysis code (Hendrix 2003). The pier-soil analysis code then
responds to the impact force by generating iterative displacements and forces throughout the
MDF model.
3.1.3 Use of Experimental Data for Coupled Analysis Validation
Coupled analysis was previously developed and demonstrated as a proof-of-concept
using analytical data (Consolazio and Cowan 2005). Output from very high-resolution FE
models consisting of a MDF impacting barge and a MDF impacted pier were compared to output
obtained from coupled analysis of a SDF barge and MDF pier model. At present, experimental
data is now available for validation of the coupled analysis procedure. Using data from the
full-scale barge impact experiments (Consolazio et al. 2006), validation of the coupled analysis
procedure is carried out in four stages: select appropriate pier structures from the experimental
dataset; develop respective models in a nonlinear dynamic finite element analysis (NDFEA) code
capable of conducting coupled analysis; analyze the models using respective barge impact
conditions and coupled analysis; and, compare time-history results from the coupled analysis to
those obtained experimentally.
21

3.2 Barge Impact Test Cases Selected for Validation: Case 1 and Case 2
Data was collected more extensively from Pier 1-S than from any other pier in the 2004
full-scale experimental test set (Consolazio et al. 2006). Furthermore, a single pier is
representative of the type of structure often used in static design procedures for barge collision
analysis (Knott and Prucz 2000). Hence, a single pier (Pier 1-S) was selected for coupled
analysis validation using experimental data (Fig. 3-3A). Of the eight experimental tests
conducted on Pier 1-S, the fourth test (termed P1T4) consisted of a head-on impact at an
undamaged portion of the barge bow, as would be assumed in bridge design. Test P1T4, with
velocity and impact weight as specified in Table 1-1, was selected for Case 1.
In addition to validating the coupled analysis procedure for a single-pier, data from the
partial bridge (B3 series) tests were employed for validation purposes. Regarding impact
conditions used for validation, the fourth test (termed B3T4) generated the largest pier response
among the B3 test series. Hence, test B3T4, with velocity and impact weight as specified in
Table 1-1, was selected for Case 2 (Fig. 3-3B).
3.3 Software Selection and Model Development
Coupled analysis was previously implemented in the commercial pier analysis software,
FB-Pier (2003), and was shown to produce force and displacement time-histories in agreement
with those obtained from high-resolution contact-impact FE pier-soil model simulations.
Subsequent to implementation of the coupled analysis procedure in FB-Pier, an enhanced
package called FB-MultiPier (2007) was released. FB-MultiPier possesses the same analysis
capabilities as FB-Pier (including coupled analysis) but also has the ability to analyze bridge
structures containing superstructure elements. Therefore, FB-MultiPier was selected for all
model development and analysis conducted in this study.
22
FB-MultiPier employs fiber-based frame elements for piles, pier columns, and pier caps;
flat shell elements for pile caps; beam elements, based on gross section properties, for
superstructure spans; and, distributed nonlinear springs to represent soil stiffness. Transfer
beams transmit load from bearings, for which the stiffness and location are user-specified, to the
superstructure elements. FB-MultiPier permits Rayleigh damping, which was applied to all
structural elements in the models used for this study such that approximately 5% of critical
damping was achieved over the first five natural modes of vibration.
FB-MultiPier allows either linear elastic or material-nonlinear analysis of structural
elements. Linear elastic analysis was selected for all structural (non-soil) element components of
models used in this study. This approach was taken because the 2004 full-scale barge impact
experiments were non-destructive (Consolazio et al. 2006) and post-test inspection of the pier
structures subjected to collision loading indicated that the structural components had remained
largely in the elastic range.
Structural models of Case 1 and Case 2 (Fig. 3-3A and Fig. 3-3B, respectively) were
developed from original construction drawings and direct site investigation measurements. The
Case 2 structural model was limited to four piers, with springs representing the stiffness
contributions of piers beyond Pier 5-S (Fig. 3-3B), as contribution to structural response from
these piers was expectedly small (Consolazio et al. 2006). The soil model spring system for
Case 1 was developed based on boring logs and dynamic soil properties obtained from a
geotechnical investigation conducted in parallel with the 2004 full-scale barge impact testing
(McVay et al. 2005). For the development of the Case 2 soil-spring system, boring logs formed
the sole data source available.
23
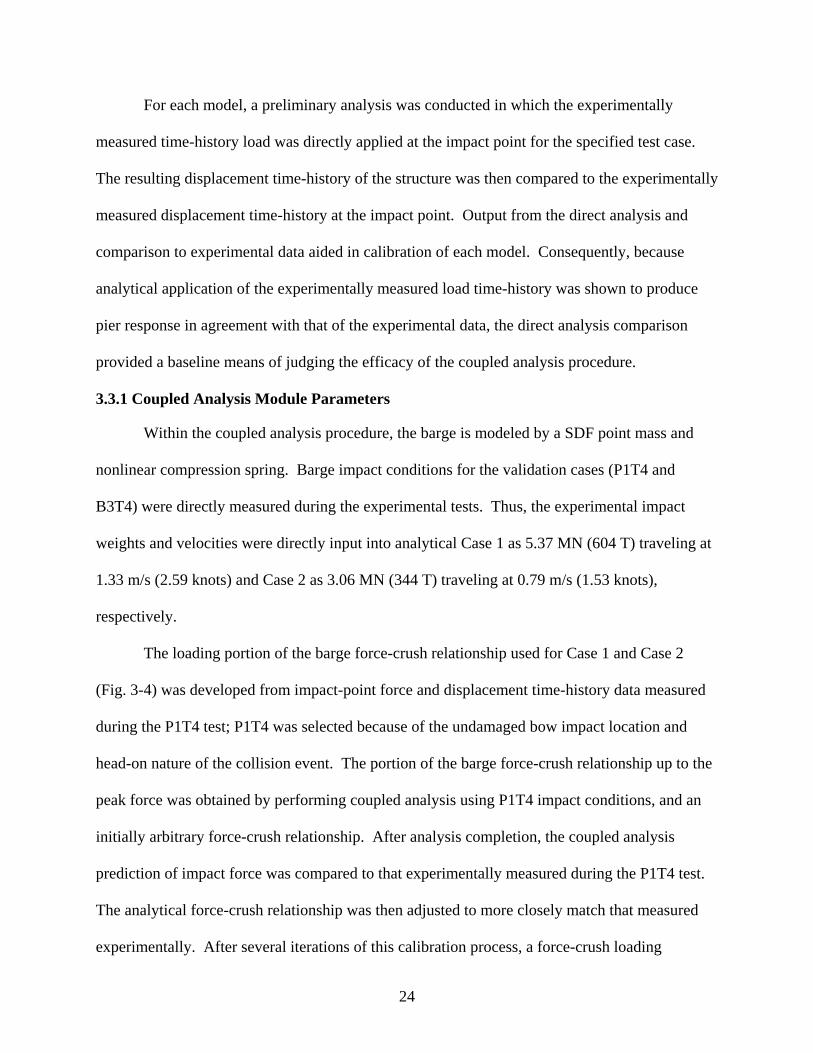
For each model, a preliminary analysis was conducted in which the experimentally
measured time-history load was directly applied at the impact point for the specified test case.
The resulting displacement time-history of the structure was then compared to the experimentally
measured displacement time-history at the impact point. Output from the direct analysis and
comparison to experimental data aided in calibration of each model. Consequently, because
analytical application of the experimentally measured load time-history was shown to produce
pier response in agreement with that of the experimental data, the direct analysis comparison
provided a baseline means of judging the efficacy of the coupled analysis procedure.
3.3.1 Coupled Analysis Module Parameters
Within the coupled analysis procedure, the barge is modeled by a SDF point mass and
nonlinear compression spring. Barge impact conditions for the validation cases (P1T4 and
B3T4) were directly measured during the experimental tests. Thus, the experimental impact
weights and velocities were directly input into analytical Case 1 as 5.37 MN (604 T) traveling at
1.33 m/s (2.59 knots) and Case 2 as 3.06 MN (344 T) traveling at 0.79 m/s (1.53 knots),
respectively.
The loading portion of the barge force-crush relationship used for Case 1 and Case 2
(Fig. 3-4) was developed from impact-point force and displacement time-history data measured
during the P1T4 test; P1T4 was selected because of the undamaged bow impact location and
head-on nature of the collision event. The portion of the barge force-crush relationship up to the
peak force was obtained by performing coupled analysis using P1T4 impact conditions, and an
initially arbitrary force-crush relationship. After analysis completion, the coupled analysis
prediction of impact force was compared to that experimentally measured during the P1T4 test.
The analytical force-crush relationship was then adjusted to more closely match that measured
experimentally. After several iterations of this calibration process, a force-crush loading
24

relationship was obtained that produced force time-history data in agreement with the
experimental measurements of impact force.
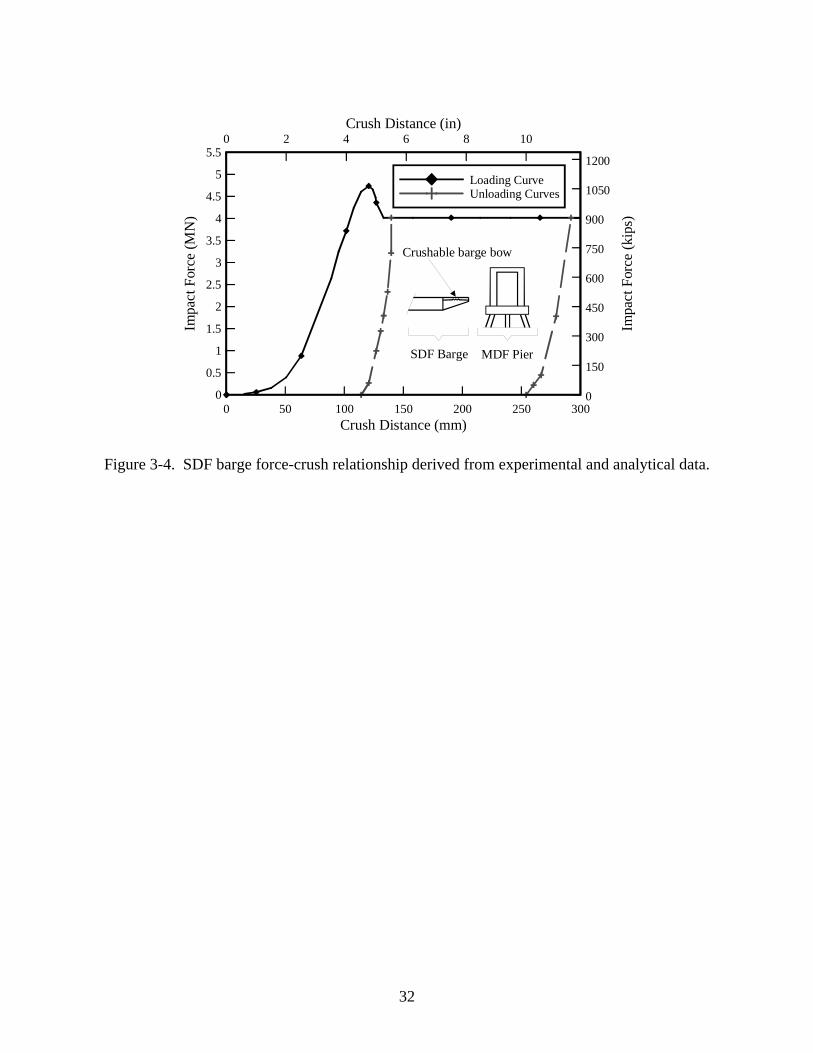
The experimentally derived loading portion of the force-crush curve (Fig. 3-4) has a peak
impact force value of 5.74 MN (1065 kips) at a crush depth of 12.07 cm (4.75 in). Explicit
derivation of forces beyond this point, pertaining to the barge-bow impact force-crush
relationship, was not possible using the experimental dataset. However, barge bow force-crush
data are available in the literature that apply to the shape of the impacted pier in the P1T4 test;
specifically, a rectangular (flat) surface impactor. This data was obtained by subjecting a
high-resolution FE barge model to quasi-static crushing by square (flat) 1.8 m (6 ft) and 2.4 m
(8 ft) impactors (Consolazio and Cowan 2003). In the present study, barge force-crush
parameters pertaining to crush depths beyond that corresponding to the peak force were
proportioned from high-resolution FE force-crush data. Specifically, these parameters are: the
yield point, structural softening beyond the peak force, and the force plateau level beyond
softening (Fig. 3-4). The unloading curves (Fig. 3-4) chosen for Case 1 and Case 2 exhibit
steeper unloading paths at smaller crush-depths and shallower unloading paths at larger crush
depths. The unloading curves are consistent, with respect to qualitative shape, with those
employed in a prior study for a common barge type subject to quasi-static crush by square piers
(Consolazio and Cowan 2005).
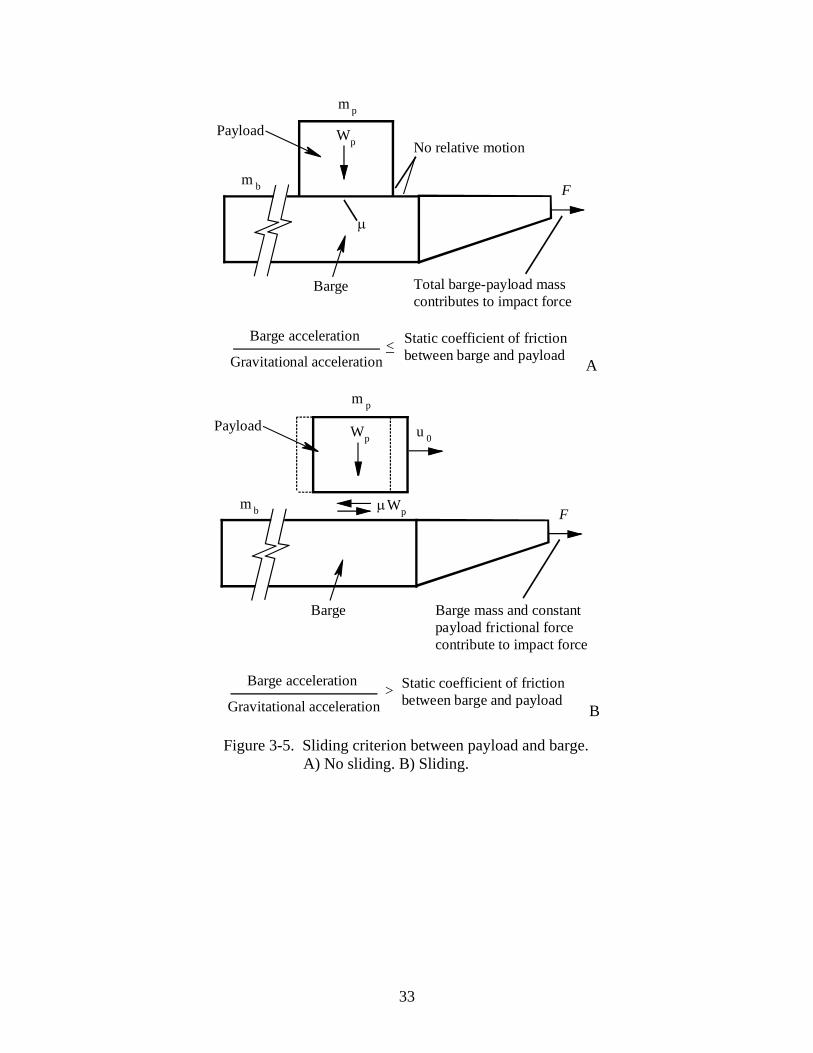
3.3.2 Accounting for Payload Sliding During Impact Testing
During the Pier 1-S test series, payload in the form of 16.76 m (55 ft) reinforced concrete
bridge superstructure span segments was placed on the barge to simulate a loaded impact
condition. However, the payload was observed to slide during the collision events, implying the
development of frictional forces and dissipation of energy (Consolazio et al. 2006). In general
bridge design, the payload would not be assumed to slide. However, for the purpose of
25
validating the coupled analysis procedure as accurately as possible, enhancements were made to
the pre-existing coupled analysis procedure to numerically account for payload sliding (Fig. 3-5).
At each time-step and iteration, the ratio of barge acceleration (which, before sliding occurs, is
equal to the payload acceleration) to gravitational acceleration was computed and compared to
the static coefficient of friction (μ ) between the barge and the payload. When the acceleration
ratio exceeded the static coefficient of friction, sliding was initiated (Fig. 3-5B). At sliding
initiation, the barge payload was assigned an initial velocity ( ) relative to the underlying
barge, equal to the corresponding current velocity of the barge-payload system. The payload was
assumed to continue sliding until the initial payload kinetic energy was completely dissipated
through friction. At all points in time during which sliding occurred, a constant frictional force,
equal to the product of the static coefficient of friction and the weight of the payload ( ), was
applied to the barge. When the sliding kinetic energy of the payload barge was dissipated, the
payload mass ( ) and barge mass ( ) were assumed to rejoin as a single loaded
barge-payload system, as before sliding (Fig.
0u
pW
pm bm
3-5A). For the P1T4 test, a sliding distance of
0.376 m (14.8 in) was predicted from the module modifications, which agreed very well with the
observed payload slide of approximately 0.38 m (15 in).
3.4 Comparison of Analytical and Experimental Data
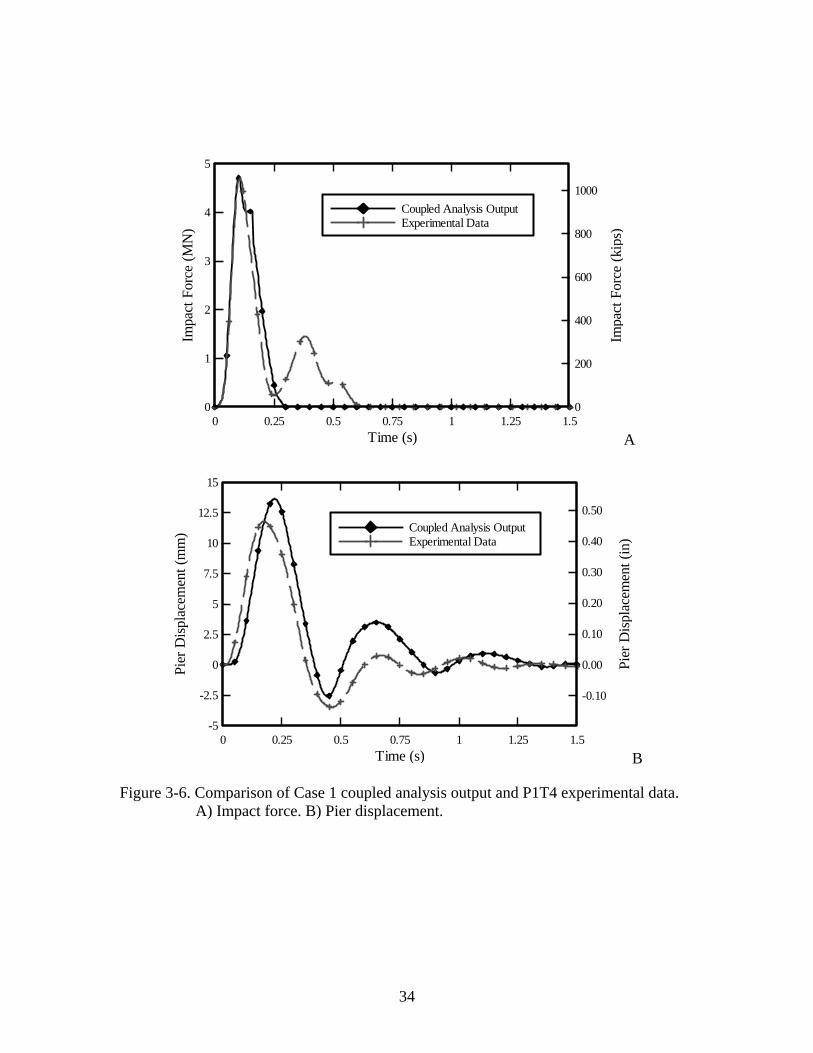
3.4.1 Case 1
The Case 1 impact load time-history (Fig. 3-6A) is nearly identical to the respective
experimental curve up to the peak load, and expectedly so, because the portion of the barge
force-crush relationship (Fig. 3-4), up to the peak impact load, was derived from the impact force
and displacement data acquired during the Case 1 (P1T4) collision event. Additionally, the
analytical and experimental agreement for portions of the Case 1 force time-history curve
26

beyond the peak justifies the assumptions made during the development of the load softening,
load plateau, and unloading components of the force-crush curve (Fig. 3-4).
The analytically determined peak value of pier displacement exceeds the experimental
value by 16% (Fig. 3-6B). Supplementary coupled analyses of the Pier 1-S model were
conducted with impact velocities measured during similar and higher impact-energy P1 series
tests. Comparisons of displacement output from these analyses (Appendix A) to respective
experimental data show discrepancies of comparable or lesser magnitude to those of Case 1.
3.4.2 Case 2
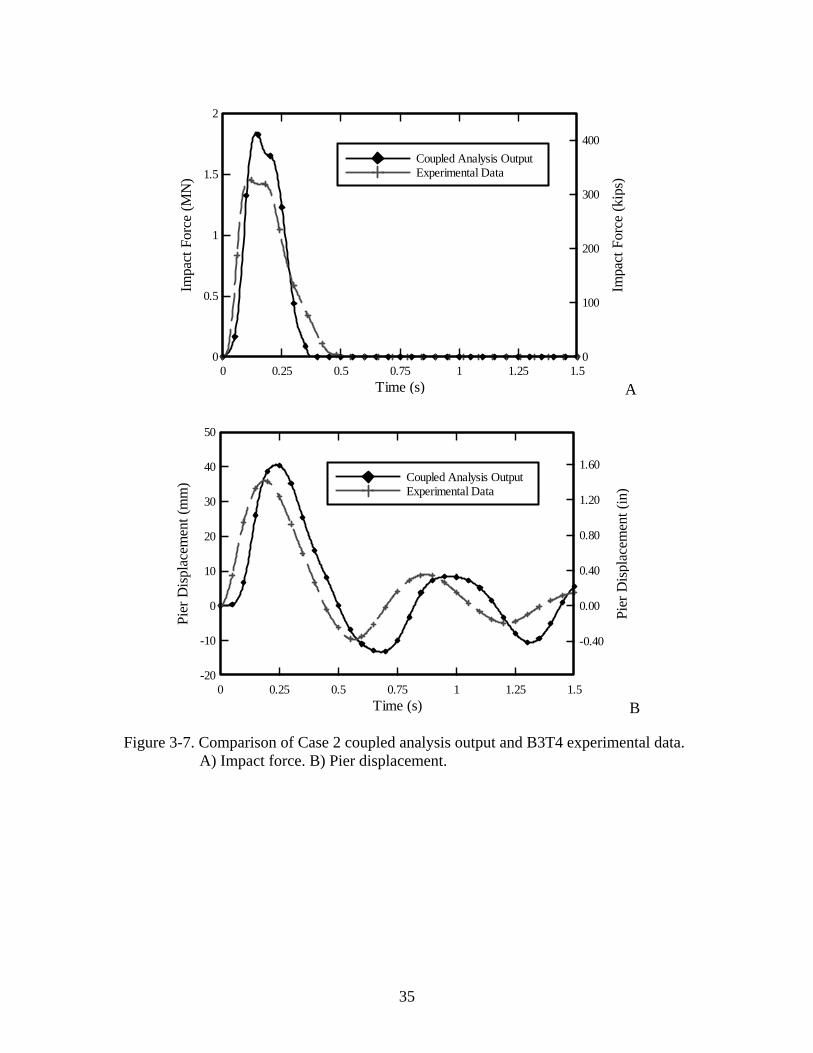
Case 2, in direct contrast to Case 1, consists of a low-energy barge collision event on a
flexible pier with superstructure restraint. Case 1 and Case 2 share only the barge force-crush
relationship derived from the P1T4 experimental data. The Case 2 experimental and analytical
force time-histories (Fig. 3-7A) embody similar qualitative shapes; however, the analytical peak
force magnitude is larger than the experimental counterpart. Despite the disparity in magnitude,
numerical integration of the curves indicates that the shape and magnitude of the impulse, as a
function of time, agree well between the experimental and analytical results (Fig. 3-8). This
implies that the change in momentum of the barge was accurately predicted by the coupled
analysis and produced a pier response similar to that measured experimentally.
The concord of the analytical and experimental time-history of displacement (Fig. 3-7B)
demonstrates the proficiency of the coupled analysis procedure in adequately predicting barge
collision response for piers of varying stiffness. Accurate pier response predictions are
maintained while incorporating superstructure effects. Agreement of pier response is the most
important outcome of the coupled analysis procedure, as the accompanying internal forces
generated throughout the MDF pier-soil model ultimately govern the pier structural member
design. The coupled analysis procedure effectively shifts the analytical focus away from
27

determination of the barge impact force, and centers the emphasis on determining pier structural
demand.
Coupled analysis also inherently captures dynamic phenomena exhibited during
barge-bridge collisions. As evidenced by the time-history plots of Case 1 and Case 2 (Fig. 3-6
and Fig. 3-7), the peak impact force and displacement do not occur simultaneously for individual
experimental test cases involving appreciable impact-energies (Consolazio et al. 2006). Static
procedures do not account for peak load-displacement time disparity or the potential
amplification effects intrinsic to the early stages of collision events for bridge structures.
Coupled analysis automatically accounts for these effects.
28
FF
Pier structure
Soilstiffness
Crushable bowsection of barge
Barge
Barge and bridge modelsare coupled together througha common contact force
SDF barge model MDF bridge model
Bridge motionBarge
motion
super- structure
Figure 3-1. Coupling between barge and bridge (after Consolazio and Cowan 2005).
29
ImpactForce
CrushDepth
Yieldpoint
Elastic loading/unloading
Loading curve
A
ImpactForce
CrushDepth
Unloading curve
Initiationof unloading
B
ImpactForce
CrushDepth
Barge and bridge not in contact
C
ImpactForce
CrushDepth
Plastic loading occurs along loading curve
Reloading occurs along same path
as unloading
D
Figure 3-2. Stages of barge crush (after Consolazio and Cowan 2005). A) Loading. B) Unloading. C) Barge not in contact with pier. D) Reloading and continued plastic deformation.
30

Impact
Pier 1-S
A
Impact
Pier 2-S Pier 3-S Pier 4-S Pier 5-S
Springs modelingadditional spansbeyond Pier 5-S
B
Figure 3-3. Structural configurations analyzed (not to relative scale). A) Case 1: Single pier. B) Case 2: Four piers with superstructure.
31
Crushable barge bow
SDF Barge MDF Pier
Crush Distance (mm)
Crush Distance (in)
Impa
ct F
orce
(MN
)
Impa
ct F
orce
(kip
s)
0 50 100 150 200 250 300
0 2 4 6 8 10
0
0.5
1
1.5
2
2.5
3
3.5
4
4.5
5
5.5
0
150
300
450
600
750
900
1050
1200Loading CurveUnloading Curves
Figure 3-4. SDF barge force-crush relationship derived from experimental and analytical data.
32
F
Barge
Payload
Total barge-payload masscontributes to impact force
No relative motion
Gravitational acceleration< Static coefficient of friction
between barge and payloadBarge acceleration
Wp
μ
m p
m b
A
F
Barge Barge mass and constant payload frictional force contribute to impact force
u 0Payload
μWp
Gravitational acceleration> Static coefficient of friction
between barge and payloadBarge acceleration
m p
m b
Wp
B
Figure 3-5. Sliding criterion between payload and barge. A) No sliding. B) Sliding.
33
Time (s)
Impa
ct F
orce
(MN
)
Impa
ct F
orce
(kip
s)
0 0.25 0.5 0.75 1 1.25 1.50
1
2
3
4
5
0
200
400
600
800
1000Coupled Analysis OutputExperimental Data
A
Time (s)
Pier
Disp
lace
men
t (m
m)
Pier
Dis p
lace
men
t (in
)
0 0.25 0.5 0.75 1 1.25 1.5-5
-2.5
0
2.5
5
7.5
10
12.5
15
-0.10
0.00
0.10
0.20
0.30
0.40
0.50Coupled Analysis OutputExperimental Data
B
Figure 3-6. Comparison of Case 1 coupled analysis output and P1T4 experimental data. A) Impact force. B) Pier displacement.
34
Time (s)
Impa
ct F
orce
(MN
)
Impa
ct F
orce
(kip
s)
0 0.25 0.5 0.75 1 1.25 1.50
0.5
1
1.5
2
0
100
200
300
400Coupled Analysis OutputExperimental Data
A
Time (s)
Pier
Disp
lace
men
t (m
m)
Pier
Disp
lace
men
t (in
)
0 0.25 0.5 0.75 1 1.25 1.5-20
-10
0
10
20
30
40
50
-0.40
0.00
0.40
0.80
1.20
1.60Coupled Analysis OutputExperimental Data
B
Figure 3-7. Comparison of Case 2 coupled analysis output and B3T4 experimental data. A) Impact force. B) Pier displacement.
35

Time (s)
Impu
lse (M
N-s
ec)
Impu
lse (k
ip-s
ec)
0 0.25 0.5 0.75 1 1.25 1.50
0.1
0.2
0.3
0.4
0
20
40
60
80
Coupled Analysis OutputExperimental Data
Figure 3-8. Comparison of Case 2 coupled analysis output and B3T4 experimental data: Impulse.
36
CHAPTER 4 SIMPLIFIED MULTIPLE-PIER COUPLED ANALYSIS
4.1 Overview
At current computer processing speeds, barge impact time-history analysis of bridge
models can require between tens of minutes to several hours of processing time. Two
simplifications may be applied to the coupled analysis of bridge structural models to reduce
analysis time and facilitate its use in design settings. First, a simplified alternative to the
experimentally and analytically derived crush curve may be used in design when more detailed
barge force-crush behavior is not available. The bilinear curve found in the current static
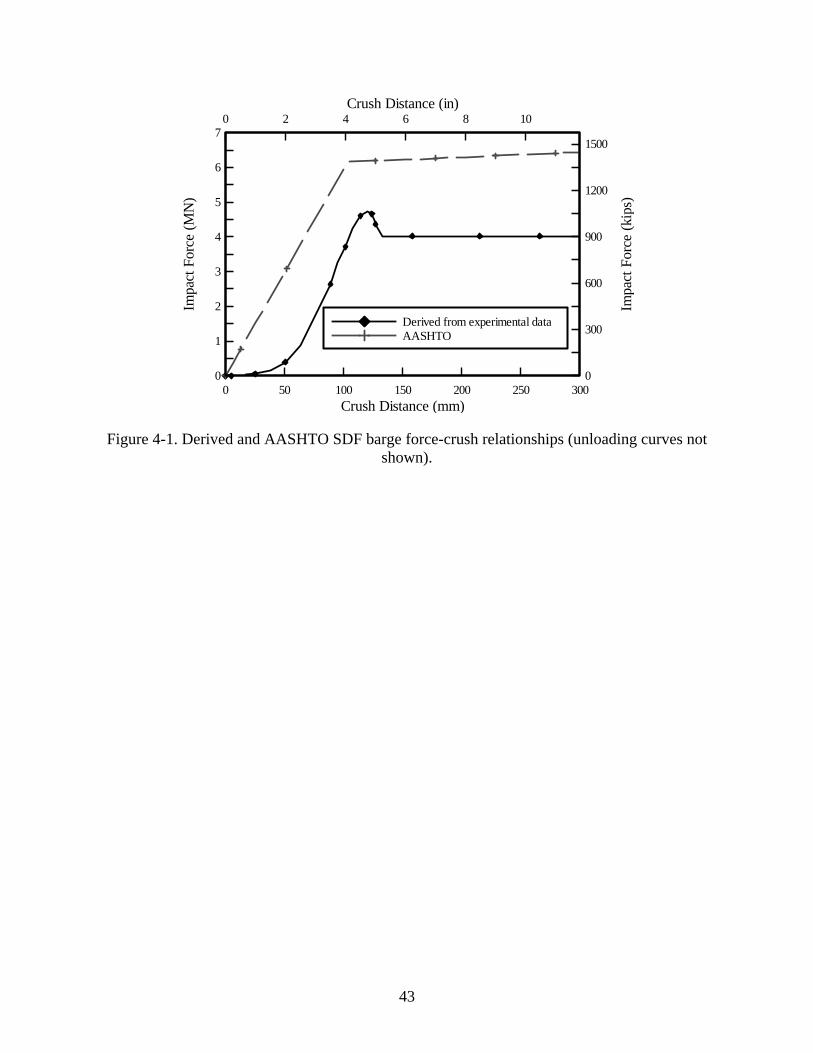
AASHTO design specifications (Fig. 4-1) may be used for general barge-bridge collision design
applications. Second, multiple-pier models may be reduced to a pseudo-single pier model (with
two attached superstructure spans) and analyzed to produce results that match to a satisfactory
degree of accuracy, those obtained from corresponding full-resolution (multi-span, multi-pier)
models.
4.2 Linearized Barge Force-Crush Relationship
The nonlinear loading portion of the barge force-crush curve, developed from P1T4
experimental data (Fig. 4-1), is specific to the barge used in the 2004 impact experiments.
Phenomena such as structural-softening beyond the peak force level for each combination of
barge type and impactor shape are not well documented in the literature and further study is
warranted before these components of barge bow crushing behavior may be quantified for
general application. Hence, the use of a simple bilinear force-crush relationship, such as that
found in the AASHTO barge-collision specifications, is desirable at present as long as such a
curve produces reasonable results.
37
The AASHTO force-crush relationship is in reasonable agreement with the P1T4
experimentally determined based force-crush curve. The crush depth at which the AASHTO and
experimental curves shift from the initial linear portion to the subsequent linear portion occur at
103.63 mm (4.08 in) and 120.65 mm (4.75 in), respectively. For convenience, these locations
are termed the shift points. Note that the AASHTO force corresponding to the shift point,
6.17 MN (1386 kips), is significantly greater than that found in the experimentally based curve,
4.74 MN (1065 kips). Additionally, the AASHTO curve exhibits positive stiffness regardless of
crush depth, whereas the curve employed in the validation of the coupled analysis method is
assumed to exhibit perfectly plastic behavior at high crush depths (Fig. 4-1). Consequently, the
AASHTO curve yields higher impact forces than the experimental data for all barge crush
depths, and is therefore conservative.
4.3 Reduction of the Bridge Model
Barges impart predominantly horizontal forces to impacted bridge piers during collision
events. Displacement and acceleration based superstructure restraint (due to superstructure
stiffness and mass, respectively) can attract a significant portion of the horizontal forces and
cause the impact load to “shed” to the superstructure (Consolazio et al. 2006). The horizontal
force shed to the superstructure then propagates (initially) away from the impacted pier.
Consequently, lateral translational and plan-view rotational stiffnesses influence the structural
response as the force propagates through the superstructure from the impacted pier to adjacent
piers. Simultaneously, the distributed mass of the superstructure alternates between a source of
inertial resistance to a source of inertial load that respectively restrains or must be absorbed by
other portions of the bridge structure. Simplification of the multiple-pier structural model,
therefore, must adequately retain the influence of adjacent non-impacted (the lateral translational
38

and plan-view rotational stiffnesses of the adjacent piers; and, the dynamically participating mass
of the superstructure).
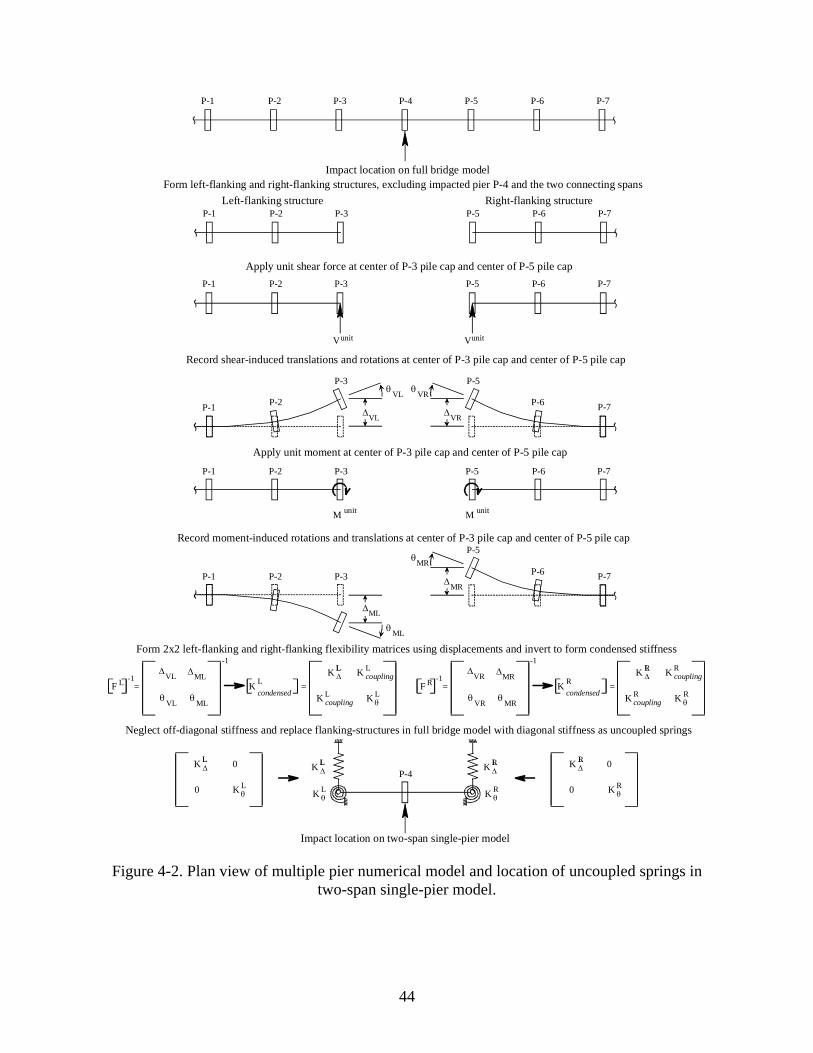
4.3.1 Uncoupled Condensed Stiffness Matrix
The stiffness DOF of a bridge model, beyond the superstructure spans that extend from
the impacted pier (Fig. 4-2), may be approximated by equivalent lateral translational springs and
plan-view rotational springs. These springs are linear elastic and represent the predominant DOF
of the linear elastic structural elements in the full-resolution model at piers adjacent to the
impacted pier. Soil nonlinearities at piers other than the impacted pier are ignored during
formation of the translational and rotational springs.
Replacement of numerous DOF from the flanking portions of a full bridge model
(Fig. 4-2) by two uncoupled springs at each end of a simplified two-span single-pier model may
be described in terms of a condensed stiffness matrix:
[ ] ⎥⎦
⎤⎢⎣
⎡= Δ
θKKKK
Kcoupling
couplingcondensed (4.1)
where [ is the condensed stiffness matrix of the flanking bridge portion eliminated at
each side of the impacted pier; is the condensed lateral translational stiffness term;
is an off-diagonal stiffness term that couples the translational DOF to the rotational DOF; and
is the condensed stiffness plan-view rotational stiffness term. In the simplified model, the
diagonal terms and are represented by translational and rotational springs, respectively,
and the terms are neglected. The exclusion of in the simplified model is
justified by examining the forces generated by the condensed stiffness terms on one side of an
example five-pier model.
]condensedK
ΔK couplingK
θK
ΔK θK
couplingK couplingK
39
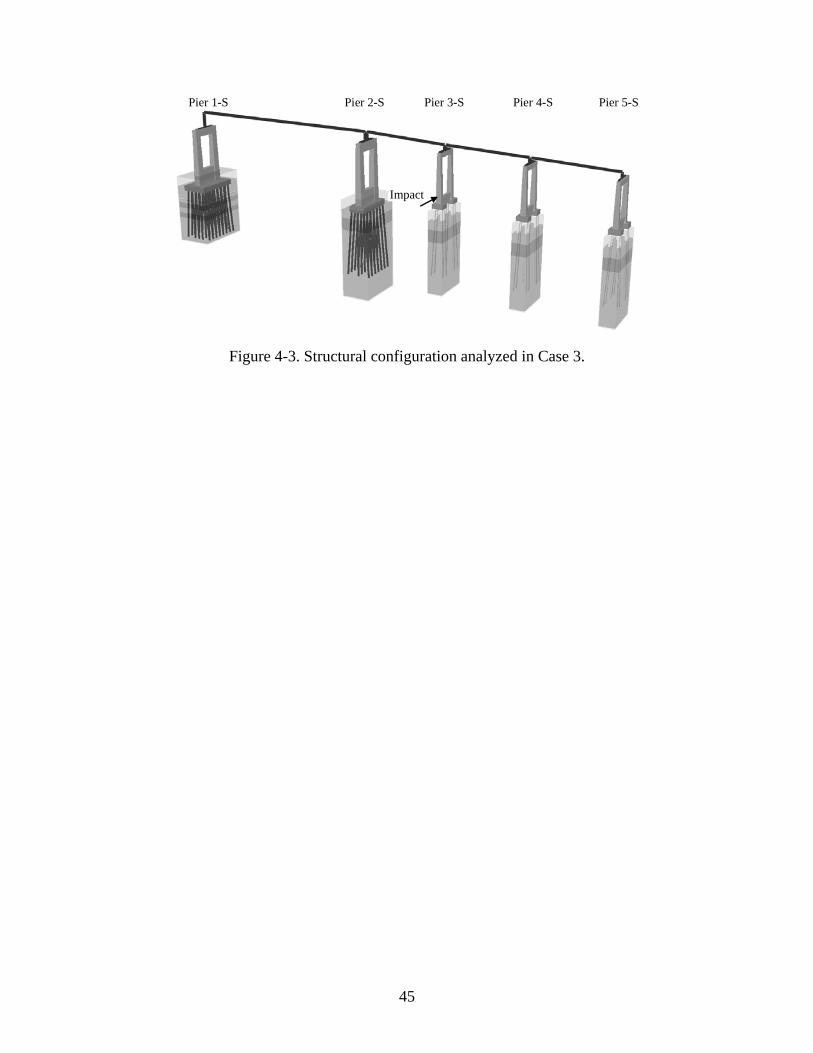
A channel pier was added to the previously discussed four-pier Case 2 model, using
bridge plans of the old St. George Island Bridge. This new five-pier model (Fig. 4-3) is referred
to as Case 3, as defined in Table 1-1. Through flexibility inversion (Fig. 4-2), the left-flanking
bridge structure in Case 3 (consisting of Pier 1-S to Pier 2-S), is reduced to the 2-DOF linear
elastic condensed stiffness matrix in Eq. (4.1), where =ΔK 97.0 MN/m (554 kip/in);
2.58E+05 MN-m/rad (2.28E+09 kip-in/rad); and, =θK =couplingK 398 MN/rad
(8.95+04 kip/rad). In row one of , the term may be interpreted as a horizontal
shear force generated when a unit rotation (1 rad) is induced at the right-most node of the
left-flanking structure. Static application of a load of 1.84 MN (414 kips) to the central pier of
the Case 3 five-pier model induces a plan-view rotation of
[ ]condensedK couplingK
=θ 6.35E-06 rad at the location of
the condensed stiffness. The horizontal shear produced as a result of this rotation is:
θθ couplingcoupling KV = (4.2)
where is the shear produced from the coupling of rotational and translational DOF. In
this instance, 2.53E-03 MN (0.568 kips). In comparison, the horizontal shear produced
as a result of diagonal lateral stiffness
couplingVθ
=couplingVθ
=ΔK 97.0 MN/m (554 kip/in) and lateral displacement
4.62 mm (0.182 in) is: =Δ
Δ= ΔΔ KV (4.3)
where is the shear produced directly from lateral translation. For this loading,
0.448 MN (101 kips).
ΔV
=ΔV
The amount of horizontal shear generated at the location of the condensed stiffness
matrix, due to the coupling stiffness term, is very small relative to the amount of horizontal shear
40
generated due to the diagonal stiffness term ( is only 0.6% of ). A similar examination
of the and terms yields ratios of comparable values (
couplingVθ ΔV
θK couplingK Appendix B). The large
difference in magnitude between the two shear forces demonstrates that the off-diagonal stiffness
terms of generate negligible forces relative to those generated by the diagonal
stiffness terms. Uncoupling the condensed stiffness terms by applying two independent springs
is therefore warranted for design applications, as the uncoupled springs form a reasonable static
approximation of the stiffness of the excluded portions of the model.
[ condensedK ]
As a further simplification to the full-bridge model, the diagonal stiffness terms and
may be approximated by direct inversion of the individual diagonal flexibility coefficients.
Specifically, this entails directly inverting the translational
ΔK
θK
VΔ and rotational Mθ displacements,
respectively, induced by the application of a unit shear force and unit force-couple
on the applicable flanking structure (Fig.
unitV unitM
4-2
) and is simpler to carry out.
). This approximation produces only nominally
different magnitudes of stiffness with respect to that obtained by a flexibility matrix inversion
(Appendix B
If significant nonlinear behavior is expected at non-impacted piers, then loads
representative of the forces that will be shed to the superstructure, and subsequently transmitted
into these piers, should be used to compute displacements (flexibility coefficients). Inversion of
flexibility coefficients formed in this manner yields a condensed secant stiffness that may then be
employed in the simplified model as described previously.
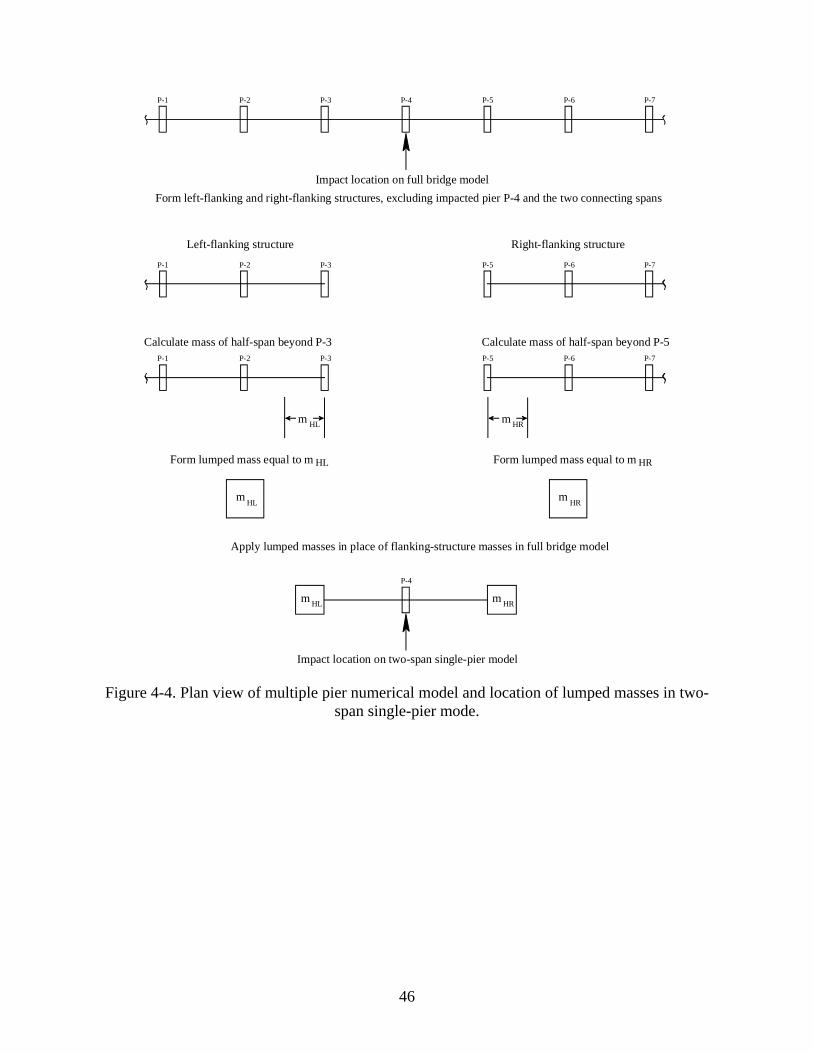
4.3.2 Lumped Mass Approximation
Mass is attributed to each node of the NDFEA models in this study, which consequently,
approximate a distributed mass system under dynamic loading. Therefore, a portion of mass of
the excluded structural components is assumed to contribute to the structural response of the
41

simplified models. This mass is assumed to fall within the tributary area (Fig. 4-4) extending
along the spans beyond the piers adjacent to the impacted pier of a given full-resolution model.
The mass is lumped and placed at respective ends of the simplified model. The lumped mass
simplification is combined with the stiffness approximation (Fig. 4-2) to complete the simplified
two-span single-pier model.
4.4 Multiple-Pier Coupled Analysis Simplification Algorithm
Simplified coupled analysis occurs in two stages. First, the two-span single-pier model is
assembled by replacing extraneous portions of the multiple-pier model with uncoupled linear
elastic springs and half-span lumped tributary masses. Coupled analysis is then performed, as
previously discussed, with the AASHTO bilinear crush-curve being employed for the barge.
The simplification algorithm automatically retains the ability to capture dynamic effects,
such as amplification, not addressed in static procedures. Furthermore, hundreds to thousands of
DOF are eliminated because the non-impacted piers and respective superstructure spans from the
full-resolution model are omitted from the model.
42
Crush Distance (mm)
Crush Distance (in)
Impa
ct F
orce
(MN
)
Impa
ct F
orce
(kip
s)
0 50 100 150 200 250 300
0 2 4 6 8 10
0
1
2
3
4
5
6
7
0
300
600
900
1200
1500
Derived from experimental dataAASHTO
Figure 4-1. Derived and AASHTO SDF barge force-crush relationships (unloading curves not shown).
43
K =F =
Impact location on full bridge modelForm left-flanking and right-flanking structures, excluding impacted pier P-4 and the two connecting spans
P-1 P-2 P-3 P-4 P-5 P-6 P-7
Apply unit shear force at center of P-3 pile cap and center of P-5 pile cap
Vunit
P-1 P-2 P-3 P-5 P-6 P-7
Record shear-induced translations and rotations at center of P-3 pile cap and center of P-5 pile cap
Apply unit moment at center of P-3 pile cap and center of P-5 pile cap
M unit
P-1 P-2 P-3 P-5 P-6 P-7
M unit
Record moment-induced rotations and translations at center of P-3 pile cap and center of P-5 pile cap
Form 2x2 left-flanking and right-flanking flexibility matrices using displacements and invert to form condensed stiffness
Left-flanking structure Right-flanking structureP-1 P-2 P-3 P-5 P-6 P-7
ΔVLP-1 P-2
P-3
P-7P-6
P-5
ΔVR
Vunit
θVL θVR
P-4
Neglect off-diagonal stiffness and replace flanking-structures in full bridge model with diagonal stiffness as uncoupled springs
Impact location on two-span single-pier model
ΔVL
θML K couplingL K θ
L
L K LK ΔL
coupling
0 K θL
L 0K ΔL
K θR
LK ΔR
0
0LK ΔL
K θL
LK ΔR
K θR
L Lcondensed
-1
-1
K =F =K coupling
R K θR
L K RK ΔR
couplingR R
condensed
-1
-1
ΔMR
θMR
P-7P-6
P-5
P-1 P-2 P-3
ΔML
θML
ΔML
θVL
ΔVR
θMR
ΔMR
θVR
Figure 4-2. Plan view of multiple pier numerical model and location of uncoupled springs in two-span single-pier model.
44
Pier 1-S Pier 2-S Pier 3-S Pier 4-S Pier 5-S
Impact
Figure 4-3. Structural configuration analyzed in Case 3.
45
Impact location on full bridge modelForm left-flanking and right-flanking structures, excluding impacted pier P-4 and the two connecting spans
P-1 P-2 P-3 P-4 P-5 P-6 P-7
Calculate mass of half-span beyond P-3
m HL
P-1 P-2 P-3 P-5 P-6 P-7
P-4
Impact location on two-span single-pier model
Calculate mass of half-span beyond P-5
Form lumped mass equal to m HL Form lumped mass equal to m HR
Apply lumped masses in place of flanking-structure masses in full bridge model
Left-flanking structure Right-flanking structure
P-1 P-2 P-3 P-5 P-6 P-7
m HR
m HL m HR
m HL m HR
Figure 4-4. Plan view of multiple pier numerical model and location of lumped masses in two-span single-pier mode.
46
CHAPTER SIMPLIFIED-COUPLED ANALYSIS DEMONSTRATION CASES
5.1 Introduction
To illustrate the efficacy of the simplification algorithm, three demonstration cases
(FB-MultiPier bridge models) are presented. Each model was developed using methods
representative of those employed by bridge designers. Impact conditions prescribed for the
models are such that the range of scenarios encountered in practical bridge design for barge
impact loading is well represented. The cases employ the AASHTO bilinear barge crush-curve,
consist of impacted pier models of increasing impact resistance, and are subjected to impacts
with corresponding increases in impact energy. Time-history output of internal pier structural
member forces obtained from both full-resolution and simplified models are subsequently
compared for each case.
Each full-resolution model contains five piers: a centrally located impact pier and
additional structural components (soil, non-impacted piers, and superstructure spans) for a length
of two spans to either side of the central pier. A five-pier model contains a sufficient number of
piers and spans such that inclusion of additional piers would increase analytical computation
costs without appreciably improving the computed structural response. The appropriateness of
the decision to limit the full-resolution models to five piers is substantiated by the consistently
negligible acceleration response exhibited by the outer-most piers included in the five-pier
models. Alternatively stated, the added restraint provided by including additional piers is not
necessary, as the outer-most piers of the five-pier models are only nominally active throughout
the barge impact analysis.
47
A single time-step increment, 0.0025 sec, was employed for all demonstration analyses.
Each model also utilized Rayleigh damping, which is configured such that the first five vibration
modes undergo damping at approximately 5% of critical damping.
5.2 Geographical Information, Structural Configuration, and Impact Conditions
5.2.1 Case 3
The first demonstration case consists of analysis of the previously described Case 3
model (Fig. 4-3). This model was based on the old St. George Island Bridge from the
Apalachicola Bay area, linking St. George Island to mainland Florida, in the southeastern United
States. Apalachicola Bay is located approximately 80.5 km (50 mi) southwest of Tallahassee,
Florida in the “panhandle” portion of the state.
The structure of the old St. George Island Bridge, constructed in the 1960s, was detailed
in a prior report (Consolazio et al. 2006). Pertinent to demonstration Case 3, the superstructure
spanning from Pier 2-S to Pier 5-S (Fig. 4-3) consisted of 23 m (75.5 ft) concrete girder-and-slab
segments overlying concrete piers with waterline footings. Spanning the navigation channel and
one additional pier to either side, a 189 m (619.5 ft) continuous three-span steel girder and
concrete slab segment rested on Pier 1-S and Pier 2-S, each containing a mudline footing and
steel H-piles. The central pier in Case 3, Pier 3-S, contained two tapered rectangular pier
columns, with a 1.5 m (5 ft) wide impact face at approximately the same elevation as the top of a
small shear strut that spanned between the two 1.2 m (4 ft) thick waterline pile-cap segments.
The pier rested on eight battered 0.5 m (20 in) square prestressed concrete piles, each containing
a free length of approximately 3.7 m (12 ft).
The Case 3 FE model includes the southern channel pier and extends southward from the
centerline of barge traffic. The impacted pier, Pier 3-S, was constructed before the AASHTO
provisions were written (1991), and was flexible as it was not a channel pier. The pier was
48

located 115.8 m (380 ft) from the channel centerline, which was significantly closer to a distance
of three times the impacting vessel length, 138 m (450 ft), than the distance to the edge of the
navigation channel, 37.75 m (124 ft). Per the AASHTO specifications, the pier would be subject
to a reduced impact velocity, approaching that of the yearly mean current velocity
(Consolazio et al. 2002). The kinetic energy (Table 1-1) associated with an empty jumbo-hopper
barge drifting at the yearly mean current velocity for the Apalachicola Bay is representative of a
low-energy impact condition.
5.2.2 Case 4
Escambia Bay abuts Pensacola, Florida, in the southeastern United States. Case 4
(Fig. 5-1) consists of impact analysis of a model based on the Escambia Bay Bridge. Structural
components of this bridge model were derived from bridge plans developed in the 1960s. The
superstructure spanning from Pier 2-W to Pier 2-E consists of a 125 m (410 ft) continuous
three-span steel girder and concrete slab. A 28 m (92 ft) concrete girder-and-slab segment spans
the underlying concrete piers beyond Pier 2-E. All piers, except for the channel piers denoted as
Pier 1-E and Pier 1-W, contain two pier columns, a shear wall, pile cap, and waterline footing
foundation. The channel piers in Case 4 each contain two tapered rectangular pier columns, with
a 2.6 m (8.5 ft) wide head-on impact face at approximately the mid-height elevation of a 5.3 m
(17.5 ft) shear wall. The pier columns and shear wall overlie a 1.5 m (5 ft) thick mudline footing
and 1.8 m (6 ft) tremie seal. The channel pier foundations consist of eighteen battered and nine
plumb 0.6 m (24 in) square prestressed concrete piles.
The Case 4 FE model includes both of the channel piers and three auxiliary piers. The
impacted pier, Pier 1-E, was constructed before the AASHTO provisions were written (1991),
but contains large impact resistance relative to the impacted pier from Case 3, as Pier 1-E is a
channel pier. Impact on a channel pier with a relatively high impact resistance was chosen to
49

demonstrate the accuracy of the simplification algorithm for the medium-energy impact of a
fully-loaded jumbo-hopper barge and towboat, traveling at a higher speed than the mean
waterway velocity (Table 1-1).
5.2.3 Case 5
Case 5 (Fig. 5-2) consists of impact analysis of piers from the new St. George Island
Bridge, which replaced the old St. George Island Bridge in 2004. The structural model of the
new St. George Island Bridge was derived from construction drawings. Per these drawings,
Pier 46 through Pier 49 support five cantilever-constructed Florida Bulb-T girder-and-slab
segments at span lengths of 62.25 m (207.5 ft) for the channel and 78.5 m (257.5 ft) for the
flanking spans. Due to haunching, the depth of the post-tensioned girders vary from 2 m (6.5 ft)
at drop-in locations to 3.7 m (12 ft) at respective pier cap beam bearing locations. Simply
supported Florida Bulb-T beams with a depth equal to that of the haunched beams at the drop-in
locations span either side of Pier 50. All piers included in this model contain two pier columns, a
shear strut centered near a respective pier column mid-height, a pile cap, and a waterline footing
system. The central pier in Case 5, Pier 48, contains two round 1.8 m (6 ft) pier columns, a
(6.5 ft) thick pile cap, and fourteen battered and one plumb 1.4 m (4.5 ft) diameter prestressed
cylinder piles with a 3 m (10 ft) concrete plug extending earthward from the pile cap.
The new St. George Island Bridge was designed in accordance with current AASHTO
barge collision design standards and provided a means of validating the simplification algorithm
for barge impact energies similar to those used in present day design. The Case 5 FE model
includes both of the channel piers and three auxiliary piers. The impacted pier, Pier 48 was
designed for a static impact load of 14.48 MN (3255 kips). With respect to the static AASHTO
design impact load, an energy equivalent impact condition (Appendix D) is employed in Case 5.
The prescribed vessel mass and velocity yields an impact kinetic energy equivalent to four
50
fully-loaded jumbo class hopper barges and a towboat traveling slightly above typical waterway
vessel speeds for the Apalachicola Bay waterway (Table 1-1).
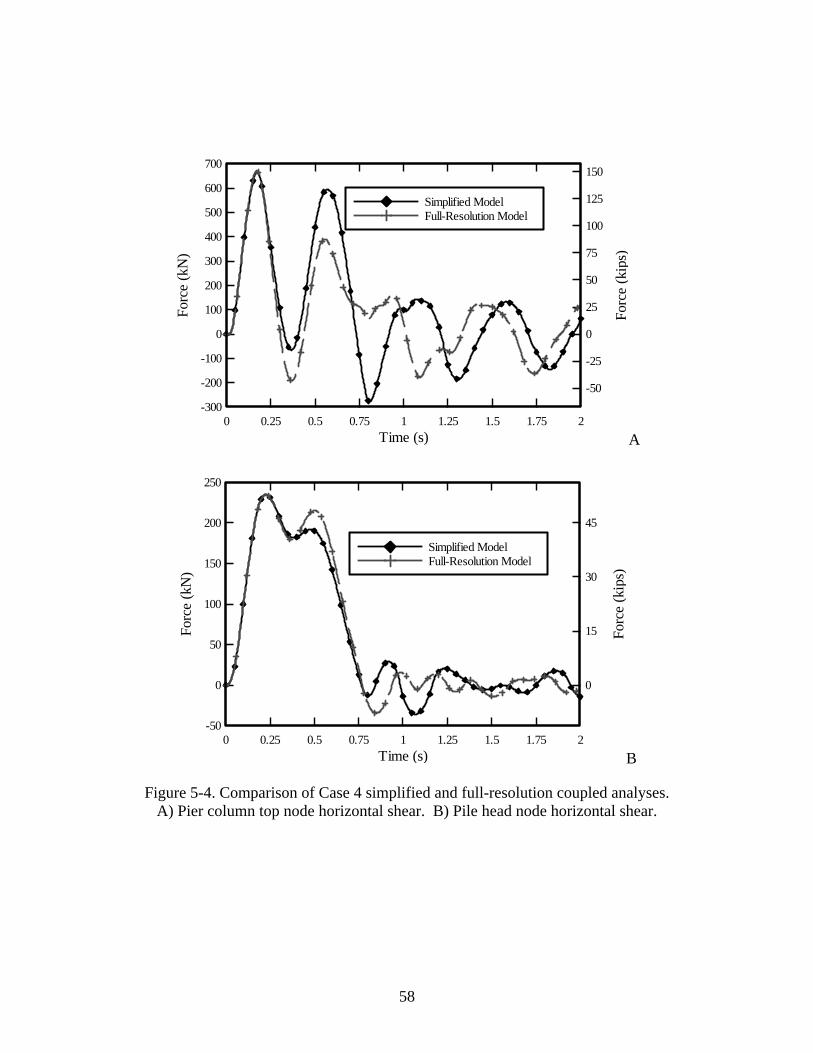
5.3 Comparison of Simplified and Full-Resolution Results
In bridge design applications related to waterway vessel collision, the analytically
quantified internal forces in a given pier structure govern subsequent structural component
sizing. Hence, accurate determination of internal forces is a necessary outcome of a bridge
structural analysis method. To highlight the ability of simplified analysis to accurately quantify
design forces over the full range of impacted pier structures, time-histories of internal shear force
induced by the impact loading are shown for the top of the impacted pier column and an
underlying pile-head node for Case 3 through Case 5 shown in Fig. 5-3 through Fig. 5-5,
respectively (additional comparisons of the impact force, displacements, and internal moments
are documented in Appendix C).
The predictions of load duration (the time during which the barge and pier are in contact),
common to both simplified and full-resolution analyses, are 0.26 sec, 0.78 sec, and 2.9 sec,
respectively, for Case 3, Case 4, and Case 5. At points in time greater than the respective load
durations, each bridge is in an unloaded condition and undergoes damped free-vibration.
Accordingly, pier response to time-history barge collision analysis may be divided into two
phases: first a load-phase then a free-vibration phase. In all three demonstration cases, peak
internal pier forces occur during the load-phase (0.13 sec, 0.17 sec, and 2.1 sec for Case 3,
Case 4, and Case 5, respectively). Therefore, agreement between the simplified and
full-resolution models is most critical during the load-phase, as forces obtained during this phase
ultimately govern bridge pier member design. Simplified analysis retains the ability to
accurately capture forces during the load-phase of response (Fig. 5-3 through Fig. 5-5 for each
case, respectively). Peak shear forces generated by full-resolution and simplified analysis during
51
the load-phase for each case differ by less than 2%. Reduced, yet still reasonable, agreement
with respect to period of response and subsequent peak values of shear force occur during the
free-phase of response for each case, however, such agreement is less critical and typically
irrelevant for design purposes.
Case 3 through Case 5 were analyzed on a Dell Latitude D610 notebook computer using
a single 2.13 GHz Intel PentiumM CPU and FB-MultiPier. The computation times necessary for
analysis completion of the simplified models were only 8%, 7.5%, and 8.4% of those required
for the full-resolution models of Case 3 through Case 5, respectively (Fig. 5-6). All cases
required significantly less than an hour to complete 800, 800, and 1600 time-steps of analysis,
respectively. Engineering judgment is required to determine the appropriate amount of analysis
time specified. However, analysis generally need not be conducted beyond the end of
load-phase, as evidenced by forces during the load-phase for Case 3 through Case 5.
5.4 Conclusions from Simplified-Coupled Analysis Demonstrations
Excellent agreement is observed during the load-phase response of the full-resolution and
simplified test cases, especially with respect to peak internal forces generated at various locations
of the impacted piers. From a design perspective, reasonable agreement between full and
simplified analytical results is also observed during the free-phase portions of respective
time-history responses. Time-histories of internal shear force, moment, and displacement are
adequately captured by the simplification algorithm, despite the simplifying stiffness and mass
assumptions that are made.
The time necessary to analyze the simplified models is significantly less than one hour in
each case, which is in contrast to the several hours necessary to analyze respective full-resolution
models. It should be noted that all FB-MultiPier analyses were conducted in compilation debug
52
mode. Considerable additional reduction in analysis time is expected if the same analyses were
to be conducted in a release compilation or commercial version of FB-MultiPier.
5.5 Dynamic Amplification of the Impacted Pier Column Internal Forces
Application of the simplification algorithm to each of the demonstration cases inherently
incorporates mass and acceleration based inertial forces that emerge from integration of the
dynamic system equations of motion. The simplification algorithm accurately captures dynamic
amplification of forces generated in the pier columns that would be absent from static analysis
results. Dynamic amplification in each case may be quantified by considering the maximum pier
column shears developed in models subjected to static application of the peak impact load
predicted through the coupled analysis. The peak shear and moments developed in the pier due
to static loading are then compared to those from the simplified and full-resolution dynamic
analyses (Fig. 5-7)
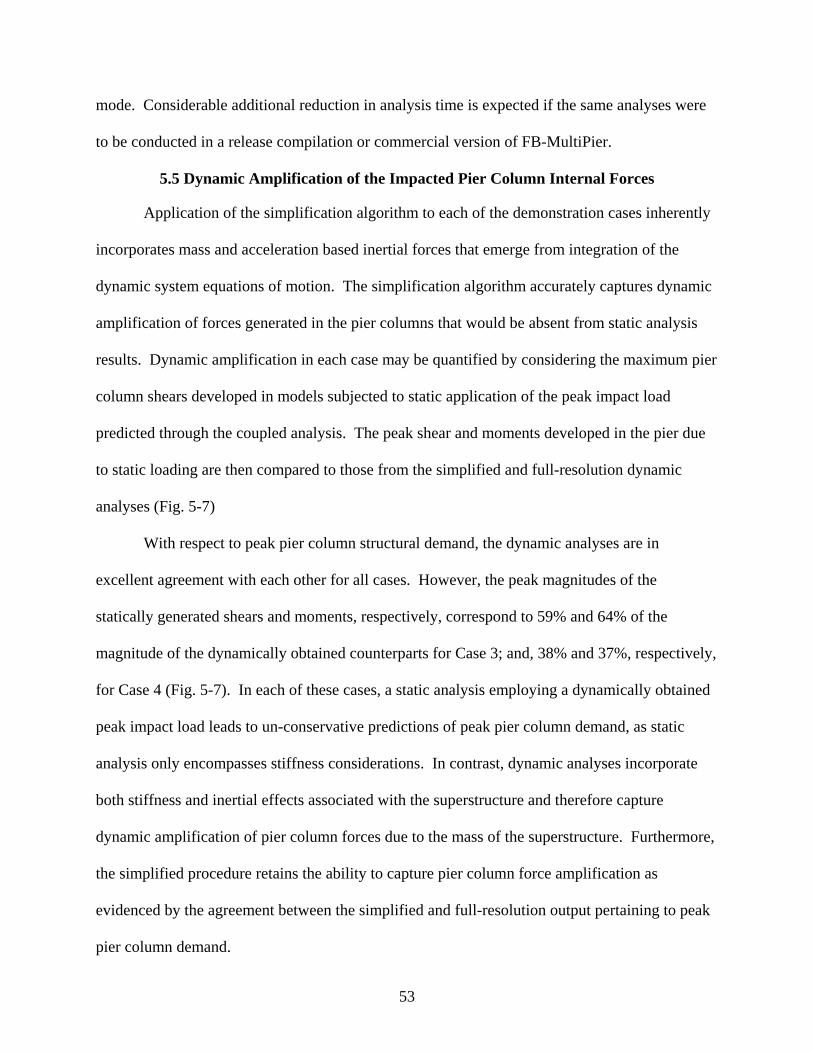
With respect to peak pier column structural demand, the dynamic analyses are in
excellent agreement with each other for all cases. However, the peak magnitudes of the
statically generated shears and moments, respectively, correspond to 59% and 64% of the
magnitude of the dynamically obtained counterparts for Case 3; and, 38% and 37%, respectively,
for Case 4 (Fig. 5-7). In each of these cases, a static analysis employing a dynamically obtained
peak impact load leads to un-conservative predictions of peak pier column demand, as static
analysis only encompasses stiffness considerations. In contrast, dynamic analyses incorporate
both stiffness and inertial effects associated with the superstructure and therefore capture
dynamic amplification of pier column forces due to the mass of the superstructure. Furthermore,
the simplified procedure retains the ability to capture pier column force amplification as
evidenced by the agreement between the simplified and full-resolution output pertaining to peak
pier column demand.
53
The impact energy specified in Case 5 is of sufficient magnitude to cause the barge and
impacted pier to remain in contact for a time greater than several periods of the fundamental pier
vibration mode. Consequently, the inertial forces in the impacted pier begin to dissipate due to
damping effects. This is evidenced by attenuation of oscillation exhibited in the pile head shear
force time-history for Case 5 from 0.1 sec to 2.5 sec (Fig. 5-5B). Despite the continued dynamic
activity in the top of the Pier 48 pier columns throughout the analysis (Fig. 5-5A), the overall
pier behavior approaches that of a static response as the impact load approaches a maximum
value. Additionally, because the AASHTO barge bow force-crush relationship (Fig. 4-1)
maintains a positive stiffness regardless of crush depth, the Case 5 peak impact force occurs at a
time in which the dynamic component of behavior of Pier 48 has substantially diminished.
Therefore, the peak pier column demands are driven by a static response in this case. As a result,
there is not a great difference between dynamic and static response (Fig. 5-7).
54

Pier 2-W Pier 1-W Pier 1-E Pier 2-E Pier 3-E
Impact
Figure 5-1. Structural configuration analyzed in Case 4.
55
Pier 46 Pier 47 Pier 48 Pier 49 Pier 50
Impact
Figure 5-2. Structural configuration analyzed in Case 5.
56

Time (s)
Forc
e (k
N)
Forc
e (k
ips)
0 0.25 0.5 0.75 1 1.25 1.5 1.75 2-300
-200
-100
0
100
200
300
400
500
600
-50
-25
0
25
50
75
100
125
Simplified ModelFull-Resolution Model
A
Time (s)
Forc
e (k
N)
Forc
e (k
ips)
0 0.25 0.5 0.75 1 1.25 1.5 1.75 2-100
-50
0
50
100
150
200
-15
0
15
30Simplified ModelFull-Resolution Model
B
Figure 5-3. Comparison of Case 3 simplified and full-resolution coupled analyses. A) Pier column top node horizontal shear. B) Pile head node horizontal shear.
57
Time (s)
Forc
e (k
N)
Forc
e (k
ips)
0 0.25 0.5 0.75 1 1.25 1.5 1.75 2-300
-200
-100
0
100
200
300
400
500
600
700
-50
-25
0
25
50
75
100
125
150
Simplified ModelFull-Resolution Model
A
Time (s)
Forc
e (k
N)
Forc
e (k
ips)
0 0.25 0.5 0.75 1 1.25 1.5 1.75 2-50
0
50
100
150
200
250
0
15
30
45
Simplified ModelFull-Resolution Model
B
Figure 5-4. Comparison of Case 4 simplified and full-resolution coupled analyses. A) Pier column top node horizontal shear. B) Pile head node horizontal shear.
58
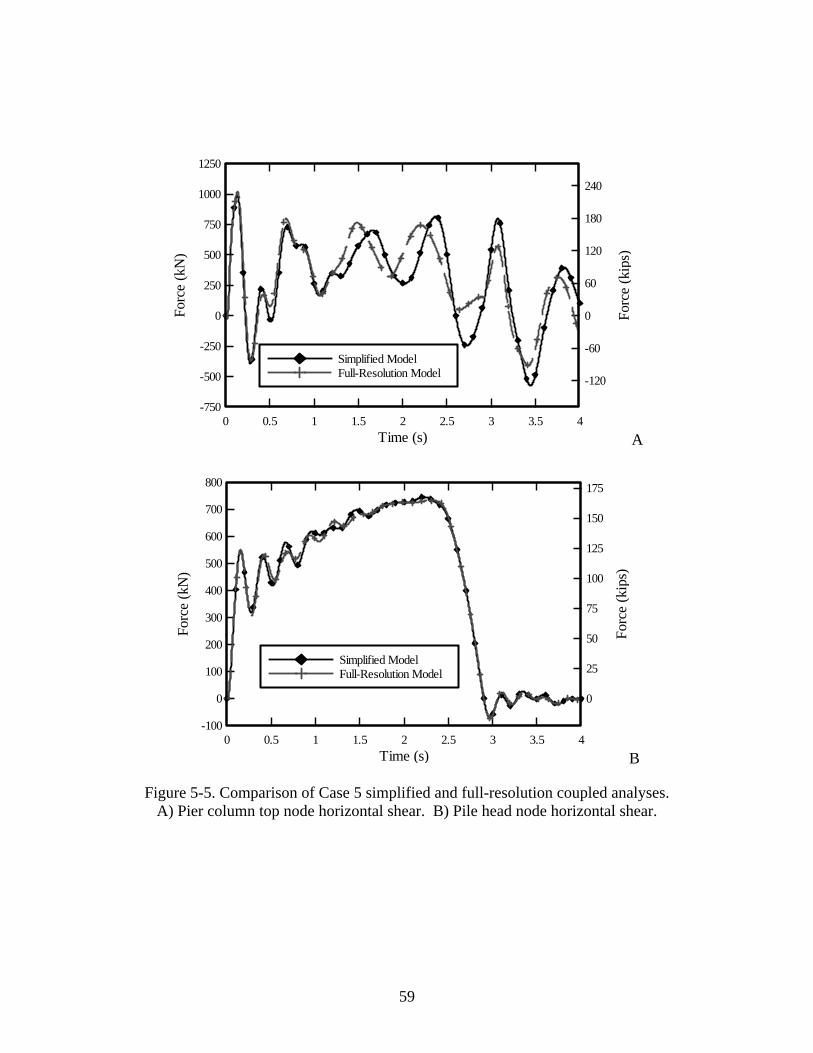
Time (s)
Forc
e (k
N)
Forc
e (k
ips)
0 0.5 1 1.5 2 2.5 3 3.5 4-750
-500
-250
0
250
500
750
1000
1250
-120
-60
0
60
120
180
240
Simplified ModelFull-Resolution Model
A
Time (s)
Forc
e (k
N)
Forc
e (k
ips)
0 0.5 1 1.5 2 2.5 3 3.5 4-100
0
100
200
300
400
500
600
700
800
0
25
50
75
100
125
150
175
Simplified ModelFull-Resolution Model
B
Figure 5-5. Comparison of Case 5 simplified and full-resolution coupled analyses. A) Pier column top node horizontal shear. B) Pile head node horizontal shear.
59
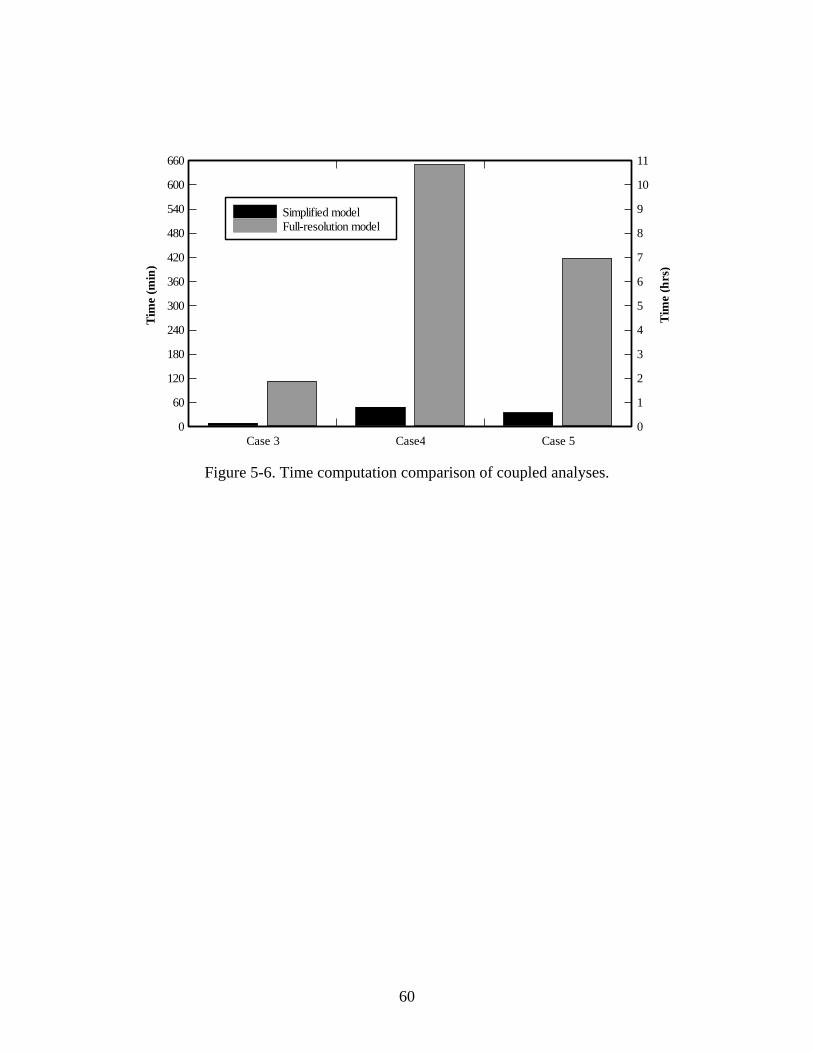
Tim
e (m
in)
Tim
e (h
rs)
0
60
120
180
240
300
360
420
480
540
600
660
0
1
2
3
4
5
6
7
8
9
10
11
Case 3 Case4 Case 5
Simplified modelFull-resolution model
Figure 5-6. Time computation comparison of coupled analyses.
60
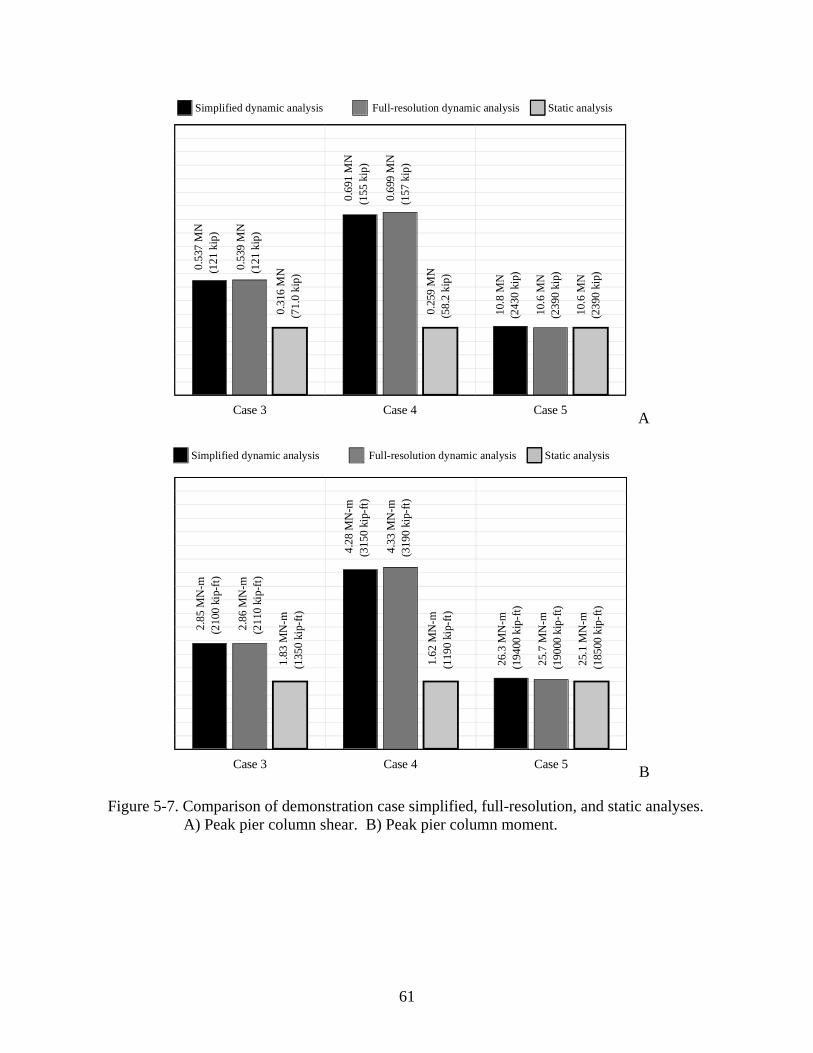
Case 3 Case 4 Case 5
0.53
7 M
N(1
21 k
ip)
0.53
9 M
N(1
21 k
ip)
0.31
6 M
N(7
1.0
kip)
0.69
1 M
N(1
55 k
ip)
0.69
9 M
N(1
57 k
ip)
0.25
9 M
N(5
8.2
kip)
10.8
MN
(243
0 ki
p)
10.6
MN
(239
0 ki
p)
10.6
MN
(239
0 ki
p)
Simplified dynamic analysis Full-resolution dynamic analysis Static analysis
A
Case 3 Case 4 Case 5
Simplified dynamic analysis Full-resolution dynamic analysis Static analysis
2.85
MN
-m(2
100
kip-
ft)
2.86
MN
-m(2
110
kip-
ft)
1.83
MN
-m(1
350
kip-
ft)
4.28
MN
-m(3
150
kip-
ft)
4.33
MN
-m(3
190
kip-
ft)
1.62
MN
-m(1
190
kip-
ft)
26.3
MN
-m(1
9400
kip
-ft)
25.1
MN
-m(1
8500
kip
-ft)
25.7
MN
-m(1
9000
kip
-ft)
B
Figure 5-7. Comparison of demonstration case simplified, full-resolution, and static analyses. A) Peak pier column shear. B) Peak pier column moment.
61
CHAPTER 6 CONCLUSIONS AND RECOMMENDATIONS FOR FUTURE RESEARCH
6.1 Conclusions
Numerical coupled analysis has been validated using experimental findings from the
2004 full-scale barge impact experiments. As one means of making coupled analysis feasible for
use in design settings, a simplified and standardized barge bow stiffness curve has been
recognized as desirable. Due to the scarcity of barge bow force-crush relationship data in the
literature, the AASHTO crush-curve has been selected. However, data specific to a particular
vessel type obtained by other means may easily be integrated into the coupled analysis
procedure. As an additional facilitation for the use of coupled analysis in design settings, an
algorithm has been presented that reduces a multi-span, multiple-pier model to a multi-span
single pier model with lateral and rotational springs, and lumped masses. With regard to the
stiffness approximation associated with the simplification algorithm, linear elastic lateral and
rotational springs have been shown to retain sufficient accuracy in respective simplified models
for design purposes despite the associated uncoupling of the respective DOF.
Three five-pier bridge analysis cases have been presented and subjected to the coupled
analysis procedure at simplified and full resolutions. Comparison of the results demonstrates the
ability of the simplification algorithm to predict time-history results in agreement with
full-resolution models for low, medium, and high-energy impact conditions through a range of
pier impact resistances. The simplified algorithm, used in conjunction with coupled analysis,
provides a feasible means of conducting barge-bridge collision analysis in design settings.
Required analyses times associated with simplified analysis are reduced to levels suitable for
design situations. Furthermore, the simplification algorithm retains analytical sophistication
62

sufficient to adequately quantify inertial bridge forces and the resulting distribution of internal
forces throughout a given pier.
Dynamic phenomena documented in previous barge-pier collision research, such as
dynamic amplification of pier column shear forces due to dynamic excitation of superstructure
elements, are quantified for three cases and compared to results obtained from a static analysis
procedure. Simplified coupled analysis is shown to adequately and efficiently capture such
effects and is found to be suitable for future incorporation into design provisions.
6.2 Recommendations for Future Research
Based on the advances made in this study, the following topics warrant additional future
investigation:
• The development of experimental procedures leading to a standardized body of crush-curves, including phenomena such as post-yield softening and unloading;
• High-resolution modeling or experimental testing of multiple-barge flotilla impacts, resulting in data sufficient to quantify any significant interactions between multiple barge flotillas; this would be in relation to improving the state-of-the-art SDF impact model; and,
• Possible revision of the AASHTO Probability of Collapse term.
63

APPENDIX A SUPPLEMENTARY COUPLED ANALYSIS VALIDATION DATA
The 2004 full-scale experiments (Consolazio et al. 2006) consisted of three distinct impact test setups, two of which are of interest in this study: the first impact tests were conducted on the stiff channel pier, Pier 1-S; the second set of tests were conducted on a flexible pier, Pier 3-S, with the superstructure intact for one span to the north and multiple spans to the south. After development of the barge force-crush relationship, coupled analyses were conducted on FB-MultiPier models of the Pier 1-S and Pier 3-S partial bridge structure at impact energies corresponding to the impact test events.
The highest impact energies, and therefore the most appreciable impact loads and
structure response, occurred during tests four through seven on Pier 1-S (termed test P1T4 through P1T7). Due to the flexibility of Pier 3-S, and the non-destructive nature of the testing, impact energies employed in the multi-span B3 bridge tests were considerably lower than that of the P1 test series. Even so, the second through fourth tests (termed test B3T2 through B3T4) generated considerable pier response and significant impact loads. Tests associated with significant loading or pier response were selected for validation of the coupled analysis procedure. Pertinent output from such analyses is included in this appendix. All P1 series analyses included here were conducted using the payload modifications discussed in Chapter 3.
64
0 0.25 0.5 0.75 1 1.25 1.50.2
0.1
0
0.1
0.2
0.3
0.4
0.5
Time (sec)
Dis
plac
emen
t (in
)
Impact Point Displacement Time History
0 0.25 0.5 0.75 1 1.25 1.50
200
400
600
800
1000
1200
Time (sec)
Forc
e (k
ips)
Impact Force Time History
0 1 2 3 4 5 60
200
400
600
800
1000
1200
Analytical outputExperimental dataInput loading curve
Analytical outputExperimental dataInput loading curve
Crush (in)
Forc
e (k
ips)
Barge Force Crush Output
Figure A-1. Analytical output comparison to experimental P1T4 barge impact data.
65

0 0.25 0.5 0.75 1 1.25 1.50.2
0.1
0
0.1
0.2
0.3
0.4
0.5
Time (sec)
Dis
plac
emen
t (in
)
Impact Point Displacement Time History
0 0.25 0.5 0.75 1 1.25 1.50
200
400
600
800
1000
1200
Time (sec)
Forc
e (k
ips)
Impact Force Time History
0 1 2 3 4 5 60
200
400
600
800
1000
1200
Analytical outputExperimental dataInput loading curve
Analytical outputExperimental dataInput loading curve
Crush (in)
Forc
e (k
ips)
Barge Force Crush Output
Figure A-2. Analytical output comparison to experimental P1T5 barge impact data.
66
0 0.25 0.5 0.75 1 1.25 1.50.5
0.25
0
0.25
0.5
0.75
Time (sec)
Dis
plac
emen
t (in
)
Impact Point Displacement Time History
0 0.25 0.5 0.75 1 1.25 1.50
200
400
600
800
1000
1200
Time (sec)
Forc
e (k
ips)
Impact Force Time History
0 1 2 3 4 5 6 7 8 90
200
400
600
800
1000
1200
Analytical outputExperimental dataInput loading curve
Analytical outputExperimental dataInput loading curve
Crush (in)
Forc
e (k
ips)
Barge Force Crush Output
Figure A-3. Analytical output comparison to experimental P1T6 barge impact data.
67
0 0.25 0.5 0.75 1 1.25 1.50.25
0
0.25
0.5
0.75
Time (sec)
Dis
plac
emen
t (in
)
Impact Point Displacement Time History
0 0.25 0.5 0.75 1 1.25 1.50
200
400
600
800
1000
1200
Time (sec)
Forc
e (k
ips)
Impact Force Time History
0 1 2 3 4 5 6 7 8 90
200
400
600
800
1000
1200
Analytical outputExperimental dataInput loading curve
Analytical outputExperimental dataInput loading curve
Crush (in)
Forc
e (k
ips)
Barge Force Crush Output
Figure A-4. Analytical output comparison to experimental P1T7 barge impact data.
68
0 0.25 0.5 0.75 1 1.25 1.50.5
0.25
0
0.25
0.5
0.75
1
Time (sec)
Dis
plac
emen
t (in
)
Impact Point Displacement Time History
0 0.25 0.5 0.75 1 1.25 1.50
50
100
150
200
250
Time (sec)
Forc
e (k
ips)
Impact Force Time History
0 0.5 1 1.5 2 2.5 30
50
100
150
200
250
Analytical outputExperimental dataInput loading curve
Analytical outputExperimental dataInput loading curve
Crush (in)
Forc
e (k
ips)
Barge Force Crush Output
Figure A-5. Analytical output in comparison to experimental B3T2 barge impact data.
69
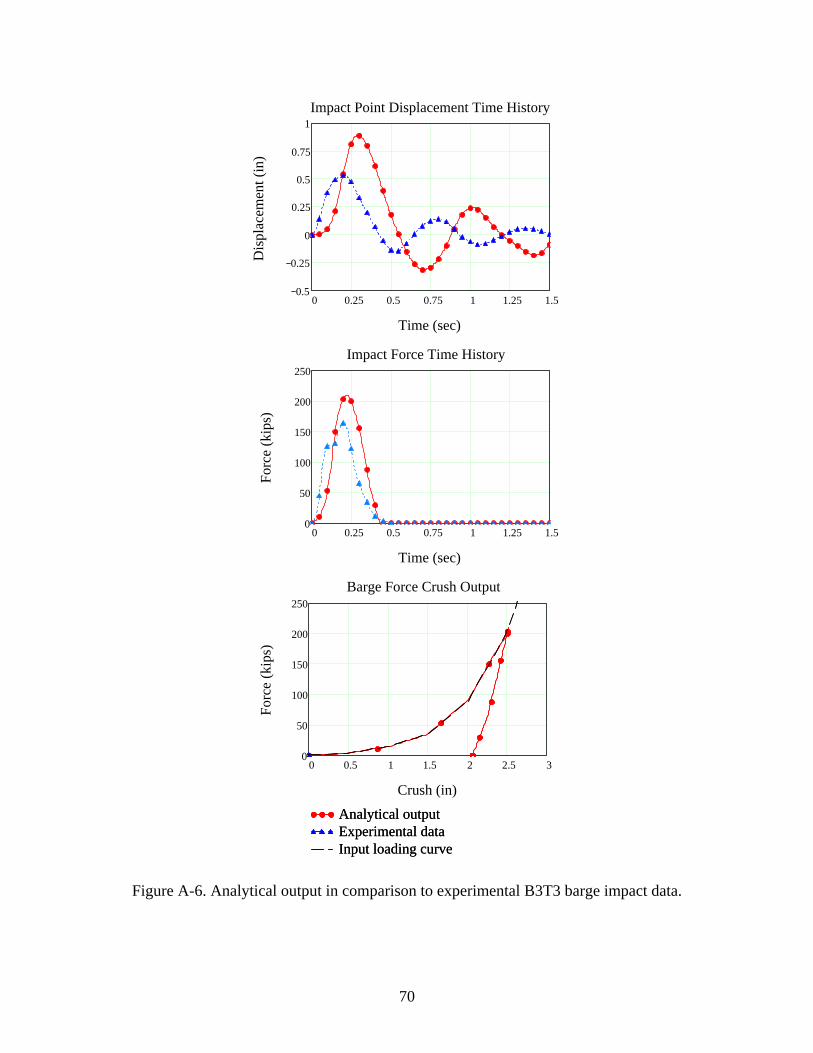
0 0.25 0.5 0.75 1 1.25 1.50.5
0.25
0
0.25
0.5
0.75
1
Time (sec)
Dis
plac
emen
t (in
)
Impact Point Displacement Time History
0 0.25 0.5 0.75 1 1.25 1.50
50
100
150
200
250
Time (sec)
Forc
e (k
ips)
Impact Force Time History
0 0.5 1 1.5 2 2.5 30
50
100
150
200
250
Analytical outputExperimental dataInput loading curve
Analytical outputExperimental dataInput loading curve
Crush (in)
Forc
e (k
ips)
Barge Force Crush Output
Figure A-6. Analytical output in comparison to experimental B3T3 barge impact data.
70
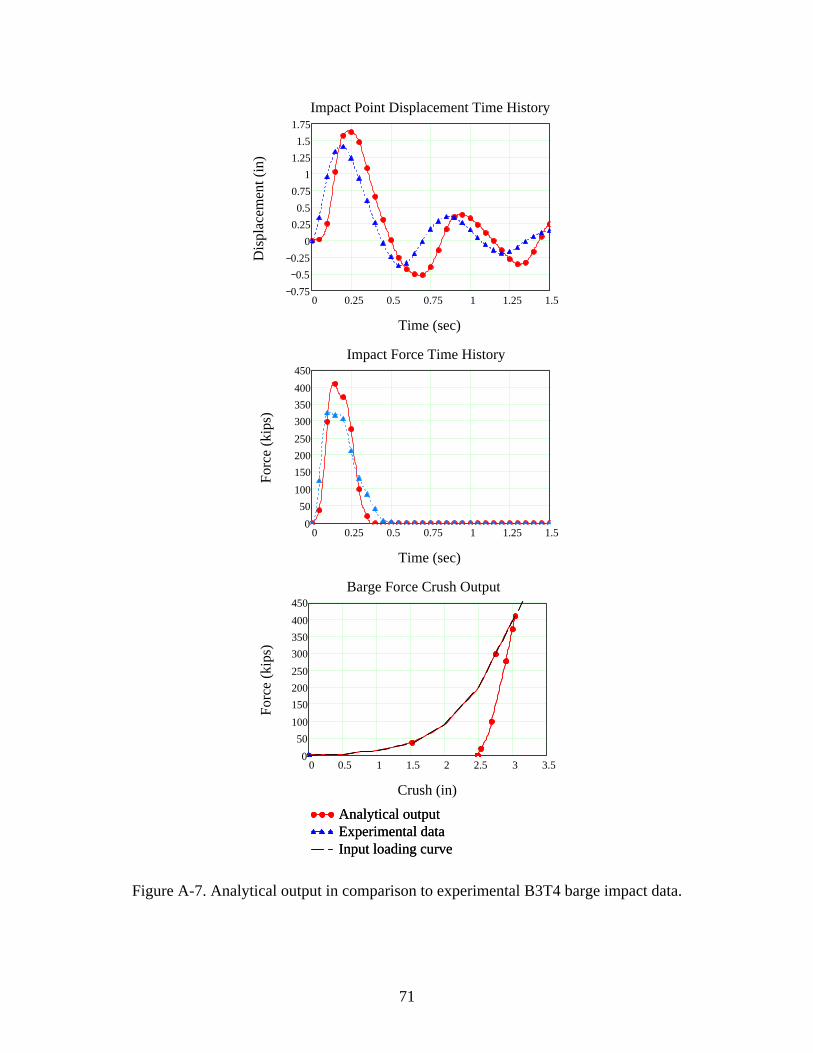
0 0.25 0.5 0.75 1 1.25 1.50.750.5
0.250
0.250.5
0.751
1.251.5
1.75
Time (sec)
Dis
plac
emen
t (in
)
Impact Point Displacement Time History
0 0.25 0.5 0.75 1 1.25 1.50
50100150200250300350400450
Time (sec)
Forc
e (k
ips)
Impact Force Time History
0 0.5 1 1.5 2 2.5 3 3.50
50100150200250300350400450
Analytical outputExperimental dataInput loading curve
Analytical outputExperimental dataInput loading curve
Crush (in)
Forc
e (k
ips)
Barge Force Crush Output
Figure A-7. Analytical output in comparison to experimental B3T4 barge impact data.
71
APPENDIX B CONDENSED UNCOUPLED STIFFNESS MATRIX CALCULATIONS
Within the discussion of the condensed uncoupled stiffness matrix, presented in Chapter 4, the condensed off-diagonal stiffness term that couples rotation and horizontal shear force ( ) is shown to produce relatively negligible shear forces with respect to the applied impact load. This affords the uncoupling of the condensed stiffness matrix of extraneous non-impacted portions of a given bridge model. This appendix contains comparisons of the same off-diagonal stiffness term ( ), alternatively viewed as a coupling between horizontal translation and a vertical moment, and the moment produced by the diagonal rotational stiffness term ( ) of the condensed stiffness matrix when the B3 numerical model (Fig.
couplingK
couplingK
θK3-3) is subject to an arbitrary static load at the impact location. A comparison of the
diagonal and off-diagonal moments reveals that the off-diagonal stiffness of piers adjacent to the impacted pier in a given full-resolution model may be neglected without sacrificing any appreciable analytical accuracy of forces developed in the impacted pier.
72

Off-Diagonal stiffness quantification: Case 3 Numerical Model
1. Obtain condensed stiffness matrix of Pier 2S to Pier 1S portion of full-resolution model
1.1 Apply unit lateral load at location of stiffness condensation; in this case, the center of the pier cap beam of Pier 2S
1.1.1 Store lateral translation and vertical rotation in appropriate entries of condensed flexibility matrix
1.2 Apply unit vertical moment at location of stiffness condensation; in this case, the center of the pier cap beam of Pier 2S
1.2.1 Store lateral translation and vertical rotation in appropriate entries of condensed flexibility matrix
Condensed flexibility matrix: FlexP2
0.00181781
8.5443− 10 7−⋅
12
8.5443− 10 7−⋅
12
5.28799 10 9−⋅
12
⎛⎜⎜⎜⎜⎝
⎞⎟⎟⎟⎟⎠
:= in/kip and rad/kip-in
The first row diagonal entry pertains to shear force per unit lateral translation; the second row diagonal pertains to vertical moment per unit vertical rotation
2. Invert condensed flexibility matrix to obtain condensed stiffness matrix
StiffP2 FlexP2 1−:=
Condensed stiffness matrix: StiffP2553.616
8.945 104×
8.945 104×
2.284 109×
⎛⎜⎜⎝
⎞⎟⎟⎠
= kip/in and kip-in/rad
73

Off-Diagonal stiffness quantification: Case 3 Numerical Model (Cont'd)
3. Apply peak static load at impact point of full-resolution model and record displacements
Static load applied at Node 109 of Pier 3-S:
PeakLoad 413.8:= kips
Induced displacements at location of condensed stiffness:
Vertical rotation:
θz 1.994 10 4−⋅:= rad
Horizontal translation:
Δx 0.1908:= in
4. Calculate moment due to diagonal stiffness term and vertical rotation
Mzdiagonal StiffP22 2, θz⋅:= Mzdiagonal 4.554 105×= kip-in
5. Calculate moment due to off-diagonal stiffness term and horizontal translation
Mzoffdiagonal StiffP21 2, Δx⋅:= Mzoffdiagonal 1.707 104×= kip-in
6. Compare magnitudes of "diagonal" and "off-diagonal" moments
ratioMzdiagonal
Mzoffdiagonal:= ratio 26.681=
The "diagonal" moment is significantly larger than the "off-diagonal" moment.
74

Flexibility Approximation: Case 3 Numerical Model7. Directly invert diagonal flexibility terms recorded in 1.2.1 of Off-Diagonal Stiffness Quantification
7.1 Approximation of Translational Stiffness Term
AppStiffTrans1
FlexP21 1,:= AppStiffTrans 550.112= kip/in
7.2 Approximation of Rotational Stiffness Term
AppStiffRot1
FlexP22 2,:= AppStiffRot 2.269 109
×= kip-rad/in
8. Calculate percent difference between approximated stiffness terms and stiffness terms obtained by flexibility matrix inversion (the latter terms being calculated in 2. of Off-Diagonal Stiffness Quantification)
8.1 Percent difference of translational stiffness term
AppStiffTrans StiffP21 1,−
StiffP21 1,100⋅ 0.633−= percent
8.2 Percent difference of rotational stiffness term
AppStiffRot StiffP22 2,−
StiffP22 2,100⋅ 0.633−= percent
The approximation yields nominally different values of stiffness.
75

APPENDIX C SIMPLIFIED-COUPLED ANALYSIS CASE OUTPUT
To further bolster the assertion that the simplification algorithm predicts impacted pier response with an accuracy that, within reason, matches that of full-resolution bridge coupled analysis, additional time-history data from each of Case 3 through Case 5 are included in this appendix. More specifically, time-histories of shear, moment, and displacement are provided at the pier column top and pile head for each case. Additionally, barge force-crush data obtained from simplified and full-bridge analyses are included. Accompanying this data are the impact location displacement time-history and impact location force time-history for each of Case 3 through Case 5. Consequently, the data presented in Fig. C-1 through Fig. C-9 were obtained using the AASHTO barge bow force-crush relationship. Finally, data obtained from the same pier models are presented when simplified and full-resolution analyses are conducted using a bilinear barge bow force-crush relationship with an initial stiffness and “shift point” (see Chapter 4) identical to that found in the AASHTO curve. Output pertaining to these analyses are located in Fig. C-10 through Fig. C-18.
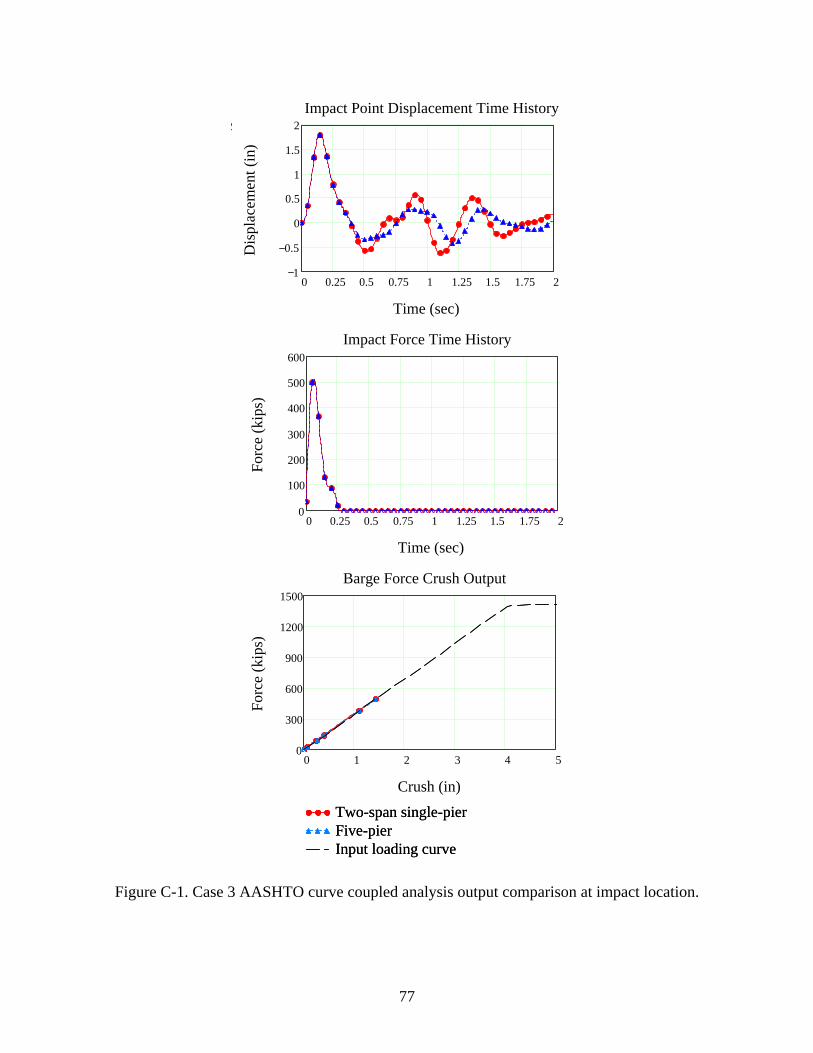
2
0 0.25 0.5 0.75 1 1.25 1.5 1.75 21
0.5
0
0.5
1
1.5
2
Time (sec)
Dis
plac
emen
t (in
)
Impact Point Displacement Time History
0 0.25 0.5 0.75 1 1.25 1.5 1.75 20
100
200
300
400
500
600
Time (sec)
Forc
e (k
ips)
Impact Force Time History
0 1 2 3 4 50
300
600
900
1200
1500
Two-span single-pierFive-pierInput loading curve
Two-span single-pierFive-pierInput loading curve
Crush (in)
Forc
e (k
ips)
Barge Force Crush Output
Figure C-1. Case 3 AASHTO curve coupled analysis output comparison at impact location.
77
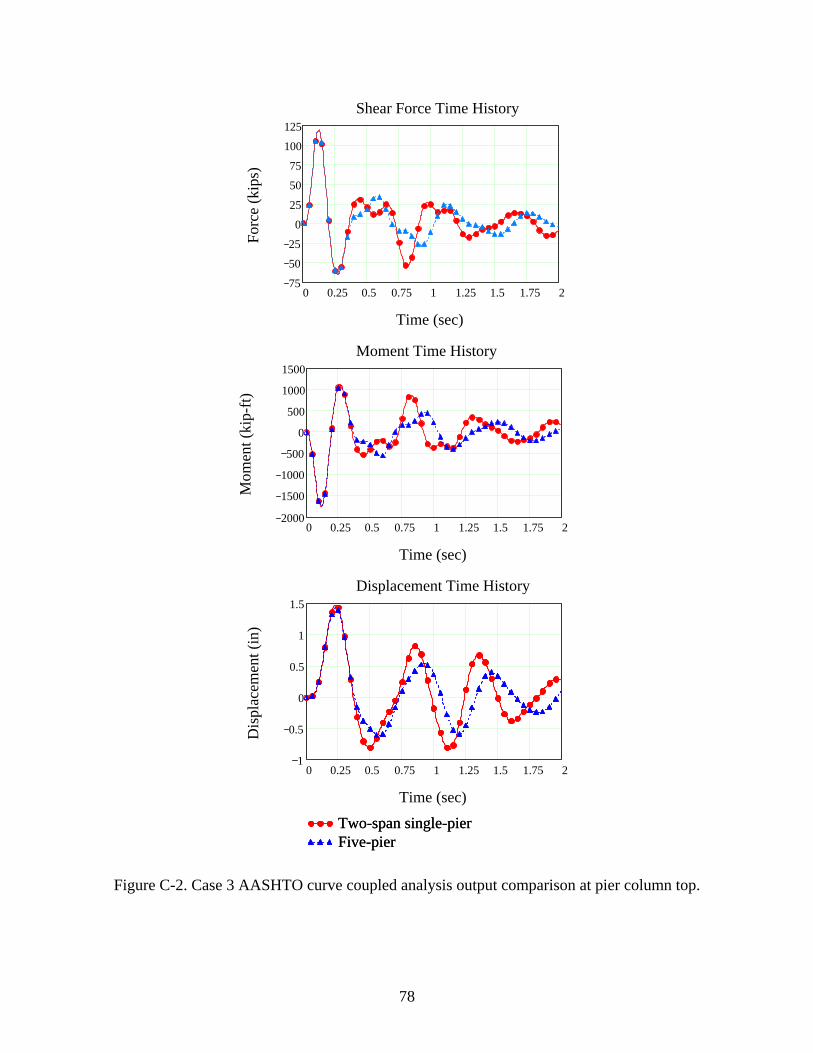
Shear Force Time History
Moment Time History
0 0.25 0.5 0.75 1 1.25 1.5 1.75 21
0.5
0
0.5
1
1.5
Two-span single-pierFive-pierTwo-span single-pierFive-pier
Time (sec)
Dis
plac
emen
t (in
)
Displacement Time History
0 0.25 0.5 0.75 1 1.25 1.5 1.75 22000
1500
1000
500
0
500
1000
1500
Time (sec)
Mom
ent (
kip-
ft)
0 0.25 0.5 0.75 1 1.25 1.5 1.75 275
50
25
0
25
50
75
100
125
Time (sec)
Forc
e (k
ips)
Figure C-2. Case 3 AASHTO curve coupled analysis output comparison at pier column top.
78
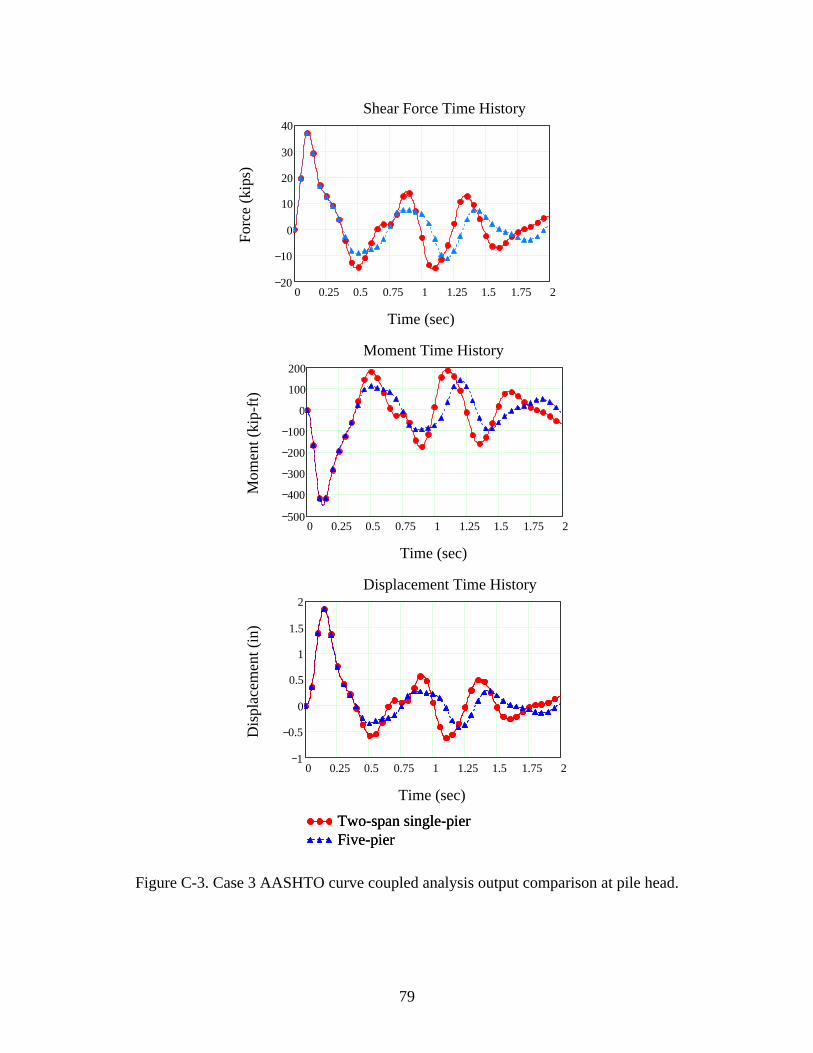
0 0.25 0.5 0.75 1 1.25 1.5 1.75 220
10
0
10
20
30
40
Time (sec)
Forc
e (k
ips)
Shear Force Time History
0 0.25 0.5 0.75 1 1.25 1.5 1.75 2500
400
300
200
100
0
100
200
Time (sec)
Mom
ent (
kip-
ft)
Moment Time History
0 0.25 0.5 0.75 1 1.25 1.5 1.75 21
0.5
0
0.5
1
1.5
2
Two-span single-pierFive-pierTwo-span single-pierFive-pier
Time (sec)
Dis
plac
emen
t (in
)
Displacement Time History
Figure C-3. Case 3 AASHTO curve coupled analysis output comparison at pile head.
79
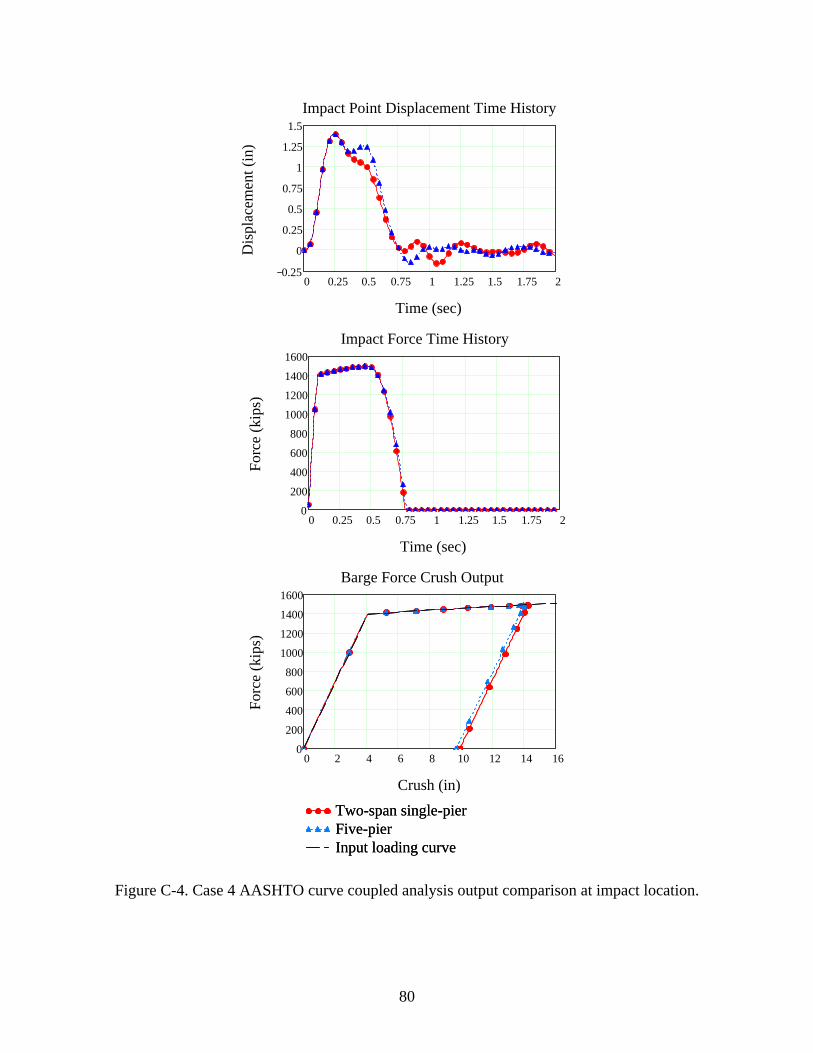
0 0.25 0.5 0.75 1 1.25 1.5 1.75 20.25
0
0.25
0.5
0.75
1
1.25
1.5
Time (sec)
Dis
plac
emen
t (in
)
Impact Point Displacement Time History
0 0.25 0.5 0.75 1 1.25 1.5 1.75 20
200
400
600
800
1000
1200
1400
1600
Time (sec)
Forc
e (k
ips)
Impact Force Time History
0 2 4 6 8 10 12 14 160
200
400
600
800
1000
1200
1400
1600
Two-span single-pierFive-pierInput loading curve
Two-span single-pierFive-pierInput loading curve
Crush (in)
Forc
e (k
ips)
Barge Force Crush Output
Figure C-4. Case 4 AASHTO curve coupled analysis output comparison at impact location.
80
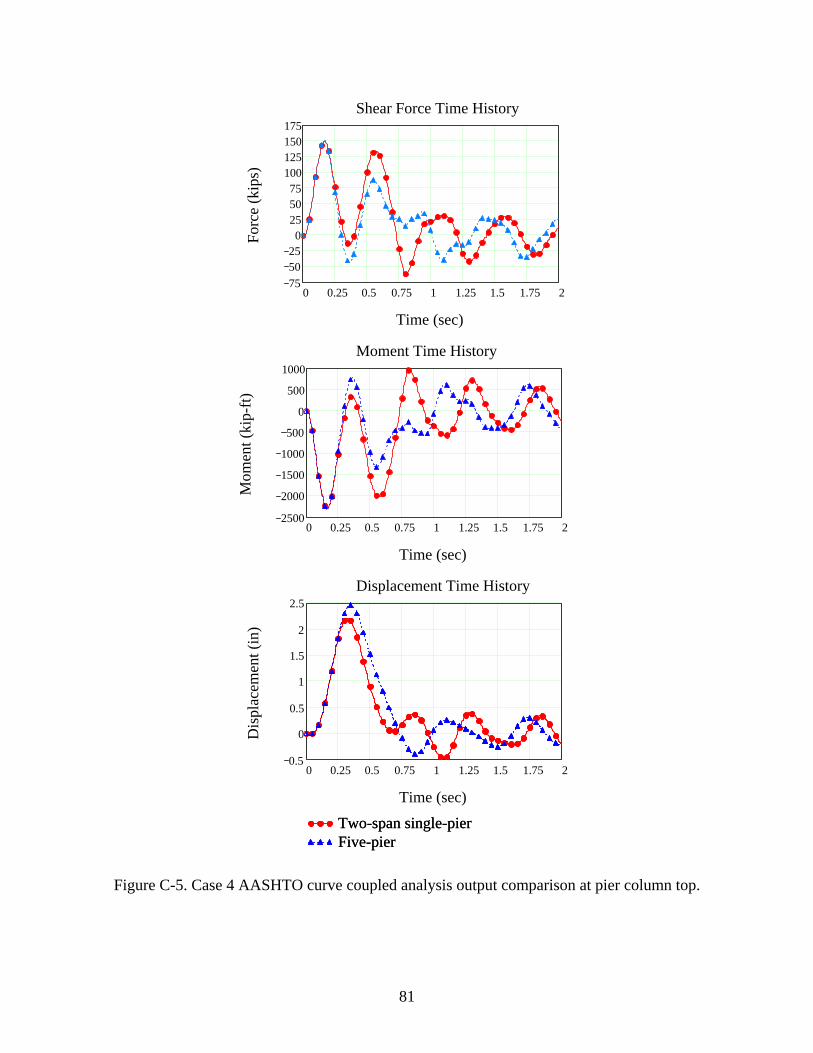
0 0.25 0.5 0.75 1 1.25 1.5 1.75 2755025
0255075
100125150175
Time (sec)
Forc
e (k
ips)
Shear Force Time History
0 0.25 0.5 0.75 1 1.25 1.5 1.75 22500
2000
1500
1000
500
0
500
1000
Time (sec)
Mom
ent (
kip-
ft)
Moment Time History
0 0.25 0.5 0.75 1 1.25 1.5 1.75 20.5
0
0.5
1
1.5
2
2.5
Two-span single-pierFive-pierTwo-span single-pierFive-pier
Time (sec)
Dis
plac
emen
t (in
)
Displacement Time History
Figure C-5. Case 4 AASHTO curve coupled analysis output comparison at pier column top.
81

0 0.25 0.5 0.75 1 1.25 1.5 1.75 210
0
10
20
30
40
50
60
Time (sec)
Forc
e (k
ips)
Shear Force Time History
0 0.25 0.5 0.75 1 1.25 1.5 1.75 2600
500
400
300
200
100
0
100
Time (sec)
Mom
ent (
kip-
ft)
Moment Time History
0 0.25 0.5 0.75 1 1.25 1.5 1.75 20.25
0
0.25
0.5
0.75
1
1.25
Two-span single-pierFive-pierTwo-span single-pierFive-pier
Time (sec)
Dis
plac
emen
t (in
)
Displacement Time History
Figure C-6. Case 4 AASHTO curve coupled analysis output comparison at pile head.
82
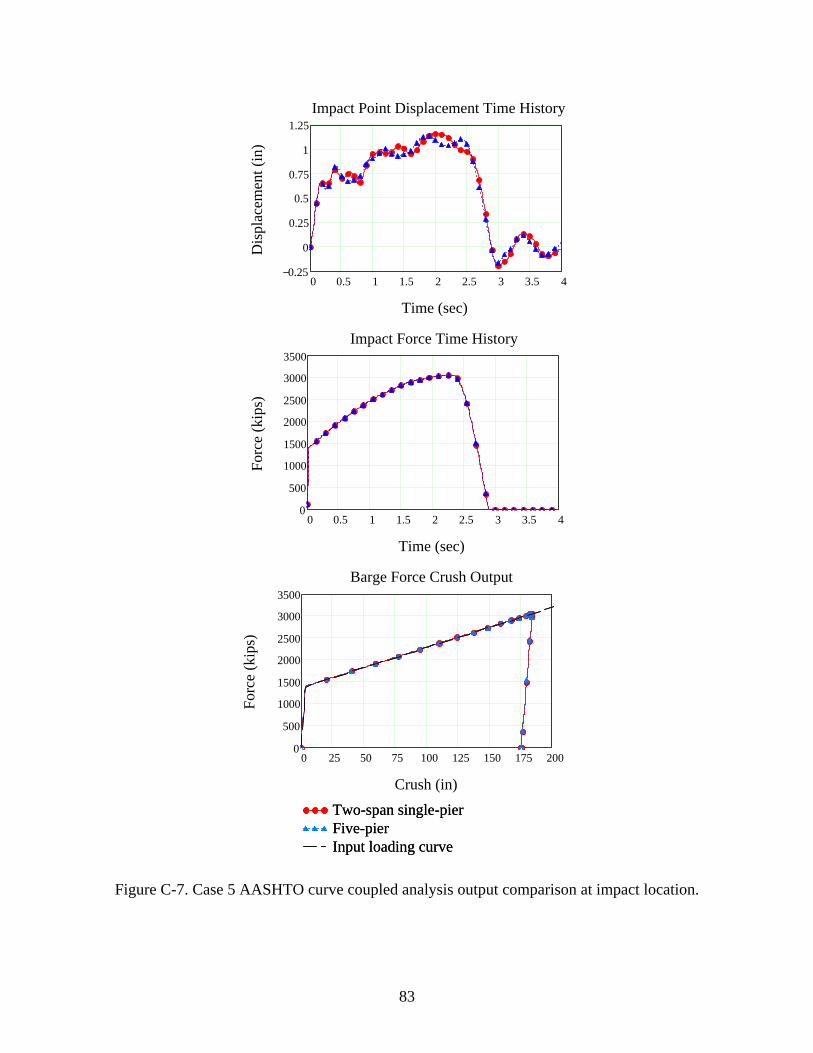
0 25 50 75 100 125 150 175 2000
500
1000
1500
2000
2500
3000
3500
Two-span single-pierFive-pierInput loading curve
Two-span single-pierFive-pierInput loading curve
Crush (in)
Forc
e (k
ips)
0 0.5 1 1.5 2 2.5 3 3.5 40
500
1000
1500
2000
2500
3000
3500
Time (sec)
Forc
e (k
ips)
0 0.5 1 1.5 2 2.5 3 3.5 40.25
0
0.25
0.5
0.75
1
1.25
Time (sec)
Dis
plac
emen
t (in
)
Impact Point Displacement Time History
Impact Force Time History
Barge Force Crush Output
Figure C-7. Case 5 AASHTO curve coupled analysis output comparison at impact location.
83
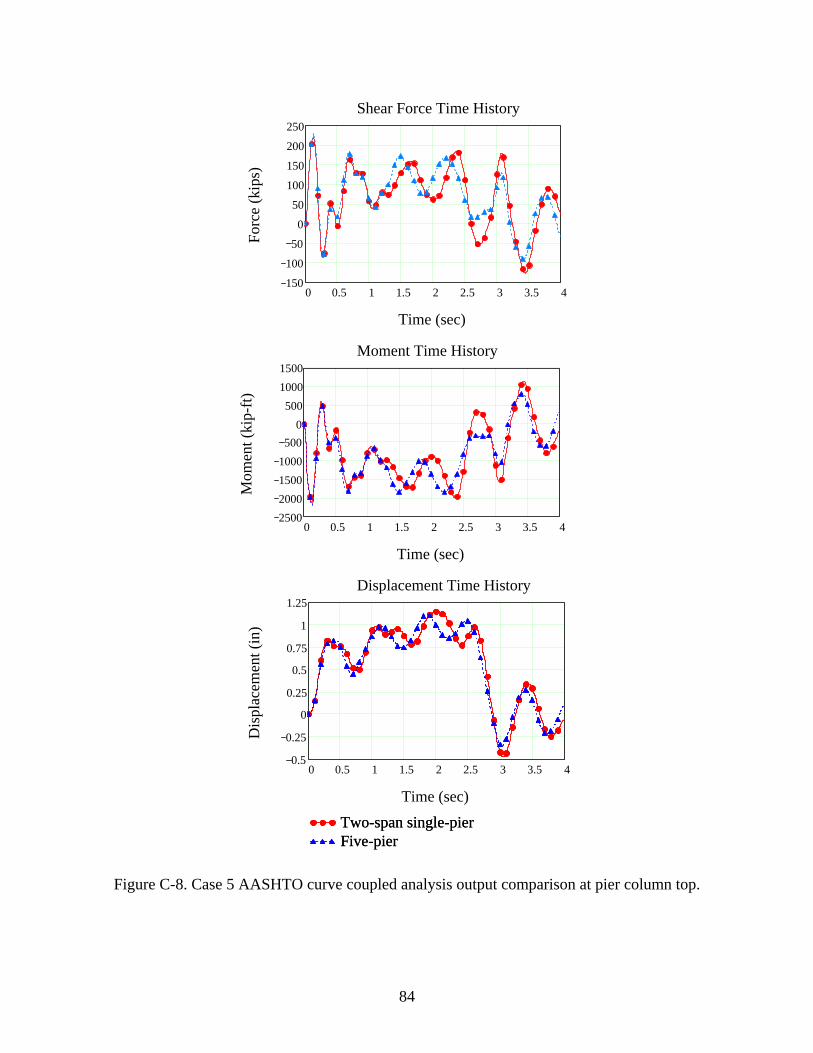
0 0.5 1 1.5 2 2.5 3 3.5 4150
100
50
0
50
100
150
200
250
Time (sec)
Forc
e (k
ips)
Shear Force Time History
0 0.5 1 1.5 2 2.5 3 3.5 42500200015001000500
0500
10001500
Time (sec)
Mom
ent (
kip-
ft)
Moment Time History
0 0.5 1 1.5 2 2.5 3 3.5 40.5
0.25
0
0.25
0.5
0.75
1
1.25
Two-span single-pierFive-pierTwo-span single-pierFive-pier
Time (sec)
Dis
plac
emen
t (in
)
Displacement Time History
Figure C-8. Case 5 AASHTO curve coupled analysis output comparison at pier column top.
84
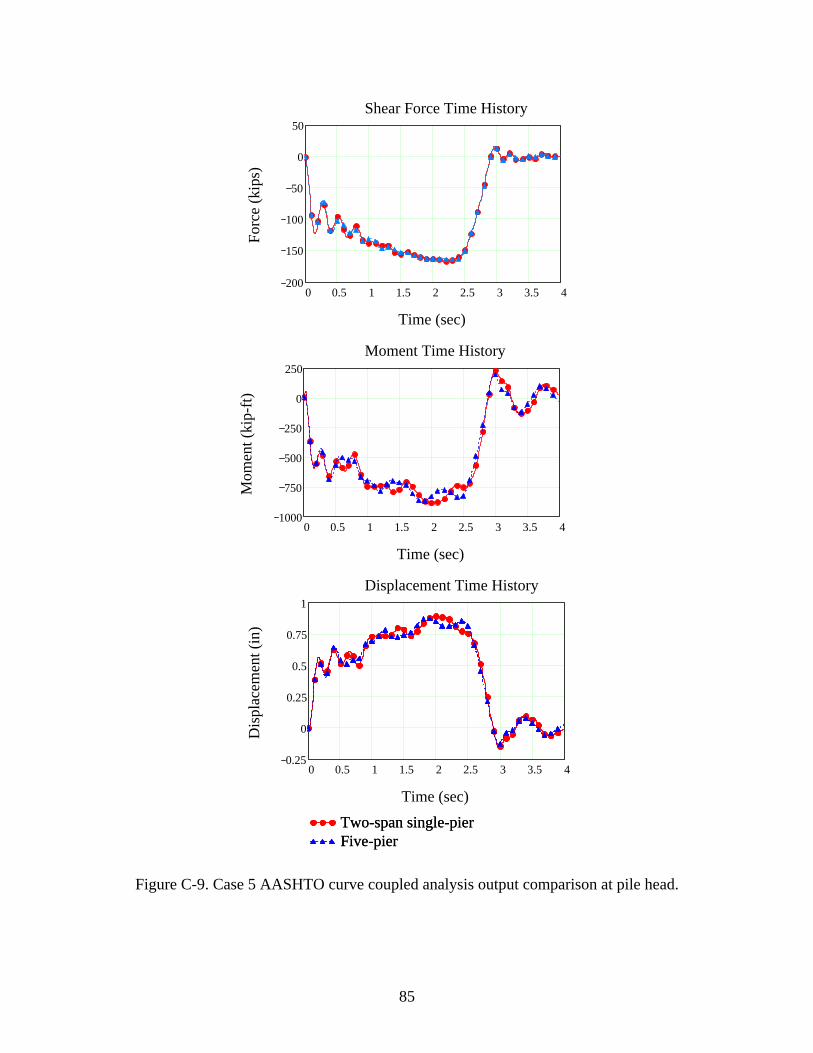
0 0.5 1 1.5 2 2.5 3 3.5 4200
150
100
50
0
50
Time (sec)
Forc
e (k
ips)
Shear Force Time History
0 0.5 1 1.5 2 2.5 3 3.5 41000
750
500
250
0
250
Time (sec)
Mom
ent (
kip-
ft)
Moment Time History
0 0.5 1 1.5 2 2.5 3 3.5 40.25
0
0.25
0.5
0.75
1
Two-span single-pierFive-pierTwo-span single-pierFive-pier
Time (sec)
Dis
plac
emen
t (in
)
Displacement Time History
Figure C-9. Case 5 AASHTO curve coupled analysis output comparison at pile head.
85
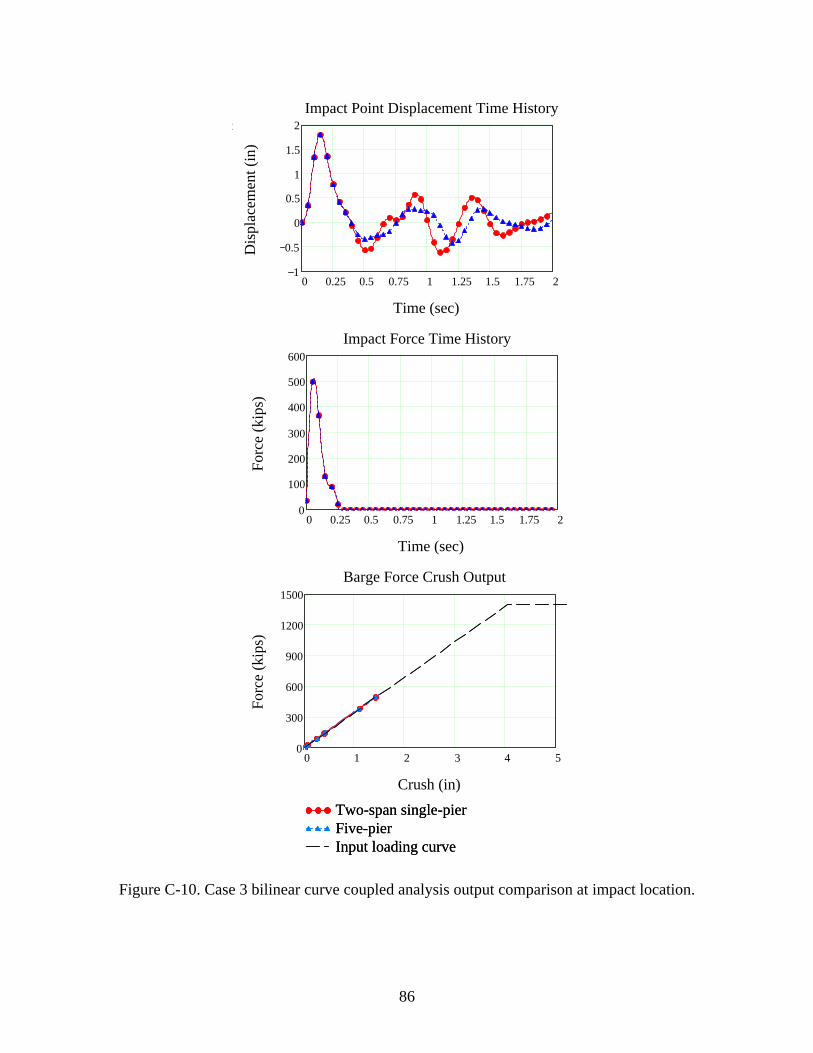
2
0 0.25 0.5 0.75 1 1.25 1.5 1.75 21
0.5
0
0.5
1
1.5
2
Time (sec)
Dis
plac
emen
t (in
)
Impact Point Displacement Time History
0 0.25 0.5 0.75 1 1.25 1.5 1.75 20
100
200
300
400
500
600
Time (sec)
Forc
e (k
ips)
Impact Force Time History
0 1 2 3 4 50
300
600
900
1200
1500
Two-span single-pierFive-pierInput loading curve
Two-span single-pierFive-pierInput loading curve
Crush (in)
Forc
e (k
ips)
Barge Force Crush Output
Figure C-10. Case 3 bilinear curve coupled analysis output comparison at impact location.
86
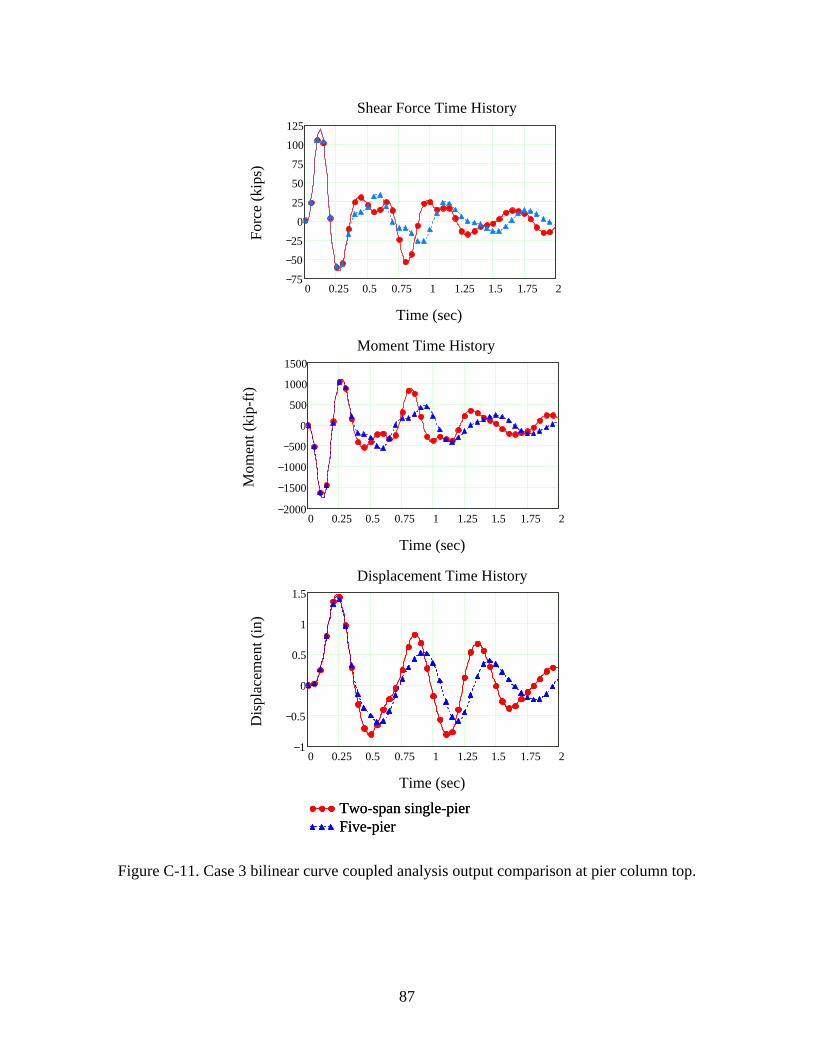
Shear Force Time History
Moment Time History
0 0.25 0.5 0.75 1 1.25 1.5 1.75 21
0.5
0
0.5
1
1.5
Two-span single-pierFive-pierTwo-span single-pierFive-pier
Time (sec)
Dis
plac
emen
t (in
)
Displacement Time History
0 0.25 0.5 0.75 1 1.25 1.5 1.75 22000
1500
1000
500
0
500
1000
1500
Time (sec)
Mom
ent (
kip-
ft)
0 0.25 0.5 0.75 1 1.25 1.5 1.75 275
50
25
0
25
50
75
100
125
Time (sec)
Forc
e (k
ips)
Figure C-11. Case 3 bilinear curve coupled analysis output comparison at pier column top.
87
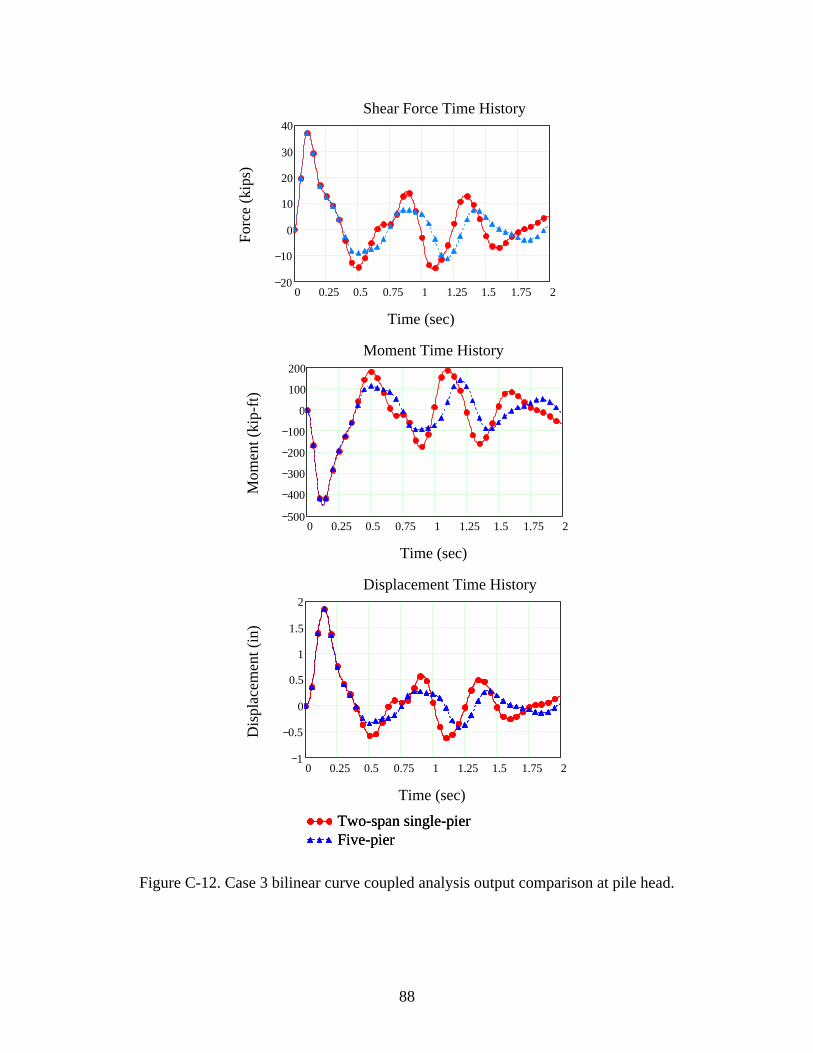
0 0.25 0.5 0.75 1 1.25 1.5 1.75 220
10
0
10
20
30
40
Time (sec)
Forc
e (k
ips)
Shear Force Time History
0 0.25 0.5 0.75 1 1.25 1.5 1.75 2500
400
300
200
100
0
100
200
Time (sec)
Mom
ent (
kip-
ft)
Moment Time History
0 0.25 0.5 0.75 1 1.25 1.5 1.75 21
0.5
0
0.5
1
1.5
2
Two-span single-pierFive-pierTwo-span single-pierFive-pier
Time (sec)
Dis
plac
emen
t (in
)
Displacement Time History
Figure C-12. Case 3 bilinear curve coupled analysis output comparison at pile head.
88
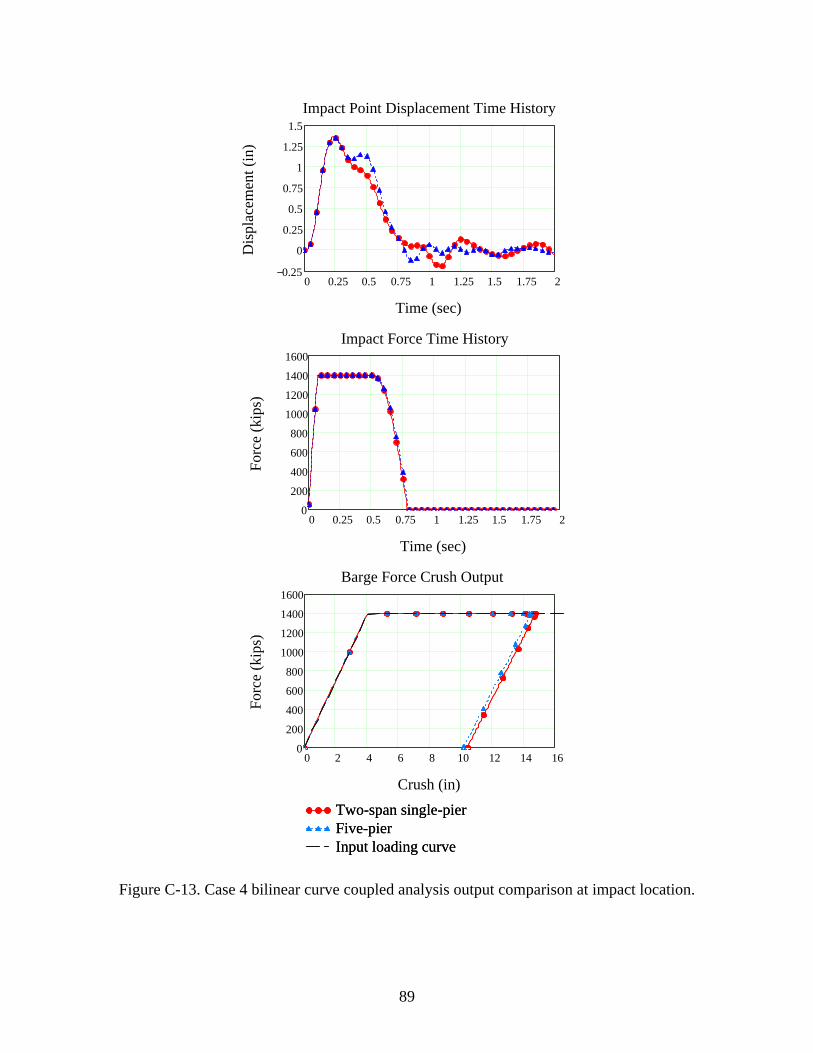
0 0.25 0.5 0.75 1 1.25 1.5 1.75 20.25
0
0.25
0.5
0.75
1
1.25
1.5
Time (sec)
Dis
plac
emen
t (in
)
Impact Point Displacement Time History
0 0.25 0.5 0.75 1 1.25 1.5 1.75 20
200
400
600
800
1000
1200
1400
1600
Time (sec)
Forc
e (k
ips)
Impact Force Time History
0 2 4 6 8 10 12 14 160
200
400
600
800
1000
1200
1400
1600
Two-span single-pierFive-pierInput loading curve
Two-span single-pierFive-pierInput loading curve
Crush (in)
Forc
e (k
ips)
Barge Force Crush Output
Figure C-13. Case 4 bilinear curve coupled analysis output comparison at impact location.
89

0 0.25 0.5 0.75 1 1.25 1.5 1.75 2100
50
0
50
100
150
Time (sec)
Forc
e (k
ips)
Shear Force Time History
0 0.25 0.5 0.75 1 1.25 1.5 1.75 22500200015001000500
0500
10001500
Time (sec)
Mom
ent (
kip-
ft)
Moment Time History
0 0.25 0.5 0.75 1 1.25 1.5 1.75 21
0.5
0
0.5
1
1.5
2
2.5
Two-span single-pierFive-pierTwo-span single-pierFive-pier
Time (sec)
Dis
plac
emen
t (in
)
Displacement Time History
Figure C-14. Case 4 bilinear curve coupled analysis output comparison at pier column top.
90
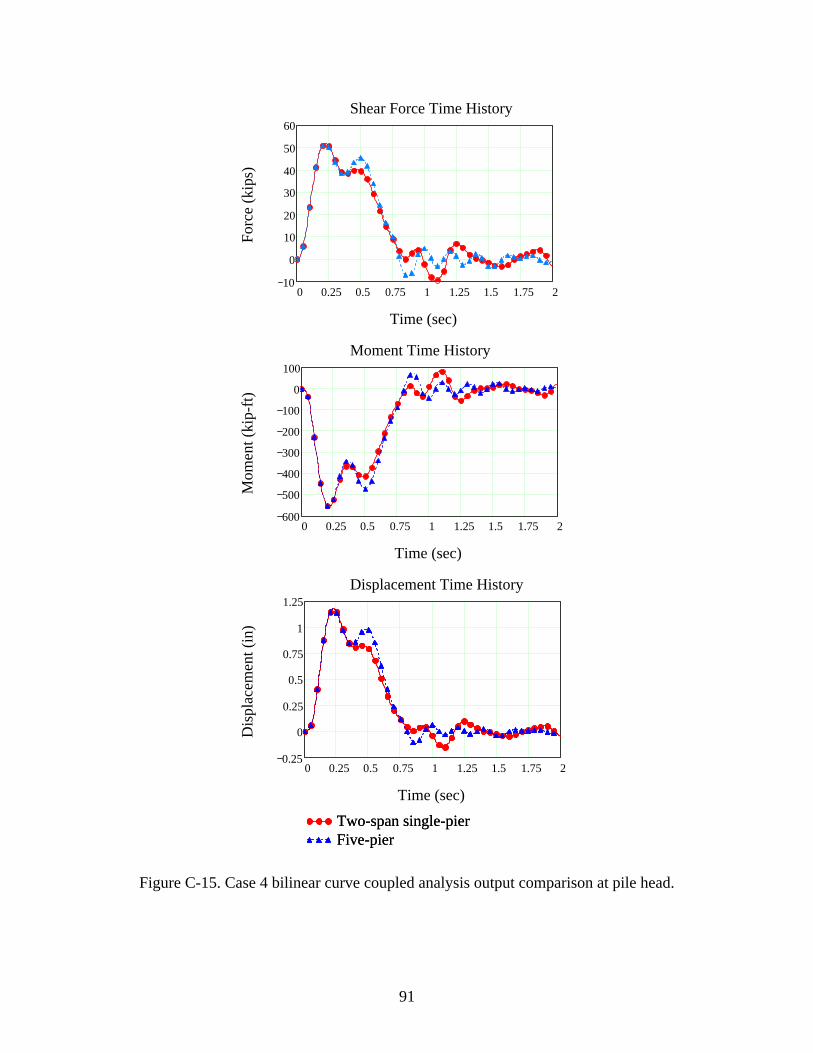
0 0.25 0.5 0.75 1 1.25 1.5 1.75 210
0
10
20
30
40
50
60
Time (sec)
Forc
e (k
ips)
Shear Force Time History
0 0.25 0.5 0.75 1 1.25 1.5 1.75 2600
500
400
300
200
100
0
100
Time (sec)
Mom
ent (
kip-
ft)
Moment Time History
0 0.25 0.5 0.75 1 1.25 1.5 1.75 20.25
0
0.25
0.5
0.75
1
1.25
Two-span single-pierFive-pierTwo-span single-pierFive-pier
Time (sec)
Dis
plac
emen
t (in
)
Displacement Time History
Figure C-15. Case 4 bilinear curve coupled analysis output comparison at pile head.
91
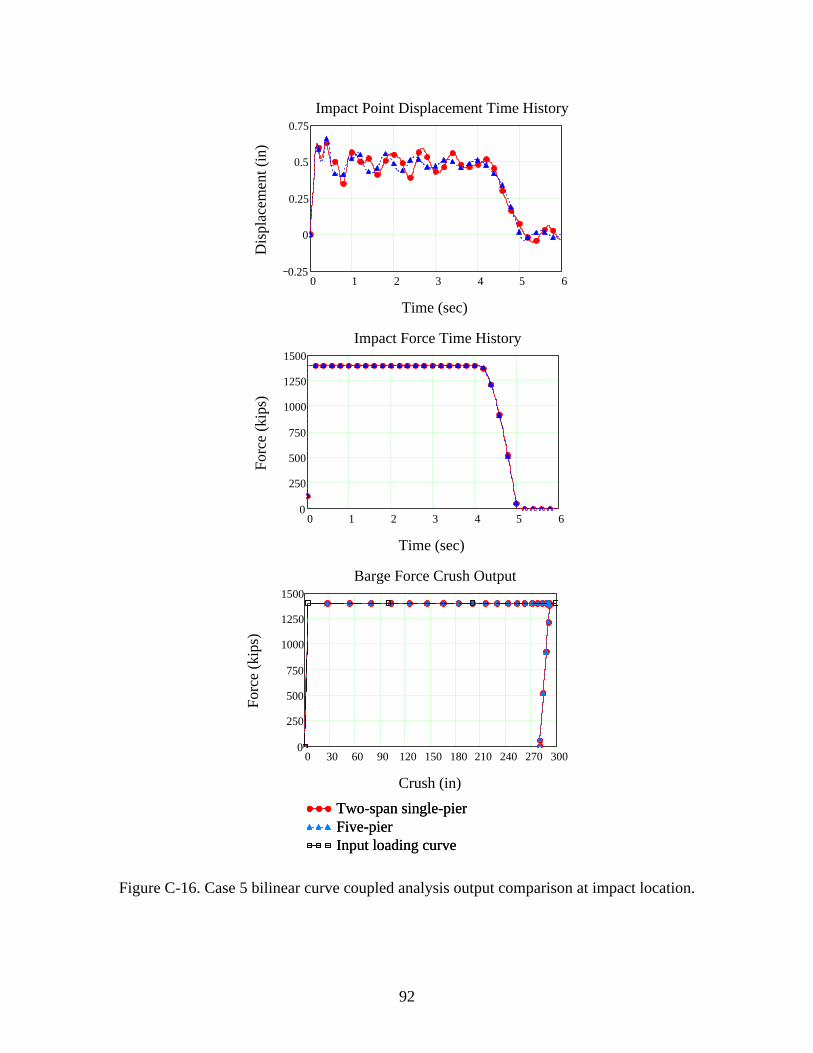
0 30 60 90 120 150 180 210 240 270 3000
250
500
750
1000
1250
1500
Two-span single-pierFive-pierInput loading curve
Two-span single-pierFive-pierInput loading curve
Crush (in)
Forc
e (k
ips)
0 1 2 3 4 5 60
250
500
750
1000
1250
1500
Time (sec)
Forc
e (k
ips)
0 1 2 3 4 5 60.25
0
0.25
0.5
0.75
Time (sec)
Dis
plac
emen
t (in
)
Impact Point Displacement Time History
Impact Force Time History
Barge Force Crush Output
Figure C-16. Case 5 bilinear curve coupled analysis output comparison at impact location.
92
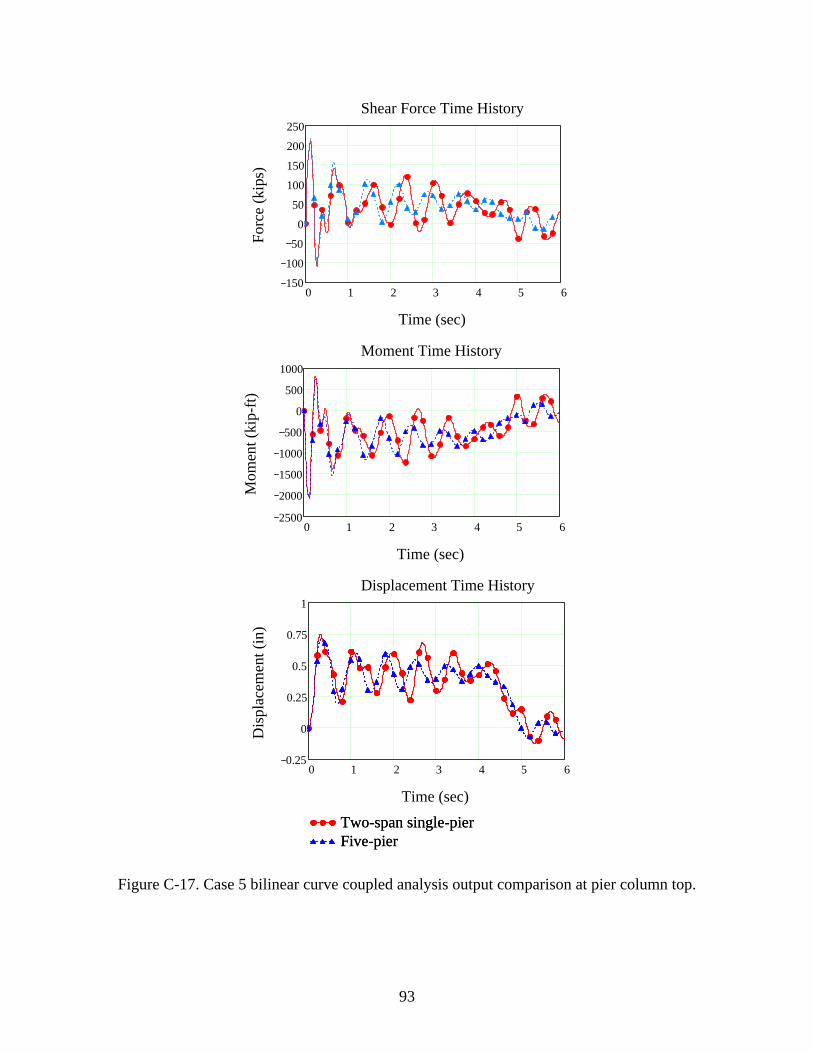
0 1 2 3 4 5 6150
100
50
0
50
100
150
200
250
Time (sec)
Forc
e (k
ips)
Shear Force Time History
0 1 2 3 4 5 62500
2000
1500
1000
500
0
500
1000
Time (sec)
Mom
ent (
kip-
ft)
Moment Time History
0 1 2 3 4 5 60.25
0
0.25
0.5
0.75
1
Two-span single-pierFive-pierTwo-span single-pierFive-pier
Time (sec)
Dis
plac
emen
t (in
)
Displacement Time History
Figure C-17. Case 5 bilinear curve coupled analysis output comparison at pier column top.
93
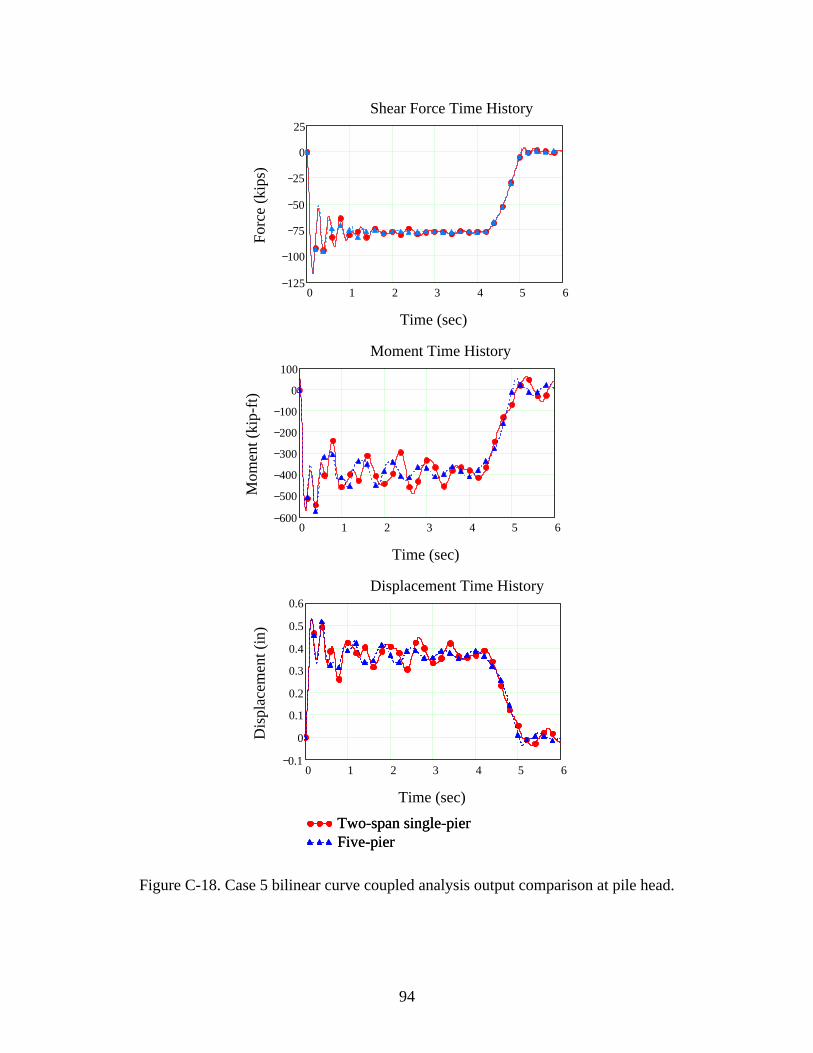
0 1 2 3 4 5 6125
100
75
50
25
0
25
Time (sec)
Forc
e (k
ips)
Shear Force Time History
0 1 2 3 4 5 6600
500
400
300
200
100
0
100
Time (sec)
Mom
ent (
kip-
ft)
Moment Time History
0 1 2 3 4 5 60.1
0
0.1
0.2
0.3
0.4
0.5
0.6
Two-span single-pierFive-pierTwo-span single-pierFive-pier
Time (sec)
Dis
plac
emen
t (in
)
Displacement Time History
Figure C-18. Case 5 bilinear curve coupled analysis output comparison at pile head.
94
APPENDIX D ENERGY EQUIVALENT AASHTO IMPACT CALCULATIONS
The new St. George Island Bridge was designed and constructed after the AASHTO vessel collision specifications went in effect, hence, the piers of this bridge were designed to resist barge impact loading. Furthermore, pier impact load data was contained within the bridge plans used to develop the numerical model for Case 5 of this thesis. The initial kinetic energy specified in the Case 5 coupled analyses was derived from the known design impact load and pertinent equations found in AASHTO. Conversely, energy-equivalent static AASHTO impact loads are calculated from the kinetic energies employed in Case 3 and Case 4. The barge width modification factor is 1.0 in the following calculations as a jumbo-hopper is selected as the impacting vessel in all demonstration cases.
95

Back calculation of AASHTO impact force using Case 3 Impact Energy
The Old St. George Island Bridge Pier 3-S was subject to an impact energy consisting of:
Barge weight
W 1.78 MN⋅:= W 200.08T= W 181.478 tonne=
Barge velocity
V 1.03ms
:= V 2.002knot= V 3.379fts
=
Assume a hydrodynamic mass coefficient of Ch 1.05:=
Impact energy
KE12
Ch W⋅g
⋅ V2⋅:= KE 74.564kip ft⋅= KE 0.101MN m⋅=
From the American Association of State and Highway Transportation Officials (AASHTO) GuideSpecification and Commentary for Vessel Collision Design of Highway Bridges , the equations forbarge crush depth and kinetic energy associated with impact are:
Barge crush depth:
abKE
56721+⎛⎜
⎝⎞⎟⎠
0.51−
⎡⎢⎣
⎤⎥⎦
10.2⋅:= ab 0.067= ft
The energy equivalent AASHTO static impact force is:
Pb Pb 1349 110 ab⋅+( )← ab 0.34≥if
Pb 4112ab← ab 0.34<if
Pbreturn
:=
Pb 274.787= kip
96

Back calculation of AASHTO impact force using Case 4 Impact Energy
The Escambia Bay Bridge Pier 1-E was subject to an impact energy consisting of:
Barge weight
W 18 MN⋅:= W 2.023 103× T= W 1.835 103
× tonne=
Barge velocity
V 1.54ms
:= V 2.994knot= V 5.052fts
=
Assume a hydrodynamic mass coefficient of Ch 1.05:=
Impact energy
KE12
Ch W⋅g
⋅ V2⋅:= KE 1.686 103
× kip ft⋅= KE 2.285MN m⋅=
From the American Association of State and Highway Transportation Officials (AASHTO) GuideSpecification and Commentary for Vessel Collision Design of Highway Bridges , the equations forbarge crush depth and kinetic energy, and barge width associated with impact are:
Barge crush depth:
abKE
56721+⎛⎜
⎝⎞⎟⎠
0.51−
⎡⎢⎣
⎤⎥⎦
10.2⋅:= ab 1.417= ft
The energy equivalent AASHTO static impact force is:
Pb Pb 1349 110 ab⋅+← ab 0.34≥if
Pb 4112ab← ab 0.34<if
Pbreturn
:=
Pb 1.505 103×= kip
97

Back calculation of Case 5 impact energy using AASHTO impact force
From bridge plans of the New St. George Island Bridge Channel Pier, the design impact load is:
Pb 3255:= kips
From the American Association of State and Highway Transportation Officials (AASHTO) GuideSpecification and Commentary for Vessel Collision Design of Highway Bridges , the equations forbarge crush depth and kinetic energy associated with impact are:
Barge crush depth:
ab abPb 1349−
110←
Pb 1349−110
0.34≥if
abPb
4112←
Pb4112
0.34<if
abreturn
:=
ab 17.327= ft
Kinetic energy associated with impact:
KEab
10.21+⎛⎜
⎝⎞⎟⎠
21−
⎡⎢⎣
⎤⎥⎦
5672⋅:= KE 3.564 104×= kip-ft
Define flotilla design velocity as a function of Hydrodynamic Mass Coefficient and Flotilla weight (tonnes)
V CH W,( ) KE 29.2⋅CH W⋅
⎛⎜⎝
⎞⎟⎠
0.5:=
Assume Hydrodynamic Mass Coefficient is 1.05.
Define weight of barge as a function of the number of barges in the flotilla; assume towboat weighs 120 tons (US, short)
W n( )n 1700 200+( )⋅ 120+
1.102311311:=
98

Back calculation of Case 5 impact energy using AASHTO impact force(Cont'd)
Try using four fully loaded Jumbo Hopper barges and check that the accompanying velocity is attainable within the waterway.
The weight of four fully loaded Jumbo Hopper barges and the tow boat is:
W 4( ) 7.003 103×= tonnes
The velocity of the flotilla, necessary to generate a static impact load of 3255 kips is:
V 1.05 W 4( ),( ) 11.896= ft/sec
Conclusion: the four barge flotilla is a reasonable number of barges for use in a single column flotilla in the southeastern United States, and 11.896 ft/sec is an attainable speed in the St. George Island waterway as typical traveling speeds are: 10.13 ft/sec (Consolazio et al. 2002).
99
REFERENCES
AASHTO. (1991). Guide Specification and Commentary for Vessel Collision Design of Highway Bridges, American Association of State Highway and Transportation Officials, Washington, D.C.
Arroyo, J. R., Ebeling, R. M., and Barker, B. C. (2003). “Analysis of Impact Loads from Full-Scale Low-Velocity, Controlled Barge Impact Experiments, December 1998.” US Army Corps of Engineers Report ERDC/ITL TR-03-3, 2003.
Consolazio, G. R., Cook, R. A., and Lehr, G. B. (2002). “Barge Impact Testing of the St. George Island Causeway Bridge Phase I : Feasibility Study.” Structures Research Report No. 783, Engineering and Industrial Experiment Station. University of Florida, Gainesville, Florida, January.
Consolazio, G. R. and Cowan, D. R. (2003). “Nonlinear Analysis of Barge Crush Behavior and its Relationship to Impact Resistant Bridge Design.” Computers and Structures, Vol. 81, Nos.8-11, pp. 547-557.
Consolazio, G. R., Lehr, G. B., and McVay, M. C. (2004a). “Dynamic Finite Element Analysis of Vessel-Pier-Soil Interaction During Barge Impact Events.” Transportation Research Record: Journal of the Transportation Research Board. No. 1849, Washington, D.C., pp. 81-90.
Consolazio, G. R., Hendrix, J. L., McVay, M. C., Williams, M. E., and Bollman, H. T. (2004b). “Prediction of Pier Response to Barge Impacts Using Design-Oriented Dynamic Finite Element Analysis.” Transportation Research Record: Journal of the Transportation Research Board. No. 1868, Washington, D.C., pp. 177-189.
Consolazio, G. R. and Cowan, D. R. (2005). “Numerically Efficient Dynamic Analysis of Barge Collisions with Bridge Piers.” ASCE Journal of Structural Engineering, ASCE, Vol. 131, No. 8, pp. 1256-1266.
Consolazio, G. R., Cook, R. A., and McVay, M. C. (2006). “Barge Impact Testing of the St. George Island Causeway Bridge”, Structures Research Report No. 2006/26868, Engineering and Industrial Experiment Station, University of Florida, Gainesville, Florida, March.
FB-MULTIPIER User’s Manual. (2007). Florida Bridge Software Institute, University of Florida, Gainesville, Florida.
FB-PIER User’s Manual. (2003). Florida Bridge Software Institute, University of Florida, Gainesville, Florida.
Goble, G., Schulz, J., and Commander, B. (1990). Lock and Dam #26 Field Test Report for The Army Corps of Engineers, Bridge Diagnostics Inc., Boulder, CO.
100

Hendrix, J. L. (2003). “Dynamic Analysis Techniques for Quantifying Bridge Pier Response to Barge Impact Loads.” Masters Thesis, Department of Civil and Coastal Engineering, Univ. of Florida, Gainesville, Fla.
Larsen, O. D. (1993). “Ship Collision with Bridges: The Interaction between Vessel Traffic and Bridge Structures.” IABSE Structural Engineering Document 4, IABSE
Knott, M., and Prucz, Z. (2000). Vessel Collision Design of Bridges: Bridge Engineering Handbook, CRC Press LLC.
Meier-Dörnberg, K. E. (1983). “Ship Collisions, Safety Zones, and Loading Assumptions for Structures in Inland Waterways.” Verein Deutscher Ingenieure (Association of German Engineers) Report No. 496, 1983, pp. 1-9.
McVay, M. C., Wasman, S. J., Bullock, P. J. (2005). St. George Geotechnical Investigation of Vessel Pier Impact, Engineering and Industrial Experiment Station, University of Florida, Gainesville, Florida.
Patev, R. C., Barker, B. C., and Koestler, L. V., III. (2003). “Full-Scale Barge Impact Experiments, Robert C. Byrd Lock and Dam, Gallipolis Ferry, West Virginia.” United States Army Corps of Engineers Report ERDC/ITL TR-03-7, December.
Yuan, P. (2005). “Modeling, Simulation and Analysis of Multi-Barge Flotillas Impacting Bridge Piers.” PhD dissertation, Dept. of Civil Engineering, Univ. of Kentucky, Lexington, Ky.
101

BIOGRAPHICAL SKETCH
Michael Davidson was born in Louisville, Kentucky. He enrolled at the University of
Kentucky in August 2000. After being awarded the National Science Foundation Graduate
Research Fellowship and obtaining his Bachelor of Science in civil engineering from the
University of Kentucky (summa cum laude) in May 2005, he began graduate school at the
University of Florida in the College of Engineering, Department of Civil and Coastal
Engineering. The author will receive his Master of Science degree in August 2007, with a
concentration in structural engineering. Upon graduation, the author will continue his education
at the University of Florida, ultimately earning a degree of Doctor of Philosophy with a
specialization in structural engineering.
102