Embed Size (px)
Citation preview
C A L A B A R Z O N R E G I O N A L R E S U L T S M A T R I C E S | ii
C A L A B A R Z O N R E G I O N A L R E S U L T S M A T R I C E S | iii
The pursuit for development
results necessitates the collaboration
of all sectors of society, i.e. the line
agencies, government and controlled
corporations (GOCCs), local
government units (LGUs), private
sector and the civil society
organizations (CSOs). As such, the Calabarzon Regional
Development (RDP) was prepared in a participatory
manner involving representatives from all stakeholders.
The Updated RDP Results Matrices (RM) is a
companion document of the Calabarzon RDP that serves
as a common reference to effectively pursue the
collaboration towards the development of the region. The
RM provides an easy reference for the stakeholders to
track progress in the achievement of the RDP targets.
The RM provides objective trees and indicator
framework corresponding to the chapters of the RDP. The
objective trees illustrate the means-ends relationship
between the strategic framework of the Plan with its
development objectives. The indicator framework for the
strategies, programs and projects identified in the
chapters of the RDP facilitates the tracking of gains
achieved during plan implementation.
The Calabarzon RM follows the objectives trees of
the PDP RM as the two plans are aligned. It also indicates
the quantitative targets that address the Key Result Areas
of the President’s 16-point Agenda.
In collaboration with the line and statistical
agencies, the RM will be enhanced annually. It shall be the
basis for the annual agency and RDC regional
development report.
LUIS G. BANUA
Vice-Chairperson
Regional Development Council
Picture of
Dir. LGB
Foreword
C A L A B A R Z O N R E G I O N A L R E S U L T S M A T R I C E S | iv
Acknowledgement The RDC Secretariat would like to acknowledge the
assistance of the focal persons of the line and statistical
agencies, GOCCs, SUCs and constitutional commissions for
their inputs particularly in: (a) validating the core
indicators; (b) identifying other relevant indicators for the
region; (c) setting the targets; and, (d) providing the
baseline data. The support of agency heads was crucial in
the timely submission of required output and in sharing
the needed information.
The contribution of the local planners and the
private sector representatives in validating the RM is
deeply appreciated. The questions posed during the
consultations were helpful in identifying the relevant
information needed in tracking the progress of the RDP.
The updating of the RM was expedited by the
effective facilitation of the Chairpersons and Co-
Chairpersons and active participation of the members of
the following Sectoral Committees:
Sectoral Committee on Economic Development
o Chairperson: Hon. Arlene Arcillas (Sta. Rosa City)
o Co-Chairperson: Ms. Teresita Leabres (PPCI)
Sectoral Committee on Infrastructure
Development
o Chairperson: Hon. Strike Revilla (Bacoor City)
o Co-Chairperson: Engr. Ladislao Andal (PCE)
Sectoral Committee on Macroeconomy and
Development Administration
o Chairperson: Hon. Casimiro Ynares III
(Antipolo City)
o Co-Chairperson: Mr. Eduardo Nicolas (PCCI)
Sectoral Committee on Social Development
o Chairperson: Hon. Girlie Ejercito
(Pagsanjan, Laguna)
o Co-Chairperson: Ms. Josie Parilla (PATAMABA)
C A L A B A R Z O N R E G I O N A L R E S U L T S M A T R I C E S | v
Table of Contents RDC Resolution
ii
Foreword
iii
Acknowledgement
iv
List of Acronyms
vi
Chapter I In Pursuit of Inclusive Growth
1
Chapter II Macroeconomy
4
Chapter III
Competitive Industry and Services Sectors
8
Chapter IV Competitive and Sustainable Agriculture and Fisheries Sector
19
Chapter V Accelerating Infrastructure Development
30
Chapter VI Towards a Resilient and Inclusive Financial Sector
40
Chapter VII Good Governance and the Rule of Law
43
Chapter VIII Social Development
56
Chapter IX Peace and Security
68
Chapter X Conservation, Protection and Rehabilitation of the Environment and Natural Resources
74
C A L A B A R Z O N R E G I O N A L R E S U L T S M A T R I C E S | vi
Credits 90
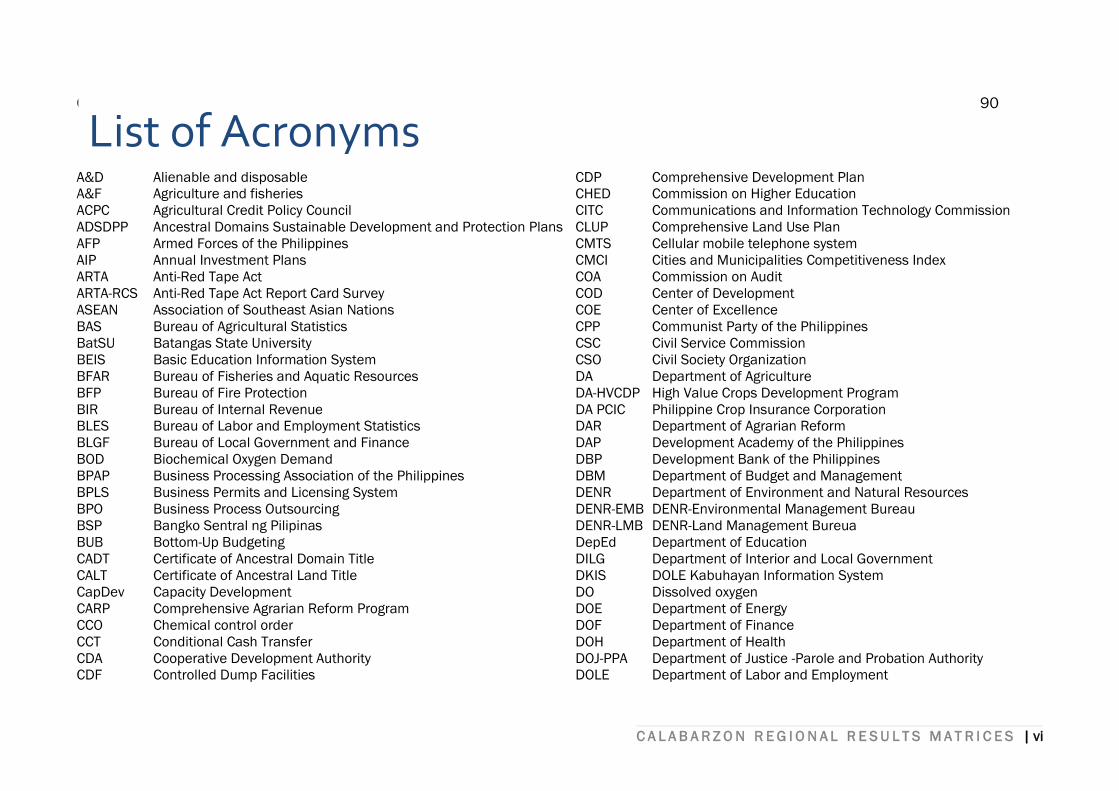
A&D
Alienable and disposable
CDP
Comprehensive Development Plan
A&F Agriculture and fisheries CHED Commission on Higher Education
ACPC Agricultural Credit Policy Council CITC Communications and Information Technology Commission
ADSDPP Ancestral Domains Sustainable Development and Protection Plans CLUP Comprehensive Land Use Plan
AFP Armed Forces of the Philippines CMTS Cellular mobile telephone system
AIP Annual Investment Plans CMCI Cities and Municipalities Competitiveness Index
ARTA Anti-Red Tape Act COA Commission on Audit
ARTA-RCS Anti-Red Tape Act Report Card Survey COD Center of Development
ASEAN Association of Southeast Asian Nations COE Center of Excellence
BAS Bureau of Agricultural Statistics CPP Communist Party of the Philippines
BatSU Batangas State University CSC Civil Service Commission
BEIS Basic Education Information System CSO Civil Society Organization
BFAR Bureau of Fisheries and Aquatic Resources DA Department of Agriculture
BFP Bureau of Fire Protection DA-HVCDP High Value Crops Development Program
BIR Bureau of Internal Revenue DA PCIC Philippine Crop Insurance Corporation
BLES Bureau of Labor and Employment Statistics DAR Department of Agrarian Reform
BLGF Bureau of Local Government and Finance DAP Development Academy of the Philippines
BOD Biochemical Oxygen Demand DBP Development Bank of the Philippines
BPAP Business Processing Association of the Philippines DBM Department of Budget and Management
BPLS Business Permits and Licensing System DENR Department of Environment and Natural Resources
BPO Business Process Outsourcing DENR-EMB DENR-Environmental Management Bureau
BSP Bangko Sentral ng Pilipinas DENR-LMB DENR-Land Management Bureua
BUB Bottom-Up Budgeting DepEd Department of Education
CADT Certificate of Ancestral Domain Title DILG Department of Interior and Local Government
CALT Certificate of Ancestral Land Title DKIS DOLE Kabuhayan Information System
CapDev Capacity Development DO Dissolved oxygen
CARP Comprehensive Agrarian Reform Program DOE Department of Energy
CCO Chemical control order DOF Department of Finance
CCT Conditional Cash Transfer DOH Department of Health
CDA Cooperative Development Authority DOJ-PPA Department of Justice -Parole and Probation Authority
CDF Controlled Dump Facilities DOLE Department of Labor and Employment
List of Acronyms
C A L A B A R Z O N R E G I O N A L R E S U L T S M A T R I C E S | vii
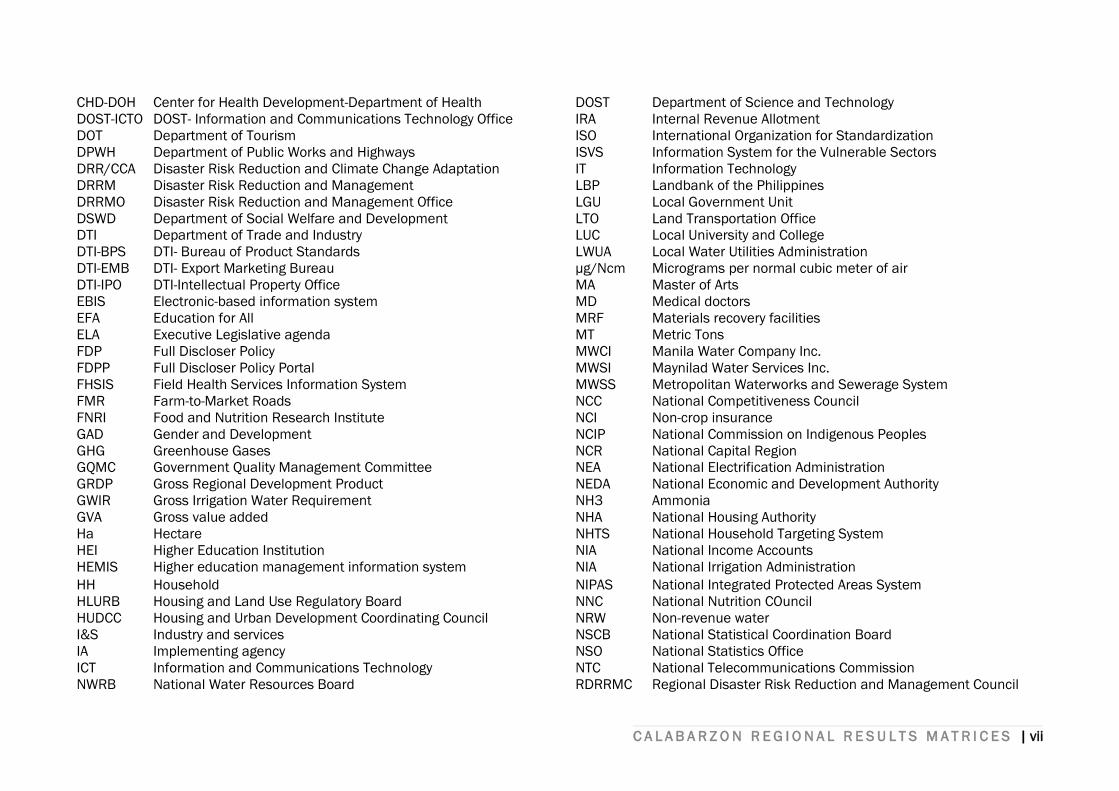
CHD-DOH Center for Health Development-Department of Health DOST Department of Science and Technology
DOST-ICTO DOST- Information and Communications Technology Office IRA Internal Revenue Allotment
DOT Department of Tourism ISO International Organization for Standardization
DPWH Department of Public Works and Highways ISVS Information System for the Vulnerable Sectors
DRR/CCA Disaster Risk Reduction and Climate Change Adaptation IT Information Technology
DRRM Disaster Risk Reduction and Management LBP Landbank of the Philippines
DRRMO Disaster Risk Reduction and Management Office LGU Local Government Unit
DSWD Department of Social Welfare and Development LTO Land Transportation Office
DTI Department of Trade and Industry LUC Local University and College
DTI-BPS DTI- Bureau of Product Standards LWUA Local Water Utilities Administration
DTI-EMB DTI- Export Marketing Bureau μg/Ncm Micrograms per normal cubic meter of air
DTI-IPO DTI-Intellectual Property Office MA Master of Arts
EBIS Electronic-based information system MD Medical doctors
EFA Education for All MRF Materials recovery facilities
ELA Executive Legislative agenda MT Metric Tons
FDP Full Discloser Policy MWCI Manila Water Company Inc.
FDPP Full Discloser Policy Portal MWSI Maynilad Water Services Inc.
FHSIS Field Health Services Information System MWSS Metropolitan Waterworks and Sewerage System
FMR Farm-to-Market Roads NCC National Competitiveness Council
FNRI Food and Nutrition Research Institute NCI Non-crop insurance
GAD Gender and Development NCIP National Commission on Indigenous Peoples
GHG Greenhouse Gases NCR National Capital Region
GQMC Government Quality Management Committee NEA National Electrification Administration
GRDP Gross Regional Development Product NEDA National Economic and Development Authority
GWIR Gross Irrigation Water Requirement NH3 Ammonia
GVA Gross value added NHA National Housing Authority
Ha Hectare NHTS National Household Targeting System
HEI Higher Education Institution NIA National Income Accounts
HEMIS Higher education management information system NIA National Irrigation Administration
HH Household NIPAS National Integrated Protected Areas System
HLURB Housing and Land Use Regulatory Board NNC National Nutrition COuncil
HUDCC Housing and Urban Development Coordinating Council NRW Non-revenue water
I&S Industry and services NSCB National Statistical Coordination Board
IA Implementing agency NSO National Statistics Office
ICT Information and Communications Technology NTC National Telecommunications Commission
NWRB National Water Resources Board RDRRMC Regional Disaster Risk Reduction and Management Council
C A L A B A R Z O N R E G I O N A L R E S U L T S M A T R I C E S | viii
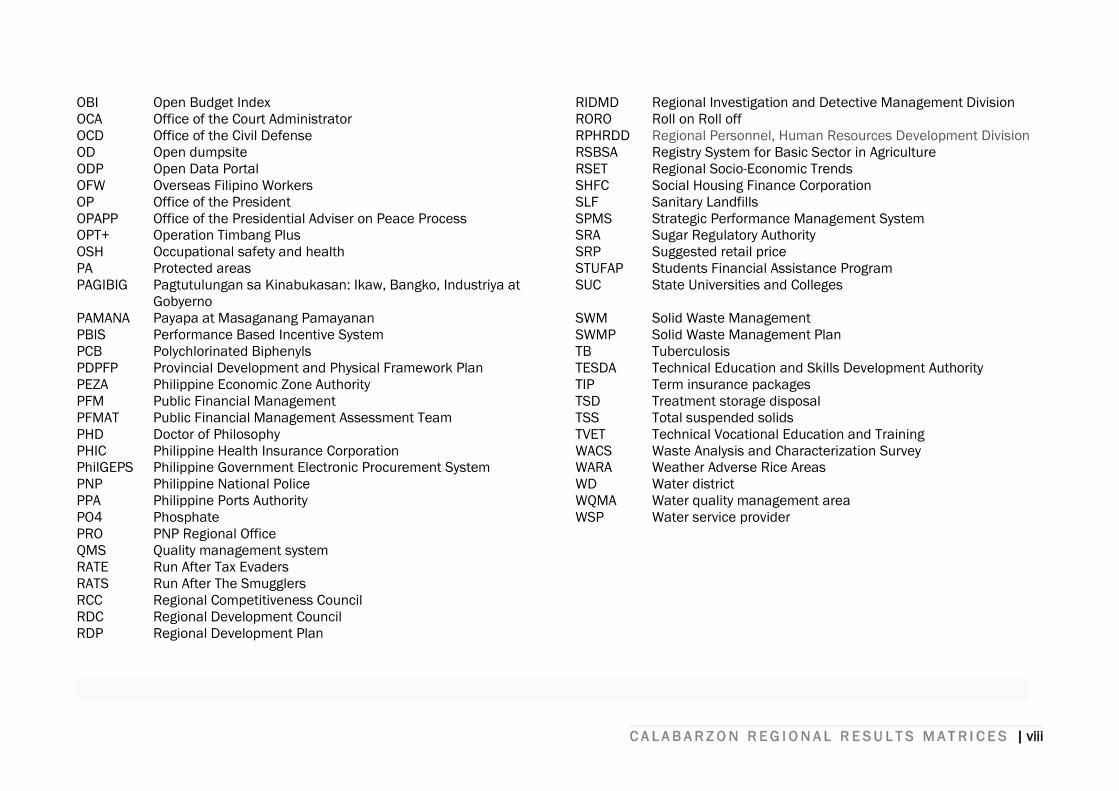
OBI Open Budget Index RIDMD Regional Investigation and Detective Management Division
OCA Office of the Court Administrator RORO Roll on Roll off
OCD Office of the Civil Defense RPHRDD Regional Personnel, Human Resources Development Division
OD Open dumpsite RSBSA Registry System for Basic Sector in Agriculture
ODP Open Data Portal RSET Regional Socio-Economic Trends
OFW Overseas Filipino Workers SHFC Social Housing Finance Corporation
OP Office of the President SLF Sanitary Landfills
OPAPP Office of the Presidential Adviser on Peace Process SPMS Strategic Performance Management System
OPT+ Operation Timbang Plus SRA Sugar Regulatory Authority
OSH Occupational safety and health SRP Suggested retail price
PA Protected areas STUFAP Students Financial Assistance Program
PAGIBIG Pagtutulungan sa Kinabukasan: Ikaw, Bangko, Industriya at
Gobyerno
SUC State Universities and Colleges
PAMANA Payapa at Masaganang Pamayanan SWM Solid Waste Management
PBIS Performance Based Incentive System SWMP Solid Waste Management Plan
PCB Polychlorinated Biphenyls TB Tuberculosis
PDPFP Provincial Development and Physical Framework Plan TESDA Technical Education and Skills Development Authority
PEZA Philippine Economic Zone Authority TIP Term insurance packages
PFM Public Financial Management TSD Treatment storage disposal
PFMAT Public Financial Management Assessment Team TSS Total suspended solids
PHD Doctor of Philosophy TVET Technical Vocational Education and Training
PHIC Philippine Health Insurance Corporation WACS Waste Analysis and Characterization Survey
PhilGEPS Philippine Government Electronic Procurement System WARA Weather Adverse Rice Areas
PNP Philippine National Police WD Water district
PPA Philippine Ports Authority WQMA Water quality management area
PO4 Phosphate WSP Water service provider
PRO PNP Regional Office
QMS Quality management system
RATE Run After Tax Evaders
RATS Run After The Smugglers
RCC Regional Competitiveness Council
RDC Regional Development Council
RDP Regional Development Plan
C A L A B A R Z O N R E G I O N A L R E S U L T S M A T R I C E S |1
CHAPTER I
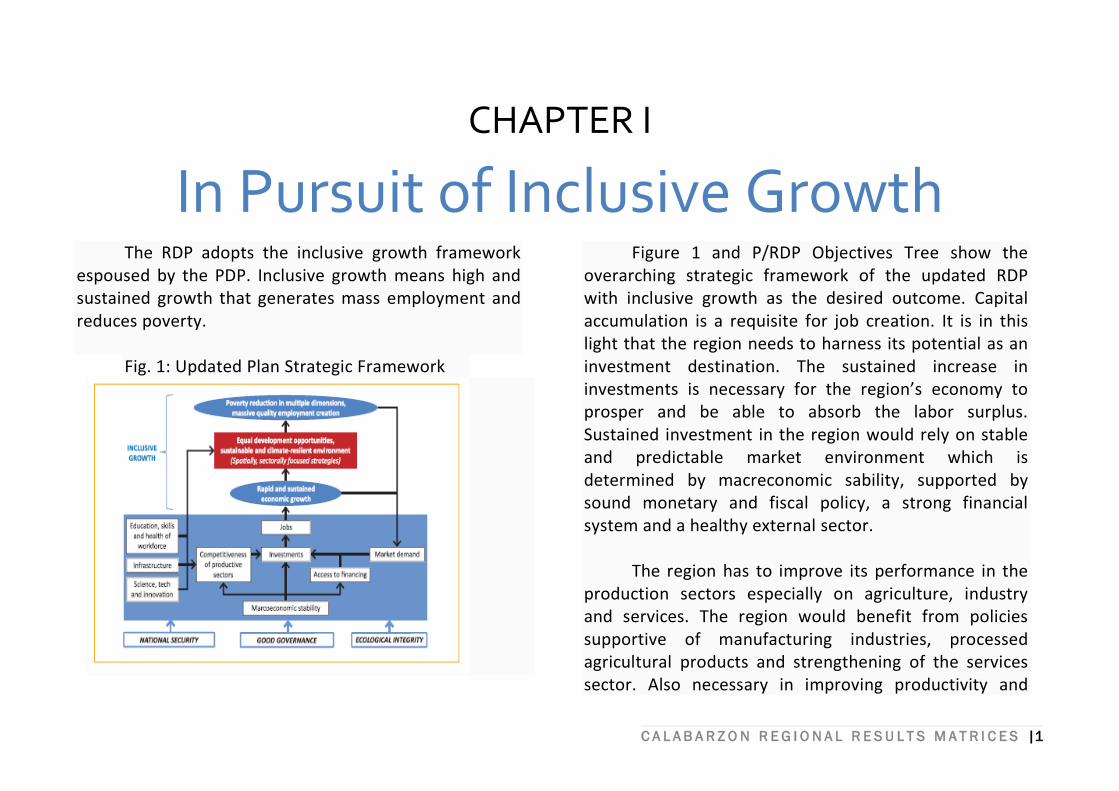
In Pursuit of Inclusive GrowthThe RDP adopts the inclusive growth framework
espoused by the PDP. Inclusive growth means high and sustained growth that generates mass employment and reduces poverty.
Fig. 1: Updated Plan Strategic Framework
Figure 1 and P/RDP Objectives Tree show the overarching strategic framework of the updated RDP with inclusive growth as the desired outcome. Capital accumulation is a requisite for job creation. It is in this light that the region needs to harness its potential as an investment destination. The sustained increase in investments is necessary for the region’s economy to prosper and be able to absorb the labor surplus. Sustained investment in the region would rely on stable and predictable market environment which is determined by macreconomic sability, supported by sound monetary and fiscal policy, a strong financial system and a healthy external sector.
The region has to improve its performance in the
production sectors especially on agriculture, industry and services. The region would benefit from policies supportive of manufacturing industries, processed agricultural products and strengthening of the services sector. Also necessary in improving productivity and
C A L A B A R Z O N R E G I O N A L R E S U L T S M A T R I C E S |2
expanding the range of products and services is private investment on research and development which can be influenced by the government through science and technology.
The region has to improve its competitiveness in
terms of infrastructure particularly on roads, sea and airports, telecommunications and transportations. With the absence of an international airport in the region, interventions to ease traffic from the NAIA to the investment hubs in the region need to be put in place. Skyways directly from the NAIA to manufacturing and investment sites are proposed.
The presence of quality higher education
institutions and the region’s proximity to NCR ensures the availability of healthy, highly and skilled work force which is an important factor of business competitiveness. Interventions to further harness the human resource potential of the region is wanting attention. The capability of HEIs to predict the skills requirements of industries need to be improved.
All initiatives towards inclusive growth are directly
and indirectly affected by peace and order, DRR-CCA concerns and good governance. It is in this light that
parallel efforts to address these concerns need to be prioritized.
Sound spatial planning is among the strategies identified in the RDP to address socio-economic disparities. The east to west connections shall be strengthened by improving existing infrastructure and opening new transportation routes to interconnect all parts of the region and eventually open opportunities for waterfront and logistics development at the eastern seaboard. The following strategies shall be pursued to facilitate east-west connections:
Develop and improve major transportation links in the region: (1) Real-Famy-Antipolo-Manila Corridor; (2) Mauban-Santa Cruz-Manila Corridor; (3) Mauban-San Pablo-Sangley Point Corridor; and (4) Mauban-Lucena-San Juan, Batangas Corridor.
Link South and North Luzon Expressway to bolster access and flow of goods and services from the northern and central Philippines to Calabarzon
Develop ports along the Pacific coast that will make trade to and from the Philippines more accessible and more cost-efficient to the Americas
Direct interventions for the vulnerable groups shall be
facilitated by the Listahanan spearheaded by the DWSD as
C A L A B A R Z O N R E G I O N A L R E S U L T S M A T R I C E S |3
Sector
Outcome
Goal Poverty in multiple dimensions reduced and massive quality
employment created
Rapid and sustained
economic growth achieved
Globally competitive and innovative industry and
services sectors achieved
Effective and
efficient governance achieved
Stable national
security achieved
Human
capabilities improved
Equal development
opportunities achieved
Competitive and sustainable agriculture
and fisheries sector achieved
Sustainable and climate-resilient
environment achieved
Vulnerabilities
reduced
Access to financing expanded in support to macroeconomic
stability
Stable
macroeconomy achieved
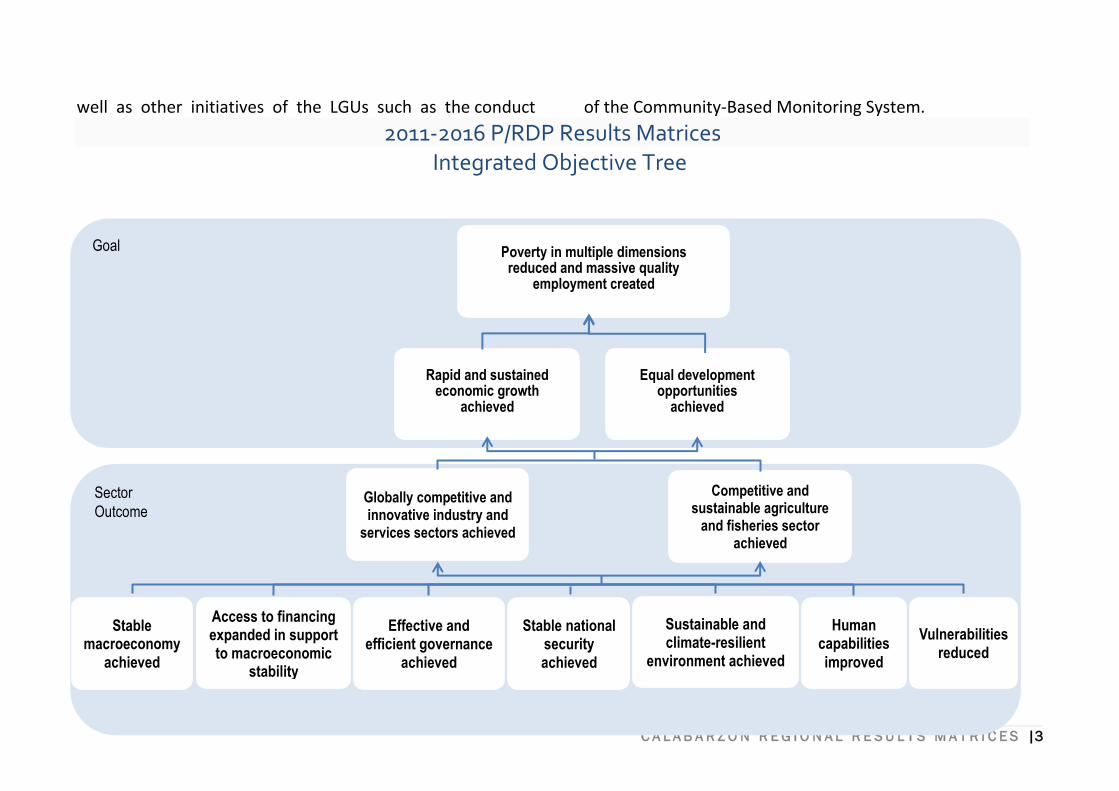
well as other initiatives of the LGUs such as the conduct of the Community-Based Monitoring System.
2011-2016 P/RDP Results Matrices
Integrated Objective Tree

C A L A B A R Z O N R E G I O N A L R E S U L T S M A T R I C E S |4
CHAPTER II
MACROECONOMY
C A L A B A R Z O N R E G I O N A L R E S U L T S M A T R I C E S |5
Subsector
Outcome
Sector
Outcome
Intermediate
Goal
Goal
Poverty in multiple dimensions reduced and massive quality
employment created
Rapid and sustained economic growth
achieved
Stable macroeconomy
achieved
Sustainable fiscal sector
achieved
Resilient external sector
maintained
Monetary and financial sector made resilient
and inclusive
Equal development opportunities
achieved
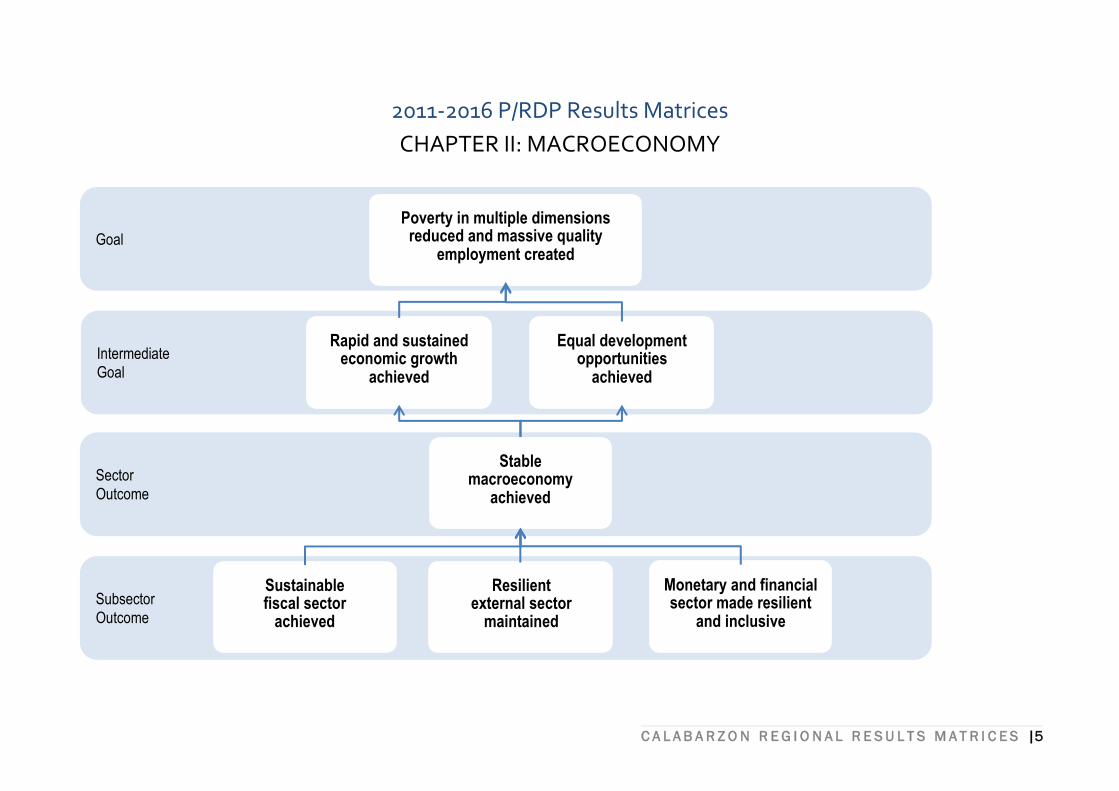
2011-2016 P/RDP Results Matrices
CHAPTER II: MACROECONOMY
C A L A B A R Z O N R E G I O N A L R E S U L T S M A T R I C E S |6
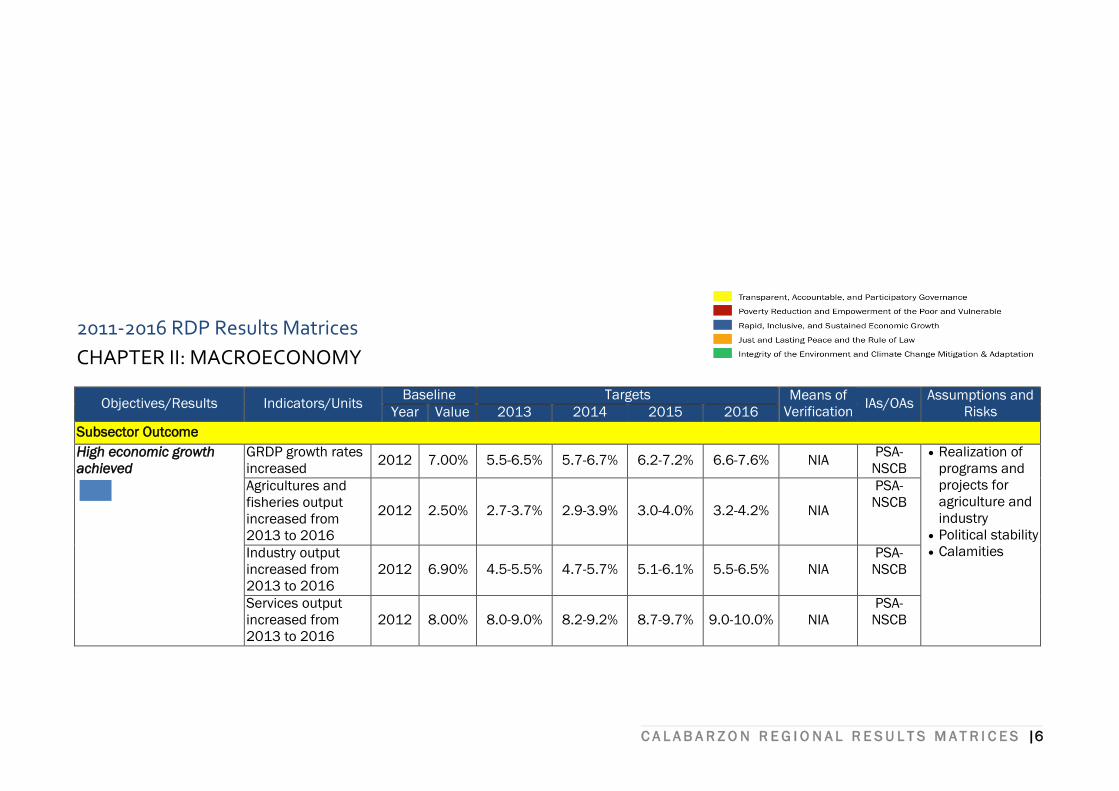
2011-2016 RDP Results Matrices
CHAPTER II: MACROECONOMY
Objectives/Results Indicators/Units Baseline Targets Means of
Verification IAs/OAs
Assumptions and
Risks Year Value 2013 2014 2015 2016
Subsector Outcome
High economic growth
achieved
GRDP growth rates
increased 2012 7.00% 5.5-6.5% 5.7-6.7% 6.2-7.2% 6.6-7.6% NIA
PSA-
NSCB
Realization of
programs and
projects for
agriculture and
industry
Political stability
Calamities
Agricultures and
fisheries output
increased from
2013 to 2016
2012 2.50% 2.7-3.7% 2.9-3.9% 3.0-4.0% 3.2-4.2% NIA
PSA-
NSCB
Industry output
increased from
2013 to 2016
2012 6.90% 4.5-5.5% 4.7-5.7% 5.1-6.1% 5.5-6.5% NIA
PSA-
NSCB
Services output
increased from
2013 to 2016
2012 8.00% 8.0-9.0% 8.2-9.2% 8.7-9.7% 9.0-10.0% NIA
PSA-
NSCB
C A L A B A R Z O N R E G I O N A L R E S U L T S M A T R I C E S |7
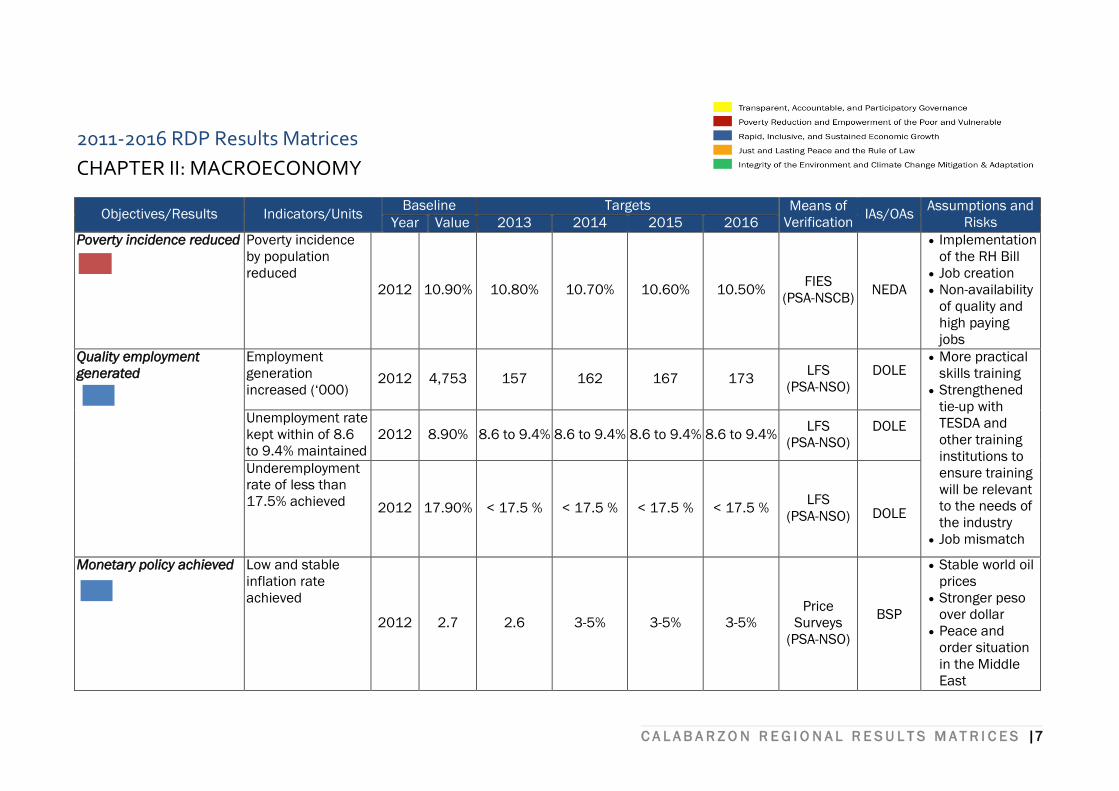
2011-2016 RDP Results Matrices
CHAPTER II: MACROECONOMY
Objectives/Results Indicators/Units Baseline Targets Means of
Verification IAs/OAs
Assumptions and
Risks Year Value 2013 2014 2015 2016
Poverty incidence reduced
Poverty incidence
by population
reduced
2012 10.90% 10.80% 10.70% 10.60% 10.50% FIES
(PSA-NSCB)
NEDA
Implementation
of the RH Bill
Job creation
Non-availability
of quality and
high paying
jobs
Quality employment
generated
Employment
generation
increased (‘000) 2012 4,753 157 162 167 173
LFS
(PSA-NSO)
DOLE
More practical
skills training
Strengthened
tie-up with
TESDA and
other training
institutions to
ensure training
will be relevant
to the needs of
the industry
Job mismatch
Unemployment rate
kept within of 8.6
to 9.4% maintained
2012 8.90% 8.6 to 9.4% 8.6 to 9.4% 8.6 to 9.4% 8.6 to 9.4% LFS
(PSA-NSO)
DOLE
Underemployment
rate of less than
17.5% achieved 2012 17.90% < 17.5 % < 17.5 % < 17.5 % < 17.5 %
LFS
(PSA-NSO)
DOLE
Monetary policy achieved
Low and stable
inflation rate
achieved
2012 2.7 2.6 3-5% 3-5% 3-5%
Price
Surveys
(PSA-NSO)
BSP
Stable world oil
prices
Stronger peso
over dollar
Peace and
order situation
in the Middle
East

C A L A B A R Z O N R E G I O N A L R E S U L T S M A T R I C E S |8
C A L A B A R Z O N R E G I O N A L R E S U L T S M A T R I C E S |9
CHAPTER III
COMPETITIVE INDUSTRY AND
SERVICES SECTORS
C A L A B A R Z O N R E G I O N A L R E S U L T S M A T R I C E S |10
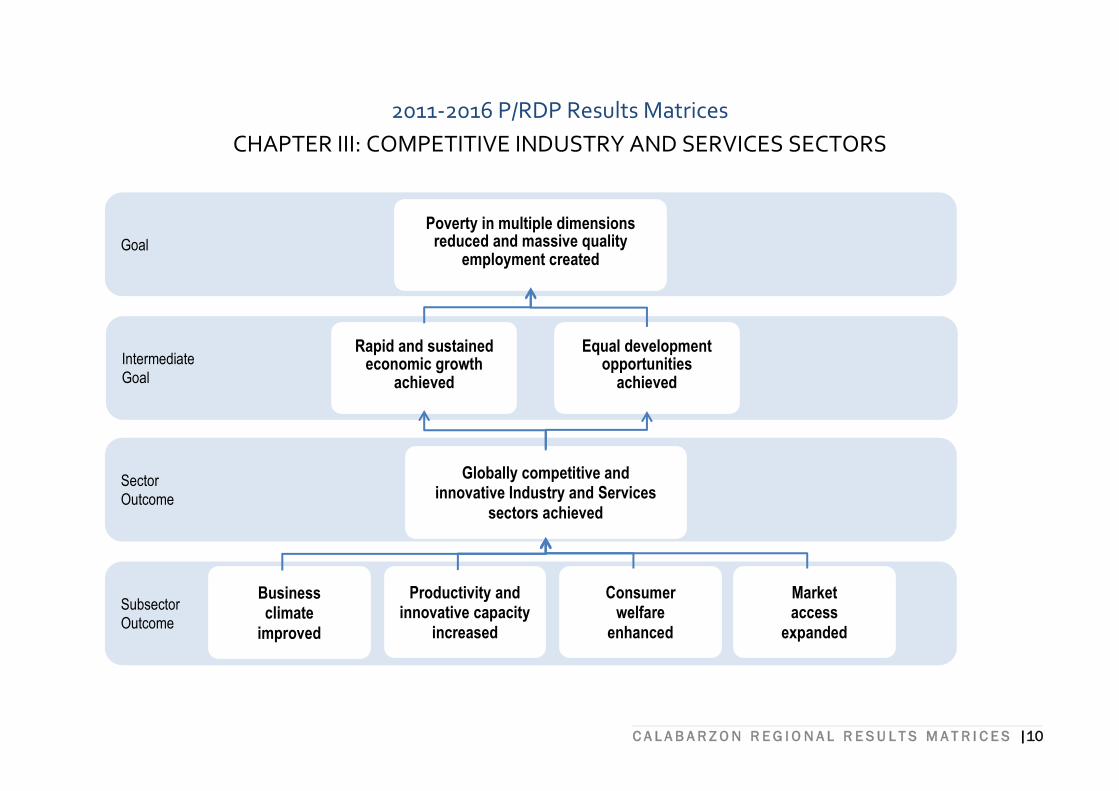
2011-2016 P/RDP Results Matrices
CHAPTER III: COMPETITIVE INDUSTRY AND SERVICES SECTORS
Subsector
Outcome
Sector
Outcome
Intermediate
Goal
Goal
Poverty in multiple dimensions reduced and massive quality
employment created
Rapid and sustained economic growth
achieved
Globally competitive and innovative Industry and Services
sectors achieved
Equal development opportunities
achieved
Business climate
improved
Productivity and innovative capacity
increased
Consumer welfare
enhanced
Market access
expanded

C A L A B A R Z O N R E G I O N A L R E S U L T S M A T R I C E S |11
C A L A B A R Z O N R E G I O N A L R E S U L T S M A T R I C E S |12
2011-2016 RDP Results Matrices
CHAPTER III: COMPETITIVE INDUSTRY AND SERVICES SECTORS
Objectives/Results Indicators/Units Baseline Targets Means of
Verification IAs/ OAs
Assumptions
and Risks Year Value 2013 2014 2015 2016
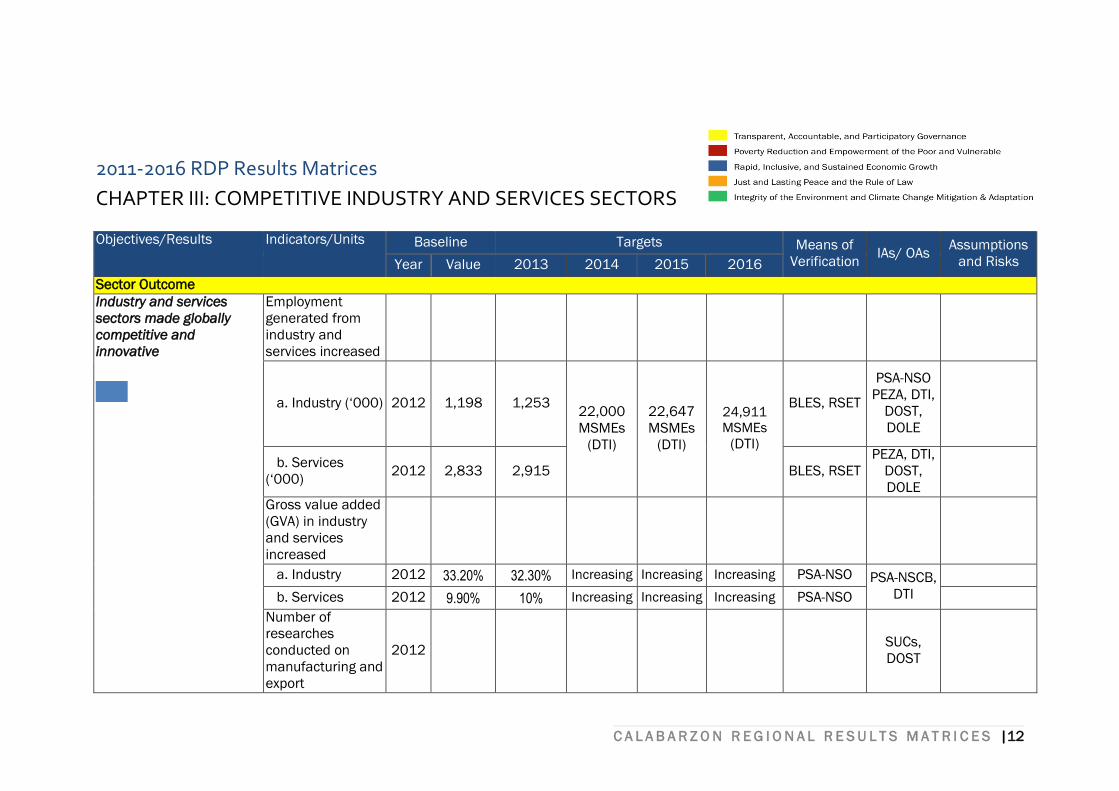
Sector Outcome
Industry and services
sectors made globally
competitive and
innovative
Employment
generated from
industry and
services increased
a. Industry (‘000) 2012 1,198 1,253 22,000
MSMEs
(DTI)
22,647
MSMEs
(DTI)
24,911
MSMEs
(DTI)
BLES, RSET
PSA-NSO
PEZA, DTI,
DOST,
DOLE
b. Services
(‘000) 2012 2,833 2,915 BLES, RSET
PEZA, DTI,
DOST,
DOLE
Gross value added
(GVA) in industry
and services
increased
a. Industry 2012 33.20% 32.30% Increasing Increasing Increasing PSA-NSO PSA-NSCB,
DTI
b. Services 2012 9.90% 10% Increasing Increasing Increasing PSA-NSO
Number of
researches
conducted on
manufacturing and
export
2012
SUCs,
DOST
C A L A B A R Z O N R E G I O N A L R E S U L T S M A T R I C E S |13
2011-2016 RDP Results Matrices
CHAPTER III: COMPETITIVE INDUSTRY AND SERVICES SECTORS
Objectives/Results Indicators/Units Baseline Targets Means of
Verification IAs/ OAs
Assumptions
and Risks Year Value 2013 2014 2015 2016
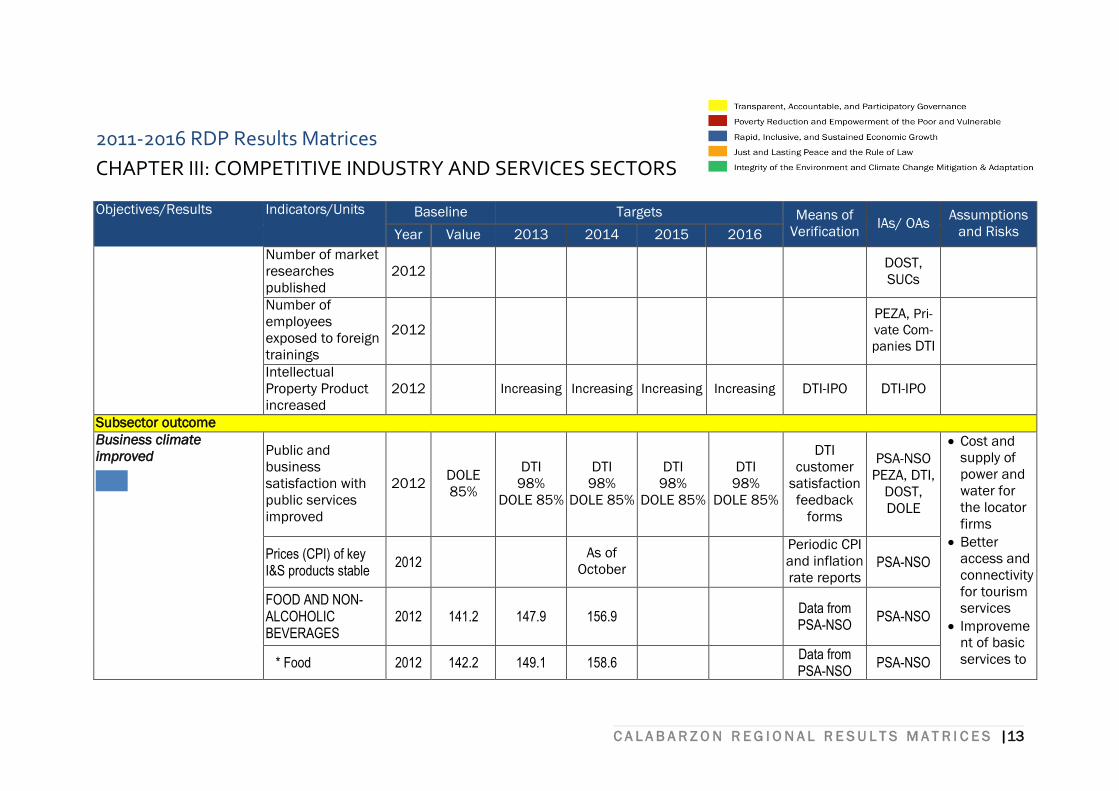
Number of market
researches
published
2012
DOST,
SUCs
Number of
employees
exposed to foreign
trainings
2012
PEZA, Pri-
vate Com-
panies DTI
Intellectual
Property Product
increased
2012
Increasing Increasing Increasing Increasing DTI-IPO DTI-IPO
Subsector outcome
Business climate
improved
Public and
business
satisfaction with
public services
improved
2012 DOLE
85%
DTI
98%
DOLE 85%
DTI
98%
DOLE 85%
DTI
98%
DOLE 85%
DTI
98%
DOLE 85%
DTI
customer
satisfaction
feedback
forms
PSA-NSO
PEZA, DTI,
DOST,
DOLE
Cost and
supply of
power and
water for
the locator
firms
Better
access and
connectivity
for tourism
services
Improveme
nt of basic
services to
Prices (CPI) of key I&S products stable
2012 As of
October
Periodic CPI
and inflation
rate reports PSA-NSO
FOOD AND NON-ALCOHOLIC BEVERAGES
2012 141.2 147.9 156.9 Data from PSA-NSO
PSA-NSO
* Food 2012 142.2 149.1 158.6 Data from PSA-NSO
PSA-NSO
C A L A B A R Z O N R E G I O N A L R E S U L T S M A T R I C E S |14
2011-2016 RDP Results Matrices
CHAPTER III: COMPETITIVE INDUSTRY AND SERVICES SECTORS
Objectives/Results Indicators/Units Baseline Targets Means of
Verification IAs/ OAs
Assumptions
and Risks Year Value 2013 2014 2015 2016
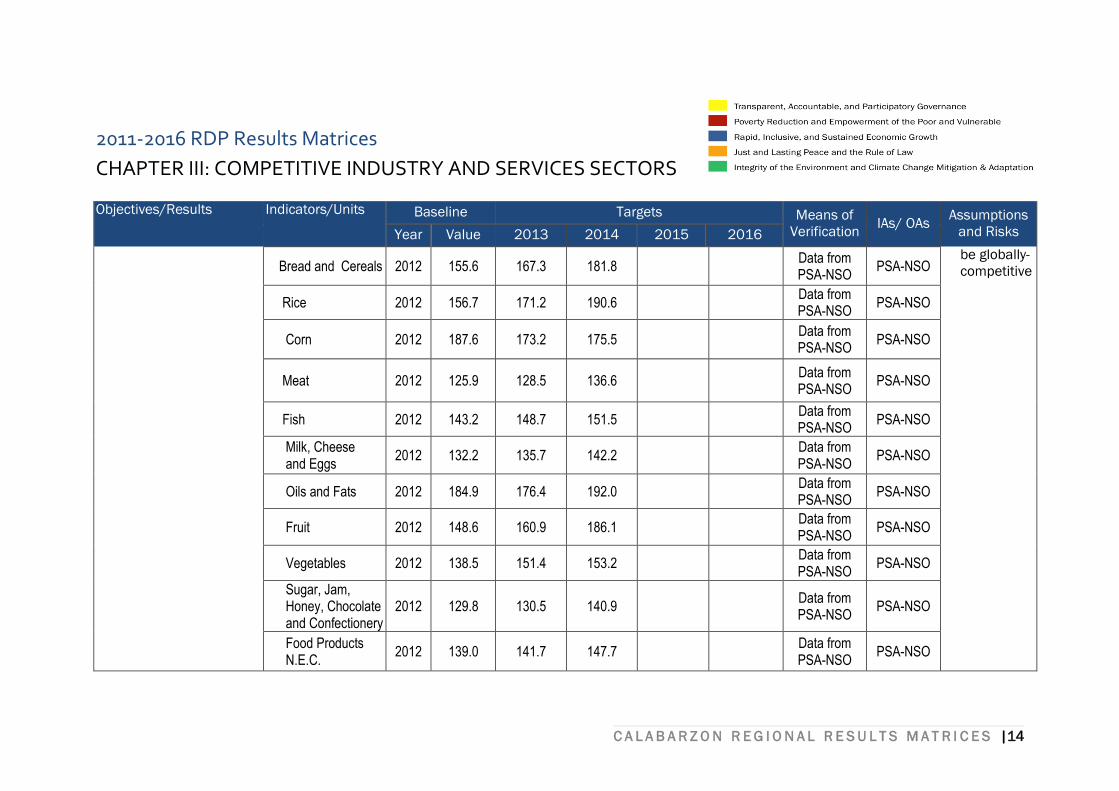
Bread and Cereals 2012 155.6 167.3 181.8 Data from PSA-NSO
PSA-NSO be globally-
competitive
Rice 2012 156.7 171.2 190.6 Data from PSA-NSO
PSA-NSO
Corn 2012 187.6 173.2 175.5 Data from PSA-NSO
PSA-NSO
Meat 2012 125.9 128.5 136.6 Data from PSA-NSO
PSA-NSO
Fish 2012 143.2 148.7 151.5 Data from PSA-NSO
PSA-NSO
Milk, Cheese ___and Eggs
2012 132.2 135.7 142.2 Data from PSA-NSO
PSA-NSO
Oils and Fats 2012 184.9 176.4 192.0 Data from PSA-NSO
PSA-NSO
Fruit 2012 148.6 160.9 186.1 Data from PSA-NSO
PSA-NSO
Vegetables 2012 138.5 151.4 153.2 Data from PSA-NSO
PSA-NSO
Sugar, Jam, ___Honey, Chocolate ___and Confectionery
2012 129.8 130.5 140.9 Data from PSA-NSO
PSA-NSO
Food Products ___N.E.C.
2012 139.0 141.7 147.7 Data from PSA-NSO
PSA-NSO
C A L A B A R Z O N R E G I O N A L R E S U L T S M A T R I C E S |15
2011-2016 RDP Results Matrices
CHAPTER III: COMPETITIVE INDUSTRY AND SERVICES SECTORS
Objectives/Results Indicators/Units Baseline Targets Means of
Verification IAs/ OAs
Assumptions
and Risks Year Value 2013 2014 2015 2016
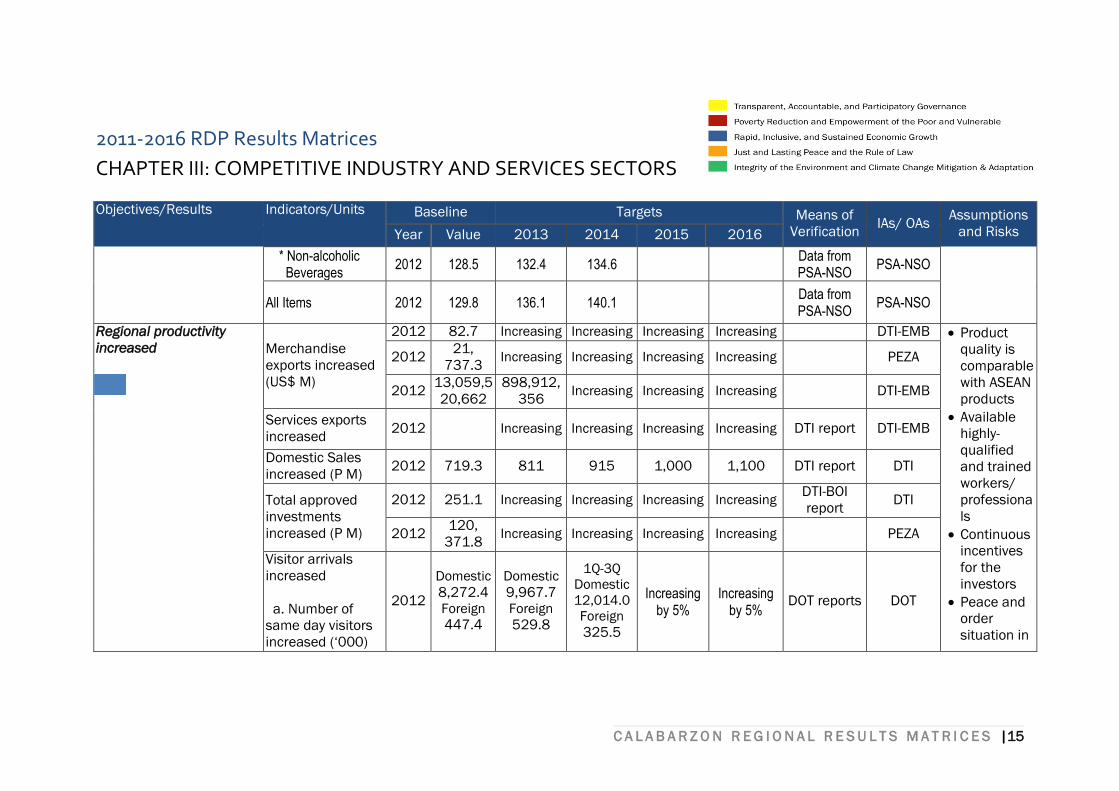
* Non-alcoholic ___Beverages
2012 128.5 132.4 134.6 Data from PSA-NSO
PSA-NSO
All Items 2012 129.8 136.1 140.1 Data from PSA-NSO
PSA-NSO
Regional productivity
increased Merchandise
exports increased
(US$ M)
2012 82.7 Increasing Increasing Increasing Increasing
DTI-EMB Product
quality is
comparable
with ASEAN
products
Available
highly-
qualified
and trained
workers/
professiona
ls
Continuous
incentives
for the
investors
Peace and
order
situation in
2012 21,
737.3 Increasing Increasing Increasing Increasing
PEZA
2012 13,059,5
20,662
898,912,
356 Increasing Increasing Increasing
DTI-EMB
Services exports
increased 2012
Increasing Increasing Increasing Increasing DTI report DTI-EMB
Domestic Sales
increased (P M) 2012 719.3 811 915 1,000 1,100 DTI report DTI
Total approved
investments
increased (P M)
2012 251.1 Increasing Increasing Increasing Increasing DTI-BOI
report DTI
2012 120,
371.8 Increasing Increasing Increasing Increasing
PEZA
Visitor arrivals
increased
a. Number of
same day visitors
increased (‘000)
2012
Domestic
8,272.4 Foreign 447.4
Domestic
9,967.7 Foreign 529.8
1Q-3Q
Domestic 12,014.0 Foreign 325.5
Increasing by 5%
Increasing by 5%
DOT reports DOT
C A L A B A R Z O N R E G I O N A L R E S U L T S M A T R I C E S |16
2011-2016 RDP Results Matrices
CHAPTER III: COMPETITIVE INDUSTRY AND SERVICES SECTORS
Objectives/Results Indicators/Units Baseline Targets Means of
Verification IAs/ OAs
Assumptions
and Risks Year Value 2013 2014 2015 2016
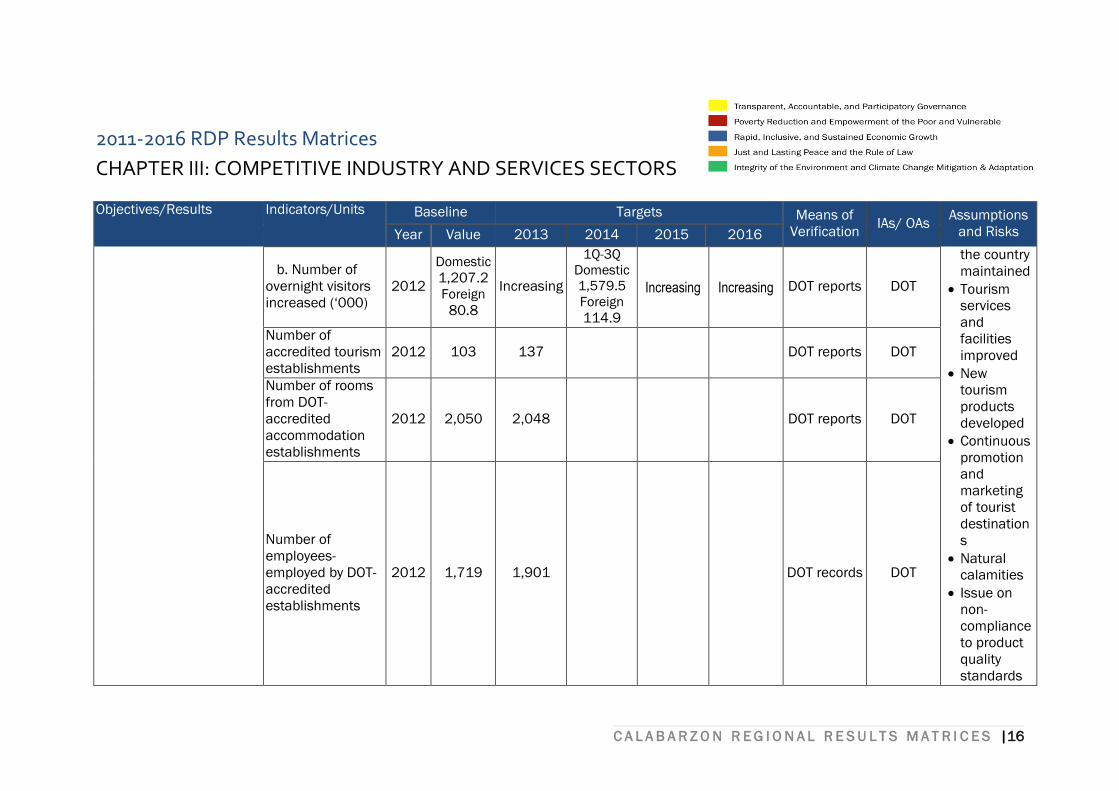
b. Number of
overnight visitors
increased (‘000)
2012
Domestic
1,207.2 Foreign
80.8
Increasing
1Q-3Q
Domestic 1,579.5 Foreign 114.9
Increasing Increasing DOT reports DOT
the country
maintained
Tourism
services
and
facilities
improved
New
tourism
products
developed
Continuous
promotion
and
marketing
of tourist
destination
s
Natural
calamities
Issue on
non-
compliance
to product
quality
standards
Number of
accredited tourism
establishments
2012 103 137
DOT reports DOT
Number of rooms
from DOT-
accredited
accommodation
establishments
2012 2,050 2,048
DOT reports DOT
Number of
employees-
employed by DOT-
accredited
establishments
2012 1,719 1,901
DOT records DOT
C A L A B A R Z O N R E G I O N A L R E S U L T S M A T R I C E S |17
2011-2016 RDP Results Matrices
CHAPTER III: COMPETITIVE INDUSTRY AND SERVICES SECTORS
Objectives/Results Indicators/Units Baseline Targets Means of
Verification IAs/ OAs
Assumptions
and Risks Year Value 2013 2014 2015 2016
Proliferatio
n of low
quality,
cheap
imported
products
Presence of
underpaid
workers,
hiring by
illegal
recruiters,
and
undocumen
ted workers
Withdrawal
of fiscal
incentives
for
investors
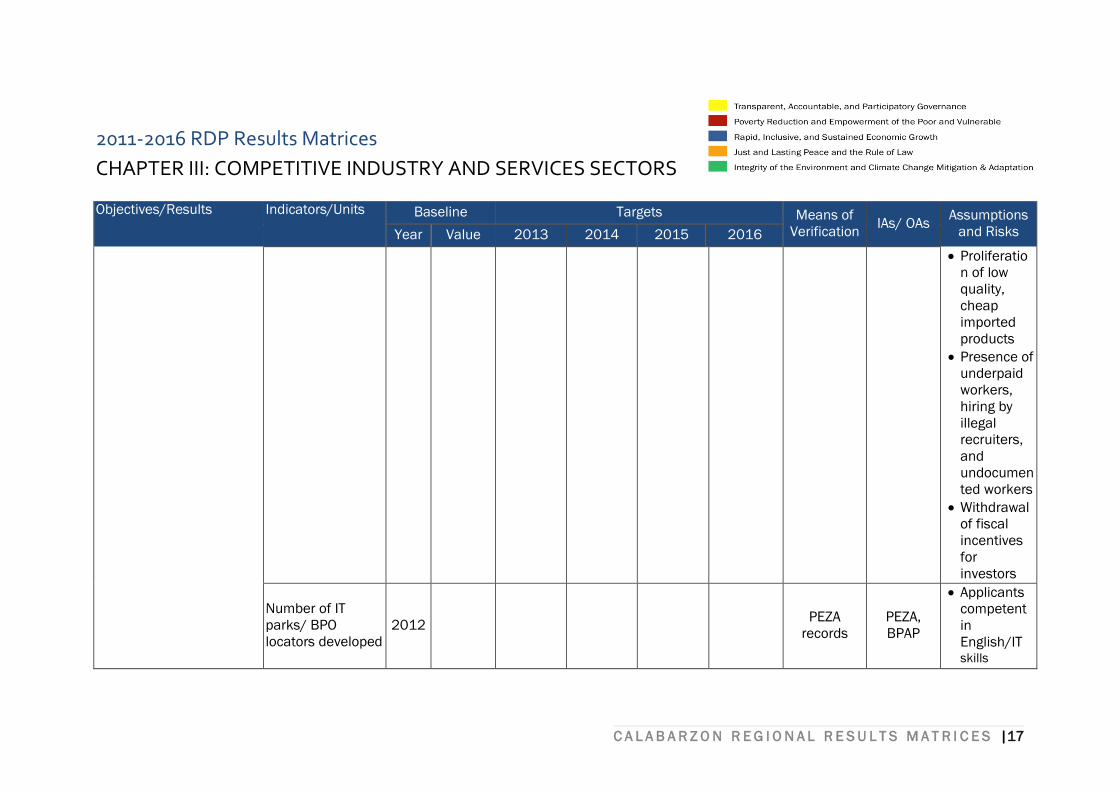
Number of IT
parks/ BPO
locators developed
2012
PEZA
records
PEZA,
BPAP
Applicants
competent
in
English/IT skills
C A L A B A R Z O N R E G I O N A L R E S U L T S M A T R I C E S |18
2011-2016 RDP Results Matrices
CHAPTER III: COMPETITIVE INDUSTRY AND SERVICES SECTORS
Objectives/Results Indicators/Units Baseline Targets Means of
Verification IAs/ OAs
Assumptions
and Risks Year Value 2013 2014 2015 2016
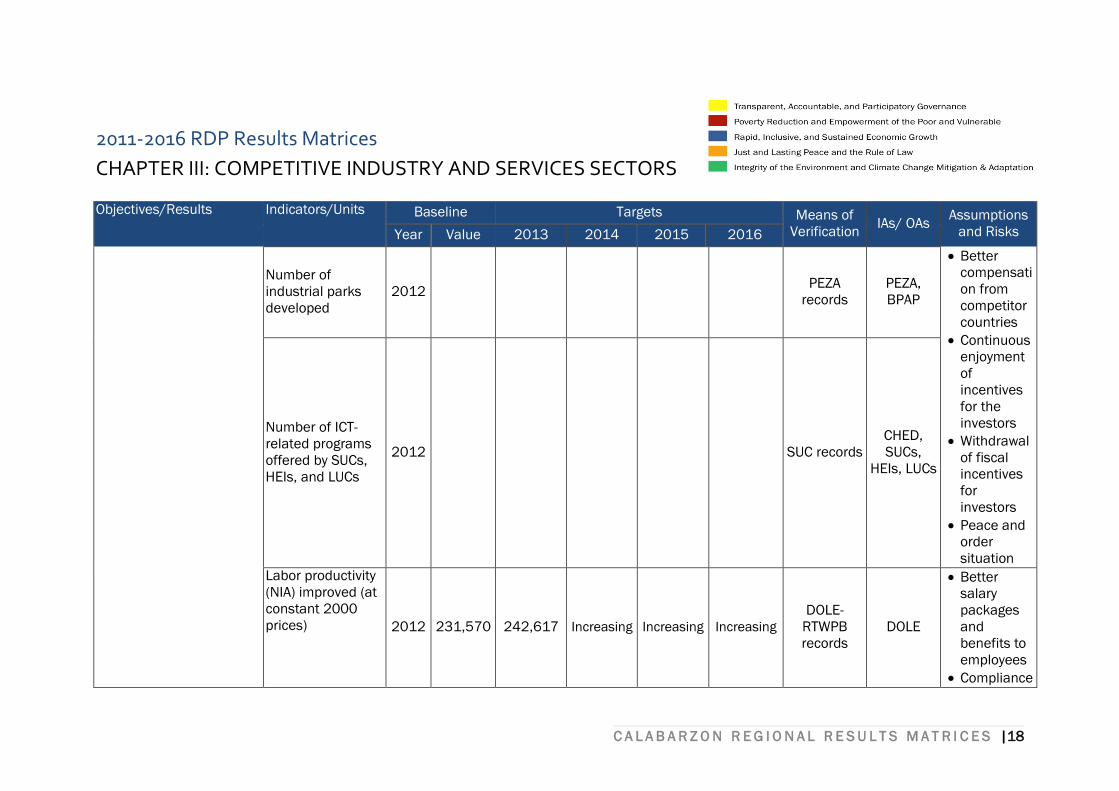
Number of
industrial parks
developed
2012
PEZA
records
PEZA,
BPAP
Better
compensati
on from
competitor
countries
Continuous
enjoyment
of
incentives
for the
investors
Withdrawal
of fiscal
incentives
for
investors
Peace and
order
situation
Number of ICT-
related programs
offered by SUCs,
HEIs, and LUCs
2012
SUC records
CHED,
SUCs,
HEIs, LUCs
Labor productivity
(NIA) improved (at
constant 2000
prices) 2012 231,570 242,617 Increasing Increasing Increasing
DOLE-
RTWPB
records
DOLE
Better
salary
packages
and
benefits to
employees
Compliance
C A L A B A R Z O N R E G I O N A L R E S U L T S M A T R I C E S |19
2011-2016 RDP Results Matrices
CHAPTER III: COMPETITIVE INDUSTRY AND SERVICES SECTORS
Objectives/Results Indicators/Units Baseline Targets Means of
Verification IAs/ OAs
Assumptions
and Risks Year Value 2013 2014 2015 2016
to labor
standards
and
occupation
al safety
and health
(OSH)
Salary
package
below
minimum
Poor
working
environ-
ment
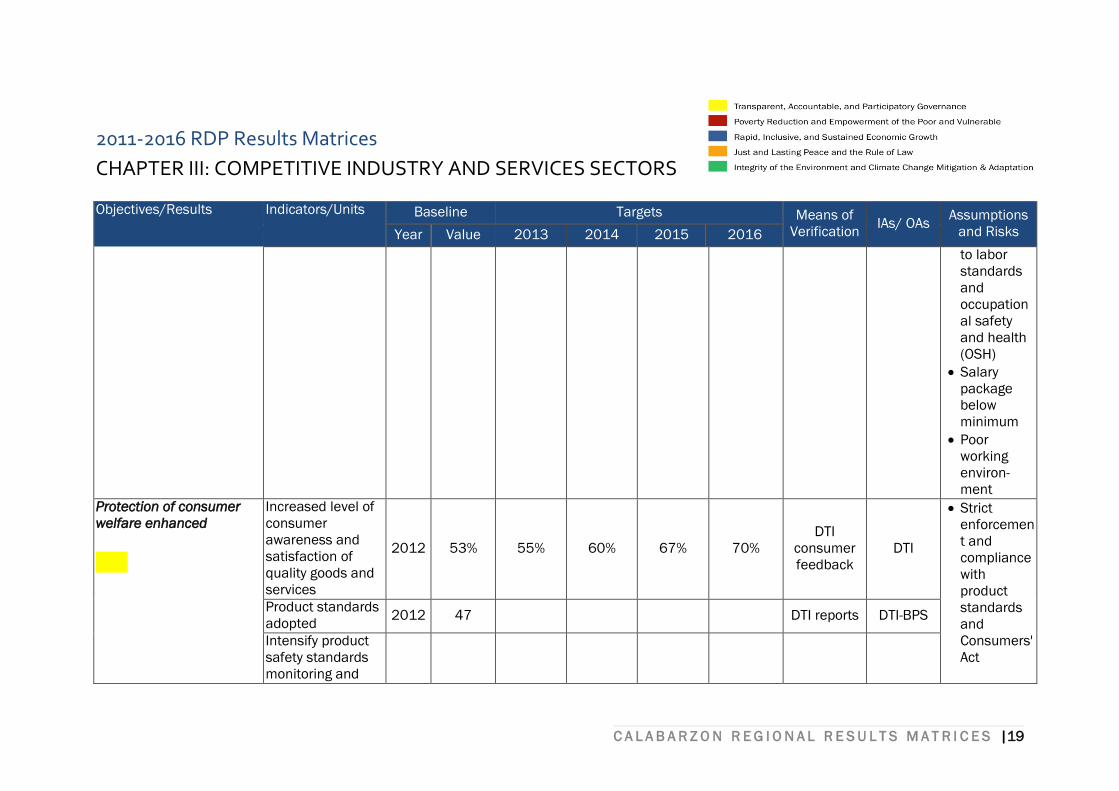
Protection of consumer
welfare enhanced
Increased level of
consumer
awareness and
satisfaction of
quality goods and
services
2012 53% 55% 60% 67% 70%
DTI
consumer
feedback
DTI
Strict
enforcemen
t and
compliance
with
product
standards
and
Consumers'
Act
Product standards
adopted 2012 47
DTI reports DTI-BPS
Intensify product
safety standards
monitoring and
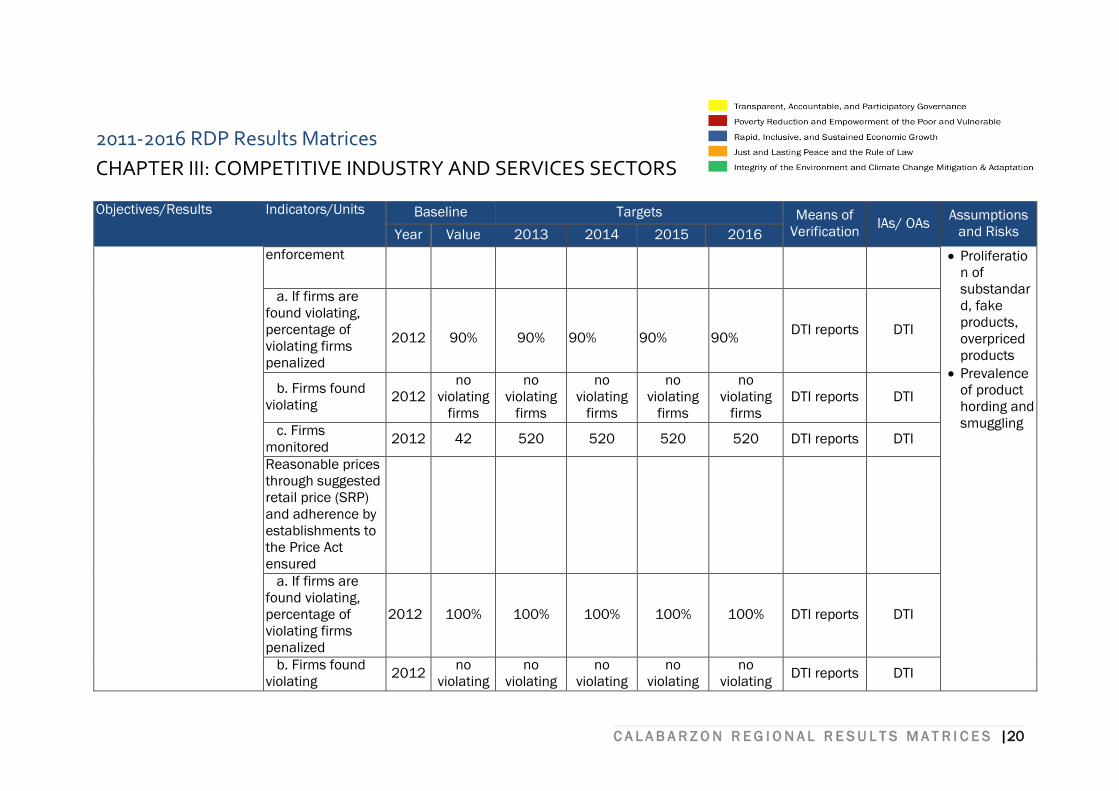
C A L A B A R Z O N R E G I O N A L R E S U L T S M A T R I C E S |20
2011-2016 RDP Results Matrices
CHAPTER III: COMPETITIVE INDUSTRY AND SERVICES SECTORS
Objectives/Results Indicators/Units Baseline Targets Means of
Verification IAs/ OAs
Assumptions
and Risks Year Value 2013 2014 2015 2016
enforcement Proliferatio
n of
substandar
d, fake
products,
overpriced
products
Prevalence
of product
hording and
smuggling
a. If firms are
found violating,
percentage of
violating firms
penalized
2012
90%
90%
90%
90%
90% DTI reports DTI
b. Firms found
violating 2012
no
violating
firms
no
violating
firms
no
violating
firms
no
violating
firms
no
violating
firms
DTI reports DTI
c. Firms
monitored 2012 42 520 520 520 520 DTI reports DTI
Reasonable prices
through suggested
retail price (SRP)
and adherence by
establishments to
the Price Act
ensured
a. If firms are
found violating,
percentage of
violating firms
penalized
2012 100% 100% 100% 100% 100% DTI reports DTI
b. Firms found
violating 2012
no
violating
no
violating
no
violating
no
violating
no
violating DTI reports DTI
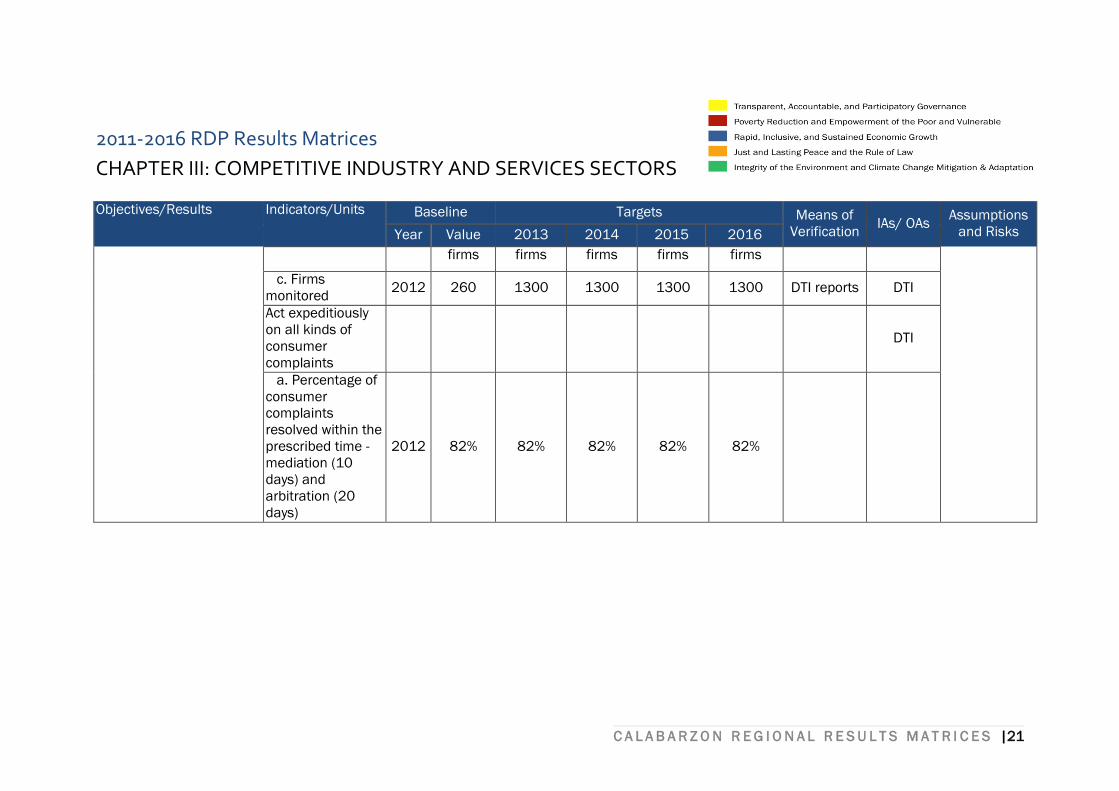
C A L A B A R Z O N R E G I O N A L R E S U L T S M A T R I C E S |21
2011-2016 RDP Results Matrices
CHAPTER III: COMPETITIVE INDUSTRY AND SERVICES SECTORS
Objectives/Results Indicators/Units Baseline Targets Means of
Verification IAs/ OAs
Assumptions
and Risks Year Value 2013 2014 2015 2016
firms firms firms firms firms
c. Firms
monitored 2012 260 1300 1300 1300 1300 DTI reports DTI
Act expeditiously
on all kinds of
consumer
complaints
DTI
a. Percentage of
consumer
complaints
resolved within the
prescribed time -
mediation (10
days) and
arbitration (20
days)
2012 82% 82% 82% 82% 82%
C A L A B A R Z O N R E G I O N A L R E S U L T S M A T R I C E S |22
CHAPTER IV
COMPETITIVE AND
SUSTAINABLE
AGRICULTURE AND FISHERIES
SECTOR
C A L A B A R Z O N R E G I O N A L R E S U L T S M A T R I C E S |23
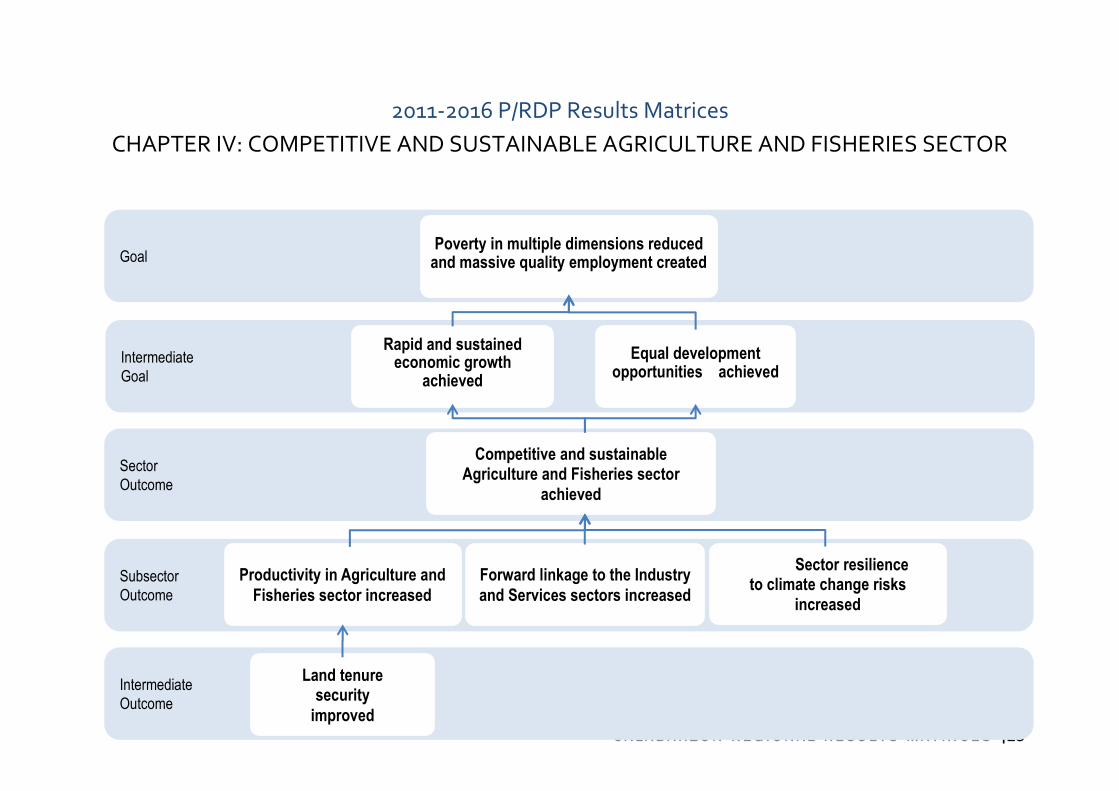
2011-2016 P/RDP Results Matrices
CHAPTER IV: COMPETITIVE AND SUSTAINABLE AGRICULTURE AND FISHERIES SECTOR
Subsector
Outcome
Sector
Outcome
Intermediate
Goal
Goal
Poverty in multiple dimensions reduced
and massive quality employment created
Rapid and sustained economic growth
achieved
Competitive and sustainable Agriculture and Fisheries sector
achieved
Productivity in Agriculture and
Fisheries sector increased
Forward linkage to the Industry
and Services sectors increased
Sector resilience to climate change risks
increased
Equal development
opportunities achieved
Intermediate
Outcome
Land tenure security
improved

C A L A B A R Z O N R E G I O N A L R E S U L T S M A T R I C E S |24
C A L A B A R Z O N R E G I O N A L R E S U L T S M A T R I C E S |25
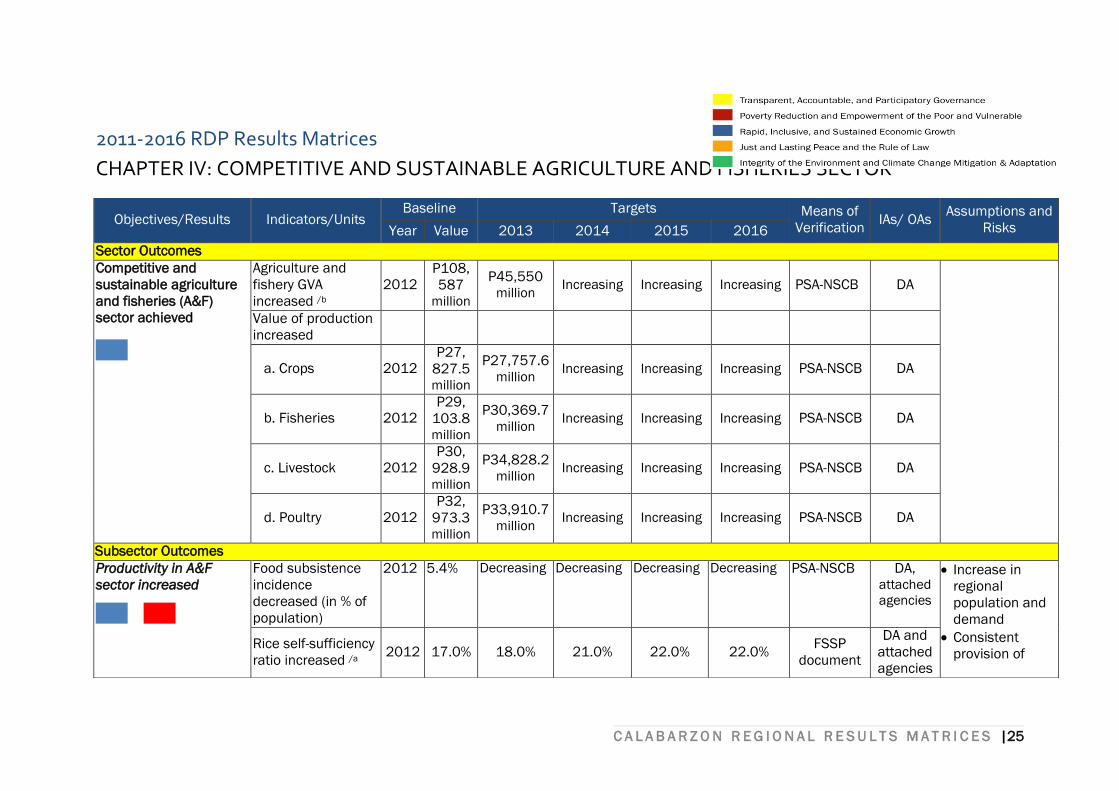
2011-2016 RDP Results Matrices
CHAPTER IV: COMPETITIVE AND SUSTAINABLE AGRICULTURE AND FISHERIES SECTOR
Objectives/Results Indicators/Units Baseline Targets Means of
Verification IAs/ OAs
Assumptions and
Risks Year Value 2013 2014 2015 2016
Sector Outcomes
Competitive and
sustainable agriculture
and fisheries (A&F)
sector achieved
Agriculture and
fishery GVA
increased /b
2012 P108,
587 million
P45,550 million
Increasing Increasing Increasing PSA-NSCB DA
Value of production
increased
a. Crops 2012 P27,
827.5 million
P27,757.6 million
Increasing Increasing Increasing PSA-NSCB DA
b. Fisheries 2012 P29,
103.8 million
P30,369.7 million
Increasing Increasing Increasing PSA-NSCB DA
c. Livestock 2012 P30,
928.9 million
P34,828.2 million
Increasing Increasing Increasing PSA-NSCB DA
d. Poultry 2012 P32,
973.3 million
P33,910.7 million
Increasing Increasing Increasing PSA-NSCB DA
Subsector Outcomes
Productivity in A&F
sector increased
Food subsistence
incidence
decreased (in % of
population)
2012 5.4% Decreasing Decreasing Decreasing Decreasing PSA-NSCB DA, attached
agencies
Increase in
regional
population and
demand
Consistent
provision of Rice self-sufficiency
ratio increased /a 2012 17.0% 18.0% 21.0% 22.0% 22.0%
FSSP
document
DA and
attached
agencies
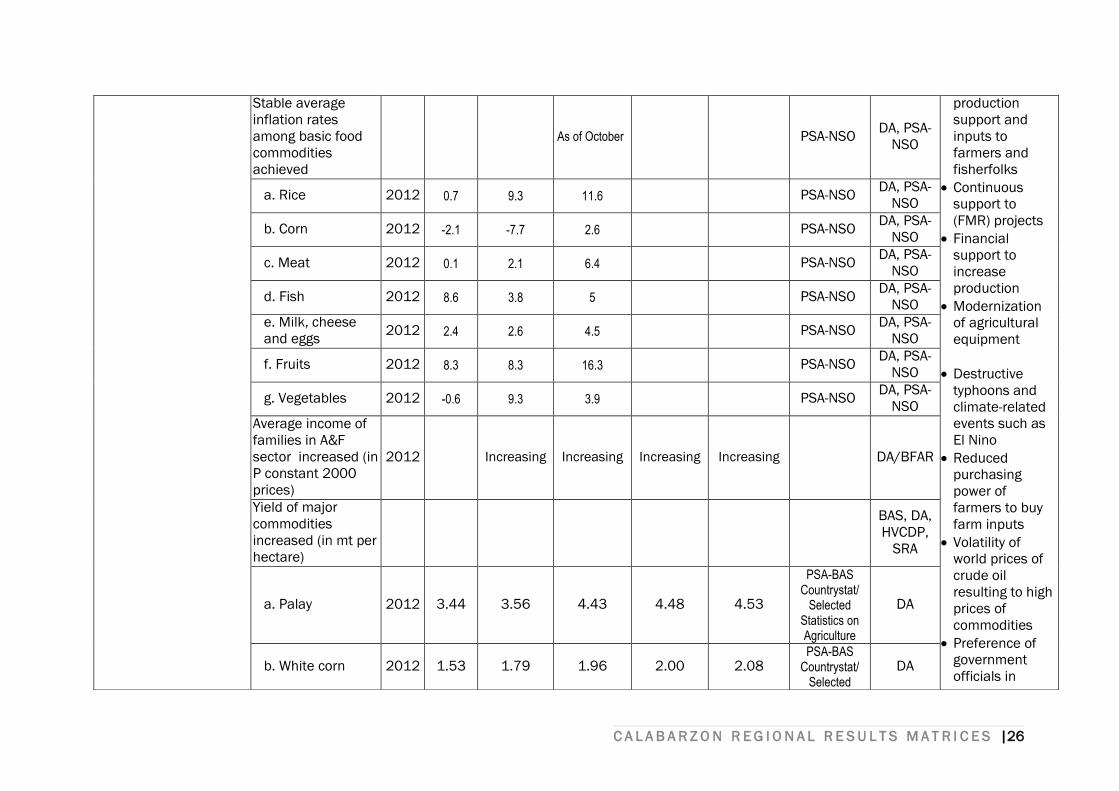
C A L A B A R Z O N R E G I O N A L R E S U L T S M A T R I C E S |26
Stable average
inflation rates
among basic food
commodities
achieved
As of October PSA-NSO DA, PSA-
NSO
production
support and
inputs to
farmers and
fisherfolks
Continuous
support to
(FMR) projects
Financial
support to
increase
production
Modernization
of agricultural
equipment
Destructive
typhoons and
climate-related
events such as
El Nino
Reduced
purchasing
power of
farmers to buy
farm inputs
Volatility of
world prices of
crude oil
resulting to high
prices of
commodities
Preference of
government
officials in
a. Rice 2012 0.7 9.3 11.6 PSA-NSO DA, PSA-
NSO
b. Corn 2012 -2.1 -7.7 2.6 PSA-NSO DA, PSA-
NSO
c. Meat 2012 0.1 2.1 6.4 PSA-NSO DA, PSA-
NSO
d. Fish 2012 8.6 3.8 5 PSA-NSO DA, PSA-
NSO
e. Milk, cheese
and eggs 2012 2.4 2.6 4.5 PSA-NSO
DA, PSA-
NSO
f. Fruits 2012 8.3 8.3 16.3 PSA-NSO DA, PSA-
NSO
g. Vegetables 2012 -0.6 9.3 3.9 PSA-NSO DA, PSA-
NSO
Average income of
families in A&F
sector increased (in
P constant 2000
prices)
2012
Increasing Increasing Increasing Increasing DA/BFAR
Yield of major
commodities
increased (in mt per
hectare)
BAS, DA,
HVCDP,
SRA
a. Palay 2012 3.44 3.56 4.43 4.48 4.53
PSA-BAS Countrystat/
Selected Statistics on Agriculture
DA
b. White corn 2012 1.53 1.79 1.96 2.00 2.08 PSA-BAS
Countrystat/ Selected
DA
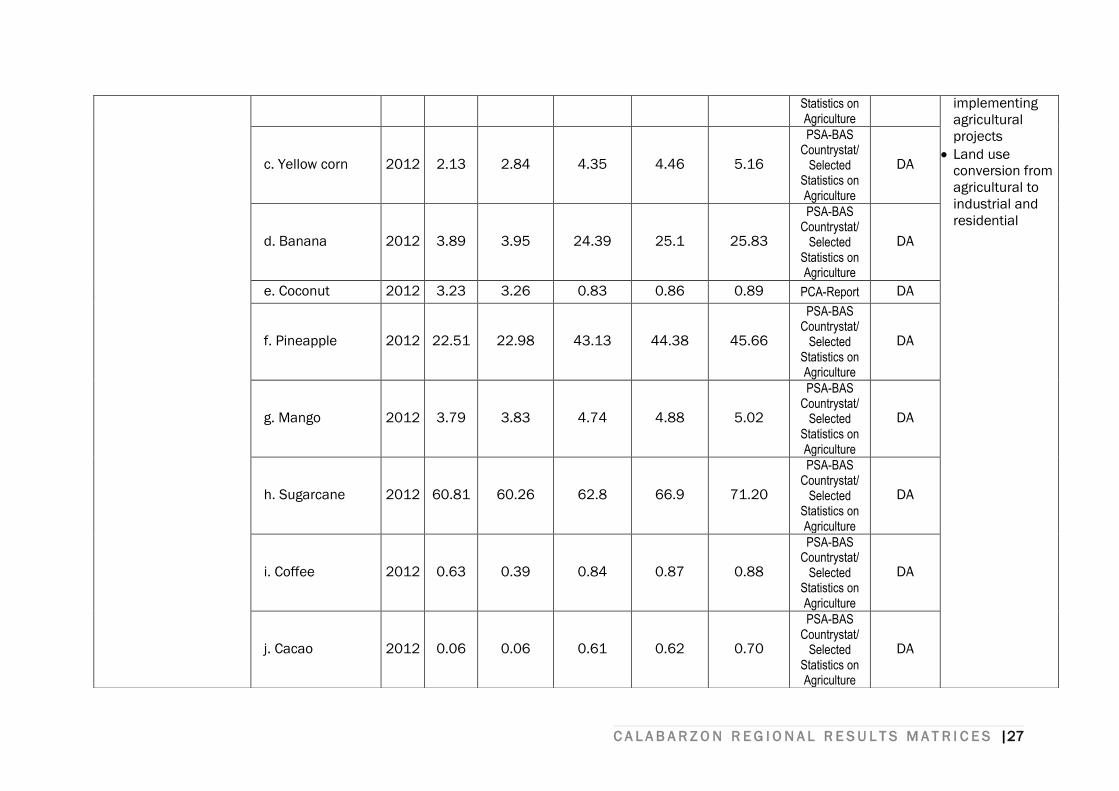
C A L A B A R Z O N R E G I O N A L R E S U L T S M A T R I C E S |27
Statistics on Agriculture
implementing
agricultural
projects
Land use
conversion from
agricultural to
industrial and
residential
c. Yellow corn 2012 2.13 2.84 4.35 4.46 5.16
PSA-BAS Countrystat/
Selected Statistics on Agriculture
DA
d. Banana 2012 3.89 3.95 24.39 25.1 25.83
PSA-BAS Countrystat/
Selected Statistics on Agriculture
DA
e. Coconut 2012 3.23 3.26 0.83 0.86 0.89 PCA-Report DA
f. Pineapple 2012 22.51 22.98 43.13 44.38 45.66
PSA-BAS Countrystat/
Selected Statistics on Agriculture
DA
g. Mango 2012 3.79 3.83 4.74 4.88 5.02
PSA-BAS Countrystat/
Selected Statistics on Agriculture
DA
h. Sugarcane 2012 60.81 60.26 62.8 66.9 71.20
PSA-BAS Countrystat/
Selected Statistics on Agriculture
DA
i. Coffee 2012 0.63 0.39 0.84 0.87 0.88
PSA-BAS Countrystat/
Selected Statistics on Agriculture
DA
j. Cacao 2012 0.06 0.06 0.61 0.62 0.70
PSA-BAS Countrystat/
Selected Statistics on Agriculture
DA
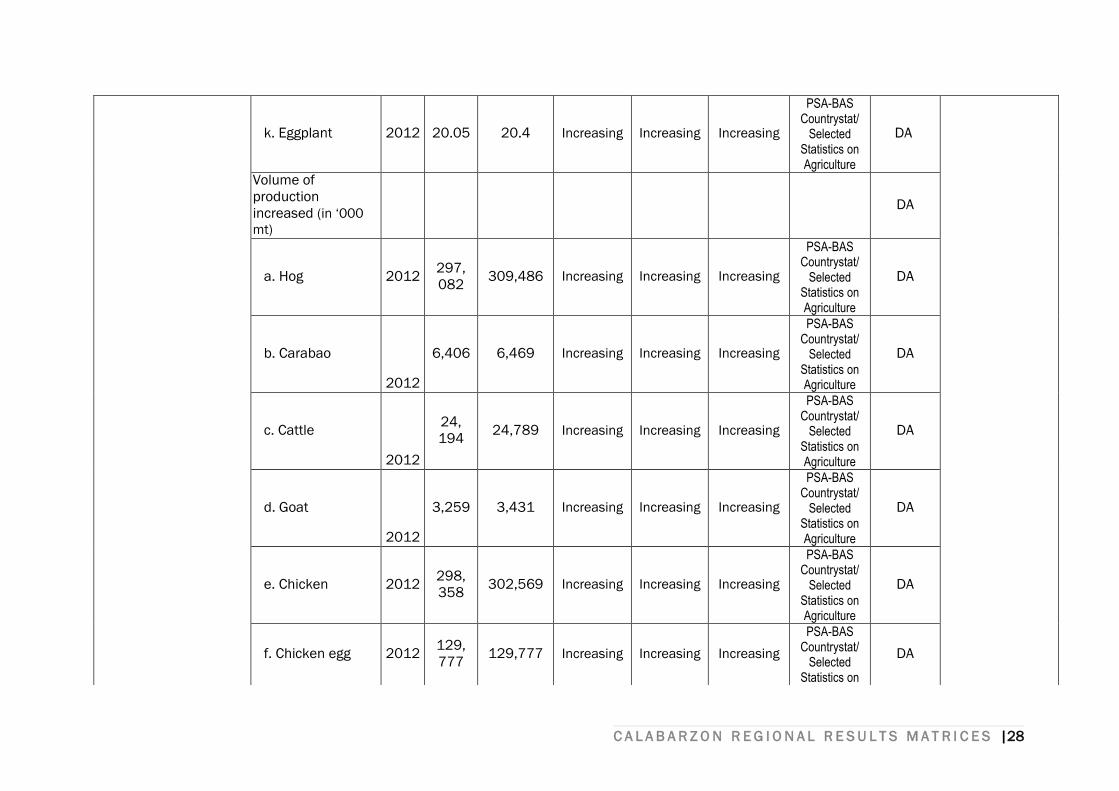
C A L A B A R Z O N R E G I O N A L R E S U L T S M A T R I C E S |28
k. Eggplant 2012 20.05 20.4 Increasing Increasing Increasing
PSA-BAS Countrystat/
Selected Statistics on Agriculture
DA
Volume of
production
increased (in ‘000
mt)
DA
a. Hog 2012 297,
082 309,486 Increasing Increasing Increasing
PSA-BAS Countrystat/
Selected Statistics on Agriculture
DA
b. Carabao
2012
6,406 6,469 Increasing Increasing Increasing
PSA-BAS Countrystat/
Selected Statistics on Agriculture
DA
c. Cattle
2012
24,
194 24,789 Increasing Increasing Increasing
PSA-BAS Countrystat/
Selected Statistics on Agriculture
DA
d. Goat
2012
3,259 3,431 Increasing Increasing Increasing
PSA-BAS Countrystat/
Selected Statistics on Agriculture
DA
e. Chicken 2012 298,
358 302,569 Increasing Increasing Increasing
PSA-BAS Countrystat/
Selected Statistics on Agriculture
DA
f. Chicken egg 2012 129,
777 129,777 Increasing Increasing Increasing
PSA-BAS Countrystat/
Selected Statistics on
DA
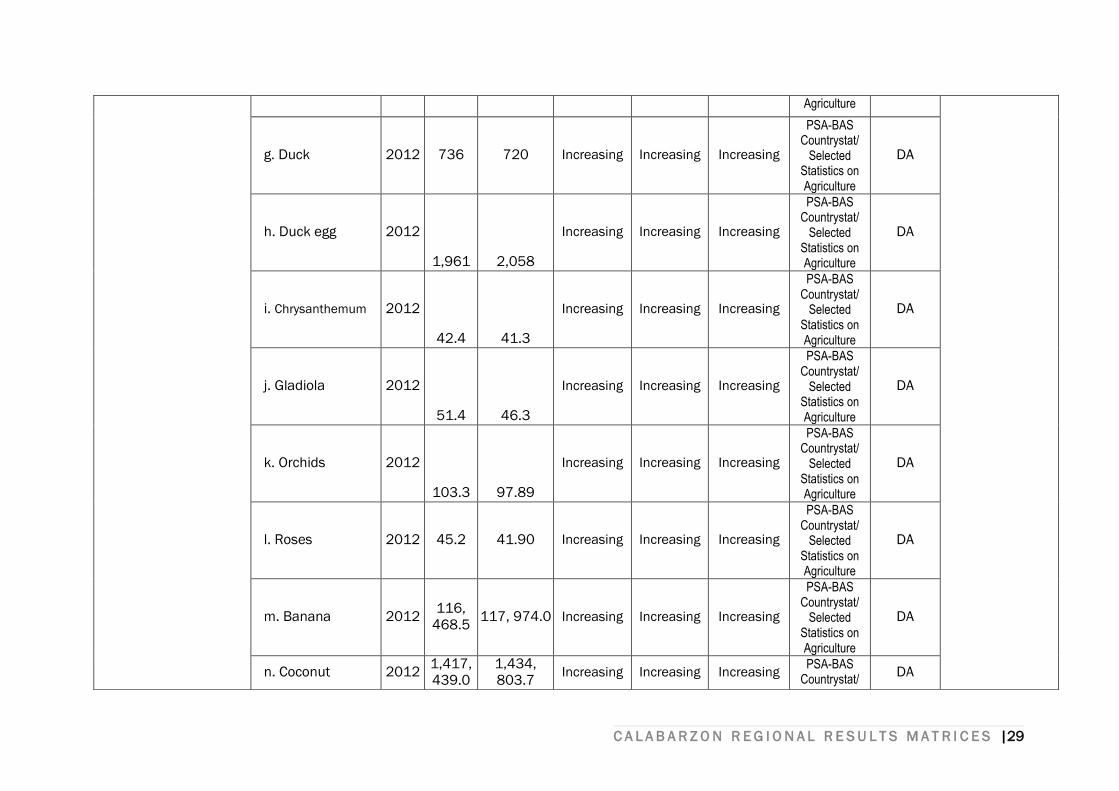
C A L A B A R Z O N R E G I O N A L R E S U L T S M A T R I C E S |29
Agriculture
g. Duck 2012 736 720 Increasing Increasing Increasing
PSA-BAS Countrystat/
Selected Statistics on Agriculture
DA
h. Duck egg 2012
1,961 2,058
Increasing Increasing Increasing
PSA-BAS Countrystat/
Selected Statistics on Agriculture
DA
i. Chrysanthemum 2012
42.4 41.3
Increasing Increasing Increasing
PSA-BAS Countrystat/
Selected Statistics on Agriculture
DA
j. Gladiola 2012
51.4 46.3
Increasing Increasing Increasing
PSA-BAS Countrystat/
Selected Statistics on Agriculture
DA
k. Orchids 2012
103.3 97.89
Increasing Increasing Increasing
PSA-BAS Countrystat/
Selected Statistics on Agriculture
DA
l. Roses 2012 45.2 41.90 Increasing Increasing Increasing
PSA-BAS Countrystat/
Selected Statistics on Agriculture
DA
m. Banana 2012 116,
468.5 117, 974.0 Increasing Increasing Increasing
PSA-BAS Countrystat/
Selected Statistics on Agriculture
DA
n. Coconut 2012 1,417,
439.0
1,434,
803.7 Increasing Increasing Increasing
PSA-BAS Countrystat/
DA
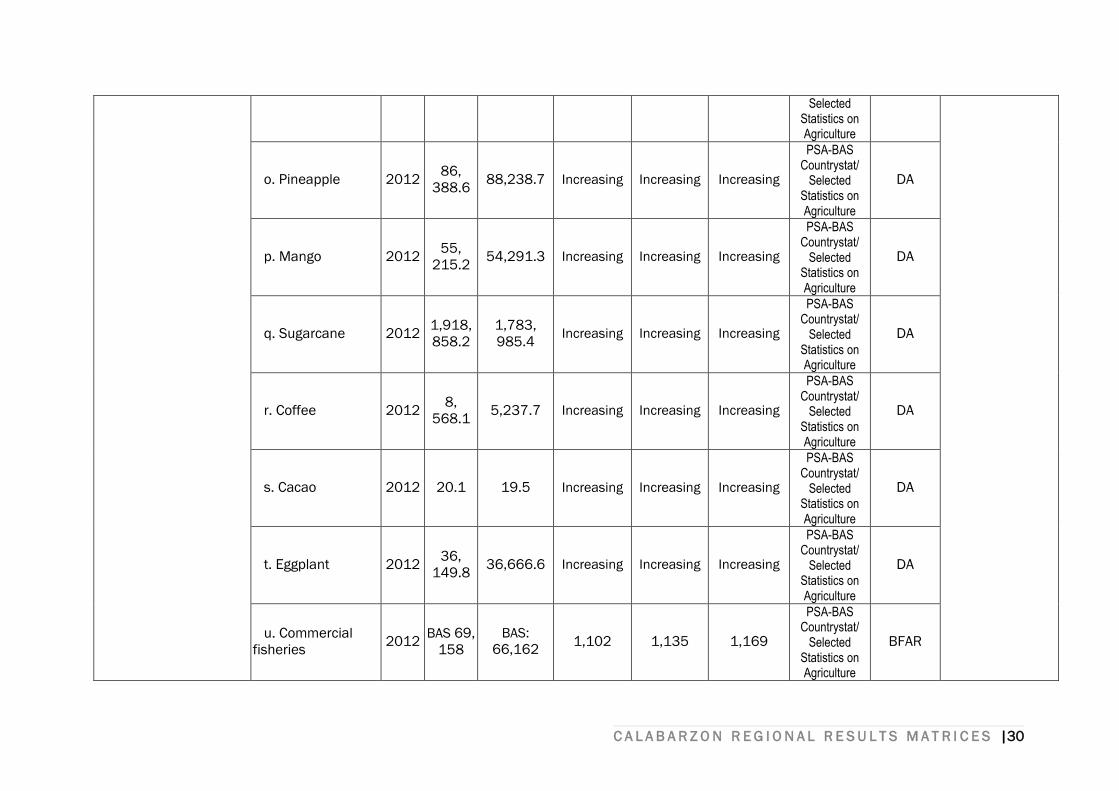
C A L A B A R Z O N R E G I O N A L R E S U L T S M A T R I C E S |30
Selected Statistics on Agriculture
o. Pineapple 2012 86,
388.6 88,238.7 Increasing Increasing Increasing
PSA-BAS Countrystat/
Selected Statistics on Agriculture
DA
p. Mango 2012 55,
215.2 54,291.3 Increasing Increasing Increasing
PSA-BAS Countrystat/
Selected Statistics on Agriculture
DA
q. Sugarcane 2012 1,918,
858.2
1,783,
985.4 Increasing Increasing Increasing
PSA-BAS Countrystat/
Selected Statistics on Agriculture
DA
r. Coffee 2012 8,
568.1 5,237.7 Increasing Increasing Increasing
PSA-BAS Countrystat/
Selected Statistics on Agriculture
DA
s. Cacao 2012 20.1 19.5 Increasing Increasing Increasing
PSA-BAS Countrystat/
Selected Statistics on Agriculture
DA
t. Eggplant 2012 36,
149.8 36,666.6 Increasing Increasing Increasing
PSA-BAS Countrystat/
Selected Statistics on Agriculture
DA
u. Commercial
fisheries 2012
BAS 69,
158
BAS:
66,162 1,102 1,135 1,169
PSA-BAS Countrystat/
Selected Statistics on Agriculture
BFAR
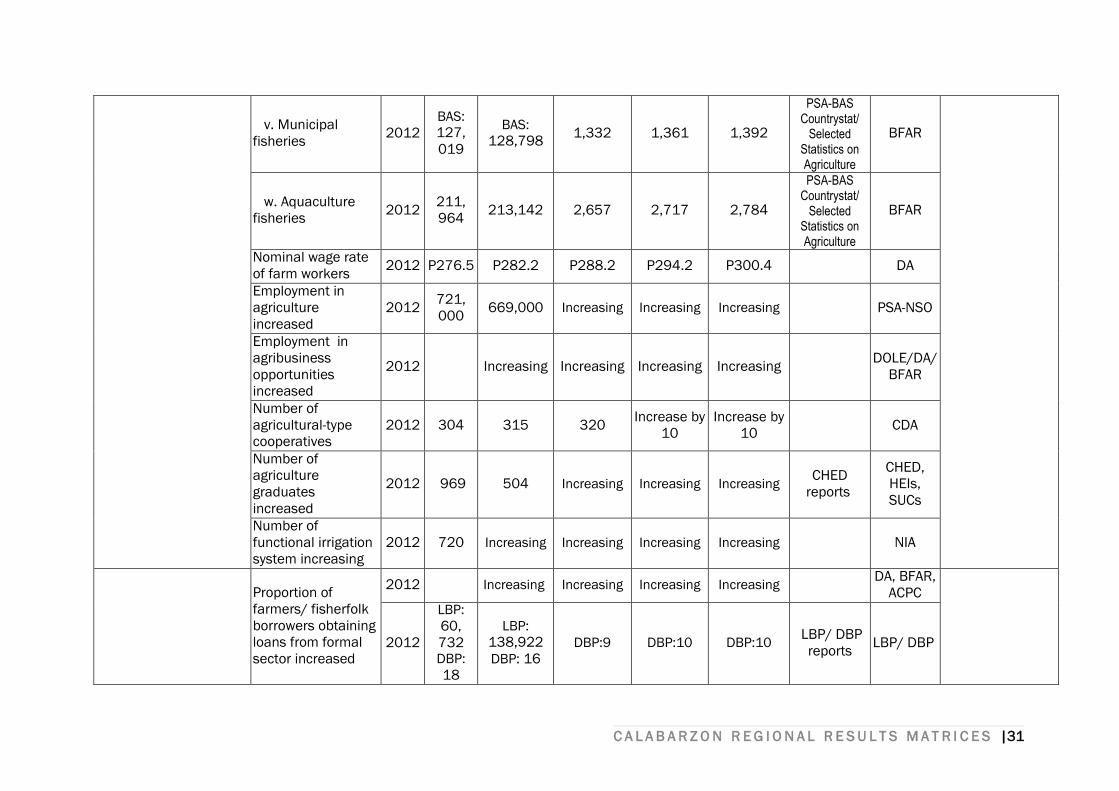
C A L A B A R Z O N R E G I O N A L R E S U L T S M A T R I C E S |31
v. Municipal
fisheries 2012
BAS: 127,
019
BAS: 128,798
1,332 1,361 1,392
PSA-BAS Countrystat/
Selected Statistics on Agriculture
BFAR
w. Aquaculture
fisheries 2012
211,
964 213,142 2,657 2,717 2,784
PSA-BAS Countrystat/
Selected Statistics on Agriculture
BFAR
Nominal wage rate
of farm workers 2012 P276.5 P282.2 P288.2 P294.2 P300.4 DA
Employment in
agriculture
increased
2012 721,
000 669,000 Increasing Increasing Increasing PSA-NSO
Employment in
agribusiness
opportunities
increased
2012 Increasing Increasing Increasing Increasing DOLE/DA/
BFAR
Number of
agricultural-type
cooperatives
2012 304 315 320 Increase by
10
Increase by
10 CDA
Number of
agriculture
graduates
increased
2012 969 504 Increasing Increasing Increasing CHED
reports
CHED,
HEIs,
SUCs
Number of
functional irrigation
system increasing
2012 720 Increasing Increasing Increasing Increasing NIA
Proportion of
farmers/ fisherfolk
borrowers obtaining
loans from formal
sector increased
2012 Increasing Increasing Increasing Increasing DA, BFAR,
ACPC
2012
LBP:
60,
732 DBP:
18
LBP:
138,922
DBP: 16 DBP:9 DBP:10 DBP:10
LBP/ DBP
reports LBP/ DBP
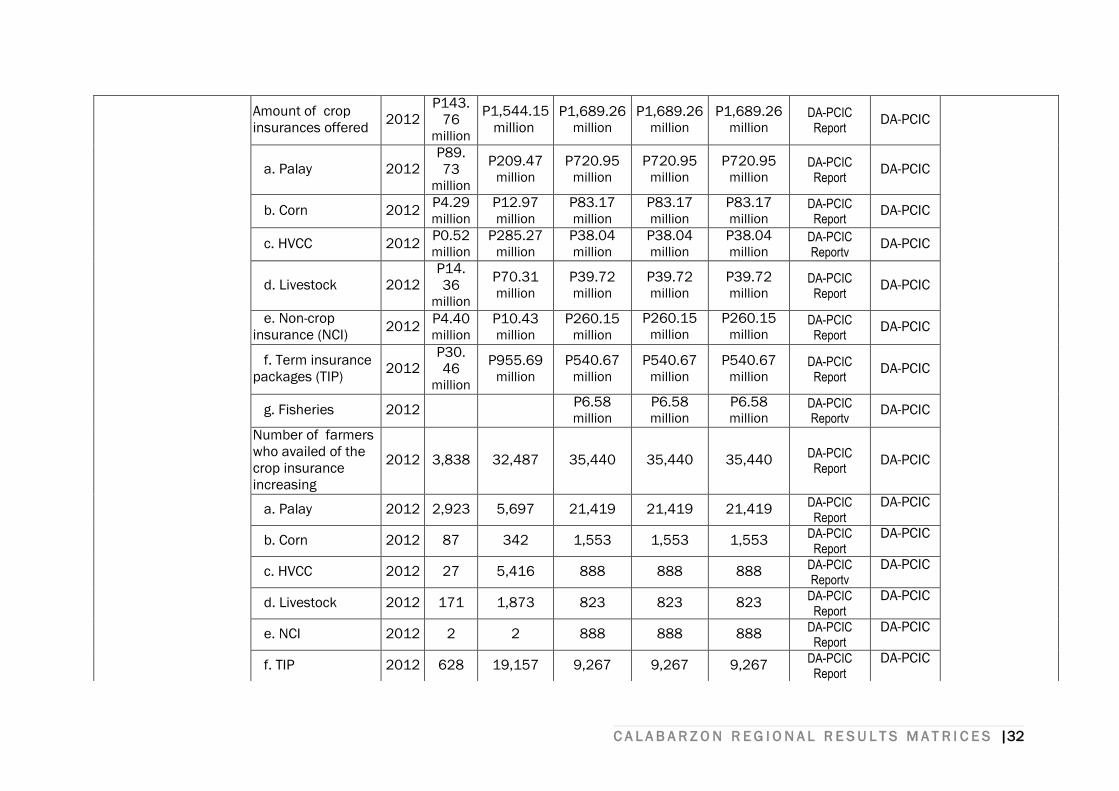
C A L A B A R Z O N R E G I O N A L R E S U L T S M A T R I C E S |32
Amount of crop
insurances offered 2012
P143.
76 million
P1,544.15
million P1,689.26
million P1,689.26
million P1,689.26
million DA-PCIC
Report DA-PCIC
a. Palay 2012 P89.
73 million
P209.47 million
P720.95 million
P720.95 million
P720.95 million
DA-PCIC Report
DA-PCIC
b. Corn 2012 P4.29 million
P12.97 million
P83.17 million
P83.17 million
P83.17 million
DA-PCIC Report
DA-PCIC
c. HVCC 2012 P0.52 million
P285.27 million
P38.04 million
P38.04 million
P38.04 million
DA-PCIC Reportv
DA-PCIC
d. Livestock 2012 P14.
36 million
P70.31 million
P39.72 million
P39.72 million
P39.72 million
DA-PCIC Report
DA-PCIC
e. Non-crop
insurance (NCI) 2012
P4.40 million
P10.43
million P260.15
million
P260.15 million
P260.15 million
DA-PCIC Report
DA-PCIC
f. Term insurance
packages (TIP) 2012
P30.
46 million
P955.69 million
P540.67 million
P540.67 million
P540.67 million
DA-PCIC Report
DA-PCIC
g. Fisheries 2012 P6.58
million P6.58
million P6.58
million DA-PCIC Reportv
DA-PCIC
Number of farmers
who availed of the
crop insurance
increasing
2012 3,838 32,487 35,440 35,440 35,440 DA-PCIC
Report DA-PCIC
a. Palay 2012 2,923 5,697 21,419 21,419 21,419 DA-PCIC
Report DA-PCIC
b. Corn 2012 87 342 1,553 1,553 1,553 DA-PCIC
Report DA-PCIC
c. HVCC 2012 27 5,416 888 888 888 DA-PCIC Reportv
DA-PCIC
d. Livestock 2012 171 1,873 823 823 823 DA-PCIC
Report DA-PCIC
e. NCI 2012 2 2 888 888 888 DA-PCIC
Report DA-PCIC
f. TIP 2012 628 19,157 9,267 9,267 9,267 DA-PCIC
Report DA-PCIC
C A L A B A R Z O N R E G I O N A L R E S U L T S M A T R I C E S |33
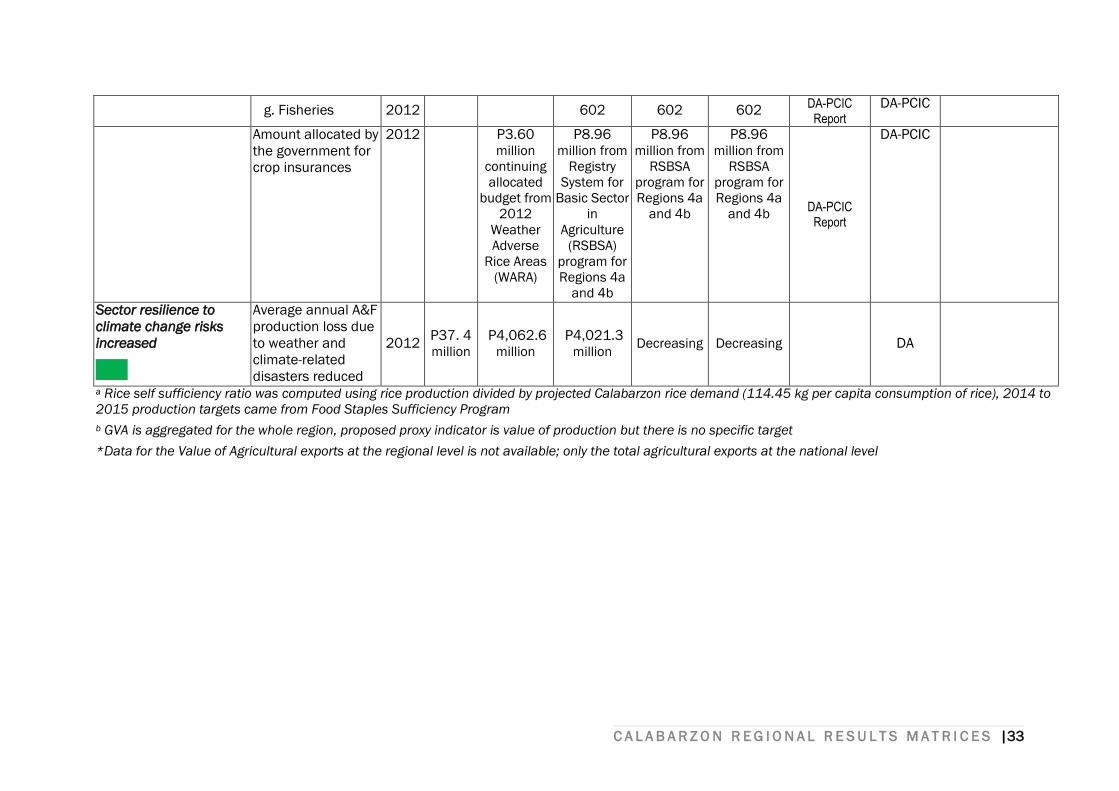
g. Fisheries 2012 602 602 602 DA-PCIC
Report DA-PCIC
Amount allocated by
the government for
crop insurances
2012 P3.60 million
continuing
allocated
budget from
2012
Weather
Adverse
Rice Areas
(WARA)
P8.96 million from
Registry
System for
Basic Sector
in
Agriculture
(RSBSA)
program for
Regions 4a
and 4b
P8.96 million from
RSBSA
program for
Regions 4a
and 4b
P8.96 million from
RSBSA
program for
Regions 4a
and 4b DA-PCIC
Report
DA-PCIC
Sector resilience to
climate change risks
increased
Average annual A&F
production loss due
to weather and
climate-related
disasters reduced
2012 P37. 4 million
P4,062.6 million
P4,021.3 million
Decreasing Decreasing DA
a Rice self sufficiency ratio was computed using rice production divided by projected Calabarzon rice demand (114.45 kg per capita consumption of rice), 2014 to
2015 production targets came from Food Staples Sufficiency Program
b GVA is aggregated for the whole region, proposed proxy indicator is value of production but there is no specific target
*Data for the Value of Agricultural exports at the regional level is not available; only the total agricultural exports at the national level
C A L A B A R Z O N R E G I O N A L R E S U L T S M A T R I C E S |34
CHAPTER V
ACCELERATING
INFRASTRUCTURE
DEVELOPMENT
C A L A B A R Z O N R E G I O N A L R E S U L T S M A T R I C E S |35
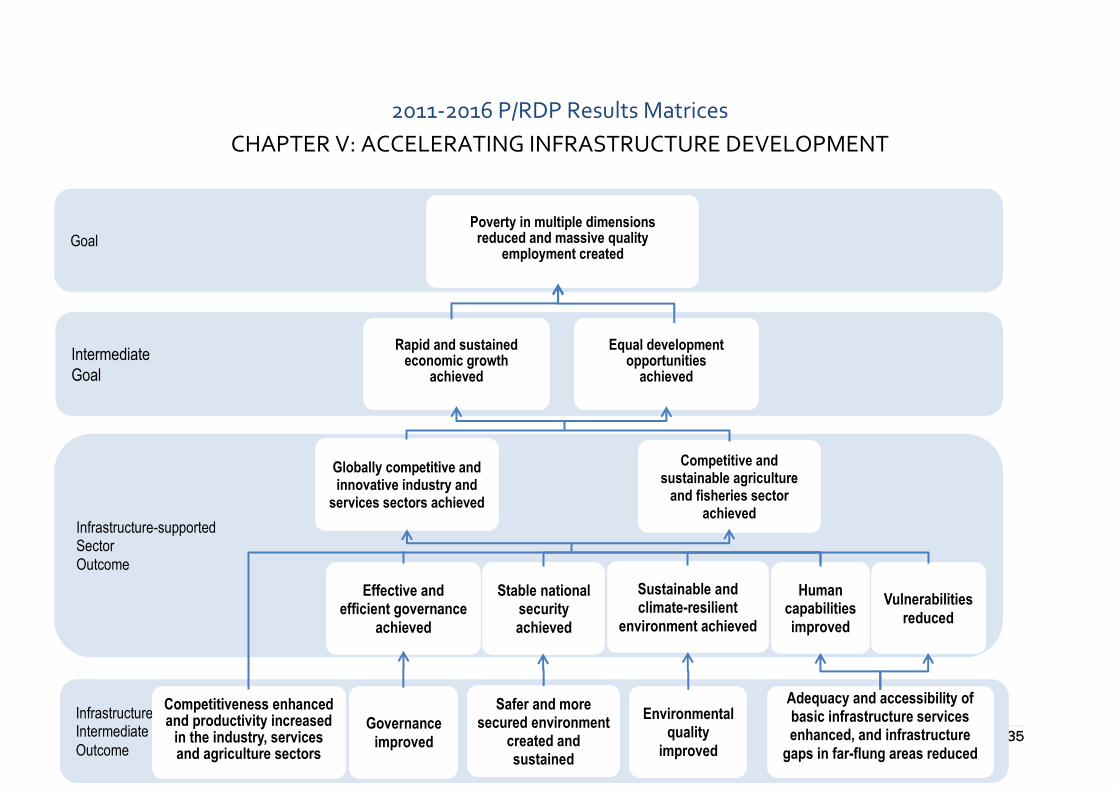
2011-2016 P/RDP Results Matrices
CHAPTER V: ACCELERATING INFRASTRUCTURE DEVELOPMENT
Infrastructure-supported
Sector Outcome
Intermediate
Goal
Goal
Poverty in multiple dimensions reduced and massive quality
employment created
Rapid and sustained
economic growth achieved
Globally competitive and innovative industry and
services sectors achieved
Effective and
efficient governance achieved
Stable national
security achieved
Human
capabilities improved
Equal development
opportunities achieved
Competitive and sustainable agriculture
and fisheries sector achieved
Sustainable and climate-resilient
environment achieved
Infrastructure
Intermediate
Outcome
Vulnerabilities
reduced
Competitiveness enhanced and productivity increased
in the industry, services and agriculture sectors
Governance
improved
Environmental
quality improved
Safer and more secured environment
created and sustained
Adequacy and accessibility of basic infrastructure services enhanced, and infrastructure
gaps in far-flung areas reduced
C A L A B A R Z O N R E G I O N A L R E S U L T S M A T R I C E S |36
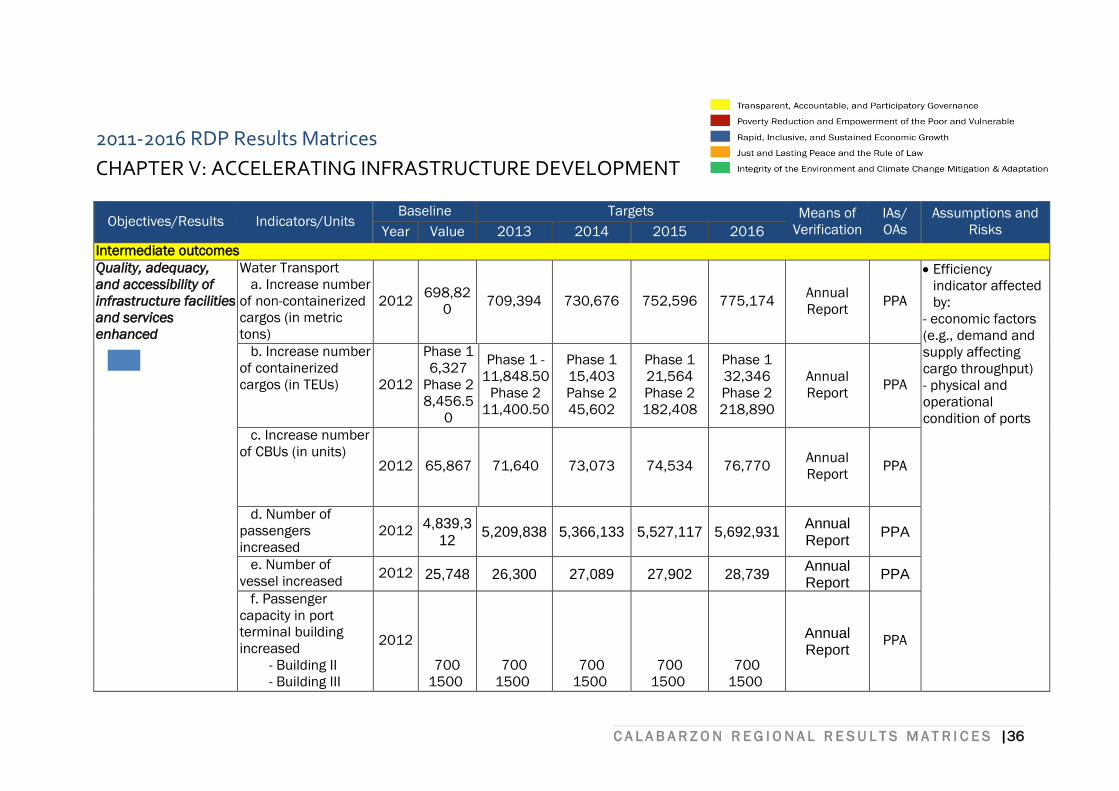
2011-2016 RDP Results Matrices
CHAPTER V: ACCELERATING INFRASTRUCTURE DEVELOPMENT
Objectives/Results Indicators/Units Baseline Targets Means of
Verification
IAs/
OAs
Assumptions and
Risks Year Value 2013 2014 2015 2016
Intermediate outcomes
Quality, adequacy,
and accessibility of
infrastructure facilities
and services
enhanced
Water Transport
a. Increase number
of non-containerized
cargos (in metric
tons)
2012 698,82
0 709,394 730,676 752,596 775,174
Annual
Report PPA
Efficiency
indicator affected
by:
- economic factors
(e.g., demand and
supply affecting
cargo throughput)
- physical and
operational
condition of ports
b. Increase number
of containerized
cargos (in TEUs) 2012
Phase 1
6,327
Phase 2
8,456.5
0
Phase 1 -
11,848.50
Phase 2
11,400.50
Phase 1
15,403
Pahse 2
45,602
Phase 1
21,564
Phase 2
182,408
Phase 1
32,346
Phase 2
218,890
Annual
Report PPA
c. Increase number
of CBUs (in units) 2012 65,867 71,640 73,073 74,534 76,770
Annual
Report PPA
d. Number of
passengers
increased
2012 4,839,3
12 5,209,838 5,366,133 5,527,117 5,692,931
Annual Report
PPA
e. Number of
vessel increased 2012 25,748 26,300 27,089 27,902 28,739
Annual Report
PPA
f. Passenger
capacity in port
terminal building
increased
- Building II
- Building III
2012
700
1500
700
1500
700
1500
700
1500
700
1500
Annual Report
PPA
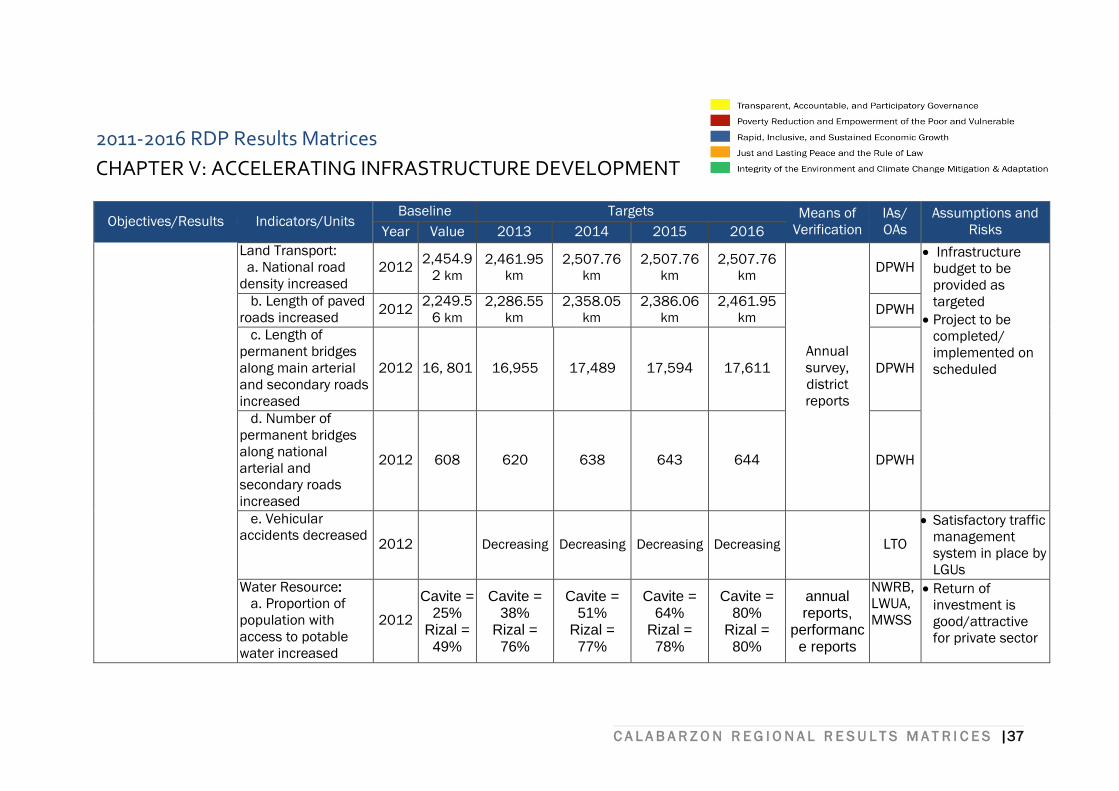
C A L A B A R Z O N R E G I O N A L R E S U L T S M A T R I C E S |37
2011-2016 RDP Results Matrices
CHAPTER V: ACCELERATING INFRASTRUCTURE DEVELOPMENT
Objectives/Results Indicators/Units Baseline Targets Means of
Verification
IAs/
OAs
Assumptions and
Risks Year Value 2013 2014 2015 2016
Land Transport:
a. National road
density increased
2012 2,454.9
2 km 2,461.95
km 2,507.76
km 2,507.76
km 2,507.76
km
Annual
survey,
district
reports
DPWH Infrastructure
budget to be
provided as
targeted
Project to be
completed/
implemented on
scheduled
b. Length of paved
roads increased 2012
2,249.5
6 km 2,286.55
km 2,358.05
km 2,386.06
km 2,461.95
km DPWH
c. Length of
permanent bridges
along main arterial
and secondary roads
increased
2012 16, 801 16,955 17,489 17,594 17,611 DPWH
d. Number of
permanent bridges
along national
arterial and
secondary roads
increased
2012 608 620 638 643 644 DPWH
e. Vehicular
accidents decreased 2012 Decreasing Decreasing Decreasing Decreasing LTO
Satisfactory traffic
management
system in place by
LGUs
Water Resource:
a. Proportion of
population with
access to potable
water increased
2012
Cavite = 25%
Rizal = 49%
Cavite = 38%
Rizal = 76%
Cavite = 51%
Rizal = 77%
Cavite = 64%
Rizal = 78%
Cavite = 80%
Rizal = 80%
annual reports,
performance reports
NWRB,
LWUA,
MWSS
Return of
investment is
good/attractive
for private sector
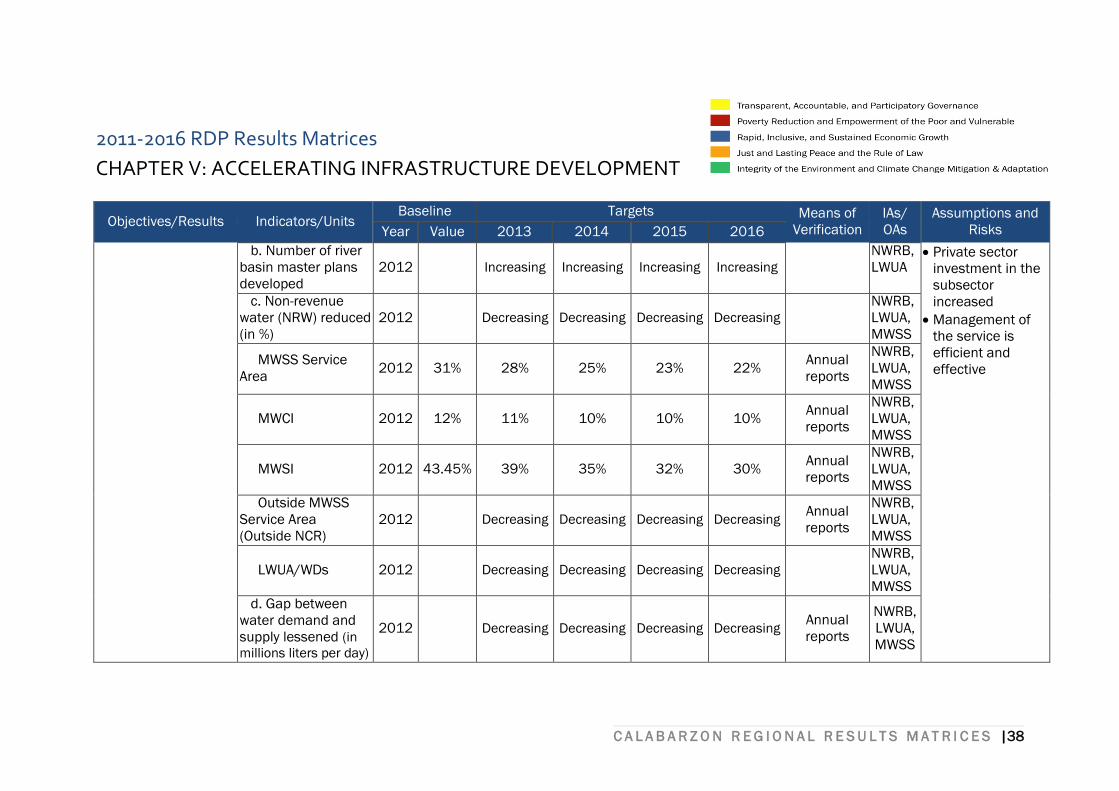
C A L A B A R Z O N R E G I O N A L R E S U L T S M A T R I C E S |38
2011-2016 RDP Results Matrices
CHAPTER V: ACCELERATING INFRASTRUCTURE DEVELOPMENT
Objectives/Results Indicators/Units Baseline Targets Means of
Verification
IAs/
OAs
Assumptions and
Risks Year Value 2013 2014 2015 2016
b. Number of river
basin master plans
developed
2012 Increasing Increasing Increasing Increasing
NWRB,
LWUA Private sector
investment in the
subsector
increased
Management of
the service is
efficient and
effective
c. Non-revenue
water (NRW) reduced
(in %)
2012 Decreasing Decreasing Decreasing Decreasing
NWRB,
LWUA,
MWSS
MWSS Service
Area 2012 31% 28% 25% 23% 22%
Annual
reports
NWRB,
LWUA,
MWSS
MWCI 2012 12% 11% 10% 10% 10% Annual
reports
NWRB,
LWUA,
MWSS
MWSI 2012 43.45% 39% 35% 32% 30% Annual
reports
NWRB,
LWUA,
MWSS
Outside MWSS
Service Area
(Outside NCR)
2012 Decreasing Decreasing Decreasing Decreasing Annual
reports
NWRB,
LWUA,
MWSS
LWUA/WDs 2012 Decreasing Decreasing Decreasing Decreasing
NWRB,
LWUA,
MWSS
d. Gap between
water demand and
supply lessened (in
millions liters per day)
2012 Decreasing Decreasing Decreasing Decreasing Annual
reports
NWRB,
LWUA,
MWSS
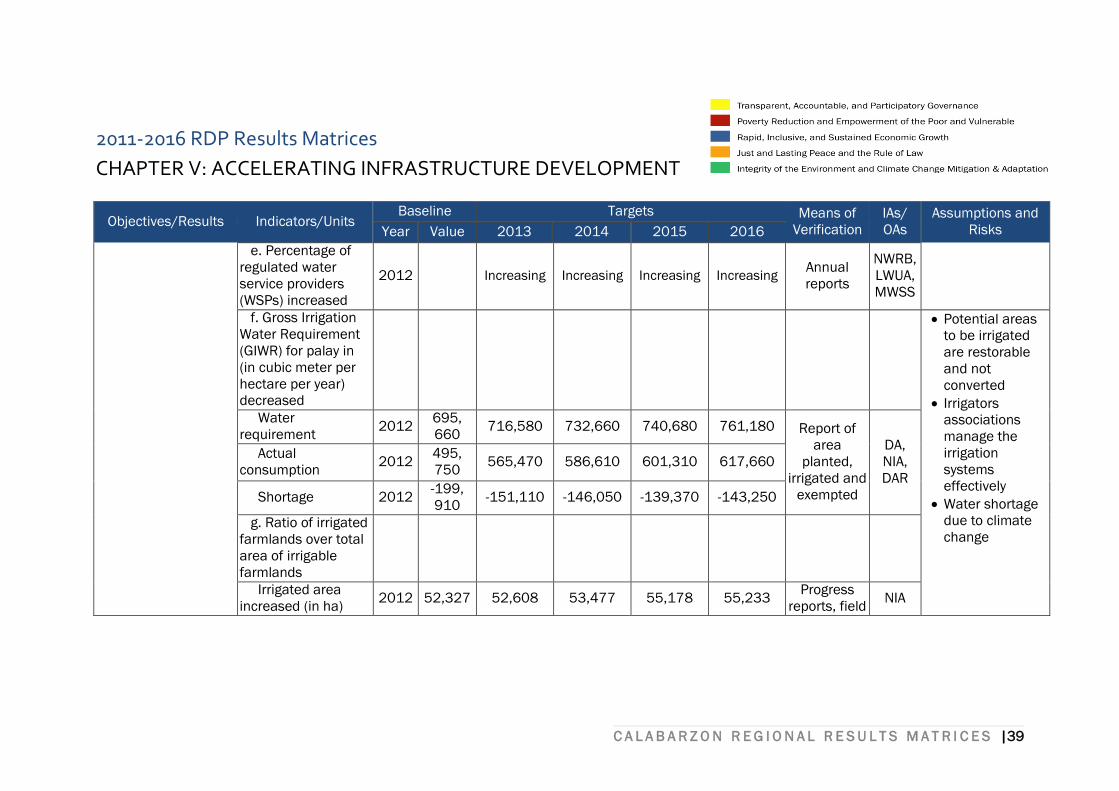
C A L A B A R Z O N R E G I O N A L R E S U L T S M A T R I C E S |39
2011-2016 RDP Results Matrices
CHAPTER V: ACCELERATING INFRASTRUCTURE DEVELOPMENT
Objectives/Results Indicators/Units Baseline Targets Means of
Verification
IAs/
OAs
Assumptions and
Risks Year Value 2013 2014 2015 2016
e. Percentage of
regulated water
service providers
(WSPs) increased
2012 Increasing Increasing Increasing Increasing Annual
reports
NWRB,
LWUA,
MWSS
f. Gross Irrigation
Water Requirement
(GIWR) for palay in
(in cubic meter per
hectare per year)
decreased
Potential areas
to be irrigated
are restorable
and not
converted
Irrigators
associations
manage the
irrigation
systems
effectively
Water shortage
due to climate
change
Water
requirement 2012
695,
660 716,580 732,660 740,680 761,180 Report of
area
planted,
irrigated and
exempted
DA,
NIA,
DAR
Actual
consumption 2012
495,
750 565,470 586,610 601,310 617,660
Shortage 2012 -199,
910 -151,110 -146,050 -139,370 -143,250
g. Ratio of irrigated
farmlands over total
area of irrigable
farmlands
Irrigated area
increased (in ha) 2012 52,327 52,608 53,477 55,178 55,233
Progress
reports, field NIA
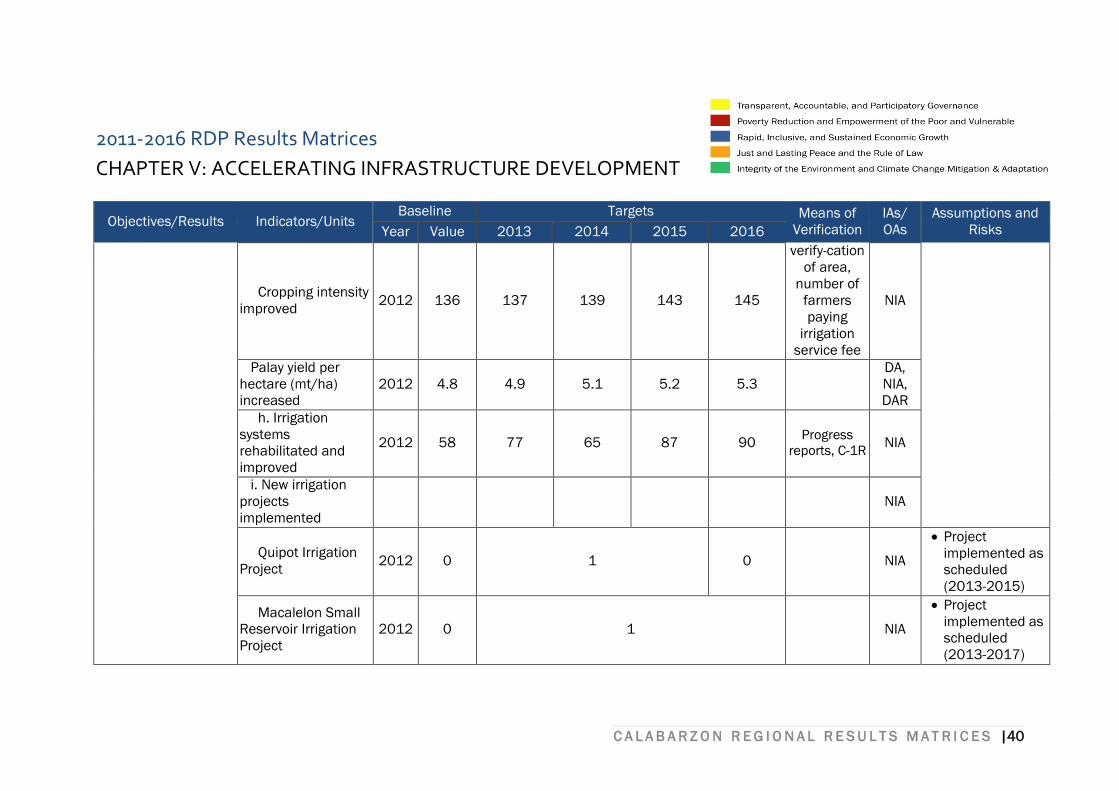
C A L A B A R Z O N R E G I O N A L R E S U L T S M A T R I C E S |40
2011-2016 RDP Results Matrices
CHAPTER V: ACCELERATING INFRASTRUCTURE DEVELOPMENT
Objectives/Results Indicators/Units Baseline Targets Means of
Verification
IAs/
OAs
Assumptions and
Risks Year Value 2013 2014 2015 2016
Cropping intensity
improved 2012 136 137 139 143 145
verify-cation
of area,
number of
farmers
paying
irrigation
service fee
NIA
Palay yield per
hectare (mt/ha)
increased
2012 4.8 4.9 5.1 5.2 5.3
DA,
NIA,
DAR
h. Irrigation
systems
rehabilitated and
improved
2012 58 77 65 87 90 Progress
reports, C-1R NIA
i. New irrigation
projects
implemented
NIA
Quipot Irrigation
Project 2012 0 1 0 NIA
Project
implemented as
scheduled
(2013-2015)
Macalelon Small
Reservoir Irrigation
Project
2012 0 1 NIA
Project
implemented as
scheduled
(2013-2017)

C A L A B A R Z O N R E G I O N A L R E S U L T S M A T R I C E S |41
2011-2016 RDP Results Matrices
CHAPTER V: ACCELERATING INFRASTRUCTURE DEVELOPMENT
Objectives/Results Indicators/Units Baseline Targets Means of
Verification
IAs/
OAs
Assumptions and
Risks Year Value 2013 2014 2015 2016
j. Areas vulnerable
to floods (in ha)
decreased
2012 Decreasing Decreasing Decreasing Decreasing
OCD,
DILG,
LGUs
Inundation
duration minimized 2012 Decreasing Decreasing Decreasing Decreasing
OCD,
DILG,
LGUs
ICT Infrastructure
a. Coverage of
cellular mobile
telephone system
(CMTS) increased
2012
Increasing Increasing Increasing Increasing Data from
LGUs
NTC,
CITC,
DOST
Sector investment
increased and
management for
the broadband
system by LGU/
private sector
satisfactory
Enabling policies/
regulations on
increasing
coverage to be
issued by
government
(DOST- ICTO, NTC,
etc.)
b. CMTS
subscription per 100
inhabitants
increased
2012
Increasing Increasing Increasing Increasing Data from
LGUs
NTC,
CITC,
DOST
c. Average
broadband speed (in
Mbps) increased
2012
Increasing Increasing Increasing Increasing Data from
LGUs
NTC,
CITC,
DOST
d. Percentage of
LGUs with
broadband
connection
increased
2012
Increasing Increasing Increasing Increasing Data from
LGUs
NTC,
CITC,
DOST
e. NGAs and
GOCCs that have 2012
Increasing Increasing Increasing Increasing Data from
LGUs
NTC,
CITC,
C A L A B A R Z O N R E G I O N A L R E S U L T S M A T R I C E S |42
2011-2016 RDP Results Matrices
CHAPTER V: ACCELERATING INFRASTRUCTURE DEVELOPMENT
Objectives/Results Indicators/Units Baseline Targets Means of
Verification
IAs/
OAs
Assumptions and
Risks Year Value 2013 2014 2015 2016
web presence
increased
DOST
f. LGUs that have
web presence
increased 2012
Increasing Increasing Increasing Increasing
Data from
LGUs
NTC,
CITC,
DOST,
LGUs
g. SUCs that have
web presence
increased 2012
Increasing Increasing Increasing Increasing
Data from
LGUs
NTC,
CITC,
DOST,
SUCs
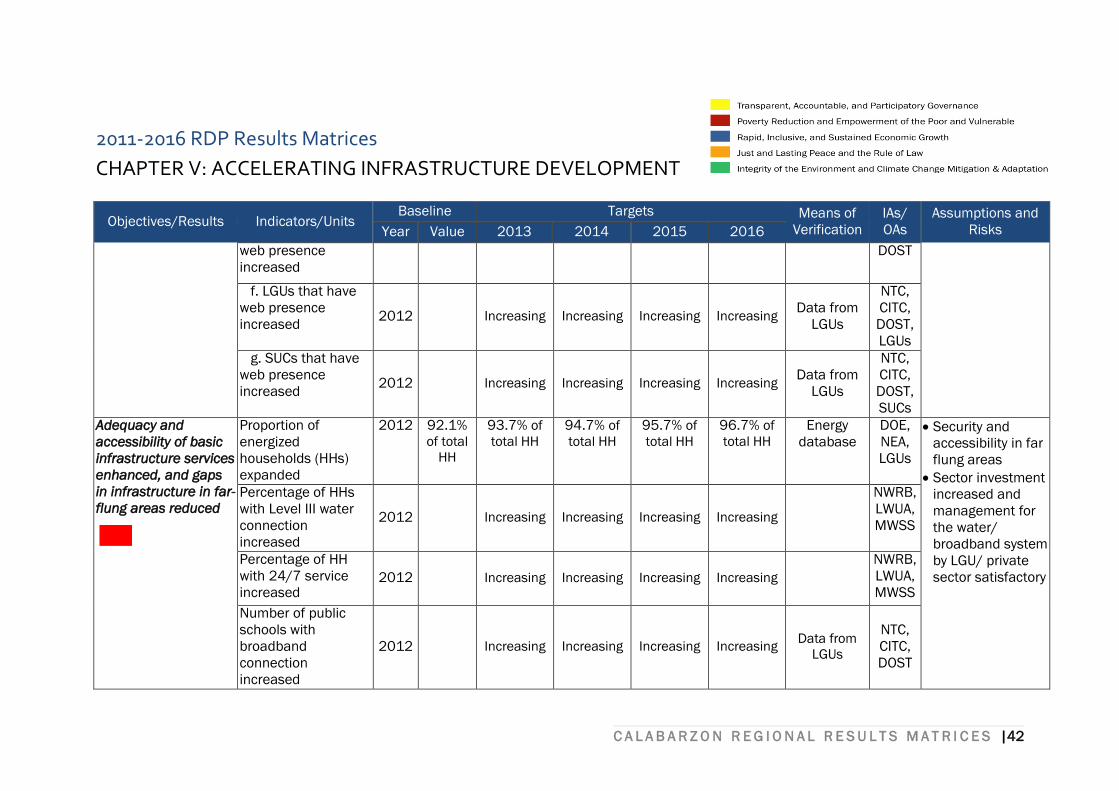
Adequacy and
accessibility of basic
infrastructure services
enhanced, and gaps
in infrastructure in far-
flung areas reduced
Proportion of
energized
households (HHs)
expanded
2012 92.1% of total
HH
93.7% of
total HH
94.7% of
total HH
95.7% of
total HH
96.7% of
total HH
Energy
database
DOE,
NEA,
LGUs
Security and
accessibility in far
flung areas
Sector investment
increased and
management for
the water/
broadband system
by LGU/ private
sector satisfactory
Percentage of HHs
with Level III water
connection
increased
2012 Increasing Increasing Increasing Increasing
NWRB,
LWUA,
MWSS
Percentage of HH
with 24/7 service
increased 2012 Increasing Increasing Increasing Increasing
NWRB,
LWUA,
MWSS
Number of public
schools with
broadband
connection
increased
2012 Increasing Increasing Increasing Increasing Data from
LGUs
NTC,
CITC,
DOST
C A L A B A R Z O N R E G I O N A L R E S U L T S M A T R I C E S |43
2011-2016 RDP Results Matrices
CHAPTER V: ACCELERATING INFRASTRUCTURE DEVELOPMENT
Objectives/Results Indicators/Units Baseline Targets Means of
Verification
IAs/
OAs
Assumptions and
Risks Year Value 2013 2014 2015 2016
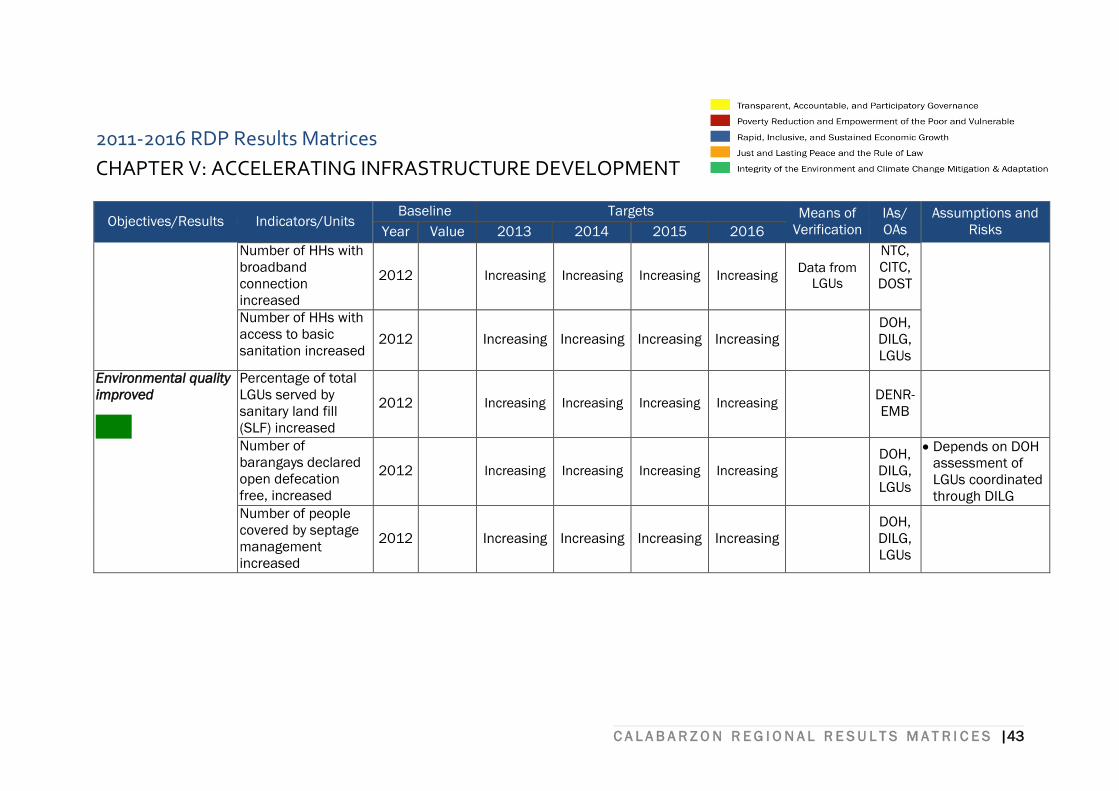
Number of HHs with
broadband
connection
increased
2012 Increasing Increasing Increasing Increasing Data from
LGUs
NTC,
CITC,
DOST
Number of HHs with
access to basic
sanitation increased 2012 Increasing Increasing Increasing Increasing
DOH,
DILG,
LGUs
Environmental quality
improved
Percentage of total
LGUs served by
sanitary land fill
(SLF) increased
2012 Increasing Increasing Increasing Increasing DENR-
EMB
Number of
barangays declared
open defecation
free, increased
2012 Increasing Increasing Increasing Increasing
DOH,
DILG,
LGUs
Depends on DOH
assessment of
LGUs coordinated
through DILG
Number of people
covered by septage
management
increased
2012 Increasing Increasing Increasing Increasing
DOH,
DILG,
LGUs
C A L A B A R Z O N R E G I O N A L R E S U L T S M A T R I C E S |44
CHAPTER VI
TOWARDS A RESILIENT AND
INCLUSIVE
FINANCIAL SYSTEM

C A L A B A R Z O N R E G I O N A L R E S U L T S M A T R I C E S |45
C A L A B A R Z O N R E G I O N A L R E S U L T S M A T R I C E S |46
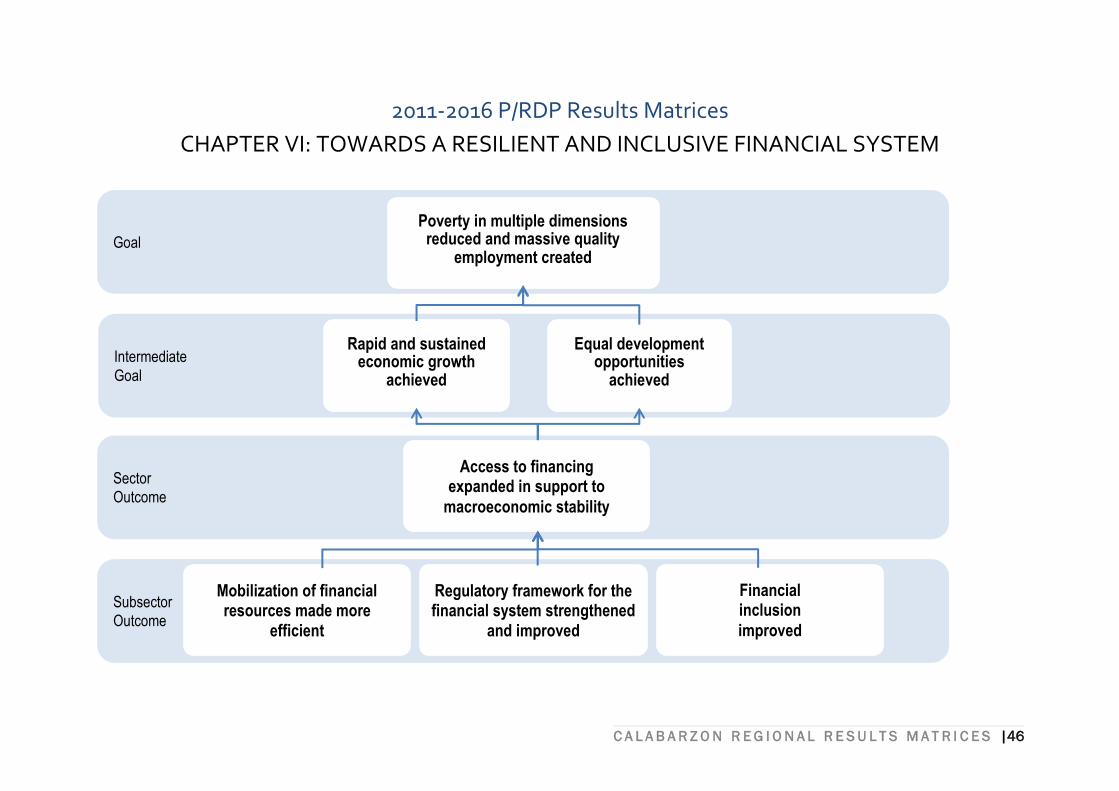
2011-2016 P/RDP Results Matrices
CHAPTER VI: TOWARDS A RESILIENT AND INCLUSIVE FINANCIAL SYSTEM
Subsector
Outcome
Sector
Outcome
Intermediate
Goal
Goal
Poverty in multiple dimensions reduced and massive quality
employment created
Rapid and sustained economic growth
achieved
Access to financing
expanded in support to
macroeconomic stability
Mobilization of financial resources made more
efficient
Regulatory framework for the financial system strengthened
and improved
Financial inclusion
improved
Equal development opportunities
achieved
C A L A B A R Z O N R E G I O N A L R E S U L T S M A T R I C E S |47
2011-2016 RDP Results Matrices
CHAPTER VI: TOWARDS A RESILIENT AND INCLUSIVE FINANCIAL SYSTEM
Objectives/Results Indicators/Units Baseline Targets Means of
Verification
IAs/
Oas
Assumptions and
Risks Year Value 2013 2014 2015 2016
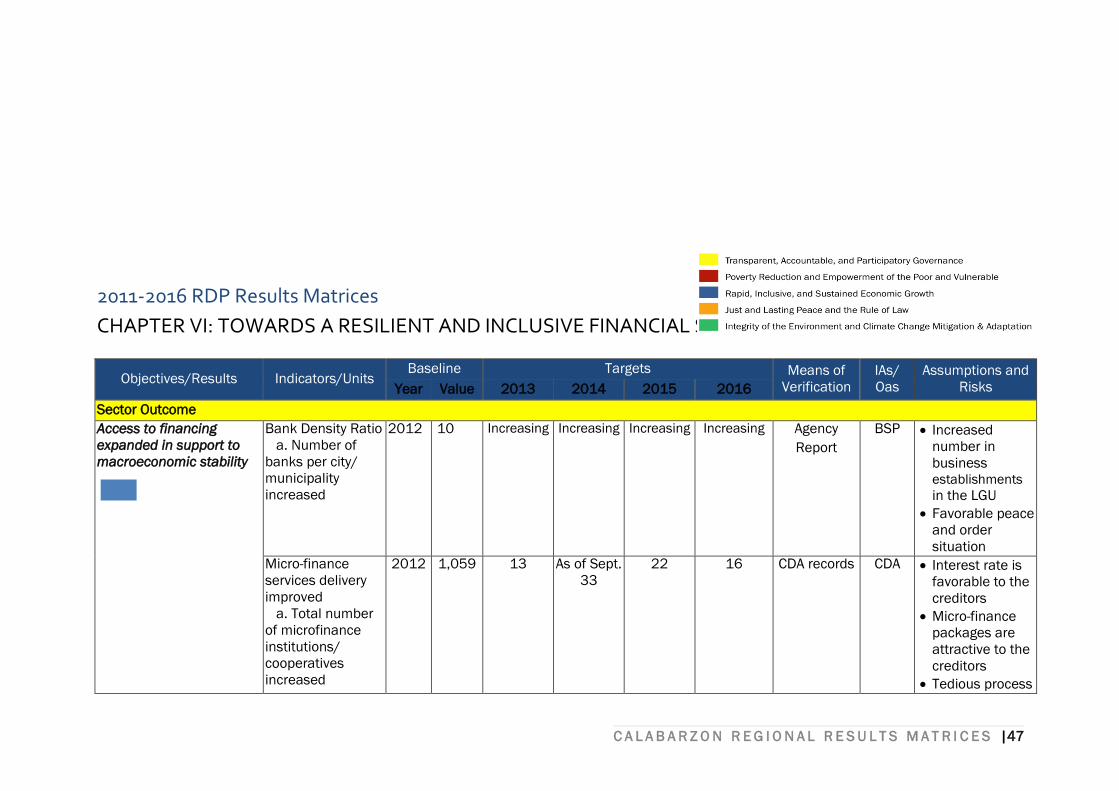
Sector Outcome
Access to financing
expanded in support to
macroeconomic stability
Bank Density Ratio
a. Number of
banks per city/
municipality
increased
2012 10 Increasing Increasing Increasing Increasing Agency
Report
BSP Increased
number in
business establishments in the LGU
Favorable peace
and order
situation
Micro-finance
services delivery
improved
a. Total number
of microfinance
institutions/
cooperatives
increased
2012 1,059 13 As of Sept.
33
22 16 CDA records CDA Interest rate is
favorable to the
creditors
Micro-finance
packages are
attractive to the
creditors
Tedious process

C A L A B A R Z O N R E G I O N A L R E S U L T S M A T R I C E S |48
for the creditors
Non-payment of
the creditors to
their loans

C A L A B A R Z O N R E G I O N A L R E S U L T S M A T R I C E S |49
CHAPTER VII
GOOD GOVERNANCE AND
THE RULE OF LAW
C A L A B A R Z O N R E G I O N A L R E S U L T S M A T R I C E S |50
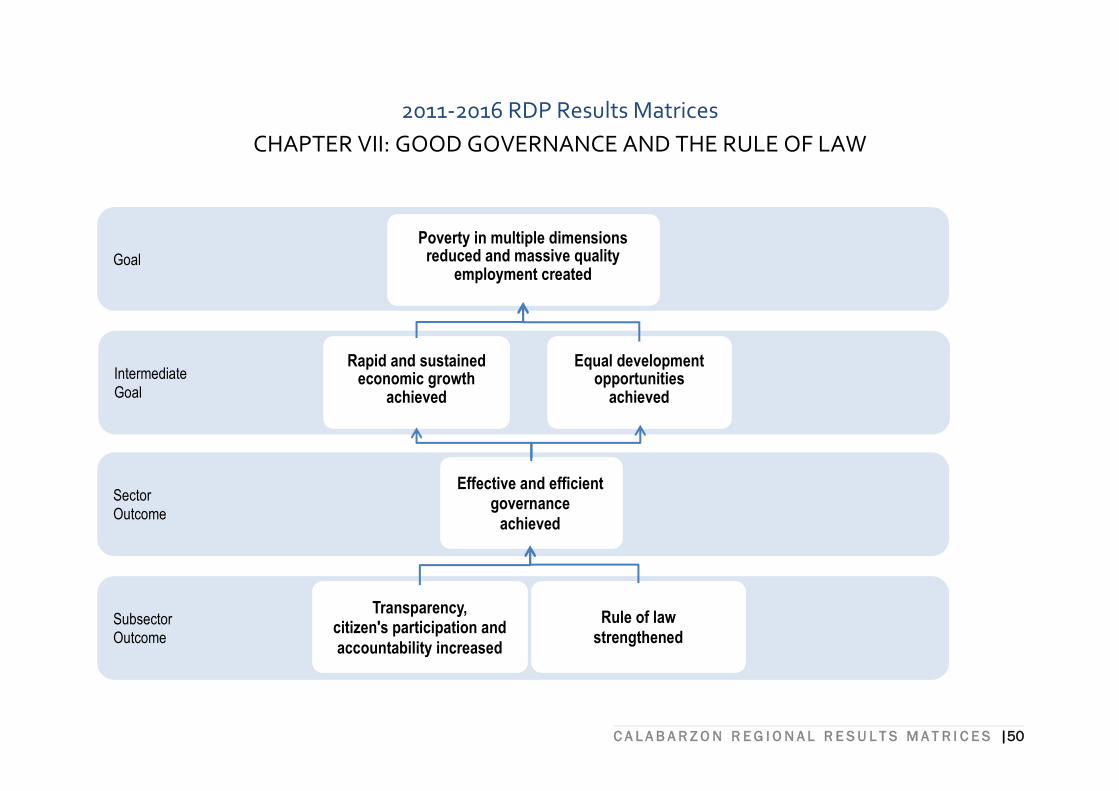
2011-2016 RDP Results Matrices
CHAPTER VII: GOOD GOVERNANCE AND THE RULE OF LAW
Subsector Outcome
Sector Outcome
Intermediate
Goal
Goal
Poverty in multiple dimensions reduced and massive quality
employment created
Rapid and sustained economic growth
achieved
Effective and efficient governance
achieved
Transparency, citizen's participation and
accountability increased
Rule of law
strengthened
Equal development opportunities
achieved
C A L A B A R Z O N R E G I O N A L R E S U L T S M A T R I C E S |51
2011-2016 RDP Results Matrices
CHAPTER VII: GOOD GOVERNANCE AND THE RULE OF LAW
Objectives/Results Indicators/Units Baseline Targets Means of
Verificatio
n
IAs/
OAs
Assumptions and
Risks Year Value 2013 2014 2015 2016
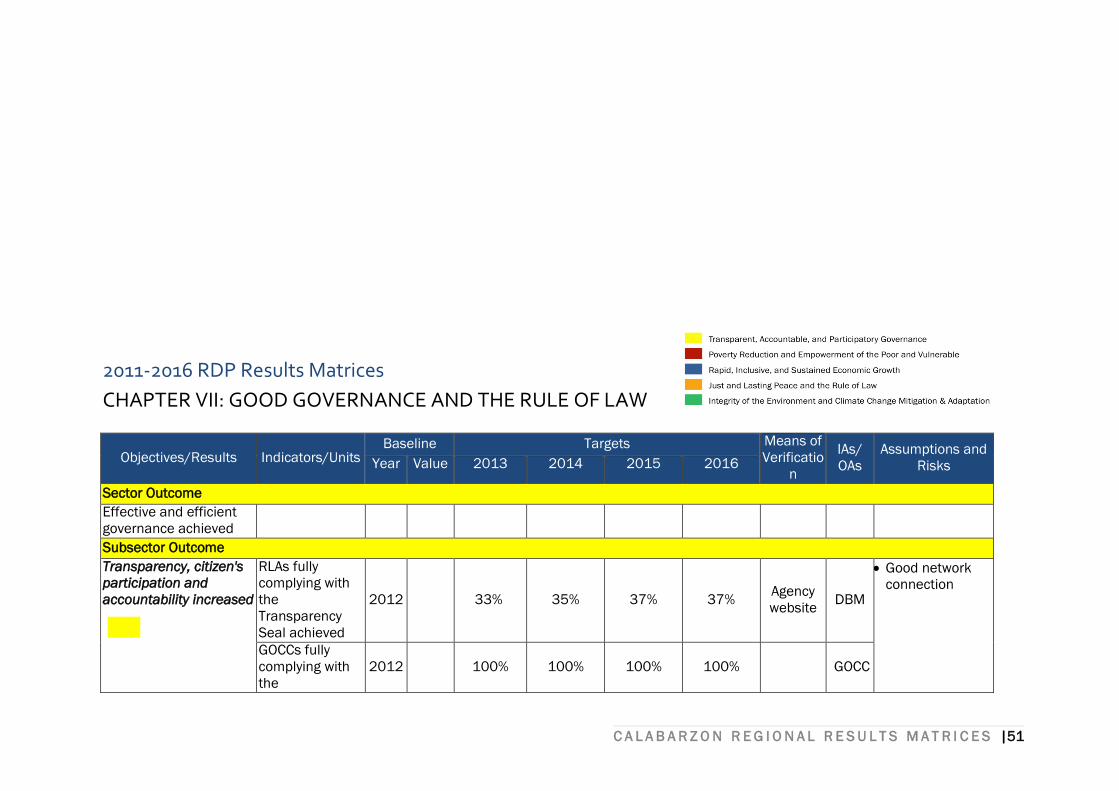
Sector Outcome
Effective and efficient
governance achieved
Subsector Outcome
Transparency, citizen's
participation and
accountability increased
RLAs fully
complying with
the
Transparency
Seal achieved
2012 33% 35% 37% 37% Agency
website DBM
Good network
connection
GOCCs fully
complying with
the
2012
100% 100% 100% 100% GOCC
C A L A B A R Z O N R E G I O N A L R E S U L T S M A T R I C E S |52
2011-2016 RDP Results Matrices
CHAPTER VII: GOOD GOVERNANCE AND THE RULE OF LAW
Objectives/Results Indicators/Units Baseline Targets Means of
Verificatio
n
IAs/
OAs
Assumptions and
Risks Year Value 2013 2014 2015 2016
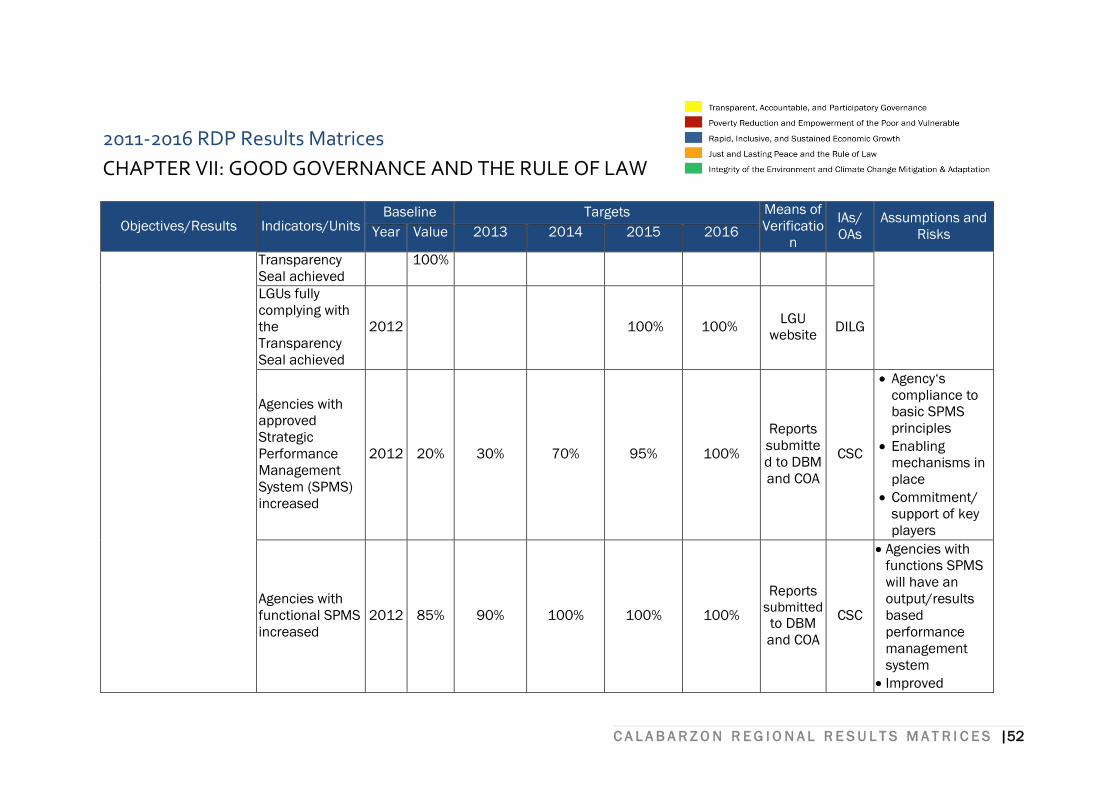
Transparency
Seal achieved
100%
LGUs fully
complying with
the
Transparency
Seal achieved
2012 100% 100% LGU
website DILG
Agencies with
approved
Strategic
Performance
Management
System (SPMS)
increased
2012 20% 30% 70% 95% 100%
Reports
submitte
d to DBM
and COA
CSC
Agency‘s
compliance to
basic SPMS
principles
Enabling
mechanisms in
place
Commitment/
support of key
players
Agencies with
functional SPMS
increased
2012 85% 90% 100% 100% 100%
Reports submitted
to DBM
and COA
CSC
Agencies with
functions SPMS
will have an
output/results
based
performance
management
system
Improved
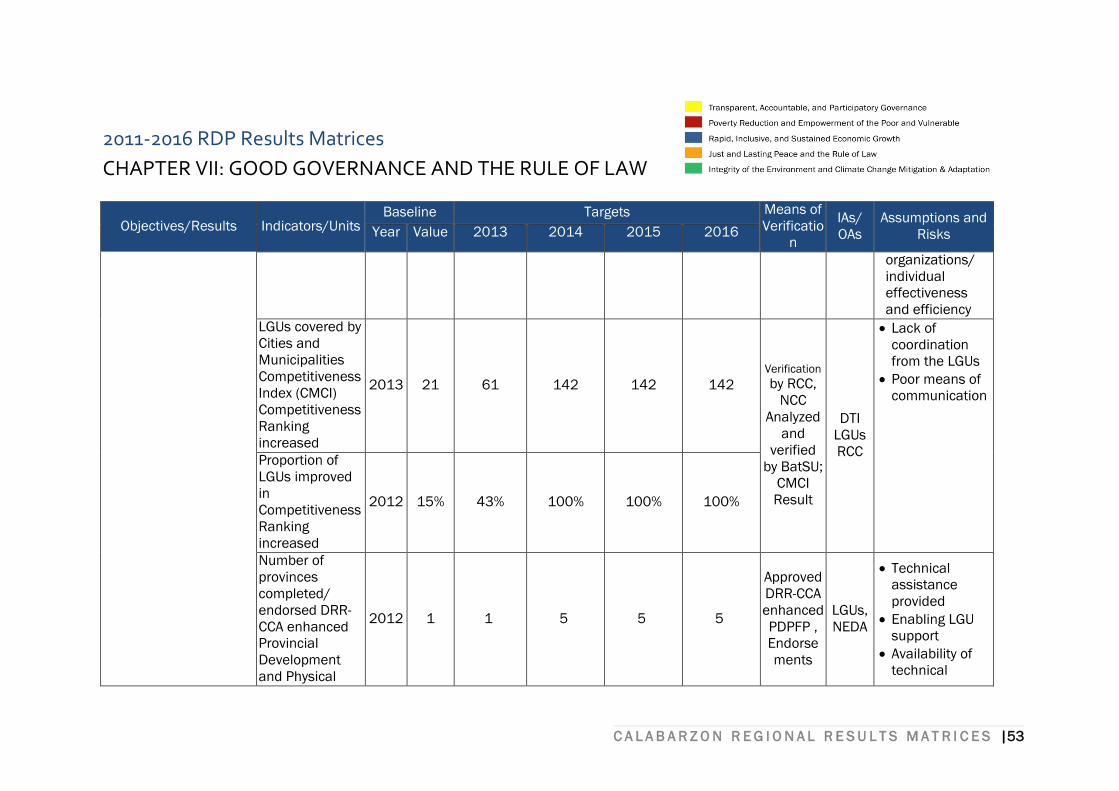
C A L A B A R Z O N R E G I O N A L R E S U L T S M A T R I C E S |53
2011-2016 RDP Results Matrices
CHAPTER VII: GOOD GOVERNANCE AND THE RULE OF LAW
Objectives/Results Indicators/Units Baseline Targets Means of
Verificatio
n
IAs/
OAs
Assumptions and
Risks Year Value 2013 2014 2015 2016
organizations/
individual
effectiveness
and efficiency
LGUs covered by
Cities and
Municipalities
Competitiveness
Index (CMCI)
Competitiveness
Ranking
increased
2013 21 61 142 142 142
Verification
by RCC,
NCC
Analyzed
and
verified
by BatSU;
CMCI
Result
DTI
LGUs
RCC
Lack of
coordination
from the LGUs
Poor means of
communication
Proportion of
LGUs improved
in
Competitiveness
Ranking
increased
2012 15% 43% 100% 100% 100%
Number of
provinces
completed/
endorsed DRR-
CCA enhanced
Provincial
Development
and Physical
2012 1 1 5 5 5
Approved
DRR-CCA
enhanced
PDPFP ,
Endorse
ments
LGUs,
NEDA
Technical
assistance
provided
Enabling LGU
support
Availability of
technical
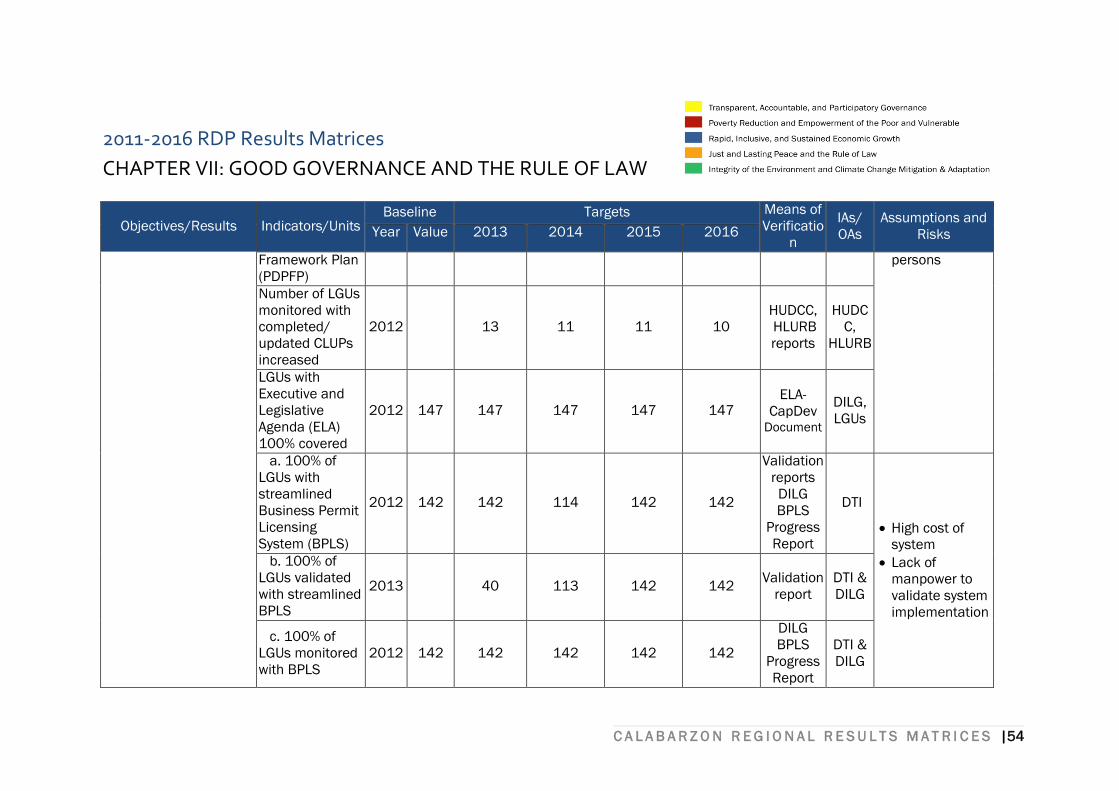
C A L A B A R Z O N R E G I O N A L R E S U L T S M A T R I C E S |54
2011-2016 RDP Results Matrices
CHAPTER VII: GOOD GOVERNANCE AND THE RULE OF LAW
Objectives/Results Indicators/Units Baseline Targets Means of
Verificatio
n
IAs/
OAs
Assumptions and
Risks Year Value 2013 2014 2015 2016
Framework Plan
(PDPFP)
persons
Number of LGUs
monitored with
completed/
updated CLUPs
increased
2012 13 11 11 10
HUDCC,
HLURB
reports
HUDC
C,
HLURB
LGUs with
Executive and
Legislative
Agenda (ELA)
100% covered
2012 147 147 147 147 147 ELA-
CapDev Document
DILG,
LGUs
a. 100% of
LGUs with
streamlined
Business Permit
Licensing
System (BPLS)
2012 142 142 114 142 142
Validation
reports
DILG
BPLS
Progress
Report
DTI
High cost of
system
Lack of
manpower to
validate system
implementation
b. 100% of
LGUs validated
with streamlined
BPLS
2013
40 113 142 142 Validation
report
DTI &
DILG
c. 100% of
LGUs monitored
with BPLS
2012 142 142 142 142 142
DILG
BPLS
Progress
Report
DTI &
DILG
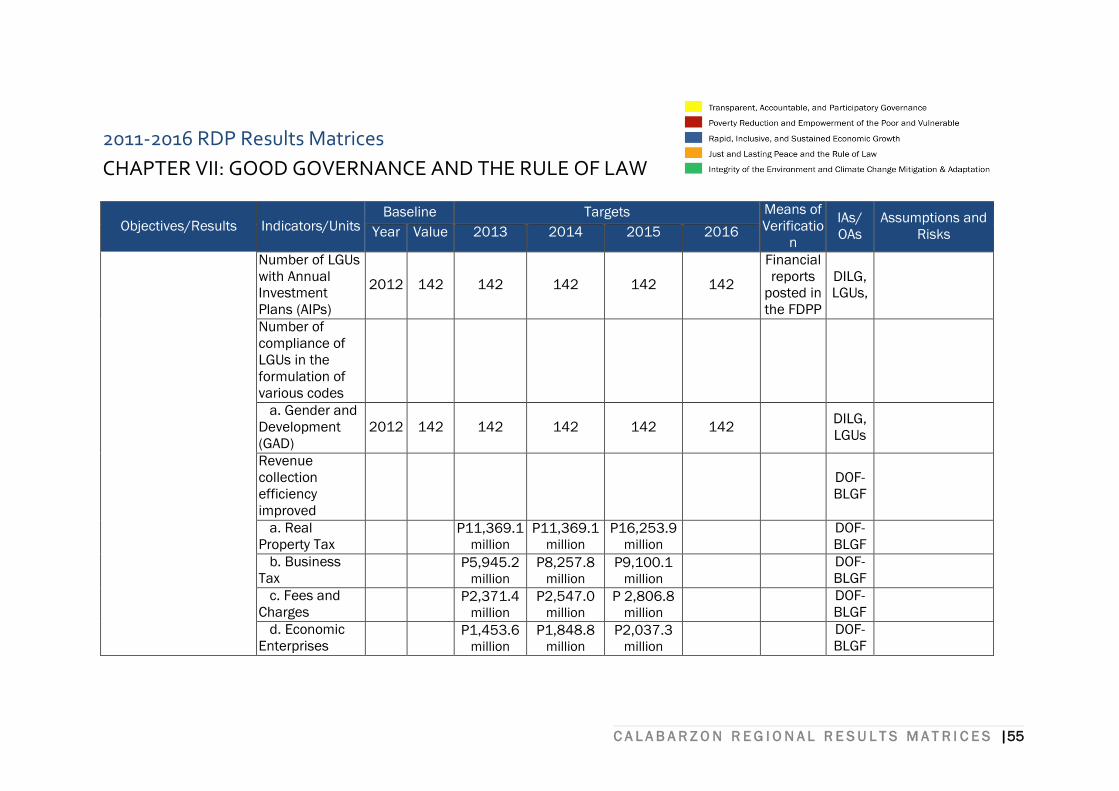
C A L A B A R Z O N R E G I O N A L R E S U L T S M A T R I C E S |55
2011-2016 RDP Results Matrices
CHAPTER VII: GOOD GOVERNANCE AND THE RULE OF LAW
Objectives/Results Indicators/Units Baseline Targets Means of
Verificatio
n
IAs/
OAs
Assumptions and
Risks Year Value 2013 2014 2015 2016
Number of LGUs
with Annual
Investment
Plans (AIPs)
2012 142 142 142 142 142
Financial
reports
posted in
the FDPP
DILG,
LGUs,
Number of
compliance of
LGUs in the
formulation of
various codes
a. Gender and
Development
(GAD)
2012 142 142 142 142 142 DILG,
LGUs
Revenue
collection
efficiency
improved
DOF-
BLGF
a. Real
Property Tax P11,369.1
million P11,369.1
million P16,253.9
million
DOF-
BLGF
b. Business
Tax
P5,945.2 million
P8,257.8 million
P9,100.1 million
DOF-
BLGF
c. Fees and
Charges
P2,371.4 million
P2,547.0 million
P 2,806.8 million
DOF-
BLGF
d. Economic
Enterprises
P1,453.6 million
P1,848.8 million
P2,037.3 million
DOF-
BLGF
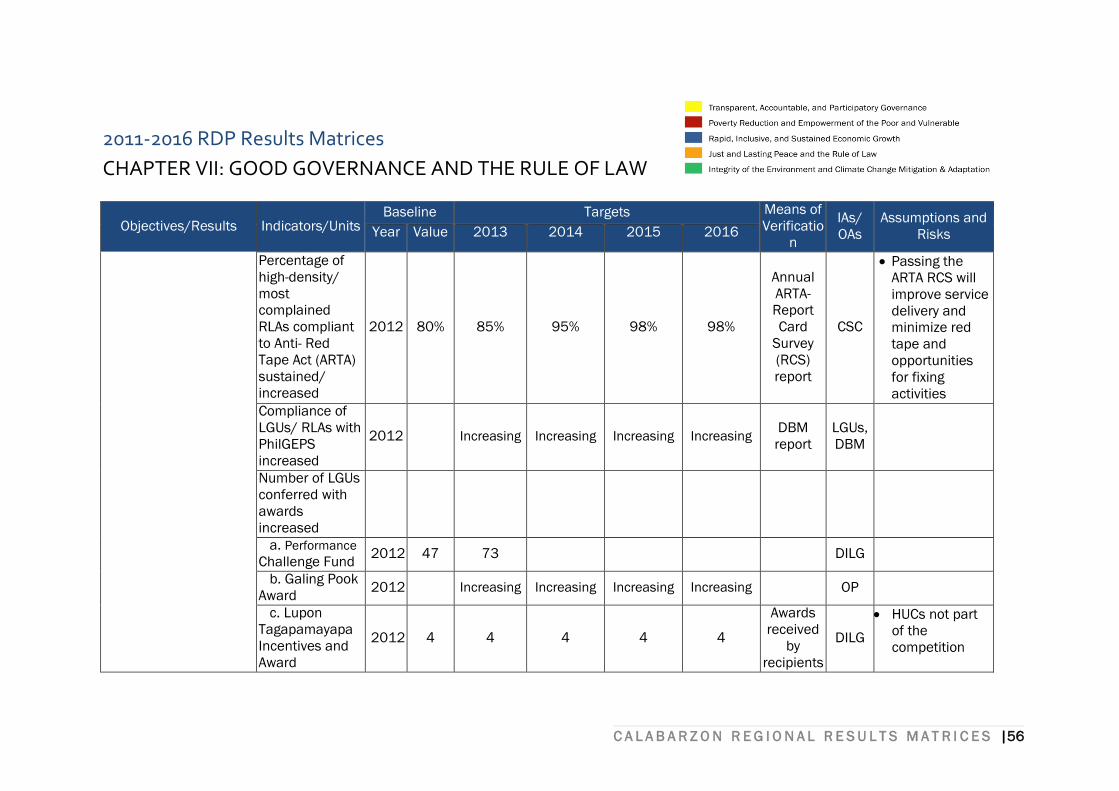
C A L A B A R Z O N R E G I O N A L R E S U L T S M A T R I C E S |56
2011-2016 RDP Results Matrices
CHAPTER VII: GOOD GOVERNANCE AND THE RULE OF LAW
Objectives/Results Indicators/Units Baseline Targets Means of
Verificatio
n
IAs/
OAs
Assumptions and
Risks Year Value 2013 2014 2015 2016
Percentage of
high-density/
most
complained
RLAs compliant
to Anti- Red
Tape Act (ARTA)
sustained/
increased
2012 80% 85% 95% 98% 98%
Annual
ARTA-
Report
Card
Survey
(RCS)
report
CSC
Passing the
ARTA RCS will
improve service
delivery and
minimize red
tape and
opportunities
for fixing
activities
Compliance of
LGUs/ RLAs with
PhilGEPS
increased
2012 Increasing Increasing Increasing Increasing DBM
report
LGUs,
DBM
Number of LGUs
conferred with
awards
increased
a. Performance
Challenge Fund 2012 47 73 DILG
b. Galing Pook
Award 2012 Increasing Increasing Increasing Increasing OP
c. Lupon
Tagapamayapa
Incentives and
Award
2012 4 4 4 4 4
Awards
received
by
recipients
DILG
HUCs not part
of the
competition
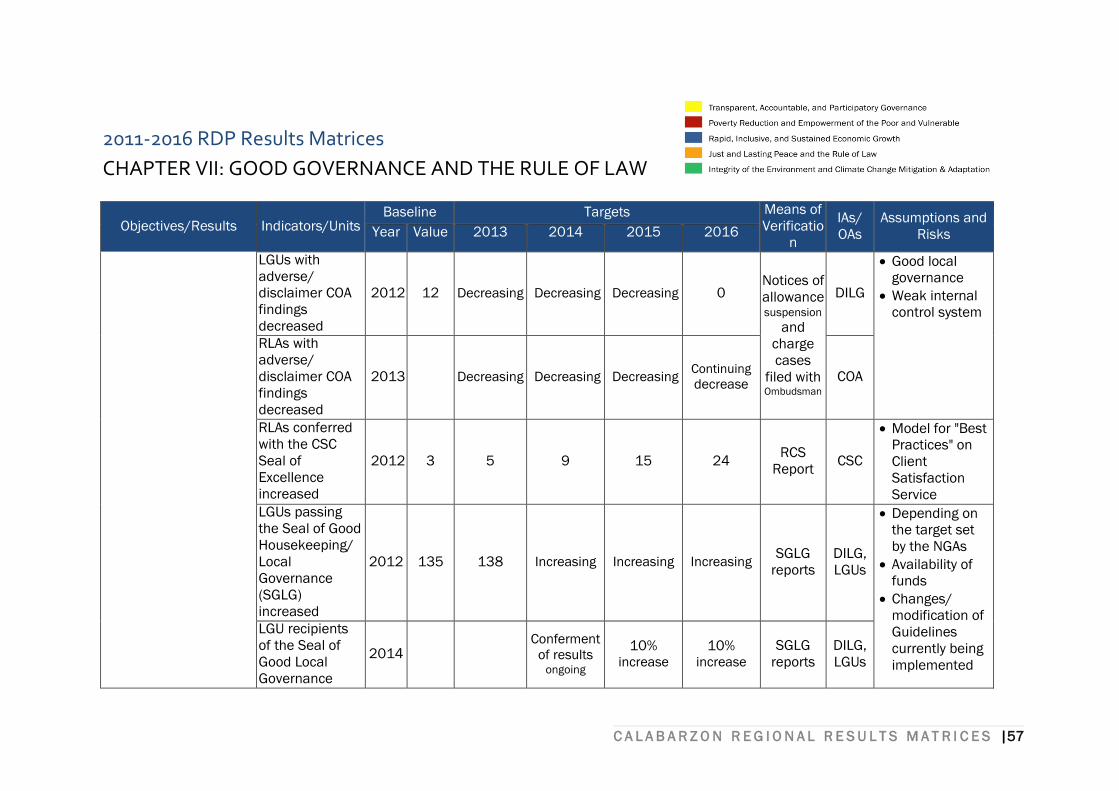
C A L A B A R Z O N R E G I O N A L R E S U L T S M A T R I C E S |57
2011-2016 RDP Results Matrices
CHAPTER VII: GOOD GOVERNANCE AND THE RULE OF LAW
Objectives/Results Indicators/Units Baseline Targets Means of
Verificatio
n
IAs/
OAs
Assumptions and
Risks Year Value 2013 2014 2015 2016
LGUs with
adverse/
disclaimer COA
findings
decreased
2012 12 Decreasing Decreasing Decreasing 0 Notices of
allowance suspension
and
charge
cases
filed with Ombudsman
DILG
Good local
governance
Weak internal
control system
RLAs with
adverse/
disclaimer COA
findings
decreased
2013
Decreasing Decreasing Decreasing Continuing
decrease COA
RLAs conferred
with the CSC
Seal of
Excellence
increased
2012 3 5 9 15 24 RCS
Report CSC
Model for "Best
Practices" on
Client
Satisfaction
Service
LGUs passing
the Seal of Good
Housekeeping/
Local
Governance
(SGLG)
increased
2012 135 138 Increasing Increasing Increasing SGLG
reports
DILG,
LGUs
Depending on
the target set
by the NGAs
Availability of
funds
Changes/
modification of
Guidelines
currently being
implemented
LGU recipients
of the Seal of
Good Local
Governance
2014
Conferment
of results ongoing
10% increase
10% increase
SGLG
reports
DILG,
LGUs
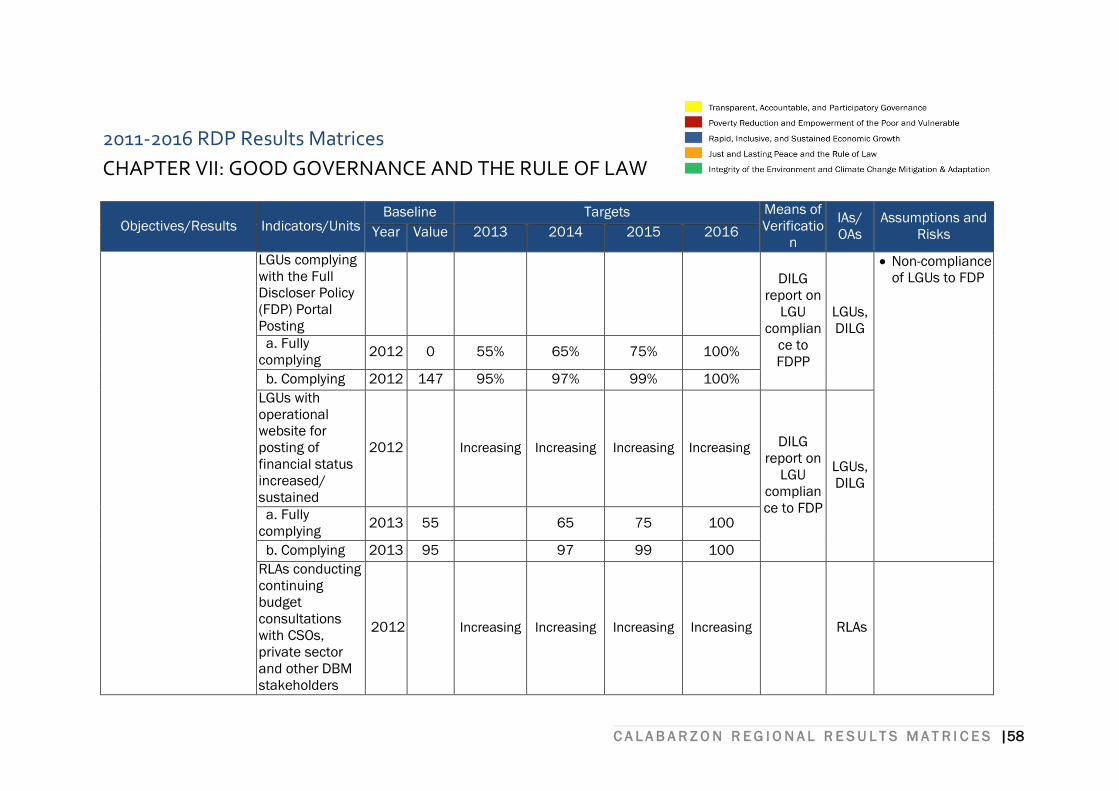
C A L A B A R Z O N R E G I O N A L R E S U L T S M A T R I C E S |58
2011-2016 RDP Results Matrices
CHAPTER VII: GOOD GOVERNANCE AND THE RULE OF LAW
Objectives/Results Indicators/Units Baseline Targets Means of
Verificatio
n
IAs/
OAs
Assumptions and
Risks Year Value 2013 2014 2015 2016
LGUs complying
with the Full
Discloser Policy
(FDP) Portal
Posting
DILG
report on
LGU
complian
ce to
FDPP
LGUs,
DILG
Non-compliance
of LGUs to FDP
a. Fully
complying 2012 0 55% 65% 75% 100%
b. Complying 2012 147 95% 97% 99% 100%
LGUs with
operational
website for
posting of
financial status
increased/
sustained
2012 Increasing Increasing Increasing Increasing DILG
report on
LGU
complian
ce to FDP
LGUs,
DILG
a. Fully
complying 2013 55 65 75 100
b. Complying 2013 95 97 99 100
RLAs conducting
continuing
budget
consultations
with CSOs,
private sector
and other DBM
stakeholders
2012 Increasing Increasing Increasing Increasing RLAs
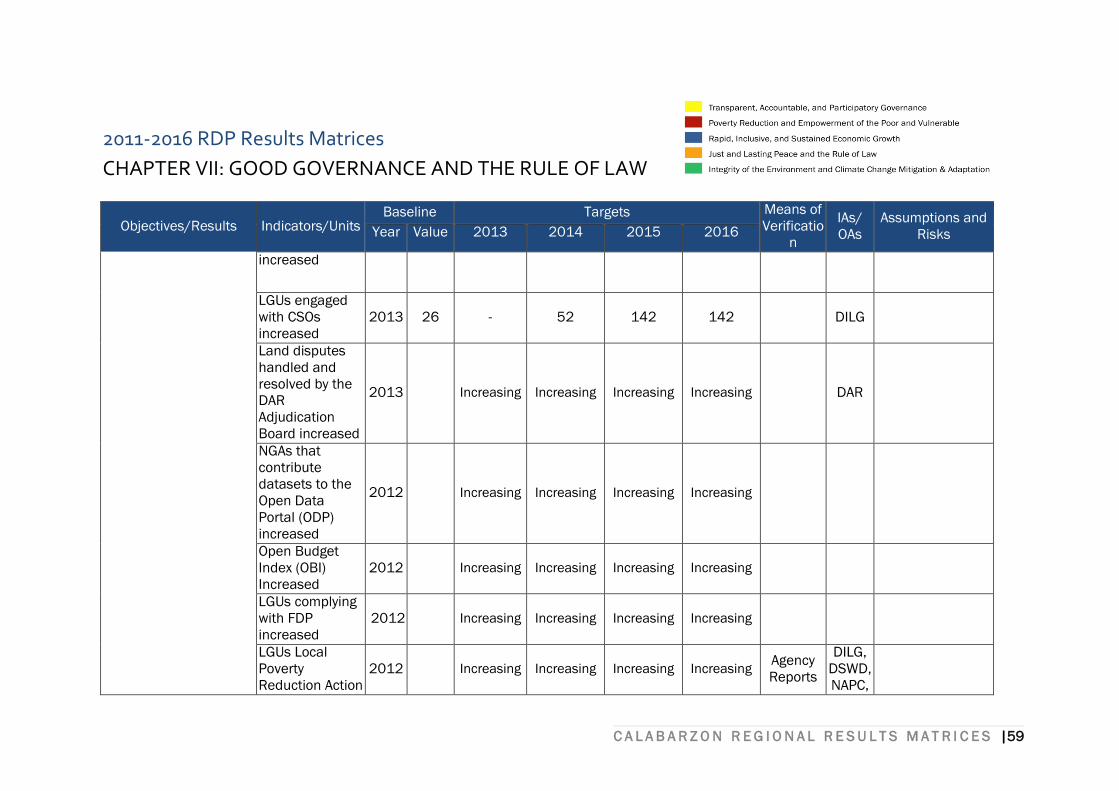
C A L A B A R Z O N R E G I O N A L R E S U L T S M A T R I C E S |59
2011-2016 RDP Results Matrices
CHAPTER VII: GOOD GOVERNANCE AND THE RULE OF LAW
Objectives/Results Indicators/Units Baseline Targets Means of
Verificatio
n
IAs/
OAs
Assumptions and
Risks Year Value 2013 2014 2015 2016
increased
LGUs engaged
with CSOs
increased
2013 26 - 52 142 142 DILG
Land disputes
handled and
resolved by the
DAR
Adjudication
Board increased
2013 Increasing Increasing Increasing Increasing DAR
NGAs that
contribute
datasets to the
Open Data
Portal (ODP)
increased
2012 Increasing Increasing Increasing Increasing
Open Budget
Index (OBI)
Increased
2012 Increasing Increasing Increasing Increasing
LGUs complying
with FDP
increased
2012 Increasing Increasing Increasing Increasing
LGUs Local
Poverty
Reduction Action
2012 Increasing Increasing Increasing Increasing Agency
Reports
DILG,
DSWD,
NAPC,
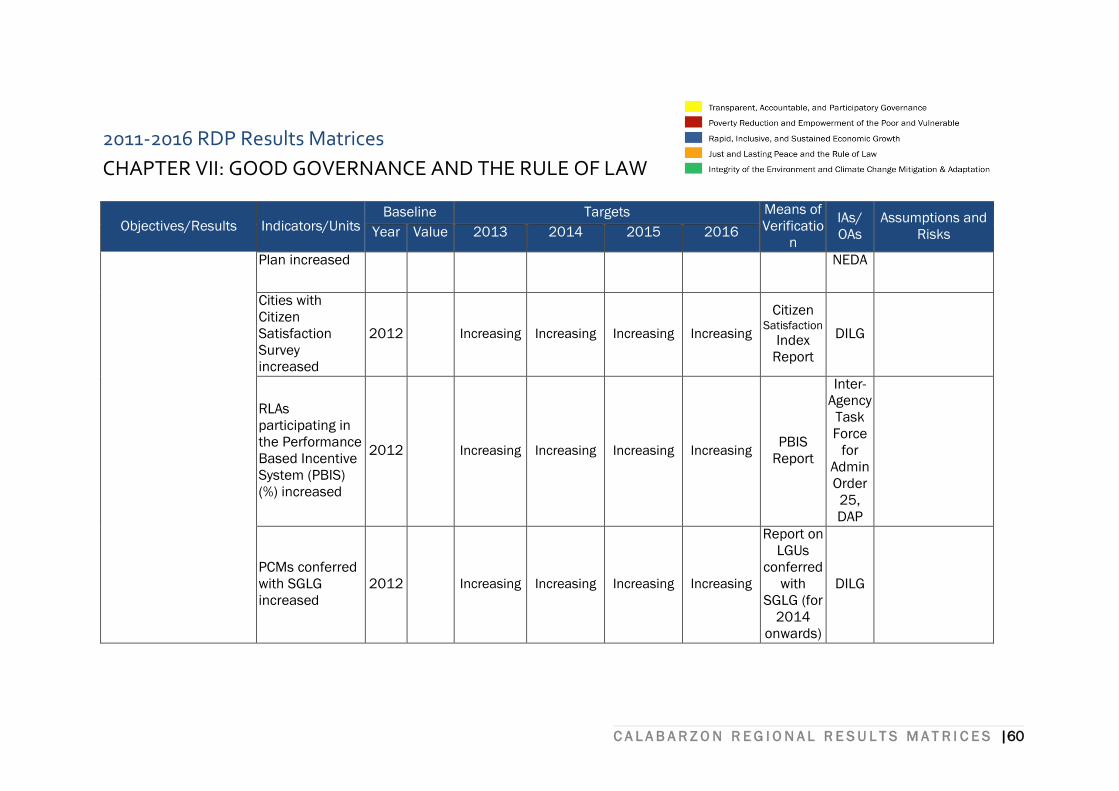
C A L A B A R Z O N R E G I O N A L R E S U L T S M A T R I C E S |60
2011-2016 RDP Results Matrices
CHAPTER VII: GOOD GOVERNANCE AND THE RULE OF LAW
Objectives/Results Indicators/Units Baseline Targets Means of
Verificatio
n
IAs/
OAs
Assumptions and
Risks Year Value 2013 2014 2015 2016
Plan increased NEDA
Cities with
Citizen
Satisfaction
Survey
increased
2012 Increasing Increasing Increasing Increasing
Citizen Satisfaction
Index
Report
DILG
RLAs
participating in
the Performance
Based Incentive
System (PBIS)
(%) increased
2012 Increasing Increasing Increasing Increasing PBIS
Report
Inter-
Agency
Task
Force
for
Admin
Order
25,
DAP
PCMs conferred
with SGLG
increased
2012 Increasing Increasing Increasing Increasing
Report on
LGUs
conferred
with
SGLG (for
2014
onwards)
DILG
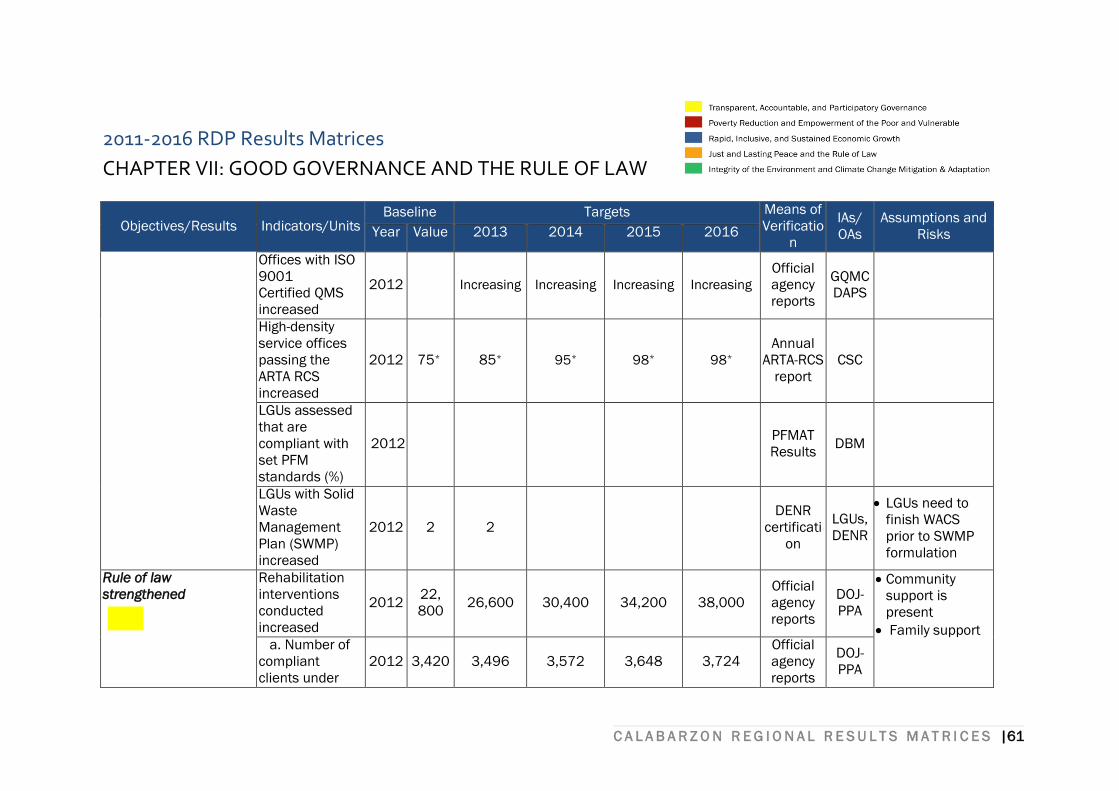
C A L A B A R Z O N R E G I O N A L R E S U L T S M A T R I C E S |61
2011-2016 RDP Results Matrices
CHAPTER VII: GOOD GOVERNANCE AND THE RULE OF LAW
Objectives/Results Indicators/Units Baseline Targets Means of
Verificatio
n
IAs/
OAs
Assumptions and
Risks Year Value 2013 2014 2015 2016
Offices with ISO
9001
Certified QMS
increased
2012 Increasing Increasing Increasing Increasing
Official
agency
reports
GQMC
DAPS
High-density
service offices
passing the
ARTA RCS
increased
2012 75* 85* 95* 98* 98*
Annual
ARTA-RCS
report
CSC
LGUs assessed
that are
compliant with
set PFM
standards (%)
2012 PFMAT
Results DBM
LGUs with Solid
Waste
Management
Plan (SWMP)
increased
2012 2 2
DENR
certificati
on
LGUs,
DENR
LGUs need to
finish WACS
prior to SWMP
formulation
Rule of law
strengthened
Rehabilitation
interventions
conducted
increased
2012 22,
800 26,600 30,400 34,200 38,000
Official
agency
reports
DOJ-
PPA
Community
support is
present
Family support a. Number of
compliant
clients under
2012 3,420 3,496 3,572 3,648 3,724
Official
agency
reports
DOJ-
PPA
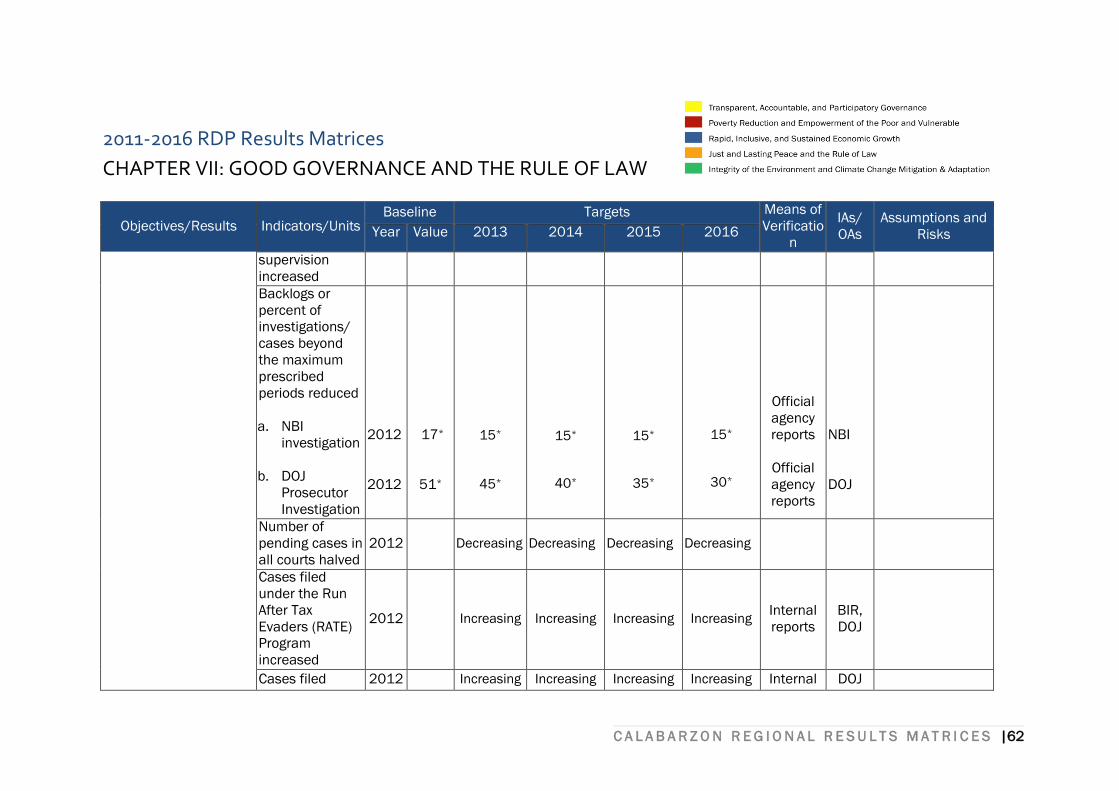
C A L A B A R Z O N R E G I O N A L R E S U L T S M A T R I C E S |62
2011-2016 RDP Results Matrices
CHAPTER VII: GOOD GOVERNANCE AND THE RULE OF LAW
Objectives/Results Indicators/Units Baseline Targets Means of
Verificatio
n
IAs/
OAs
Assumptions and
Risks Year Value 2013 2014 2015 2016
supervision
increased
Backlogs or
percent of
investigations/
cases beyond
the maximum
prescribed
periods reduced
a. NBI
investigation
b. DOJ
Prosecutor
Investigation
2012
2012
17*
51*
15*
45*
15*
40*
15*
35*
15*
30*
Official
agency
reports
Official
agency
reports
NBI
DOJ
Number of
pending cases in
all courts halved
2012 Decreasing Decreasing Decreasing Decreasing
Cases filed
under the Run
After Tax
Evaders (RATE)
Program
increased
2012 Increasing Increasing Increasing Increasing Internal
reports
BIR,
DOJ
Cases filed 2012 Increasing Increasing Increasing Increasing Internal DOJ
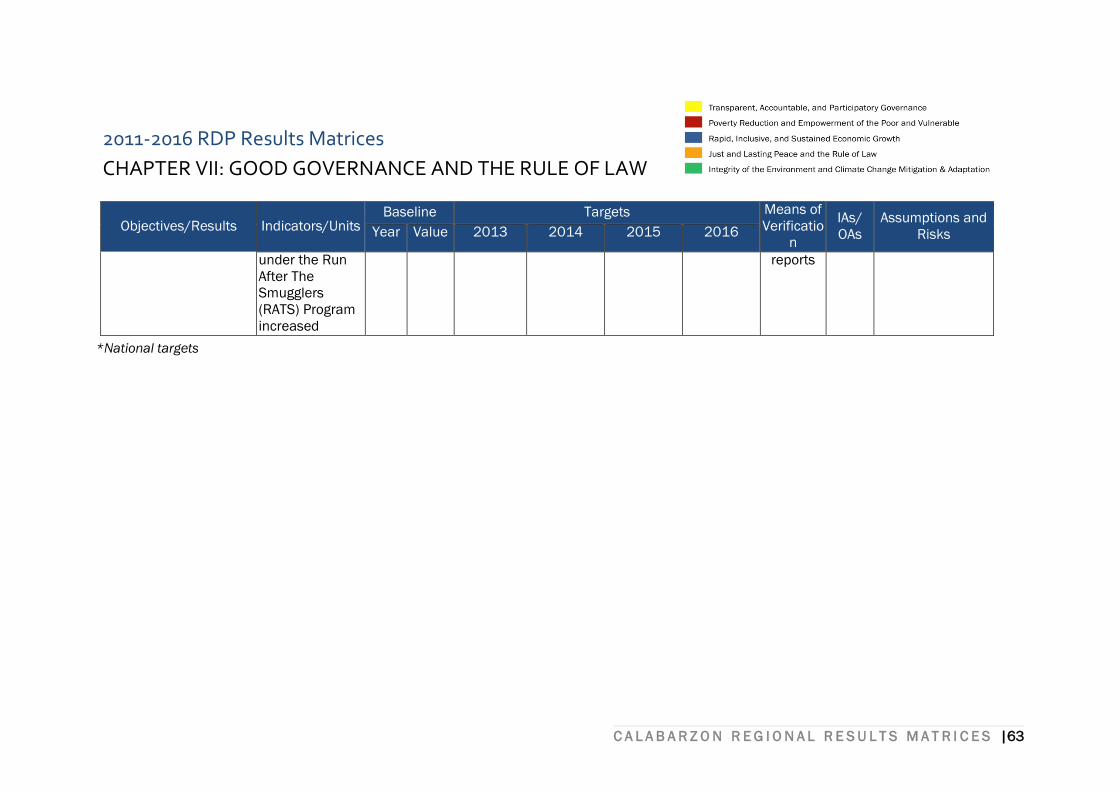
C A L A B A R Z O N R E G I O N A L R E S U L T S M A T R I C E S |63
2011-2016 RDP Results Matrices
CHAPTER VII: GOOD GOVERNANCE AND THE RULE OF LAW
Objectives/Results Indicators/Units Baseline Targets Means of
Verificatio
n
IAs/
OAs
Assumptions and
Risks Year Value 2013 2014 2015 2016
under the Run
After The
Smugglers
(RATS) Program
increased
reports
*National targets
C A L A B A R Z O N R E G I O N A L R E S U L T S M A T R I C E S |64
CHAPTER VIII
SOCIAL DEVELOPMENT
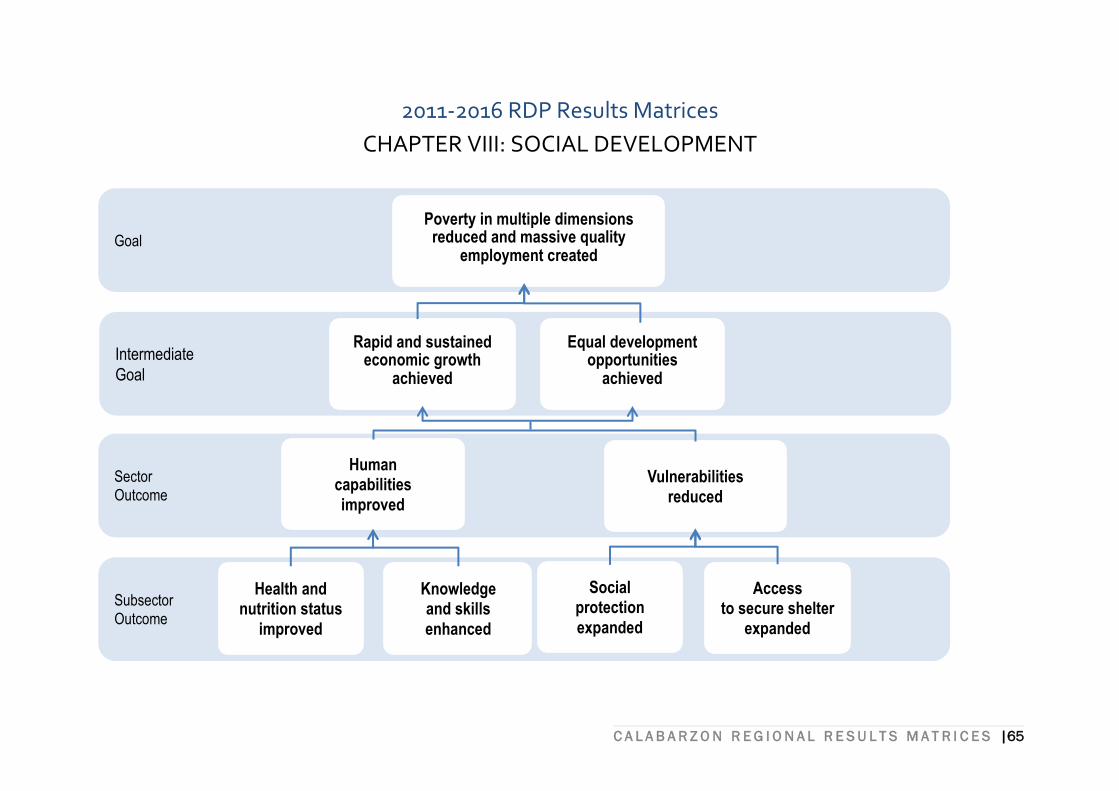
C A L A B A R Z O N R E G I O N A L R E S U L T S M A T R I C E S |65
2011-2016 RDP Results Matrices
CHAPTER VIII: SOCIAL DEVELOPMENT
Subsector Outcome
Sector Outcome
Intermediate
Goal
Goal
Poverty in multiple dimensions reduced and massive quality
employment created
Rapid and sustained economic growth
achieved
Human capabilities improved
Health and nutrition status
improved
Knowledge and skills
enhanced
Access to secure shelter
expanded
Equal development opportunities
achieved
Vulnerabilities
reduced
Social
protection
expanded
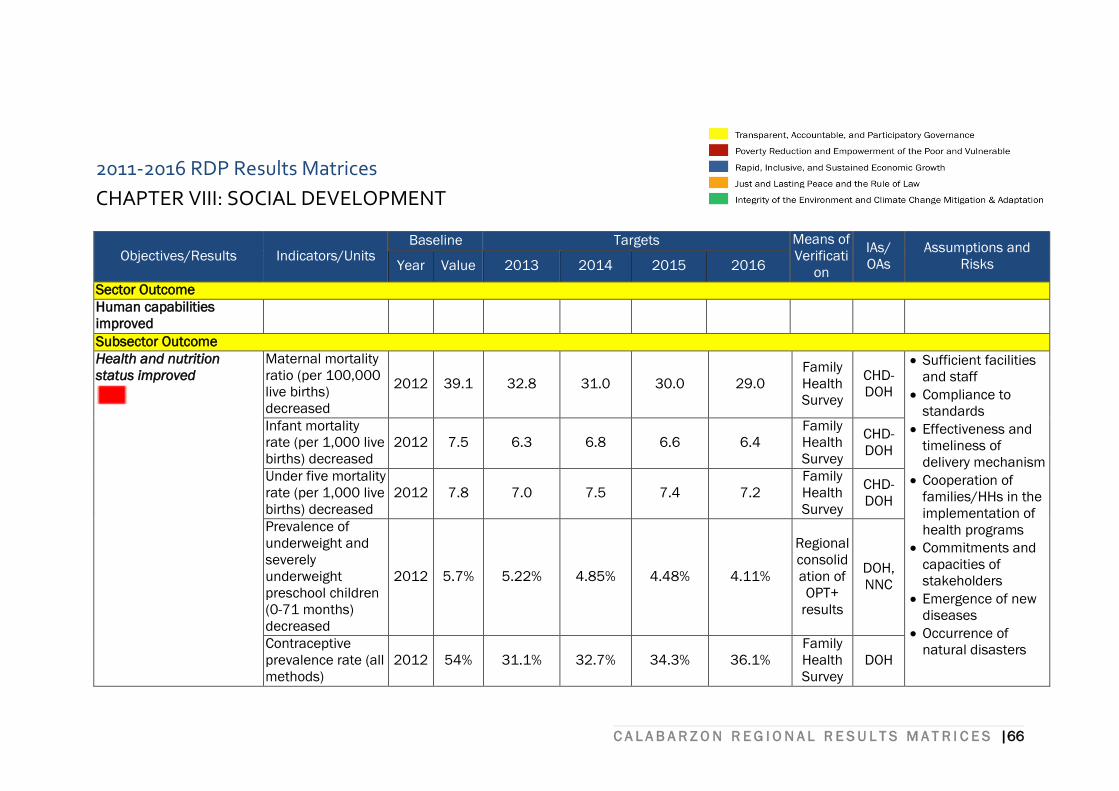
C A L A B A R Z O N R E G I O N A L R E S U L T S M A T R I C E S |66
2011-2016 RDP Results Matrices
CHAPTER VIII: SOCIAL DEVELOPMENT
Objectives/Results Indicators/Units Baseline Targets Means of
Verificati
on
IAs/
OAs
Assumptions and
Risks Year Value 2013 2014 2015 2016
Sector Outcome
Human capabilities
improved
Subsector Outcome
Health and nutrition
status improved
Maternal mortality
ratio (per 100,000
live births)
decreased
2012 39.1 32.8 31.0 30.0 29.0
Family
Health
Survey
CHD-
DOH
Sufficient facilities
and staff
Compliance to
standards
Effectiveness and
timeliness of
delivery mechanism
Cooperation of
families/HHs in the
implementation of
health programs
Commitments and
capacities of
stakeholders
Emergence of new
diseases
Occurrence of
natural disasters
Infant mortality
rate (per 1,000 live
births) decreased
2012 7.5 6.3 6.8 6.6 6.4
Family
Health
Survey
CHD-
DOH
Under five mortality
rate (per 1,000 live
births) decreased
2012 7.8 7.0 7.5 7.4 7.2
Family
Health
Survey
CHD-
DOH
Prevalence of
underweight and
severely
underweight
preschool children
(0-71 months)
decreased
2012 5.7% 5.22% 4.85% 4.48% 4.11%
Regional
consolid
ation of
OPT+
results
DOH,
NNC
Contraceptive
prevalence rate (all
methods)
2012 54% 31.1% 32.7% 34.3% 36.1%
Family
Health
Survey
DOH
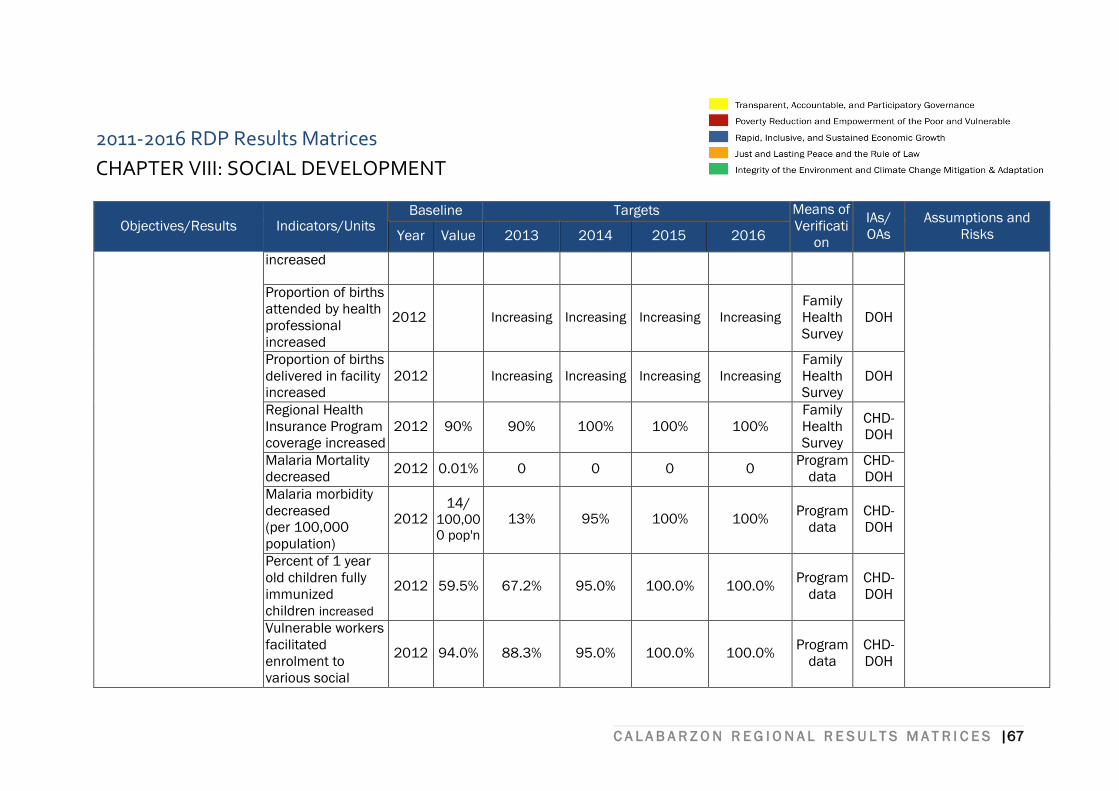
C A L A B A R Z O N R E G I O N A L R E S U L T S M A T R I C E S |67
2011-2016 RDP Results Matrices
CHAPTER VIII: SOCIAL DEVELOPMENT
Objectives/Results Indicators/Units Baseline Targets Means of
Verificati
on
IAs/
OAs
Assumptions and
Risks Year Value 2013 2014 2015 2016
increased
Proportion of births
attended by health
professional
increased
2012 Increasing Increasing Increasing Increasing
Family
Health
Survey
DOH
Proportion of births
delivered in facility
increased
2012 Increasing Increasing Increasing Increasing
Family
Health
Survey
DOH
Regional Health
Insurance Program
coverage increased
2012 90% 90% 100% 100% 100%
Family
Health
Survey
CHD-
DOH
Malaria Mortality
decreased 2012 0.01% 0 0 0 0
Program
data
CHD-
DOH
Malaria morbidity
decreased
(per 100,000
population)
2012 14/
100,00
0 pop'n 13% 95% 100% 100%
Program
data
CHD-
DOH
Percent of 1 year
old children fully
immunized
children increased
2012 59.5% 67.2% 95.0% 100.0% 100.0% Program
data
CHD-
DOH
Vulnerable workers
facilitated
enrolment to
various social
2012 94.0% 88.3% 95.0% 100.0% 100.0% Program
data
CHD-
DOH
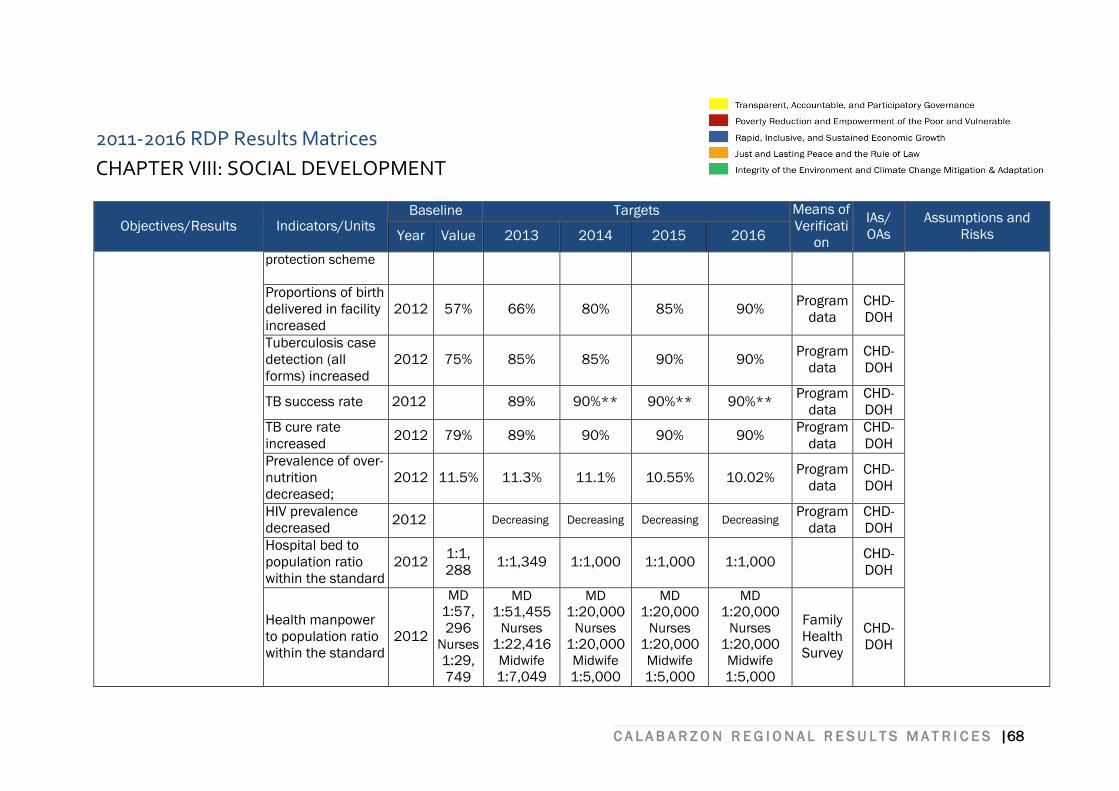
C A L A B A R Z O N R E G I O N A L R E S U L T S M A T R I C E S |68
2011-2016 RDP Results Matrices
CHAPTER VIII: SOCIAL DEVELOPMENT
Objectives/Results Indicators/Units Baseline Targets Means of
Verificati
on
IAs/
OAs
Assumptions and
Risks Year Value 2013 2014 2015 2016
protection scheme
Proportions of birth
delivered in facility
increased
2012 57% 66% 80% 85% 90% Program
data
CHD-
DOH
Tuberculosis case
detection (all
forms) increased
2012 75% 85% 85% 90% 90% Program
data
CHD-
DOH
TB success rate 2012 89% 90%** 90%** 90%** Program
data
CHD-
DOH
TB cure rate
increased 2012 79% 89% 90% 90% 90%
Program
data
CHD-
DOH
Prevalence of over-
nutrition
decreased;
2012 11.5% 11.3% 11.1% 10.55% 10.02% Program
data
CHD-
DOH
HIV prevalence
decreased 2012 Decreasing Decreasing Decreasing Decreasing
Program
data
CHD-
DOH
Hospital bed to
population ratio
within the standard
2012 1:1,
288 1:1,349 1:1,000 1:1,000 1:1,000
CHD-
DOH
Health manpower
to population ratio
within the standard
2012
MD
1:57,
296 Nurses
1:29,
749
MD 1:51,455
Nurses
1:22,416 Midwife
1:7,049
MD 1:20,000
Nurses
1:20,000 Midwife
1:5,000
MD 1:20,000
Nurses
1:20,000 Midwife
1:5,000
MD 1:20,000
Nurses
1:20,000 Midwife
1:5,000
Family
Health
Survey
CHD-
DOH
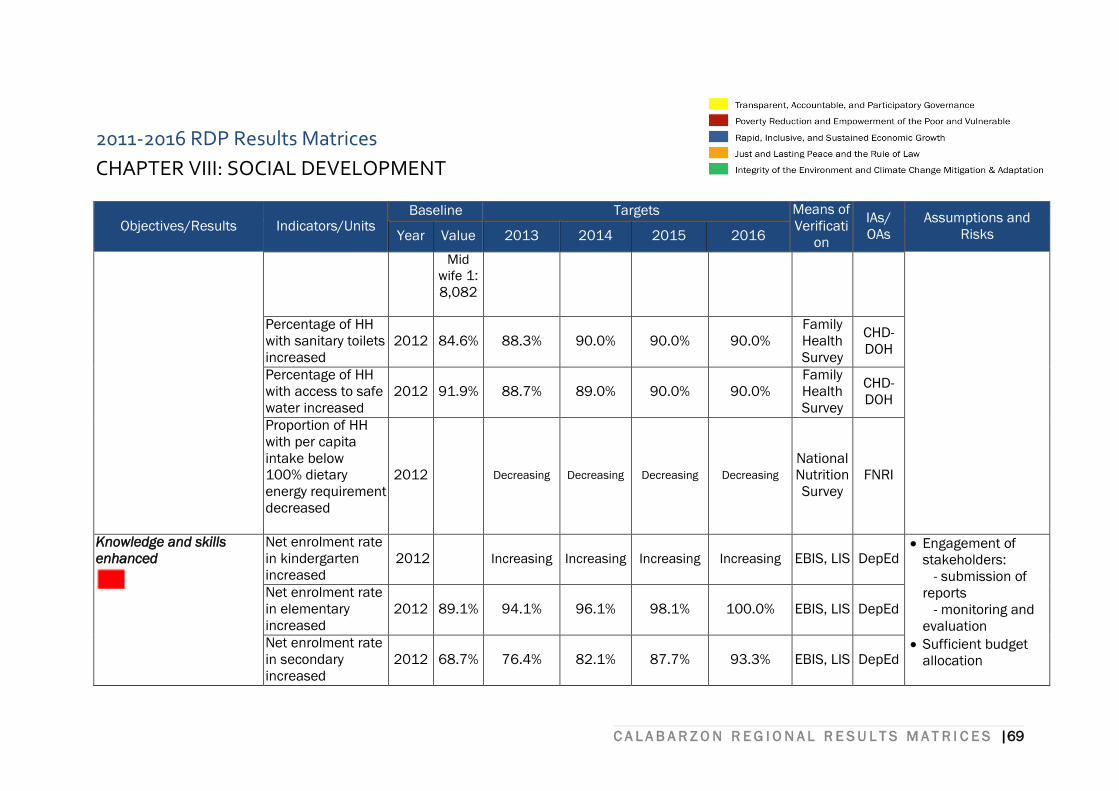
C A L A B A R Z O N R E G I O N A L R E S U L T S M A T R I C E S |69
2011-2016 RDP Results Matrices
CHAPTER VIII: SOCIAL DEVELOPMENT
Objectives/Results Indicators/Units Baseline Targets Means of
Verificati
on
IAs/
OAs
Assumptions and
Risks Year Value 2013 2014 2015 2016
Mid
wife 1:
8,082
Percentage of HH
with sanitary toilets
increased
2012 84.6% 88.3% 90.0% 90.0% 90.0%
Family
Health
Survey
CHD-
DOH
Percentage of HH
with access to safe
water increased
2012 91.9% 88.7% 89.0% 90.0% 90.0%
Family
Health
Survey
CHD-
DOH
Proportion of HH
with per capita
intake below
100% dietary
energy requirement
decreased
2012
Decreasing Decreasing Decreasing Decreasing National
Nutrition
Survey
FNRI
Knowledge and skills
enhanced
Net enrolment rate
in kindergarten
increased
2012 Increasing Increasing Increasing Increasing EBIS, LIS DepEd Engagement of
stakeholders:
- submission of
reports
- monitoring and
evaluation
Sufficient budget
allocation
Net enrolment rate
in elementary
increased
2012 89.1% 94.1% 96.1% 98.1% 100.0% EBIS, LIS DepEd
Net enrolment rate
in secondary
increased
2012 68.7% 76.4% 82.1% 87.7% 93.3% EBIS, LIS DepEd
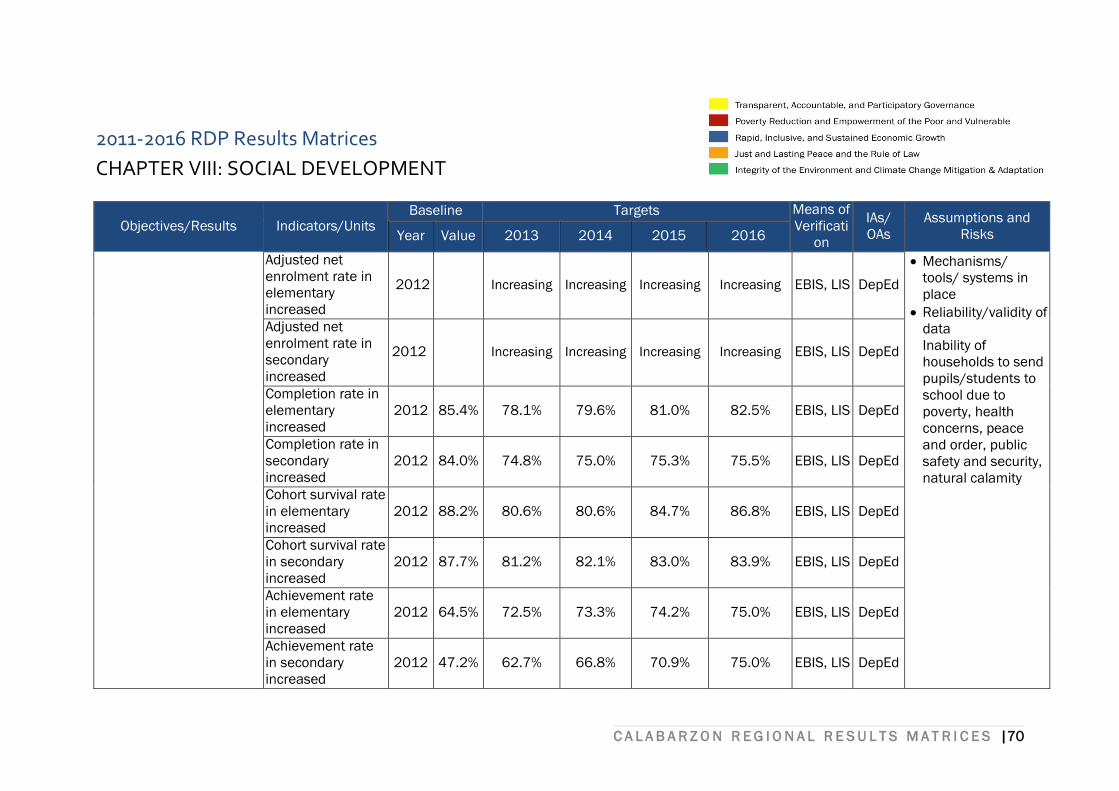
C A L A B A R Z O N R E G I O N A L R E S U L T S M A T R I C E S |70
2011-2016 RDP Results Matrices
CHAPTER VIII: SOCIAL DEVELOPMENT
Objectives/Results Indicators/Units Baseline Targets Means of
Verificati
on
IAs/
OAs
Assumptions and
Risks Year Value 2013 2014 2015 2016
Adjusted net
enrolment rate in
elementary
increased
2012 Increasing Increasing Increasing Increasing EBIS, LIS DepEd
Mechanisms/
tools/ systems in
place
Reliability/validity of
data
Inability of
households to send
pupils/students to
school due to
poverty, health
concerns, peace
and order, public
safety and security,
natural calamity
Adjusted net
enrolment rate in
secondary
increased
2012 Increasing Increasing Increasing Increasing EBIS, LIS DepEd
Completion rate in
elementary
increased
2012 85.4% 78.1% 79.6% 81.0% 82.5% EBIS, LIS DepEd
Completion rate in
secondary
increased
2012 84.0% 74.8% 75.0% 75.3% 75.5% EBIS, LIS DepEd
Cohort survival rate
in elementary
increased
2012 88.2% 80.6% 80.6% 84.7% 86.8% EBIS, LIS DepEd
Cohort survival rate
in secondary
increased
2012 87.7% 81.2% 82.1% 83.0% 83.9% EBIS, LIS DepEd
Achievement rate
in elementary
increased
2012 64.5% 72.5% 73.3% 74.2% 75.0% EBIS, LIS DepEd
Achievement rate
in secondary
increased
2012 47.2% 62.7% 66.8% 70.9% 75.0% EBIS, LIS DepEd
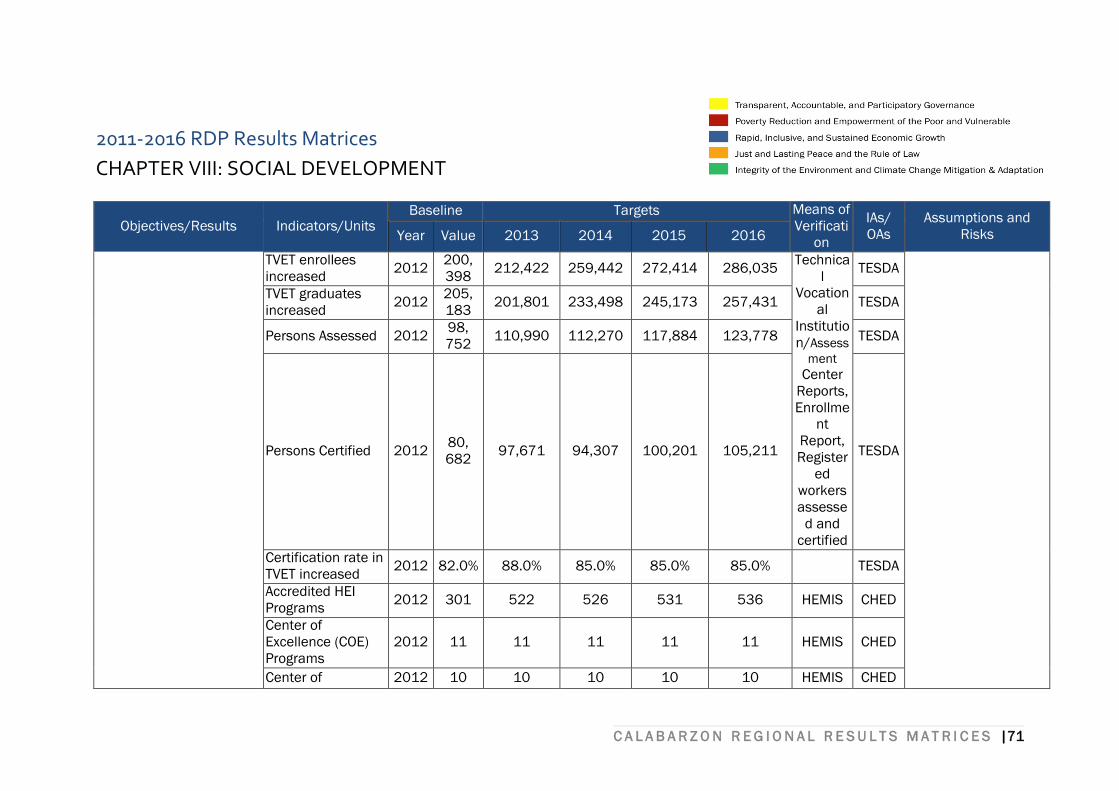
C A L A B A R Z O N R E G I O N A L R E S U L T S M A T R I C E S |71
2011-2016 RDP Results Matrices
CHAPTER VIII: SOCIAL DEVELOPMENT
Objectives/Results Indicators/Units Baseline Targets Means of
Verificati
on
IAs/
OAs
Assumptions and
Risks Year Value 2013 2014 2015 2016
TVET enrollees
increased 2012
200,
398 212,422 259,442 272,414 286,035
Technica
l
Vocation
al
Institutio
n/Assess
ment Center
Reports,
Enrollme
nt
Report,
Register
ed
workers
assesse
d and
certified
TESDA
TVET graduates
increased 2012
205,
183 201,801 233,498 245,173 257,431 TESDA
Persons Assessed 2012 98,
752 110,990 112,270 117,884 123,778 TESDA
Persons Certified 2012 80,
682 97,671 94,307 100,201 105,211 TESDA
Certification rate in
TVET increased 2012 82.0% 88.0% 85.0% 85.0% 85.0%
TESDA
Accredited HEI
Programs 2012 301 522 526 531 536 HEMIS CHED
Center of
Excellence (COE)
Programs
2012 11 11 11 11 11 HEMIS CHED
Center of 2012 10 10 10 10 10 HEMIS CHED
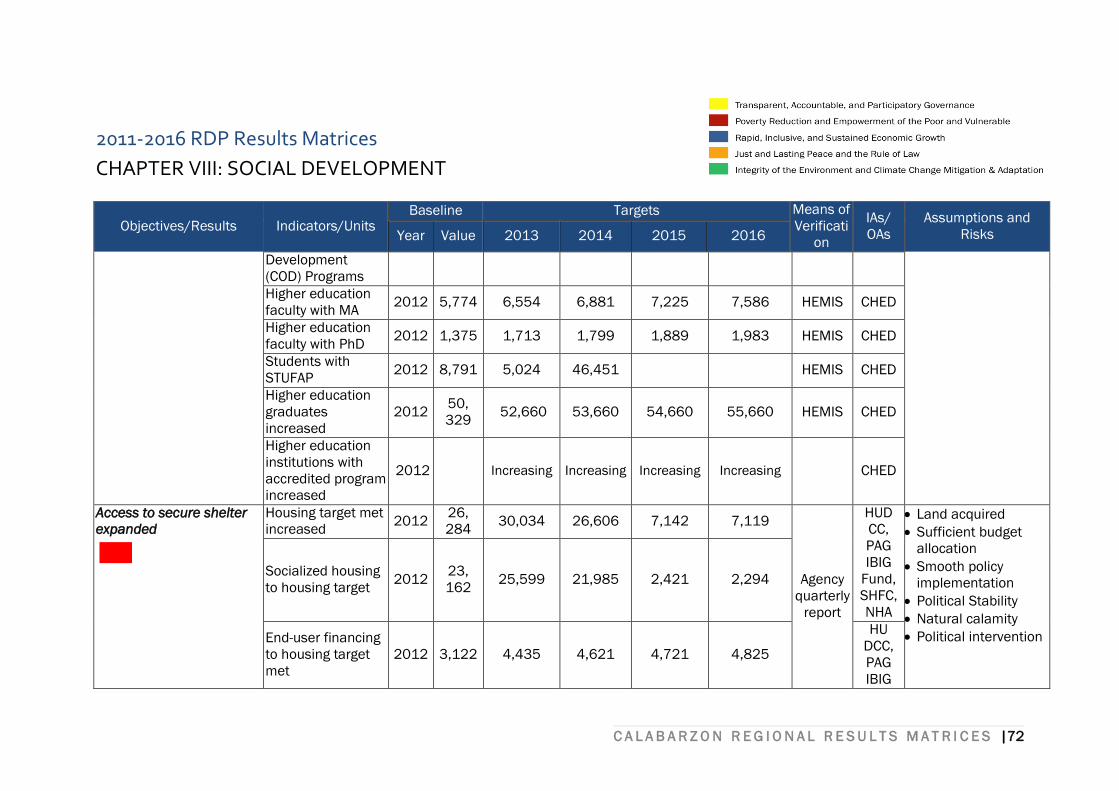
C A L A B A R Z O N R E G I O N A L R E S U L T S M A T R I C E S |72
2011-2016 RDP Results Matrices
CHAPTER VIII: SOCIAL DEVELOPMENT
Objectives/Results Indicators/Units Baseline Targets Means of
Verificati
on
IAs/
OAs
Assumptions and
Risks Year Value 2013 2014 2015 2016
Development
(COD) Programs
Higher education
faculty with MA 2012 5,774 6,554 6,881 7,225 7,586 HEMIS CHED
Higher education
faculty with PhD 2012 1,375 1,713 1,799 1,889 1,983 HEMIS CHED
Students with
STUFAP 2012 8,791 5,024 46,451 HEMIS CHED
Higher education
graduates
increased
2012 50,
329 52,660 53,660 54,660 55,660 HEMIS CHED
Higher education
institutions with
accredited program
increased
2012 Increasing Increasing Increasing Increasing CHED
Access to secure shelter
expanded
Housing target met
increased 2012
26,
284 30,034 26,606 7,142 7,119
Agency
quarterly
report
HUD
CC,
PAG
IBIG
Fund,
SHFC,
NHA
Land acquired
Sufficient budget
allocation
Smooth policy
implementation
Political Stability
Natural calamity
Political intervention
Socialized housing
to housing target 2012
23,
162 25,599 21,985 2,421 2,294
End-user financing
to housing target
met
2012 3,122 4,435 4,621 4,721 4,825
HU
DCC,
PAG
IBIG
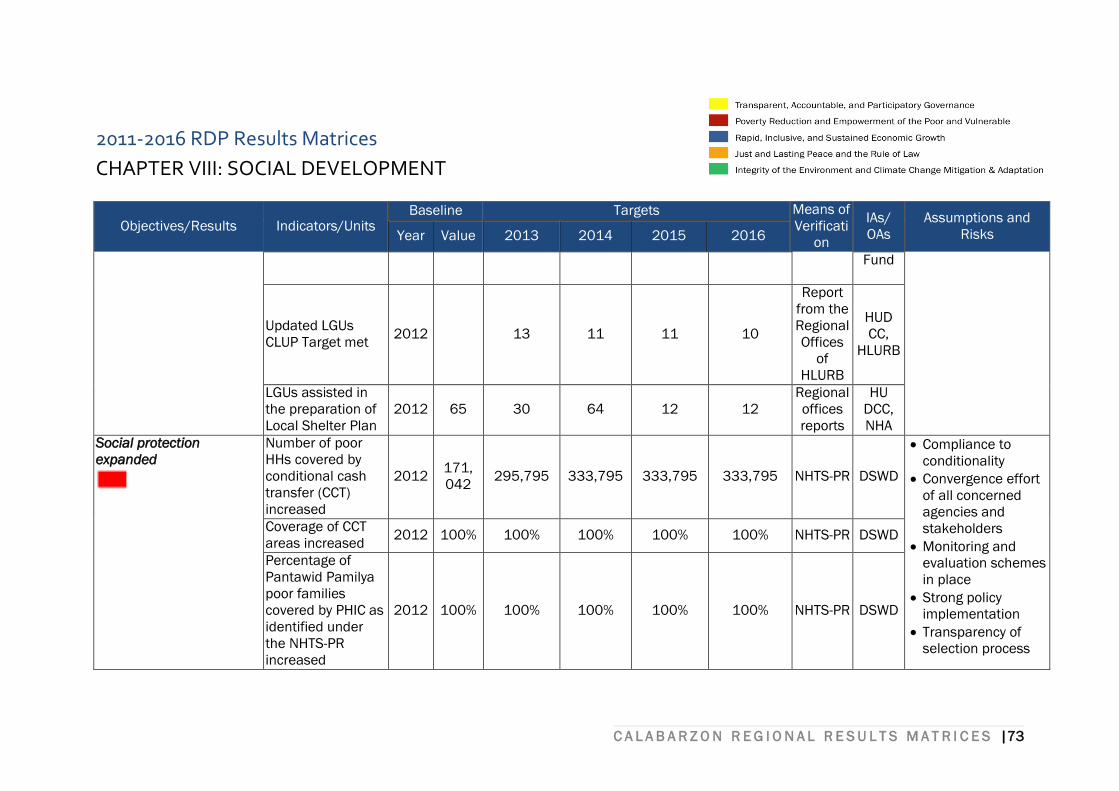
C A L A B A R Z O N R E G I O N A L R E S U L T S M A T R I C E S |73
2011-2016 RDP Results Matrices
CHAPTER VIII: SOCIAL DEVELOPMENT
Objectives/Results Indicators/Units Baseline Targets Means of
Verificati
on
IAs/
OAs
Assumptions and
Risks Year Value 2013 2014 2015 2016
Fund
Updated LGUs
CLUP Target met 2012 13 11 11 10
Report
from the
Regional
Offices
of
HLURB
HUD
CC,
HLURB
LGUs assisted in
the preparation of
Local Shelter Plan
2012 65 30 64 12 12
Regional
offices
reports
HU
DCC,
NHA
Social protection
expanded
Number of poor
HHs covered by
conditional cash
transfer (CCT)
increased
2012 171,
042 295,795 333,795 333,795 333,795 NHTS-PR DSWD
Compliance to
conditionality
Convergence effort
of all concerned
agencies and
stakeholders
Monitoring and
evaluation schemes
in place
Strong policy
implementation
Transparency of
selection process
Coverage of CCT
areas increased 2012 100% 100% 100% 100% 100% NHTS-PR DSWD
Percentage of
Pantawid Pamilya
poor families
covered by PHIC as
identified under
the NHTS-PR
increased
2012 100% 100% 100% 100% 100% NHTS-PR DSWD
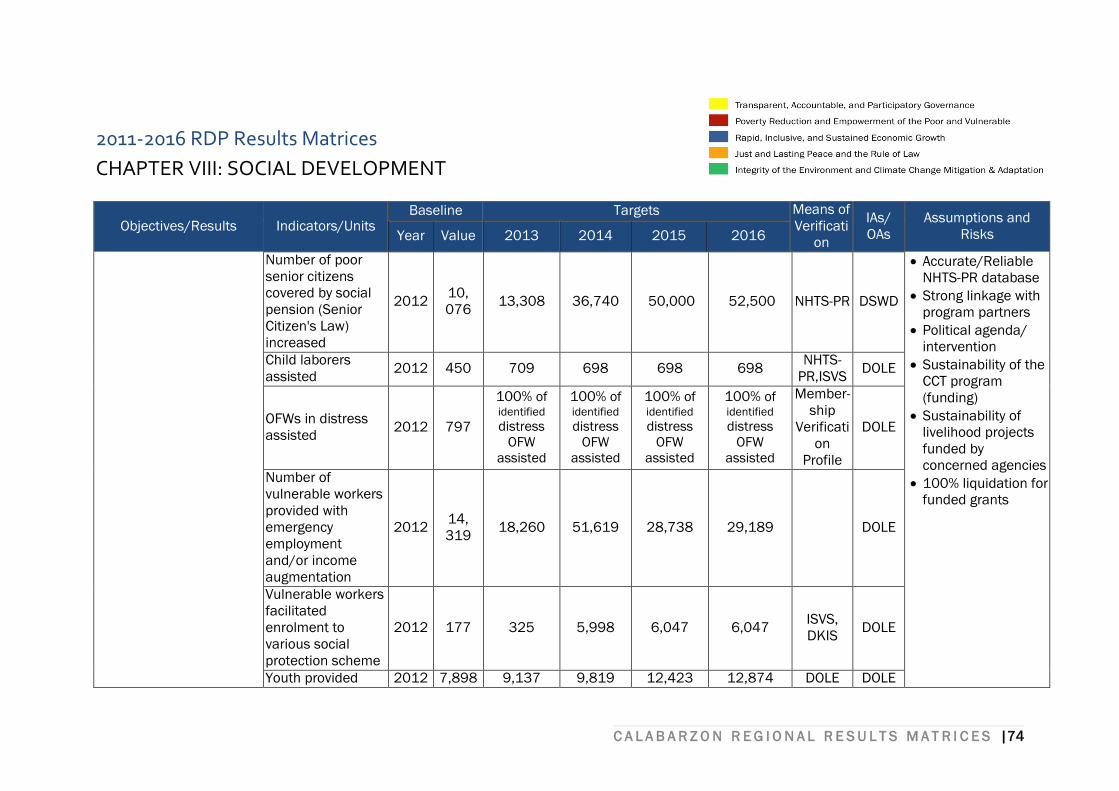
C A L A B A R Z O N R E G I O N A L R E S U L T S M A T R I C E S |74
2011-2016 RDP Results Matrices
CHAPTER VIII: SOCIAL DEVELOPMENT
Objectives/Results Indicators/Units Baseline Targets Means of
Verificati
on
IAs/
OAs
Assumptions and
Risks Year Value 2013 2014 2015 2016
Number of poor
senior citizens
covered by social
pension (Senior
Citizen's Law)
increased
2012 10,
076 13,308 36,740 50,000 52,500 NHTS-PR DSWD
Accurate/Reliable
NHTS-PR database
Strong linkage with
program partners
Political agenda/
intervention
Sustainability of the
CCT program
(funding)
Sustainability of
livelihood projects
funded by
concerned agencies
100% liquidation for
funded grants
Child laborers
assisted 2012 450 709 698 698 698
NHTS-
PR,ISVS DOLE
OFWs in distress
assisted 2012 797
100% of identified distress
OFW
assisted
100% of identified
distress
OFW
assisted
100% of identified
distress
OFW
assisted
100% of identified
distress
OFW
assisted
Member-
ship
Verificati
on
Profile
DOLE
Number of
vulnerable workers
provided with
emergency
employment
and/or income
augmentation
2012 14,
319 18,260 51,619 28,738 29,189 DOLE
Vulnerable workers
facilitated
enrolment to
various social
protection scheme
2012 177 325 5,998 6,047 6,047 ISVS,
DKIS DOLE
Youth provided 2012 7,898 9,137 9,819 12,423 12,874 DOLE DOLE
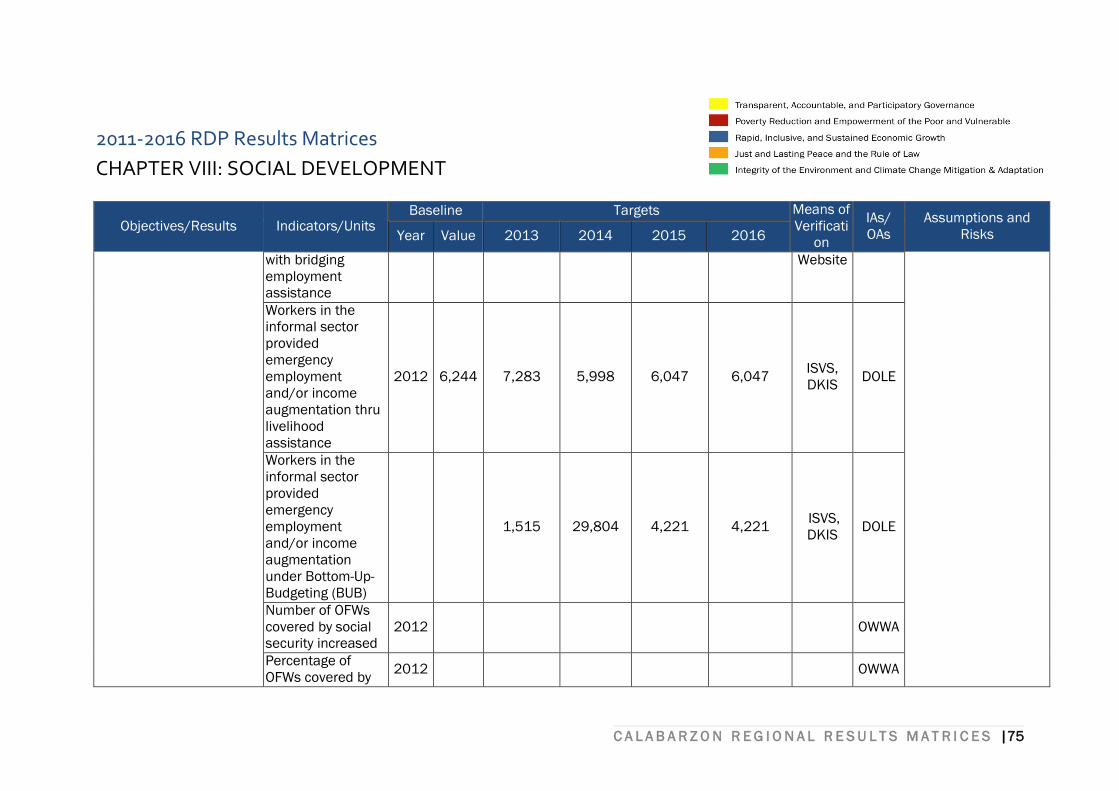
C A L A B A R Z O N R E G I O N A L R E S U L T S M A T R I C E S |75
2011-2016 RDP Results Matrices
CHAPTER VIII: SOCIAL DEVELOPMENT
Objectives/Results Indicators/Units Baseline Targets Means of
Verificati
on
IAs/
OAs
Assumptions and
Risks Year Value 2013 2014 2015 2016
with bridging
employment
assistance
Website
Workers in the
informal sector
provided
emergency
employment
and/or income
augmentation thru
livelihood
assistance
2012 6,244 7,283 5,998 6,047 6,047 ISVS,
DKIS DOLE
Workers in the
informal sector
provided
emergency
employment
and/or income
augmentation
under Bottom-Up-
Budgeting (BUB)
1,515 29,804 4,221 4,221
ISVS,
DKIS DOLE
Number of OFWs
covered by social
security increased
2012 OWWA
Percentage of
OFWs covered by 2012
OWWA
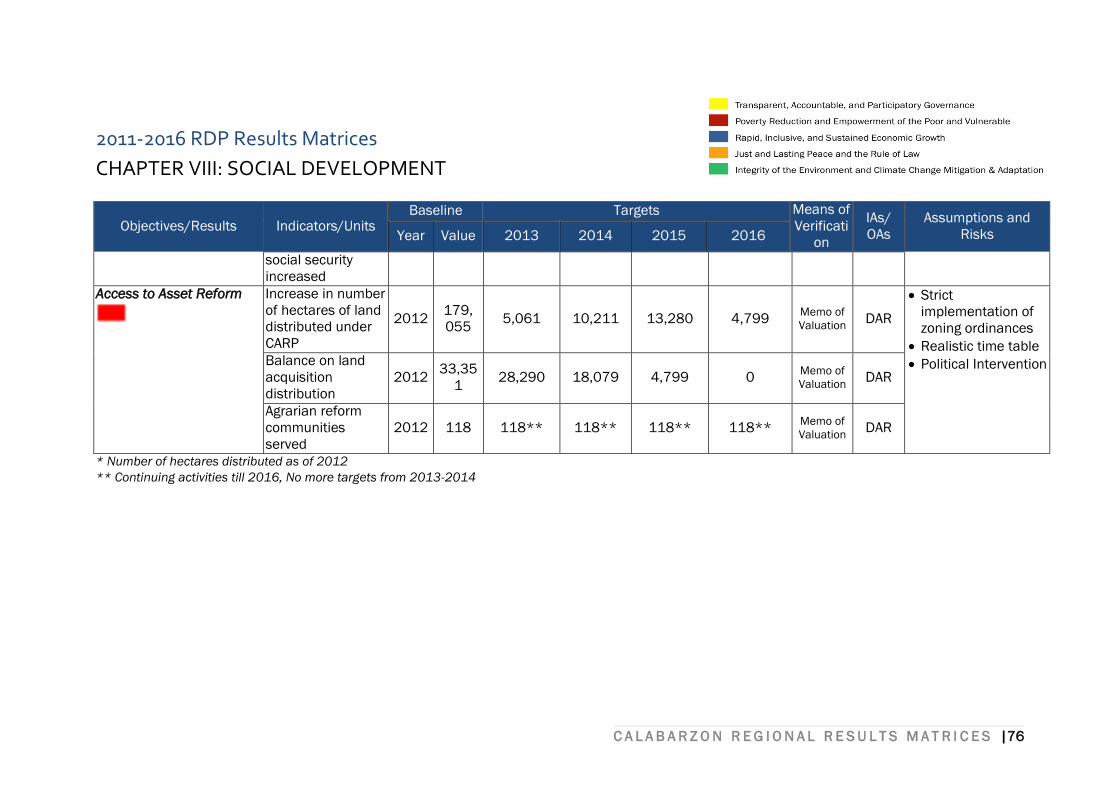
C A L A B A R Z O N R E G I O N A L R E S U L T S M A T R I C E S |76
2011-2016 RDP Results Matrices
CHAPTER VIII: SOCIAL DEVELOPMENT
Objectives/Results Indicators/Units Baseline Targets Means of
Verificati
on
IAs/
OAs
Assumptions and
Risks Year Value 2013 2014 2015 2016
social security
increased
Access to Asset Reform
Increase in number
of hectares of land
distributed under
CARP
2012 179,
055 5,061 10,211 13,280 4,799
Memo of
Valuation DAR
Strict
implementation of
zoning ordinances
Realistic time table
Political Intervention Balance on land
acquisition
distribution
2012 33,35
1 28,290 18,079 4,799 0
Memo of
Valuation DAR
Agrarian reform
communities
served
2012 118 118** 118** 118** 118** Memo of
Valuation DAR
* Number of hectares distributed as of 2012
** Continuing activities till 2016, No more targets from 2013-2014

C A L A B A R Z O N R E G I O N A L R E S U L T S M A T R I C E S |77
CHAPTER IX
PEACE AND SECURITY
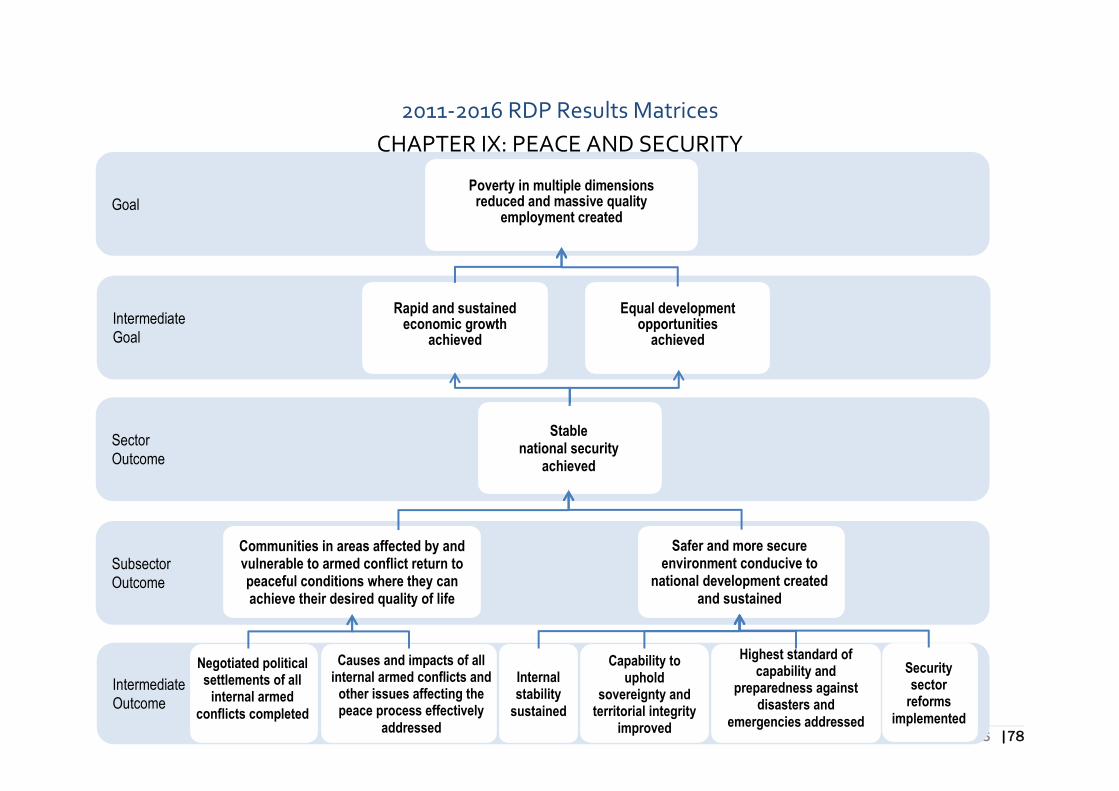
C A L A B A R Z O N R E G I O N A L R E S U L T S M A T R I C E S |78
2011-2016 RDP Results Matrices
CHAPTER IX: PEACE AND SECURITY
Subsector
Outcome
Sector
Outcome
Intermediate
Goal
Goal
Poverty in multiple dimensions reduced and massive quality
employment created
Rapid and sustained
economic growth achieved
Stable
national security achieved
Communities in areas affected by and vulnerable to armed conflict return to peaceful conditions where they can achieve their desired quality of life
Safer and more secure environment conducive to
national development created and sustained
Equal development
opportunities achieved
Intermediate
Outcome
Negotiated political settlements of all
internal armed
conflicts completed
Causes and impacts of all internal armed conflicts and
other issues affecting the peace process effectively
addressed
Highest standard of
capability and preparedness against
disasters and
emergencies addressed
Capability to uphold
sovereignty and territorial integrity
improved
Internal stability
sustained
Security sector
reforms implemented
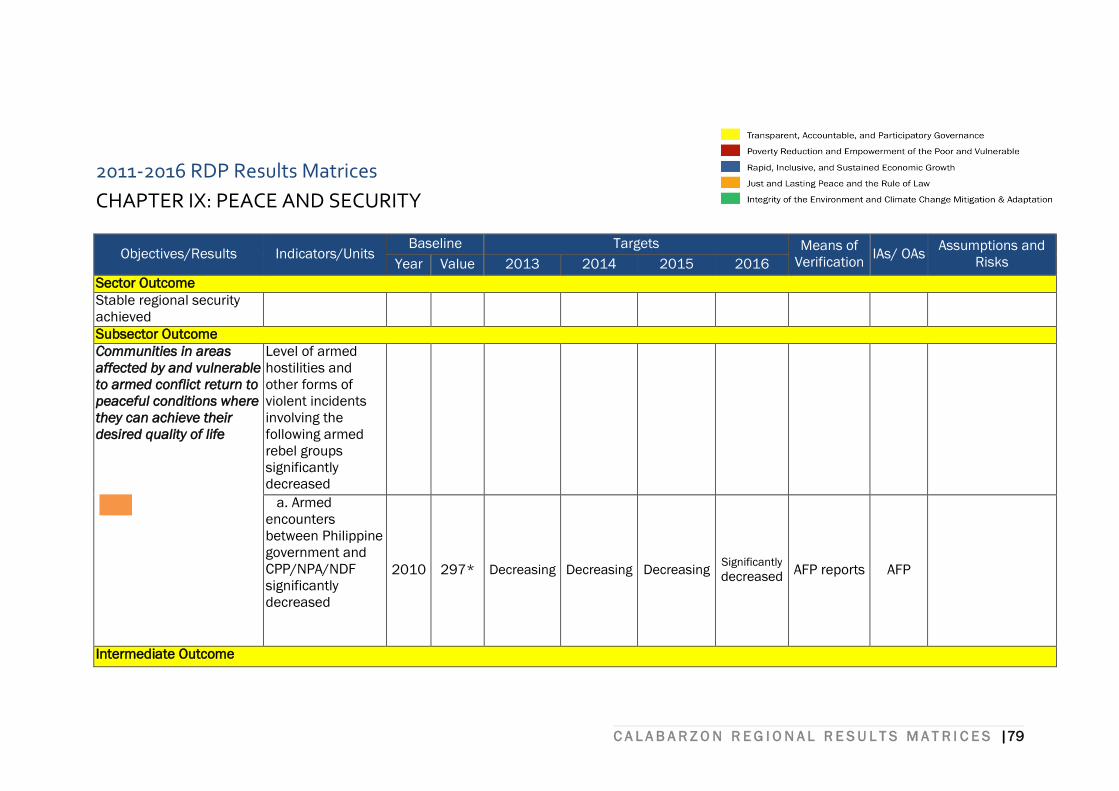
C A L A B A R Z O N R E G I O N A L R E S U L T S M A T R I C E S |79
2011-2016 RDP Results Matrices
CHAPTER IX: PEACE AND SECURITY
Objectives/Results Indicators/Units Baseline Targets Means of
Verification IAs/ OAs
Assumptions and
Risks Year Value 2013 2014 2015 2016
Sector Outcome
Stable regional security
achieved
Subsector Outcome
Communities in areas
affected by and vulnerable
to armed conflict return to
peaceful conditions where
they can achieve their
desired quality of life
Level of armed
hostilities and
other forms of
violent incidents
involving the
following armed
rebel groups
significantly
decreased
a. Armed
encounters
between Philippine
government and
CPP/NPA/NDF
significantly
decreased
2010 297* Decreasing Decreasing Decreasing Significantly
decreased AFP reports AFP
Intermediate Outcome
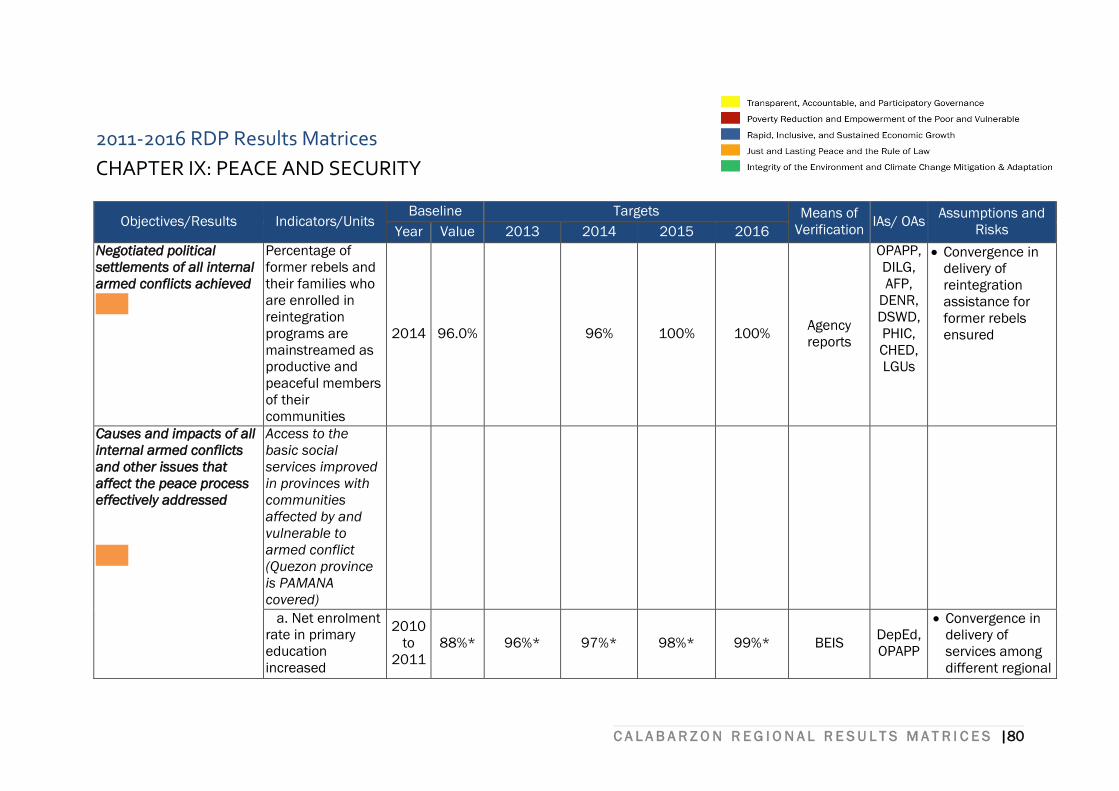
C A L A B A R Z O N R E G I O N A L R E S U L T S M A T R I C E S |80
2011-2016 RDP Results Matrices
CHAPTER IX: PEACE AND SECURITY
Objectives/Results Indicators/Units Baseline Targets Means of
Verification IAs/ OAs
Assumptions and
Risks Year Value 2013 2014 2015 2016
Negotiated political
settlements of all internal
armed conflicts achieved
Percentage of
former rebels and
their families who
are enrolled in
reintegration
programs are
mainstreamed as
productive and
peaceful members
of their
communities
2014 96.0% 96% 100% 100% Agency
reports
OPAPP,
DILG,
AFP,
DENR,
DSWD,
PHIC,
CHED,
LGUs
Convergence in
delivery of
reintegration
assistance for
former rebels
ensured
Causes and impacts of all
internal armed conflicts
and other issues that
affect the peace process
effectively addressed
Access to the
basic social
services improved
in provinces with
communities
affected by and
vulnerable to
armed conflict
(Quezon province
is PAMANA
covered)
a. Net enrolment
rate in primary
education
increased
2010
to
2011
88%* 96%* 97%* 98%* 99%* BEIS DepEd,
OPAPP
Convergence in
delivery of
services among
different regional
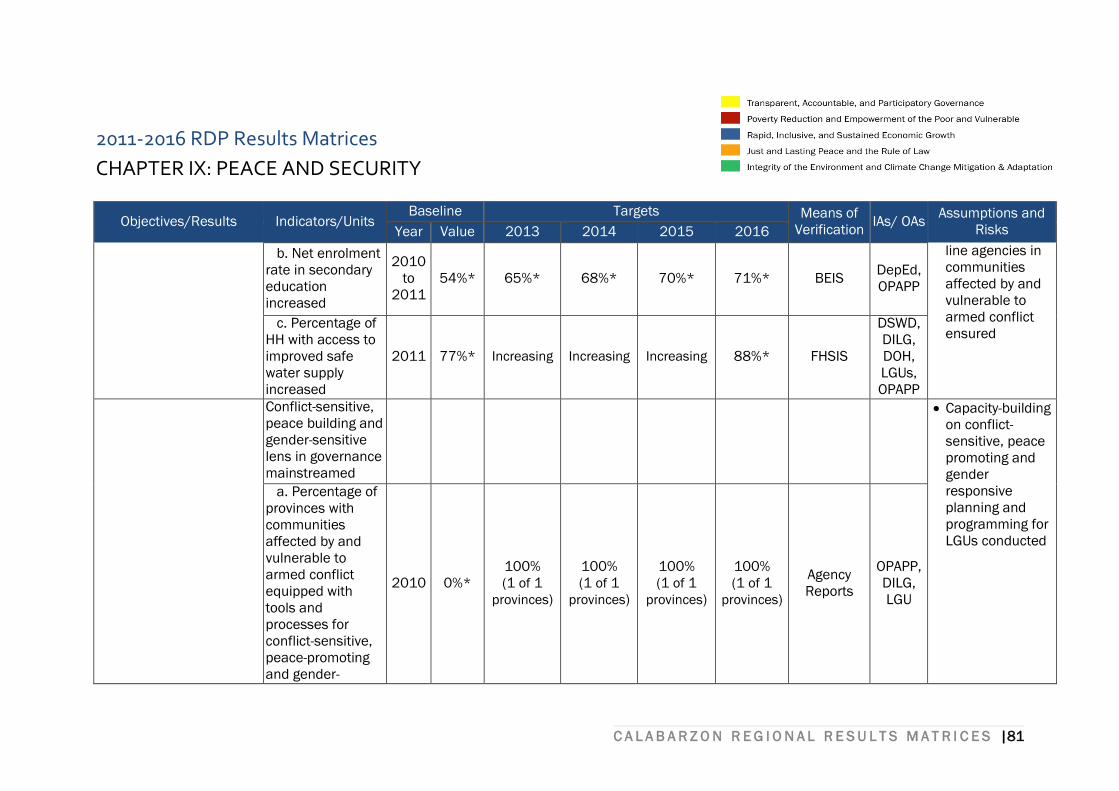
C A L A B A R Z O N R E G I O N A L R E S U L T S M A T R I C E S |81
2011-2016 RDP Results Matrices
CHAPTER IX: PEACE AND SECURITY
Objectives/Results Indicators/Units Baseline Targets Means of
Verification IAs/ OAs
Assumptions and
Risks Year Value 2013 2014 2015 2016
b. Net enrolment
rate in secondary
education
increased
2010
to
2011
54%* 65%* 68%* 70%* 71%* BEIS DepEd,
OPAPP
line agencies in
communities
affected by and
vulnerable to
armed conflict
ensured c. Percentage of
HH with access to
improved safe
water supply
increased
2011 77%* Increasing Increasing Increasing 88%* FHSIS
DSWD,
DILG,
DOH,
LGUs,
OPAPP
Conflict-sensitive,
peace building and
gender-sensitive
lens in governance
mainstreamed
Capacity-building
on conflict-
sensitive, peace
promoting and
gender
responsive
planning and
programming for
LGUs conducted
a. Percentage of
provinces with
communities
affected by and
vulnerable to
armed conflict
equipped with
tools and
processes for
conflict-sensitive,
peace-promoting
and gender-
2010 0%*
100%
(1 of 1
provinces)
100%
(1 of 1
provinces)
100%
(1 of 1
provinces)
100%
(1 of 1
provinces)
Agency
Reports
OPAPP,
DILG,
LGU
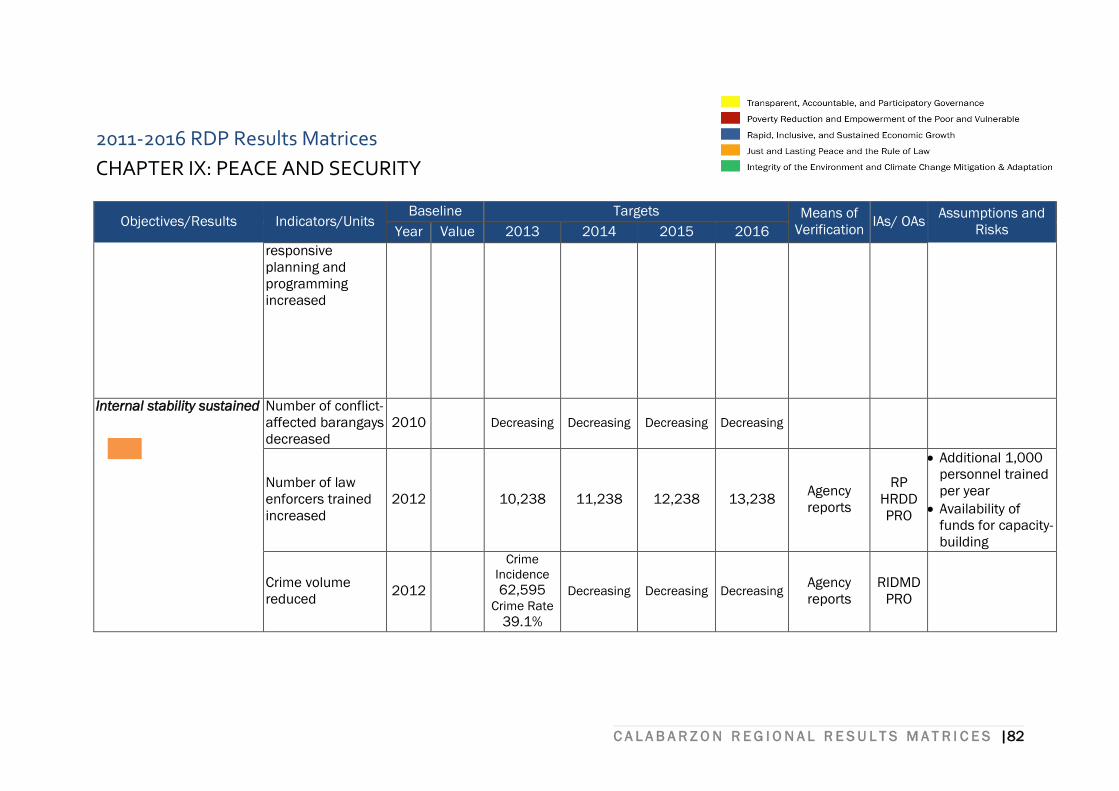
C A L A B A R Z O N R E G I O N A L R E S U L T S M A T R I C E S |82
2011-2016 RDP Results Matrices
CHAPTER IX: PEACE AND SECURITY
Objectives/Results Indicators/Units Baseline Targets Means of
Verification IAs/ OAs
Assumptions and
Risks Year Value 2013 2014 2015 2016
responsive
planning and
programming
increased
Internal stability sustained
Number of conflict-
affected barangays
decreased
2010
Decreasing Decreasing Decreasing Decreasing
Number of law
enforcers trained
increased
2012
10,238 11,238 12,238 13,238 Agency
reports
RP
HRDD
PRO
Additional 1,000
personnel trained
per year
Availability of
funds for capacity-
building
Crime volume
reduced 2012
Crime
Incidence 62,595
Crime Rate 39.1%
Decreasing Decreasing Decreasing Agency
reports
RIDMD
PRO
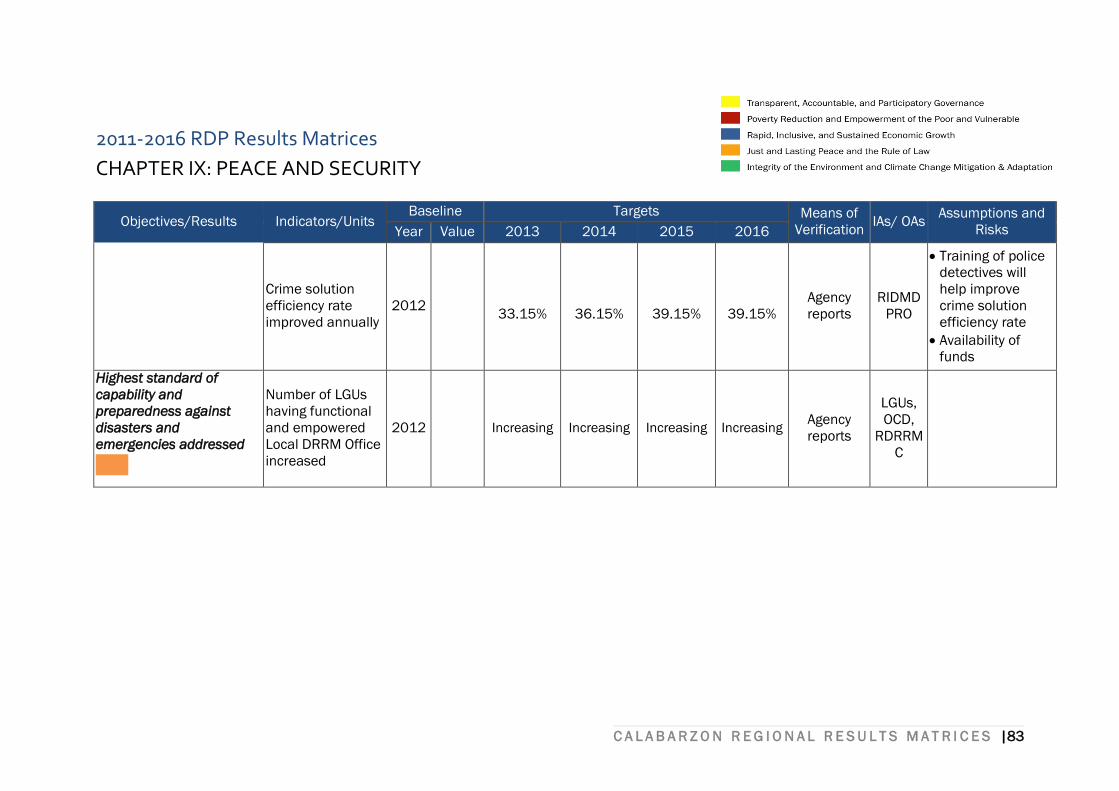
C A L A B A R Z O N R E G I O N A L R E S U L T S M A T R I C E S |83
2011-2016 RDP Results Matrices
CHAPTER IX: PEACE AND SECURITY
Objectives/Results Indicators/Units Baseline Targets Means of
Verification IAs/ OAs
Assumptions and
Risks Year Value 2013 2014 2015 2016
Crime solution
efficiency rate
improved annually
2012
33.15%
36.15%
39.15%
39.15%
Agency
reports
RIDMD
PRO
Training of police
detectives will
help improve
crime solution
efficiency rate
Availability of
funds
Highest standard of
capability and
preparedness against
disasters and
emergencies addressed
Number of LGUs
having functional
and empowered
Local DRRM Office
increased
2012 Increasing Increasing Increasing Increasing Agency
reports
LGUs,
OCD,
RDRRM
C
C A L A B A R Z O N R E G I O N A L R E S U L T S M A T R I C E S |84
CHAPTER X
CONSERVATION,
PROTECTION AND
REHABILITATION
OF THE ENVIRONMENT AND
NATURAL RESOURCES
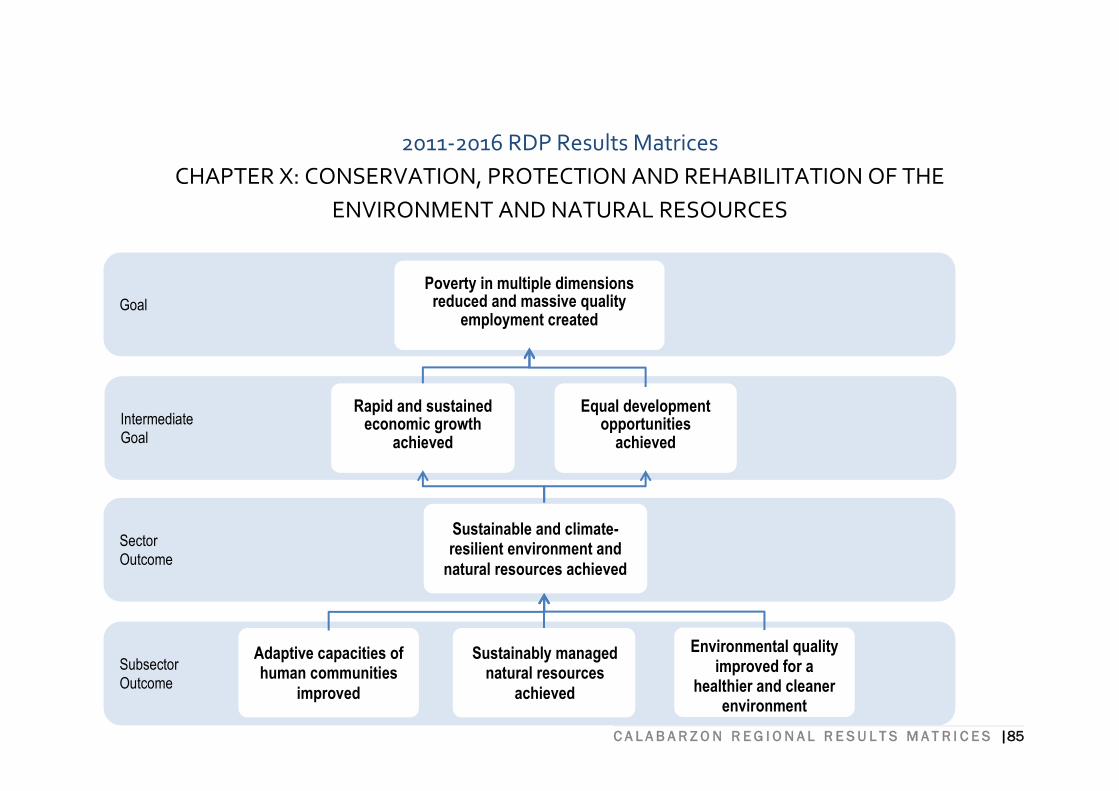
C A L A B A R Z O N R E G I O N A L R E S U L T S M A T R I C E S |85
2011-2016 RDP Results Matrices
CHAPTER X: CONSERVATION, PROTECTION AND REHABILITATION OF THE
ENVIRONMENT AND NATURAL RESOURCES
Subsector
Outcome
Sector
Outcome
Intermediate
Goal
Goal
Poverty in multiple dimensions reduced and massive quality
employment created
Rapid and sustained economic growth
achieved
Sustainable and climate-resilient environment and
natural resources achieved
Adaptive capacities of human communities
improved
Sustainably managed natural resources
achieved
Environmental quality improved for a
healthier and cleaner environment
Equal development opportunities
achieved
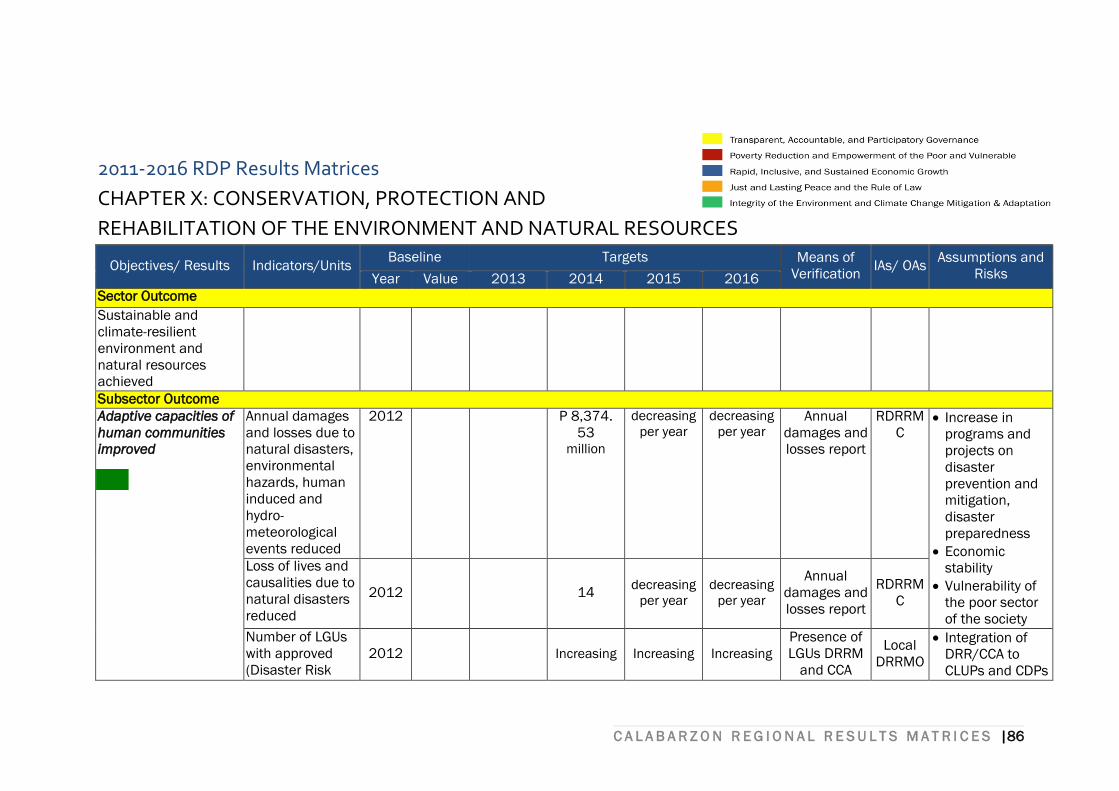
C A L A B A R Z O N R E G I O N A L R E S U L T S M A T R I C E S |86
2011-2016 RDP Results Matrices
CHAPTER X: CONSERVATION, PROTECTION AND
REHABILITATION OF THE ENVIRONMENT AND NATURAL RESOURCES
Objectives/ Results Indicators/Units Baseline Targets Means of
Verification IAs/ OAs
Assumptions and
Risks Year Value 2013 2014 2015 2016
Sector Outcome
Sustainable and
climate-resilient
environment and
natural resources
achieved
Subsector Outcome
Adaptive capacities of
human communities
improved
Annual damages
and losses due to
natural disasters,
environmental
hazards, human
induced and
hydro-
meteorological
events reduced
2012 P 8,374.
53 million
decreasing
per year
decreasing
per year Annual
damages and
losses report
RDRRM
C Increase in
programs and
projects on
disaster
prevention and
mitigation,
disaster
preparedness
Economic
stability
Vulnerability of
the poor sector
of the society
Loss of lives and
causalities due to
natural disasters
reduced
2012
14 decreasing
per year
decreasing
per year
Annual
damages and
losses report
RDRRM
C
Number of LGUs
with approved
(Disaster Risk
2012
Increasing Increasing Increasing
Presence of
LGUs DRRM
and CCA
Local
DRRMO
Integration of
DRR/CCA to
CLUPs and CDPs
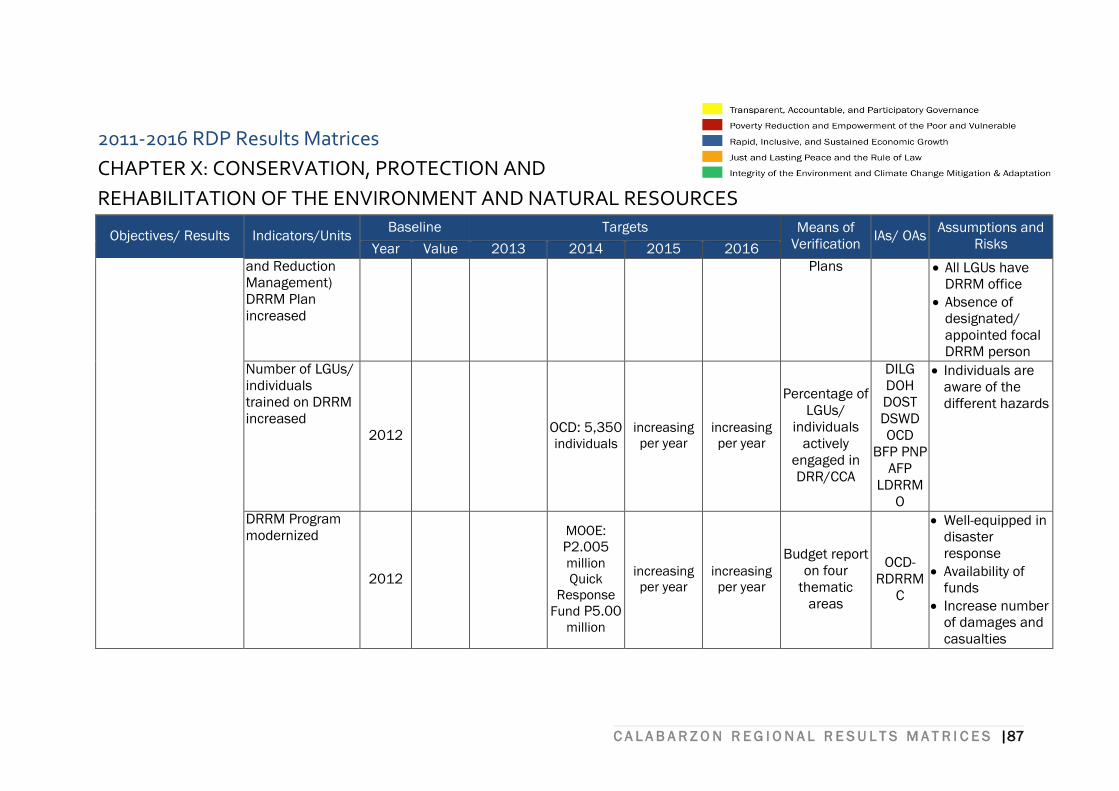
C A L A B A R Z O N R E G I O N A L R E S U L T S M A T R I C E S |87
2011-2016 RDP Results Matrices
CHAPTER X: CONSERVATION, PROTECTION AND
REHABILITATION OF THE ENVIRONMENT AND NATURAL RESOURCES
Objectives/ Results Indicators/Units Baseline Targets Means of
Verification IAs/ OAs
Assumptions and
Risks Year Value 2013 2014 2015 2016
and Reduction
Management)
DRRM Plan
increased
Plans All LGUs have
DRRM office
Absence of
designated/
appointed focal
DRRM person
Number of LGUs/
individuals
trained on DRRM
increased
2012
OCD: 5,350 individuals
increasing
per year
increasing
per year
Percentage of
LGUs/
individuals
actively
engaged in
DRR/CCA
DILG
DOH
DOST
DSWD
OCD
BFP PNP
AFP
LDRRM
O
Individuals are
aware of the
different hazards
DRRM Program
modernized
2012
MOOE: P2.005 million
Quick
Response
Fund P5.00 million
increasing
per year
increasing
per year
Budget report
on four
thematic
areas
OCD-
RDRRM
C
Well-equipped in
disaster
response
Availability of
funds
Increase number
of damages and
casualties
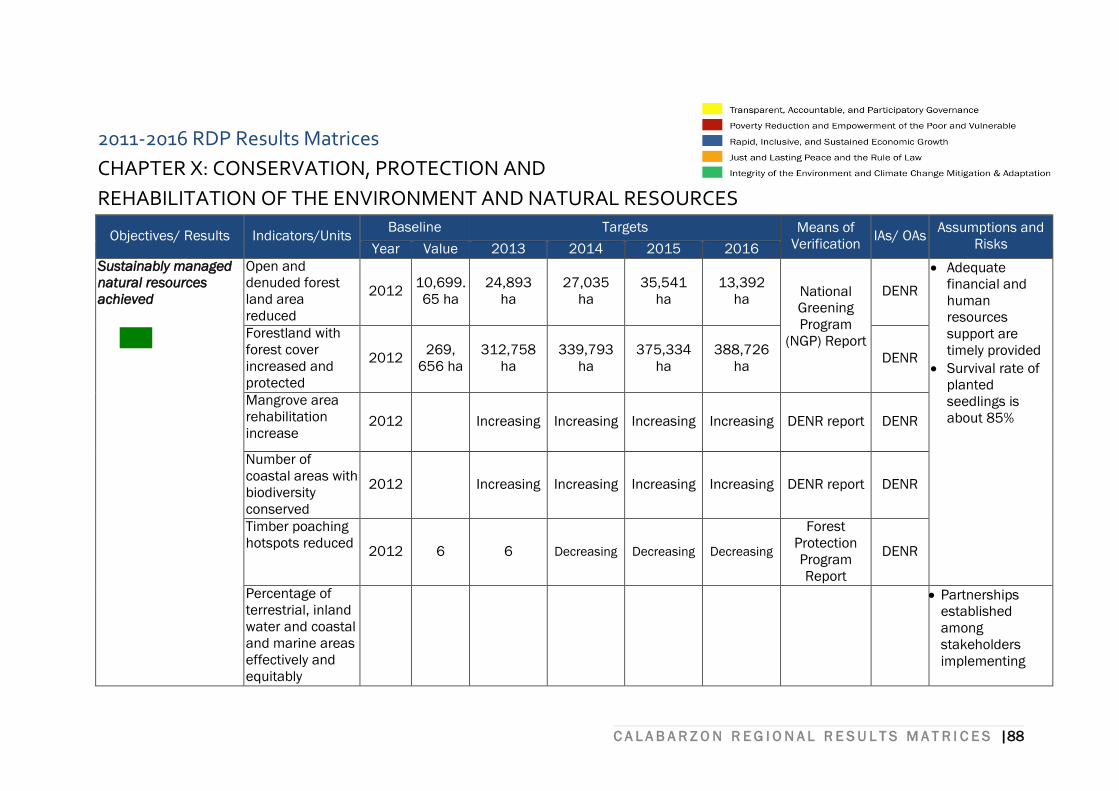
C A L A B A R Z O N R E G I O N A L R E S U L T S M A T R I C E S |88
2011-2016 RDP Results Matrices
CHAPTER X: CONSERVATION, PROTECTION AND
REHABILITATION OF THE ENVIRONMENT AND NATURAL RESOURCES
Objectives/ Results Indicators/Units Baseline Targets Means of
Verification IAs/ OAs
Assumptions and
Risks Year Value 2013 2014 2015 2016
Sustainably managed
natural resources
achieved
Open and
denuded forest
land area
reduced
2012 10,699.
65 ha
24,893
ha
27,035
ha
35,541
ha
13,392
ha National
Greening
Program
(NGP) Report
DENR
Adequate
financial and
human
resources
support are
timely provided
Survival rate of
planted
seedlings is
about 85%
Forestland with
forest cover
increased and
protected
2012 269,
656 ha
312,758
ha
339,793
ha
375,334
ha
388,726
ha DENR
Mangrove area
rehabilitation
increase 2012 Increasing Increasing Increasing Increasing DENR report DENR
Number of
coastal areas with
biodiversity
conserved
2012 Increasing Increasing Increasing Increasing DENR report DENR
Timber poaching
hotspots reduced 2012 6 6 Decreasing Decreasing Decreasing
Forest
Protection
Program
Report
DENR
Percentage of
terrestrial, inland
water and coastal
and marine areas
effectively and
equitably
Partnerships
established
among
stakeholders
implementing
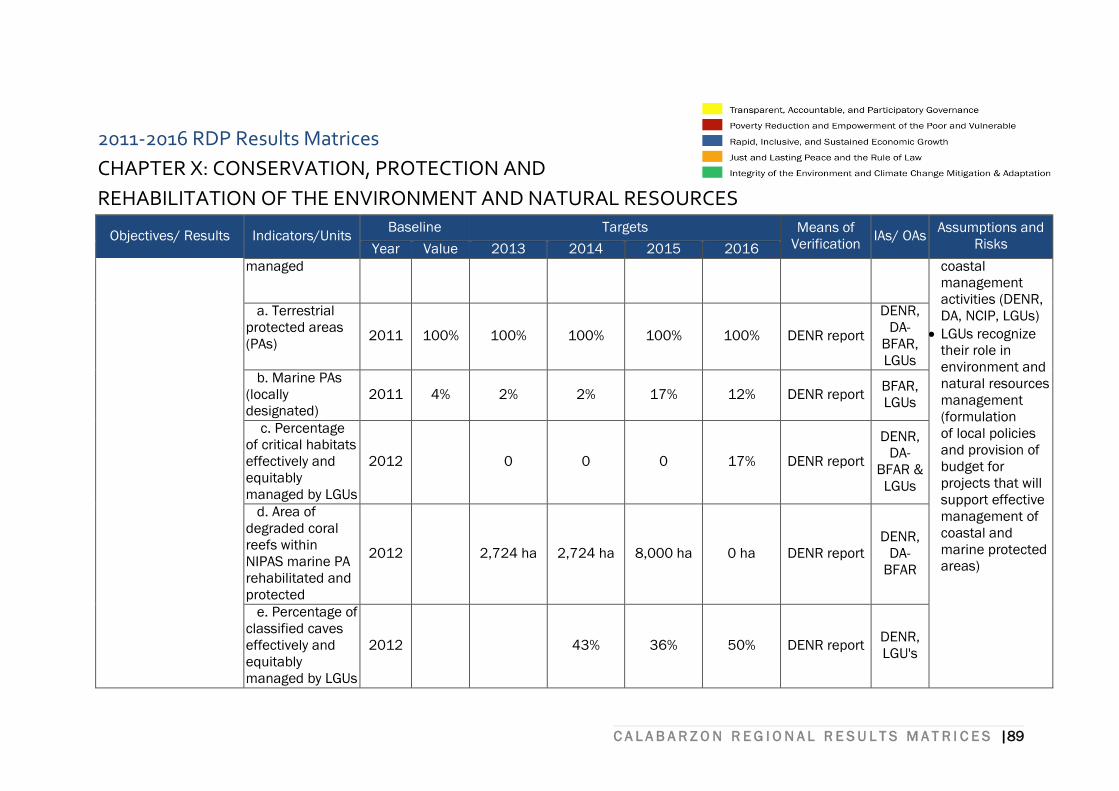
C A L A B A R Z O N R E G I O N A L R E S U L T S M A T R I C E S |89
2011-2016 RDP Results Matrices
CHAPTER X: CONSERVATION, PROTECTION AND
REHABILITATION OF THE ENVIRONMENT AND NATURAL RESOURCES
Objectives/ Results Indicators/Units Baseline Targets Means of
Verification IAs/ OAs
Assumptions and
Risks Year Value 2013 2014 2015 2016
managed coastal
management
activities (DENR,
DA, NCIP, LGUs)
LGUs recognize
their role in
environment and
natural resources
management
(formulation
of local policies
and provision of
budget for
projects that will
support effective
management of
coastal and
marine protected
areas)
a. Terrestrial
protected areas
(PAs) 2011 100% 100% 100% 100% 100% DENR report
DENR,
DA-
BFAR,
LGUs
b. Marine PAs
(locally
designated)
2011 4% 2% 2% 17% 12% DENR report BFAR,
LGUs
c. Percentage
of critical habitats
effectively and
equitably
managed by LGUs
2012
0 0 0 17% DENR report
DENR,
DA-
BFAR &
LGUs
d. Area of
degraded coral
reefs within
NIPAS marine PA
rehabilitated and
protected
2012
2,724 ha 2,724 ha 8,000 ha 0 ha DENR report
DENR,
DA-
BFAR
e. Percentage of
classified caves
effectively and
equitably
managed by LGUs
2012
43% 36% 50% DENR report DENR,
LGU's
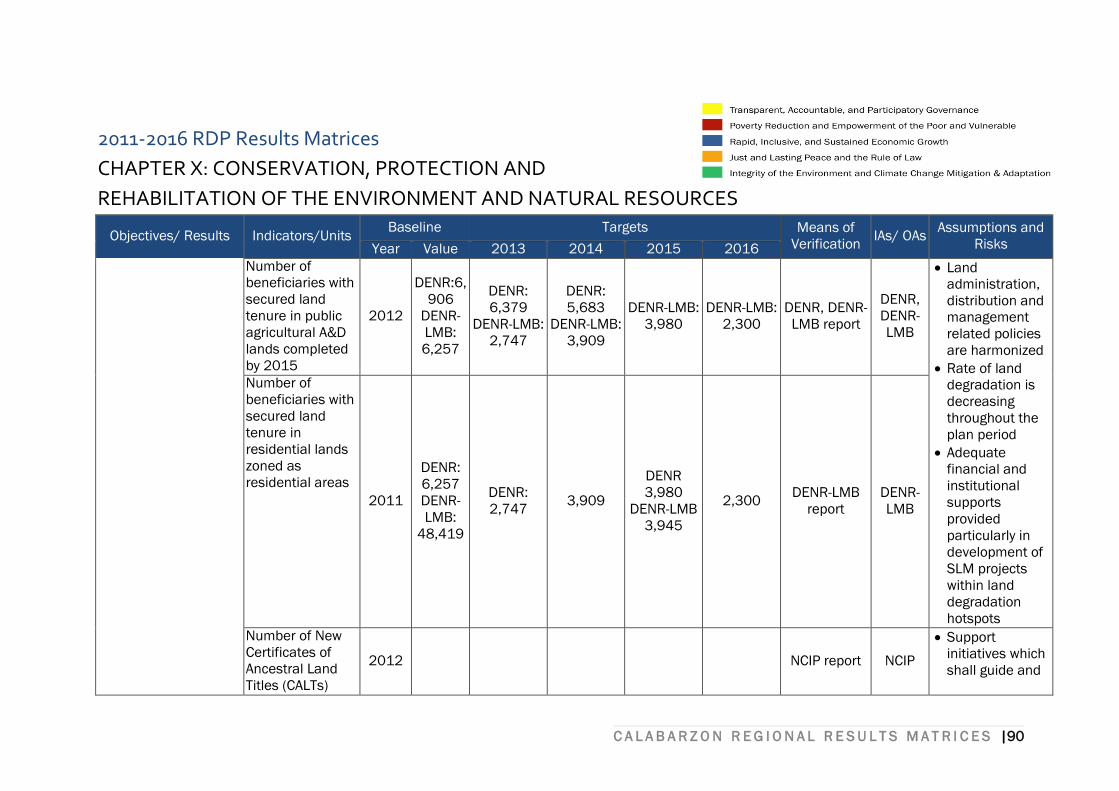
C A L A B A R Z O N R E G I O N A L R E S U L T S M A T R I C E S |90
2011-2016 RDP Results Matrices
CHAPTER X: CONSERVATION, PROTECTION AND
REHABILITATION OF THE ENVIRONMENT AND NATURAL RESOURCES
Objectives/ Results Indicators/Units Baseline Targets Means of
Verification IAs/ OAs
Assumptions and
Risks Year Value 2013 2014 2015 2016
Number of
beneficiaries with
secured land
tenure in public
agricultural A&D
lands completed
by 2015
2012
DENR:6,
906
DENR-
LMB:
6,257
DENR:
6,379
DENR-LMB:
2,747
DENR:
5,683
DENR-LMB:
3,909
DENR-LMB:
3,980
DENR-LMB:
2,300
DENR, DENR-
LMB report
DENR,
DENR-
LMB
Land
administration,
distribution and
management
related policies
are harmonized
Rate of land
degradation is
decreasing
throughout the
plan period
Adequate
financial and
institutional
supports
provided
particularly in
development of
SLM projects
within land
degradation
hotspots
Number of
beneficiaries with
secured land
tenure in
residential lands
zoned as
residential areas
2011
DENR:
6,257
DENR-
LMB:
48,419
DENR:
2,747 3,909
DENR
3,980
DENR-LMB
3,945
2,300 DENR-LMB
report
DENR-
LMB
Number of New
Certificates of
Ancestral Land
Titles (CALTs)
2012
NCIP report NCIP
Support
initiatives which
shall guide and
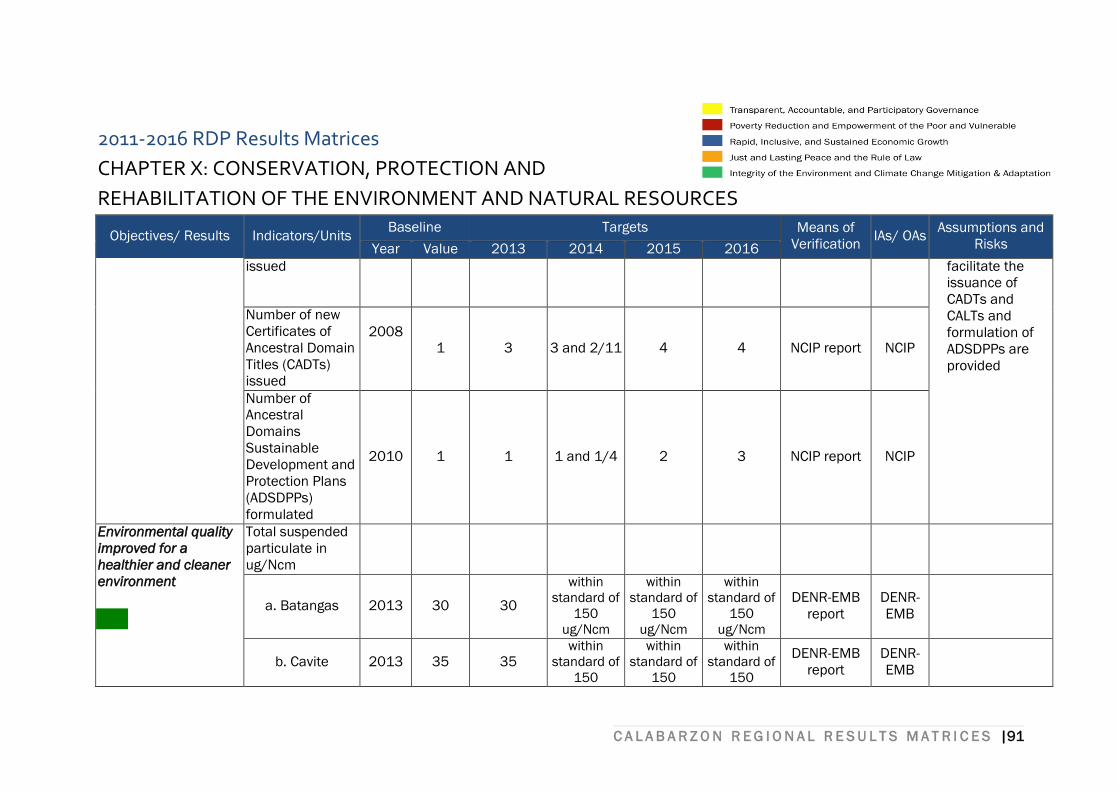
C A L A B A R Z O N R E G I O N A L R E S U L T S M A T R I C E S |91
2011-2016 RDP Results Matrices
CHAPTER X: CONSERVATION, PROTECTION AND
REHABILITATION OF THE ENVIRONMENT AND NATURAL RESOURCES
Objectives/ Results Indicators/Units Baseline Targets Means of
Verification IAs/ OAs
Assumptions and
Risks Year Value 2013 2014 2015 2016
issued facilitate the
issuance of
CADTs and
CALTs and
formulation of
ADSDPPs are
provided
Number of new
Certificates of
Ancestral Domain
Titles (CADTs)
issued
2008
1 3 3 and 2/11 4 4 NCIP report NCIP
Number of
Ancestral
Domains
Sustainable
Development and
Protection Plans
(ADSDPPs)
formulated
2010 1 1 1 and 1/4 2 3 NCIP report NCIP
Environmental quality
improved for a
healthier and cleaner
environment
Total suspended
particulate in
ug/Ncm
a. Batangas 2013 30 30
within
standard of
150
ug/Ncm
within
standard of
150
ug/Ncm
within
standard of
150
ug/Ncm
DENR-EMB
report
DENR-
EMB
b. Cavite 2013 35 35 within
standard of
150
within
standard of
150
within
standard of
150
DENR-EMB
report
DENR-
EMB
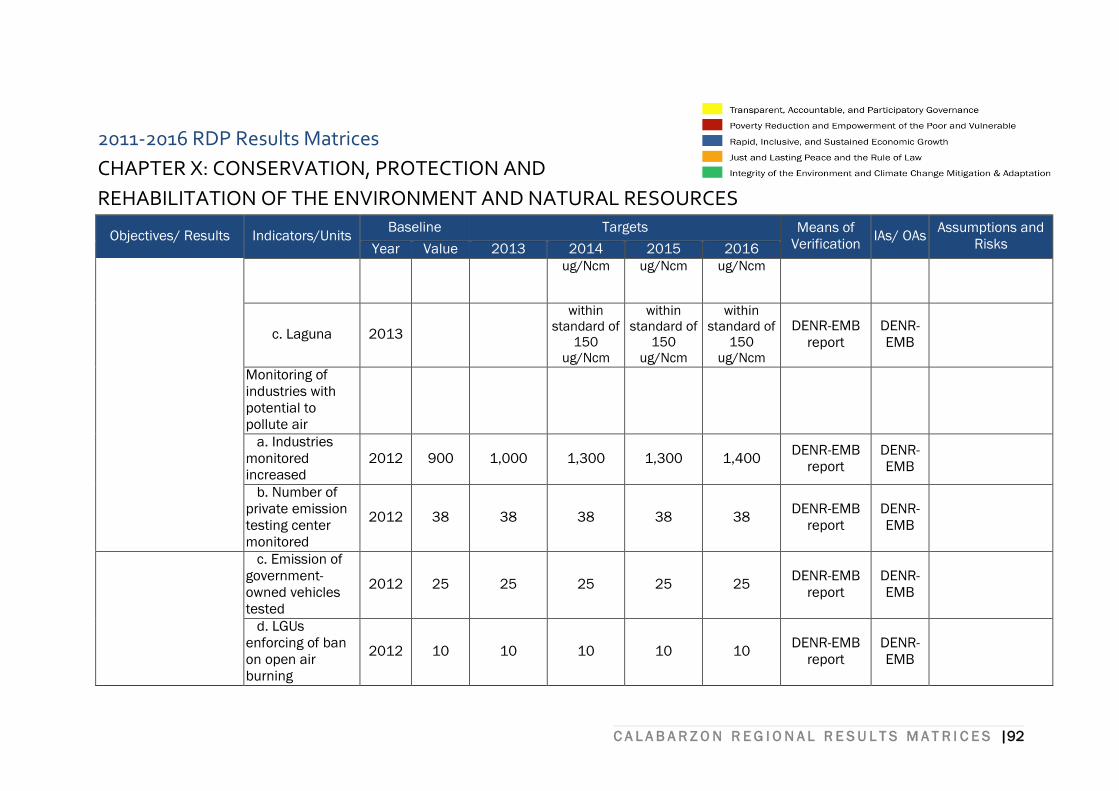
C A L A B A R Z O N R E G I O N A L R E S U L T S M A T R I C E S |92
2011-2016 RDP Results Matrices
CHAPTER X: CONSERVATION, PROTECTION AND
REHABILITATION OF THE ENVIRONMENT AND NATURAL RESOURCES
Objectives/ Results Indicators/Units Baseline Targets Means of
Verification IAs/ OAs
Assumptions and
Risks Year Value 2013 2014 2015 2016
ug/Ncm ug/Ncm ug/Ncm
c. Laguna 2013
within
standard of
150
ug/Ncm
within
standard of
150
ug/Ncm
within
standard of
150
ug/Ncm
DENR-EMB
report
DENR-
EMB
Monitoring of
industries with
potential to
pollute air
a. Industries
monitored
increased
2012 900 1,000 1,300 1,300 1,400 DENR-EMB
report
DENR-
EMB
b. Number of
private emission
testing center
monitored
2012 38 38 38 38 38 DENR-EMB
report
DENR-
EMB
c. Emission of
government-
owned vehicles
tested
2012 25 25 25 25 25 DENR-EMB
report
DENR-
EMB
d. LGUs
enforcing of ban
on open air
burning
2012 10 10 10 10 10 DENR-EMB
report
DENR-
EMB
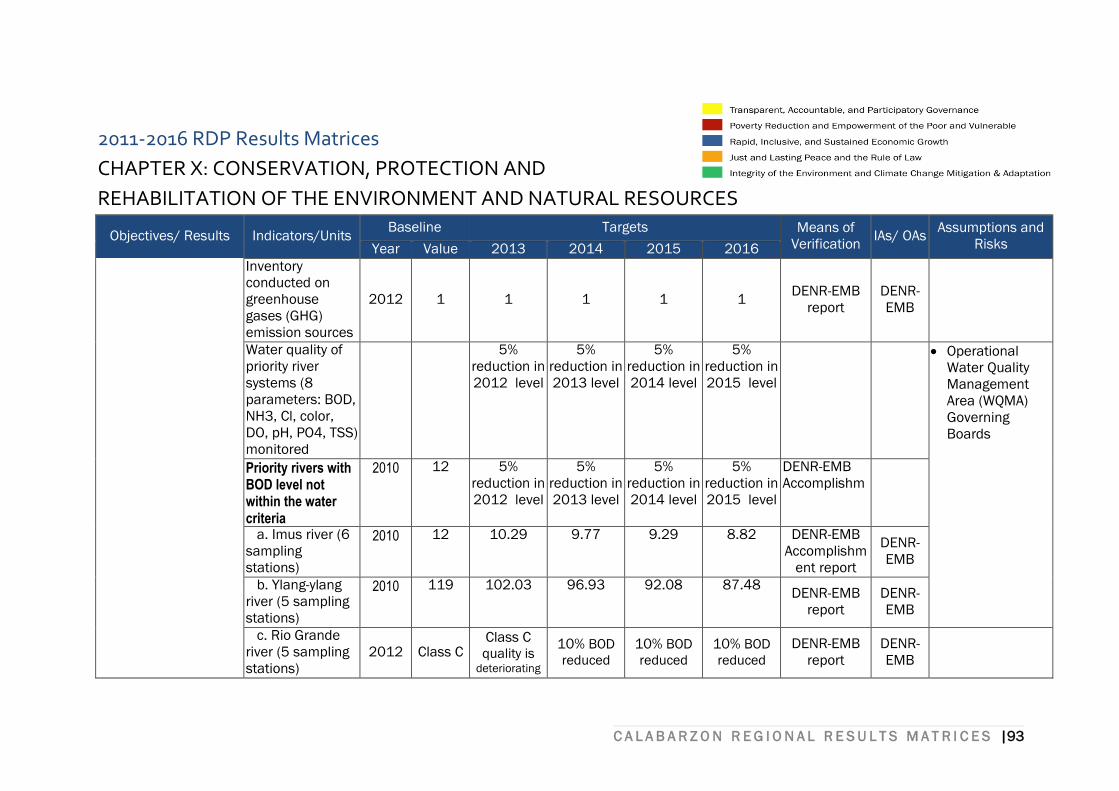
C A L A B A R Z O N R E G I O N A L R E S U L T S M A T R I C E S |93
2011-2016 RDP Results Matrices
CHAPTER X: CONSERVATION, PROTECTION AND
REHABILITATION OF THE ENVIRONMENT AND NATURAL RESOURCES
Objectives/ Results Indicators/Units Baseline Targets Means of
Verification IAs/ OAs
Assumptions and
Risks Year Value 2013 2014 2015 2016
Inventory
conducted on
greenhouse
gases (GHG)
emission sources
2012 1 1 1 1 1 DENR-EMB
report
DENR-
EMB
Water quality of
priority river
systems (8
parameters: BOD,
NH3, Cl, color,
DO, pH, PO4, TSS)
monitored
5%
reduction in
2012 level
5%
reduction in
2013 level
5%
reduction in
2014 level
5%
reduction in
2015 level
Operational
Water Quality
Management
Area (WQMA)
Governing
Boards
Priority rivers with BOD level not within the water criteria
2010 12 5%
reduction in
2012 level
5%
reduction in
2013 level
5%
reduction in
2014 level
5%
reduction in
2015 level
DENR-EMB
Accomplishm
a. Imus river (6
sampling
stations)
2010 12 10.29 9.77 9.29 8.82 DENR-EMB
Accomplishm
ent report
DENR-
EMB
b. Ylang-ylang
river (5 sampling
stations)
2010 119 102.03 96.93 92.08 87.48 DENR-EMB
report
DENR-
EMB
c. Rio Grande
river (5 sampling
stations)
2012 Class C Class C quality is
deteriorating
10% BOD
reduced 10% BOD
reduced 10% BOD
reduced
DENR-EMB
report
DENR-
EMB
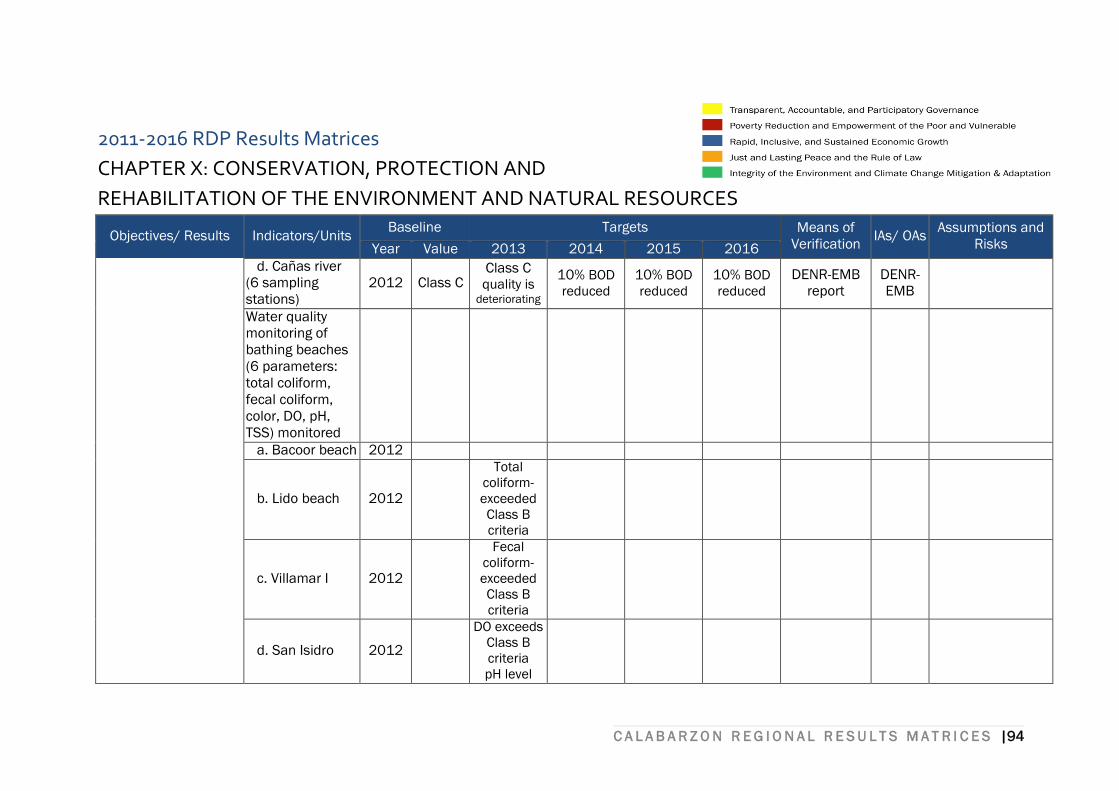
C A L A B A R Z O N R E G I O N A L R E S U L T S M A T R I C E S |94
2011-2016 RDP Results Matrices
CHAPTER X: CONSERVATION, PROTECTION AND
REHABILITATION OF THE ENVIRONMENT AND NATURAL RESOURCES
Objectives/ Results Indicators/Units Baseline Targets Means of
Verification IAs/ OAs
Assumptions and
Risks Year Value 2013 2014 2015 2016
d. Cañas river
(6 sampling
stations)
2012 Class C Class C quality is
deteriorating
10% BOD
reduced 10% BOD
reduced 10% BOD
reduced
DENR-EMB
report
DENR-
EMB
Water quality
monitoring of
bathing beaches
(6 parameters:
total coliform,
fecal coliform,
color, DO, pH,
TSS) monitored
a. Bacoor beach 2012
b. Lido beach 2012
Total
coliform-
exceeded
Class B
criteria
c. Villamar I 2012
Fecal
coliform-
exceeded
Class B
criteria
d. San Isidro 2012
DO exceeds
Class B
criteria
pH level
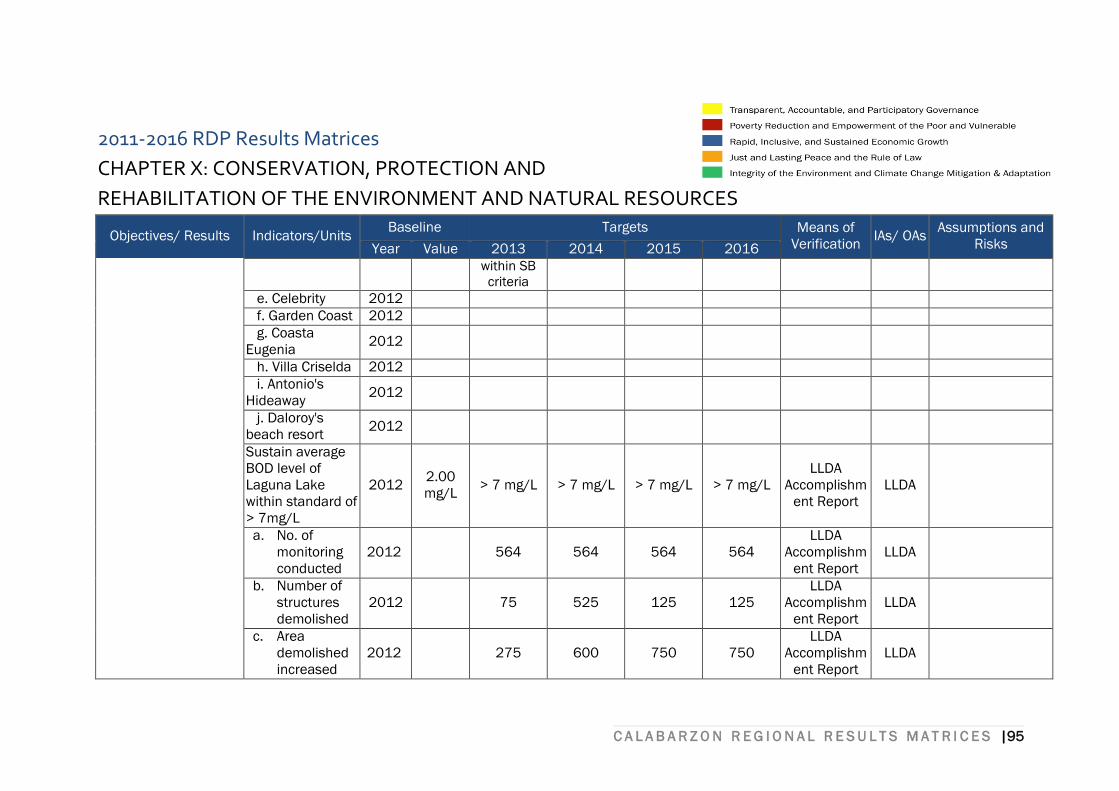
C A L A B A R Z O N R E G I O N A L R E S U L T S M A T R I C E S |95
2011-2016 RDP Results Matrices
CHAPTER X: CONSERVATION, PROTECTION AND
REHABILITATION OF THE ENVIRONMENT AND NATURAL RESOURCES
Objectives/ Results Indicators/Units Baseline Targets Means of
Verification IAs/ OAs
Assumptions and
Risks Year Value 2013 2014 2015 2016
within SB
criteria
e. Celebrity 2012
f. Garden Coast 2012
g. Coasta
Eugenia 2012
h. Villa Criselda 2012
i. Antonio's
Hideaway 2012
j. Daloroy's
beach resort 2012
Sustain average
BOD level of
Laguna Lake
within standard of
> 7mg/L
2012 2.00
mg/L > 7 mg/L > 7 mg/L > 7 mg/L > 7 mg/L
LLDA
Accomplishm
ent Report
LLDA
a. No. of
monitoring
conducted
2012 564 564 564 564
LLDA
Accomplishm
ent Report
LLDA
b. Number of
structures
demolished
2012 75 525 125 125
LLDA
Accomplishm
ent Report
LLDA
c. Area
demolished
increased
2012 275 600 750 750
LLDA
Accomplishm
ent Report
LLDA
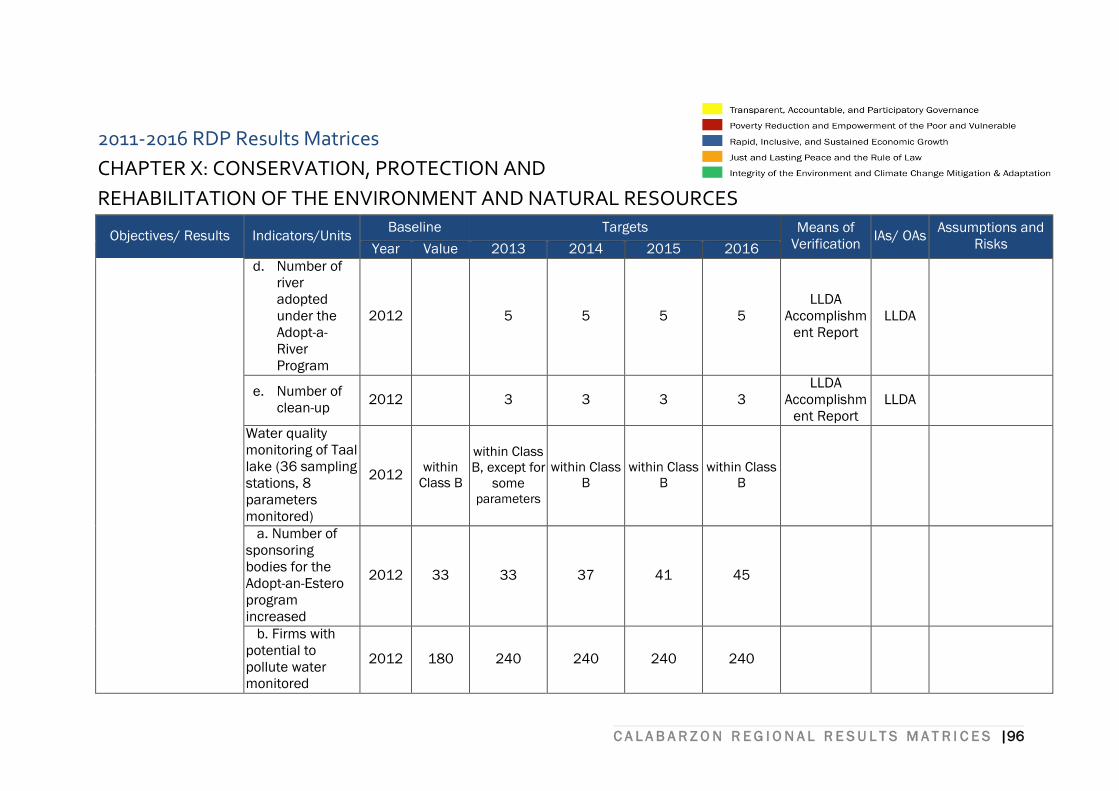
C A L A B A R Z O N R E G I O N A L R E S U L T S M A T R I C E S |96
2011-2016 RDP Results Matrices
CHAPTER X: CONSERVATION, PROTECTION AND
REHABILITATION OF THE ENVIRONMENT AND NATURAL RESOURCES
Objectives/ Results Indicators/Units Baseline Targets Means of
Verification IAs/ OAs
Assumptions and
Risks Year Value 2013 2014 2015 2016
d. Number of
river
adopted
under the
Adopt-a-
River
Program
2012 5 5 5 5
LLDA
Accomplishm
ent Report
LLDA
e. Number of
clean-up 2012 3 3 3 3
LLDA
Accomplishm
ent Report
LLDA
Water quality
monitoring of Taal
lake (36 sampling
stations, 8
parameters
monitored)
2012 within
Class B
within Class
B, except for
some parameters
within Class
B
within Class
B
within Class
B
a. Number of
sponsoring
bodies for the
Adopt-an-Estero
program
increased
2012 33 33 37 41 45
b. Firms with
potential to
pollute water
monitored
2012 180 240 240 240 240
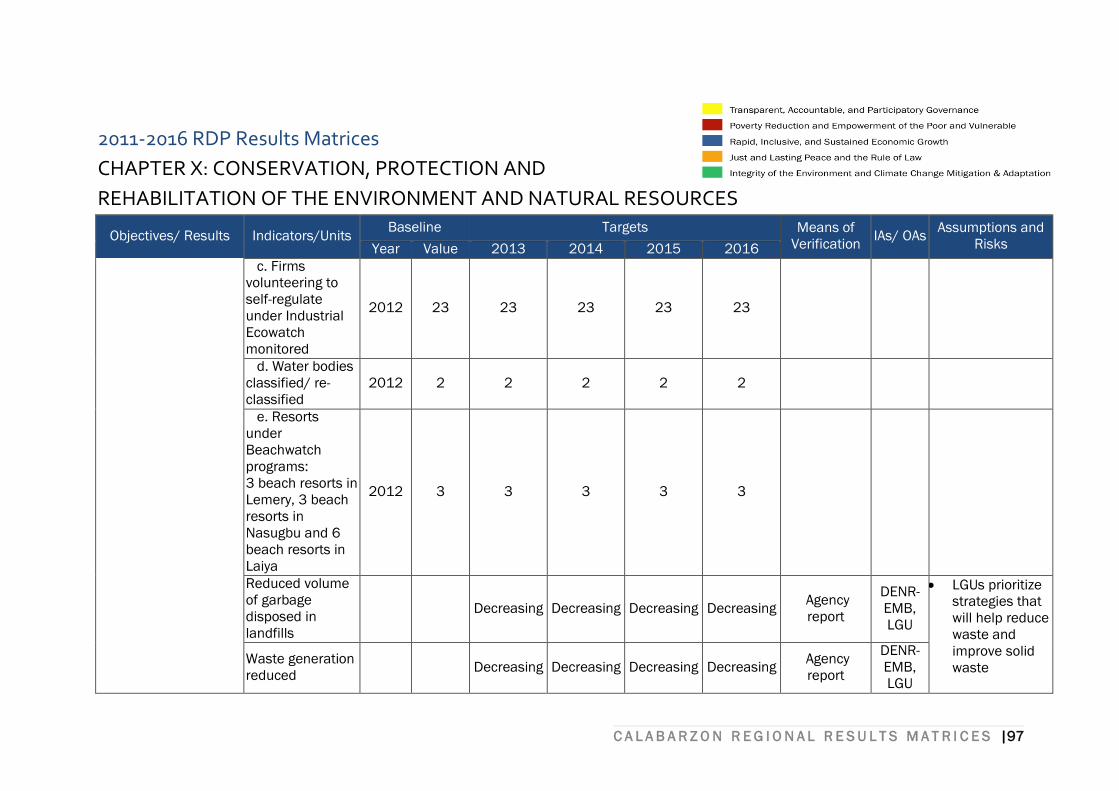
C A L A B A R Z O N R E G I O N A L R E S U L T S M A T R I C E S |97
2011-2016 RDP Results Matrices
CHAPTER X: CONSERVATION, PROTECTION AND
REHABILITATION OF THE ENVIRONMENT AND NATURAL RESOURCES
Objectives/ Results Indicators/Units Baseline Targets Means of
Verification IAs/ OAs
Assumptions and
Risks Year Value 2013 2014 2015 2016
c. Firms
volunteering to
self-regulate
under Industrial
Ecowatch
monitored
2012 23 23 23 23 23
d. Water bodies
classified/ re-
classified
2012 2 2 2 2 2
e. Resorts
under
Beachwatch
programs:
3 beach resorts in
Lemery, 3 beach
resorts in
Nasugbu and 6
beach resorts in
Laiya
2012 3 3 3 3 3
Reduced volume
of garbage
disposed in
landfills
Decreasing Decreasing Decreasing Decreasing Agency
report
DENR-
EMB,
LGU
LGUs prioritize
strategies that
will help reduce
waste and
improve solid
waste Waste generation
reduced Decreasing Decreasing Decreasing Decreasing
Agency
report
DENR-
EMB,
LGU
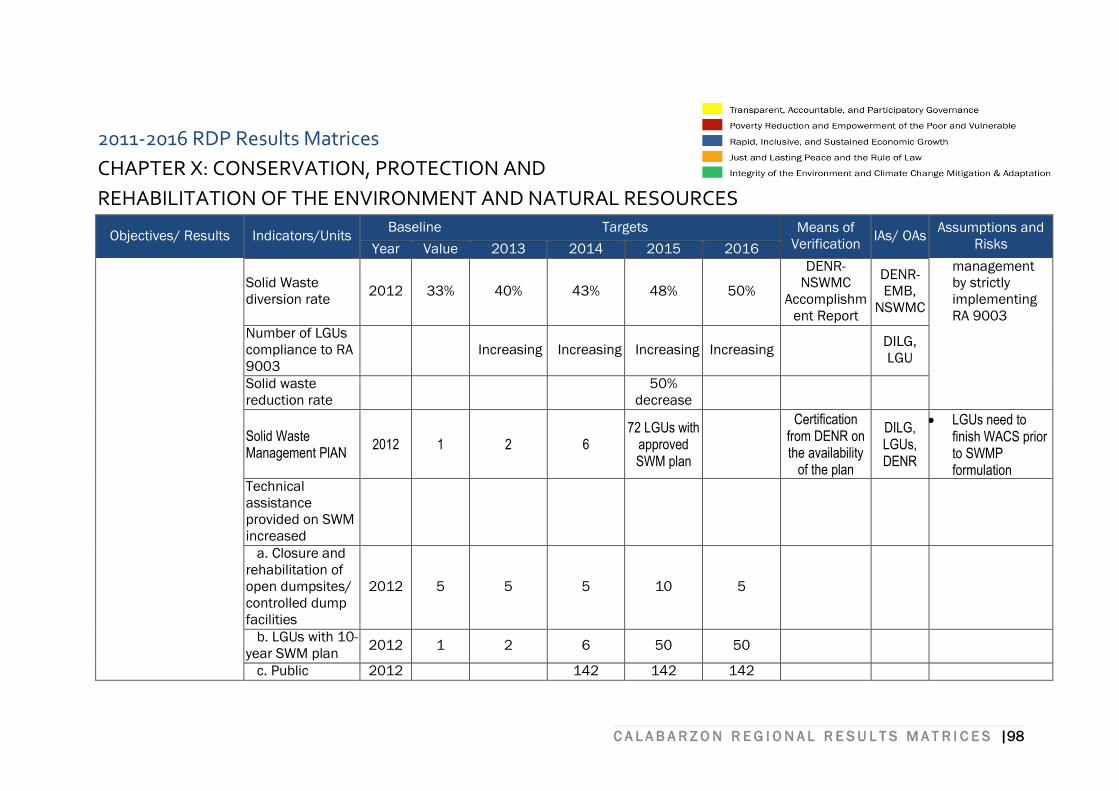
C A L A B A R Z O N R E G I O N A L R E S U L T S M A T R I C E S |98
2011-2016 RDP Results Matrices
CHAPTER X: CONSERVATION, PROTECTION AND
REHABILITATION OF THE ENVIRONMENT AND NATURAL RESOURCES
Objectives/ Results Indicators/Units Baseline Targets Means of
Verification IAs/ OAs
Assumptions and
Risks Year Value 2013 2014 2015 2016
Solid Waste
diversion rate 2012 33% 40% 43% 48% 50%
DENR-
NSWMC
Accomplishm
ent Report
DENR-
EMB,
NSWMC
management
by strictly
implementing
RA 9003
Number of LGUs
compliance to RA
9003
Increasing Increasing Increasing Increasing DILG,
LGU
Solid waste
reduction rate
50%
decrease
Solid Waste Management PlAN
2012 1 2 6
72 LGUs with approved SWM plan
Certification from DENR on the availability
of the plan
DILG, LGUs, DENR
LGUs need to finish WACS prior to SWMP formulation
Technical
assistance
provided on SWM
increased
a. Closure and
rehabilitation of
open dumpsites/
controlled dump
facilities
2012 5 5 5 10 5
b. LGUs with 10-
year SWM plan 2012 1 2 6 50 50
c. Public 2012 142 142 142
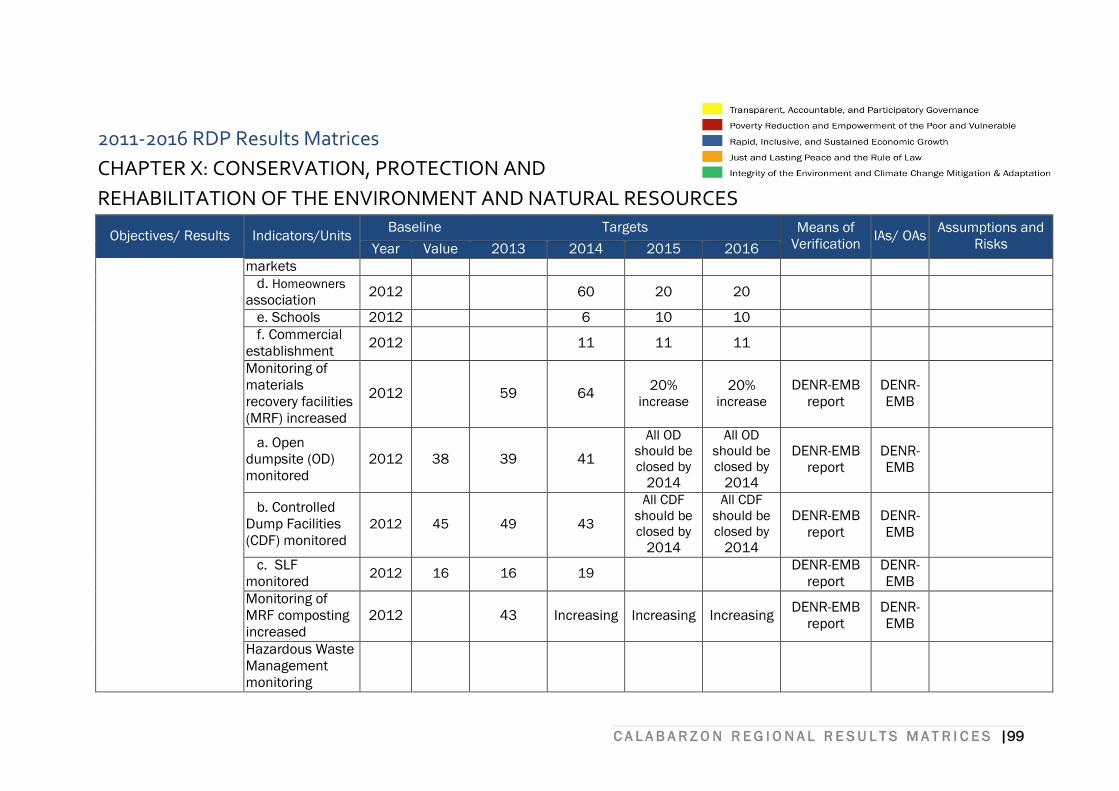
C A L A B A R Z O N R E G I O N A L R E S U L T S M A T R I C E S |99
2011-2016 RDP Results Matrices
CHAPTER X: CONSERVATION, PROTECTION AND
REHABILITATION OF THE ENVIRONMENT AND NATURAL RESOURCES
Objectives/ Results Indicators/Units Baseline Targets Means of
Verification IAs/ OAs
Assumptions and
Risks Year Value 2013 2014 2015 2016
markets
d. Homeowners
association 2012 60 20 20
e. Schools 2012 6 10 10
f. Commercial
establishment 2012 11 11 11
Monitoring of
materials
recovery facilities
(MRF) increased
2012 59 64 20%
increase 20%
increase
DENR-EMB
report
DENR-
EMB
a. Open
dumpsite (OD)
monitored
2012 38 39 41
All OD
should be
closed by 2014
All OD
should be
closed by 2014
DENR-EMB
report
DENR-
EMB
b. Controlled
Dump Facilities
(CDF) monitored
2012 45 49 43
All CDF
should be
closed by 2014
All CDF
should be
closed by 2014
DENR-EMB
report
DENR-
EMB
c. SLF
monitored 2012 16 16 19
DENR-EMB
report
DENR-
EMB
Monitoring of
MRF composting
increased
2012 43 Increasing Increasing Increasing DENR-EMB
report
DENR-
EMB
Hazardous Waste
Management
monitoring
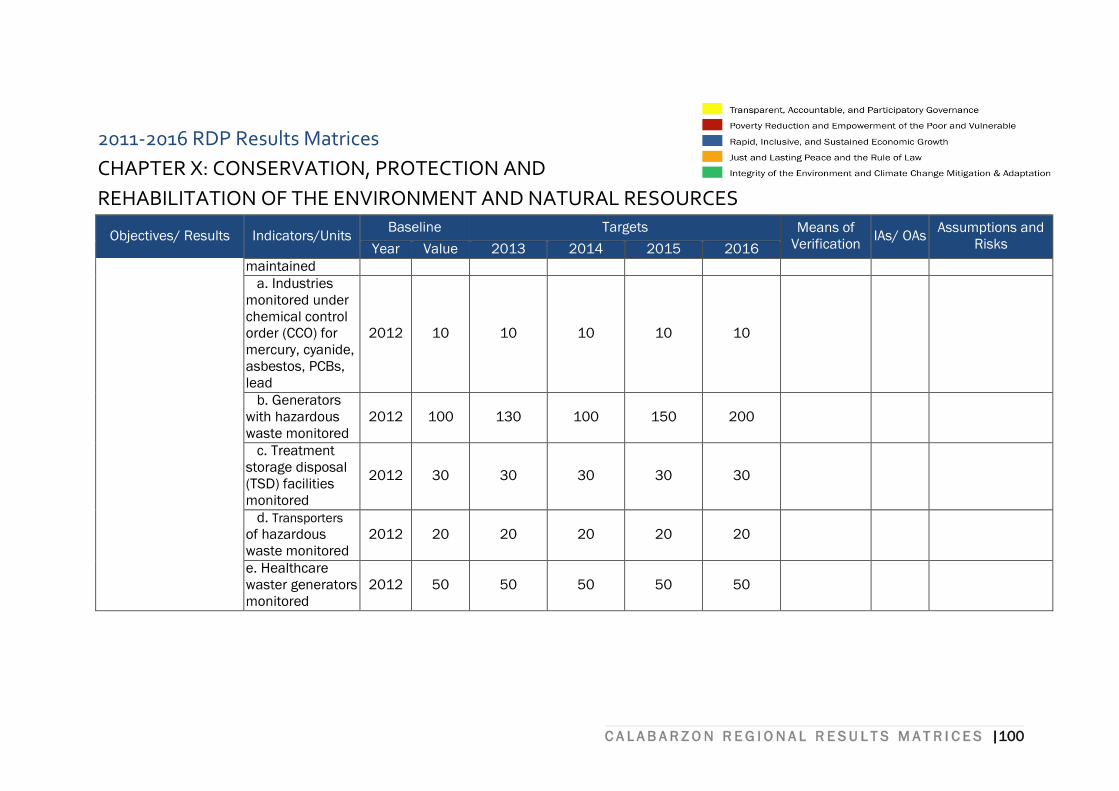
C A L A B A R Z O N R E G I O N A L R E S U L T S M A T R I C E S |100
2011-2016 RDP Results Matrices
CHAPTER X: CONSERVATION, PROTECTION AND
REHABILITATION OF THE ENVIRONMENT AND NATURAL RESOURCES
Objectives/ Results Indicators/Units Baseline Targets Means of
Verification IAs/ OAs
Assumptions and
Risks Year Value 2013 2014 2015 2016
maintained
a. Industries
monitored under
chemical control
order (CCO) for
mercury, cyanide,
asbestos, PCBs,
lead
2012 10 10 10 10 10
b. Generators
with hazardous
waste monitored
2012 100 130 100 150 200
c. Treatment
storage disposal
(TSD) facilities
monitored
2012 30 30 30 30 30
d. Transporters
of hazardous
waste monitored
2012 20 20 20 20 20
e. Healthcare
waster generators
monitored
2012 50 50 50 50 50
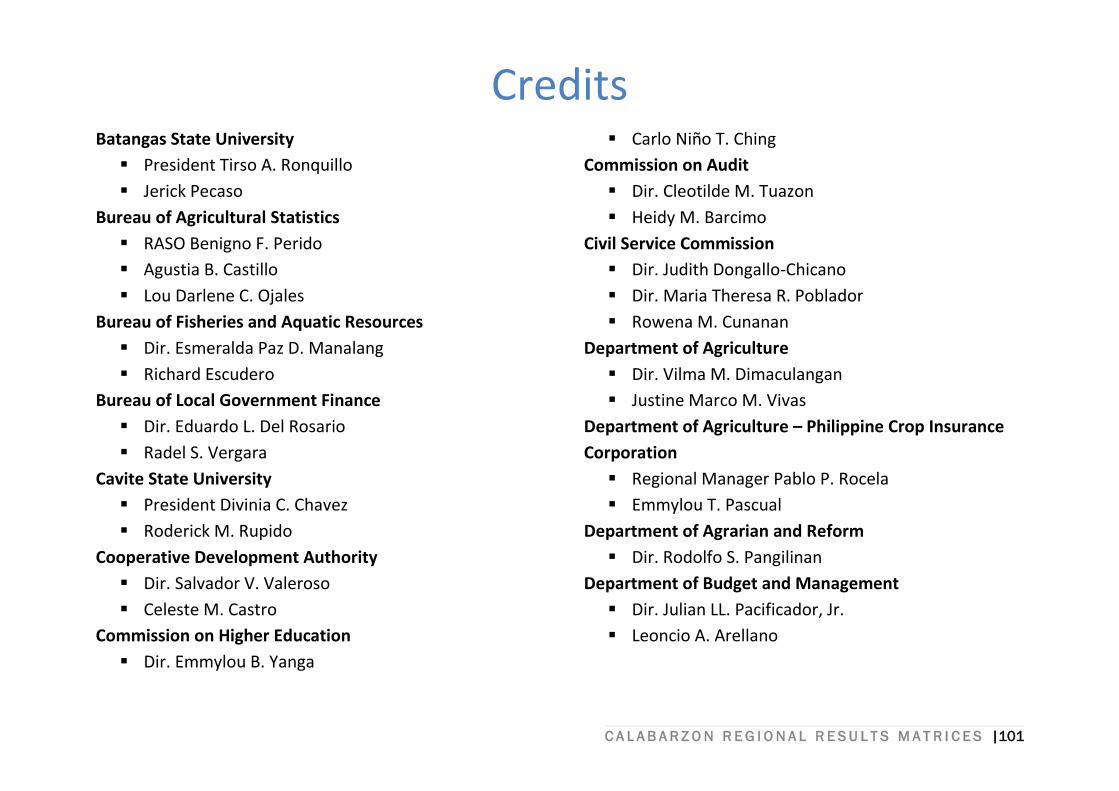
C A L A B A R Z O N R E G I O N A L R E S U L T S M A T R I C E S |101
Batangas State University
President Tirso A. Ronquillo
Jerick Pecaso
Bureau of Agricultural Statistics
RASO Benigno F. Perido
Agustia B. Castillo
Lou Darlene C. Ojales
Bureau of Fisheries and Aquatic Resources
Dir. Esmeralda Paz D. Manalang
Richard Escudero
Bureau of Local Government Finance
Dir. Eduardo L. Del Rosario
Radel S. Vergara
Cavite State University
President Divinia C. Chavez
Roderick M. Rupido
Cooperative Development Authority
Dir. Salvador V. Valeroso
Celeste M. Castro
Commission on Higher Education
Dir. Emmylou B. Yanga
Carlo Niño T. Ching
Commission on Audit
Dir. Cleotilde M. Tuazon
Heidy M. Barcimo
Civil Service Commission
Dir. Judith Dongallo-Chicano
Dir. Maria Theresa R. Poblador
Rowena M. Cunanan
Department of Agriculture
Dir. Vilma M. Dimaculangan
Justine Marco M. Vivas
Department of Agriculture – Philippine Crop Insurance
Corporation
Regional Manager Pablo P. Rocela
Emmylou T. Pascual
Department of Agrarian and Reform
Dir. Rodolfo S. Pangilinan
Department of Budget and Management
Dir. Julian LL. Pacificador, Jr.
Leoncio A. Arellano
Credits
C A L A B A R Z O N R E G I O N A L R E S U L T S M A T R I C E S |102
Department of Environment and Natural Resources
Dir. Reynulfo A. Juan
Ferdinand T. Hermano
Mailene G. Laviña
Department of Environment and Natural Resources-
Environmental Management Bureau
Dir. Carlos J. Magno
Corazon C. Gasapos
Department of Education
Dir. Diosdado M. San Antonio
Melna R. Albano
Department of Interior and Local Government
Dir. Josefina E. Castillo-Go
Jayson L. Chavez
Department of Energy
Dir. Jesus T. Tamang
Celedonio Mendoza
Department of Health
Dir. Nestor F. Santiago
Denice U. Paguirigan
Department of Justice – Parole and Probation
Administration
Dir. Allan B. Alcala
Department of Labor and Employment
Dir. Maria Zenaida A. Angara
Ethel M. Magtibay
Department of Science and Technology
Dir. Alexander R. Madrigal
Janice Irene Berris
Department of Science and Technology – Information
and Communication Technology Office
Dir. Reynaldo T. Sy
Daniel P. Dizon
Department of Tourism
Dir. Rebecca V. Labit
Marites T. Castro
Department of Public Works and Highways
Dir. Samson L. Hebra
Zosima R. Maderal
Jane F. Cruz
Department of Social Welfare and Development
Dir. Leticia T. Diokno
Eden M. Arce
Department of Trade and Industry
Dir. Marilou Q. Toledo
Edgardo B. Ferino
C A L A B A R Z O N R E G I O N A L R E S U L T S M A T R I C E S |103
Development Bank of the Philippines
VP Abelardo L. Monarquia
Donna E. Guce
Laguna State Polytechnic University
President Nestor M. De Vera
Beltran P. Pedrigal
Land Bank of the Philippines – South West Luzon
VP Ananias O. Lugo, Jr.
Madelin S. Francisco
Housing and Urban Development Coordinating Council
Dir. Avelino Tolentino
Rowena P. Dineros
Metropolitan Waterworks and Sewerage System
Dir. Gerardo A.I. Esquivel
Engr. Delfin Sespeñe
National Commission on Indigenous People
Dir. Ruben S. Bastero
Ann Stephanie T. Tapales
National Economic and Development Authority
Dir. Luis G. Banua
ARD Fidel T. Udarbe
Donald James D. Gawe
Marcelo Cesar R. Palacio
Agnes A. Daantos
Valter L. Morada
Christine Joyce B. Mendoza
Kathleen DC Melendrez
Nelson J. Aman, Jr.
Lovely S. Mores
Luningning D. Llames
Donna Riza P. Ronquillo
Mariell A. Evasco
Corazon C. Salandanan
National Irrigation Administration
Regional Manager Romeo M. Lopez
Narcisa R. Gabrido
National Nutrition Council
RNPC Carina Z. Santiago
Hannah P. Clemente
Office of the Civil Defense
Dir. Vecente F. Tomazar
Elvis S. Cruz
Office of the Presidential Adviser on the Peace Process
Hon. Teresita Quintos-Deles
Judith de Guzman
C A L A B A R Z O N R E G I O N A L R E S U L T S M A T R I C E S |104
Philippine Coconut Authorit
Regional Manager Erlene Menohar
Joey de Chavez
Philippine Economic Zone Authority
Director General Lilia B. De Lima
Romeo Corporal
Police Regional Office
Dir. Jesus T. Gatchalian
SSupt. Marcelino Villafranca
Philippine Ports Authority – PDO Luzon
District Manager Hector E. Miole
Philippine Statistics Authority – National Statistics Office
Dir. Rosalinda P. Bautista
Charity O. Bautista
Southern Luzon Command
MajGen. Ricardo R. Visaya
Col. Amadeo F. Azul, Jr.
Southern Luzon State University
Dr. Cecilia N. Gascon
Milo O. Placino
Technical Education and Skills Development Authority
Dir. Luisita S. Dela Cruz
Katrina T. Tabu
University of Rizal System
President Marita R. Canapi
Jaeson U. Cruz