Embed Size (px)
Citation preview

8/3/2019 C. Focsa et al- Fourier transform emission spectroscopy of the A^2-Pi-X^2-Sigma^+ system of BeH
http://slidepdf.com/reader/full/c-focsa-et-al-fourier-transform-emission-spectroscopy-of-the-a2-pi-x2-sigma 1/8
Fourier transform emission spectroscopy of the A2 –X
2 systemof BeH
C. Focsa,a) S. Firth,b) P. F. Bernath,c) and R. Colin Laboratoire de Chimie Physique Mole culaire, Universite Libre de Bruxelles, C.P. 160/09,50 av. F. D. Roosevelt, 1050-Brussels, Belgium
Received 21 May 1998; accepted 2 July 1998
The A2
– X 2
transition of BeH was observed by Fourier transform emission spectroscopyusing a hollow cathode discharge lamp. The 0–0 to 6–6 bands were rotationally analyzed andmolecular constants extracted. The equilibrium rotational constants B e and bond lengths were foundto be 10.331 2150 cm1 and 1.341 683 Å for the ground state and 10.466 3127 cm1 and1.332 992 Å in the excited state. In order to link the diagonal bands together and to determine thevibrational constants, the 0–1 to 6–7 bands in an archival arc emission spectrum were alsorotationally analyzed. In the X 2 and A 2 states, the spectroscopic constants are nearly identicalso the v1 bands were too weak to be seen in our Fourier transform spectra. Franck–Condonfactors were calculated for the A 2 – X 2 transition from Rydberg–Klein–Rees potentialcurves. These new rotational analyses now link up with the previous work on the 0–7, 0–8, 0–9,1–9 and 1–10 bands of the C 2– X 2 system R. Colin, C. Dreze, and M. Steinhauer, Can. J.Phys. 61, 641 1983. Spectroscopic data are thus available for all bound ground state vibrationallevels, v0–10, and a set of Dunham Y constants were determined. BeH joins the small group of
chemically bound molecules for which a nearly complete set of ground state rovibronic energylevels are known experimentally. © 1998 American Institute of Physics.
S0021-96069800238-4
I. INTRODUCTION
The light BeH molecule has been extensively studied byab initio quantum chemists and serves as a test case foropen-shell systems e.g., Refs. 1–9. Partly because of thetoxicity of the Be-containing molecules, BeH has been lesspopular with experimentalists. Watson10 and Olsson11 carried
out early work on the electronic emission spectra of BeH inthe late 1920s and early 1930s. BeH was made by running anarc discharge with Be electrodes in an atmosphere of hydro-gen. This early work provided extensive spectra of the A 2 – X 2 system and some data for the B 2 – X 2
system, but of only moderate quality.10–13 Koontz14 recordedthe A 2 – X 2 transition of BeD and this system hasbeen detected recently in emission from the plasma confinedin a tokamak.15
The work of Colin and co-workers16–21 has improvedand expanded our spectroscopic knowledge of BeH and BeDand they were even able to study BeT. Improved spectrawere recorded by using a carbon tube furnace King furnace
instead of an arc, and by measuring the bands in absorption.In this way visible, UV, and vacuum UV VUV down to
1700 Å spectra of BeH and BeD were recorded with the 10m spectrograph at the National Research Council inOttawa.16 These photographic plates allowed a reanalysis of the A 2 – X 2 system and for the assignment of theVUV systems.19 For reasons of safety the A 2 – X 2
transition of BeT was recorded in a hollow cathode lampwith a 2 m spectrograph.18 Most recently, the 3d Rydberg
complex of BeH and BeD was analyzed.21
All of the known band systems of BeH, BeD, and BeTare very diagonal except for the weak C 2– X 2 sys-tem that can only be seen in emission from an arcdischarge.20 In addition to the 0–0 to 5–5 bands of the A 2 – X 2 system, the arc produced the 0–7, 0–8, 0–9,1–9, 2–9, and 1–10 bands of the C 2– X 2 system.20
The tentative identification of the 0–6 band in this workproved to be incorrect. The C 2 state correlates to thesame Be (3P)H(2S) asymptote as the A 2 state but has ar e2.301 Å compared to r e1.333 Å for the A 2 stateand r e1.342 Å for the X 2 state see Fig. 1 of Ref. 20.
The problem is that the very weak off-diagonal bands of the A 2 – X 2 system only partly link the v and v0 – 5vibrational levels together and there is no direct connectionbetween the C 2– X 2 bands and any of the otherknown ground state vibrational levels (v0–5) in BeH.Fortunately, the A 2 and the C 2 states perturb eachother20 so that an indirect connection could be made and thev7 – 10 levels of the X 2 state could be located relativeto v0.
The dissociation energy ( D e17 426100 cm1) isknown for the X 2 state from the limiting curve of
aPermanent address: Laboratoire de Physique des Lasers, Atomes et Mol-ecules, UMR CNRS, Centre d’Etudes et de Recherches Lasers et Applica-tions, Universite des Sciences et Technologies de Lille, 59 655 Villeneuved’Ascq Cedex, France.
bPresent address: Department of Chemistry, University College London, 20Gordon St., London WC1H0A6, United Kingdom.
cAuthor to whom correspondence should be addressed. Permanent address:Department of Chemistry, University of Waterloo, Waterloo,Ontario N2L 3G1, Canada.
JOURNAL OF CHEMICAL PHYSICS VOLUME 109, NUMBER 14 8 OCTOBER 1998
57950021-9606/98/109(14)/5795/8/$15.00 © 1998 American Institute of Physics

8/3/2019 C. Focsa et al- Fourier transform emission spectroscopy of the A^2-Pi-X^2-Sigma^+ system of BeH
http://slidepdf.com/reader/full/c-focsa-et-al-fourier-transform-emission-spectroscopy-of-the-a2-pi-x2-sigma 2/8
predissociation20 and from predissociation in the B 2state.19 The v10 level turns out to be the last bound vi-brational level of the X 2 state, although v11 may bebound by a few cm1. BeH is thus a rather unique systemthat has spectroscopic data for low vibrational levels (v
0 – 5, not all linked and high vibrational levels (v
7–10). If these ground state levels could all be directlylinked together and the v6 gap filled, then the experimen-
tal data for BeH would be much more useful. With only fiveelectrons BeH is already widely used to benchmark open-shell ab initio methods and to study the breakdown of theBorn–Oppenheimer approximation.8,18
We report here new Fourier transform emission spectraof the A 2 – X 2 transition for the 0–0 to 6–6 vibra-tional bands. An attempt was made to link these bands to-gether by observing the vibration–rotation bands as well asthe v1 bands of the A – X system by Fourier transformemission spectroscopy, but without success. Our hollowcathode source was too weak to see the v1 bands andstrong thermal emission from the cathode swamped the in-frared vibration–rotation emission bands. There is, how-
ever, an infrared spectrum of BeH isolated in an argonmatrix.22 We, therefore, used unpublished data from thesame arc spectrum used for the C 2– X 2 analysis20
and identified the 0–1 to 6–7 bands of the A 2 – X 2
system. Thus the v0–10 levels in the X 2 state andv0– 6 in the A 2 state are now linked together on thesame energy scale. BeH thus joins the very small and exclu-sive group of chemically bound molecules that includes H2)for which all of the bound ground state levels are knownexperimentally.
II. EXPERIMENTAL DETAILS
The A 2 – X 2 v0 sequence of BeH was excitedin a Be hollow cathode discharge and recorded using a Fou-rier transform spectrometer. Spectra from two different typesof hollow cathode discharge lamps were recorded. In the firstexperiment, we used a water-cooled Be cathode held inside abrass collar and a tungsten ring anode. The cooling waterwas either off or flowing very slowly. The cathode was op-erated at currents of 1.2 A the maximum that we could getwithout arcing and with total pressures of a few Torr with amixture of 1% H2 in Ne. Be does not sputter well and thecathode must be very hot to evaporate sufficient metal tomake BeH. The Doppler width for well-resolved BeH lines
in this relatively cool spectrum was typically 0.15 cm
1, cor-responding to a temperature of about 1200 K.
In the second experiment, we recorded a hotter spectrumby using a classical, uncooled Be hollow cathode dischargelamp and with He as the buffer gas. This cathode was notbored through and a tungsten pin anode was used. In thiscase, the current was 0.7 A and the total pressure was 8Torr with 20% H2 and 80% He in the nonflowing gas mix-ture. The BeH rotational lines observed on this second spec-trum had measured linewidths of 0.19 cm1 correspondingto a temperature of about 1500 K. Our best spectrum wasrecorded just before the cathode melted. The combined studyof the two spectra proved to be very useful: while the cooler
spectrum provided better resolved lines, the hotter one al-lowed us to extend the assignment of the branches to higher N values.
The emission from the discharge was recorded with aBruker IFS 120 HR Fourier transform spectrometer. A Siphotodiode detector was used and a bandpass filter served toisolate the 18 000–22 500 cm1 spectral region. A total of 50 scans were coadded in about 30 min of observation at an
instrumental resolution of 0.1 cm1
. Higher resolution spec-tra were not recorded because of the large Doppler broaden-ing of the BeH lines. The isolated BeH lines were not alwayssymmetric because of problems with the phase correction.
The spectra were recorded in air so the line positionswere first corrected to vacuum wave numbers using the re-fractive index of air. The wave number scale was then cali-brated in the cooler spectrum using Ne lines23 and this cali-bration was transferred to the hotter spectrum using strongBeH lines. The estimated absolute accuracy of the wavenumber scale is 0.003 cm1. The line positions were mea-sured by fitting Voigt line shape functions to the experimen-tal lines in a nonlinear, least-squares procedure using the
program SPECTRA. The precision of our measurements is es-timated to be about 0.01 cm1 for unblended lines.
The experimental setup used to record the A 2 – X 2
v1 sequence was previously described in detail byColin et al.20 in their study of the C 2– X 2 systemand only a brief description will be given here. A conven-tional arc source with Be electrodes was used to excite thespectrum. The dc arc was operated at 190 V and 9 A, with a1:5 mixture of H2 and Ar at a total pressure of a few Torr.The emission spectra were photographed in the second orderof a 2 m Czerny–Turner grating spectrograph using KodakI-F plates and 50 m slits. The emission spectrum of an ironhollow cathode was used for wavelength calibration. Theabsolute error in the line positions is estimated to be 0.2cm1 and the uncertainty in the relative line positions is 0.1cm1 for strong unblended lines.20
III. ANALYSIS
A. Description of the observed bands
An overview of the Fourier transform FT emissionspectrum of the A 2 – X 2 v0 sequence of BeH ispresented in Fig. 1. The 0–0 to 6–6 bands could be identifiedin our new spectra. The detection of the 6–6 band is new andthe Q lines of the 4–4 and 5–5 bands were also seen for the
first time. For the 0–0 to 5– 5 bands, the number of assignedlines was extended to both higher and lower N values com-pared to the previous analyses.16,20 Some weak and irregularstructure was seen near 20 008 cm1 that is probably the 7–7Q head but no rotational assignments could be made.
All the observed bands have six branches, P1 , P2 , Q1 ,Q2 , R1 and R2 , with the doublet fine structure splitting ( F 1and F 2) resolved at low N values up to N 12 in the case of the cooler spectrum as appropriate for a Hund’s case b2 – 2 transition. As noted first by Watson in 1928, the P,Q, and R branches are very peculiar because a head forms athigh N in all three branches. BeH is, therefore, cited inHerzberg24 as an example of molecule that has ‘‘extra’’
5796 J. Chem. Phys., Vol. 109, No. 14, 8 October 1998 Focsa et al.

8/3/2019 C. Focsa et al- Fourier transform emission spectroscopy of the A^2-Pi-X^2-Sigma^+ system of BeH
http://slidepdf.com/reader/full/c-focsa-et-al-fourier-transform-emission-spectroscopy-of-the-a2-pi-x2-sigma 3/8
heads. In our hollow cathode spectra, R heads were observedfor the 0–0 and 1–1 bands, and ‘‘extra’’ Q heads found forthe 0–0, 1–1, 2–2 and 3–3 bands the 4–4, 5–5, and 6–6 Q
branches exhibit particularly odd features that will be dis-cussed below. The A 2 – X 2 v0 sequence also pre-sents a ‘‘vibrational head’’ or ‘‘head-of-heads’’ for the Q
branches. The origins of the vibrational bands go initially tohigher wave numbers with T 0020 030.963 cm1, T 1120 051.310 cm1, T 2220 063.172 cm1, and T 3320 066.248 cm1 and then they turn back to lower wavenumbers with T 4420 060.687 cm1, T 5520 047.327cm1, and T 6620 028.759 cm1. The origins of the 2–2,3–3, and 4–4 bands are separated only by a few wave num-
bers so that extensive overlapping of lines occurs. In particu-lar, the 4–4 Q branch is overlapped almost completely by thestronger 2–2 and 3–3 Q branches, and we were able to ob-serve only some ten 4–4 Q lines at low N values.
The 5–5 and 6–6 Q branches also present some interest-ing aspects caused by the slightly different vibrational de-pendence of the B
vvalues in the A and X states. The B– B
difference is initially positive for the 0–0 band, decreases tozero for the 5–5 band, and becomes slightly negative for the6–6 band. This fact results in a sharp Q head at 20 047.5cm1 for the 5– 5 band, with the first ten Q lines unresolved.The observation of Q lines and of the first P and R lines inthe 4–4 and 5–5 bands allowed us to determine reliable band
origins of 20 060.687 cm
1 4– 4 and 20 047.327 cm
15– 5 instead of the previous estimates of 20 062.56 cm1
4– 4 and 20 052.05 cm1 5– 5 based only on P and R
lines.20
The 6–6 Q branch displayed in Fig. 2 presents a veryinteresting appearance. The B difference is so small thanthe two spin components behave differently, with the Q1lines starting at Q1( N 1)20 029.258 cm1 and going todecreasing wave numbers with increasing N . In contrast, theQ2 lines start at Q2( N 1)20 027.657 cm1, go to higherwave numbers to form a head at 20 028.22 cm1 ( N 3),and then turn back to lower wave numbers. The two Q
branches unresolved at high N values then form an ‘‘extra’’
head at 20 019.3 cm1 ( N 24) and return to higher wavenumbers as N increases further.
The A 2 state is strongly perturbed by the C 2 asnoted by Colin et al. in their analysis of the C 2– X 2
system.20 Indeed these perturbations were used to connectthe C 2 state and the high vibrational levels of the groundstate with the v0 level of the X 2 state. Colin et al.
found that the v0, 1, and 2 vibrational levels of the C 2
state were interacting with the v4, 5, 6, and 7 vibrationallevels of the A 2 state. In our A 2 – X 2 spectrum, wehave observed strongly perturbed P and R lines in the 2– 2 to6–6 bands, while for the 0–0 and 1–1 bands only a fewperturbed P and R lines were assigned in the region of the
heads. No local perturbations were found in any of the Qbranches. For example, one can see that the 6–6 Q branchdisplayed in Fig. 2 exhibits no local perturbations up to N 24, although the P and R lines are already strongly per-turbed at N 11. This fact may be explained by the differentinteraction of the four (F 1e / f and F 2e / f energy levels of agiven N of the A 2 state with the two ( F 1e and F 2 f levelsof the C 2 state.
The selection rules for perturbations are J 0, e – e,and f – f so that only the e level of the F 1 spin componentand the f level of the F 2 component of the A 2 state areperturbed for a N 0 interaction with the C 2 state. Inthis case the Q2e – f and Q1 f – e branches will not be per-
turbed. In principle, N 1 interactions are possible andthey would lead to perturbed Q branches. Experimentally nosuch perturbed Q branches were detected because the A 2
state belongs to Hund’s case b. N is therefore a good quan-tum number for both rotations and perturbations so that the N 1 interactions become very weak.
In order to derive the vibrational intervals, the analysisof a previously recorded20 arc emission spectrum of the A 2 – X 2 v1 sequence was carried out. The 0–1to 6–7 bands were identified in the 17 800–19 000 cm1
spectral region. Because of the positive B– B difference,which is greater than in the v0 sequence, the v1bands form ‘‘classical’’ P heads. These heads are clearly
FIG. 1. An overview of the A 2 – X 2 emission spectrum of BeH re-corded with a Fourier transform spectrometer.
FIG. 2. The 6–6 Q branch of the A 2 – X 2 transition of BeH showingunusual rotational structure. The two lines marked with asterisks are fromother bands.
5797J. Chem. Phys., Vol. 109, No. 14, 8 October 1998 Focsa et al.
8/3/2019 C. Focsa et al- Fourier transform emission spectroscopy of the A^2-Pi-X^2-Sigma^+ system of BeH
http://slidepdf.com/reader/full/c-focsa-et-al-fourier-transform-emission-spectroscopy-of-the-a2-pi-x2-sigma 4/8
visible in the case of the 0–1 to 3–4 bands but for the 4–5,5–6, and 6–7 bands they become less prominent as the in-tensity decreases. The weakness of these lines, along withoverlap by stronger Q and R lines of the lower v bands,
made the assignment of the 4–5, 5–6, and 6–7 bands verydifficult. In addition, the v4, 5, and 6 vibrational levels of the A 2 state begin to be perturbed at low N values 24, 16,and 11 for v4, 5, and 6, respectively and the correspond-ing P and R lines are displaced. Fortunately, the Q lines arenot perturbed and we were able to follow the Q branches tohigher N values than the P and R branches. The presence of these well-behaved Q branches in the v1 sequenceadded some new information to our data set because the highv bands of the v0 Fourier transform spectroscopyFTSmeasurements had only partly resolved Q branches.
B. Theoretical model and least-squares treatment
We used the usual effective N ˆ 2 Hamiltonian for 2 and2 states25 to reduce the experimental data to molecular con-stants. Explicit matrix elements for 2 and 2 states areprovided in Refs. 26 and 27. Because of the extensiveamount of high quality data, we needed to use higher-orderconstants such as M in the X 2 v0 level or -doublingparameters up to q L in some of the vibrational levels of the A 2 state. The matrix elements corresponding to these pa-rameters were calculated by matrix multiplication e.g., q H
(DqqD)/2.The experimental lines and the ground state combination
differences see below were fitted using a nonlinear, least-
squares procedure with each datum weighted with the squareof the reciprocal of the estimated uncertainty. The unblendedFTS lines were assigned a weighting factor of 0.01 cm1,while the v1 data were weighted at 0.05 cm1 for thestrongest lines and 0.1 cm1 for the weaker ones. However,the measurements of the blended lines were very imprecisein the arc emission spectrum and they were heavily dew-eighted in the fits.
The main goal of this initial work is a complete charac-terization of the X 2 ground state, so the perturbed linesin the v0 sequence were heavily deweighted but the cor-responding ground state combination differences were in-cluded in the fits. The inclusion of these combination differ-
ences greatly improved our determination of the ground stateconstants and helped to uncouple the two electronic states.They also served as a check for our rotational assignments.We intend to carry out a thorough deperturbation of the
A2
and the C 2
states at a later date.The main fitting strategy was to work with the v0FTS bands first and then use these rotational constants in thev1 fits, allowing only the band origins to vary. Thisstrategy was applied for the 0–0 to 4–4 and the 0–1 to 3–4bands. However, the 4–4, 5–5, and 6–6 bands have peculiarQ branches that were compact and difficult to assign. Itturned out that although the Q lines in the v1 bandswere of lower precision they could be followed to higher N
for the 4–5, 5–6, and 6–7 bands than in the 4–4, 5–5 and6–6 bands. Consequently, we decided to fit all of these bandstogether and to determine the parameters of the A 2 (v
4, 5, and 6 and X 2 (v5, 6, and 7 levels simulta-
neously the constants for the X 2 (v4) level werekept fixed at the values determined from the 4–4 fit. Thesefits gave more reliable values for the -doubling parametersin the A 2 upper state.
The assignment of the 6–7 band linked together thelower vibrational levels (v0 – 6) of the ground state withdata on the higher vibrational levels, v7–10, derivedfrom the C 2– X 2 study.20 Because the C 2 v
0, 1, and 2 levels are massively perturbed, only the groundstate combination differences were introduced into our fit. Inaddition to the usual rotational differences, all the possibledifferences between P lines and R lines with the same N ,
N , and v
but different v
were added to the fit in order toobtain the X 2 vibrational intervals. In this way, the vi-
brational energy levels for v4–10 of the ground statewere fitted together. The output of this fit, as well as theoutputs of the band-by-band fits, has been placed in PhysicsAuxiliary Publication Service PAPS.28 The molecular con-stants obtained are presented in Tables I and II for the X 2 and A 2 states, respectively.
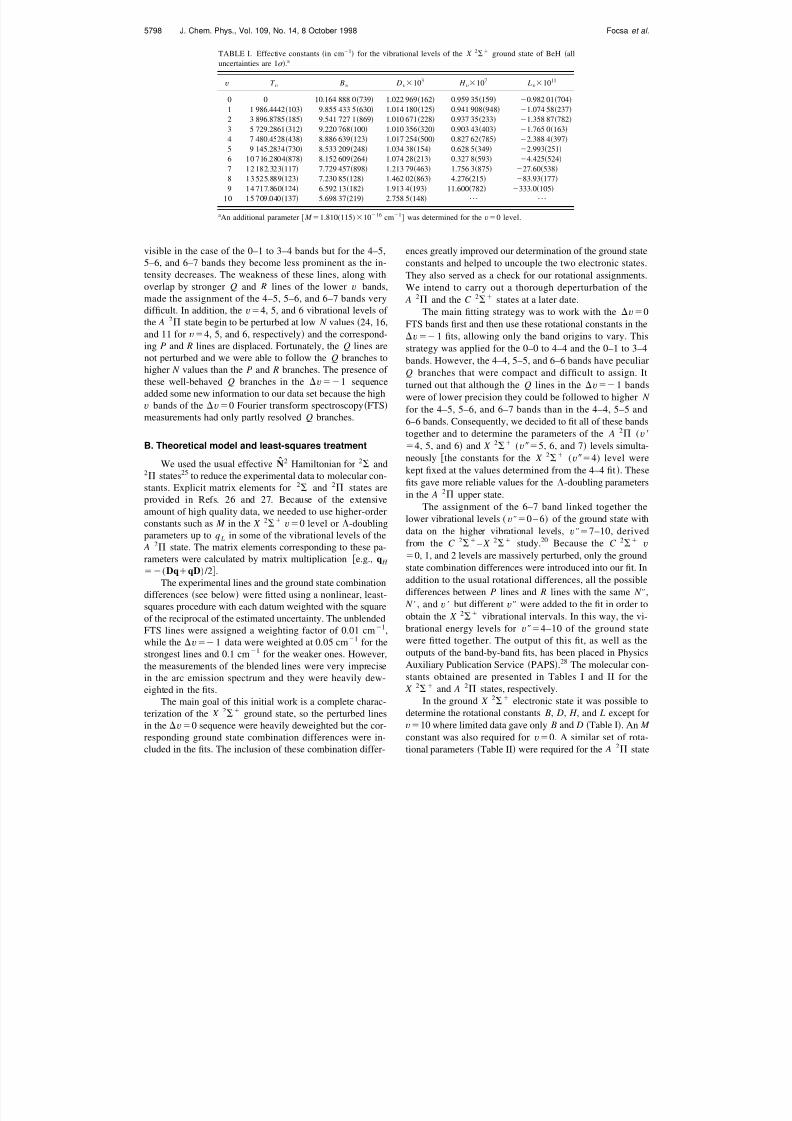
In the ground X 2 electronic state it was possible todetermine the rotational constants B, D, H , and L except forv10 where limited data gave only B and D Table I. An M
constant was also required for v0. A similar set of rota-tional parameters Table II were required for the A 2 state
TABLE I. Effective constants in cm1 for the vibrational levels of the X 2 ground state of BeH alluncertainties are 1 .a
v T v
Bv
Dv103 H
v107 L
v1011
0 0 10.164 888 0739 1.022 969162 0.959 35159 0.982 01704
1 1 986.4442103 9.855 433 5630 1.014 180125 0.941 908948 1.074 58237
2 3 896.8785185 9.541 727 1869 1.010 671228 0.937 35233 1.358 87782
3 5 729.2861312 9.220 768100 1.010 356320 0.903 43403 1.765 0163
4 7 480.4528438 8.886 639123 1.017 254500 0.827 62785 2.388 4397
5 9 145.2834730 8.533 209248 1.034 38154 0.628 5349
2.9932516 10 716.2804878 8.152 609264 1.074 28213 0.327 8593 4.425524
7 12 182.323117 7.729 457898 1.213 79463 1.756 3875 27.60538
8 13 525.889123 7.230 85128 1.462 02863 4.276215 83.93177
9 14 717.860124 6.592 13182 1.913 4193 11.600782 333.0105
10 15 709.040137 5.698 37219 2.758 5148 ¯ ¯
aAn additional parameter M 1.810(115)1016 cm1 was determined for the v0 level.
5798 J. Chem. Phys., Vol. 109, No. 14, 8 October 1998 Focsa et al.

8/3/2019 C. Focsa et al- Fourier transform emission spectroscopy of the A^2-Pi-X^2-Sigma^+ system of BeH
http://slidepdf.com/reader/full/c-focsa-et-al-fourier-transform-emission-spectroscopy-of-the-a2-pi-x2-sigma 5/8
TABLE II. Molecular constants in cm1 for the vibrational levels of the A 2 state of BeH all uncertainties are 1 .a
Constant v0 v1 v2 v3 v4
T v0 20 030.962 73233 22 037.754 9124 23 960.042 1209 25 795.566 9339 27 541.093 7493
Bv
10.302 101 4697
9.970 041 6
643
9.631 231 9
885
9.281 843
111
8.918 924
166
Dv103 1.042 986123 1.039 877141 1.041 220252 1.045 716468 1.050 190985
H v107 0.924 517852 0.917 84123 0.913 97291 0.914 17853 0.810 2286
Lv1011
0.949 73197 1.130 82376 1.419 4115 2.113 5538 3.296270
Av
2.154 3142 2.132 5126 2.185 7164 2.223 9157 2.171 5184
v103
7.778295 5.955194 8.146252 8.760333 8.094618
Dv106 7.790504 3.588193 6.504314 8.451669 6.45175
qv102 1.402 65284 1.348 99381 1.266 34496 1.191 28268 1.143 5213
q Dv106
6.217 8800 6.656137 6.758233 7.091 6540 12.774465
q H v109 1.408 7697 1.814158 2.118346 ¯ ¯
q Lv10133.002190 5.810578 1.247163 ¯ ¯
aAn additional parameter H 2.220(198)109 cm1 was determined for the v0 level.
TABLE III. Dunham constants in cm1 for the X 2 ground state of BeH all uncertainties are 1 .
m0 m1 m2 m3
Y 0,m 10.331 214 75042 1.044 176 06760103 1.024 36133021079.53
Y 1,m 2068.863 45174 0.351 0681721 6.654 321541052.174 248582108 1.04
Y 2,m 46.145 56352 4.833 418561025.964 62101105 2.023 187169108
9.28Y 3,m 4.980 93694 2.527 35(9045)102 2.657 778897105
7.807 22579109
Y 4,m 1.612 01167 6.668 9(2266)1036.006 11813106 1.385 474124109
Y 5,m 0.289 172120 9.657 1(3021)104 6.434 117331079.749 923381011
Y 6,m 3.097 8(2210)102
7.065 8(2031)105
2.608 596180108
Y 7,m 1.783 9(1228)1032.102 43(5411)106
Y 8,m 4.445 3(2817)105

8/3/2019 C. Focsa et al- Fourier transform emission spectroscopy of the A^2-Pi-X^2-Sigma^+ system of BeH
http://slidepdf.com/reader/full/c-focsa-et-al-fourier-transform-emission-spectroscopy-of-the-a2-pi-x2-sigma 6/8
along with the -doubling series q, q D , q H , and q L as wellas the spin–orbit coupling constant A and the spin–rotationconstants and D .
The A 2 and X 2 electronic states of BeH both be-long to the Hund’s case b coupling case, and this led tostrong correlation between the spin–rotation parameters
and . No satellite branches were detected so could notbe directly determined. We have therefore chosen to fix theground state constant to zero and to vary the correspondingconstant in the upper state. The -doubling constant p alsocould not be determined because of the nearly pure case b
coupling in the A 2 state.A second stage in our analysis was to fit all the available
data together, including the vibrational levels v0 to 10 forthe X 2 state and v0–6 for the A 2 state in a globalfit to determine Dunham constants29 in the ground state. Inthis case, the ground state rovibrational energies were repre-sented by the conventional double Dunham expansion,29
E X v, N l,m
Y l ,m v1
2 l
N N 1 m, 1
and the upper A 2 levels were represented by the same 2
matrix discussed above. The values of the Y l ,m
parametersobtained are listed in Table III. However, it should be notedthat the normalized standard deviation of 1.8 of this fit wassomewhat higher than the values of about 1 obtained in theseparate fits described above. The equilibrium vibrationaland rotational constants were also derived for the A 2 stateusing the constants listed in Table II and the equilibriumparameters are presented in Table IV.
IV. DISCUSSION
The new Fourier transform spectra of the A 2 – X 2
system greatly improved the spectroscopic constants and also
cleared up some spectroscopic mysteries. One puzzling fea-ture in the spectra was the appearance of two groups of un-assigned lines to lower wave numbers of the strong 0–0 Q
branch. They are the tiny features on the left-hand side of the0– 0 Q branch in Fig. 1 see also Fig. 2. These lines looklike peculiar Q branches and they were noted even in earlyarc spectra of Watson and Parker.12 In fact the presence of many additional P and R lines in the A 2 – X 2 transi-tion led Watson and Parker to the erroneous conclusion thatthey had found the 8BeH isotopomer. They understood thatthe A – X system had a head-of-heads at the 4–4 band andthey assigned the two extra Q branches to the 8–8 and 9–9bands. The head-of-heads in fact forms at the 3–3 band and
these extra two Q heads turn out to belong to the 6–6 and7–7 bands, but Watson and Parker were clearly on the right
track.The various parameters Table II in the excited A 2
state empirically account for the observed spectroscopic fea-tures. The long series of -doubling parameters q’s arenecessary because the Q branches connect to excited staterotational levels of opposite parity compared to the P and R
branches. This leads to a combination defect between the Q
branches and the P and R branches that would normally besmall. In this case the C 2 state is nearby and the stronglocal interactions require as many q parameters as there areterms in the B series of parameters. The q series of param-eters thus lets the e and f parity levels have slightly differenteffective rotational constants.
The spin splitting is resolved only at low N values anddisappears as the spin uncoupling becomes complete. Thissplitting is represented in the A 2 state by the spin–orbitcoupling constant A and the two spin–rotation constants
and D . Since A D and are completely correlated30 for a 2state, we have chosen to determine because the A 2 stateis close to Hund’s case b. The effect of the constants and
FIG. 3. A plot of Gv1/2 as a function of v for the A 2 and X 2 states
of BeH.
FIG. 4. A plot of Bv
as a function of v for the A 2 and X 2 states of BeH.
TABLE IV. Main equilibrium constants in cm1 of the A 2 state of BeHa,b all uncertainties are 1 .
T e20 019.7647(146) e2089.953 0(421) Be10.466 305(273) e x e41.363 9(303) e0.327 746(405) e y e 0.074 83(766) 1e0.001 237(157) e z e0.037 98(617) 2e0.000 519 3(166)
aGv e(v
12) e xe(v
12)2 e y e(v
12)3 e ze(v
12)4.
b Bv Be e(v 12) 1e(v 12)2 2e(v 12)3.
5800 J. Chem. Phys., Vol. 109, No. 14, 8 October 1998 Focsa et al.

8/3/2019 C. Focsa et al- Fourier transform emission spectroscopy of the A^2-Pi-X^2-Sigma^+ system of BeH
http://slidepdf.com/reader/full/c-focsa-et-al-fourier-transform-emission-spectroscopy-of-the-a2-pi-x2-sigma 7/8
D is to allow the F 1 and F 2 spin components to haveslightly different effective B values while the A constant, asusual, is the rotationless spin–orbit splitting.
Since we have arbitrarily set the spin– rotation constant to zero in the ground state, the exited state constant is,in fact, the difference – . In this respect the A 2 – X 2 transition is like a 2 – 2 transition. It is pos-sible to estimate a value of 2(2)103 cm1 for theground state using Curl’s relationship,31,32
2 Bg , andthe small anisotropy of the g tensor of matrix-isolated BeH.33
A crude estimate based on a pure precession relationship34
between the ground state and the A 2 state gives a similarvalue of 4103 cm1. Note that pure precession alsoimplies that the experimentally undetermined -doubling pa-rameter p ( ) has the same value of 4103 cm1 in the A 2 state.
The A 2 and X 2 states have remarkably similarvibrational and rotational constants as is illustrated graphi-cally in Figs. 3 and 4. In Fig. 3, G1/2 G1/2 and the diag-onal bands go to higher wave numbers as v increases but ahead-of-head forms when the difference in G
v1/2 valuesbecomes negative after the 3–3 band. In the B
vplot Fig. 4,
the excited state Bv
values are initially greater than in theground state for the diagonal bands and the Q branches go tohigher wave numbers as N increases Fig. 1. At the 5–5band, however, the ground and excited state B
vvalues be-
come identical Fig. 4 and a linelike Q branch results, al-though because of centrifugal distortion some lines are re-
solved at higher N values in the hotter spectrum. Thepeculiar 6–6 Q branch Fig. 2 has already been discussed.
The Dunham constants of Table III are a poor represen-tation of the energy levels of BeH. This is a well-known factfor hydrides8 and is a particular problem for H2. The tradi-tional constants form a badly convergent series with strongcorrelation between the parameters. It is, therefore, necessaryto carry many extra significant figures in Table III and manyof the terms even e) in the expansion have lost much of their physical meaning. Nevertheless, the Y ’s of Table III do
reproduce the experimental data in an empirical manner. Infuture work, we plan to explore the fitting of the BeH andBeD data using alternate energy level expressions35 as wellas the direct fitting to a potential energy curve that includesBorn–Opppenheimer breakdown terms.36
The Bv(Y i1) and G
v(Y i0) functions Table III were
used to calculate the Rydberg–Klein–Rees RKR potentialenergy curve plotted for the ground state shown in Fig. 5. Ascan be seen in Fig. 5, v10 is the last bound vibrationallevel although it is difficult to rule out37 a v11 level boundby a few cm1. Interestingly, the outer turning points of v9 and 10 are not in the long-range region so a LeRoy–Bernstein analysis38 of the G
vdata Fig. 3 is not appropri-
ate.The A 2 excited state rotational constants and band
origins Table II were fitted with the traditional expressionsTable IV to obtain equilibrium constants. The equilibriumbond length for the A 2 state was calculated to be1.332 992 Å compared to 1.341 683 Å for the groundstate, calculated from Y 01 Table III. The equilibrium con-stants of Table IV were used to calculate the A 2 stateRKR potential curve also displayed in Fig. 5. The RKR turn-ing points are available from the authors upon request.
The RKR potential energy curves were used to calculatethe Franck–Condon factors Table V. A glance at Table Vexplains why we were not able to see the v1 sequencein spite of the excellent signal-to-noise ratio Fig. 1 obtainedfor v0 bands. For the v1 bands, the largestFranck–Condon factor is 0.0042 for the 2–3 band so that wewere forced to use the older arc measurements to see thebands. Note that since we only used the v1 sequence,all of the systematic errors in the calibration of the photo-graphic plates propagate upwards so that the v10 levelcould be in error by as much as 2 cm1.
V. CONCLUSION
We have measured the 0–0 to 6–6 bands of the
A2
– X 2
transition of BeH with a Fourier transformspectrometer. These bands show many unusual features such
FIG. 5. The RKR potential energy curves for the A 2 and X 2 states of BeH.
TABLE V. Franck–Condon factors for the A 2 – X 2 transition of BeH.
v v 0 1 2 3 4 5 6 7 8 9 10
0 0.998 2.07 E 3 5.00 E 5 1.11 E 6 4.42 E 8 5.86 E 9 7.26 E 6 8.56 E 6 4.24 E 9 1.17 E 6 1.72 E 71 2.09 E 3 0.994 3.59 E 3 1.69 E 4 3.57 E 6 4.36 E 5 7.49 E 7 8.23 E 6 1.27 E 5 1.11 E 5 6.57 E 62 2.05 E 5 3.72 E 3 0.992 4.18 E 3 3.47 E 4 1.05 E 5 1.04 E 7 9.65 E 6 2.11 E 5 2.24 E 5 1.86 E 53 2.73 E 5 8.00 E 5 4.41 E 3 0.991 3.96 E 3 5.74 E 4 2.56 E 5 4.04 E 4 2.79 E 5 6.18 E 5 5.32 E 54 5.63 E 7 2.86 E 5 2.10 E 4 4.27 E 3 0.992 3.09 E 3 8.24 E 4 5.41 E 5 1.66 E 6 3.80 E 5 1.33 E 45 1.55 E 6 5.10 E 5 6.44 E 04 4.23 E 4 3.42 E 3 0.993 1.85 E 3 1.07 E 3 9.70 E 5 7.38 E 6 4.14 E 56 8.07 E 6 9.89 E 6 2.35 E 04 5.10 E 6 7.06 E 4 2.10 E 3 0.995 5.44 E 4 1.38 E 3 1.35 E 4 1.97 E 5
5801J. Chem. Phys., Vol. 109, No. 14, 8 October 1998 Focsa et al.

8/3/2019 C. Focsa et al- Fourier transform emission spectroscopy of the A^2-Pi-X^2-Sigma^+ system of BeH
http://slidepdf.com/reader/full/c-focsa-et-al-fourier-transform-emission-spectroscopy-of-the-a2-pi-x2-sigma 8/8
as a head-of-heads and peculiar Q branches as the result of the near identity of the spectroscopic constants in the twostates. By assigning the 0–1 to 6–7 bands in the v1sequence in an archival arc emission spectrum, we were ableto link together all of the new FTS data as well as connectwith the C 2– X 2 bands which cover v7 – 10. BeHthus joins the small set of chemically bound molecules forwhich all of the ground state vibrational levels have been
derived from high-resolution data.
ACKNOWLEDGMENTS
This work was supported by the Fonds National de laRecherche Scientifique Belgium and the Natural Sciencesand Engineering Research Council of Canada. C.F. thanksthe Universite des Sciences et Technologies de Lille Francefor a BQR grant. We thank R. LeRoy, M. Carleer, and R.Mitzner for their help and for discussions.
1 W. Meyer and P. Rosmus, J. Chem. Phys. 63, 2356 1975.2 D. L. Cooper, J. Chem. Phys. 80, 1961 1984.3 M. Larsson, Phys. Scr. 32, 97 1985.4
C. Henriet and G. Verhaegen, Phys. Scr. 33, 299 1986.5 I. D. Petsalakis, G. Theodorakopoulos, and C. A. Nicolaides, J. Chem.Phys. 97, 7623 1992.
6 I. D. Petsalakis, R. J. Buenker, G. Hirsch, and G. Theodorakopoulos, J.Phys. B 30, 4935 1997.
7 F. B. C. Machado, O. Roberto-Neto, and F. R. Ornellas, Chem. Phys. Lett.284, 293 1998.
8 J. M. L. Martin, Chem. Phys. Lett. 283, 283 1998.9 B. Fernandez and P. Jorgensen, Chem. Phys. Lett. 232, 463 1995.
10 W. W. Watson, Phys. Rev. 32, 600 1928.11 E. Olsson, Z. Phys. 73, 732 1932.12 W. W. Watson and A. E. Parker, Phys. Rev. 37, 167 1931.13 W. W. Watson and R. F. Humphreys, Phys. Rev. 52, 318 1937.14 P. G. Koontz, Phys. Rev. 48, 707 1935.15 G. Duxbury, M. F. Stamp, and H. P. Summers, Plasma Phys. Controlled
Fusion 40, 361 1998.
16 R. Horne and R. Colin, Bull. Soc. Chim. Belges 81, 93 1972.17 R. Colin, D. De Greef, P. Goethals, and G. Verhaegen, Chem. Phys. Lett.25, 70 1974.
18 D. De Greef and R. Colin, J. Mol. Spectrosc. 53, 455 1974.19 R. Colin and D. De Greef, Can. J. Phys. 53, 2142 1975.20 R. Colin, C. Dreze, and M. Steinhauer, Can. J. Phys. 61, 641 1983.21 C. Clerbaux and R. Colin, Mol. Phys. 72, 471 1991.22 T. J. Tague, Jr. and L. Andrews, J. Am. Chem. Soc. 115, 12111 1993.23 B. A. Palmer and R. Engleman, Jr., Atlas of the Thorium Spectrum Los
Alamos National Laboratory, Los Alamos, NM, 1983.24 G. Herzberg, Spectra of Diatomic Molecules, 2nd ed. Van Nostrand, New
York, 1950, pp. 174–175.25 J. M. Brown, E. A. Colbourne, J. K. G. Watson, and F. D. Wayne, J. Mol.
Spectrosc. 74, 425 1979.26 M. Douay, S. A. Rogers, and P. F. Bernath, Mol. Phys. 64, 425 1988.27 C. Amiot, J.-P. Maillard, and J. Chauville, J. Mol. Spectrosc. 87, 196
1981.28 See AIP Document # PAPS: JCPSA 6-109-002838 for 52 pages of tables.
Order by PAPS number and journal reference from American Institute of Physics, Physics, Physics Auxillary Publication Service, Carolyn Gehl-bach, 500 Sunnyside Boulevard, Woodbury, NY 11797-2999. Fax: 516-576-2223, e-mail: [email protected]. The price is $1.50 for each microfiche98 pages or $5.00 for photocopies of up to 30 pages, and $0.15 for eachadditional page over 30 pages. Airmail additional. Make checks payable to
the American Institute of Physics.29 J. L. Dunham, Phys. Rev. 41, 721 1932.30 J. M. Brown and J. K. G. Watson, J. Mol. Spectrosc. 65, 65 1977.31 R. F. Curl, Jr., J. Chem. Phys. 37, 779 1962.32 W. Weltner, Jr., Magnetic Atoms and Molecules Dover, New York,
1990.33 L. B. Knight, Jr., J. M. Brom, Jr., and W. Weltner, Jr., J. Chem. Phys. 56,
1152 1972.34 J. H. Van Vleck, Phys. Rev. 33, 467 1929.35 D. T. Appadoo et al., J. Chem. Phys. 104, 903 1996.36 M. Dulick, K.-Q. Zhang, B. Guo, and P. F. Bernath, J. Mol. Spectrosc.188, 14 1998.
37 Preliminary calculations by R. J. LeRoy indicate that v11 is bound byabout 50 cm1.
38 R. J. LeRoy and R. B. Bernstein, Chem. Phys. Lett. 5, 42 1970.
5802 J. Chem. Phys., Vol. 109, No. 14, 8 October 1998 Focsa et al.