Embed Size (px)
Citation preview
1
CULTURE,INSTITUTIONSANDDEMOCRATIZATION*
YuriyGorodnichenko GerardRolandUniversityofCalifornia,Berkeley
andNBERUniversityofCalifornia,Berkeley,
CEPRandNBER
Firstdraft:November2012Thisdraft:April2016
Abstract: We construct a model of revolution and transition to democracy under individualistic and collectivist cultures. The main result is that, despite facing potentially larger collective action problems, countries with an individualistic culture are more likely to end up adopting democracy earlier than countries with a collectivist culture. Our empirical analysis suggests a strong and robust association between individualistic culture and average polity scores and length of democracy, even after controlling for other determinants of democracy emphasized in the literature. We provide evidence that countries with collectivist culture are also more likely to experience autocratic breakdowns and transitions from autocracy to autocracy.
Keywords: culture, individualism, collectivism, democratization, collective action. JEL codes:H1,P48,Z1. * We thank Ganesh Viswanath Natraj and Anne Meng for excellent research assistance. We also thank Philippe Aghion, Melissa Dell, Torsten Persson, Hans-Joachim Voth and Marta Reynal-Querol for useful comments. We thank seminar participants in Berkeley, NYU, Oslo, Pompeu Fabra, Stockholm and Toulouse as well as participants of the Harvard PIEP workshop, participants of the conference “The Role of Cultural and Political Factors in Institutional Change and Development” in Warwick in 2013 and of the NBER spring 2014 political economy workshop.
2
1. Introduction
Understanding the determinants of democratization has always been one of the key questions in
social sciences. Recent decades have seen great progress in democracy across the world.
According to Freedom House (1999), there was not a single liberal democracy with universal
suffrage in the world in 1900. By 2000, 120 of the world's 192 nations were liberal democracies.
Various theories, based on formal models and informal arguments, have been proposed to
explain the underlying causes of democratization. The dominant theory of democratization in
social sciences, modernization theory, holds that, as the level of economic development in a
country increases, it will tend to become democratic (Lipset, 1959), or stay democratic
(Przeworski and Limongi, 1997). Yet, it is far from clear whether worldwide convergence
towards democracy will continue. Autocratic tendencies have appeared in democratic countries
such as Russia or Turkey. A key question is whether China, the biggest country in the world with
miraculous growth over the last four decades, will evolve towards democracy. So far, little
evidence points in that direction. There are thus reasons to be skeptical that countries should all
become democratic as they develop economically. Could modernization theories have
overlooked slow-moving forces such as culture that may facilitate or hamper transition to
democracy? Strikingly, although culture is often considered a bedrock of many social and
economic processes, the role of culture in democratization has been largely ignored until now.
In this paper, we present a simple formal model of democratization that includes the
individualistic/collectivist dimension of culture. A key difference between these cultural types is
that a collectivist culture creates a stronger pressure towards conformity and a stronger aversion
for radical institutional innovation. We show that, starting from an initial situation of autocracy,
a collectivist society is less likely to adopt a democratic regime than an individualistic society,
irrespective of whether a collectivist culture may be more effective in overcoming collective
action problems. In our model, collectivist societies often end up in equilibrium having a
“good” autocracy, i.e. an autocracy that does not act in a predatory way toward its citizens
because good autocracies tend not to be overthrown by collectivist societies, unlike in
individualistic societies. This outcome happens because of the stronger aversion for radical
institutional innovation in collectivist societies. Furthermore, if political institutions may
influence culture over time, our central prediction continues to hold: collectivist societies are
less likely to end up with democracy. Note that these results do not follow automatically from a

3
congruence between individualistic values and democracy. Countries with individualistic cultures
must still overcome the collective action problems to make a transition from autocracy to
democracy, which is a non-trivial barrier. Indeed, we do observe countries with relatively high
individualism scores and low democracy scores (e.g. Morocco). Yet, a striking result of our model
is that even if one assumes that the collective action problem is much more acute in individualistic
societies, they are still more likely to end up with democracy over time compared to collectivist
societies.
We test the predictions of the model empirically, using the well-known Hofstede measure
of individualism/collectivism. We find a strong and robust effect of individualism on average
polity scores between 1980 and 2010. A one standard deviation increase in the individualism
score is associated with as much as four point increase in polity scores, a large magnitude. This
result holds even when we control for all the variables that have been used in the literature on
democratization, including measures of economic development. We also document evidence that
countries with collectivist cultures have a higher frequency of autocracy breakdown, suggesting
lower collective action failure in collectivist cultures. We do find strong evidence that in
collectivist cultures, conditional on autocratic breakdown, transition to autocracy is more likely
while in individualistic cultures, transition to democracy is more likely. While the main result is
tested using the well-known polity data, these last results are tested using the new data on
autocracies and autocratic transitions put together by Geddes et al. (2014). Interestingly, other
cultural variables, such as trust or other cultural dimensions constructed by Hofstede (2001)—
power distance, uncertainty avoidance, masculinity, long term orientation—do not have a
significant or a robust effect on average polity scores whereas the effect of individualism is very
robust.
Because there may be a two-way causality between democracy and culture, we use
instrumental variables to analyze the effect of culture on democratization. The first instrumental
variable is a measure of historical pathogen prevalence. This variable has been argued (see e.g.
Fincher et al. 2008, Murray and Schaller, 2010) to have a direct effect on the choice of
collectivist culture as stronger pathogen prevalence created better survival prospects for
communities that adopted more collectivist values, putting stronger limits on individual
behavior, showing less openness towards foreigners and putting strong emphasis on tradition
and stability of social norms. The second instrumental variable is a measure of genetic distance
4
between countries based on differences in frequencies of blood types across countries. This
instrument is used as a proxy for vertical cultural transmission from parents to children. Since
the genetic pool evolves relatively slowly and it is unlikely that neutral genetic markers (e.g.,
blood types) changed since the industrial revolution, one can use genetic distance in terms of
such markers to instrument cultural differences.1 Because of the pitfalls related to cross-country
regressions, we must be careful in interpreting these instrumental variable regression results as
causal. Nevertheless, our findings are consistent with culture playing an important role in
transitions from autocracy to democracy as well as in transitions from autocracy to autocracy.
Our paper contributes to an immense body of work on the determinants of democratization.
Since Lipset’s (1959) seminal work, a large literature, both theoretical and empirical, has been
devoted to understanding the determinants of democratization. Lipset emphasized the role of
economic development and, thus not surprisingly, most disputes on democratization have been
about whether economic development is a fundamental determinant of democracy. Lipset was
taking a broad view of economic and social modernization creating conditions for a greater
demand for democracy. In recent years, debates about the importance of economic development
have been revived after the work of Przeworski and Limongi (1997). Using data between 1950
and 1990 for 135 countries, they showed that the correlation between income and democracy was
explained not so much by economic development leading to democratization, but rather by the
fact that once countries have achieved a certain level of economic development, they usually
never revert to authoritarian regimes. Countries could opt for democratic or dictatorial regimes for
reasons that are unrelated to economic development but if richer countries develop stable
democracies, one will see a strong correlation between income per capita and democracy.2
Acemoglu and Robinson (2006) argued that democratization was mostly an elite strategy to
1 More recently, some scholars have claimed that there is a direct link between genes and political behavior such as political participation and ideology (Fowler et al. , 2008, Hatemi and Mc Dermott, 2012). These studies focus however on individual political behavior and individual political psychology, not on how average genetic endowments affect a collectivity or a country’s culture. This difference is very important. The individual approach postulates a direct approach between an individual’s genetic endowment and that individual’s psychology or political behavior. In contrast, we use the correlation between cultural traits and genetic distance to address potential endogeneity of culture. 2 Persson and Tabellini (2009) built a model and showed empirical support for a theory of a positive feedback between the capital of democratic experience and economic development. Persson (2005) showed that the form of democracy mattered for income development: the introduction of parliamentary democracy with proportional electoral rule produced the most growth-promoting policies.
5
commit to redistributive transfers in response to revolutionary threats.3 Some of the recent studies
question causation from development to democracy or even the correlation between the two.
Acemoglu et al. (2005, 2008) showed that the relationship between income (or education) and
democracy, is mostly a feature of cross-sectional data and that when performing panel data
analysis, one ceases to find a significant relationship between these variables.4 Acemoglu et al.
(2014) in recent work even found that democracy has an effect on growth, a reverse effect
compared to modernization theory. On the other hand, Boix and Stokes (2003) found that by
taking data far enough in the past (to the second half of the nineteenth century), one can establish
a significant relation between income per capita and democracy. Treisman (2012) also found an
effect of economic development in the medium to long run, with democratic transitions happening
more often after the exit of a dictator.
To find a mention of cultural determinants of democracy, one has to go back to Almond and
Verba (1963) who emphasized the importance of civic culture as a prerequisite for democracy in a
comparative study of five countries (Italy, Germany, the US, the UK, and Mexico). More recently,
Inglehart and Weizel (2005), using the World Values Survey, argued that modernization leads to
changes in values towards more self-expression and stronger emphasis on individual liberty.
According to them, these changes in values are behind the stronger support for democracy. Their
study is the closest to ours as the values they emphasize are close to individualism as we define it
(more on this below). However, their focus is not the effect of culture on democracy. Instead, they
emphasize the cultural change brought about by modernization. Our approach is different: we take
culture as slow-moving (Roland, 2004)5 and thus potentially affecting faster-moving variables,
such as political institutions. While our research suggests that individualism affects both income
per capita and democracy, we do not rule out a separate effect of income on democracy.
Furthermore, we document that, in contrast to other measures of culture (e.g., religion, trust),
individualism is a robust predictor of democracy. To the best of our knowledge, our paper is the
3 Bruckner and Ciccone (2011) found that transitory negative income shocks related to negative rainfall shocks have a positive effect on democratization in Sub-Saharan Africa. 4 Grosjean and Senik (2011) found no link between income and support for democracy in the context of transition countries. 5 There is now a large empirical literature showing that culture has a very strong inertia, from research showing the long run effects of cultural differences between groups of early settlers in the US (see Fischer, 1989 or Grosjean, 2014) to research showing the persistence of culture of ancestors’country of origin among US immigrants (see e.g. Guiso et al., 2006, Tabellini, 2008, Algan and Cahuc, 2010).
6
first to systematically explore how culture (individualism) can influence democratization
processes.
The paper is organized as follows. In section 2, we present the model. In section 3, we
present the empirical analysis. In section 4, we give some brief comparative narratives on
regime change and democratization in countries with different cultures, using the examples of
Ghana, India and Pakistan. Section 5 concludes.
2. The model
The model embeds cultural differences in a model of democratization and revolution. Consider a
polity composed of two classes of infinitely lived citizens: rich and poor. The size of the population
is normalized to one. The rich are present in proportion . The average income of the rich is
/ whereas the average income of the poor, present in proportion 1 , is
1 / 1 where is average income and ( 1/2 is an indicator of income inequality.
The initial regime is autocracy. We will make the distinction between good and bad
autocrats. We assume that a bad autocrat acts in a predatory way and takes away all income from
the citizens. Therefore, after-tax income of the rich and poor is assumed to be equal to zero. We
assume that a good autocrat does not tax or redistribute. Everybody, rich and poor, prefers good
autocrats to bad autocrats. A good autocrat is randomly drawn with probability and bad
autocrat with probability 1 . We assume that a ruler stays in power forever unless there is a
successful revolt to overthrow the ruler.
In each period, citizens are able to overcome their collective action problem and to
successfully overthrow the ruler with probability ( for individualism or for
collectivism). We do not need for the results below to make any particular assumptions about the
ranking of between different cultures. A natural assumption might be : collectivist
culture can help overcome free rider problems if there is a social norm of just revolt against an
unjust autocratic ruler. Indeed, people with collectivist culture will conform to the social norm
and derive social status reward from doing so (failure to conform may lead to being ostracized).
On the other hand, one may also make an argument that . In collectivist societies,
allegiances are based on tribal or clan affiliation. If various tribes or clans deeply distrust each
other and are in conflict, they may have a more difficult time overcoming collective action

7
problems than people in those individualistic cultures that have dense civil society networks and
a culture of citizenship participation.
In periods when citizens are able to overcome their collective action problems, usually
called revolutionary situations, citizens in all cultures may choose to overthrow the regime or to
keep it. While it seems obvious that citizens will want to overthrow a bad autocrat, it is not a
priori obvious that they want to replace a good autocrat.
Since the poor are the majority, the decision to engage or not in collective action is theirs.
Even if the rich would not want to engage in collective action, we assume that the decision of the
poor is the one that matters.6 If they engage in collective action, they will either replace the old
autocrat with a new, possibly good, autocrat or introduce a radical institutional innovation and
replace autocracy with democracy. In case of successful collective action, it is assumed that an
autocrat will be replaced by another autocrat (possibly a good one, which happens with probability
) with probability , and that he will be replaced by democracy with probability 1 . We
assume that and this assumption will matter for our results. One justification for this
assumption is that collectivist cultures have a higher level of conformism and a lower propensity to
engage in institutional innovations. Another, probably deeper, justification is that collectivist
values put a heavier emphasis on the difference between a benevolent ruler and a bad ruler, on
political stability and the capacity of a good ruler to wisely arbitrate between different clans and
groups. In contrast, individualistic values put a heavier emphasis on individual freedom, on
equality of citizens before the law, and on limited government.7
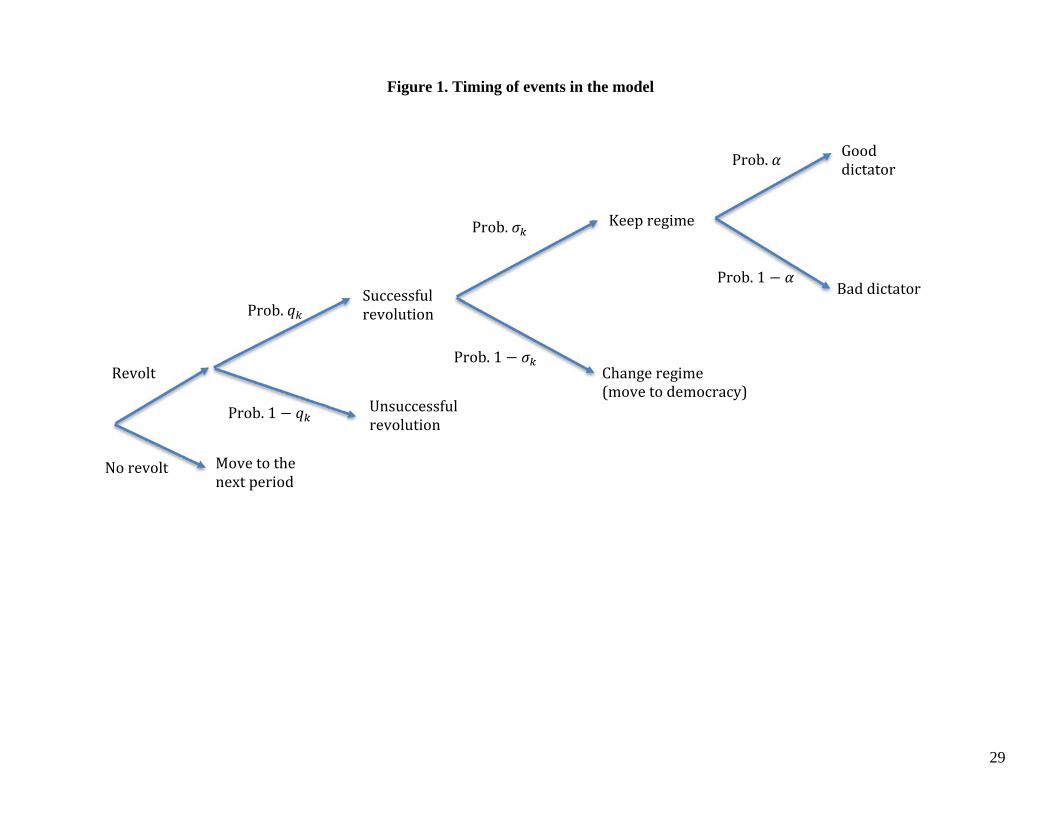
Note that in this model, there is uncertainty about what institutional regime will obtain
after the decision to revolt. The decision taken is only to engage in collective action, but the
outcome is uncertain. This aspect of the model seems quite realistic. For example, during the
Arab Spring of 2011, it was not clear whether democratic regimes or new autocratic regimes
with changed rulers were going to emerge. As of 2016, this uncertainty has still not yet been
fully resolved in various countries of the region. The above assumption on the values of
means that the uncertainty over the outcome of collective action is influenced by deep cultural
parameters. Figure 1 summarizes the timing of actions and outcomes. 6 This part of the model should not be interpreted too literally. In many regime changes, parts of the elite spearhead revolutions, coups and abrupt regime changes in the name of the people. Popular support for regime change is nevertheless critical for its success. 7 See Gorodnichenko and Roland (2012) for a fuller discussion of the cross-cultural differences between individualism and collectivism and their implications for economic and institutional behavior.

8
The main cultural differences in the model (differences in and ) are undoubtedly in
reduced form because existing theories of how collective action problems are overcome and
theories of the dynamics of collective action are far from satisfactory. Nevertheless, the current
model makes some progress in our knowledge of institutional change by introducing a cultural
component to theories of revolution and democratization.
To simplify algebra, we assume that once democracy is introduced, it remains forever. We
thus rule out by assumption coups by the rich to abolish democracy.8 Under democracy, the poor are
the majority and tax the rich. They are better off under democracy than under even a good autocratic
ruler whereas the rich prefer the latter since there is no redistribution under a good autocrat. The
value function for income class i ( for poor and for rich) under democracy is:
∗1
where argmax ∗ and is the distortionary cost from
redistributive taxation.
Under a predatory ruler, the poor will always prefer to revolt. However, under a good
autocrat, the decision to revolt may lead to democracy with a certain probability, which makes
the poor better off, but it may also lead to the arrival of a predatory ruler.
Under a predatory ruler, the value function for the poor (henceforth we skip the
superscripts as we concentrate only on the decisions and payoffs of the poor) is:
0 1 1 1
where B stands for the predatory, bad ruler and G for the good ruler. Note that depends on
whether the poor decide to revolt against a good autocrat. The value function for the poor under a
good autocrat if they decide not to revolt (N) is:
1
whereas if they decide to revolt (R), it is:
1 1 1
Note that the expression for is similar to that of . Indeed, we have that
11 1
8 Acemoglu and Robinson (2006) consider a model where the rich change the regime by a coup.
9
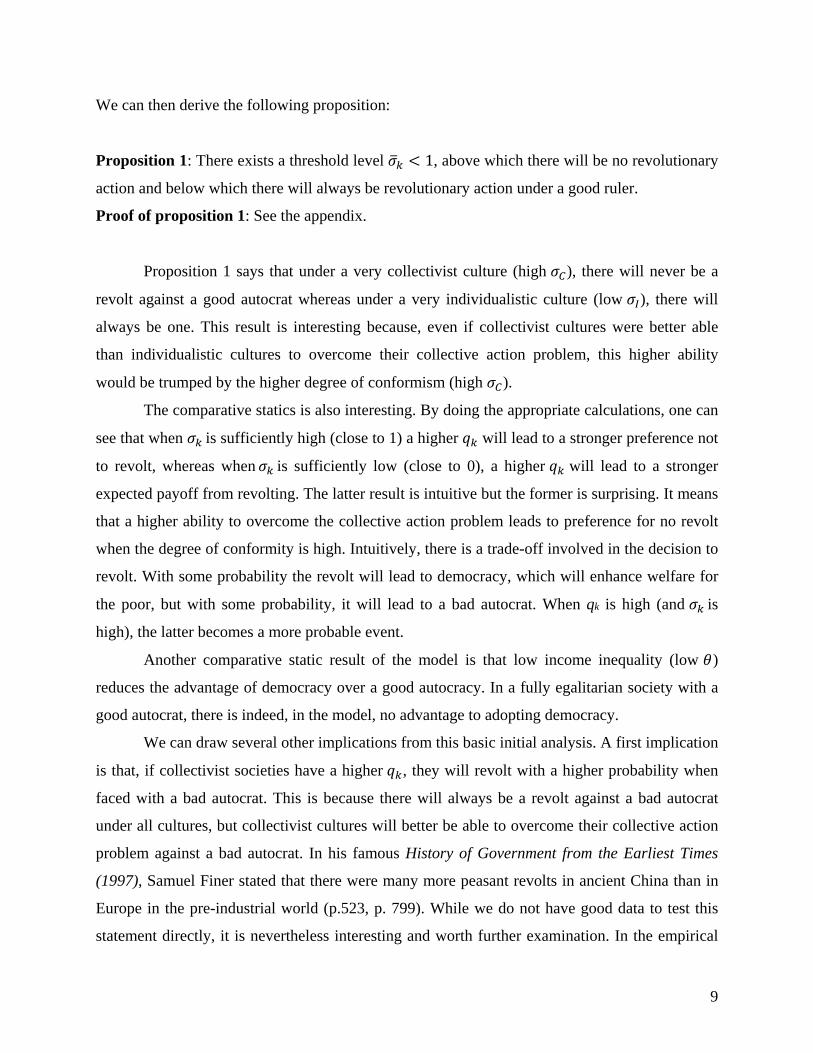
We can then derive the following proposition:
Proposition 1: There exists a threshold level 1, above which there will be no revolutionary
action and below which there will always be revolutionary action under a good ruler.
Proof of proposition 1: See the appendix.
Proposition 1 says that under a very collectivist culture (high ), there will never be a
revolt against a good autocrat whereas under a very individualistic culture (low ), there will
always be one. This result is interesting because, even if collectivist cultures were better able
than individualistic cultures to overcome their collective action problem, this higher ability
would be trumped by the higher degree of conformism (high ).
The comparative statics is also interesting. By doing the appropriate calculations, one can
see that when is sufficiently high (close to 1) a higher will lead to a stronger preference not
to revolt, whereas when is sufficiently low (close to 0), a higher will lead to a stronger
expected payoff from revolting. The latter result is intuitive but the former is surprising. It means
that a higher ability to overcome the collective action problem leads to preference for no revolt
when the degree of conformity is high. Intuitively, there is a trade-off involved in the decision to
revolt. With some probability the revolt will lead to democracy, which will enhance welfare for
the poor, but with some probability, it will lead to a bad autocrat. When qk is high (and is
high), the latter becomes a more probable event.
Another comparative static result of the model is that low income inequality (low )
reduces the advantage of democracy over a good autocracy. In a fully egalitarian society with a
good autocrat, there is indeed, in the model, no advantage to adopting democracy.
We can draw several other implications from this basic initial analysis. A first implication
is that, if collectivist societies have a higher , they will revolt with a higher probability when
faced with a bad autocrat. This is because there will always be a revolt against a bad autocrat
under all cultures, but collectivist cultures will better be able to overcome their collective action
problem against a bad autocrat. In his famous History of Government from the Earliest Times
(1997), Samuel Finer stated that there were many more peasant revolts in ancient China than in
Europe in the pre-industrial world (p.523, p. 799). While we do not have good data to test this
statement directly, it is nevertheless interesting and worth further examination. In the empirical

10
section, we will use available data to examine collective action in different cultures. A second
implication that is independent of the level of qk is that having a good autocrat in a collectivist
society will lead to higher regime stability under autocracy because of the absence of revolt.
The main result we would like to test, and also the most interesting one, follows from
Proposition 1. More collectivist societies characterized by a high tend not to revolt when they
have a good autocrat. More individualistic societies characterized by a low will tend to decide
to engage in revolt even if qk is very low. As a result, individualistic societies are unambiguously
more likely to end up adopting democracy over time. This is expressed in Proposition 2:
Proposition 2: Independently of the level of qk, societies with a lower than have a strictly
higher probability of ending up with democracy than societies with a higher , above as long
as > 0.
Proof of proposition 2: See the appendix.
Intuitively, under a good autocrat, there will be no revolt under a collectivist culture, in
contrast to what is the case in an individualistic culture. The non-intuitive part of the proposition
is that however low (but still non zero) the level of qk, individualistic cultures are more likely to
end up with a democracy. The reason is that collectivist societies will tend with positive
probability to replace a bad autocrat with another autocrat rather than with democracy, as long as
0. If they get a good autocrat, they will not revolt any more, and if they get a bad autocrat
they will revolt but will, with positive probability, put another autocrat in place. However high qC
and however low qI, the result of proposition 2 always holds.
In the model, culture is exogenous to institutions. What happens if we allow culture to be
influenced by existing institutions? Suppose we permit the cultural parameters of our model to
change as a function of the length of time spent under a given regime. Indeed, Persson and
Tabellini (2009) have given evidence that pro-democracy values are reinforced over time the
longer people live under democracy. Assume thus, in the framework of our model, that k
declines over time after democracy has been introduced. Assume also that k increases over time
under a “good” autocratic regime and that these changes only take place under peaceful
conditions, i.e. under conditions where no revolt takes place. It follows that this will not change
the results of our model. Indeed, democracy and “good” autocracy are both absorbing states,
11
depending on the values of . Once democracy has been reached, it will not be reversed, and so
variation in the level of will not modify the results of the model. On the other hand, there will
be no revolt under a good autocrat if is above . If living under a good autocrat further
increases , then there will still not be any revolt against the good autocrat. The results of the
model are thus unchanged, if we allow culture to move slowly in these regimes.
Before turning to the data, it is useful to compare the predictions of our model with the
results of mainstream models such as Acemoglu and Robinson (2006). The current model shares
certain basic features with the Acemoglu-Robinson model: there are two groups, the elite and the
poor, there is also a Markov structure, and the effect of inequality is similar. The differences are,
however, conceptually very substantial. In their model, the decisions are taken by the elite. In our
model, decisions (to revolt or not) are taken by the people, or their representatives within the
elite, and uncertainty over the outcome of collective action plays a much larger role. In their
model, there is absolutely no cultural component and the elites decide between either
endogenously redistributing to the poor when they revolt, in order to avert a revolution, or to
establish democracy as a commitment to redistribution. The probability of success of collective
action plays an important role in their model. The higher the probability of successful collective
action, the more likely it is that the elites will prefer to redistribute income to the poor to avoid a
revolution. On the other hand, if that probability is lower, they will choose instead to establish
democracy to avoid a revolution. In contrast, in our model the probability of success of collective
action ( ) is not playing a significant role in determining long-term outcomes. It is instead the
cultural parameter that determines the long-run probability that a country adopts democracy.
Furthermore, to the extent collective action is easier in collectivist culture (we provide below
some evidence consistent with this claim), our model predicts a less likely transition from
autocracy to democracy in countries with collectivist culture, which as we discuss below is
consistent with the data, while models in the Acemoglu-Robinson spirit predict the opposite.
3. Empirical analysis
We now turn to the empirical analysis of the link between culture and democratization. Because
we have no time series for our data on culture, and in particular on individualism and
collectivism, and the available data are at the country level, our empirical investigation will, by
necessity, mostly be devoted to cross-country analysis.

12
A. Data
We take the Polity IV index averaged between 1980-2010 as a measure of democratization. Polity
scores take values between -10 and +10. Negative scores are for autocracies and the more negative
the score the more autocratic the regime. Positive scores are for democracies and a score of +10
goes to fully institutionalized democracies. Note that many countries have a score of +10. Taking
an average over 30 years is useful because many countries switched from autocracy to democracy
during that period and the average score reflects the time since democracy was established as well
as the quality of democracy. This period covers many democratization episodes that took place
during the so-called third wave of democratization (Huntington, 1991) but it does not cover yet the
results of the Arab Spring. Although Polity IV data go back much further in time, we focus on the
more recent period because our cultural data were generated starting from the 1970s. The
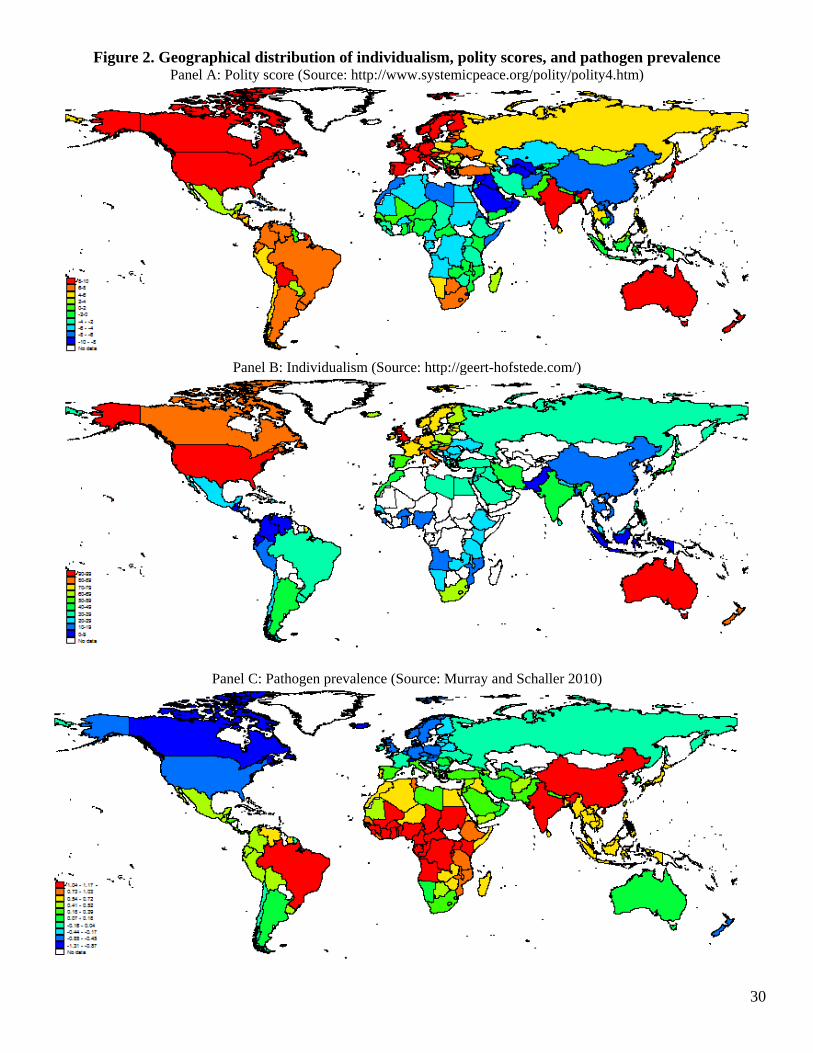
geographical distribution of polity scores is shown in Panel A of Figure 2.
To measure individualism/collectivism, we use the country level data developed by
Hofstede (2001) who initially used surveys of IBM employees in about 30 countries in the 1960s.
To avoid cultural biases in the way questions were framed, the survey was translated into local
languages by a team of English and local language speakers. With new waves of surveys and
replication studies, Hofstede’s measure of individualism has been expanded to more than 90
countries.9 The individualism score measures the extent to which it is believed that individuals are
supposed to take care of themselves as opposed to being strongly integrated and loyal to a
cohesive group. Individuals in countries with a high level of the individualism index value
personal freedom and status, while individuals in countries with a low level of the index value
harmony and conformity. Hofstede’s index, as well as the measures of individualism from other
studies, uses a broad array of survey questions to establish cultural values. Factor analysis is used
to summarize data and construct indices. In Hofstede’s analysis, the index of individualism is the
first factor in work goal questions about the value of personal time, freedom, interesting and
fulfilling work, etc. This component loads positively on valuing individual freedom, opportunity,
achievement, advancement, recognition and negatively on valuing harmony, cooperation, relations
with superiors. Although Hofstede’s data were initially collected mostly with the purpose of
9 The most current version of the data is available at http://www.geert-hofstede.com/. The timing of this and other variables is provided in Appendix Table A1.

13
understanding differences in IBM’s corporate culture, the main advantage of Hofstede’s measure
of individualism is that it has been validated in a large number of studies. The ranking of
countries across various studies and measures (see Hofstede (2001) for a review) is very stable.
Hofstede’s measure has been used extensively in the cross-cultural psychology literature, which
views the individualism-collectivism cleavage as the main cultural cleavage across countries (see
Heine, 2008). The Hofstede data also correlate quite well with the more recent data by Schwartz
(1994, 2006).10 Panel B of Figure 2 shows the geographic distribution of individualism scores.
Empirically, the causality between individualism and democracy can go both ways. One
can argue, as we do in this paper, that individualistic culture has a positive effect on democracy,
but one can also make an argument in the other direction: the more people live under democracy
and are accustomed to the protection of the rights of individual citizens, the more they espouse
an individualistic world view with its values of freedom and opportunity, equality of citizens
before the law and constraints on the executive (see for example Persson and Tabellini, 2009).
This would not change the results of the model, but would affect the empirical analysis. Ideally,
we would like to have a measure of individualism and collectivism much earlier in time, prior to
democratization history. Unfortunately, we do not have such data. We are therefore forced, in an
attempt to deal with the potential endogeneity of culture, to use instrumental variables.
Our main instrumental variable is based on epidemiological data put together by Murray
and Schaller (2010) for 230 geopolitical regions (mostly nations) on historical pathogen
prevalence in the early-to-mid 20th century, extending the work of Fincher et al. (2008).11 These
historical data are very important because they give a good idea of the pathogen environment
populations were facing in the past, including the very distant past, and in any case before the
post-WWII epidemiological revolution when big public health changes started to occur. Panel C
of Figure 2 shows the geographical distribution of historic pathogen prevalence. Given a strong
correlation between pathogen prevalence and collectivism, the above studies argue that stronger
pathogen prevalence pushed communities to adopt more collectivist values emphasizing
tradition, putting stronger limits on individual behavior, and showing less openness towards
foreigners. Collectivism is thus understood as a defense mechanism created to cope with greater
10 Schwartz’s cultural dimensions of intellectual and affective autonomy correlate positively with individualism while the dimension of embeddedness correlates negatively with individualism. These cultural dimensions are also interpreted in a very similar way as Hofstede’s individualism-collectivism index. 11 The study use 9 pathogens: leishmanias, trypanosomes, malaria, schistosomes, filariae, dengue, typhus, leprosy and tuberculosis.
14
pathogen prevalence. Obviously, historical pathogen prevalence is only one of the possible
reasons for the adoption of collectivism. Nevertheless, as an instrumental variable, it can provide
a very useful role in measuring the effect of individualism on democratization. Historical
pathogen prevalence can also be argued to satisfy the exclusion restriction since historical
pathogen prevalence is not likely to have a direct effect on political regime choice. Indeed, one
cannot claim that autocracy is more efficient than democracy, or vice-versa, in dealing with
pathogen prevalence. Autocracy suffers from lack of transparency, as was seen in China a few
years ago with the SARS epidemic, and is not necessarily more efficient in dealing with a
humanitarian disaster, as was the case with the catastrophic handling of the 2008 massive
flooding from cyclone Nargis in Myanmar. Likewise, democracy may or may not lack speed in
response to a major health epidemic.12
In some specifications we use another instrumental variable in conjunction with historical
pathogen prevalence: the Euclidian distance between the frequency of blood types A and B in a
given country and the frequency of those blood types in the USA, which is the most
individualistic country in our sample. This is a measure of genetic distance. To the extent that
culture is transmitted mainly from parents to children (see for example Fernandez et al. 2004,
Fernandez and Fogli, 2006, and the models by Bisin and Verdier, 2000, 2001), so are genes.
Populations that interbreed a lot should be genetically and culturally close because a similar
parental transmission mechanism is at work in both cases. Therefore, measures of genetic distance
can be seen as a proxy measure of differences in cultural values. Note that these are “neutral”
genetic markers that have no direct effect on fitness (i.e., ability to think, run, work, etc.) and thus
economic, cultural or political outcomes. Because genetic pools evolve slowly, these markers are
very unlikely to be affected by economic outcomes, and thus we can exclude reverse causality in
our instrumental variable estimates. To be clear, this particular identification strategy does not
postulate that the first stage captures a direct causal effect between genes (here blood types) and
culture. Instead, this strategy exploits the correlation between cultural and genetic transmission
from patents to offspring. We combine this variable with the other instrumental variable
mentioned above and apply standard statistical tests for the exclusion restriction. Our measure of
12 One could argue that higher pathogen prevalence should be correlated with a more centralized form of government given the externalities from disease transmission. However, centralization of government is not directly related to the type of political regime.
15
genetic distance successfully passes these tests, and one can thus feel more comfortable using it as
instrumental variable.13
The genetic data originate from Cavalli-Sforza et al. (1994), which provides measured
genetic markers for roughly 2,000 groups of population across the globe. These data contain
allele frequencies (alleles are variants taken by a gene) for various ethnic groups. Using the
frequency of blood types is attractive because, apart from being neutral genetic markers, the
frequency of alleles determining blood types is the most widely available genetic information
and thus we can construct the most comprehensive (in terms of country coverage) measure of
genetic distance. Since the genetic data are available at the level of ethnic groups while our
analysis is done at the country level, we have aggregated genetic information using ethnic shares
of population from Fearon (2003). Gorodnichenko and Roland (2010) provide more details on
how genetic distance is constructed.14
B. Individualism and democracy in cross-section
We now present the empirical results of the effects of individualism on average polity scores.
The first three columns of Table 1 report results for the basic OLS and IV regressions. The effect
of individualism is strongly significant with OLS and with IV, whether we take only historical
pathogen prevalence as an instrument, or together with blood distance. Note that in the two IV
regressions, the first stage is very significant, indicating no problem of weak instrument.
Moreover, the p-value of 0.856 for the overidentifying restriction test confirms that one cannot
reject the null of the instrumental variables being correctly excluded at any standard significance
level. Note that the IV coefficients are somewhat higher than the OLS coefficient, indicating a
potential measurement error. If we take the IV coefficient in column 3 as a baseline indicator, it
means that a one standard deviation increase in individualism (say from Iran to Finland, or
Argentina to Switzerland) should lead to a 4 point increase in the average polity score.
13 Using a smaller sample of countries, Gorodnichenko and Roland (2010) test overidentifying restrictions for the blood distance and other genetic instrumental variables with arguably more direct effects on individualism and collectivism and find that one cannot reject the null of correct exclusion restrictions. 14 A potential disadvantage of blood type distance as an instrumental variable is that it could be an instrument for other cultural variables, which may also be argued to affect political regime choice. Having two plausible instruments is nevertheless an advantage in empirical analysis because one can use formal tests of the exclusion restriction.
16
In columns 4 to 6, we perform the same regressions but include controls for conflict.
Countries plagued by conflict may indeed be more likely to have democracy suspended or
eliminated during periods of conflict. We thus include four variables from the International
Country Risk Guide, averaged between 1985 and 2009. These variables measure perceptions of
risk for 1) cross-border conflict, 2) civil disorder, 3) ethnic tensions and 4) war. Even with more
controls, the IV first stages are strong and the p-value for the overidentifying restriction is far
above conventional significance levels. Note that the inclusion of controls for conflict tends to
increase the size of the coefficient for individualism. We will include these four controls in the
rest of our empirical specification to control for these potentially confounding factors.
One may be concerned that, perhaps, controlling for other cultural dimensions can
eliminate statistical and economic significance of the individualism-democracy relationship. For
example, Hofstede identified four other cultural dimensions: power distance, masculinity,
uncertainty avoidance and long-term orientation.15 Fish (2002) found a negative correlation
between democracy and Islam. Inglehart (1999) argues that interpersonal trust is conducive to
stable democracies. In Table 2, we assess whether including these cultural characteristics alters
the strength of the individualism-democracy link. Specifically, we control for the four additional
Hofstede indexes, the share of Muslim population in 1970 (these data are from Barro and
McCleary (2003)), and generalized trust (taken from the World Values Survey (WVS); an
average value across available waves of the WVS). The share of Muslim population has a
significantly negative coefficient, which is consistent across specifications.16 The only other
cultural characteristic with similar consistency across specifications is uncertainty avoidance.
Interestingly, although trust, the cultural variable the most used by economists, is positively
correlated with Polity IV scores, this correlation disappears once we control for individualism
scores. The magnitude of the coefficient on individualism is largely unchanged across
specification.
15 Power distance measures the extent to which the less powerful members of organizations and institutions (like the family) accept and expect that power is distributed unequally. Uncertainty avoidance measures a society's tolerance for ambiguity. Masculinity measures a preference in society for achievement, heroism, assertiveness and material rewards for success. Cultures with high long-term orientation scores are characterized by emphasis on persistence (perseverance), ordering relationships by status, the possibility of having many truths (depending on time and context), thrift, and having a sense of shame. 16 When introducing shares of other religions (results not shown), the share of Muslims remains strongly negatively significant and is the only strongly robust variable. The share of Jews is typically positively associated to democracy. Given that Jews are a minority in all countries except Israel, the most natural interpretation is that Jews, who have been persecuted in the past, have migrated to the more stable democratic countries in the world.

17
In Table 3, we focus on four key economic factors typically linked to the prevalence of
democracy: income, institutions, inequality, and natural resource rents. As highlighted in the
introduction, since Lipset (1959), discussions on the determinants of democracy have turned
around measures of economic development. We use the log of income (at purchasing power
parity) per worker in 2000 from the Penn World Tables as a control for the level of economic
development to maximize the coverage of countries.
Acemoglu and Robinson (2006) and others argue that extractive/non-inclusive
institutions create barriers for transitions to democracy.17 To quantify the quality of institutions,
we follow Acemoglu et al. (2001) and measure the quality of institutions as the score for
protection against expropriation rights from the ICRG averaged over the 1985-2009 period.
Inequality has also been argued to be related to democratization. It is a key variable in
Acemoglu and Robinson’s models of democratization. A higher level of inequality makes
democracy more advantageous, as it will lead to higher levels of redistribution. On the other
hand, very high levels of inequality may lead the elite to stage coups to eliminate the associated
tax burden. We measure inequality with the Gini coefficient for net income. This variable is
taken from the Standardized World Income Inequality Database. To minimize measurement
errors and short-term volatility in the series, we take a median value of the inequality over the
1960-2009 period.
Finally, we employ a measure of natural resource rents. Ross (2001), Wantchekon
(2002), Dunning (2008) and others provide evidence suggesting that countries rich in natural
resources may tend to be less democratic (“the political resource curse”). To account for this
determinant, we use the share of natural resource rents in the gross domestic product. The share
is averaged over 1980-2010 and taken from the World Development Indicators.
From an econometric point of view, these additional controls could be problematic in
several respects. First, Gorodnichenko and Roland (2010, 2011) document a potential causal
effect of individualism on income per capita and the quality of institutions. Hence, there could be
an identification problem when both variables are used as regressors. Second, there might be
reverse causality, i.e., democracy may affect the level of economic development, quality of
institutions, level of inequality, and the extractive/non-extractive nature of the economy. Such
17 Acemoglu et al. (2008) claim that income has no effect on democracy and that the comovement between these two variables is determined by institutions (the rule of law) that affect both democracy and successful economic development.
18
endogeneity not only yields biased estimates of the coefficients on these economic variables but
it is also likely to generate a downward bias in the estimate of the coefficient on individualism.18
As a result, the estimated coefficient on individualism scores likely provides a lower bound for
the “true” coefficient. In short, one should exercise caution in interpreting regression coefficients
in this specification, and also bear in mind that the estimated effect of individualism on
democracy is likely to be understated.
We find that income is indeed positively correlated with Polity IV scores, but controlling
for income or the other potential determinants does not appear to diminish the strength of the
relationship between individualism and democracy.19 Note that income is not significant in the IV
regressions, which could be because of the identification problem mentioned above. In contrast,
the share of natural resource rents in GDP is robustly negatively correlated with Polity IV scores.
Inequality and the quality of institutions seem to have no robust association with democracy once
we condition on other predictors. Importantly, results in Table 3 suggest that, even after controlling
for economic factors emphasized in previous work, the effect of individualism is large and
statistically significant.
In Table 4, we introduce controls for other variables that previous work has associated
with democracy: education, measures of fractionalization and economic openness. Bourguignon
and Verdier (2000), for example, build a model where education is both an engine of growth and
of political participation. Column (1) includes the education index (average over 1980-2005)
from the Human Development Report. We see that individualism and education are both
statistically significant. In column (2), we introduce measures of ethnic, cultural and ethno-
linguistic fractionalization from Fearon (2003). None of these variables comes out as significant,
while individualism remains strongly significant. A similar result obtains in column (3) when we
control for openness, measured as the ratio of exports plus imports to gross domestic product (in
current prices, year 2000) and provided by Penn World Tables. The IV regressions in columns
(4) through (6) yield similar results.
Conditional on the quality of our instrumental variables, we conclude that individualism
has a significant and robust causal effect on the polity score, even after including controls that
18 Gorodnichenko and Roland (2010) provide a more detailed discussion of this econometric problem. 19 Results are similar when we use consider measures of output for earlier periods. See Appendix Table A2.
19
have been used in the literature, such as conflict, religion, income, institutions, education,
fractionalization and openness.
C. Long-difference analysis
A potential drawback of cross-sectional analysis of democratization is that it does not exploit the
time variation of the data. Fortunately, it is possible to perform panel data analysis of the polity score
to understand the dynamics of democratization within a country. However, culture is slow-moving
and it would be surprising to see important effects of culture on the basis of annual time variation.
Furthermore, given that cultural attributes are likely to be measured with error, panel regressions
based on annual data can exacerbate attenuation biases (see Griliches and Hausman 1986). Not
surprisingly, analyses of cultural attributes almost invariably focus on cross-sectional variation.
In an attempt to strike a balance between a desired specification and data constraints, we
report in Table 5 results based on “long-difference regressions” where the dependent variable is the
difference in the polity index between 1960 and 2000 and regressors are the log difference of income
per capita and the difference in the level of primary education during that same period as well as
individualism and the polity score in 1960. This approach enhances the signal-to-noise ratio for the
variables and one may thus obtain a crisper view of how variables are related. With long differences,
individualism remains significant, except in columns (1) and (5), but this is mostly due to outliers.
The coefficient on individualism is significant when we use Huber robust regressions.
D. Years of democracy, collective action, collectivism and regime transitions
We have so far used as dependent variable the average polity score between 1980 and 2010. An
important advantage of this measure is that it incorporates the quality of democracy in a country as
well as its length after 1980. In this subsection, we try to further explore dynamic aspects of the
democratization process in the context of our model. In a first step, we examine the relationship
between individualism and the frequency of democracy, which is defined as the fractions of years a
country has continuously had a non-negative polity score. One may interpret this frequency as
measuring the length of democracy in a country. While this measure does not take into account the
quality of democracy, one can argue that this measure is closer to the model as the latter predicts
that individualist cultures will on average adopt democracy earlier. We ran the same regressions as
20
in Tables 1-5 using length of democracy as the dependent variable and we reached essentially the
same conclusions as before. In Table 6, we present some of the most salient results.
Column 1 presents the simple OLS regression of fraction of years in democracy on
individualism. A one standard deviation in the individualism score leads to a 24 percentage point
increase in the length of democracy. The instrumental variable regression in column 2, using
historical pathogen prevalence and blood distance to the U.S. as instrumental variables predicts a
34 percent increase in response to a one standard deviation increase in the individualism score.
The over-identification test clearly indicates that we cannot reject the null of the IVs being
correctly excluded. Columns 3 and 4 control for log of income per worker, quality of institutions
and the share of natural resource rents in gross domestic product. Although the point estimates
on individualism scores are somewhat smaller, the effect continues to by economically and
statistically significant. In columns 5 and 6, we add controls for education, religion, conflict, and
measures of ethnic/cultural/linguistic fractionalization. In all these regressions individualism
always has a significant effect on the length of democracy.
We did not make any assumptions in the model about whether collectivist cultures have a
higher probability of successful collective action compared ( ) to individualist cultures ( ),
and our main result did not hinge on this. It would nevertheless be useful to see if the data can
give us some indication about whether there is more collective action under collectivism. In
relation to this, we investigate whether collectivist autocracies have a higher likelihood of
breakdown, be it through mass protests or coups, which would tend to suggest that there is more
collective action success in more collectivist countries. In order to do this, we rely on the
database assembled by Geddes et al. (2014). This database focuses on autocracies and, to our
knowledge, is the best source documenting transitions from an autocratic regime to either
democracy or another autocracy.
We define the probability of an autocracy breakdown as the number of autocracy
breakdowns (coups, revolutions, elections, etc.) divided by the number of years a country has
been under autocracy. This statistic from the Geddes et al. (2014) comes the closest to our
parameter . Figure 3 shows that there is a clear negative correlation between individualism and
autocracy breakdown. In Table 7, we provide some regressions using autocracy breakdown as
the dependent variable and the set of controls identical to those in Table 6. In all specifications
the coefficient for individualism is negative, suggesting that among countries with an autocratic

21
regime, those having a collectivist culture are more likely to experience autocracy breakdown.
The coefficient is significant in all OLS regressions, but the IV coefficients are mostly not
significant. The evidence presented here is weaker than in previous tables, but overall tends to
suggest that there may be less collective action failure in collectivist cultures.
Importantly, the Geddes et al. (2014) database also makes it possible to analyze
transitions from autocracy to autocracy and transitions from autocracy to democracy. The model
clearly predicts that, in collectivist societies, there will be more transitions from bad autocracies
to good autocracies because ). While it is difficult to distinguish empirically “bad” and
“good” autocrats, we can examine the link between individualism and collectivism and the
probability of regime changes. We define the probability of autocratic transition as the
proportion of autocracy breakdowns leading to autocracy in a country. Because these variables
are likely to very often take the value of 0 or 100, we performed tobit regressions with censoring
points at 0 and 100. The results are presented in Tables 8, where we take the same controls as in
Table 7. We observe clearly that transitions from autocracy to autocracy are significantly
negatively associated with individualism (and thus positively associated with collectivism) in all
specifications. Hence, both the polity data and the Geddes et al. (2014) data on autocracies and
autocratic transitions give empirical support for these predictions of the model.
4. A case study of culture and regime transitions
In this section, we give some historical examples that are consistent with the features of our
model. While this narrative account is necessarily limited and non-exhaustive, it facilitates
interpretation of the model and its empirical tests.
Ghana has an individualism score of 20, the same as China, Vietnam, Singapore,
Bangladesh or Thailand. It has the lowest individualism score in Africa, together with Nigeria.
Ghana is thus among the most collectivist countries in the world. Ghana has had a strong history of
collective action. During the colonial period, it had one of the most powerful anti-colonial
movements, under the leadership of Kwame Nkrumah. Ghana was the first country in Sub-
Saharan to achieve independence in 1956. Nkrumah espoused a socialist ideology. After
independence, he gradually became a dictator, concentrating all powers in his hands, instituting a
single party state, controlling the different branches of government and instituting increasingly
repressive laws. Nkrumah was deposed in 1966 by a military coup. Democracy was introduced by

22
the military, elections were held in 1969 but there were soon massive protests against austerity
policies introduced by the democratically elected government. Another military coup followed and
democracy was abolished. Several years later, protests developed against the military regime.
Under the pressure of these protests, a referendum was held in 1978 to establish a union
government to replace the military regime with a government representing both military and
civilian leaders. Parties were still not allowed under the union government. After the success of
the referendum, more strikes and demonstrations developed to ask for the establishment of full
democracy. In 1979, parties were allowed to operate legally again. Very soon, there was a failed
military coup under the leadership of Air Force officer Jerry Rawlings who was arrested. Riots led
to Rawlings being freed from jail and to the so-called June 4 revolution putting Rawlings in power.
While democracy was again shortly being reestablished, strikes against the economic policies of
the new democratic government led in 1981 to a coup led by Rawlings. In 1992, the latter
organized a transition to democracy under which he was elected president of Ghana, a post he held
until 2001. Ghana is currently one of the respected democracies in Sub-Saharan Africa with a
polity score of 8 in 2004.
There are several striking facts about Ghana. First, there has always been strong collective
action, before and after independence. Second, until recently, Ghana was mostly an autocracy. The
two most famous autocrats, Nrkumah and Rawlings enjoyed a high level of popularity during a great
part of their tenure. Nkrumah was overthrown in the middle of the cold war and Rawlings presided
over the transition to democracy, becoming elected leader after being a military dictator. The
experience of Ghana resonates with some of the features of our model, in particular the higher
propensity to collective action under the collectivist culture, and the emergence of “good autocrats”.
The experience of Ghana stands in sharp contrast to that of India, which also had a strong
independence movement but established democracy right after independence, and never became
autocratic, despite ups and downs in the quality of its democracy. India has an individualism
score of 48, the highest among developing countries, a score only slightly lower than that of
Spain (51) or Israel (54). India’s success with democracy can be explained in many ways, but it
is nevertheless striking to note that, being one of the most individualist countries in the
developing world, India has had a stable democracy.
Pakistan, geographically close to India, has an individualism score of 14, one of the
lowest in the world. While initially democratic after the Partition, Pakistan became autocratic in
23
1958 following martial law declared by president Mirza, following a series of short-lived
governments. Mirza himself was ousted by General Ayub Khan. The latter then introduced land
reform and a series of reforms that were quite popular as they delivered good economic
performance. He then introduced a presidential system in 1962 and was elected president. Ayub
Khan may be seen as a “good dictator” who implemented useful reforms. Indeed, he was quite
popular during most of his tenure. He stayed in power until 1969 when he was deposed by a
coup. Since then, Pakistan has alternated between military regimes and short-lived democracies.
Although Pakistan and India shared British colonial rule for a long time, the contrast between
India and Pakistan’s post-WWII political history is quite striking.
5. Conclusions
We have presented a model integrating culture in democratization processes. Assuming that a
collectivist culture displays a stronger taste for conformity and a stronger aversion to institutional
innovation even if it might be better at overcoming collective action problems, the model
predicts that, starting from autocracy as the initial regime, an individualistic culture will have a
higher likelihood of switching to democracy than a collectivist culture. The reason is that a
collectivist culture will tend to stick to a “good” non-predatory autocracy, which will not be the
case with an individualistic culture.
Predictions of the model have strong, robust support in the data, controlling for existing
determinants identified in the literature.. To the extent one believes our instrumental variable
analysis, these effects may be interpreted as causal. Using long-difference regressions, we also find
long-run effects of individualism on polity scores. Using the Geddes et al. (2014) data base on
autocracies, we also found that collectivist autocracies have higher frequency of regime breakdowns
than individualist autocracies. Consistent with the model, collectivist countries are more likely to
experience a transition towards autocracy while individualist countries are more likely to experience
a transition towards democracy.
Our theoretical and empirical results have important implications. In particular, as countries
with collectivist cultures develop economically, they will not necessarily evolve towards democracy
or might do so more slowly or possibly only under the effect of an exceptional crisis. This
implication is in stark contrast with modernization theories. Countries like China, Vietnam or
Singapore, which have experienced considerable economic success in recent decades have not
24
adopted Western-style democracies. Similarly, countries that have experienced a genuine
democratization process like Taiwan, Thailand, Indonesia and Korea have done so relatively recently
and their average polity score over the last 30 years have not been better than Guatemala, Panama or
Peru.
We must nevertheless be very cautious in interpreting these implications. There are many
determinants of democracy and culture is only one of those forces. Our research nevertheless
suggests that the role of culture, and in particular of individualism and collectivism as
fundamental cultural dimension, cannot be ignored in understand democratization processes.
References
Acemoglu D., and J. Robinson (2006) Economic Origins of Dictatorship and Democracy. Cambridge University Press.
Acemoglu, D., and J. Robinson (2000) “Why Did the West Extend the Franchise? Democracy, Inequality and Growth in Historical Perspective,” Quarterly Journal of Economics 115(4), 1167-1199.
Acemoglu, D., S. Johnson, and J. Robinson (2001) “The Colonial Origins of Comparative Development: An Empirical Investigation,” American Economic Review 91: 1369-1401.
Acemoglu, D., S. Johnson, J. Robinson, and P. Yared (2005) “From Education to Democracy?” American Economic Review Papers and Proceedings 95(2), 44-49.
Acemoglu, D., S. Johnson, J. Robinson, and P. Yared (2008) “Income and democracy,” American Economic Review 98, 808-42.
Acemoglu, D., S. Naidu, P. Restrepo and J. Robinson (2014) “Democracy Does Cause Growth” NBER working paper No 20004.
Algan, Y., and P. Cahuc (2010) “Inherited Trust and Growth,” American Economic Review 100(5), 2060-2092.
Almond, G., and S. Verba (1963) The Civic Culture. Political Attitude and Democracy in Five Nations. Sage Publications New York.
Barro, R.J., and J.W. Lee (2012) “A New Data Set of Educational Attainment in the World, 1950–2010”, mimeo Harvard University.
Barro, R.J., and R.M. McCleary (2003) “Religion and Economic Growth Across Countries,” American Sociological Review 68(5), 760-781.
Bisin, A., and T. Verdier (2000) “Beyond The Melting Pot”: Cultural Transmission, Marriage, And The Evolution Of Ethnic And Religious Traits,” Quarterly Journal of Economics 115, 955-988.
Bisin, A., and T. Verdier (2001) “The Economics of Cultural Transmission and the Dynamics of Preferences,” Journal of Economic Theory 97, 298-319.
Boix, C., and S. Stokes (2003). “Endogenous Democratization” World Politics 55(4), 517-549. Bourguignon, F., and T. Verdier “Oligarchy, Democracy, Inequality and Growth,” Journal of
Development Economics 62(2), 285-313. Bruckner, M., and A. Ciccone (2011) “Rain and the Democratic Window of Opportunity,”
Econometrica 79(3), 923–947.
25
Cavalli-Sforza, L. L., P. Menozzi, and A. Piazza (1994) The History and Geography of Human Genes. Princeton University Press.
Dunning, T. (2008) Crude Democracy: Natural Resource Wealth, and Political Regimes, Cambridge University Press Cambridge U.K.
Fearon, J. (2003) “Ethnic and Cultural Diversity by Country,” Journal of Economic Growth 8(2), 195-222.
Fincher, C.L., R. Thornhill, D.R. Murray, and M. Schaller (2008) “Pathogen prevalence predicts human cross-cultural variability in individualism/collectivism” Proceedings - Royal Society. Biological sciences 275(1640), 1279-1285.
Finer, S. (1997) The History of Government, volumes I-III, Oxford University Press, Oxford. Fischer, D. H. (1989) Albion's seed: Four British folkways in America. New York: Oxford
University Press. Fish, S. (2002) “Islam and Authoritarianism,” World Politics 55(1), 4-37. Fowler, J., L. Baker, and C. Dawes (2008) “Genetic Variation in Political Participation,” American
Political Science Review 102, 233-248. Freedom House, 1999. Democracy’s Century: A Survey of Global Political Change in the 20th
Century. Geddes, B., J. Wright and E. Frantz (2014) “Autocratic Breakdown and Regime Transitions: A
New Data Set,” Perspectives on Politics 12(2), 313-331. Gorodnichenko, Y., and G. Roland (2010). “Culture, Institutions and the Wealth of Nations”,
forthcoming in Review of Economics and Statistics. Gorodnichenko, Y., and G. Roland (2011) “Which Dimensions of Culture Matter for Long-Run
Growth?” American Economic Review Papers and Proceedings 101(3), 492-498. Gorodnichenko, Y., and G. Roland (2012) “Understanding the Individualism-Collectivism
Cleavage and its Effects: Lessons from Cultural Psychology.” In Aoki, M. T. Kuran and G. Roland (ed.) Institutions and Comparative Economic Development, Palgrave McMillan (forthcoming).
Griliches, Z., and J.A. Hausman (1986) “Errors in variables in panel data,” Journal of Econometrics 31(1), 93-118.
Grosjean, P. (2014) “A history of violence: the culture of honor as a determinant of homicide in the US South,” Journal of the European Economic Association 12(5), 1285–1316.
Grosjean, P., and C. Senik (2011) “Democracy, Market Liberalization and Political Preferences” Review of Economics and Statistics 93(1), 365-381.
Guiso, L., P. Sapienza, and L. Zingales (2006) “Does Culture Affect Economic Outcomes.” Journal of Economic Perspectives 20(2), 23-48.
Hatemi, P.K., and R. McDermott (2012) “The Genetics of Politics: Discovery, Challenges and Progress,” Trends in Genetics 28(10), 525-533.
Heine, Steve J. (2008) Cultural psychology. W. W. Norton & Company. Hofstede, G. (2001) Culture’s Consequences: Comparing Values, Behaviors, and Organizations
Across Nations. 2nd edition. Sage Publications. Huntington, S. (1991). The Third Wave: Democratization in the Late Twentieth Century
University of Oklahoma Press. Inglehart, R. 1999. “Trust, well-being and democracy,” in Democracy and trust, M.E. Warren. ed.,
Cambridge ; New York : Cambridge University Press, 88-120. Inglehart, R., and C. Weizel (2005) Modernization, Cultural Change and Democracy: The Human
Development Sequence, Cambridge University Press, Cambridge UK.

26
Lipset, S.M. (1959) “Some Social Requisites of Democracy: Economic Development and Political Legitimacy,” American Political Science Review 53, 69-105.
Murray, D. R., and M. Schaller (2010) “Historical prevalence of infectious diseases within 230 geopolitical regions: A tool for investigating origins of culture,” Journal of Cross-Cultural Psychology 41, 99-108.
Persson, T. (2005) “Forms of Democracy, Policy and Economic Development” NBER Working Paper No 11171.
Persson, T., and G. Tabellini (2009) “Democratic Capital: The Nexus of Political and Economic Change,” American Economic Journal: Macroeconomics 1, 88-126.
Przeworski, A., and F. Limongi (1997) “Modernization: Theories and Facts,” World Politics 49, 155-183.
Ross, M. (2001) “Does Oil Hinder Democracy?” World Politics 53, 325-361. Schwartz, S.H. (1994) “Beyond Individualism/Collectivism: New Cultural Dimensions of Values”
in Uichol K. et al, eds., Individualism and Collectivism: Theory, Method, and Applications. Sage.
Schwartz, S.H. (2006) “A Theory of Cultural Value Orientations: Explication and Applications,” Comparative Sociology 5(2-3), 137-182.
Tabellini, G. (2008) “Institutions and Culture,” Journal of the European Economic Association 6(2-3), 255-294.
Treisman, D. (2012). “Income, Democracy and the Cunning of Reason”, mimeo UCLA. Wantchekon, L. (2002) “Why Do Resource Dependent Governments have Authoritarian
Governments?” Journal of African Finance and Development 2, 57-77.

27
APPENDIX
Proof of Proposition 1:
Under a good ruler, the poor prefer not to revolt if:
11 1 1
Using the expression for 1
we get ⇔
1 1 ⇔
1 1 1 1
Since the right hand side of the inequality is equal to , we have that ⇔
1 1
A quick look at this last inequality shows several things. First, a high degree of conformity (a high ) implies the preference not to revolt. With ⟶ 1,
⟶1
11
1 1 1
Note now that when is low and tends towards zero, there will be a strict preference to revolt. Indeed, in that case:
⟶1
1 1 1⟺
The latter inequality is always satisfied as democracy brings positive redistribution to the
poor. Since VGN >VGR for high values of and VGN < VGR for low values of and since
0 , by continuity, there exists a threshold value , at which the poor are indifferent between revolting and not revolting. Above , they prefer not to revolt against a good autocrat, and below they prefer to revolt against a good autocrat.
QED.
Proof of Proposition 2:
Under a collectivist culture with a high enough above such that the poor decide not to revolt, the probability of ending up with a democratic regime after t periods can be shown to be
k
28
equal to
1 1 1
When → ∞, the probability of having democracy converges to
1 11 1
.
Note that this expression tends towards zero as → 1.
Under an individualist culture with a low enough such that the poor decide to revolt against any type of dictator, the probability of ending up with a democratic regime after t periods can be shown to be equal to
1
With → ∞, the probability of having democracy converges to which is strictly
positive as long as 0. Compare now the probability of an individualistic culture (with below ) and the
probability of a collectivist culture (with above ) of ending up with democracy as → ∞. A country with an individualistic culture will have a higher probability of ending up with democracy than a country with a collectivist culture as long as
11
1 11 1
One verifies that this inequality is strictly satisfied as long as .
QED
29
Figure 1. Timing of events in the model
Revolt
Norevolt
Prob.
Prob.1
Successfulrevolution
Unsuccessfulrevolution
Prob.
Prob.1
Keepregime
Changeregime(movetodemocracy)
Prob.
Prob.1
Gooddictator
Baddictator
Movetothenextperiod
30
Figure 2. Geographical distribution of individualism, polity scores, and pathogen prevalence Panel A: Polity score (Source: http://www.systemicpeace.org/polity/polity4.htm)
Panel B: Individualism (Source: http://geert-hofstede.com/)
Panel C: Pathogen prevalence (Source: Murray and Schaller 2010)

31
Figure 3. Individualism and the probability of autocratic breakdown.
Notes: Probability of autocracy breakdown is the fraction of years when a country has a change of autocrats conditional on starting as an autocracy. Source: Geddes et al. (2014).
ALBAGO
ARGBGD
BRA
BGR
BFA
CHL
CHN
COL
CRI
CZE
DOM
ECU
EGY
SLVETH
GER
GHA
GRCGTM
HND
HUNIDN
IRN
IRQ
KEN
KOR
KWTLBYMWI
MYSMEX MARMOZ
NAMNPL
NGAPAK
PAN
PER
PHL
POLPRT
ROM
RUS
SAUSEN
SCG
SLE
SGP ZAFESP
LKA
SYR
TWN TZA
THA
TUR
ARE
URY
VEN
VNM
ZMB
010
2030
40P
rob
abili
ty o
f au
tocr
acy
bre
akd
own
0 20 40 60 80Individualism score

32
TABLE 1: Individualism and democratization. Basic OLS and IV regressions.
Dependent variable: Polity score
OLS IV
pathogens
IV blood distance +
pathogens OLS
IV pathogens
IV blood distance +
pathogens (1) (2) (3) (4) (5) (6) Individualism 0.130*** 0.201*** 0.199*** 0.160*** 0.278*** 0.250***
(0.018) (0.028) (0.026) (0.025) (0.055) (0.042) Low risk of:
- Cross-border conflict
0.137 -0.218 -0.132 (1.408) (1.422) (1.403) - Civil disorder -2.152* -4.443*** -3.884*** (1.116) (1.573) (1.320) - Ethnic tensions 0.944** 0.855* 0.877* (0.426) (0.479) (0.456) - War 1.670 2.845 2.559
(1.907) (1.877) (1.854) Observations 96 96 96 92 92 92 R2 0.236 0.166 0.170 0.334 0.196 0.255 1st stage F-stat 95.73 51.18 42.19 28.81 1st stage Partial R2 0.445 0.515 0.277 0.392 Overid test p-value 0.856 0.319
Notes: The dependent variable is the average polity score for the 1980-2010 period from the Polity IV data base. Individualism is Hofstede’s index of individualism. A larger value of the index corresponds to a greater level of individualism. The four conflict variables (low risk of: cross-border conflict, civil disorder, ethnic tensions and war) are taken from the International Country Risk Guide and are averaged between 1985 and 2009. A higher score means a lower risk of the variable. Instrumental variables for individualism: historical pathogens is the Historical Pathogen prevalence index from Murray and Schaller (2010); blood distance is the Euclidian distance of frequency of blood types A and B in a given country relative to their frequency in the USA. Over-id test p-value reports the p-value for the overidentifying restriction tests that instruments are correctly excluded. Robust standard errors in parentheses. *** p<0.01, ** p<0.05, * p<0.1.

33
TABLE 2: Individualism and Democratization with controls for different cultural dimensions.
Dependent variable: Polity score OLS OLS OLS OLS OLS
IV pathogens
IV blood dist. + pathogens
(1) (2) (3) (4) (5) (6) (7) Hofstede’s cultural indexes
Individualism 0.160*** 0.105*** 0.141*** 0.110*** 0.078*** 0.170*** 0.125*** (0.025) (0.028) (0.028) (0.021) (0.025) (0.062) (0.042) Power Distance -0.102*** -0.079*** -0.028 -0.053 (0.035) (0.028) (0.039) (0.033) Masculinity -0.011 -0.013 -0.031 -0.022 (0.025) (0.022) (0.024) (0.022) Uncertainty Avoidance 0.054* 0.045* 0.042** 0.044** (0.027) (0.023) (0.020) (0.020) Long-Term Orientation 0.040 -0.006 -0.003 -0.005
(0.024) (0.018) (0.017) (0.016) Trust (WVS) -0.022 -0.026 -0.032* -0.029 (0.026) (0.020) (0.019) (0.018) Share of Muslim population (1970) -10.419*** -8.312*** -7.565*** -7.928*** (1.464) (1.862) (1.909) (1.779) Observations 92 83 85 92 78 78 78 R2 0.334 0.499 0.340 0.614 0.659 0.603 0.644 1st stage F-stat 23.69 19.87 1st partial R2 0.237 0.356 Over-id test p-value 0.207
Notes: The dependent variable is the average polity score for the 1980-2010 period from the Polity IV database. Individualism is Hofstede’s index of individualism. A larger value of the index corresponds to a greater level of individualism. Power Distance, Masculinity, Uncertainty Avoidance, and Long-Term Orientation are other dimensions of culture according to Hofstede’s cultural dimension. Trust is a measure of generalized trust from the World Values Survey. Share of Muslim population is from Barro and McCleary (2003) and refers to 1970. Instrumental variables for individualism: historical pathogens is the Historical Pathogen prevalence index from Murray and Schaller (2010); blood distance is the Euclidian distance of frequency of blood types A and B in a given country relative to their frequency in the USA. Column (6) uses historical pathogens. Column (7) uses both instrumental variables. Controls for low risk of: cross-border conflict, civil disorder, ethnic tensions and war (ICRG, average 1985 -2009) are include but not reported. Over-id test p-value reports the p-value for the overidentifying restriction tests that instruments are correctly excluded. Robust standard errors in parentheses. *** p<0.01, ** p<0.05, * p<0.1.

34
Table 3: Individualism and Democratization with controls for income, institutions, rents and inequality. Dependent variable: Polity score
(1) (2) (3) (4) (5)
Panel A: OLS Individualism 0.123*** 0.148*** 0.120*** 0.122*** 0.048* (0.035) (0.027) (0.027) (0.023) (0.027) Log income per worker 2.332*** 3.479*** (0.771) (0.701) Protection against
expropriation risk 0.309** 0.009 (0.133) (0.133)
Natural resource rent -0.233*** -0.151** (0.047) (0.057) Gini coefficient 0.002 0.057 (0.047) (0.039) R2 0.423 0.374 0.498 0.350 0.612
Panel B: IV (historic pathogen prevalence) Individualism 0.223*** 0.258*** 0.251*** 0.275*** 0.182** (0.071) (0.056) (0.062) (0.064) (0.080) Log income per worker 1.427 2.103** (0.896) (0.954) Protection against
expropriation risk 0.213 0.031 (0.145) (0.140)
Natural resource rent -0.161*** -0.119* (0.062) (0.064) Gini coefficient 0.081 0.100* (0.066) (0.059) R2 0.342 0.260 0.349 0.086 0.458 1st stage F-stat 17.37 34.72 35.76 26.41 9.473 1st stage Partial R2 0.164 0.255 0.248 0.232 0.106
Panel C: IV (historic pathogen prevalence + blood distance)
Individualism 0.205*** 0.244*** 0.224*** 0.224*** 0.133** (0.052) (0.040) (0.045) (0.045) (0.053) Log income per worker 1.586** 2.602*** (0.795) (0.874) Protection against
expropriation risk 0.225* 0.023 (0.134) (0.132)
Natural resource rent -0.176*** -0.131** (0.055) (0.057) Gini coefficient 0.055 0.085* (0.056) (0.049) R2 0.368 0.287 0.404 0.233 0.549 1st stage F-stat 14.79 27.34 25.23 20.29 11.51 1st stage Partial R2 0.290 0.398 0.358 0.344 0.244 Overid test p-value 0.693 0.686 0.401 0.146 0.425 Observations 91 92 91 87 86
Notes: The dependent variable is the average polity score for the 1980-2010 period from the Polity IV data base. Individualism is Hofstede’s index of individualism. A larger value of the index corresponds to a greater level of individualism. Log income per worker: log income (at purchasing power parity) per worker in 2000 from the Penn World Tables. Protection against expropriation risk (ICRG, average 1985 -2009). Gini coefficient of net income inequality is from the Standardized World Income Inequality Data base. Natural resource rent is the sum of oil rents, natural gas rents, coal rents (hard and soft), mineral rents, and forest rents. This variable is measured in percent of GDP (average over 1980-2010) and taken from the World Development Indicators. Controls low risk of: cross-border conflict, civil disorder, ethnic tensions and war (ICRG, average 1985 -2009) are included but not reported. Instrumental variables for individualism: historical pathogens is the Historical Pathogen prevalence index from Murray and Schaller (2010); blood distance is the Euclidian distance of frequency of blood types A and B in a given country relative to their frequency in the USA. Over-id test p-value reports the p-value for the overidentifying restriction tests that instruments are correctly excluded. Robust standard errors in parentheses. *** p<0.01, ** p<0.05, * p<0.1.
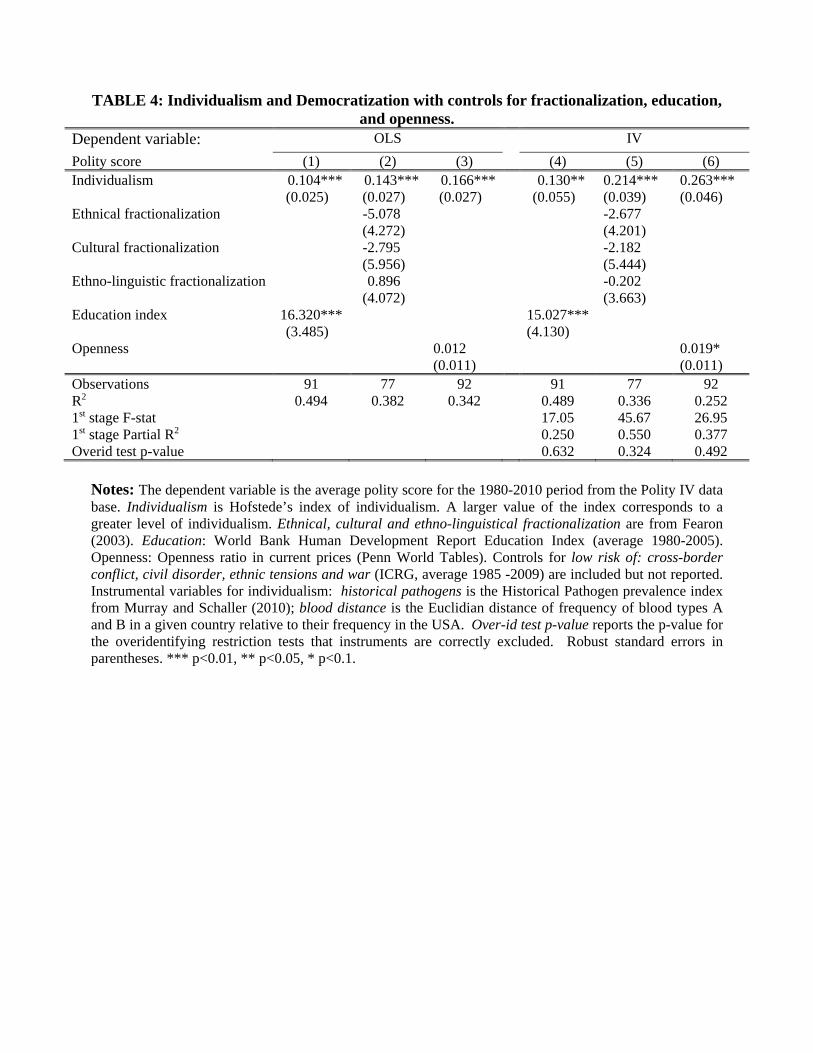
TABLE 4: Individualism and Democratization with controls for fractionalization, education, and openness.
Dependent variable: OLS IV
Polity score (1) (2) (3) (4) (5) (6) Individualism 0.104*** 0.143*** 0.166*** 0.130** 0.214*** 0.263*** (0.025) (0.027) (0.027) (0.055) (0.039) (0.046) Ethnical fractionalization -5.078 -2.677 (4.272) (4.201) Cultural fractionalization -2.795 -2.182 (5.956) (5.444) Ethno-linguistic fractionalization 0.896 -0.202 (4.072) (3.663) Education index 16.320*** 15.027*** (3.485) (4.130) Openness 0.012 0.019* (0.011) (0.011) Observations 91 77 92 91 77 92 R2 0.494 0.382 0.342 0.489 0.336 0.252 1st stage F-stat 17.05 45.67 26.95 1st stage Partial R2 0.250 0.550 0.377 Overid test p-value 0.632 0.324 0.492
Notes: The dependent variable is the average polity score for the 1980-2010 period from the Polity IV data base. Individualism is Hofstede’s index of individualism. A larger value of the index corresponds to a greater level of individualism. Ethnical, cultural and ethno-linguistical fractionalization are from Fearon (2003). Education: World Bank Human Development Report Education Index (average 1980-2005). Openness: Openness ratio in current prices (Penn World Tables). Controls for low risk of: cross-border conflict, civil disorder, ethnic tensions and war (ICRG, average 1985 -2009) are included but not reported. Instrumental variables for individualism: historical pathogens is the Historical Pathogen prevalence index from Murray and Schaller (2010); blood distance is the Euclidian distance of frequency of blood types A and B in a given country relative to their frequency in the USA. Over-id test p-value reports the p-value for the overidentifying restriction tests that instruments are correctly excluded. Robust standard errors in parentheses. *** p<0.01, ** p<0.05, * p<0.1.

36
TABLE 5. Long-differences regression
Dependent variable: OLS
Huber robust
regression OLS
Huber robust
regression OLS
Huber robust
regression (1) (2) (3) (4) (5) (6) Individualism 0.029 0.033*** 0.039* 0.027*** 0.021 0.018** (0.024) (0.007) (0.021) (0.007) (0.024) (0.007)
log -1.255 0.678** -0.244 0.811*** (1.253) (0.281) (1.149) (0.274)
-1.277 -0.384* (0.945) (0.193)
-0.659*** -0.966*** -0.722*** -0.953*** -0.875*** -0.958*** (0.101) (0.020) (0.102) (0.022) (0.089) (0.022) Observations 70 70 58 58 51 51 R-squared 0.507 0.976 0.631 0.978 0.813 0.982 Notes: The dependent variable is the change in the polity score (source: Polity IV) between 1960 and 2000. Individualism is Hofstede’s index of individualism. A larger value of the index corresponds to a greater level of individualism. is income per worker (source: Penn World Tables). Education: Barro-Lee (2012) primary education enrollment. Huber robust regression automatically identifies and downweighs influential observations/outliers. Robust standard errors in parentheses. *** p<0.01, ** p<0.05, * p<0.1.
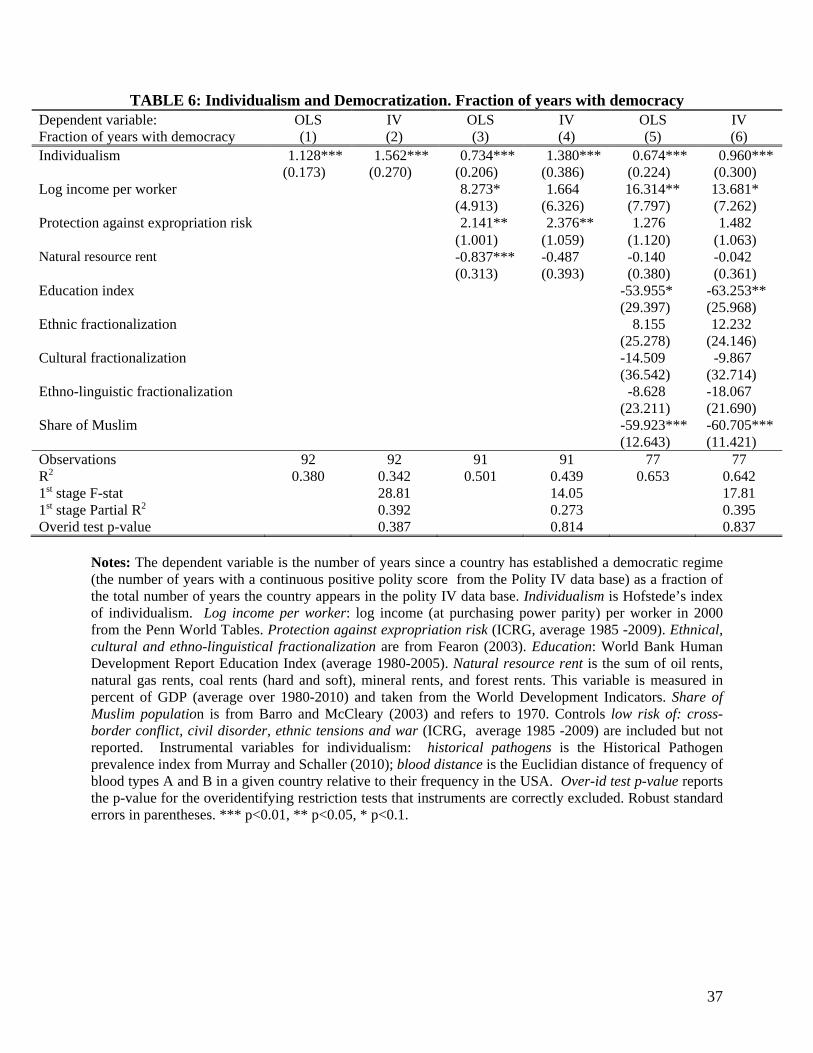
37
TABLE 6: Individualism and Democratization. Fraction of years with democracy Dependent variable: Fraction of years with democracy
OLS IV OLS IV OLS IV (1) (2) (3) (4) (5) (6)
Individualism 1.128*** 1.562*** 0.734*** 1.380*** 0.674*** 0.960*** (0.173) (0.270) (0.206) (0.386) (0.224) (0.300) Log income per worker 8.273* 1.664 16.314** 13.681* (4.913) (6.326) (7.797) (7.262) Protection against expropriation risk 2.141** 2.376** 1.276 1.482 (1.001) (1.059) (1.120) (1.063) Natural resource rent -0.837*** -0.487 -0.140 -0.042 (0.313) (0.393) (0.380) (0.361) Education index -53.955* -63.253** (29.397) (25.968) Ethnic fractionalization 8.155 12.232 (25.278) (24.146) Cultural fractionalization -14.509 -9.867 (36.542) (32.714) Ethno-linguistic fractionalization -8.628 -18.067 (23.211) (21.690) Share of Muslim -59.923*** -60.705*** (12.643) (11.421) Observations 92 92 91 91 77 77 R2 0.380 0.342 0.501 0.439 0.653 0.642 1st stage F-stat 28.81 14.05 17.81 1st stage Partial R2 0.392 0.273 0.395 Overid test p-value 0.387 0.814 0.837
Notes: The dependent variable is the number of years since a country has established a democratic regime (the number of years with a continuous positive polity score from the Polity IV data base) as a fraction of the total number of years the country appears in the polity IV data base. Individualism is Hofstede’s index of individualism. Log income per worker: log income (at purchasing power parity) per worker in 2000 from the Penn World Tables. Protection against expropriation risk (ICRG, average 1985 -2009). Ethnical, cultural and ethno-linguistical fractionalization are from Fearon (2003). Education: World Bank Human Development Report Education Index (average 1980-2005). Natural resource rent is the sum of oil rents, natural gas rents, coal rents (hard and soft), mineral rents, and forest rents. This variable is measured in percent of GDP (average over 1980-2010) and taken from the World Development Indicators. Share of Muslim population is from Barro and McCleary (2003) and refers to 1970. Controls low risk of: cross-border conflict, civil disorder, ethnic tensions and war (ICRG, average 1985 -2009) are included but not reported. Instrumental variables for individualism: historical pathogens is the Historical Pathogen prevalence index from Murray and Schaller (2010); blood distance is the Euclidian distance of frequency of blood types A and B in a given country relative to their frequency in the USA. Over-id test p-value reports the p-value for the overidentifying restriction tests that instruments are correctly excluded. Robust standard errors in parentheses. *** p<0.01, ** p<0.05, * p<0.1.
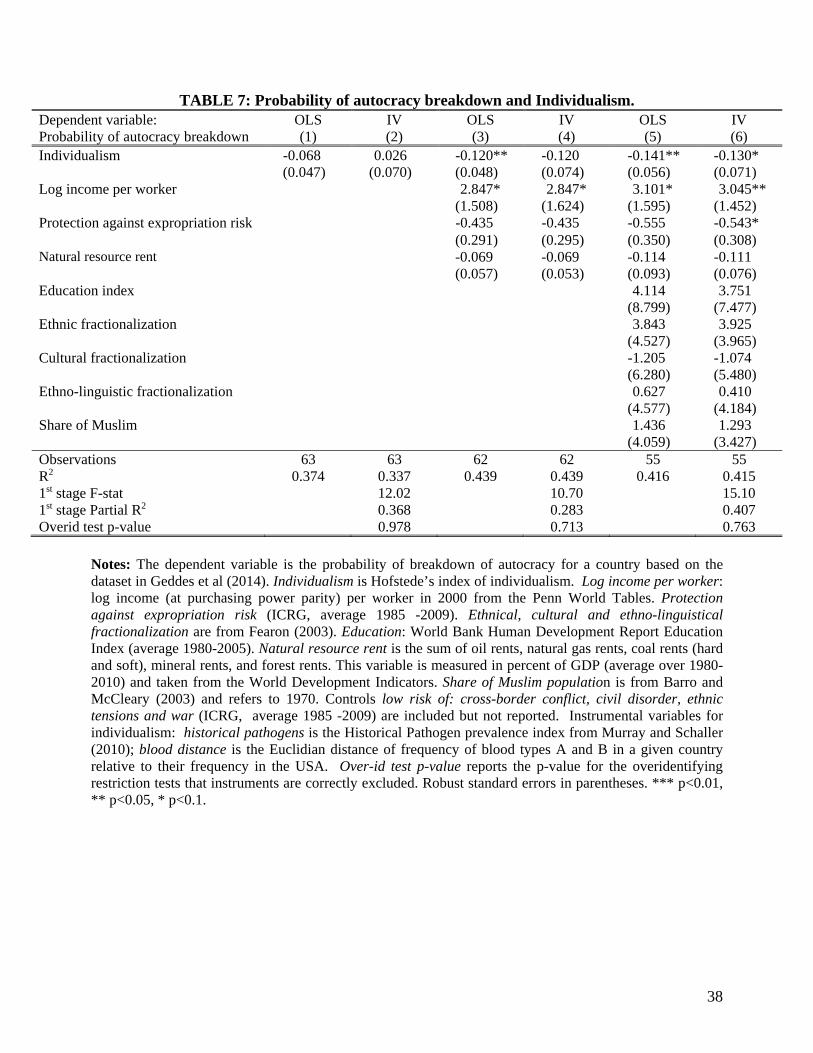
38
TABLE 7: Probability of autocracy breakdown and Individualism. Dependent variable: Probability of autocracy breakdown
OLS IV OLS IV OLS IV (1) (2) (3) (4) (5) (6)
Individualism -0.068 0.026 -0.120** -0.120 -0.141** -0.130* (0.047) (0.070) (0.048) (0.074) (0.056) (0.071) Log income per worker 2.847* 2.847* 3.101* 3.045** (1.508) (1.624) (1.595) (1.452) Protection against expropriation risk -0.435 -0.435 -0.555 -0.543* (0.291) (0.295) (0.350) (0.308) Natural resource rent -0.069 -0.069 -0.114 -0.111 (0.057) (0.053) (0.093) (0.076) Education index 4.114 3.751 (8.799) (7.477) Ethnic fractionalization 3.843 3.925 (4.527) (3.965) Cultural fractionalization -1.205 -1.074 (6.280) (5.480) Ethno-linguistic fractionalization 0.627 0.410 (4.577) (4.184) Share of Muslim 1.436 1.293 (4.059) (3.427) Observations 63 63 62 62 55 55 R2 0.374 0.337 0.439 0.439 0.416 0.415 1st stage F-stat 12.02 10.70 15.10 1st stage Partial R2 0.368 0.283 0.407 Overid test p-value 0.978 0.713 0.763
Notes: The dependent variable is the probability of breakdown of autocracy for a country based on the dataset in Geddes et al (2014). Individualism is Hofstede’s index of individualism. Log income per worker: log income (at purchasing power parity) per worker in 2000 from the Penn World Tables. Protection against expropriation risk (ICRG, average 1985 -2009). Ethnical, cultural and ethno-linguistical fractionalization are from Fearon (2003). Education: World Bank Human Development Report Education Index (average 1980-2005). Natural resource rent is the sum of oil rents, natural gas rents, coal rents (hard and soft), mineral rents, and forest rents. This variable is measured in percent of GDP (average over 1980-2010) and taken from the World Development Indicators. Share of Muslim population is from Barro and McCleary (2003) and refers to 1970. Controls low risk of: cross-border conflict, civil disorder, ethnic tensions and war (ICRG, average 1985 -2009) are included but not reported. Instrumental variables for individualism: historical pathogens is the Historical Pathogen prevalence index from Murray and Schaller (2010); blood distance is the Euclidian distance of frequency of blood types A and B in a given country relative to their frequency in the USA. Over-id test p-value reports the p-value for the overidentifying restriction tests that instruments are correctly excluded. Robust standard errors in parentheses. *** p<0.01, ** p<0.05, * p<0.1.
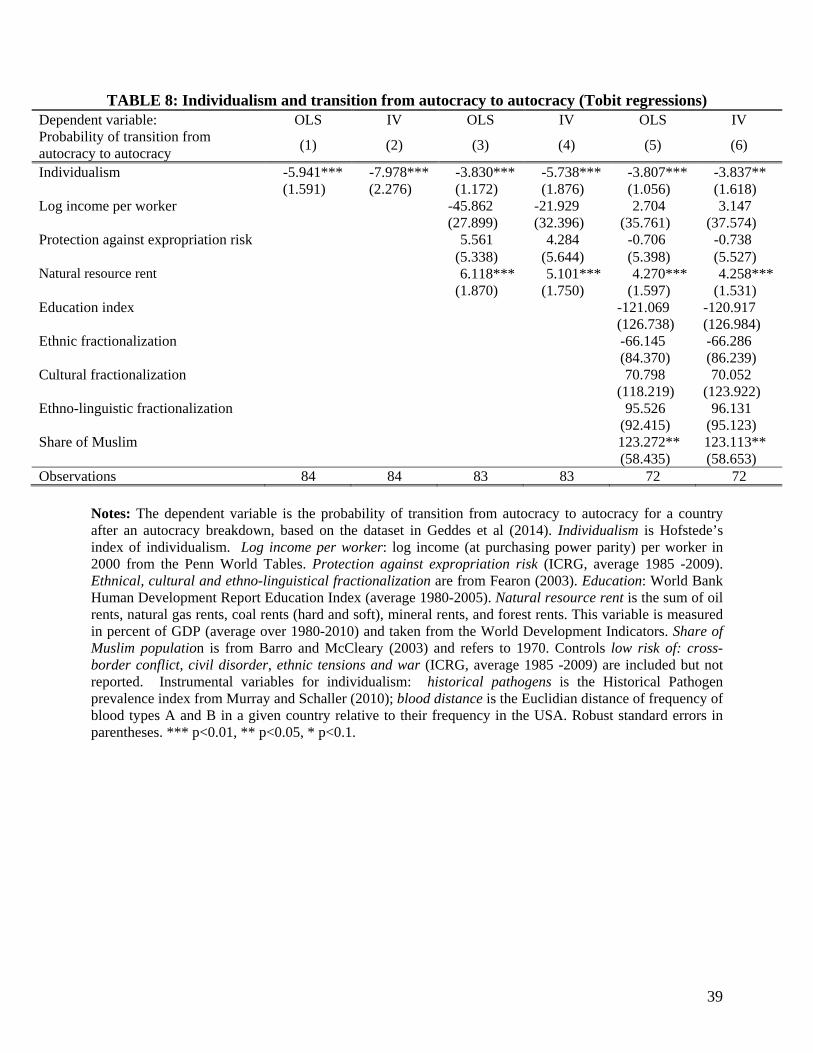
39
TABLE 8: Individualism and transition from autocracy to autocracy (Tobit regressions) Dependent variable: Probability of transition from autocracy to autocracy
OLS IV OLS IV OLS IV
(1) (2) (3) (4) (5) (6)
Individualism -5.941*** -7.978*** -3.830*** -5.738*** -3.807*** -3.837** (1.591) (2.276) (1.172) (1.876) (1.056) (1.618) Log income per worker -45.862 -21.929 2.704 3.147 (27.899) (32.396) (35.761) (37.574) Protection against expropriation risk 5.561 4.284 -0.706 -0.738 (5.338) (5.644) (5.398) (5.527) Natural resource rent 6.118*** 5.101*** 4.270*** 4.258*** (1.870) (1.750) (1.597) (1.531) Education index -121.069 -120.917 (126.738) (126.984) Ethnic fractionalization -66.145 -66.286 (84.370) (86.239) Cultural fractionalization 70.798 70.052 (118.219) (123.922) Ethno-linguistic fractionalization 95.526 96.131 (92.415) (95.123) Share of Muslim 123.272** 123.113** (58.435) (58.653) Observations 84 84 83 83 72 72
Notes: The dependent variable is the probability of transition from autocracy to autocracy for a country after an autocracy breakdown, based on the dataset in Geddes et al (2014). Individualism is Hofstede’s index of individualism. Log income per worker: log income (at purchasing power parity) per worker in 2000 from the Penn World Tables. Protection against expropriation risk (ICRG, average 1985 -2009). Ethnical, cultural and ethno-linguistical fractionalization are from Fearon (2003). Education: World Bank Human Development Report Education Index (average 1980-2005). Natural resource rent is the sum of oil rents, natural gas rents, coal rents (hard and soft), mineral rents, and forest rents. This variable is measured in percent of GDP (average over 1980-2010) and taken from the World Development Indicators. Share of Muslim population is from Barro and McCleary (2003) and refers to 1970. Controls low risk of: cross-border conflict, civil disorder, ethnic tensions and war (ICRG, average 1985 -2009) are included but not reported. Instrumental variables for individualism: historical pathogens is the Historical Pathogen prevalence index from Murray and Schaller (2010); blood distance is the Euclidian distance of frequency of blood types A and B in a given country relative to their frequency in the USA. Robust standard errors in parentheses. *** p<0.01, ** p<0.05, * p<0.1.

40
APPENDIX

41
Appendix Table A1. Timing and sources of the variables used in the paper. Variable Sources Timing Individualism, Power distance, Masculinity, Uncertainty Avoidance, Long-term orientation
Hosftede (2001), subsequent updates are available on http://geert‐hofstede.com
The initial wave of individualism scores were constructed in the 1960s for about 30 countries. Additional countries were added gradually over time.
Frequency of blood types Cavalli-Sfoza, Menozzi, Piazza (1994), Mourant, Kopec and Domaniewska-Sobczak (1976), Tills, Kopec, and Tills (1983)
Most data on the frequencies of blood types comes from 1940s and 1950s.
Output per worker Penn World Tables (PWT) We use year 2000 (from Penn World Table) in the baseline.
Ethnic shares Fearon (2003)
Early 1990s
Historical pathogen prevalence
Murray and Schaller (2010), Fincher et al. (2008)
Early-to-mid 20th century
Protection against expropriation risk
International Country Risk Guide (ICRG)
Average value for 1985-2019.
Trust World Values Survey
An average value across multiple waves since 1980s
Natural resource rent World Development Indicators, measured in percent of GDP
Average value over the 1980-2010 period
Share of Muslim in population
Barro and McLeary (2003) 1970
Education index Human Development Report Average value over the 1980-2005 period
Openness Penn World Tables (PWT) 2000
Gini coefficient Standardized World Income Inequality Database
Median value over the 1960-2010 period
Democracy score Polity IV Average value over the 1980-2010 period
Fraction of years in democracy
Polity IV, fraction of years with positive Polity IV scores
1950-2004
Probability of autocracy breakdown, probability of transition from autocracy to autocracy
Geddes et al. (2014) 1946-2010
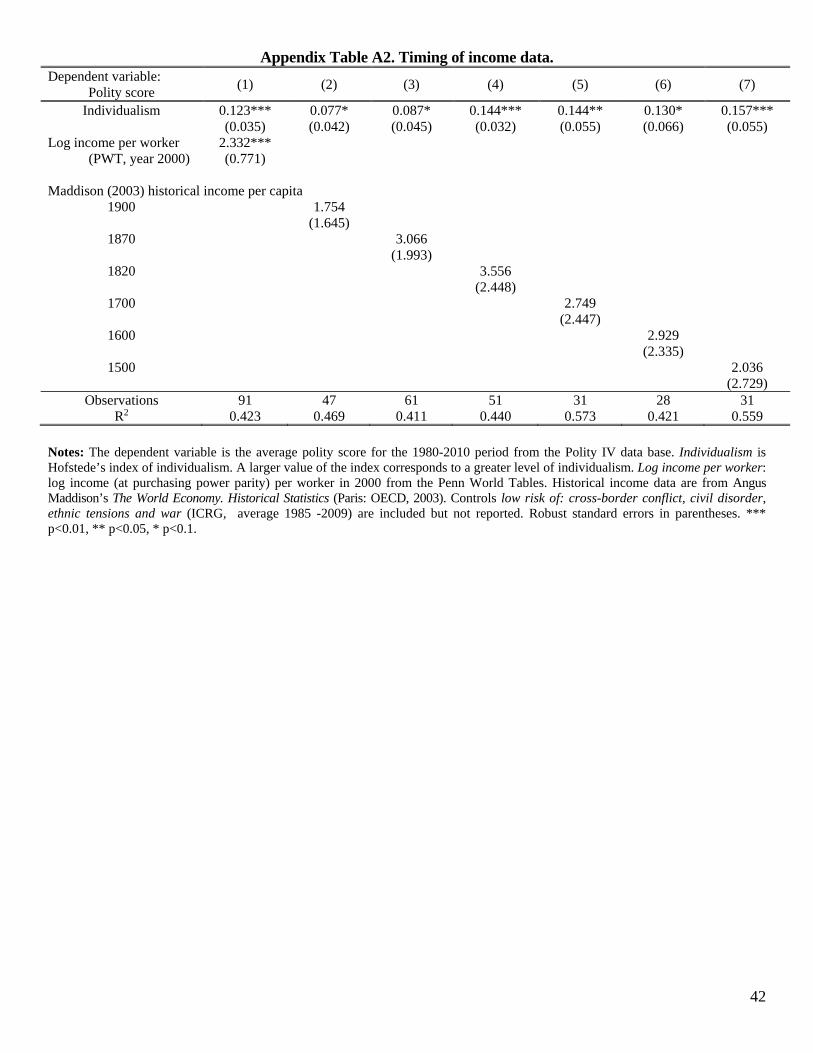
42
Appendix Table A2. Timing of income data. Dependent variable:
Polity score (1) (2) (3) (4) (5) (6) (7)
Individualism 0.123*** 0.077* 0.087* 0.144*** 0.144** 0.130* 0.157*** (0.035) (0.042) (0.045) (0.032) (0.055) (0.066) (0.055)
Log income per worker (PWT, year 2000)
2.332*** (0.771)
Maddison (2003) historical income per capita
1900 1.754 (1.645)
1870 3.066 (1.993)
1820 3.556 (2.448)
1700 2.749 (2.447)
1600 2.929 (2.335)
1500 2.036 (2.729)
Observations 91 47 61 51 31 28 31 R2 0.423 0.469 0.411 0.440 0.573 0.421 0.559
Notes: The dependent variable is the average polity score for the 1980-2010 period from the Polity IV data base. Individualism is Hofstede’s index of individualism. A larger value of the index corresponds to a greater level of individualism. Log income per worker: log income (at purchasing power parity) per worker in 2000 from the Penn World Tables. Historical income data are from Angus Maddison’s The World Economy. Historical Statistics (Paris: OECD, 2003). Controls low risk of: cross-border conflict, civil disorder, ethnic tensions and war (ICRG, average 1985 -2009) are included but not reported. Robust standard errors in parentheses. *** p<0.01, ** p<0.05, * p<0.1.