Embed Size (px)
Citation preview

(c) Murray Turoff 2000 1
IS Management Introduction and Issues
CIS 679 Management of Information System
New Jersey Institute of Technology First Set of Notes for course
© Copyright 2000 Murray Turoff

(c) Murray Turoff 2000 2
First Set: Table of Contents
Management Challenges & Issues Specific Management Functions Forecasting Methods IS Issues Overview Historical IS Background
(c) Murray Turoff 2000 3
Management of IS wisdom
Learn the signals of problems Act to minimize mistakes based upon
signals No rules only understandings work Be aware of alternatives and what is going
on externally as well as internally Be both a risk taker and a risk avoider Be flexible, calm, recognize talent and
advance it Don’t build empires
(c) Murray Turoff 2000 4
Management IS Problems I
New generations 3-7 years Hardware & Software
Highly skilled people Short supply Highly priced Too specialized Too many unskilled Mavericks Rapid Obsolescence
Rapid cost changes Relative bases Declining & Increasing

(c) Murray Turoff 2000 5
Management problems II
Shifting applications Clerical automation Office automation Management information Decision support Strategic relevance Collaborative Systems
Foreign vocabulary to users MIS, GDSS, AI, VR, CMC, Expert
Systems
(c) Murray Turoff 2000 6
Management problems III
Multiple objectives Tradeoffs (not optional)
Reductionism training & approaches Difficult to deal with or see forest
Changing management wisdom No recipes Management rules change
Scope, Size & Complexity
(c) Murray Turoff 2000 7
Grand management issues for IS
MIS quarterly, December 1991, June 1996
Delphi study Every four years IS executives
Chief Information Officers (CIO) 200 – 300 participated

(c) Murray Turoff 2000 8
Rank order of issues I
1991 original ranking (#), 1996 issue 1. Developing information
architecture, (6) 2. Effective use of data resource,
Facilitating and Managing Business Process Redesign
3. Improving IS strategic planning, (13)
4. Specifying, recruiting, and developing IS human resources, (1)
5. Facilitating organizational learning and use of IS technologies, (10).
(c) Murray Turoff 2000 9
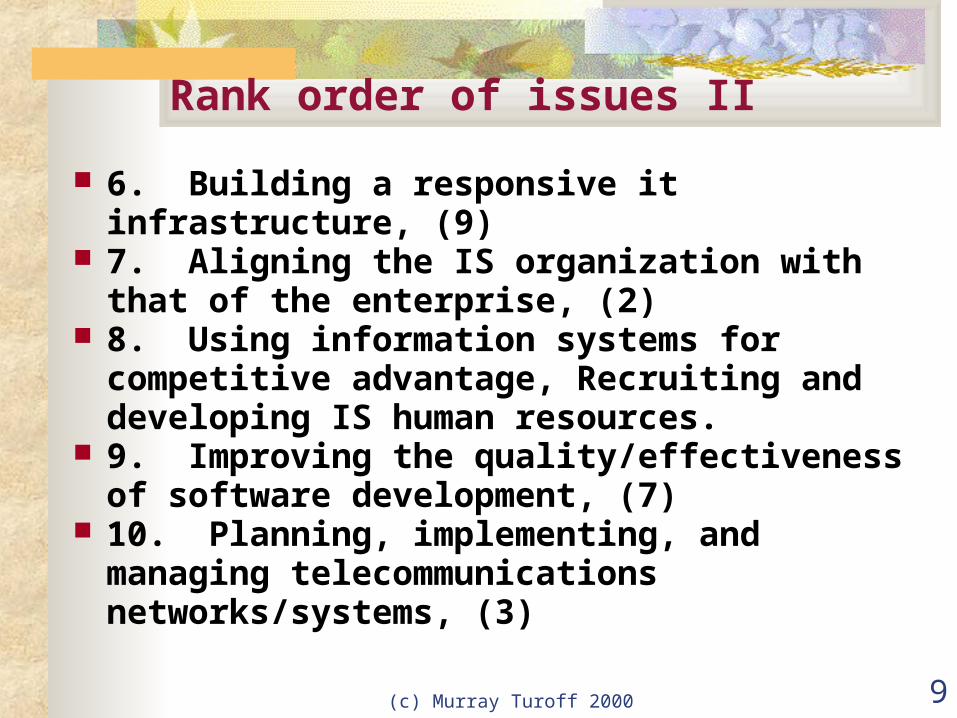
Rank order of issues II
6. Building a responsive it infrastructure, (9)
7. Aligning the IS organization with that of the enterprise, (2)
8. Using information systems for competitive advantage, Recruiting and developing IS human resources.
9. Improving the quality/effectiveness of software development, (7)
10. Planning, implementing, and managing telecommunications networks/systems, (3)
(c) Murray Turoff 2000 10
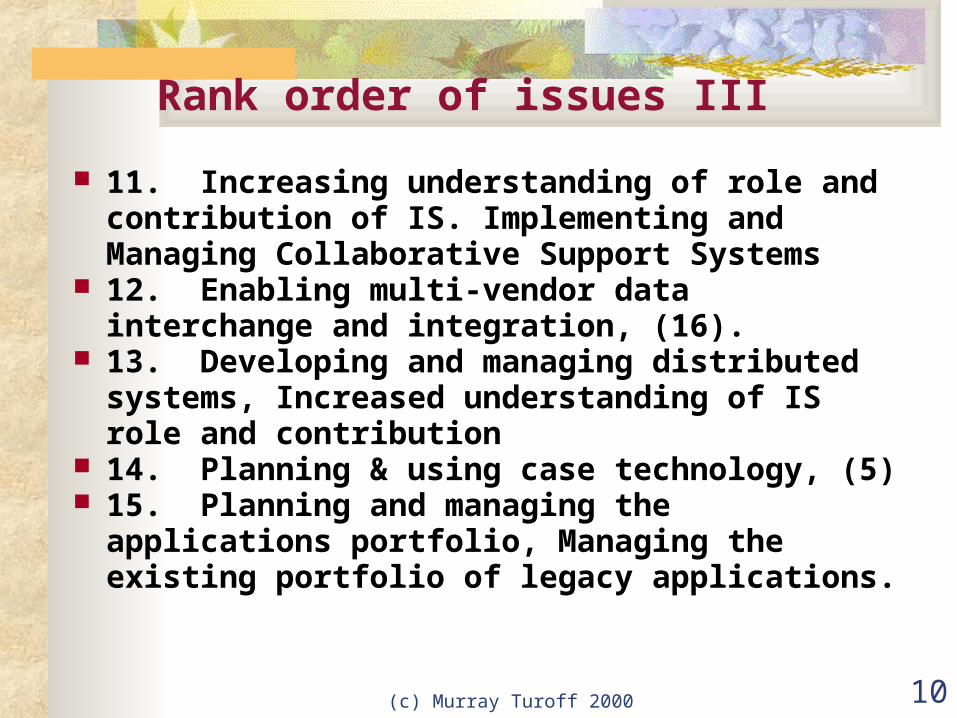
Rank order of issues III
11. Increasing understanding of role and contribution of IS. Implementing and Managing Collaborative Support Systems
12. Enabling multi-vendor data interchange and integration, (16).
13. Developing and managing distributed systems, Increased understanding of IS role and contribution
14. Planning & using case technology, (5) 15. Planning and managing the
applications portfolio, Managing the existing portfolio of legacy applications.
(c) Murray Turoff 2000 11
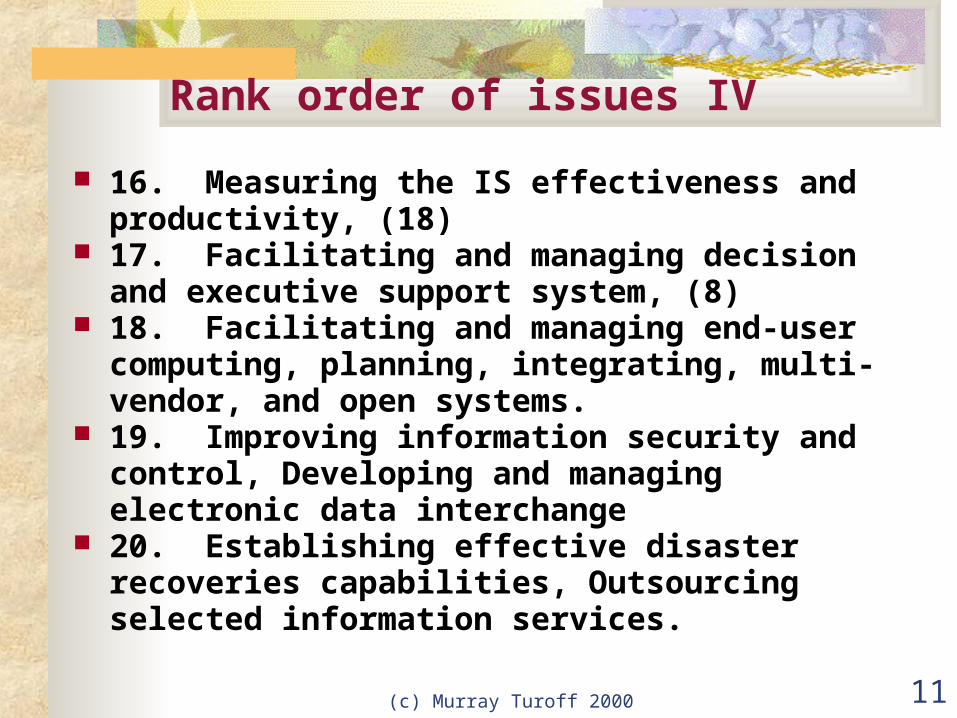
Rank order of issues IV
16. Measuring the IS effectiveness and productivity, (18)
17. Facilitating and managing decision and executive support system, (8)
18. Facilitating and managing end-user computing, planning, integrating, multi-vendor, and open systems.
19. Improving information security and control, Developing and managing electronic data interchange
20. Establishing effective disaster recoveries capabilities, Outsourcing selected information services.

(c) Murray Turoff 2000 12
1. Data resources
1991 Information architecture* Data resource*
* indicates it made both the 1991 and the 1996 lists
(c) Murray Turoff 2000 13
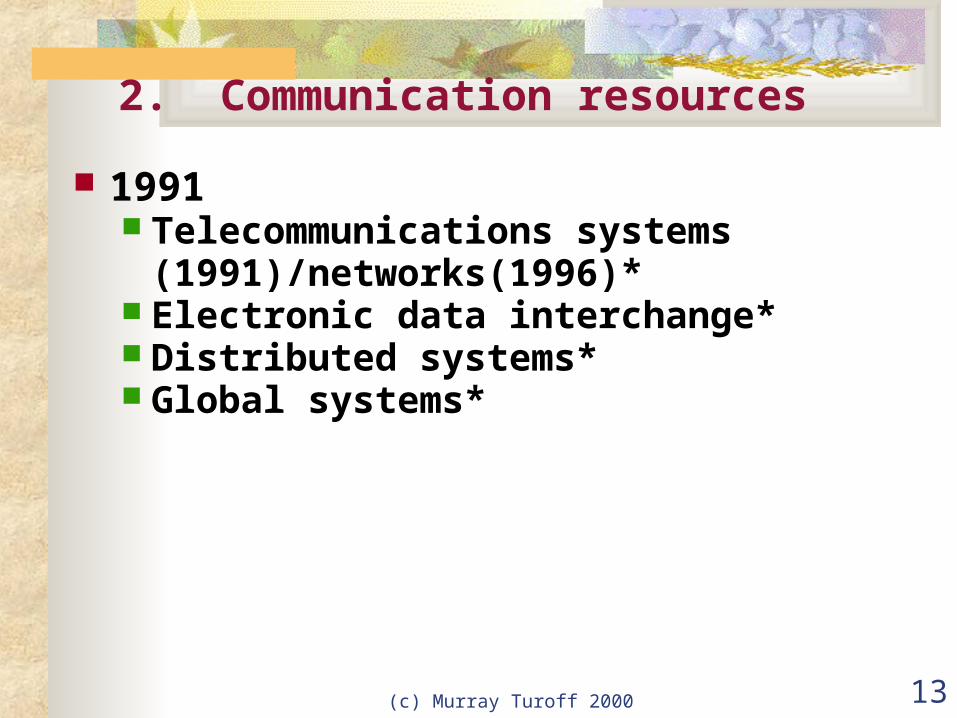
2. Communication resources
1991 Telecommunications systems
(1991)/networks(1996)* Electronic data interchange* Distributed systems* Global systems*
(c) Murray Turoff 2000 14
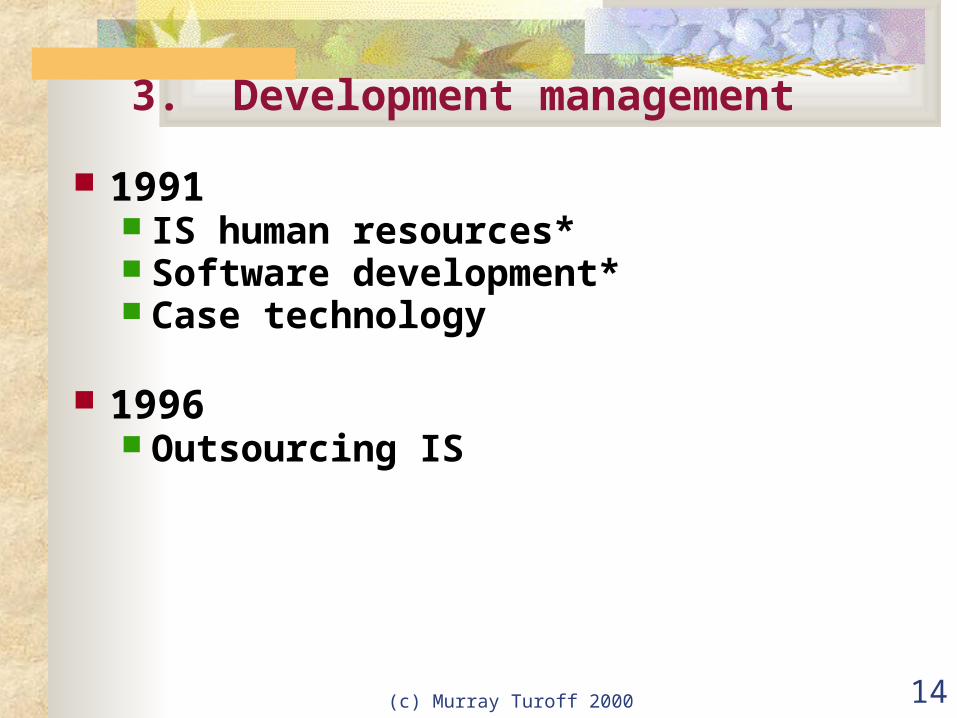
3. Development management
1991 IS human resources* Software development* Case technology
1996 Outsourcing IS

(c) Murray Turoff 2000 15
4. Planning
1991 IS role and contribution* Strategic planning* IS organization/enterprise
alignment* IS asset accounting IS effectiveness (1991)/quality
measurement(1996)*
1996 Business process redesign Organizational learning

(c) Murray Turoff 2000 16
5. Applications management
1991 Applications portfolio Organizational learning Competitive advantage (old
business/new business)* End-user computing* Executive/decision support
1996 Legacy applications

(c) Murray Turoff 2000 17
6. Cost control
1991 Security and control Disaster recovery
1996 None
This signaled the new technology cycle where costs are very secondary starting in 1995.

(c) Murray Turoff 2000 18
7. Technology management
1991 Technology infrastructure Image technology Technology islands
1996 Collaborative Systems Vendor integration/open systems

(c) Murray Turoff 2000 19
Major constant management concerns
Applications management Technology management Development management Planning Cost control Data resources Communication resources
What do you think are the three top issues in each category today?
(c) Murray Turoff 2000 20
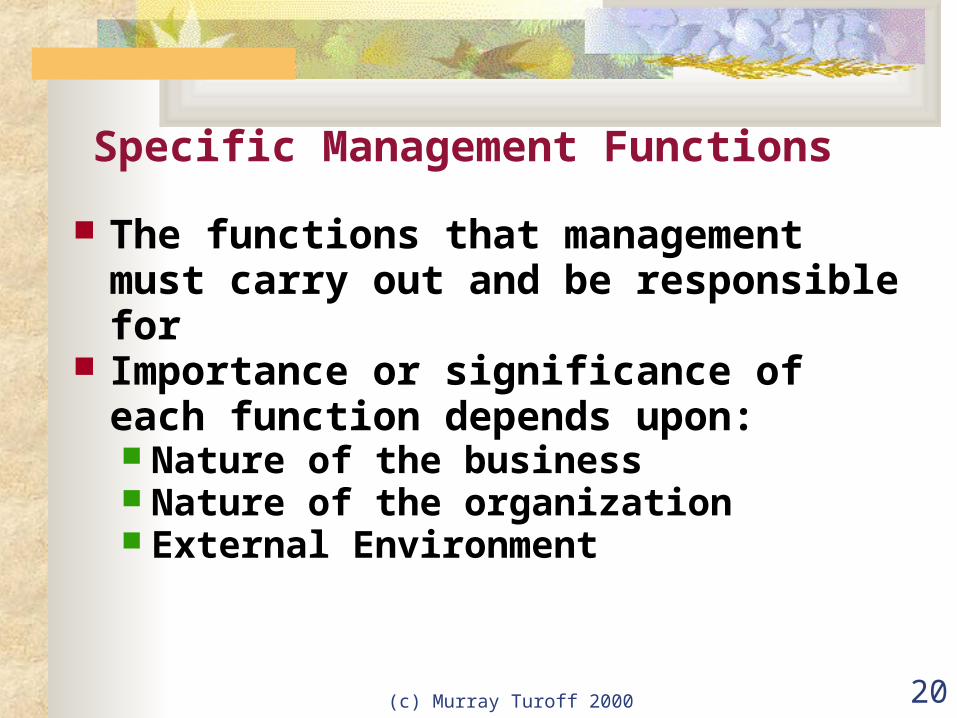
Specific Management Functions
The functions that management must carry out and be responsible for
Importance or significance of each function depends upon: Nature of the business Nature of the organization External Environment

(c) Murray Turoff 2000 21
Major management functions
Surveillance Evaluation Planning Forecasting & assessment Policy formulation & analyses Development & implementation Maintenance & operations General management
(c) Murray Turoff 2000 22
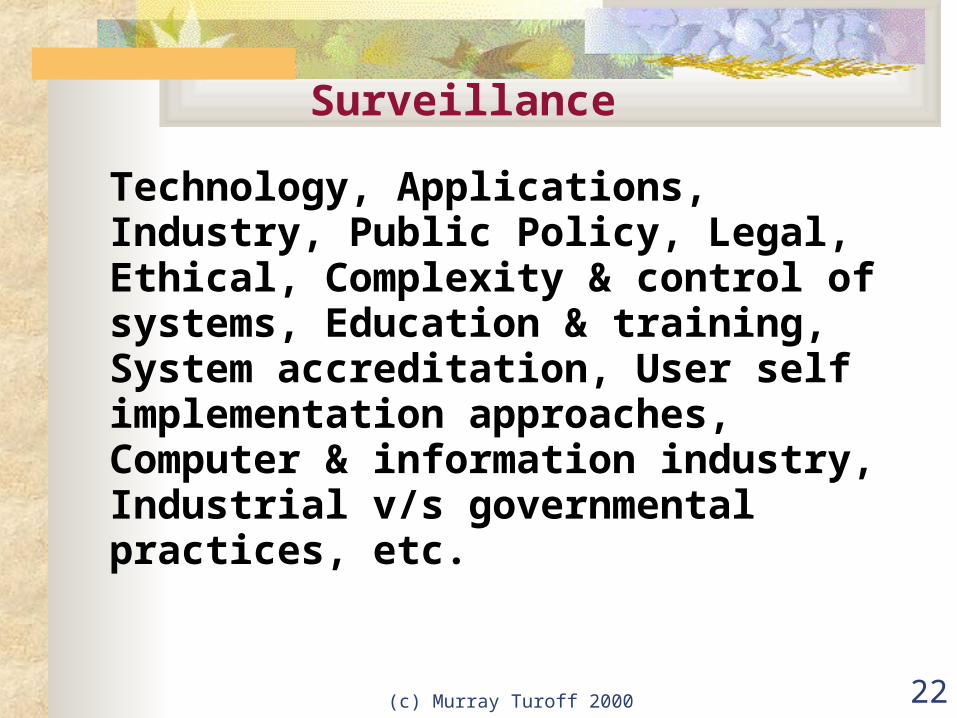
Surveillance
Technology, Applications, Industry, Public Policy, Legal, Ethical, Complexity & control of systems, Education & training, System accreditation, User self implementation approaches, Computer & information industry, Industrial v/s governmental practices, etc.
(c) Murray Turoff 2000 23
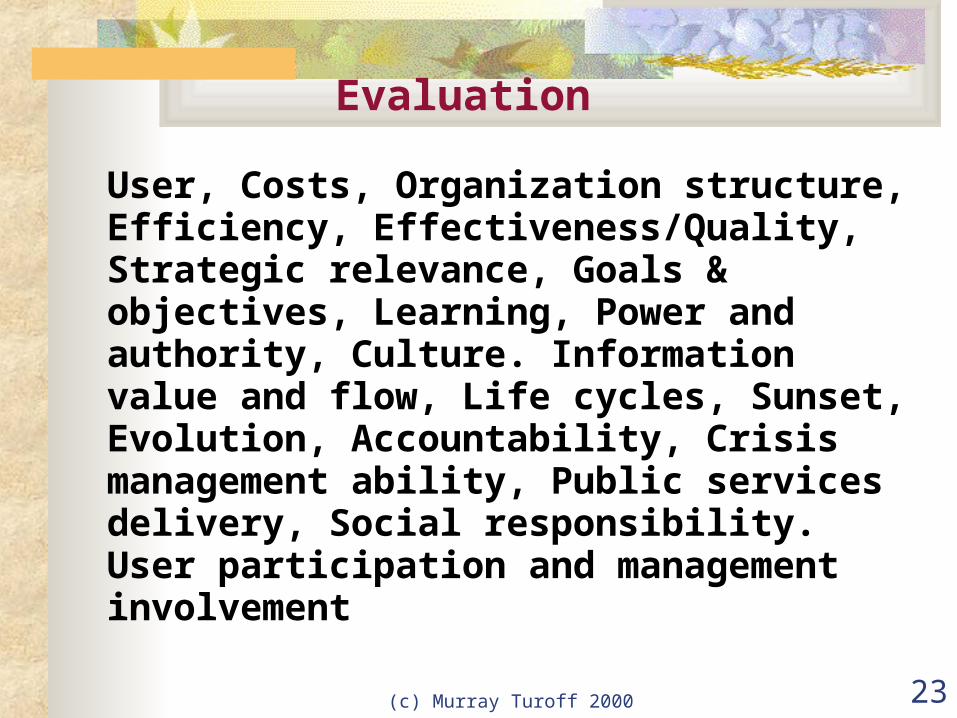
Evaluation
User, Costs, Organization structure, Efficiency, Effectiveness/Quality, Strategic relevance, Goals & objectives, Learning, Power and authority, Culture. Information value and flow, Life cycles, Sunset, Evolution, Accountability, Crisis management ability, Public services delivery, Social responsibility. User participation and management involvement
(c) Murray Turoff 2000 24
Planning
IS and organizational objectives, Long range approaches, Measures of planning effectiveness, System obsolescence, System evolution, Acquisitions, Hardware, Systems interconnection, Manpower needs, Short term/long term, Normative approaches, etc.
(c) Murray Turoff 2000 25
Forecasting & Assessment
Hardware, software, and service performance and costs, Vendor offerings, Networks, Regulation and liability, Applications, Markets, Technology, Industry change & overlap (e.g. ecommerce, communications), Computer crime, Exports & imports, Employment demands, Technology performance, Computer literacy and training, Vendor evaluation, Electronic marketplace

(c) Murray Turoff 2000 26
Policy formulation & analyses I
Standards, Privacy & information rights, Paperwork reduction, Database quality and duplication, Records and performance compliance, Liability, Ownership, Remote work, Impact of metaphors, Technology transfer, Public access to information systems, Top management involvement, People, Organizational, Technology, or System obsolescence

(c) Murray Turoff 2000 27
Policy Formulation and Analysis II
Organizational structure, Centralized vs. Decentralized, End user computing, Steering committees, Acquisition policies, Life cycle analysis, ZBB analysis, Sunset analysis, Strategic relevance, Labor & job impacts, Productivity & Quality

(c) Murray Turoff 2000 28
Development & implementation
User acceptance and involvement, Prototyping systems, Evolutionary & modular approaches, Estimations & overruns, Programming productivity, Requirements definition, Validation & verification, Conversion, Auditing, Off the shelf software, Role of research & development
(c) Murray Turoff 2000 29
Maintenance & operations
Software performance measurement, Structured design & programming, Benchmarks, Quality & data assurance, Security & disaster recovery, Reliability, Obsolescence detection, Saturation detection, Conversion, Auditing, Services contracting, System acceptance testing, Operational user feedback
(c) Murray Turoff 2000 30
Management
Personnel Classification, Pay, Moral. Certification,
Mobility, Training & continuing education, Adequacy & demand, Turnover
Decentralization, End user computing. Life cycle costing, Productivity measurement, Software engineering & standards, Interface systems design & standard, Programming support technology, Multiple vendor systems, Management Span, Accountability,

(c) Murray Turoff 2000 31
(c) Murray Turoff 2000 32
Forecasting Methods and Examples
Can be done with a great deal of accuracy on the right variables
Extrapolation for 2 to 5 years as long as no structural (technology, social system, organizational, industrial, governmental) changes.
Normative for longer periods like 10-15 years.
5-10 considered the “no man’s land” of forecasting in computer field
Time scale of change decreasing
(c) Murray Turoff 2000 33
Forecasting Methods
Single trend extrapolation Growth Analogy (limit or not) Substitution Subjective estimations Personal judgment Genius & Expert Opinion Consensus & Focus Group Delphi Normative Techniques
(c) Murray Turoff 2000 34
Trend Analysis
Linear Regression Analysis Good as long as no substitution
process taking place. Easy if data is available Must discover any underlying
models for confidence. Should look at confidence limits Speed of Computers, memory size Cost verses quantity of product

(c) Murray Turoff 2000 35
Number of Transistors per Die(symbols reversed)
(c) Murray Turoff 2000 36
Moore’s Law
Computing Power grows 100 times every 10 years at state of the art!
Or costs of total systems go down by a factor of 10 every 10 years
Logarithmic relationships of performance or costs.
Year Dollars1955 10,000,0001965 1,000,0001975 100,0001985 10,0001995 1,000

(c) Murray Turoff 2000 37
Costs modified by performance and adjusted for inflation

(c) Murray Turoff 2000 38
Technical Progress Function
T = A(X)**B T = The value of the technological
parameter X = the cumulative production
quantity A = a constant associated with unit
number one B = the rate of progress associated
with the external environment. Log(T) = B*log(X) + log(A) (linear
form)
(c) Murray Turoff 2000 39
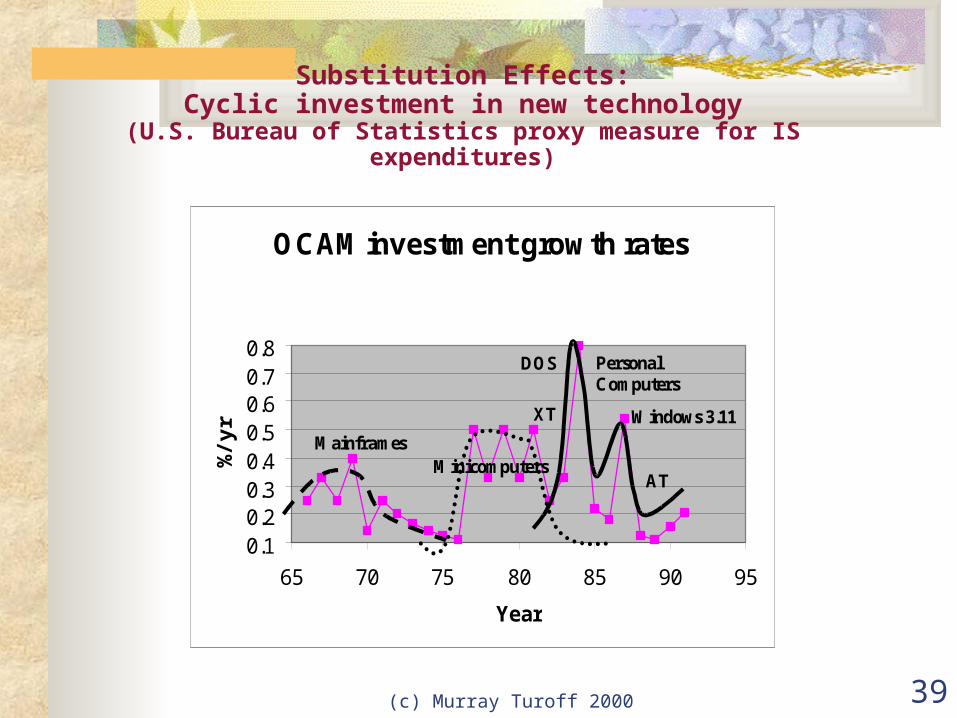
Substitution Effects:Cyclic investment in new technology
(U.S. Bureau of Statistics proxy measure for IS expenditures)
OCAM investment growth rates
0.10.20.30.40.50.60.70.8
65 70 75 80 85 90 95
Year
%/y
r
Minicomputers
PersonalComputers
XT
AT
DOS
Mainframes
Windows 3.11
(c) Murray Turoff 2000 40
Technical Progress Alternative Functions
Could be costs instead of technology parameter.
Costs go down and performance goes up with quantity of production.
Learning curve: Efficiency in performing the Nth task is the same function of the cumulative task number.
(c) Murray Turoff 2000 41
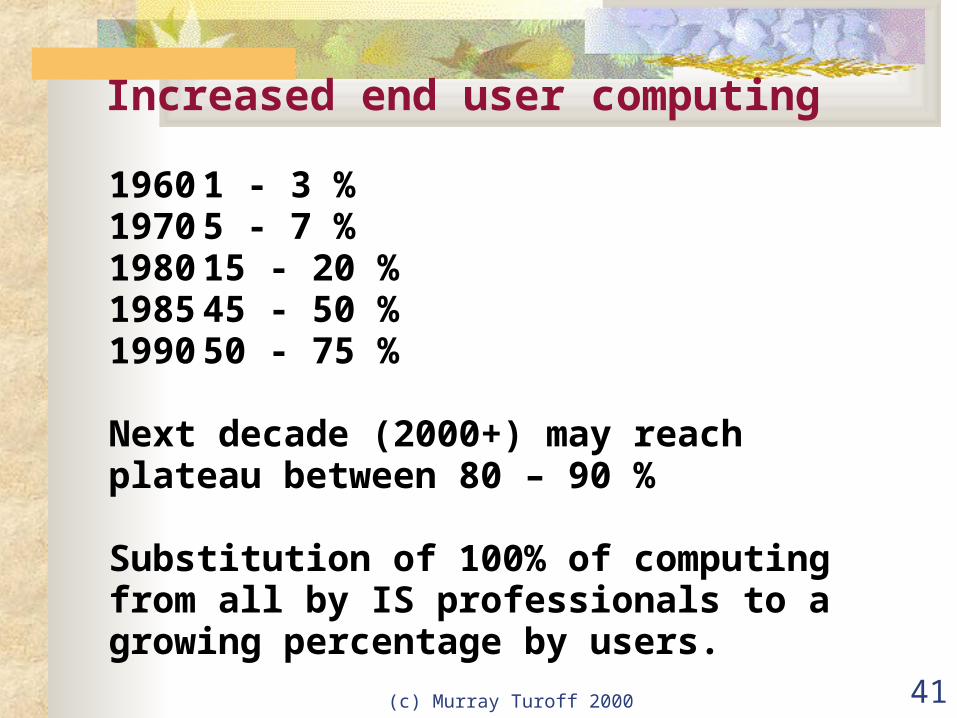
Increased end user computing
1960 1 - 3 %1970 5 - 7 %1980 15 - 20 %1985 45 - 50 %1990 50 - 75 %
Next decade (2000+) may reach plateau between 80 – 90 %
Substitution of 100% of computing from all by IS professionals to a growing percentage by users.
(c) Murray Turoff 2000 42
Growth Analogy
Initial cell/invention Cell division/Inventive Process Cell division period/time between
inventions Nutrient media/Economic support Cell lifetime/Useful live of
invention Cell Death/Obsolescence Cell mass/Technical area Volume limit of mass/Limit on
demand

(c) Murray Turoff 2000 43
Growth Curves
Birth and rapid initial adoption Steady growth over initial period Heading toward a limit which
should be known Turnover with age Light efficiency of incandescent
lamps Use Perl (logistic) curve and
Gompertz curve
(c) Murray Turoff 2000 44
Substitution
Growth Curve to 100% of market Water based paints for oil based;
Percentage of plastic in automobiles, synthetic rubber for natural rubber.
Good for measuring technical substitution.
Usually 15% substitution sufficient for projecting rest of curve.
Three and higher substitutions possible

(c) Murray Turoff 2000 45
Substitution Example
The substitution of fiberglass & plastic for wood in personal boats
Data taken from the yearly London Boat Show (1950-1970)
Number of boats of each type exhibited as ratio to total number
Results is a clear substitution curve Indirect and imaginative data
collection a characteristic of good forecasters
Often direct data unobtainable
(c) Murray Turoff 2000 46
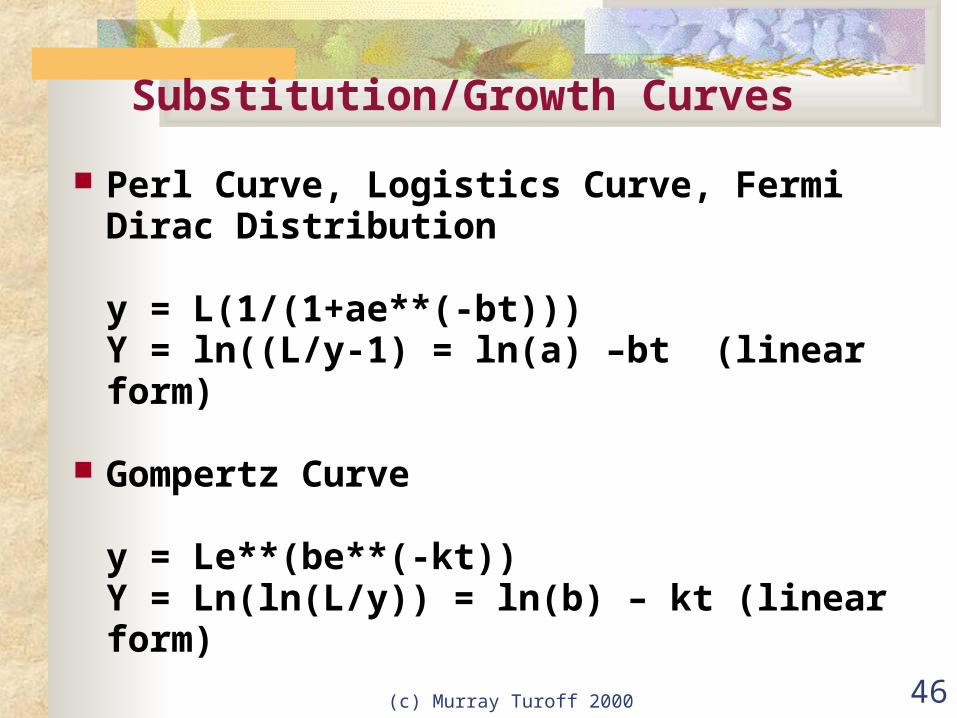
Substitution/Growth Curves
Perl Curve, Logistics Curve, Fermi Dirac Distribution
y = L(1/(1+ae**(-bt)))Y = ln((L/y-1) = ln(a) –bt (linear form)
Gompertz Curve
y = Le**(be**(-kt))Y = Ln(ln(L/y)) = ln(b) – kt (linear form)
(c) Murray Turoff 2000 47
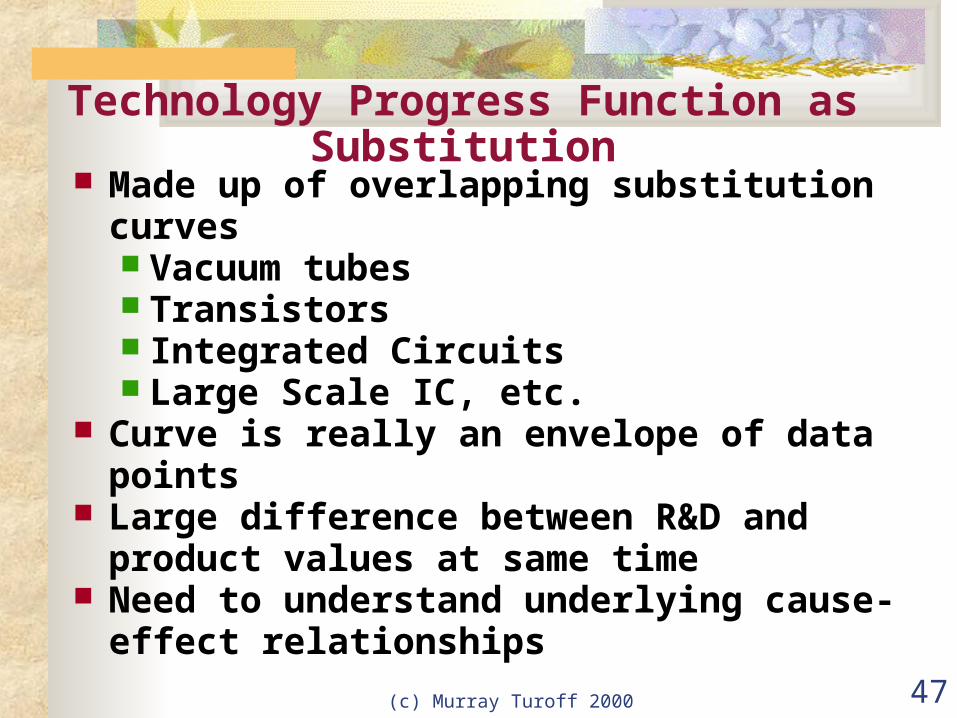
Technology Progress Function as Substitution
Made up of overlapping substitution curves Vacuum tubes Transistors Integrated Circuits Large Scale IC, etc.
Curve is really an envelope of data points
Large difference between R&D and product values at same time
Need to understand underlying cause-effect relationships
(c) Murray Turoff 2000 48
Extrapolation Exercise
Find a useful IS data set with ten or more historical points.
Draw this curve and extrapolate five years or more into the future either by hand or analytically
Explain what the primary causes are of the trend and if there is any substitution processes taking place
Explain a situation where it would be useful for a management decision
(c) Murray Turoff 2000 49
Single Subjective Estimates
Personal judgment As good as data, models and
information to back it up Expert Opinion As many examples of wrong ones
as right ones by experts. Xerox, Video text, Picture Phone,
X.400
(c) Murray Turoff 2000 50
Some interesting forecasts
1953 IBM estimates market for only 50 computers in U.S. with IBM 650
1969 GE management claims BASIC is useless
1975 HP rejects idea of personal computer
1979 Tandy expects to sell only 4,000 portable computers

(c) Murray Turoff 2000 51
Group Subjective Estimates
If well structured can lead to more reliable results
Normal committee approaches often suffer from biases
Focus Groups and/or Delphi recommended
(c) Murray Turoff 2000 52
Forecasting Delphi Round One
Provide historical curve Ask for:
Future projection Assumptions used Uncertainties that would cause
change if true
Example: amount of sales of a product. Assumptions & uncertainties:
Modifications, competitors actions, government policies, economic conditions, etc.
(c) Murray Turoff 2000 53
Forecasting Delphi Round Two
Turn all into potential assumptions One persons assumption is
another’s uncertainty Ask for vote on validity:
Certain, Likely, Maybe, Unlikely, False
Show 50 % spread of projections

(c) Murray Turoff 2000 54
Forecasting Delphi Round Three
Show ordered assumption Focus on Maybe range Ask for modifications to original
projection Ask for significance of impact Determine actions organization
can take to force internal assumptions
Determine measures of external assumptions
(c) Murray Turoff 2000 55
Forecasting Delphi Round Four
Determine desirability and feasibility of actions
Determine usability of measures Round five for significant
disagreements
(c) Murray Turoff 2000 56
Results of Trend Delphi
A projection which might not differ from a regression analysis
A collaborative model of the groups reasons (assumptions) for the projection
A collaborative model of all the factors that could change the forecast
A plan for: Trying to influence the outcome Monitoring for surprise changes from
external sources

(c) Murray Turoff 2000 57
Modeling Delphi of Steel Industry
Flow diagram by three experts 45 flow of material legs between
different processes in the industry Only 15 legs reported in yearly data
40 other experts (planners) asked to fill in missing data for prior year Not asked to do anything else 25 decided to modify the model
because they did not agree with it being the “best” model for them
Modeling Delphis need more exploration

(c) Murray Turoff 2000 58
Normative Approaches
Set objectives Work backwards from the future Build scenarios and models Reverse engineering Reverse of extrapolation
approaches

(c) Murray Turoff 2000 59

(c) Murray Turoff 2000 60
IS Issues Overview
General background on IS Themes that underlie almost every
area of IS management

(c) Murray Turoff 2000 61
Negative impacts of computers I
Job displacement Job deskilling Increased specialization
Decrease mobility Decreased authority Increased centralization Rigidity (lack of resiliency) Scapegoating
(c) Murray Turoff 2000 62
Negative impacts of computers II
Efficiency rather than effectiveness
Ends rather than means Unanticipated consequences
Inventory & message systems Over structuring and over
qualifying Over expectation Privacy, monitoring and moral Not meant for mortals, Godhood
(c) Murray Turoff 2000 63
Negative impacts of computers III
Escape (drunkard’s paradox) Creating templates (prescriptive) Substitution of unreal for real Sub-optimization Prior bad decisions & experiences Status symbols Unfriendly Cold
(c) Murray Turoff 2000 64
Typical conflicts in IS I
Centralization or decentralization Prescriptive or descriptive Effectiveness or efficiency Process, incentives or goals Development or purchase Outsourcing and contracting or in-
house

(c) Murray Turoff 2000 65
Typical conflicts in IS II
Privacy, security, and/or access Qualitative or quantitative Specialization or generalization Extrapolative or normative
Planning IMS or MIS, MIS or DSS, IS or MIS
(c) Murray Turoff 2000 66
Roots of MIS
Well structured problems Central database Model of the firm Computer Science Information Science Operations Research General approach/DBMS
(c) Murray Turoff 2000 67
Roots of DSS
Unstructured problems Tailored data and models Management science Industrial engineering Each problem unique User centered approach Toolkits
(c) Murray Turoff 2000 68
Centralization properties I
Overhead more obvious Distribute to users
Subsidize application development Subsidize technology acquisition Share expensive resources
People, software Equipment, network Data models

(c) Murray Turoff 2000 69
Centralization properties II
More talent & sophistication Vulnerable to budget limits Concentrate authority &
accountability Maintaining standards &
guidelines Job security and advancement Recognition of need for innovation Communication problems with
users Conflicting objectives with users
(c) Murray Turoff 2000 70
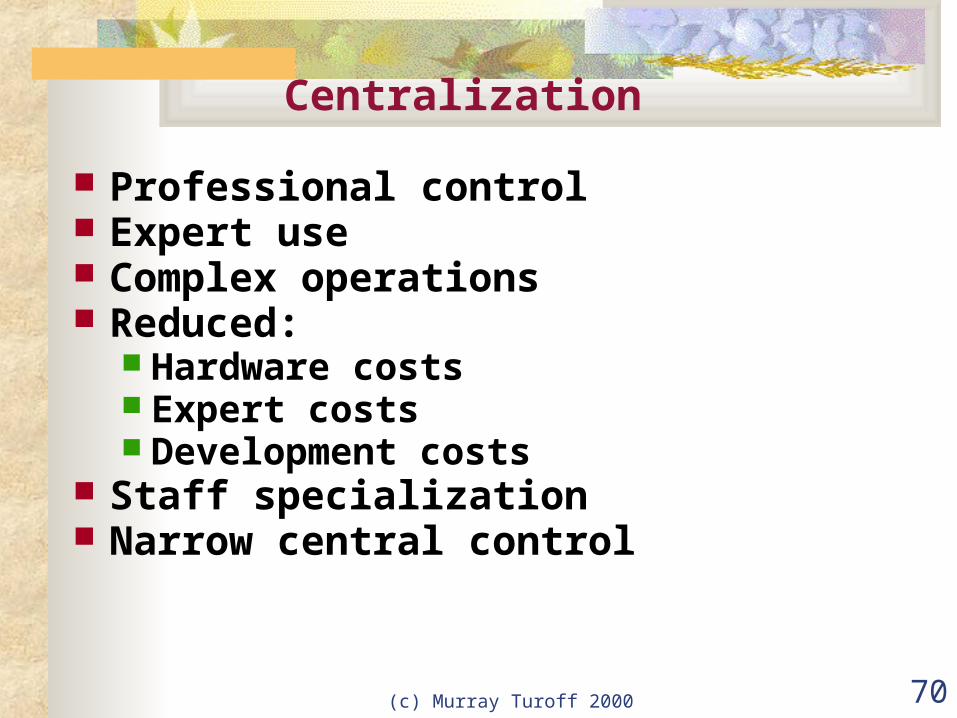
Centralization
Professional control Expert use Complex operations Reduced:
Hardware costs Expert costs Development costs
Staff specialization Narrow central control
(c) Murray Turoff 2000 71
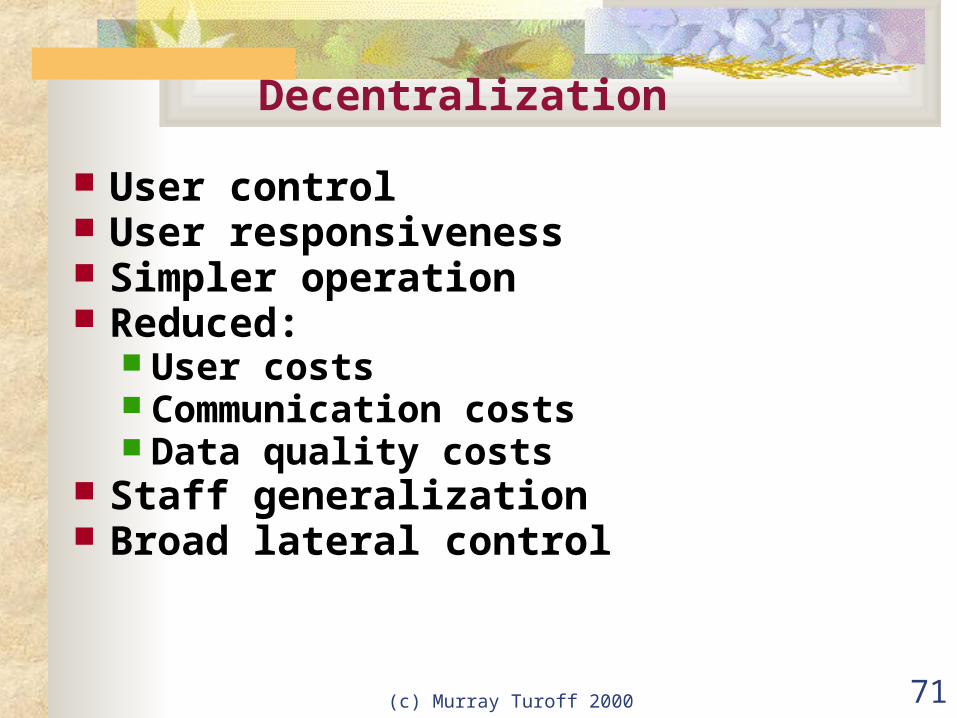
Decentralization
User control User responsiveness Simpler operation Reduced:
User costs Communication costs Data quality costs
Staff generalization Broad lateral control

(c) Murray Turoff 2000 72
Necessary Centralization
Databases for necessary data Can be outsourced
Communications Can be outsourced
Standards and Policies Plans Evaluation

(c) Murray Turoff 2000 73
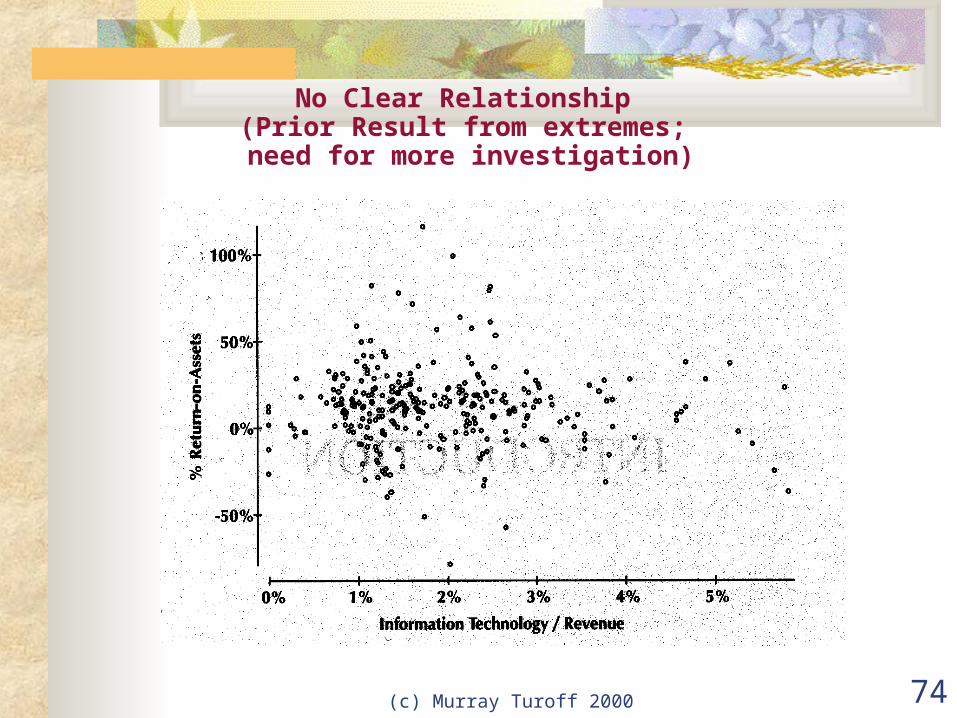
Productivity Statistical study (Strassmann)
Hundred of companies 20 years For same industry
Low profitability companiesHigh investment in computersLower profitability
High profitability companiesHigh investment in computersHigher profitability
Solve people & organizational problems first
Contrary to computer industry advice
(c) Murray Turoff 2000 74
No Clear Relationship(Prior Result from extremes; need for more investigation)

(c) Murray Turoff 2000 75
Performance specifications
IBM & Baltimore school system 2.9 million for PC’s & software If after 2 years:
First graders meet national average reading scores
IBM gets payment If not sale negated
Never saw the results of this Suspect it might not have turned
out well

(c) Murray Turoff 2000 76
Averages vs. actual
US economy annual growth rates1947-1992 (from Brynjolfsson & Hitt, 19xx)
0.0%
1.0%
2.0%
3.0%
4.0%
5.0%
6.0%
47-53 53-57 57-60 60-66 66-69 69-73 73-79 70-85 85-92
45-92 avg. growth rate=3.42% per year
(c) Murray Turoff 2000 77
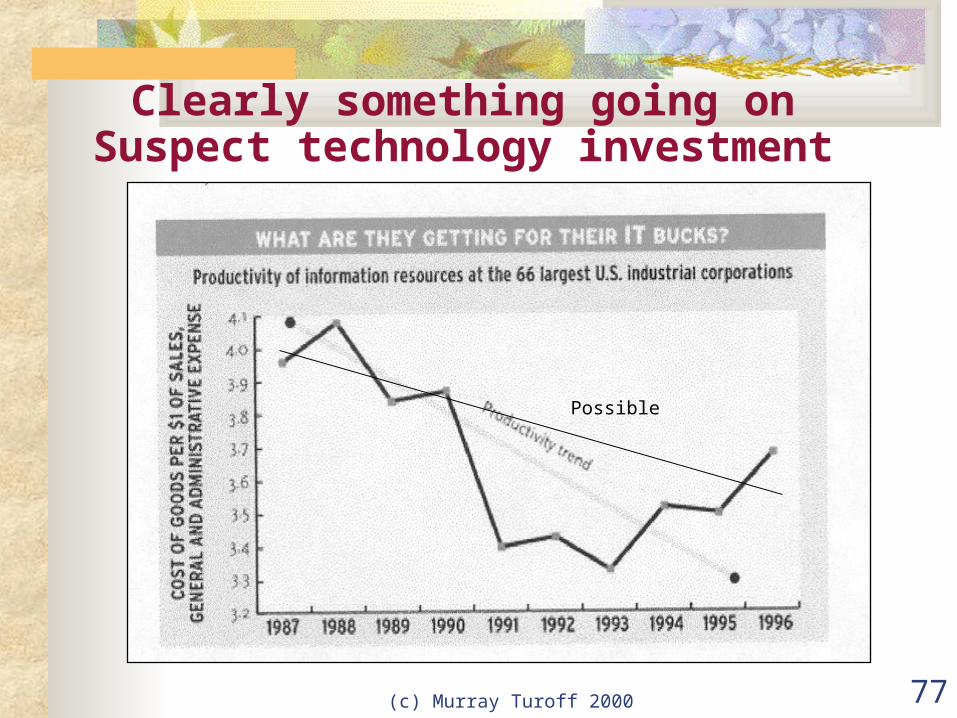
Clearly something going onSuspect technology investment
Possible
(c) Murray Turoff 2000 78
Successful IS policies I
Link IS with business strategy Visible & active support from
senior management Change culture & structure of
organization Invest in people and their
developments

(c) Murray Turoff 2000 79
Successful IS policies II
Disciplined project management & accountability
Multi disciplinary design teams Sound methods for monitoring and
reviewing progress Emphasis on spreading benefits
through organization Uniform methods for review &
evaluation
(c) Murray Turoff 2000 80
Counter productive effects
Invasion of personal privacy Monitoring of work.
Drunker’s paradox Quantity not quality
Ergonomics ignored Training and guidance ignored
(c) Murray Turoff 2000 81
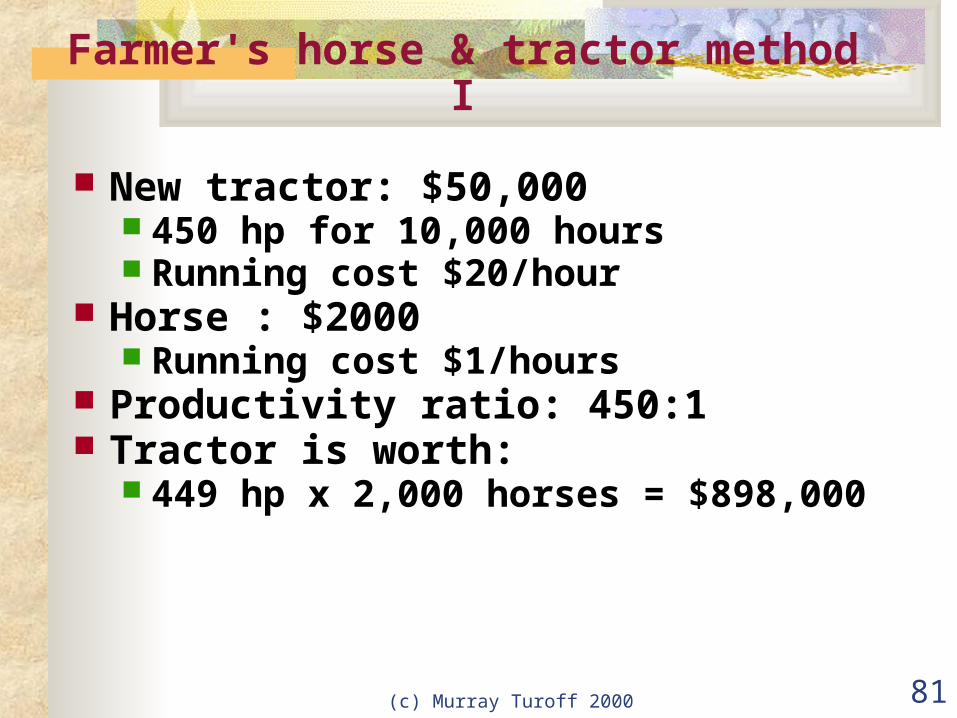
Farmer's horse & tractor method I
New tractor: $50,000 450 hp for 10,000 hours Running cost $20/hour
Horse : $2000 Running cost $1/hours
Productivity ratio: 450:1 Tractor is worth:
449 hp x 2,000 horses = $898,000

(c) Murray Turoff 2000 82
Farmer's horse & tractor method II
Operating advantage: 450 horses x 10,000 hours x $1/hour
minus 10,000 hours x $20/hour equal
$4,300,000 Total: $5,198,000 gain for only $50,000
When can you deposit the five million to pay off the loan?
Note lack of relationship to size and nature of farm
Correct view: Value of computer is what you are
willing to pay for the results.

(c) Murray Turoff 2000 83
IS observations
IS subject to overall situation Profits, plans, atmosphere Culture, management style, moral
No relationship between IS investment and business success
No easy, standard way to measure payoff of IS
Easy to manipulate results of IS IS costs migrate to hidden areas
(c) Murray Turoff 2000 84
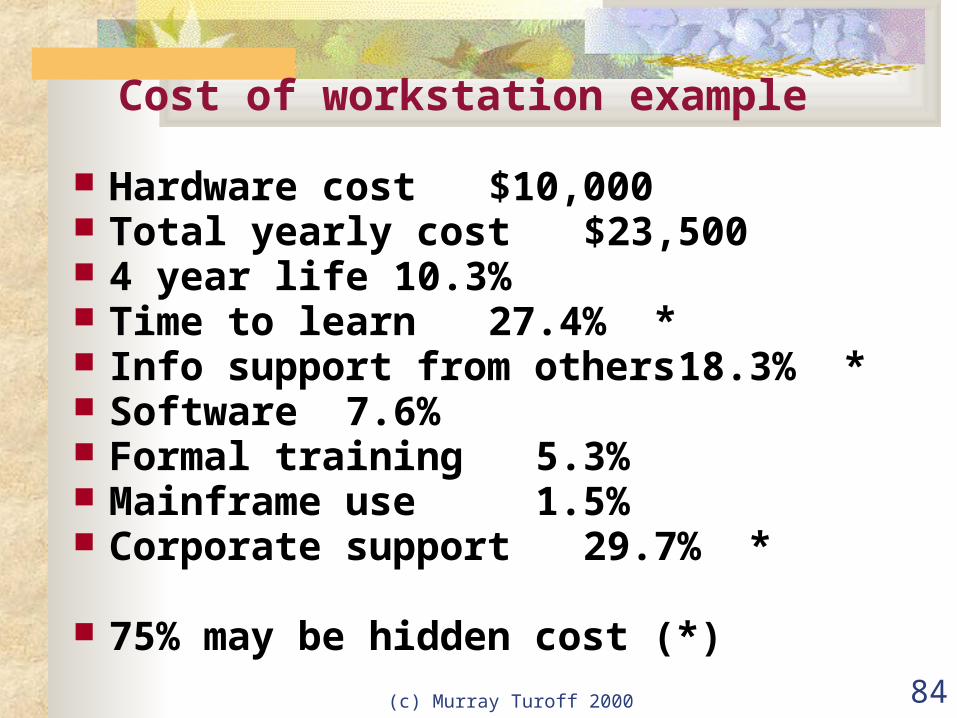
Cost of workstation example
Hardware cost $10,000 Total yearly cost $23,500 4 year life 10.3% Time to learn 27.4% * Info support from others 18.3% * Software 7.6% Formal training 5.3% Mainframe use 1.5% Corporate support 29.7% *
75% may be hidden cost (*)
(c) Murray Turoff 2000 85
Turoff’s Cycle Model
No Maturity ever reached (Nolan Model)
No constant state (Cash Model) Explains CIO job tenure (~5-7
years) Minimum Mistakes Darwin process

(c) Murray Turoff 2000 86
Management Historical cycle I
Risk taker brought in as CIO New technology investment Encourage applications Gain competitive edge Effectiveness emphasis Cost growth and runaway Power acquisition by IS
Fire CIO

(c) Murray Turoff 2000 87
Management Historical cycle II
Risk avoider brought in as CIO Cost control instituted Efficiency emphasis Inhibit innovation Limit new applications/technology Loss of competitive edge
Fire CIO Pragmatic view of management
No excuse for failure The end result determines
managers capabilities Return to prior cycle

(c) Murray Turoff 2000 88
Real management alternatives
Dead end investments in hardware or modular systems development
Assembly line or job enrichment? Hidden cost or realistic life cycle
costs? Organizational dinosaur or beyond
centralization/decentralization? Invasion of new technology or
socio-technical design? Occupational obsolescence or new
concepts of work and job?

(c) Murray Turoff 2000 89
(c) Murray Turoff 2000 90
Historical IS Background
(c) Murray Turoff 2000 91
Early IS images
Priest & wisdom Ritual & language Shrines & temples Cures & salvation Omnipotent Beyond mortal understanding
(c) Murray Turoff 2000 92
Computer system fallacies
Usage as acceptance Automation Black boxing Centralization Performance maximization Cost minimization Efficiency Descriptive only Reductionism Scientific & logical
(c) Murray Turoff 2000 93
Human impression fallacies
What the computer says is always true Garbage in is garbage out
The computer is too complicated to understand
We are only automating what you are doing now
We cannot change the way the computer does it
It is the computers fault not ours Drunkard’s paradox
(c) Murray Turoff 2000 94
IS prior determinants
Structured tasks Handling “necessary” data
What is the value of necessary data?
Cost minimizing Expensive hardware Cheap people Automating Organizational support

(c) Murray Turoff 2000 95
IS new determinants
Expensive people Cheap hardware Performance maximization New uses Handling unnecessary data with
finite value. Handling subjective data Individual support Unstructured tasks Communications

(c) Murray Turoff 2000 96
Knowledge areas related to IS I
Computer Science Information Science Management Science Operations Research Industrial Engineering Communication Science (media) Electrical engineering

(c) Murray Turoff 2000 97
Knowledge areas related to IS II
Economics Psychology Sociology Anthropology English Cybernetics Systems Science Mathematics
(c) Murray Turoff 2000 98
Changes past, present, & future
Work in a home office Robots to do housework Robots to eliminate assembly line jobs Take a college course from home Having a computer diagnose your illness Have a computer operate on you Purchase food, home, car through the
computer Banking and investment through the
computer Love and friendship through a computer Wear a computer Use a personal avatar to represent you
(c) Murray Turoff 2000 99
Impressions of computers
Smart stupid Friendly unfriendly Forgiving unforgiving Controlled uncontrolled Easy to use hard to use Easy to change hard to change
(c) Murray Turoff 2000 100
Atmosphere
Human Computer Slow Rapid Sloppy Rigorous Forgetful Precise Brilliant Stupid
How to design a communication between the two?

(c) Murray Turoff 2000 101
Information domains of users I
Common IS support levels Simple inquiry, calculations,
messaging Organizing, filtering, summarizing Status briefing, report generation Tracking, monitoring
(c) Murray Turoff 2000 102
Information domains of users II
Current individual challenges Exception reporting Modeling, structuring, relating Searching, retrieval Diagnosis Discovery Hypothesis testing and analysis
Current group challenges Planning and decision analysis Decision implementation Command and control
(c) Murray Turoff 2000 103
Industry shifts I
Information & publishing going electronic
Computers doing & offering communications
Communications & broadcasting offering computer & information services
Financial institutions offering computer and communication service
(c) Murray Turoff 2000 104
Industry shifts II
Communications offering financial services
Education increasingly offered by industry
Lines blurring between Information, Publishing, Computers, Communications, Broadcasting, Finance & Investment, Education, Training, Retailing, Services, Brokering

(c) Murray Turoff 2000 105
E Commerce Integration I
Offer opportunities Classified ads
Newspapers Broadcasters Publishers
Negotiate exchanges Communications
Phone companies Mails
Contract & liability Legal services
(c) Murray Turoff 2000 106
E Commerce Integration II
Clear funds Banking
Tax analysis Accounting
CPA firms Regulatory factors:
Federal reserve board Federal communications commission Congress, state legislator State regulatory bodies, courts
Web/E Money is key
(c) Murray Turoff 2000 107
Relative cost changes
People more than hardware Paper more than electronic storage Communications more than
computers Changing data more than fixed data Regulation & policies can delay
economic driven change but not prevent it in a world economy Example: Look at recent history of
phone companies
(c) Murray Turoff 2000 108
Technology evolution I
Large machines Batch operation Multi-programming Language development Time sharing Mini-computers User oriented languages Computer networks

(c) Murray Turoff 2000 109
Technology evolution II
Distributed systems Personal computers User developed systems Expert systems Case methodology Networking users & systems Workstation technology Multi-media Personal Networks
(c) Murray Turoff 2000 110
Application evolution
Administrative applications Report systems Data bases MIS & DSS Simulation & modeling AI & expert systems Office automation Networks Groupware Toolkits Operating system interfaces (GUI) Structural modeling

(c) Murray Turoff 2000 111
Major application examples
Payroll systems Inventory systems Linear programming Critical path scheduling Manufacturing processing &
control Statistical analysis (e.g.
marketing) Transaction processing systems The Web & Communications

(c) Murray Turoff 2000 112
Costs 1960's
Hardware 90% People 10% Make software Free systems Centralization Utilities Application development
(c) Murray Turoff 2000 113
Costs 1970's
Cost minimization Application justification Centralization data collection Top down system design Promise of IS to control operations
(c) Murray Turoff 2000 114
Costs 1980's
Hardware 10% People 90% Buy software Office automation Decentralization End user computing Get rid of IS empire Reduce explicit costs
(c) Murray Turoff 2000 115
Costs 1990's
Hardware and software 20% People 40% Information 40% Tailor software Value of information Balance of functions Data & communications Cognitive variability

(c) Murray Turoff 2000 116
Costs Future
Hardware and software 20% People 60% Information 20% Creation and organization of
information Decline of fixed data in value Collective intelligence abilities
(c) Murray Turoff 2000 117
Typical Evolution I
Expansion Under utilization Do everything
Cost cutting Control Political reactions
Maturity End user computing Steering committees
Strategic Toolboxes Tied to corporate goals Distributed systems Communications
(c) Murray Turoff 2000 118
IS Management Issues
Remote work Work at home Lateral project groups Multiple work roles Standards & policies Quality measurement Prototyping Evaluation Evolution User involvement
(c) Murray Turoff 2000 119
Factors generating IS demand I
Rapid evolution of technology Penetration to end users Multitude of alternatives Changing skill levels Quantification of office functions Fragmented organizational
responsibilities Psychological and social impacts
(c) Murray Turoff 2000 120
Factors generating IS demand
Environmental constraints Time, travel, costs Information as a commodity More complexity Dispersion of operations Social pressures
(c) Murray Turoff 2000 121
Individual level considerations
Decision accountability Remote work Specialization/generalization Skills & learning Alienation/connectiveness Superconnectivity & Information
Overload
(c) Murray Turoff 2000 122
Problem areas I
Privacy Tracking of individuals Diverse sources of data Detection of values Value of a name
Job displacement Specialization Ownership of information
Copyrights Protectionism Proprietary

(c) Murray Turoff 2000 123
Problem areas II
Overlapping industries Computers Information (publishing) Communication Financial
Complexity of systems EFT, social security IRS, FBI, Census
Size of system Integration, decomposition
Automation Training
(c) Murray Turoff 2000 124
Areas of concern
Public understanding Education Information rights Industry structure Rate of change
(c) Murray Turoff 2000 125
Trends of concern
Specialization Centralization Measurement Mobility Reductionism Sub-optimization
(c) Murray Turoff 2000 126
Understanding the art of computing
Reducing a single complex problem to a large number of simple problems
Inconsistent with process, incentive and goal orientations
Inconsistent with understanding users and organizations
(c) Murray Turoff 2000 127
Environmental Factors I
Future trends in computer & communications technology
Shortening time intervals for change
Complexity of problems Increasing information based work
force Attitude of younger generations
(c) Murray Turoff 2000 128
Environmental Factors II
Costs of people & services Increasing relative costs of energy Networking as a social technology The underground economy Personal computing and bulletin
board systems

(c) Murray Turoff 2000 129
Current Management Wisdom I
Centralized core DP staff Separate systems analyses Separate maintenance User groups & involvement Application programmers Evolutionary design
(c) Murray Turoff 2000 130
Current Management Wisdom II
Distributed equipment Feedback approaches Steering committees Networks & End user computing Strategic & operational systems Standards & integration Evaluation & evolution
(c) Murray Turoff 2000 131
THE END CIS 679 Management Information Systems Introduction and Issues The first set http://eies.njit.edu/[email protected]


![Stephen Turoff - Sedam Koraka Do Vjecnosti[1]](https://img.pdfslide.net/doc/110x75/577cdcdf1a28ab9e78ab9f66/stephen-turoff-sedam-koraka-do-vjecnosti1.jpg)