Embed Size (px)
Citation preview
S O C I E D A D E J E M P L O S L
C O M PA N Y R E P O R T
+34 902 599 222
Paseo de la Castellana 95
Pl 16 28046 Madrid
wwwinfoempresacom
3
4
5
6
7
9
10
11
12
15
19
28
1 - EXECUTIVE SUMMARY
2 - COMPANY INFORMATION
3 - CREDIT REVIEW AND RISK ANALYSIS
4 - ACTIVITY
5 - COMMERCIAL INFORMATION
6 - DIRECTORS
7 - DOMAINS
8 - LEGAL INCIDENTS AND BANKRUPTCY
9 - FINANCIAL STATEMENTS - INFOEMPRESA FORMAT
10 - ECONOMIC AND FINANCIAL COMMITTEE
11 - ANNUAL ACCOUNTS - BUSINESS REGISTER FORMAT
12 - ASNEF EMPRESAS
T A B L E O F C O N T E N T S
S O C I E D A D E J E M P L O S L | C O M P A N Y R E P O R T
W W W I N F O E M P R E S A C O M 02
ENABLE WAT CHS O C I E DAD E J E M P LO S L +
E X E C U T I V E S U MMA R Y
G E N E R A L D E T A I L S
Company name SOCIEDAD EJEMPLO SL
Commercial status Active
NIF (Spanish Tax ID Number) B000000000
Registered office PASEO DE LA CASTELLANA NUMERO 95
(MADRID)
Telephone +34 910000000
Website Not informed
Legal form Limited Liability Company (SL)
Date of Establishment 18022009
Sector Other services related to information
technologies and computer science
Borme acts See complete list
N O F I N A N C I A L
B O R R O W I N G C A P A C I T Y
C O M M E R C I A L C R E D I T R E V I E W
HIG H
RISK
OPERATE
WITH CAUTION
MODERATE
RISK
GOOD
CREDIT
QUALITY
EXCELLENT
CREDIT
QUALITY
WE RECOMMEND THAT YOU DO NOT SUPPORT CREDIT
OPERATIONS
The
default risk is
VERY HIGH
The
bankruptcy risk is
VERY HIGH
E c o n o m i c a n d fi n a n c i a l s t r u c t u r e
Assets
Liabilities
Equity
134 M682 M
-548 M
8034F I N A N C I A L I N D E P E N D E N C E
C H A N G E ( 2 0 1 4 - 2 0 1 3 )
euro-2049 M
Assets
euro225 M
Liabilities
euro-2275 M
Net income
2582R E C E I V A B L E S
C O L L E C T I O N
D A Y S
411P A Y M E N T D A Y S
R E C E I V A B L E S C O L L E C T I O N P E R I O D
30DAYS
60DAYS
90DAYS
+120DAYS
P A Y M E N T P E R I O D
T U R N O V E R
euro795559
E B I T D A
euro-13342236-167709
E B I T D A M A R G I N
E B I T
euro-13993888-175900
G R O S S P R O F I T A B I L I T Y
N E T P R O F I T
euro-22745499-285906
N E T P R O F I T A B I L I T Y
G e n d e r a n d n u m b e r o f e m p l o y e e s
3 2 T O T A L = 5
40
60
A v e r a g e i n v e s t m e n t i n p e r s o n n e l
( P E R S O N N E L E X P E N S E N O O F E M P L O Y E E S )
= euro569168 OF TOTAL EXPENSES
S O C I E D A D E J E M P L O S L | C O M P A N Y R E P O R T
W W W I N F O E M P R E S A C O M 03
Company name SOCIEDAD EJEMPLO SL
Previous company names Not informed
Legal form Limited Liability Company (SL)
Commercial status Active
NIF (Spanish Tax ID Number) B000000000
Registered office PASEO DE LA CASTELLANA NUMERO 95 (MADRID)
Telephone +34 910000000
Website Not informed
Date of incorporation and years of service 18022009
Annual accounts submitted 2011 2012 2014
Date of financial year end 3112
Share capital euro4000879
Number of Employees Between 1 and 9 employees
Turnover Less than 2 million euros
C O M PAN Y I N F O R M AT I O N
S O C I E D A D E J E M P L O S L | C O M P A N Y R E P O R T
W W W I N F O E M P R E S A C O M 04
C R E D I T R E VI E W AN D R I S K AN ALY S I S
You will be able to see our credit review here In order to facilitate decision-making we present it from two perspectives on the one hand we show you
the maximum borrowing capacity the company has access to without entering a default risk area and on the other hand we show you the maximum
commercial credit the company can be granted
Credit review
HIG H
RISK
OPERATE
WITH CAUTION
MODERATE
RISK
G OOD
CREDIT
QUALITY
EXCELLENT
CREDIT
QUALITY
High risk
Bad credit ratingCompany with limited coverage to settle debts much
caution required request up-to-date economic and financial information
for more in-depth analysis
Maximum recommended
commercial credit
euro000
Maximum borrowing capacity
euro000
Methodology
For estimation and calculation we use information and ratios from the
companys accounting reports The model combines economic and
financial elements with estimations of the companys cash generation
capacity and debt coverage
Default Risk
Methodology
We use a model which combines a series of economic and financial
ratios obtained from the companys accounting reports The model is
based on a weighting of ratios of creditworthiness financial structuring
profitability and management of money supply and determines the risk
that the company will default on its obligations
The default risk is
VERY HIGH
Bankruptcy Risk
The bankrupcy risk is
VERY HIGH
Methodology
We use a combination of models for calculation based on economic and
financial ratios obtained from the companys accounting reports The
definitive weighted model determines the financial health of the company
and allows possible difficulties in the next 12 months for the same to be
detected
S O C I E D A D E J E M P L O S L | C O M P A N Y R E P O R T
W W W I N F O E M P R E S A C O M 05
CNAE (Spanish National Classification of Economic Activities
Code)
6209 - Other services related to information technologies and computer science
SIC Not informed
Corporate purpose LA CREACION Y DISTRIBUCION DE CONTENIDOS PARA RED TELEFONICA YO INTERNET
Previous corporate purposes Ampliacion del objeto social (2014-12-04) LA CREACION Y DISTRIBUCION DE CONTENIDOS
PARA RED TELEFONICA YO INTERNET
Constitucioacuten (2009-02-18) ACTIVIDAD INMOBILIARIA EN GENERAL COMPRA VENTA
TENENCIA CONSTRUCCION PROMOCION ADMINISTRACION EXPLOTACION Y
ARRENDAMIENTO DE TODA CLASE DE BIENES INMUEBLES SUSCRIPCION DE VALORES
SALVO INSTITUCIONES INVERSION COLECTIVA ETC
AC T I VI T Y
S O C I E D A D E J E M P L O S L | C O M P A N Y R E P O R T
W W W I N F O E M P R E S A C O M 06
Commercial Registry Commercial Registry of Madrid
Registry details T 30621 F 189 S 8 H M 495132 IA 26 (200115)
Date of Establishment 18022009
Latest BORME actions Peacuterdida del caracter de unipersonalidad
Corporate purpose LA CREACION Y DISTRIBUCION DE CONTENIDOS PARA RED TELEFONICA YO INTERNET
C O M M E R C I AL I N F O R M AT I O N
Degree of Importance High Average Normal
Latest act ions of the BORME (Spanish Official Gazette of the Companies Registry)
A M N
Loss of Sole Proprietorship (1)
Re-elections (1)
2 0 1 5 M
N
Appointments (1)
Statutory modifications (2)
Other items (1)
Merger through acquisition (1)
Dismissals (1)
2 0 1 4 M
M
N
A
M
Change of legal address (1) 2 0 1 3 M
Statutory modifications (2)
Appointments (4)
Capital increase (1)
2 0 1 2 M
M
A
Filing of Accounts (1)
Revocations (1)
2 0 1 0 A
M
Revocations (1)
Appointments (1)
Payment of Dividends (1)
Statutory modifications (1)
Incorporation (1)
2 0 0 9 M
M
N
M
N
SEE PREVIOUS YEARS Previous
S O C I E D A D E J E M P L O S L | C O M P A N Y R E P O R T
W W W I N F O E M P R E S A C O M 07
Action type Registration type Date
Loss of Sole Proprietorship Peacuterdida del caracter de unipersonalidad 28012015
Statutory modifications Modificados los artiacuteculos 8 y 10 de los Estatutos Sociales 04122014
Statutory modifications Modificado el artiacuteculo 12 de los Estatutos Sociales 04122014
Merger through acquisition Sociedades absorbidas SOCIEDAD EJEMPLO SL 14102014
Change of legal address PASEO DE LA CASTELLANA NUMERO 95 (MADRID) 15012013
Statutory modifications MODIFICADO EL ART ICULO 12 DE LOS ESTATUTOS SOCIALES 19072012
Statutory modifications 1 ADAPTACION DE LOS ESTATUTOS SOCIALES A LA LEY DE SOCIEDADES DE CAPITAL 30012012
Statutory modifications ARTICULO 5 MODIFICACION DEL NUMERO Y VALOR NOMINAL DE LAS PARTICIPACIONES
SOCIALES
01102009
Incorporation Objeto social ACT IVIDAD INMOBILIARIA EN GENERAL COMPRA VENTA TENENCIA
CONSTRUCCION PROMOCION ADMINISTRACION EXPLOTACION Y ARRENDAMIENTO DE
TODA CLASE DE BIENES INMUEBLES SUSCRIPCION DE VALORES SALVO INST ITUCIONES
INVERSION COLECTIVA ETC Domicilio ARIBAU 127 PRINCIPAL 1
18022009
Associates
M
M
M
A
M
M
M
M
N
Action type Registration type Date
Capital increase Suscrito 120000000 Euros Desembolsado 280087900 Euros Resultante Suscrito
400087900 Euros Resultante Desembolsado 280087900 Euros
24012012
Payment of Dividends Desembolsado 32304350 Euros 01102009
Share capital
A
N
Action type Registration type Date
Re-elections Adm Solid DIRECTIVO 2 12012015
Appointments Adm Solid DIRECTIVO 9 04122014
Dismissals Adm Solid DIRECTIVO 2 26052014
Appointments Apoderado DIRECTIVO 13 07032012
Appointments Adm Solid DIRECTIVO 3 26012012
Appointments Apoderado DIRECTIVO 12 20012012
Appointments Auditor DIRECTIVO 8 10012012
Revocations APODERADO DIRECTIVO 6 26032010
Revocations RRM DIRECTIVO 4 01102009
Appointments ADMSOLIDAR DIRECTIVO 1 01102009
Corporate bodies
N
M
M
M
M
M
M
M
M
M
Action type Registration type Date
Filing of Accounts 2009 27092010
Activity
A
Action type Registration type Date
Other items LA CREACION Y DISTRIBUCION DE CONTENIDOS PARA RED TELEFONICA YO INTERNET 04122014
Others
N
S O C I E D A D E J E M P L O S L | C O M P A N Y R E P O R T
W W W I N F O E M P R E S A C O M 08
D I R E C TO R S
Current posit ions
Registered Name Position Appointment Date
DIRECTIVO 8 Auditor 10012012
DIRECTIVO 10 Auditor 10012012
DIRECTIVO 10 Apoderado 07032012
DIRECTIVO 10 Administrador solidario 04122014
DIRECTIVO 13 Apoderado 07032012
DIRECTIVO 15 Auditor 23032012
DIRECTIVO 16 Socio uacutenico 20032013
Directors resigned
Registered Name Position Appointment Date Cessation Date
DIRECTIVO 1 Administrador solidario 01102009 13102010
DIRECTIVO 2 Administrador solidario 26052014 26062014
DIRECTIVO 3 Administrador solidario 26012012 26092012
DIRECTIVO 4 Apoderado 20072010 20092010
DIRECTIVO 5 Apoderado 28072010 28122010
DIRECTIVO 6 Apoderado 26032010 28092011
DIRECTIVO 7 Apoderado 28042011 28072011
DIRECTIVO 7 Administrador solidario 01102009 06052011
DIRECTIVO 9 Administrador solidario 04122014 26012015
DIRECTIVO 14 Administrador solidario 26012012 28112014
DIRECTIVO 17 Administrador solidario 26052013 26052014
See in Map of Directors
S O C I E D A D E J E M P L O S L | C O M P A N Y R E P O R T
W W W I N F O E M P R E S A C O M 09
Total of registered domains 1
Domains sociedadejemplocom
Date of latest database update 12102015
D O M AI N S
S O C I E D A D E J E M P L O S L | C O M P A N Y R E P O R T
W W W I N F O E M P R E S A C O M 10
LE GAL I N C I D E N T S AN D B AN K R U P TC Y
D O WN LO A D TH E O F F I C I A L P D F
Debtor Identity document
ORGANIZACION COSTES Y GEST ION SLPU B000000000
Section 1 - Insolvency edicts
Section II - Publicity through public registries
Resolution date Resolution type Debtor Procedure
24072014 Nombramiento de Administrador concursal MACU 3000 SOCIEDAD LIMITADA 2292014
24112015 Nombramiento de Administrador concursal VALERO LLANAS E HIJOS SA 3492015
Section III - Out-of-court agreements
The following information has been found on legal incidents and bankruptcy for SOCIEDAD EJEMPLO SL
Summary of publicat ions
There is no information on for ORGANIZACION COSTES Y GEST ION SLPU
There is no information on for ORGANIZACION COSTES Y GEST ION SLPU
S O C I E D A D E J E M P L O S L | C O M P A N Y R E P O R T
W W W I N F O E M P R E S A C O M 11
F I N AN C I AL S TAT E M E N T S - I N F O E M P R E S A F O R M AT
Balance(in Euros)
Financial years
References 2011 2012 2013 2014
AVAILABLE a 1174722 1144661
Accounts Receivable b 19419485 9127868
Stocks c 37652046 43152565
Other short-term assets d 3811334 1776914
Current assets e=a+b+c+d 62057587 55202008
Financial assets f 33519211 28214577
Property Plant and Equipment g 3087909 2963630
Real estate (fixed) assets h 2880283 2662563
Fixed intangible assets i 1019 152
Other long-term assets j 53038018 45047979
Non-current assets k=f+g+h+i+j 92526440 78888901
Short-term Accounts Payable l 20206091 19560636
Other short-term Provisions and Liabilities m 11843712 19644769
Current T rade Operations Liabilities n=l+m 32049803 39205405
Long-term Accounts Payable o 0 0
Other long-term Provisions and Liabilities p 867168 1627539
Non-current T rade Operations Liabilities q=o+p 867168 1627539
NET ASSETS TO BE FINANCED r=e+k+n+q 121667056 93257965
Short-term debts with Credit Institutions s 17 329826 16903735
Long-term debts with Credit Institutions t 53229588 46565260
Financing with Credit Institutions u=s+t 70559414 63468995
Other short-term debts v 41261 41277
Other long-term Debts w 2899680 2891851
Short-term debts with group companies and sister companies x 164908873 146843513
Long-term debts with group companies and sister companies y 408500000 428000000
Financing with Group Companies and Others z=v+w+x+y 576349814 577776641
Capital aa 12972585 12972585
Premium on issued shares ab 0 0
Reserves ac 60621791 60621791
Results of previous financial years ad -547910239 -598836548
Year-end results ae -50926309 -22745499
Other items af 0 0
Equity capital ag=aa+ab+ac+a
d+ae+af
-525242172 -547987671
TOTAL FUNDS ah=u+z+ag 121667056 93257965
S O C I E D A D E J E M P L O S L | C O M P A N Y R E P O R T
W W W I N F O E M P R E S A C O M 12
Income statement(in Euros)
Financial years
References 2011 2012 2013 2014
Revenue a 12612113 795559
Direct costs b -51944620 -10919852
GROSS MARGIN c=a+b -39332507 -10124293
Other operating expenses and income d 392359 269787
Operating margin e=c+d -38940148 -9854506
Personnel expenses f -842161 -284582
Other operating expenses g -13293870 -3203148
Overheads h=f+g -14136031 -3487730
EBITDA i=c+e+h -53076179 -13342236
Amortisations and provisions j -181977 -128514
Other results k 1468967 -523138
EBIT l=i+j+k -51789189 -13993888
Financial result m -2460634 -3875197
EBT n=l+m -54249823 -17869085
Corporate income tax o 3323514 -4876414
Other results of discontinued operations p 0 0
Year-end results q=n+o+p -50926309 -22745499
Cash flow(in Euros)
Financial years
FREE CASH FLOW References 2011 2012 2013 2014
Result before tax a -54249823 -17869085
Taxes and others b 11708578 -1322329
Amortisations and other adjustments c 49845883 15719519
Gross cash flow d=a+b+c 7304638 -3471895
Change in working capital e -14001266 471718
CAPEX f 44653 -86
FREE CASH FLOW g=d+e+f -6651975 -3000263
FINANCING CASH FLOW References 2011 2012 2013 2014
Change in equity instruments a 0 0
Payment of dividends and other instruments b 0 0
Investor financing c=a+b 0 0
Change in financial debt with third parties and companies in the
group
d 6651975 3000263
FINANCING CASH FLOW e=a+b+d 6651975 3000263
S O C I E D A D E J E M P L O S L | C O M P A N Y R E P O R T
W W W I N F O E M P R E S A C O M 13
Composit ion of Net Worth(in Euros)
Financial years
References 2011 2012 2013 2014
Capital a 12972585 12972585
Premium on issued shares b 0 0
Reserves c 60621791 60621791
Results of previous financial years d -547910239 -598836548
Year-end results e -50926309 -22745499
Other items f 0 0
Equity capital g=a+b+c+d+e+f -525242172 -547987671
Graphic showing the composit ion of Equity
Capital
Premium on issued shares
Reserves
Results of previous financial years
Year-end results
Other items
Equity capital
2013 2014
-800000000
-600000000
-400000000
-200000000
0
200000000
Profit and loss statement in percentages(in )
Financial years
References 2011 2012 2013 2014
Revenue aa 10000 10000
Direct costs ba -41186 -137260
GROSS MARGIN ca -31186 -127260
Other operating expenses and income da 311 3391
Operating margin ea -30875 -123869
Personnel expenses fa -668 -3577
Other operating expenses ga -10541 -40263
Overheads ha -11208 -43840
EBITDA ia -42083 -167709
Amortisations and provisions ja -144 -1615
Other results ka 1165 -6576
EBIT la -41063 -175900
Financial result ma -1951 -48710
EBT na -43014 -224610
Corporate income tax oa 2635 -61295
Other results of discontinued operations pa 000 000
Year-end results qa -40379 -285906
S O C I E D A D E J E M P L O S L | C O M P A N Y R E P O R T
W W W I N F O E M P R E S A C O M 14
E C O N O M I C AN D F I N AN C I AL C O M M I T T E E
Economic and Financial Committee
Financial years
Growth indicators 2011 2012 2013 2014
Change in Revenues -9559 -9369
Total Number of Employees 500 500
Change () -7500 000
Cash Flow Indicators 2011 2012 2013 2014
Gross cash flow euro7304638 euro-3471895
on Revenues 5792 -43641
Change in working capital euro-14001266 euro471718
on Revenues -11101 5929
CAPEX euro44653 euro-86
on Revenues 035 -001
FREE CASH FLOW euro-6651975 euro-3000263
on Revenues -5274 -37713
Financial Structure Indicators 2011 2012 2013 2014
Working Capital Ratio 040 041
Financial Autonomy Ratio 077 080
Debt Ratio 129 124
Long-term Debt Ratio 089 087
Short-term Debt Ratio 041 037
Cost Ratio of Third Party Financing (Financial Debt) 333 681
Third-party Financing Cost ROE 034 164
Solvency Indicators 2011 2012 2013 2014
Ratio of Immediate Availability 001 001
Cash Ratio 010 005
Solvency Ratio 029 027
Guarantee Ratio 023 020
Asset Management Indicators 2011 2012 2013 2014
Average Receivables Collection Period 43992 258222
Average Payment Period 12589 41068
Stock Turnover 57551 139863
Profitability Indicators 2011 2012 2013 2014
Economic Profitability (ROI) -3350 -1044
Financial Profitability (ROE) 970 415
Results Indicators 2011 2012 2013 2014
Gross Margin Ratio -21915 -122532
EBITDA Ratio -42083 -167709
EBIT Ratio -41063 -175900
EBT Ratio -43014 -224610
Financial Year Result Ratio -40379 -285906
Cost Indicators 2011 2012 2013 2014
Sales - Direct Cost 31915 132532
Sales - Overheads 11208 43840
Working Capital 2011 2012 2013 2014
Working Capital euro-152272176 euro-147791922
S O C I E D A D E J E M P L O S L | C O M P A N Y R E P O R T
W W W I N F O E M P R E S A C O M 15
Optimal Precaution NegativeFinancial Structure Indicators
Working Capital Ratio (Rt_Cir)
120 0 0 10 0 0 0
Ind icates the capacity o f a companys as s et to be converted
into availab le funds Repres ents the weighting o f current
as s ets relative to to tal as s ets
G reen Rt_Cir gt = 0 50 Yel low Rt_Cir gt = 0 30 Y lt 0 50 Red Rt_Cir
lt 0 30
041Variation
2014 - 2013
001
Financial Autonomy Ratio (Rt_Aut)
20 0 0 0 (310 0 0 +320 0 0 )
Ind icates the companys autonomy with res pect to third
parties s howing the percentage o f own (company) res ources
emp loyed by the company relative to to tal current liab ilities
o r third party res ources
G reen Rt_Aut gt = 0 70 Yel low Rt_Aut gt 0 40 Y lt 0 70 Red Rt_Aut
lt = 0 40
080Variation
2014 - 2013
003
Debt Ratio (Rt_End)
(310 0 0 +320 0 0 ) 20 0 0 0
Ind icates the companys leverage s howing the percentage o f
third party res ources emp loyed by the company fo r financing
relative to own res ources
G reen Rt_End = 1 50 Red Rt_End gt = 250
124Variation
2014 - 2013
005
Long-term Debt Ratio (Rt_Endlp)
310 0 0 20 0 0 0
Ind icates the weighting o f long -term external financing
relative to own res ources
G reen Rt_End =1 0 0 Yel low Rt_End gt 1 50 Y Rt_Endlp Rt_End gt
0 50 Y 1 50 Y Rt_Endlp Rt_End lt =0 50
087Variation
2014 - 2013
001
Short-term Debt Ratio (Rt_Endcp)
320 0 0 20 0 0 0
Ind icates the weighting o f s ho rt-term external financing
relative to own res ources
G reen Rt_End 1 50 Y Rt_Endcp Rt_End gt 0 5 Y 1 50 Y Rt_Endcp
Rt_End gt = 0 8
037Variation
2014 - 2013
004
Cost Ratio of Third Party Financing (Financial
Debt) (Rt_Cfex)
(4150 0 ( (3120 0 de n + 3230 0 de n + 3120 0 de n_1 + 3230 0 de n_1 )
2)) 10 0
Ind icates the percentage rep res ented by the companys cos t
o f financing with external deb t
G reen Rt_Cfex Rt_Ref =0 Yel low Rt_Cfex Rt_Ref gt 0 50 Y = 1
681 Variation
2014 - 2013
003 pp
Third-party Financing Cost ROE (Rt_Cfexref)
Rt_Cfex Rt_Ref
Ind icates the weighting o f Financial Debt fund ing cos ts
relative to s hareho lder p ro fitab ility
G reen Rt_Cfexref =0 Yel low Rt_Cfexref gt = 0 50 Y =1
164Variation
2014 - 2013
130
S O C I E D A D E J E M P L O S L | C O M P A N Y R E P O R T
W W W I N F O E M P R E S A C O M 16
Optimal Precaution NegativeSolvency Indicators
Ratio of Immediate Availability (Rt_Diin)
(1250 0 +1270 0 ) 320 0 0
Ind icates the companys capacity to s ettle its s ho rt-term
debts in cas h availab le in the bank accounts and in cas h
reg is ters
G reen Rt_Di in gt = 0 15 Yel low Rt_Di in gt 0 0 5 Y lt 0 15 Red Rt_Di in
lt = 0 0 5
001Variation
2014 - 2013
000
Cash Ratio (Rt_Tes)
(1250 0 +1270 0 +1230 0 ) 320 0 0
Ind icates the companys s hort-term degree o f l iquid ity fo r
s ettling its debts
G reen Rt_Tes gt = 0 75 Yel low Rt_Tes gt 0 50 Y lt 0 75 Red Rt_Tes
lt = 0 50
005Variation
2014 - 2013
005
Solvency Ratio (Rt_Sol)
120 0 0 320 0 0
Ind icates the relations hip between current as s ets and liquid
liab ilities
G reen Rt_Sol gt = 1 5 Yel low Rt_Sol gt 1 Y lt 1 5 Red Rt_Sol lt = 1
027Variation
2014 - 2013
002
Guarantee Ratio (Rt_Gar)
10 0 0 0 (310 0 0 +320 0 0 )
Ind icates the to tal capacity o f a company to s ettle the
payment o f all its debts
G reen Rt_G a r gt = 1 5 Yel low Rt_G a r gt 1 Y lt 1 5 Red Rt_G a r lt = 1
020Variation
2014 - 2013
003
Optimal Precaution NegativeAsset Management Indicators
Average Receivables Collection Period
(Rt_Cobro)
Norma l Account Type ( ( (12310 + 12320 + 12330 ) 1 21 ) (40 10 0 +
40 50 0 )) 36 5 Abbrevia ted SME or Mixed Account Type ( ( (12380 +
1239 0 ) 1 21 ) (40 10 0 + 40 50 0 )) 36 5
The average receivab les co llection period is the number o f
days in which the company charges its c lients
G reen Rt_Cobro =6 5 Y 9 5
258222Variation
2014 - 2013
2142
Average Payment Period (Rt_Pago)
Norma l Account Type ( ( (32510 + 32520 + 32530 ) 1 21 ) (40 40 0 +
40 710 + 40 740 )) 36 5 Abbrevia ted SME or Mixed Account Type
( (3250 0 1 21 ) (40 40 0 + 40 70 0 )) 36 5
The average payment period is the number o f days in which
the company s ettles its trade ob ligations
G reen Rt_Pa go =6 5 Y 9 5
41068Variation
2014 - 2013
285
Stock Turnover (Rt_Exist)
( ( (1220 0 de n + 1220 0 de n_1 ) 2) 40 40 0 de n ) 36 5
Ind icates the number o f days needed to s ell s tocks
G reen Rt_Exist =6 0 Y 9 0
139863Variation
2014 - 2013
823
Optimal Precaution NegativeProfitability Indicators
Economic Profitability (ROI) (Rt_Roa)
(49 10 0 10 0 0 0 ) 10 0
Ind icates the p ro fitab ility o f the companys inves tment
meaning the p ro fitab ility o f the as s et befo re company taxes
and financial res ults
G reen Rt_Roa gt = 10 Yel low Rt_Roa gt 0 Y lt 10 Red Rt_Roa
lt = 0
-1044 Variation
2014 - 2013
023 pp
Financial Profitability (ROE) (Rt_Ref)
(49 50 0 20 0 0 0 ) 10 0
Meas ures the return on inves tment made by s hareho lders
G reen Rt_Ref gt = 10 Yel low Rt_Ref gt 0 Y lt 10 Red Rt_Ref lt =
0
415 Variation
2014 - 2013
006 pp
S O C I E D A D E J E M P L O S L | C O M P A N Y R E P O R T
W W W I N F O E M P R E S A C O M 17
Optimal Precaution NegativeResults Indicators
Gross Margin Ratio (Rt_Mabr)
( (40 10 0 - 40 40 0 ) 40 10 0 ) 10 0
Deducting the d irect cos ts o f generating s ales - i e the cos t
o f merchand is e s o ld o r p rovis ions tells you the return on
s ales
G reen Rt_Ma br gt = 40 Yel low Rt_Ma br gt =20 Y lt 40 Red
Rt_Ma br lt 20
-1225 Variation
2014 - 2013
1006 pp
EBITDA Ratio (Rt_Ebitda)
( (49 10 0 + 40 80 0 ) 40 10 0 ) 10 0
Ind icates the percentage rep res ented by EBITDA (earnings
befo re interes t taxes depreciation and amortis ation) relative
to the companys revenues
G reen Rt_Ebi tda gt = 10 Yel low Rt_Ebi tda gt 0 Y lt 10 Red
Rt_Ebi tda lt =0
-1677 Variation
2014 - 2013
1256 pp
EBIT Ratio (Rt_Ebit)
(49 10 0 40 10 0 ) 10 0
Ind icates the percentage rep res ented by EBIT (earnings
befo re interes t amp taxes ) relative to the companys revenues
G reen Rt_Ebi t gt = 8 Yel low Rt_Ebi t gt 0 Y lt 5 Red Rt_Ebi t
lt =0
-1759 Variation
2014 - 2013
1348 pp
EBT Ratio (Rt_Ebt)
(49 30 0 40 10 0 ) 10 0
Ind icates the percentage rep res ented by EBT (earnings
befo re taxes ) relative to the companys revenues
G reen Rt_Ebt gt = 5 Yel low Rt_Ebt gt 0 Y lt 8 Red Rt_Ebt lt =0
-2246 Variation
2014 - 2013
1816 pp
Financial Year Result Ratio (Rt_Rneta)
(49 50 0 40 10 0 ) 10 0
Ind icates the percentage rep res ented by the financial year net
p ro fit relative to the companys revenues To tal p ro fitab ility
ob tained fo r each currency unit s o ld
G reen Rt_Nneta gt 0 Red Rt_Nneta lt =0
-2859 Variation
2014 - 2013
2455 pp
S O C I E D A D E J E M P L O S L | C O M P A N Y R E P O R T
W W W I N F O E M P R E S A C O M 18
AN N UAL AC C O U N T S - B U S I N E S S R E GI S T E R F O R M AT
Balance(in Euros)
Financial years
Key 2011 2012 2013 2014
a) NON-CURRENT ASSETS 11000 9252644000 7888890100
I Fixed intangible assets 11100 101900 15200
1 Development 11110 000 000
2 Concessions 11120 000 000
3 Patents licences trademarks and similar 11130 000 000
4 Goodwill 11140 000 000
5 IT applications 11150 101900 15200
6 Investigation 11160 000 000
7 Intellectual property 11180 000 000
8 Rights relating to the emission of greenhouse gases 11190 000 000
9 Other fixed intangible assets 11170 000 000
II Property Plant and Equipment 11200 308790900 296363000
1 Land and structures 11210 000 000
2 Technical facilities and other (tangible) fixed assets 11220 100606600 88178700
3 In-progress fixed assets and advance payments 11230 208184300 208184300
III Investment Property 11300 288028300 266256300
1 Land 11310 253883200 253883200
2 Structures 11320 34145100 12373100
IV Long-term investments in group companies and sister
companies
11400 3333590100 2803860500
1 Equity instruments 11410 2016884300 2016884300
2 Credits to companies 11420 1316705800 786976200
2 Credits to companies 11430 000 000
4 Derivatives 11440 000 000
5 Other financial assets 11450 000 000
6 Other investments 11460 000 000
V Long-term financial investments 11500 18331000 17597200
1 Equity instruments 11510 131500 131500
2 Credits to third parties 11520 000 000
2 Credits to companies 11530 000 000
4 Derivatives 11540 000 000
5 Other financial assets 11550 18199500 17465700
6 Other investments 11560 000 000
VI Deferred tax assets 11600 5303801800 4504797900
VII Non-current trade debts 11700 000 000
S O C I E D A D E J E M P L O S L | C O M P A N Y R E P O R T
W W W I N F O E M P R E S A C O M 19
Financial years
Key 2011 2012 2013 2014
B) CURRENT ASSETS 12000 6205758700 5520200800
I Non-current assets maintained for sale 12100 000 000
II Stocks 12200 3765204600 4315256500
1 Commercial stocks 12210 000 000
2 Raw materials and other provisions 12220 1016357100 1607654500
3 Semi-finished products 12230 000 000
a) Long term production cycle 12231 000 000
b) Short term production cycle 12232 000 000
4 Finished products 12240 1532426200 1494815100
a) Long term production cycle 12241 1532426200 1494815100
b) Short term production cycle 12242 000 000
5 Sub-products waste and recovered materials 12250 000 000
6 Advance payments to providers 12260 1216421300 1212786900
III T rade debtors and other accounts receivable 12300 1941948500 912786800
1 Client receivables for service provisions and sales 12310 976116700 7566300
a) Client receivables for long-term service provisions
and sales
12311 000 000
b) Client receivables for short-term service
provisions and sales
12312 976116700 7566300
2 Clients group companies and sister companies 12320 204266100 205849500
3 Miscellaneous debtors 12330 716132800 698547000
4 Staff 12340 1153200 000
5Current tax assets 12350 000 000
6 Other credits with Public Administration bodies 12360 44279700 824000
7 Called-up share capital 12370 000 000
IV Short-term investments in group companies and sister
companies
12400 381133400 177691400
1 Equity instruments 12410 000 000
2 Credits to companies 12420 000 000
2 Credits to companies 12430 000 000
4 Derivatives 12440 000 000
5 Other financial assets 12450 381133400 177691400
6 Other investments 12460 000 000
V Short-term financial investments 12500 91823800 87421100
1 Equity instruments 12510 000 000
2 Credits to companies 12520 3304400 2774900
2 Credits to companies 12530 305000 305000
4 Derivatives 12540 000 000
5 Other financial assets 12550 88214400 84341200
6 Other investments 12560 000 000
VI Short-term accruals 12600 000 000
VII Cash and other equivalent liquid assets 12700 25648400 27045000
1 T reasury 12710 25648400 27045000
2 Other equivalent liquid assets 12720 000 000
TOTAL ASSETS (A + B) 10000 15458402700 13409090900
S O C I E D A D E J E M P L O S L | C O M P A N Y R E P O R T
W W W I N F O E M P R E S A C O M 20
Financial years
Key 2011 2012 2013 2014
A) EQUITY 20000 -52524217200 -54798767100
A-1) Equity capital 21000 -52524217200 -54798767100
I Capital 21100 1297258500 1297258500
1 Authorised capital 21110 1297258500 1297258500
2 (Uncalled share capital) 21120 000 000
II Premium on issued shares 21200 000 000
IIIReserves 21300 6062179100 6062179100
1 Legal and statutory reserves 21310 259451700 259451700
2 Other reserves 21320 5802727400 5802727400
3 Revaluation reserve 21330 000 000
IV (Companys equity shares and interests) 21400 000 000
V Results of previous financial years 21500 -54791023900 -59883654800
1 Carryover 21510 000 000
2 (Negative results of previous financial years) 21520 -54791023900 -59883654800
VI Other member contributions 21600 000 000
VII Financial year profit amp loss 21700 -5092630900 -2274549900
VIII (Interim dividend) 21800 000 000
IX Other equity instruments 21900 000 000
A-2) Adjustments for changes in value 22000 000 000
I Available-for-sale financial assets 22100 000 000
II Hedging transactions 22200 000 000
III Non-current assets and related liabilities maintained for
sale
22300 000 000
IV T ranslation difference 22400 000 000
V Others 22500 000 000
A3) Grants donations and legacies received 23000 000 000
B) NON-CURRENT LIABILIT IES 31000 46549643600 47908465000
I Long-term provisions 31100 75132300 75132300
1 Long-term staff benefit obligations 31110 000 000
2 Environmental actions 31120 000 000
3 Provisions for restructuring 31130 000 000
4 Other provisions 31140 75132300 75132300
II Long-term debts 31200 5612926800 4945711100
1 Obligations and other negotiable securities 31210 000 000
2 Debts with credit institutions 31220 5322958800 4656526000
3 Financial lease creditors 31230 000 000
4 Derivatives 31240 000 000
5 Other financial liabilities 31250 289968000 289185100
III Long-term debts with group companies and sister
companies
31300 40850000000 42800000000
IV Deferred tax liabilities 31400 11584500 87621600
V Long-term accruals 31500 000 000
VI Non-current trade creditors 31600 000 000
VII Long-term debt with special characteristics 31700 000 000
S O C I E D A D E J E M P L O S L | C O M P A N Y R E P O R T
W W W I N F O E M P R E S A C O M 21
Financial years
Key 2011 2012 2013 2014
C) CURRENT LIABILIT IES 32000 21432976300 20299393000
I Liabilities associated with non-current assets maintained for
sale
32100 000 000
II Short-term provisions 32200 1184371200 1964476900
1 Provisions for rights relating to the emission of
greenhouse gases
32210 000 000
2 Other provisions 32220 1184371200 1964476900
III Short-term debts 32300 17 37108700 1694501200
1 Obligations and other negotiable securities 32310 000 000
2 Debts with credit institutions 32320 17 32982600 1690373500
3 Financial lease creditors 32330 000 000
4 Derivatives 32340 000 000
5 Other financial liabilities 32350 4126100 4127700
IV Short-term debts with group companies and sister
companies
32400 16490887300 14684351300
V T rade creditors and other accounts payable 32500 2020609100 1956063600
1 Providers 32510 1573868600 1464849400
a) Long-term providers 32511 000 000
b) Short-term providers 32512 1573868600 1464849400
2 Providers group companies and sister companies 32520 116553500 78369000
3 Miscellaneous creditors 32530 59204100 60136000
4 Personnel (remunerations pending payment) 32540 1017300 000
5 Current tax liabilities 32550 000 000
6 Other debts with Public Administration bodies 32560 182162900 275878200
7 Advance payments from clients 32570 87802700 76831000
VI Short-term accruals 32600 000 000
VII Short-term debt with special characteristics 32700 000 000
TOTAL EQUITY AND LIABILIT IES (A + B + C) 30000 15458402700 13409090900
S O C I E D A D E J E M P L O S L | C O M P A N Y R E P O R T
W W W I N F O E M P R E S A C O M 22
Income statement(in Euros)
Financial years
Key 2011 2012 2013 2014
1 Net turnover 40100 1261211300 79555900
a) Sales 40110 1230715400 61382900
b) Service provisions 40120 30495900 18173000
c) Financial revenues from holding companies 40130 000 000
2 Change in stocks of finished and semi-finished products 40200 -1169328600 -37611100
3 Capital asset betterments and improvements4 40300 000 000
4Provisions 40400 -4025133400 -1054374100
a) Consumption of merchandise 40410 000 000
b) Consumption of raw materials and other consumables 40420 -1327808600 000
c) Work carried out by other companies 40430 -17488500 -30451500
d) Deterioration in merchandise raw materials and other
provisions
40440 -2679836300 -1023922600
5 Other operating expenses 40500 39235900 26978700
a) Casual income and other current operating income 40510 39235900 26978700
b) Operating grants incorporated into the financial year profit
amp loss
40520 000 000
6 Personnel expenses 40600 -84216100 -28458200
a) Wages salaries and similar expenses 40610 -72780100 -22841400
b) Social security contributions 40620 -11436000 -5616800
c) Provisions 40630 000 000
7 Other operating expenses 40700 -1329387000 -320314800
a) Outsourcing 40710 -167392300 -123318300
b) Fees 40720 -33987800 -39586900
c) Losses deterioration and change in provisions for trade
operations
40730 -1128006900 -157409600
d) Other current operating expenses 40740 000 000
e) Expenses relating to the emission of greenhouse
gases
40750 000 000
8 Depreciation of fixed assets 40800 -18197700 -12851400
9 Allocation of non-financial asset grants and others 40900 000 000
10 Provision excesses 41000 000 000
11 Deterioration and result for transfers of fixed assets 41100 -45795000 300
a) Deterioration and losses 41110 -54236000 000
b) Results for transfers and others 41120 8441000 300
c) Deterioration and results for transfers of holding company
fixed assets
41130 000 000
12 Negative difference in business combinations 41200 000 000
13 Other results 41300 192691700 -52314100
S O C I E D A D E J E M P L O S L | C O M P A N Y R E P O R T
W W W I N F O E M P R E S A C O M 23
Financial years
Key 2011 2012 2013 2014
A1) OPERATING PROFIT (1 + 2 + 3 + 4 + 5 + 6 + 7 + 8 + 9 + 10 + 11
+ 12 + 13)
49100 -5178918900 -1399388800
14 Financial revenues 41400 24914900 26494500
a) Of shareholdings in equity instruments 41410 4200 1400
a 1) In group companies and sister companies 41411 000 000
a 2) In third parties 41412 4200 1400
b) Of negotiable securities and other financial instruments 41420 24910700 26493100
b 1) Of group companies and sister companies 41421 24575700 22972200
b 2) Of third parties 41422 335000 3520900
c) Allocation of financial grants donations and legacies 41430 000 000
15 Financial expenses 41500 -270227700 -476090600
a) For debts with group companies and associated
companies
41510 -270227700 -471686500
b) For debts with third parties 41520 000 -4404100
c) For updating provisions 41530 000 000
16 Change in fair value of financial instruments 41600 000 000
a) T rading portfolio and others 41610 000 000
b) Allocation to financial year profit amp loss account on
available-for-sale financial assets
41620 000 000
17 Exchange differences 41700 -7 50600 -1101100
18 Deterioration and result for transfers of financial instruments 41800 000 63177500
a) Deteriorations and losses 41810 000 000
b) Results for transfers and others 41820 000 63177500
19 Other financial expenses and revenues 42100 000 000
a) Capitalisation of financial assets 42110 000 000
b) Financial revenues from creditors agreements 42120 000 000
c) Other revenues and expenses 42130 000 000
A2) FINANCIAL RESULT (14 + 15 + 16 + 17 18 + 19) 49200 -246063400 -387519700
A3) PRE-TAX RESULT (A1 + A2) 49300 -5424982300 -1786908500
20 Tax on profits 41900 332351400 -487641400
A4) FINANCIAL YEAR PROFIT amp LOSS FROM CONTINUING
OPERATIONS (A3 + 20)
49400 -5092630900 -2274549900
21 Financial year result from discontinued operations after tax 42000 000 000
A5) FINANCIAL YEAR RESULT (A4 + 21) 49500 -5092630900 -2274549900
S O C I E D A D E J E M P L O S L | C O M P A N Y R E P O R T
W W W I N F O E M P R E S A C O M 24
Changes in Equity(in Euros)
Financial years
Key 2011 2012 2013 2014
A) RESULT OF THE PROFIT AND LOSS ACCOUNT 59100 -5092630900 -2274549900
I For valuation of financial instruments 50010 000 000
1 Available-for-sale financial assets 50011 000 000
2 Other revenuesexpenses 50012 000 000
II For cash flow hedges (coverage) 50020 000 000
III Grants donations and legacies received 50030 000 000
IV For actuarial profits and losses and other adjustments 50040 000 000
V For non-current assets and related liabilities maintained
for sale
50050 000 000
VI Conversion Differences 50060 000 000
VII Tax effect 50070 000 000
B) Total revenues and expenses allocated directly in equity (I + II
+ III + IV +V+VI+VII)
59200 000 000
VIII For valuation of financial instruments 50080 000 000
1 Available-for-sale financial assets 50081 000 000
2 Other revenuesexpenses 50082 000 000
IX For cash flow hedges (coverage) 50090 000 000
X Grants donations and legacies received 50100 000 000
XI For non-current assets and related liabilities maintained
for sale
50110 000 000
XII T ranslation differences 50120 000 000
XIII Tax effect 50130 000 000
C) Total transfers to the profit and loss account (VIII + IX + X + XI+
XII+ XIII)
59300 000 000
TOTAL RECOGNISED EXPENDITURE AND REVENUES (A + B + C) 59400 -5092630900 -2274549900
S O C I E D A D E J E M P L O S L | C O M P A N Y R E P O R T
W W W I N F O E M P R E S A C O M 25
Cash Flows(in Euros)
Financial years
Key 2011 2012 2013 2014
1 Financial year result before tax 61100 -5424982300 -1786908500
2 Profit amp Loss adjustments 61200 4984588300 1571951900
a) Amortisation of fixed assets (+) 61201 18197700 12851400
b) Valuation adjustments due to deterioration (+) 61202 3792017100 1023922600
c) Change in provisions (+) 61203 1128006900 157409600
d) Allocation of grants () 61204 000 000
e) Results for derecognitions and transfers of fixed assets (+) 61205 -8441000 -300
f) Results for derecognitions and transfers of financial
instruments (+)
61206 000 -63177500
g) Financial revenues () 61207 -24914900 -26494500
h) Financial expenses (+) 61208 270227700 476090600
j) Change in fair value of financial instruments (+) 61210 000 000
k) Other revenues and expenses (+) 61211 -190505200 -8650000
3 Changes in current capital 61300 -1395076900 48568400
a) Stocks (+) 61301 204651700 62689600
b) Debtors and other accounts receivable (+) 61302 -1215763600 36637800
c) Other current assets (+) 61303 29929500 5136500
d) Creditors and other accounts payable (+) 61304 -413894500 -55895500
e) Other current liabilities (+) 61305 000 000
f) Other non-current assets and liabilities (+) 61306 000 000
4 Other cash flows from operating activities 61400 1170857800 -132232900
a) Interest payments () 61401 -270227700 -476090600
b) Receivables from dividends (+) 61402 000 000
c) Interest receivables (+) 61403 24914900 26494500
d) Tax on profit receivables (payments) (+) 61404 1416170600 317363200
e) Other payments (receivables) (+) 61405 000 000
5 Cash flows from operating activities (1 + 2 + 3 + 4) 61500 -664613100 -298621100
6 Payments for investments () 62100 -224200 -10000
a) Group companies and sister companies 62101 000 000
b) Fixed intangible assets 62102 000 000
c) (Tangible) fixed assets 62103 -224200 -10000
d) Real estate investments 62104 000 000
e) Other financial assets 62105 000 000
f) Non-current assets maintained for sale 62106 000 000
g) Business unit 62107 000 000
h) Other assets 62108 000 000
S O C I E D A D E J E M P L O S L | C O M P A N Y R E P O R T
W W W I N F O E M P R E S A C O M 26
Financial years
Key 2011 2012 2013 2014
7 Receivables from the sale of investments (+) 62200 4689500 1400
a) Group companies and sister companies 62201 000 000
b) Fixed intangible assets 62202 000 000
c) (Tangible) fixed assets 62203 1171100 1400
d) Real estate investments 62204 000 000
e) Other financial assets 62205 3518400 000
f) Non-current assets maintained for sale 62206 000 000
g) Business unit 62207 000 000
h) Other assets 62208 000 000
8 Cash flows from investment activities (6 + 7) 62300 4465300 -8600
9 Receivables and payments for equity instruments 63100 000 000
a) Issuance of equity instruments () 63101 000 000
b) Amortisation of equity instruments () 63102 000 000
c) Acquisition of own equity instruments () 63103 000 000
d) T ransfer of own equity instruments (+) 63104 000 000
e) Grants donations and legacies received (+) 63105 000 000
10 Receivables and payments for financial liability instruments 63200 665197500 300026300
a) Issuance 63201 10558799100 1950000000
1 Obligations and other negotiable securities (+) 63202 000 000
2 Debts with credit institutions (+) 63203 8799100 000
3 Debts with group companies and sister companies (+) 63204 10550000000 1950000000
4 Debts with special characteristics (+) 63205 000 000
5 Other debts (+) 63206 000 000
b) Repayment and amortisation of 63207 -9893601600 -1649973700
1 Obligations and other negotiable securities () 63208 000 000
3 Debts with group companies and sister companies () 63210 -9889617600 -1603328000
4 Debts with special characteristics () 63211 000 000
5 Other debts () 63212 -111200 -781300
11 Dividend payments and remunerations from other equity
instruments
63300 000 000
a) Dividends () 63301 000 000
b) Remuneration of other equity instruments () 63302 000 000
12 Cash flows from financing activities (9 + 10 + 11) 63400 665197500 300026300
D) Effect of changes in exchange types 64000 000 000
E) NET INCREASEDECREASE IN CASH OR EQUIVALENTS (5 + 8
+ 12 + D)
65000 5049700 1396600
Cash or equivalents at the start of the financial year 65100 30698100 25648400
Cash or equivalents at the end of the financial year 65200 25648400 27045000
S O C I E D A D E J E M P L O S L | C O M P A N Y R E P O R T
W W W I N F O E M P R E S A C O M 27
AS N E F E M P R E S AS
There are no defaults recorded in the ASNEF (Spanish National Association of Finance Companies) Empresas (Companies) file
RAI (Unpaid Receivables Registry)
File made up of information on defaults exclusively by legal persons that are
equal to or greater than euro300
The information in this file remains for 30 months
CH E CK D E F A U LTS A N D D E B TS ( R A I )
S O C I E D A D E J E M P L O S L | C O M P A N Y R E P O R T
W W W I N F O E M P R E S A C O M 28
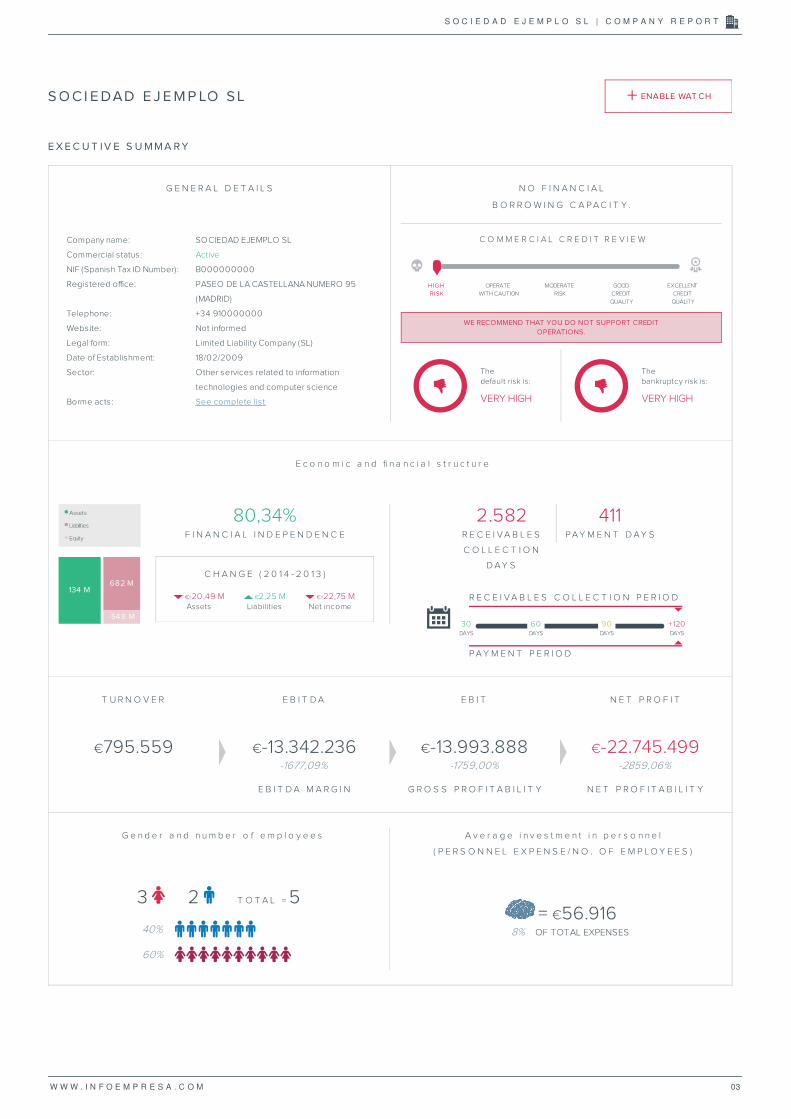
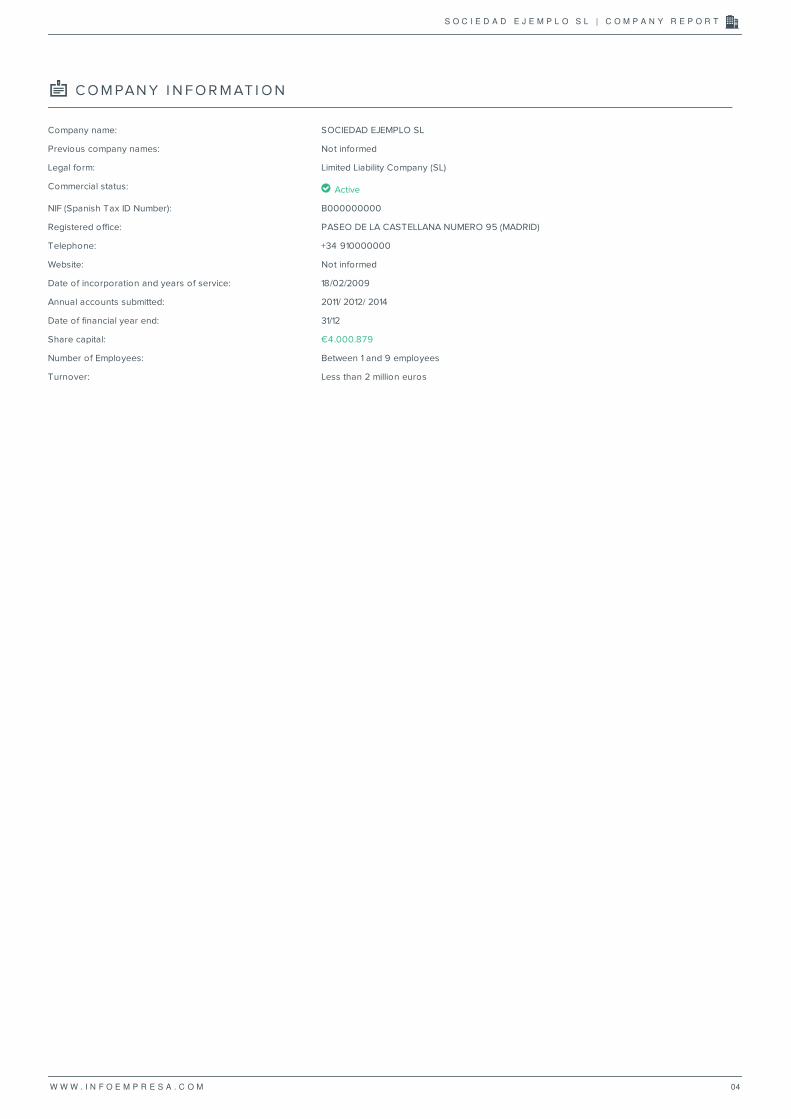
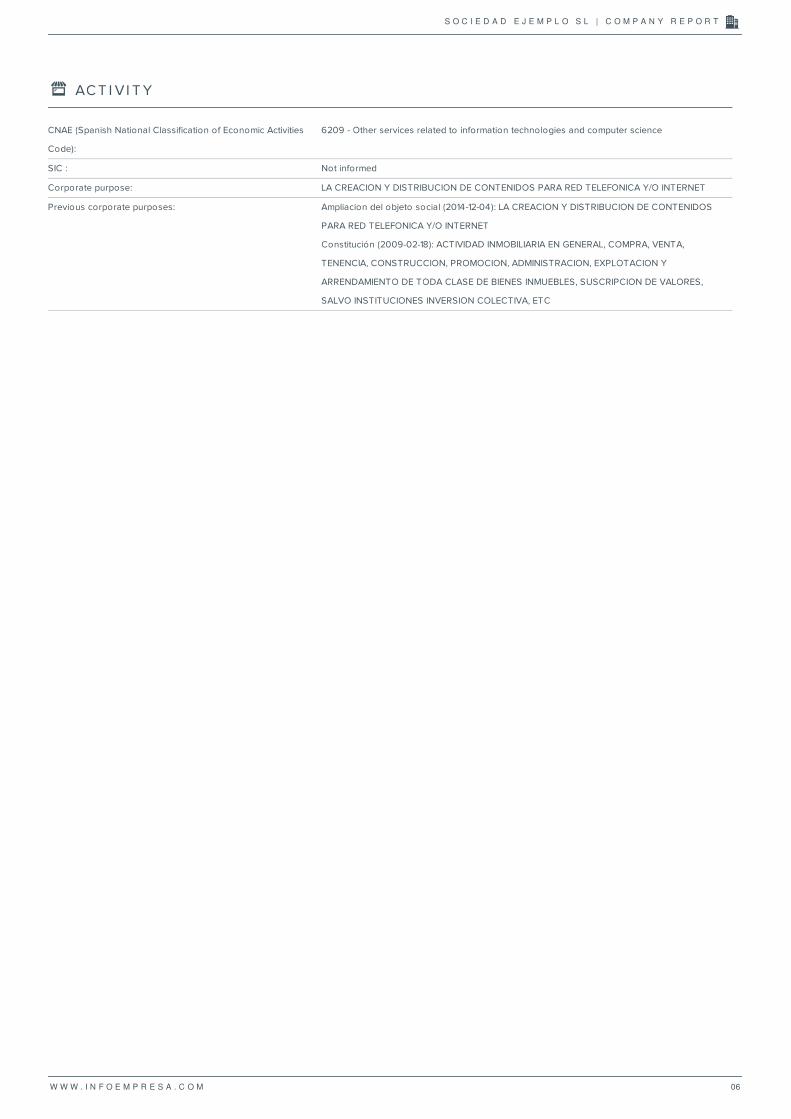
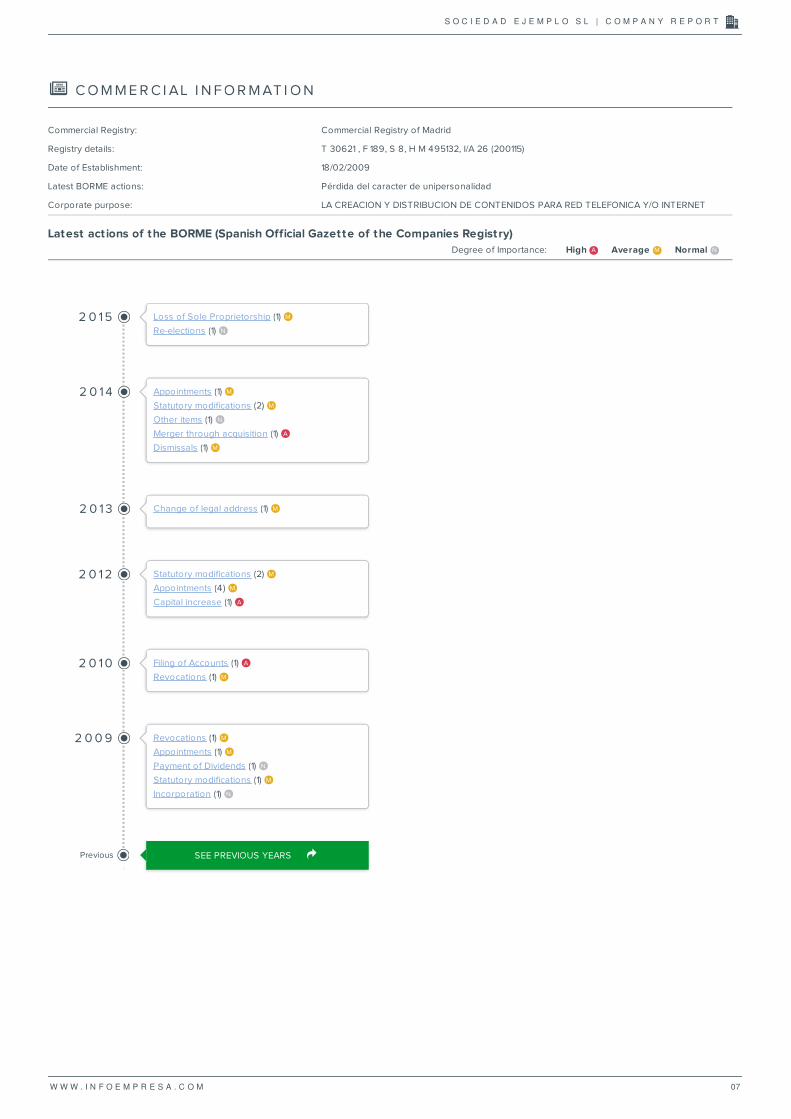
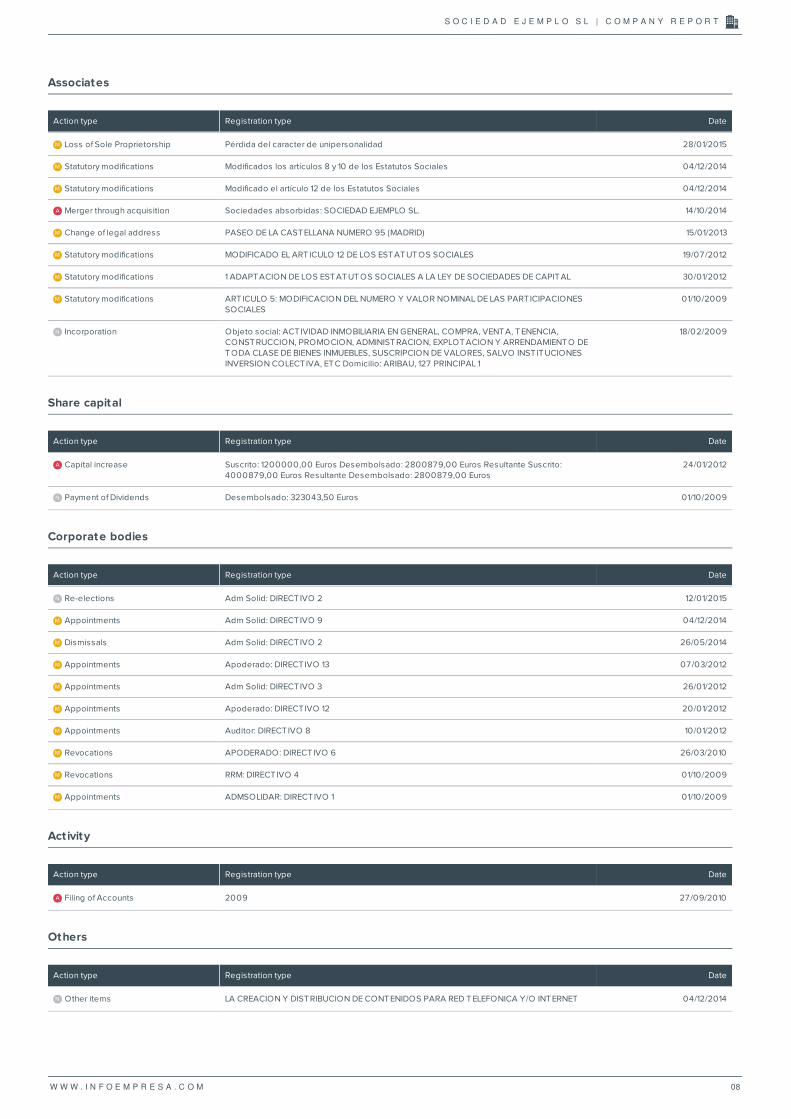
Action type Registration type Date
Loss of Sole Proprietorship Peacuterdida del caracter de unipersonalidad 28012015
Statutory modifications Modificados los artiacuteculos 8 y 10 de los Estatutos Sociales 04122014
Statutory modifications Modificado el artiacuteculo 12 de los Estatutos Sociales 04122014
Merger through acquisition Sociedades absorbidas SOCIEDAD EJEMPLO SL 14102014
Change of legal address PASEO DE LA CASTELLANA NUMERO 95 (MADRID) 15012013
Statutory modifications MODIFICADO EL ART ICULO 12 DE LOS ESTATUTOS SOCIALES 19072012
Statutory modifications 1 ADAPTACION DE LOS ESTATUTOS SOCIALES A LA LEY DE SOCIEDADES DE CAPITAL 30012012
Statutory modifications ARTICULO 5 MODIFICACION DEL NUMERO Y VALOR NOMINAL DE LAS PARTICIPACIONES
SOCIALES
01102009
Incorporation Objeto social ACT IVIDAD INMOBILIARIA EN GENERAL COMPRA VENTA TENENCIA
CONSTRUCCION PROMOCION ADMINISTRACION EXPLOTACION Y ARRENDAMIENTO DE
TODA CLASE DE BIENES INMUEBLES SUSCRIPCION DE VALORES SALVO INST ITUCIONES
INVERSION COLECTIVA ETC Domicilio ARIBAU 127 PRINCIPAL 1
18022009
Associates
M
M
M
A
M
M
M
M
N
Action type Registration type Date
Capital increase Suscrito 120000000 Euros Desembolsado 280087900 Euros Resultante Suscrito
400087900 Euros Resultante Desembolsado 280087900 Euros
24012012
Payment of Dividends Desembolsado 32304350 Euros 01102009
Share capital
A
N
Action type Registration type Date
Re-elections Adm Solid DIRECTIVO 2 12012015
Appointments Adm Solid DIRECTIVO 9 04122014
Dismissals Adm Solid DIRECTIVO 2 26052014
Appointments Apoderado DIRECTIVO 13 07032012
Appointments Adm Solid DIRECTIVO 3 26012012
Appointments Apoderado DIRECTIVO 12 20012012
Appointments Auditor DIRECTIVO 8 10012012
Revocations APODERADO DIRECTIVO 6 26032010
Revocations RRM DIRECTIVO 4 01102009
Appointments ADMSOLIDAR DIRECTIVO 1 01102009
Corporate bodies
N
M
M
M
M
M
M
M
M
M
Action type Registration type Date
Filing of Accounts 2009 27092010
Activity
A
Action type Registration type Date
Other items LA CREACION Y DISTRIBUCION DE CONTENIDOS PARA RED TELEFONICA YO INTERNET 04122014
Others
N
S O C I E D A D E J E M P L O S L | C O M P A N Y R E P O R T
W W W I N F O E M P R E S A C O M 08
D I R E C TO R S
Current posit ions
Registered Name Position Appointment Date
DIRECTIVO 8 Auditor 10012012
DIRECTIVO 10 Auditor 10012012
DIRECTIVO 10 Apoderado 07032012
DIRECTIVO 10 Administrador solidario 04122014
DIRECTIVO 13 Apoderado 07032012
DIRECTIVO 15 Auditor 23032012
DIRECTIVO 16 Socio uacutenico 20032013
Directors resigned
Registered Name Position Appointment Date Cessation Date
DIRECTIVO 1 Administrador solidario 01102009 13102010
DIRECTIVO 2 Administrador solidario 26052014 26062014
DIRECTIVO 3 Administrador solidario 26012012 26092012
DIRECTIVO 4 Apoderado 20072010 20092010
DIRECTIVO 5 Apoderado 28072010 28122010
DIRECTIVO 6 Apoderado 26032010 28092011
DIRECTIVO 7 Apoderado 28042011 28072011
DIRECTIVO 7 Administrador solidario 01102009 06052011
DIRECTIVO 9 Administrador solidario 04122014 26012015
DIRECTIVO 14 Administrador solidario 26012012 28112014
DIRECTIVO 17 Administrador solidario 26052013 26052014
See in Map of Directors
S O C I E D A D E J E M P L O S L | C O M P A N Y R E P O R T
W W W I N F O E M P R E S A C O M 09
Total of registered domains 1
Domains sociedadejemplocom
Date of latest database update 12102015
D O M AI N S
S O C I E D A D E J E M P L O S L | C O M P A N Y R E P O R T
W W W I N F O E M P R E S A C O M 10
LE GAL I N C I D E N T S AN D B AN K R U P TC Y
D O WN LO A D TH E O F F I C I A L P D F
Debtor Identity document
ORGANIZACION COSTES Y GEST ION SLPU B000000000
Section 1 - Insolvency edicts
Section II - Publicity through public registries
Resolution date Resolution type Debtor Procedure
24072014 Nombramiento de Administrador concursal MACU 3000 SOCIEDAD LIMITADA 2292014
24112015 Nombramiento de Administrador concursal VALERO LLANAS E HIJOS SA 3492015
Section III - Out-of-court agreements
The following information has been found on legal incidents and bankruptcy for SOCIEDAD EJEMPLO SL
Summary of publicat ions
There is no information on for ORGANIZACION COSTES Y GEST ION SLPU
There is no information on for ORGANIZACION COSTES Y GEST ION SLPU
S O C I E D A D E J E M P L O S L | C O M P A N Y R E P O R T
W W W I N F O E M P R E S A C O M 11
F I N AN C I AL S TAT E M E N T S - I N F O E M P R E S A F O R M AT
Balance(in Euros)
Financial years
References 2011 2012 2013 2014
AVAILABLE a 1174722 1144661
Accounts Receivable b 19419485 9127868
Stocks c 37652046 43152565
Other short-term assets d 3811334 1776914
Current assets e=a+b+c+d 62057587 55202008
Financial assets f 33519211 28214577
Property Plant and Equipment g 3087909 2963630
Real estate (fixed) assets h 2880283 2662563
Fixed intangible assets i 1019 152
Other long-term assets j 53038018 45047979
Non-current assets k=f+g+h+i+j 92526440 78888901
Short-term Accounts Payable l 20206091 19560636
Other short-term Provisions and Liabilities m 11843712 19644769
Current T rade Operations Liabilities n=l+m 32049803 39205405
Long-term Accounts Payable o 0 0
Other long-term Provisions and Liabilities p 867168 1627539
Non-current T rade Operations Liabilities q=o+p 867168 1627539
NET ASSETS TO BE FINANCED r=e+k+n+q 121667056 93257965
Short-term debts with Credit Institutions s 17 329826 16903735
Long-term debts with Credit Institutions t 53229588 46565260
Financing with Credit Institutions u=s+t 70559414 63468995
Other short-term debts v 41261 41277
Other long-term Debts w 2899680 2891851
Short-term debts with group companies and sister companies x 164908873 146843513
Long-term debts with group companies and sister companies y 408500000 428000000
Financing with Group Companies and Others z=v+w+x+y 576349814 577776641
Capital aa 12972585 12972585
Premium on issued shares ab 0 0
Reserves ac 60621791 60621791
Results of previous financial years ad -547910239 -598836548
Year-end results ae -50926309 -22745499
Other items af 0 0
Equity capital ag=aa+ab+ac+a
d+ae+af
-525242172 -547987671
TOTAL FUNDS ah=u+z+ag 121667056 93257965
S O C I E D A D E J E M P L O S L | C O M P A N Y R E P O R T
W W W I N F O E M P R E S A C O M 12
Income statement(in Euros)
Financial years
References 2011 2012 2013 2014
Revenue a 12612113 795559
Direct costs b -51944620 -10919852
GROSS MARGIN c=a+b -39332507 -10124293
Other operating expenses and income d 392359 269787
Operating margin e=c+d -38940148 -9854506
Personnel expenses f -842161 -284582
Other operating expenses g -13293870 -3203148
Overheads h=f+g -14136031 -3487730
EBITDA i=c+e+h -53076179 -13342236
Amortisations and provisions j -181977 -128514
Other results k 1468967 -523138
EBIT l=i+j+k -51789189 -13993888
Financial result m -2460634 -3875197
EBT n=l+m -54249823 -17869085
Corporate income tax o 3323514 -4876414
Other results of discontinued operations p 0 0
Year-end results q=n+o+p -50926309 -22745499
Cash flow(in Euros)
Financial years
FREE CASH FLOW References 2011 2012 2013 2014
Result before tax a -54249823 -17869085
Taxes and others b 11708578 -1322329
Amortisations and other adjustments c 49845883 15719519
Gross cash flow d=a+b+c 7304638 -3471895
Change in working capital e -14001266 471718
CAPEX f 44653 -86
FREE CASH FLOW g=d+e+f -6651975 -3000263
FINANCING CASH FLOW References 2011 2012 2013 2014
Change in equity instruments a 0 0
Payment of dividends and other instruments b 0 0
Investor financing c=a+b 0 0
Change in financial debt with third parties and companies in the
group
d 6651975 3000263
FINANCING CASH FLOW e=a+b+d 6651975 3000263
S O C I E D A D E J E M P L O S L | C O M P A N Y R E P O R T
W W W I N F O E M P R E S A C O M 13
Composit ion of Net Worth(in Euros)
Financial years
References 2011 2012 2013 2014
Capital a 12972585 12972585
Premium on issued shares b 0 0
Reserves c 60621791 60621791
Results of previous financial years d -547910239 -598836548
Year-end results e -50926309 -22745499
Other items f 0 0
Equity capital g=a+b+c+d+e+f -525242172 -547987671
Graphic showing the composit ion of Equity
Capital
Premium on issued shares
Reserves
Results of previous financial years
Year-end results
Other items
Equity capital
2013 2014
-800000000
-600000000
-400000000
-200000000
0
200000000
Profit and loss statement in percentages(in )
Financial years
References 2011 2012 2013 2014
Revenue aa 10000 10000
Direct costs ba -41186 -137260
GROSS MARGIN ca -31186 -127260
Other operating expenses and income da 311 3391
Operating margin ea -30875 -123869
Personnel expenses fa -668 -3577
Other operating expenses ga -10541 -40263
Overheads ha -11208 -43840
EBITDA ia -42083 -167709
Amortisations and provisions ja -144 -1615
Other results ka 1165 -6576
EBIT la -41063 -175900
Financial result ma -1951 -48710
EBT na -43014 -224610
Corporate income tax oa 2635 -61295
Other results of discontinued operations pa 000 000
Year-end results qa -40379 -285906
S O C I E D A D E J E M P L O S L | C O M P A N Y R E P O R T
W W W I N F O E M P R E S A C O M 14
E C O N O M I C AN D F I N AN C I AL C O M M I T T E E
Economic and Financial Committee
Financial years
Growth indicators 2011 2012 2013 2014
Change in Revenues -9559 -9369
Total Number of Employees 500 500
Change () -7500 000
Cash Flow Indicators 2011 2012 2013 2014
Gross cash flow euro7304638 euro-3471895
on Revenues 5792 -43641
Change in working capital euro-14001266 euro471718
on Revenues -11101 5929
CAPEX euro44653 euro-86
on Revenues 035 -001
FREE CASH FLOW euro-6651975 euro-3000263
on Revenues -5274 -37713
Financial Structure Indicators 2011 2012 2013 2014
Working Capital Ratio 040 041
Financial Autonomy Ratio 077 080
Debt Ratio 129 124
Long-term Debt Ratio 089 087
Short-term Debt Ratio 041 037
Cost Ratio of Third Party Financing (Financial Debt) 333 681
Third-party Financing Cost ROE 034 164
Solvency Indicators 2011 2012 2013 2014
Ratio of Immediate Availability 001 001
Cash Ratio 010 005
Solvency Ratio 029 027
Guarantee Ratio 023 020
Asset Management Indicators 2011 2012 2013 2014
Average Receivables Collection Period 43992 258222
Average Payment Period 12589 41068
Stock Turnover 57551 139863
Profitability Indicators 2011 2012 2013 2014
Economic Profitability (ROI) -3350 -1044
Financial Profitability (ROE) 970 415
Results Indicators 2011 2012 2013 2014
Gross Margin Ratio -21915 -122532
EBITDA Ratio -42083 -167709
EBIT Ratio -41063 -175900
EBT Ratio -43014 -224610
Financial Year Result Ratio -40379 -285906
Cost Indicators 2011 2012 2013 2014
Sales - Direct Cost 31915 132532
Sales - Overheads 11208 43840
Working Capital 2011 2012 2013 2014
Working Capital euro-152272176 euro-147791922
S O C I E D A D E J E M P L O S L | C O M P A N Y R E P O R T
W W W I N F O E M P R E S A C O M 15
Optimal Precaution NegativeFinancial Structure Indicators
Working Capital Ratio (Rt_Cir)
120 0 0 10 0 0 0
Ind icates the capacity o f a companys as s et to be converted
into availab le funds Repres ents the weighting o f current
as s ets relative to to tal as s ets
G reen Rt_Cir gt = 0 50 Yel low Rt_Cir gt = 0 30 Y lt 0 50 Red Rt_Cir
lt 0 30
041Variation
2014 - 2013
001
Financial Autonomy Ratio (Rt_Aut)
20 0 0 0 (310 0 0 +320 0 0 )
Ind icates the companys autonomy with res pect to third
parties s howing the percentage o f own (company) res ources
emp loyed by the company relative to to tal current liab ilities
o r third party res ources
G reen Rt_Aut gt = 0 70 Yel low Rt_Aut gt 0 40 Y lt 0 70 Red Rt_Aut
lt = 0 40
080Variation
2014 - 2013
003
Debt Ratio (Rt_End)
(310 0 0 +320 0 0 ) 20 0 0 0
Ind icates the companys leverage s howing the percentage o f
third party res ources emp loyed by the company fo r financing
relative to own res ources
G reen Rt_End = 1 50 Red Rt_End gt = 250
124Variation
2014 - 2013
005
Long-term Debt Ratio (Rt_Endlp)
310 0 0 20 0 0 0
Ind icates the weighting o f long -term external financing
relative to own res ources
G reen Rt_End =1 0 0 Yel low Rt_End gt 1 50 Y Rt_Endlp Rt_End gt
0 50 Y 1 50 Y Rt_Endlp Rt_End lt =0 50
087Variation
2014 - 2013
001
Short-term Debt Ratio (Rt_Endcp)
320 0 0 20 0 0 0
Ind icates the weighting o f s ho rt-term external financing
relative to own res ources
G reen Rt_End 1 50 Y Rt_Endcp Rt_End gt 0 5 Y 1 50 Y Rt_Endcp
Rt_End gt = 0 8
037Variation
2014 - 2013
004
Cost Ratio of Third Party Financing (Financial
Debt) (Rt_Cfex)
(4150 0 ( (3120 0 de n + 3230 0 de n + 3120 0 de n_1 + 3230 0 de n_1 )
2)) 10 0
Ind icates the percentage rep res ented by the companys cos t
o f financing with external deb t
G reen Rt_Cfex Rt_Ref =0 Yel low Rt_Cfex Rt_Ref gt 0 50 Y = 1
681 Variation
2014 - 2013
003 pp
Third-party Financing Cost ROE (Rt_Cfexref)
Rt_Cfex Rt_Ref
Ind icates the weighting o f Financial Debt fund ing cos ts
relative to s hareho lder p ro fitab ility
G reen Rt_Cfexref =0 Yel low Rt_Cfexref gt = 0 50 Y =1
164Variation
2014 - 2013
130
S O C I E D A D E J E M P L O S L | C O M P A N Y R E P O R T
W W W I N F O E M P R E S A C O M 16
Optimal Precaution NegativeSolvency Indicators
Ratio of Immediate Availability (Rt_Diin)
(1250 0 +1270 0 ) 320 0 0
Ind icates the companys capacity to s ettle its s ho rt-term
debts in cas h availab le in the bank accounts and in cas h
reg is ters
G reen Rt_Di in gt = 0 15 Yel low Rt_Di in gt 0 0 5 Y lt 0 15 Red Rt_Di in
lt = 0 0 5
001Variation
2014 - 2013
000
Cash Ratio (Rt_Tes)
(1250 0 +1270 0 +1230 0 ) 320 0 0
Ind icates the companys s hort-term degree o f l iquid ity fo r
s ettling its debts
G reen Rt_Tes gt = 0 75 Yel low Rt_Tes gt 0 50 Y lt 0 75 Red Rt_Tes
lt = 0 50
005Variation
2014 - 2013
005
Solvency Ratio (Rt_Sol)
120 0 0 320 0 0
Ind icates the relations hip between current as s ets and liquid
liab ilities
G reen Rt_Sol gt = 1 5 Yel low Rt_Sol gt 1 Y lt 1 5 Red Rt_Sol lt = 1
027Variation
2014 - 2013
002
Guarantee Ratio (Rt_Gar)
10 0 0 0 (310 0 0 +320 0 0 )
Ind icates the to tal capacity o f a company to s ettle the
payment o f all its debts
G reen Rt_G a r gt = 1 5 Yel low Rt_G a r gt 1 Y lt 1 5 Red Rt_G a r lt = 1
020Variation
2014 - 2013
003
Optimal Precaution NegativeAsset Management Indicators
Average Receivables Collection Period
(Rt_Cobro)
Norma l Account Type ( ( (12310 + 12320 + 12330 ) 1 21 ) (40 10 0 +
40 50 0 )) 36 5 Abbrevia ted SME or Mixed Account Type ( ( (12380 +
1239 0 ) 1 21 ) (40 10 0 + 40 50 0 )) 36 5
The average receivab les co llection period is the number o f
days in which the company charges its c lients
G reen Rt_Cobro =6 5 Y 9 5
258222Variation
2014 - 2013
2142
Average Payment Period (Rt_Pago)
Norma l Account Type ( ( (32510 + 32520 + 32530 ) 1 21 ) (40 40 0 +
40 710 + 40 740 )) 36 5 Abbrevia ted SME or Mixed Account Type
( (3250 0 1 21 ) (40 40 0 + 40 70 0 )) 36 5
The average payment period is the number o f days in which
the company s ettles its trade ob ligations
G reen Rt_Pa go =6 5 Y 9 5
41068Variation
2014 - 2013
285
Stock Turnover (Rt_Exist)
( ( (1220 0 de n + 1220 0 de n_1 ) 2) 40 40 0 de n ) 36 5
Ind icates the number o f days needed to s ell s tocks
G reen Rt_Exist =6 0 Y 9 0
139863Variation
2014 - 2013
823
Optimal Precaution NegativeProfitability Indicators
Economic Profitability (ROI) (Rt_Roa)
(49 10 0 10 0 0 0 ) 10 0
Ind icates the p ro fitab ility o f the companys inves tment
meaning the p ro fitab ility o f the as s et befo re company taxes
and financial res ults
G reen Rt_Roa gt = 10 Yel low Rt_Roa gt 0 Y lt 10 Red Rt_Roa
lt = 0
-1044 Variation
2014 - 2013
023 pp
Financial Profitability (ROE) (Rt_Ref)
(49 50 0 20 0 0 0 ) 10 0
Meas ures the return on inves tment made by s hareho lders
G reen Rt_Ref gt = 10 Yel low Rt_Ref gt 0 Y lt 10 Red Rt_Ref lt =
0
415 Variation
2014 - 2013
006 pp
S O C I E D A D E J E M P L O S L | C O M P A N Y R E P O R T
W W W I N F O E M P R E S A C O M 17
Optimal Precaution NegativeResults Indicators
Gross Margin Ratio (Rt_Mabr)
( (40 10 0 - 40 40 0 ) 40 10 0 ) 10 0
Deducting the d irect cos ts o f generating s ales - i e the cos t
o f merchand is e s o ld o r p rovis ions tells you the return on
s ales
G reen Rt_Ma br gt = 40 Yel low Rt_Ma br gt =20 Y lt 40 Red
Rt_Ma br lt 20
-1225 Variation
2014 - 2013
1006 pp
EBITDA Ratio (Rt_Ebitda)
( (49 10 0 + 40 80 0 ) 40 10 0 ) 10 0
Ind icates the percentage rep res ented by EBITDA (earnings
befo re interes t taxes depreciation and amortis ation) relative
to the companys revenues
G reen Rt_Ebi tda gt = 10 Yel low Rt_Ebi tda gt 0 Y lt 10 Red
Rt_Ebi tda lt =0
-1677 Variation
2014 - 2013
1256 pp
EBIT Ratio (Rt_Ebit)
(49 10 0 40 10 0 ) 10 0
Ind icates the percentage rep res ented by EBIT (earnings
befo re interes t amp taxes ) relative to the companys revenues
G reen Rt_Ebi t gt = 8 Yel low Rt_Ebi t gt 0 Y lt 5 Red Rt_Ebi t
lt =0
-1759 Variation
2014 - 2013
1348 pp
EBT Ratio (Rt_Ebt)
(49 30 0 40 10 0 ) 10 0
Ind icates the percentage rep res ented by EBT (earnings
befo re taxes ) relative to the companys revenues
G reen Rt_Ebt gt = 5 Yel low Rt_Ebt gt 0 Y lt 8 Red Rt_Ebt lt =0
-2246 Variation
2014 - 2013
1816 pp
Financial Year Result Ratio (Rt_Rneta)
(49 50 0 40 10 0 ) 10 0
Ind icates the percentage rep res ented by the financial year net
p ro fit relative to the companys revenues To tal p ro fitab ility
ob tained fo r each currency unit s o ld
G reen Rt_Nneta gt 0 Red Rt_Nneta lt =0
-2859 Variation
2014 - 2013
2455 pp
S O C I E D A D E J E M P L O S L | C O M P A N Y R E P O R T
W W W I N F O E M P R E S A C O M 18
AN N UAL AC C O U N T S - B U S I N E S S R E GI S T E R F O R M AT
Balance(in Euros)
Financial years
Key 2011 2012 2013 2014
a) NON-CURRENT ASSETS 11000 9252644000 7888890100
I Fixed intangible assets 11100 101900 15200
1 Development 11110 000 000
2 Concessions 11120 000 000
3 Patents licences trademarks and similar 11130 000 000
4 Goodwill 11140 000 000
5 IT applications 11150 101900 15200
6 Investigation 11160 000 000
7 Intellectual property 11180 000 000
8 Rights relating to the emission of greenhouse gases 11190 000 000
9 Other fixed intangible assets 11170 000 000
II Property Plant and Equipment 11200 308790900 296363000
1 Land and structures 11210 000 000
2 Technical facilities and other (tangible) fixed assets 11220 100606600 88178700
3 In-progress fixed assets and advance payments 11230 208184300 208184300
III Investment Property 11300 288028300 266256300
1 Land 11310 253883200 253883200
2 Structures 11320 34145100 12373100
IV Long-term investments in group companies and sister
companies
11400 3333590100 2803860500
1 Equity instruments 11410 2016884300 2016884300
2 Credits to companies 11420 1316705800 786976200
2 Credits to companies 11430 000 000
4 Derivatives 11440 000 000
5 Other financial assets 11450 000 000
6 Other investments 11460 000 000
V Long-term financial investments 11500 18331000 17597200
1 Equity instruments 11510 131500 131500
2 Credits to third parties 11520 000 000
2 Credits to companies 11530 000 000
4 Derivatives 11540 000 000
5 Other financial assets 11550 18199500 17465700
6 Other investments 11560 000 000
VI Deferred tax assets 11600 5303801800 4504797900
VII Non-current trade debts 11700 000 000
S O C I E D A D E J E M P L O S L | C O M P A N Y R E P O R T
W W W I N F O E M P R E S A C O M 19
Financial years
Key 2011 2012 2013 2014
B) CURRENT ASSETS 12000 6205758700 5520200800
I Non-current assets maintained for sale 12100 000 000
II Stocks 12200 3765204600 4315256500
1 Commercial stocks 12210 000 000
2 Raw materials and other provisions 12220 1016357100 1607654500
3 Semi-finished products 12230 000 000
a) Long term production cycle 12231 000 000
b) Short term production cycle 12232 000 000
4 Finished products 12240 1532426200 1494815100
a) Long term production cycle 12241 1532426200 1494815100
b) Short term production cycle 12242 000 000
5 Sub-products waste and recovered materials 12250 000 000
6 Advance payments to providers 12260 1216421300 1212786900
III T rade debtors and other accounts receivable 12300 1941948500 912786800
1 Client receivables for service provisions and sales 12310 976116700 7566300
a) Client receivables for long-term service provisions
and sales
12311 000 000
b) Client receivables for short-term service
provisions and sales
12312 976116700 7566300
2 Clients group companies and sister companies 12320 204266100 205849500
3 Miscellaneous debtors 12330 716132800 698547000
4 Staff 12340 1153200 000
5Current tax assets 12350 000 000
6 Other credits with Public Administration bodies 12360 44279700 824000
7 Called-up share capital 12370 000 000
IV Short-term investments in group companies and sister
companies
12400 381133400 177691400
1 Equity instruments 12410 000 000
2 Credits to companies 12420 000 000
2 Credits to companies 12430 000 000
4 Derivatives 12440 000 000
5 Other financial assets 12450 381133400 177691400
6 Other investments 12460 000 000
V Short-term financial investments 12500 91823800 87421100
1 Equity instruments 12510 000 000
2 Credits to companies 12520 3304400 2774900
2 Credits to companies 12530 305000 305000
4 Derivatives 12540 000 000
5 Other financial assets 12550 88214400 84341200
6 Other investments 12560 000 000
VI Short-term accruals 12600 000 000
VII Cash and other equivalent liquid assets 12700 25648400 27045000
1 T reasury 12710 25648400 27045000
2 Other equivalent liquid assets 12720 000 000
TOTAL ASSETS (A + B) 10000 15458402700 13409090900
S O C I E D A D E J E M P L O S L | C O M P A N Y R E P O R T
W W W I N F O E M P R E S A C O M 20
Financial years
Key 2011 2012 2013 2014
A) EQUITY 20000 -52524217200 -54798767100
A-1) Equity capital 21000 -52524217200 -54798767100
I Capital 21100 1297258500 1297258500
1 Authorised capital 21110 1297258500 1297258500
2 (Uncalled share capital) 21120 000 000
II Premium on issued shares 21200 000 000
IIIReserves 21300 6062179100 6062179100
1 Legal and statutory reserves 21310 259451700 259451700
2 Other reserves 21320 5802727400 5802727400
3 Revaluation reserve 21330 000 000
IV (Companys equity shares and interests) 21400 000 000
V Results of previous financial years 21500 -54791023900 -59883654800
1 Carryover 21510 000 000
2 (Negative results of previous financial years) 21520 -54791023900 -59883654800
VI Other member contributions 21600 000 000
VII Financial year profit amp loss 21700 -5092630900 -2274549900
VIII (Interim dividend) 21800 000 000
IX Other equity instruments 21900 000 000
A-2) Adjustments for changes in value 22000 000 000
I Available-for-sale financial assets 22100 000 000
II Hedging transactions 22200 000 000
III Non-current assets and related liabilities maintained for
sale
22300 000 000
IV T ranslation difference 22400 000 000
V Others 22500 000 000
A3) Grants donations and legacies received 23000 000 000
B) NON-CURRENT LIABILIT IES 31000 46549643600 47908465000
I Long-term provisions 31100 75132300 75132300
1 Long-term staff benefit obligations 31110 000 000
2 Environmental actions 31120 000 000
3 Provisions for restructuring 31130 000 000
4 Other provisions 31140 75132300 75132300
II Long-term debts 31200 5612926800 4945711100
1 Obligations and other negotiable securities 31210 000 000
2 Debts with credit institutions 31220 5322958800 4656526000
3 Financial lease creditors 31230 000 000
4 Derivatives 31240 000 000
5 Other financial liabilities 31250 289968000 289185100
III Long-term debts with group companies and sister
companies
31300 40850000000 42800000000
IV Deferred tax liabilities 31400 11584500 87621600
V Long-term accruals 31500 000 000
VI Non-current trade creditors 31600 000 000
VII Long-term debt with special characteristics 31700 000 000
S O C I E D A D E J E M P L O S L | C O M P A N Y R E P O R T
W W W I N F O E M P R E S A C O M 21
Financial years
Key 2011 2012 2013 2014
C) CURRENT LIABILIT IES 32000 21432976300 20299393000
I Liabilities associated with non-current assets maintained for
sale
32100 000 000
II Short-term provisions 32200 1184371200 1964476900
1 Provisions for rights relating to the emission of
greenhouse gases
32210 000 000
2 Other provisions 32220 1184371200 1964476900
III Short-term debts 32300 17 37108700 1694501200
1 Obligations and other negotiable securities 32310 000 000
2 Debts with credit institutions 32320 17 32982600 1690373500
3 Financial lease creditors 32330 000 000
4 Derivatives 32340 000 000
5 Other financial liabilities 32350 4126100 4127700
IV Short-term debts with group companies and sister
companies
32400 16490887300 14684351300
V T rade creditors and other accounts payable 32500 2020609100 1956063600
1 Providers 32510 1573868600 1464849400
a) Long-term providers 32511 000 000
b) Short-term providers 32512 1573868600 1464849400
2 Providers group companies and sister companies 32520 116553500 78369000
3 Miscellaneous creditors 32530 59204100 60136000
4 Personnel (remunerations pending payment) 32540 1017300 000
5 Current tax liabilities 32550 000 000
6 Other debts with Public Administration bodies 32560 182162900 275878200
7 Advance payments from clients 32570 87802700 76831000
VI Short-term accruals 32600 000 000
VII Short-term debt with special characteristics 32700 000 000
TOTAL EQUITY AND LIABILIT IES (A + B + C) 30000 15458402700 13409090900
S O C I E D A D E J E M P L O S L | C O M P A N Y R E P O R T
W W W I N F O E M P R E S A C O M 22
Income statement(in Euros)
Financial years
Key 2011 2012 2013 2014
1 Net turnover 40100 1261211300 79555900
a) Sales 40110 1230715400 61382900
b) Service provisions 40120 30495900 18173000
c) Financial revenues from holding companies 40130 000 000
2 Change in stocks of finished and semi-finished products 40200 -1169328600 -37611100
3 Capital asset betterments and improvements4 40300 000 000
4Provisions 40400 -4025133400 -1054374100
a) Consumption of merchandise 40410 000 000
b) Consumption of raw materials and other consumables 40420 -1327808600 000
c) Work carried out by other companies 40430 -17488500 -30451500
d) Deterioration in merchandise raw materials and other
provisions
40440 -2679836300 -1023922600
5 Other operating expenses 40500 39235900 26978700
a) Casual income and other current operating income 40510 39235900 26978700
b) Operating grants incorporated into the financial year profit
amp loss
40520 000 000
6 Personnel expenses 40600 -84216100 -28458200
a) Wages salaries and similar expenses 40610 -72780100 -22841400
b) Social security contributions 40620 -11436000 -5616800
c) Provisions 40630 000 000
7 Other operating expenses 40700 -1329387000 -320314800
a) Outsourcing 40710 -167392300 -123318300
b) Fees 40720 -33987800 -39586900
c) Losses deterioration and change in provisions for trade
operations
40730 -1128006900 -157409600
d) Other current operating expenses 40740 000 000
e) Expenses relating to the emission of greenhouse
gases
40750 000 000
8 Depreciation of fixed assets 40800 -18197700 -12851400
9 Allocation of non-financial asset grants and others 40900 000 000
10 Provision excesses 41000 000 000
11 Deterioration and result for transfers of fixed assets 41100 -45795000 300
a) Deterioration and losses 41110 -54236000 000
b) Results for transfers and others 41120 8441000 300
c) Deterioration and results for transfers of holding company
fixed assets
41130 000 000
12 Negative difference in business combinations 41200 000 000
13 Other results 41300 192691700 -52314100
S O C I E D A D E J E M P L O S L | C O M P A N Y R E P O R T
W W W I N F O E M P R E S A C O M 23
Financial years
Key 2011 2012 2013 2014
A1) OPERATING PROFIT (1 + 2 + 3 + 4 + 5 + 6 + 7 + 8 + 9 + 10 + 11
+ 12 + 13)
49100 -5178918900 -1399388800
14 Financial revenues 41400 24914900 26494500
a) Of shareholdings in equity instruments 41410 4200 1400
a 1) In group companies and sister companies 41411 000 000
a 2) In third parties 41412 4200 1400
b) Of negotiable securities and other financial instruments 41420 24910700 26493100
b 1) Of group companies and sister companies 41421 24575700 22972200
b 2) Of third parties 41422 335000 3520900
c) Allocation of financial grants donations and legacies 41430 000 000
15 Financial expenses 41500 -270227700 -476090600
a) For debts with group companies and associated
companies
41510 -270227700 -471686500
b) For debts with third parties 41520 000 -4404100
c) For updating provisions 41530 000 000
16 Change in fair value of financial instruments 41600 000 000
a) T rading portfolio and others 41610 000 000
b) Allocation to financial year profit amp loss account on
available-for-sale financial assets
41620 000 000
17 Exchange differences 41700 -7 50600 -1101100
18 Deterioration and result for transfers of financial instruments 41800 000 63177500
a) Deteriorations and losses 41810 000 000
b) Results for transfers and others 41820 000 63177500
19 Other financial expenses and revenues 42100 000 000
a) Capitalisation of financial assets 42110 000 000
b) Financial revenues from creditors agreements 42120 000 000
c) Other revenues and expenses 42130 000 000
A2) FINANCIAL RESULT (14 + 15 + 16 + 17 18 + 19) 49200 -246063400 -387519700
A3) PRE-TAX RESULT (A1 + A2) 49300 -5424982300 -1786908500
20 Tax on profits 41900 332351400 -487641400
A4) FINANCIAL YEAR PROFIT amp LOSS FROM CONTINUING
OPERATIONS (A3 + 20)
49400 -5092630900 -2274549900
21 Financial year result from discontinued operations after tax 42000 000 000
A5) FINANCIAL YEAR RESULT (A4 + 21) 49500 -5092630900 -2274549900
S O C I E D A D E J E M P L O S L | C O M P A N Y R E P O R T
W W W I N F O E M P R E S A C O M 24
Changes in Equity(in Euros)
Financial years
Key 2011 2012 2013 2014
A) RESULT OF THE PROFIT AND LOSS ACCOUNT 59100 -5092630900 -2274549900
I For valuation of financial instruments 50010 000 000
1 Available-for-sale financial assets 50011 000 000
2 Other revenuesexpenses 50012 000 000
II For cash flow hedges (coverage) 50020 000 000
III Grants donations and legacies received 50030 000 000
IV For actuarial profits and losses and other adjustments 50040 000 000
V For non-current assets and related liabilities maintained
for sale
50050 000 000
VI Conversion Differences 50060 000 000
VII Tax effect 50070 000 000
B) Total revenues and expenses allocated directly in equity (I + II
+ III + IV +V+VI+VII)
59200 000 000
VIII For valuation of financial instruments 50080 000 000
1 Available-for-sale financial assets 50081 000 000
2 Other revenuesexpenses 50082 000 000
IX For cash flow hedges (coverage) 50090 000 000
X Grants donations and legacies received 50100 000 000
XI For non-current assets and related liabilities maintained
for sale
50110 000 000
XII T ranslation differences 50120 000 000
XIII Tax effect 50130 000 000
C) Total transfers to the profit and loss account (VIII + IX + X + XI+
XII+ XIII)
59300 000 000
TOTAL RECOGNISED EXPENDITURE AND REVENUES (A + B + C) 59400 -5092630900 -2274549900
S O C I E D A D E J E M P L O S L | C O M P A N Y R E P O R T
W W W I N F O E M P R E S A C O M 25
Cash Flows(in Euros)
Financial years
Key 2011 2012 2013 2014
1 Financial year result before tax 61100 -5424982300 -1786908500
2 Profit amp Loss adjustments 61200 4984588300 1571951900
a) Amortisation of fixed assets (+) 61201 18197700 12851400
b) Valuation adjustments due to deterioration (+) 61202 3792017100 1023922600
c) Change in provisions (+) 61203 1128006900 157409600
d) Allocation of grants () 61204 000 000
e) Results for derecognitions and transfers of fixed assets (+) 61205 -8441000 -300
f) Results for derecognitions and transfers of financial
instruments (+)
61206 000 -63177500
g) Financial revenues () 61207 -24914900 -26494500
h) Financial expenses (+) 61208 270227700 476090600
j) Change in fair value of financial instruments (+) 61210 000 000
k) Other revenues and expenses (+) 61211 -190505200 -8650000
3 Changes in current capital 61300 -1395076900 48568400
a) Stocks (+) 61301 204651700 62689600
b) Debtors and other accounts receivable (+) 61302 -1215763600 36637800
c) Other current assets (+) 61303 29929500 5136500
d) Creditors and other accounts payable (+) 61304 -413894500 -55895500
e) Other current liabilities (+) 61305 000 000
f) Other non-current assets and liabilities (+) 61306 000 000
4 Other cash flows from operating activities 61400 1170857800 -132232900
a) Interest payments () 61401 -270227700 -476090600
b) Receivables from dividends (+) 61402 000 000
c) Interest receivables (+) 61403 24914900 26494500
d) Tax on profit receivables (payments) (+) 61404 1416170600 317363200
e) Other payments (receivables) (+) 61405 000 000
5 Cash flows from operating activities (1 + 2 + 3 + 4) 61500 -664613100 -298621100
6 Payments for investments () 62100 -224200 -10000
a) Group companies and sister companies 62101 000 000
b) Fixed intangible assets 62102 000 000
c) (Tangible) fixed assets 62103 -224200 -10000
d) Real estate investments 62104 000 000
e) Other financial assets 62105 000 000
f) Non-current assets maintained for sale 62106 000 000
g) Business unit 62107 000 000
h) Other assets 62108 000 000
S O C I E D A D E J E M P L O S L | C O M P A N Y R E P O R T
W W W I N F O E M P R E S A C O M 26
Financial years
Key 2011 2012 2013 2014
7 Receivables from the sale of investments (+) 62200 4689500 1400
a) Group companies and sister companies 62201 000 000
b) Fixed intangible assets 62202 000 000
c) (Tangible) fixed assets 62203 1171100 1400
d) Real estate investments 62204 000 000
e) Other financial assets 62205 3518400 000
f) Non-current assets maintained for sale 62206 000 000
g) Business unit 62207 000 000
h) Other assets 62208 000 000
8 Cash flows from investment activities (6 + 7) 62300 4465300 -8600
9 Receivables and payments for equity instruments 63100 000 000
a) Issuance of equity instruments () 63101 000 000
b) Amortisation of equity instruments () 63102 000 000
c) Acquisition of own equity instruments () 63103 000 000
d) T ransfer of own equity instruments (+) 63104 000 000
e) Grants donations and legacies received (+) 63105 000 000
10 Receivables and payments for financial liability instruments 63200 665197500 300026300
a) Issuance 63201 10558799100 1950000000
1 Obligations and other negotiable securities (+) 63202 000 000
2 Debts with credit institutions (+) 63203 8799100 000
3 Debts with group companies and sister companies (+) 63204 10550000000 1950000000
4 Debts with special characteristics (+) 63205 000 000
5 Other debts (+) 63206 000 000
b) Repayment and amortisation of 63207 -9893601600 -1649973700
1 Obligations and other negotiable securities () 63208 000 000
3 Debts with group companies and sister companies () 63210 -9889617600 -1603328000
4 Debts with special characteristics () 63211 000 000
5 Other debts () 63212 -111200 -781300
11 Dividend payments and remunerations from other equity
instruments
63300 000 000
a) Dividends () 63301 000 000
b) Remuneration of other equity instruments () 63302 000 000
12 Cash flows from financing activities (9 + 10 + 11) 63400 665197500 300026300
D) Effect of changes in exchange types 64000 000 000
E) NET INCREASEDECREASE IN CASH OR EQUIVALENTS (5 + 8
+ 12 + D)
65000 5049700 1396600
Cash or equivalents at the start of the financial year 65100 30698100 25648400
Cash or equivalents at the end of the financial year 65200 25648400 27045000
S O C I E D A D E J E M P L O S L | C O M P A N Y R E P O R T
W W W I N F O E M P R E S A C O M 27
AS N E F E M P R E S AS
There are no defaults recorded in the ASNEF (Spanish National Association of Finance Companies) Empresas (Companies) file
RAI (Unpaid Receivables Registry)
File made up of information on defaults exclusively by legal persons that are
equal to or greater than euro300
The information in this file remains for 30 months
CH E CK D E F A U LTS A N D D E B TS ( R A I )
S O C I E D A D E J E M P L O S L | C O M P A N Y R E P O R T
W W W I N F O E M P R E S A C O M 28
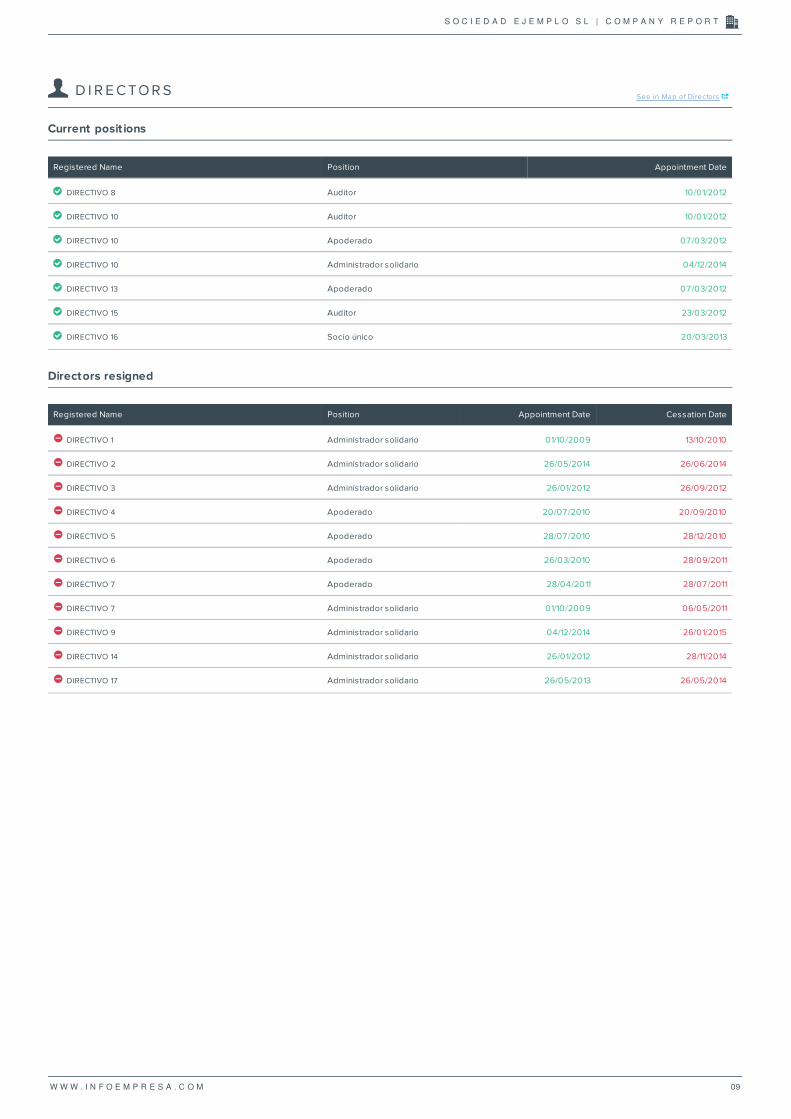
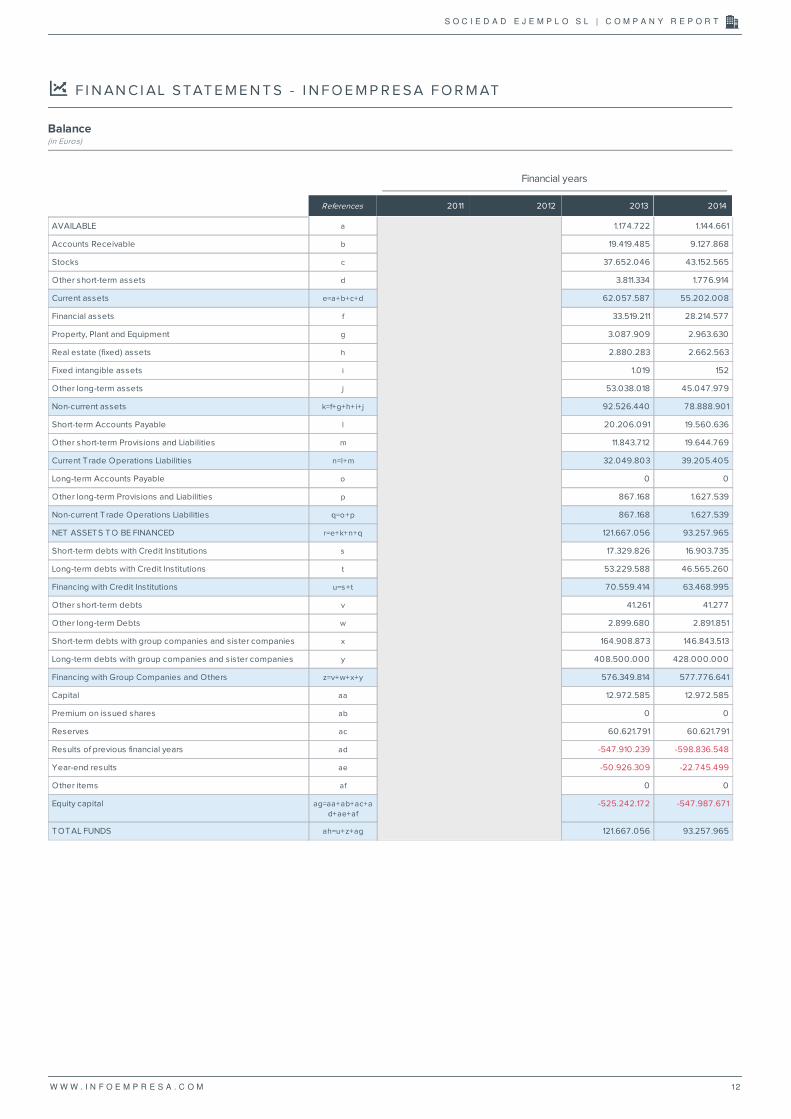
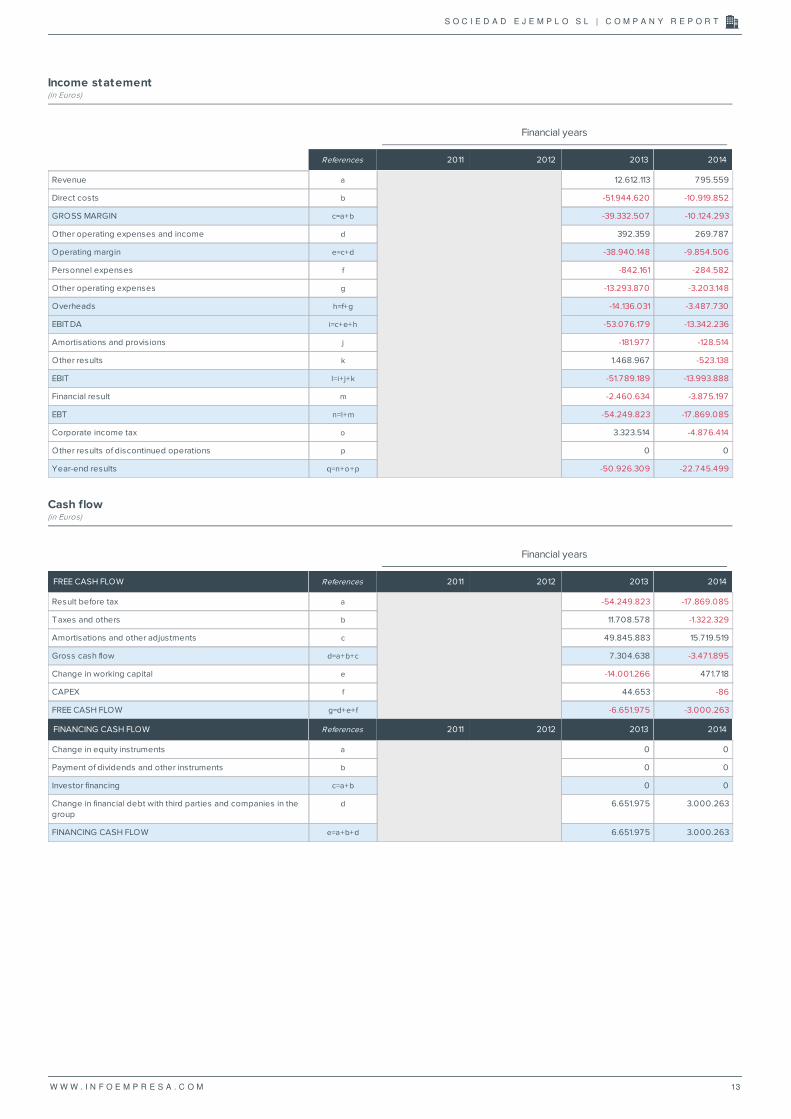
Income statement(in Euros)
Financial years
References 2011 2012 2013 2014
Revenue a 12612113 795559
Direct costs b -51944620 -10919852
GROSS MARGIN c=a+b -39332507 -10124293
Other operating expenses and income d 392359 269787
Operating margin e=c+d -38940148 -9854506
Personnel expenses f -842161 -284582
Other operating expenses g -13293870 -3203148
Overheads h=f+g -14136031 -3487730
EBITDA i=c+e+h -53076179 -13342236
Amortisations and provisions j -181977 -128514
Other results k 1468967 -523138
EBIT l=i+j+k -51789189 -13993888
Financial result m -2460634 -3875197
EBT n=l+m -54249823 -17869085
Corporate income tax o 3323514 -4876414
Other results of discontinued operations p 0 0
Year-end results q=n+o+p -50926309 -22745499
Cash flow(in Euros)
Financial years
FREE CASH FLOW References 2011 2012 2013 2014
Result before tax a -54249823 -17869085
Taxes and others b 11708578 -1322329
Amortisations and other adjustments c 49845883 15719519
Gross cash flow d=a+b+c 7304638 -3471895
Change in working capital e -14001266 471718
CAPEX f 44653 -86
FREE CASH FLOW g=d+e+f -6651975 -3000263
FINANCING CASH FLOW References 2011 2012 2013 2014
Change in equity instruments a 0 0
Payment of dividends and other instruments b 0 0
Investor financing c=a+b 0 0
Change in financial debt with third parties and companies in the
group
d 6651975 3000263
FINANCING CASH FLOW e=a+b+d 6651975 3000263
S O C I E D A D E J E M P L O S L | C O M P A N Y R E P O R T
W W W I N F O E M P R E S A C O M 13
Composit ion of Net Worth(in Euros)
Financial years
References 2011 2012 2013 2014
Capital a 12972585 12972585
Premium on issued shares b 0 0
Reserves c 60621791 60621791
Results of previous financial years d -547910239 -598836548
Year-end results e -50926309 -22745499
Other items f 0 0
Equity capital g=a+b+c+d+e+f -525242172 -547987671
Graphic showing the composit ion of Equity
Capital
Premium on issued shares
Reserves
Results of previous financial years
Year-end results
Other items
Equity capital
2013 2014
-800000000
-600000000
-400000000
-200000000
0
200000000
Profit and loss statement in percentages(in )
Financial years
References 2011 2012 2013 2014
Revenue aa 10000 10000
Direct costs ba -41186 -137260
GROSS MARGIN ca -31186 -127260
Other operating expenses and income da 311 3391
Operating margin ea -30875 -123869
Personnel expenses fa -668 -3577
Other operating expenses ga -10541 -40263
Overheads ha -11208 -43840
EBITDA ia -42083 -167709
Amortisations and provisions ja -144 -1615
Other results ka 1165 -6576
EBIT la -41063 -175900
Financial result ma -1951 -48710
EBT na -43014 -224610
Corporate income tax oa 2635 -61295
Other results of discontinued operations pa 000 000
Year-end results qa -40379 -285906
S O C I E D A D E J E M P L O S L | C O M P A N Y R E P O R T
W W W I N F O E M P R E S A C O M 14
E C O N O M I C AN D F I N AN C I AL C O M M I T T E E
Economic and Financial Committee
Financial years
Growth indicators 2011 2012 2013 2014
Change in Revenues -9559 -9369
Total Number of Employees 500 500
Change () -7500 000
Cash Flow Indicators 2011 2012 2013 2014
Gross cash flow euro7304638 euro-3471895
on Revenues 5792 -43641
Change in working capital euro-14001266 euro471718
on Revenues -11101 5929
CAPEX euro44653 euro-86
on Revenues 035 -001
FREE CASH FLOW euro-6651975 euro-3000263
on Revenues -5274 -37713
Financial Structure Indicators 2011 2012 2013 2014
Working Capital Ratio 040 041
Financial Autonomy Ratio 077 080
Debt Ratio 129 124
Long-term Debt Ratio 089 087
Short-term Debt Ratio 041 037
Cost Ratio of Third Party Financing (Financial Debt) 333 681
Third-party Financing Cost ROE 034 164
Solvency Indicators 2011 2012 2013 2014
Ratio of Immediate Availability 001 001
Cash Ratio 010 005
Solvency Ratio 029 027
Guarantee Ratio 023 020
Asset Management Indicators 2011 2012 2013 2014
Average Receivables Collection Period 43992 258222
Average Payment Period 12589 41068
Stock Turnover 57551 139863
Profitability Indicators 2011 2012 2013 2014
Economic Profitability (ROI) -3350 -1044
Financial Profitability (ROE) 970 415
Results Indicators 2011 2012 2013 2014
Gross Margin Ratio -21915 -122532
EBITDA Ratio -42083 -167709
EBIT Ratio -41063 -175900
EBT Ratio -43014 -224610
Financial Year Result Ratio -40379 -285906
Cost Indicators 2011 2012 2013 2014
Sales - Direct Cost 31915 132532
Sales - Overheads 11208 43840
Working Capital 2011 2012 2013 2014
Working Capital euro-152272176 euro-147791922
S O C I E D A D E J E M P L O S L | C O M P A N Y R E P O R T
W W W I N F O E M P R E S A C O M 15
Optimal Precaution NegativeFinancial Structure Indicators
Working Capital Ratio (Rt_Cir)
120 0 0 10 0 0 0
Ind icates the capacity o f a companys as s et to be converted
into availab le funds Repres ents the weighting o f current
as s ets relative to to tal as s ets
G reen Rt_Cir gt = 0 50 Yel low Rt_Cir gt = 0 30 Y lt 0 50 Red Rt_Cir
lt 0 30
041Variation
2014 - 2013
001
Financial Autonomy Ratio (Rt_Aut)
20 0 0 0 (310 0 0 +320 0 0 )
Ind icates the companys autonomy with res pect to third
parties s howing the percentage o f own (company) res ources
emp loyed by the company relative to to tal current liab ilities
o r third party res ources
G reen Rt_Aut gt = 0 70 Yel low Rt_Aut gt 0 40 Y lt 0 70 Red Rt_Aut
lt = 0 40
080Variation
2014 - 2013
003
Debt Ratio (Rt_End)
(310 0 0 +320 0 0 ) 20 0 0 0
Ind icates the companys leverage s howing the percentage o f
third party res ources emp loyed by the company fo r financing
relative to own res ources
G reen Rt_End = 1 50 Red Rt_End gt = 250
124Variation
2014 - 2013
005
Long-term Debt Ratio (Rt_Endlp)
310 0 0 20 0 0 0
Ind icates the weighting o f long -term external financing
relative to own res ources
G reen Rt_End =1 0 0 Yel low Rt_End gt 1 50 Y Rt_Endlp Rt_End gt
0 50 Y 1 50 Y Rt_Endlp Rt_End lt =0 50
087Variation
2014 - 2013
001
Short-term Debt Ratio (Rt_Endcp)
320 0 0 20 0 0 0
Ind icates the weighting o f s ho rt-term external financing
relative to own res ources
G reen Rt_End 1 50 Y Rt_Endcp Rt_End gt 0 5 Y 1 50 Y Rt_Endcp
Rt_End gt = 0 8
037Variation
2014 - 2013
004
Cost Ratio of Third Party Financing (Financial
Debt) (Rt_Cfex)
(4150 0 ( (3120 0 de n + 3230 0 de n + 3120 0 de n_1 + 3230 0 de n_1 )
2)) 10 0
Ind icates the percentage rep res ented by the companys cos t
o f financing with external deb t
G reen Rt_Cfex Rt_Ref =0 Yel low Rt_Cfex Rt_Ref gt 0 50 Y = 1
681 Variation
2014 - 2013
003 pp
Third-party Financing Cost ROE (Rt_Cfexref)
Rt_Cfex Rt_Ref
Ind icates the weighting o f Financial Debt fund ing cos ts
relative to s hareho lder p ro fitab ility
G reen Rt_Cfexref =0 Yel low Rt_Cfexref gt = 0 50 Y =1
164Variation
2014 - 2013
130
S O C I E D A D E J E M P L O S L | C O M P A N Y R E P O R T
W W W I N F O E M P R E S A C O M 16
Optimal Precaution NegativeSolvency Indicators
Ratio of Immediate Availability (Rt_Diin)
(1250 0 +1270 0 ) 320 0 0
Ind icates the companys capacity to s ettle its s ho rt-term
debts in cas h availab le in the bank accounts and in cas h
reg is ters
G reen Rt_Di in gt = 0 15 Yel low Rt_Di in gt 0 0 5 Y lt 0 15 Red Rt_Di in
lt = 0 0 5
001Variation
2014 - 2013
000
Cash Ratio (Rt_Tes)
(1250 0 +1270 0 +1230 0 ) 320 0 0
Ind icates the companys s hort-term degree o f l iquid ity fo r
s ettling its debts
G reen Rt_Tes gt = 0 75 Yel low Rt_Tes gt 0 50 Y lt 0 75 Red Rt_Tes
lt = 0 50
005Variation
2014 - 2013
005
Solvency Ratio (Rt_Sol)
120 0 0 320 0 0
Ind icates the relations hip between current as s ets and liquid
liab ilities
G reen Rt_Sol gt = 1 5 Yel low Rt_Sol gt 1 Y lt 1 5 Red Rt_Sol lt = 1
027Variation
2014 - 2013
002
Guarantee Ratio (Rt_Gar)
10 0 0 0 (310 0 0 +320 0 0 )
Ind icates the to tal capacity o f a company to s ettle the
payment o f all its debts
G reen Rt_G a r gt = 1 5 Yel low Rt_G a r gt 1 Y lt 1 5 Red Rt_G a r lt = 1
020Variation
2014 - 2013
003
Optimal Precaution NegativeAsset Management Indicators
Average Receivables Collection Period
(Rt_Cobro)
Norma l Account Type ( ( (12310 + 12320 + 12330 ) 1 21 ) (40 10 0 +
40 50 0 )) 36 5 Abbrevia ted SME or Mixed Account Type ( ( (12380 +
1239 0 ) 1 21 ) (40 10 0 + 40 50 0 )) 36 5
The average receivab les co llection period is the number o f
days in which the company charges its c lients
G reen Rt_Cobro =6 5 Y 9 5
258222Variation
2014 - 2013
2142
Average Payment Period (Rt_Pago)
Norma l Account Type ( ( (32510 + 32520 + 32530 ) 1 21 ) (40 40 0 +
40 710 + 40 740 )) 36 5 Abbrevia ted SME or Mixed Account Type
( (3250 0 1 21 ) (40 40 0 + 40 70 0 )) 36 5
The average payment period is the number o f days in which
the company s ettles its trade ob ligations
G reen Rt_Pa go =6 5 Y 9 5
41068Variation
2014 - 2013
285
Stock Turnover (Rt_Exist)
( ( (1220 0 de n + 1220 0 de n_1 ) 2) 40 40 0 de n ) 36 5
Ind icates the number o f days needed to s ell s tocks
G reen Rt_Exist =6 0 Y 9 0
139863Variation
2014 - 2013
823
Optimal Precaution NegativeProfitability Indicators
Economic Profitability (ROI) (Rt_Roa)
(49 10 0 10 0 0 0 ) 10 0
Ind icates the p ro fitab ility o f the companys inves tment
meaning the p ro fitab ility o f the as s et befo re company taxes
and financial res ults
G reen Rt_Roa gt = 10 Yel low Rt_Roa gt 0 Y lt 10 Red Rt_Roa
lt = 0
-1044 Variation
2014 - 2013
023 pp
Financial Profitability (ROE) (Rt_Ref)
(49 50 0 20 0 0 0 ) 10 0
Meas ures the return on inves tment made by s hareho lders
G reen Rt_Ref gt = 10 Yel low Rt_Ref gt 0 Y lt 10 Red Rt_Ref lt =
0
415 Variation
2014 - 2013
006 pp
S O C I E D A D E J E M P L O S L | C O M P A N Y R E P O R T
W W W I N F O E M P R E S A C O M 17
Optimal Precaution NegativeResults Indicators
Gross Margin Ratio (Rt_Mabr)
( (40 10 0 - 40 40 0 ) 40 10 0 ) 10 0
Deducting the d irect cos ts o f generating s ales - i e the cos t
o f merchand is e s o ld o r p rovis ions tells you the return on
s ales
G reen Rt_Ma br gt = 40 Yel low Rt_Ma br gt =20 Y lt 40 Red
Rt_Ma br lt 20
-1225 Variation
2014 - 2013
1006 pp
EBITDA Ratio (Rt_Ebitda)
( (49 10 0 + 40 80 0 ) 40 10 0 ) 10 0
Ind icates the percentage rep res ented by EBITDA (earnings
befo re interes t taxes depreciation and amortis ation) relative
to the companys revenues
G reen Rt_Ebi tda gt = 10 Yel low Rt_Ebi tda gt 0 Y lt 10 Red
Rt_Ebi tda lt =0
-1677 Variation
2014 - 2013
1256 pp
EBIT Ratio (Rt_Ebit)
(49 10 0 40 10 0 ) 10 0
Ind icates the percentage rep res ented by EBIT (earnings
befo re interes t amp taxes ) relative to the companys revenues
G reen Rt_Ebi t gt = 8 Yel low Rt_Ebi t gt 0 Y lt 5 Red Rt_Ebi t
lt =0
-1759 Variation
2014 - 2013
1348 pp
EBT Ratio (Rt_Ebt)
(49 30 0 40 10 0 ) 10 0
Ind icates the percentage rep res ented by EBT (earnings
befo re taxes ) relative to the companys revenues
G reen Rt_Ebt gt = 5 Yel low Rt_Ebt gt 0 Y lt 8 Red Rt_Ebt lt =0
-2246 Variation
2014 - 2013
1816 pp
Financial Year Result Ratio (Rt_Rneta)
(49 50 0 40 10 0 ) 10 0
Ind icates the percentage rep res ented by the financial year net
p ro fit relative to the companys revenues To tal p ro fitab ility
ob tained fo r each currency unit s o ld
G reen Rt_Nneta gt 0 Red Rt_Nneta lt =0
-2859 Variation
2014 - 2013
2455 pp
S O C I E D A D E J E M P L O S L | C O M P A N Y R E P O R T
W W W I N F O E M P R E S A C O M 18
AN N UAL AC C O U N T S - B U S I N E S S R E GI S T E R F O R M AT
Balance(in Euros)
Financial years
Key 2011 2012 2013 2014
a) NON-CURRENT ASSETS 11000 9252644000 7888890100
I Fixed intangible assets 11100 101900 15200
1 Development 11110 000 000
2 Concessions 11120 000 000
3 Patents licences trademarks and similar 11130 000 000
4 Goodwill 11140 000 000
5 IT applications 11150 101900 15200
6 Investigation 11160 000 000
7 Intellectual property 11180 000 000
8 Rights relating to the emission of greenhouse gases 11190 000 000
9 Other fixed intangible assets 11170 000 000
II Property Plant and Equipment 11200 308790900 296363000
1 Land and structures 11210 000 000
2 Technical facilities and other (tangible) fixed assets 11220 100606600 88178700
3 In-progress fixed assets and advance payments 11230 208184300 208184300
III Investment Property 11300 288028300 266256300
1 Land 11310 253883200 253883200
2 Structures 11320 34145100 12373100
IV Long-term investments in group companies and sister
companies
11400 3333590100 2803860500
1 Equity instruments 11410 2016884300 2016884300
2 Credits to companies 11420 1316705800 786976200
2 Credits to companies 11430 000 000
4 Derivatives 11440 000 000
5 Other financial assets 11450 000 000
6 Other investments 11460 000 000
V Long-term financial investments 11500 18331000 17597200
1 Equity instruments 11510 131500 131500
2 Credits to third parties 11520 000 000
2 Credits to companies 11530 000 000
4 Derivatives 11540 000 000
5 Other financial assets 11550 18199500 17465700
6 Other investments 11560 000 000
VI Deferred tax assets 11600 5303801800 4504797900
VII Non-current trade debts 11700 000 000
S O C I E D A D E J E M P L O S L | C O M P A N Y R E P O R T
W W W I N F O E M P R E S A C O M 19
Financial years
Key 2011 2012 2013 2014
B) CURRENT ASSETS 12000 6205758700 5520200800
I Non-current assets maintained for sale 12100 000 000
II Stocks 12200 3765204600 4315256500
1 Commercial stocks 12210 000 000
2 Raw materials and other provisions 12220 1016357100 1607654500
3 Semi-finished products 12230 000 000
a) Long term production cycle 12231 000 000
b) Short term production cycle 12232 000 000
4 Finished products 12240 1532426200 1494815100
a) Long term production cycle 12241 1532426200 1494815100
b) Short term production cycle 12242 000 000
5 Sub-products waste and recovered materials 12250 000 000
6 Advance payments to providers 12260 1216421300 1212786900
III T rade debtors and other accounts receivable 12300 1941948500 912786800
1 Client receivables for service provisions and sales 12310 976116700 7566300
a) Client receivables for long-term service provisions
and sales
12311 000 000
b) Client receivables for short-term service
provisions and sales
12312 976116700 7566300
2 Clients group companies and sister companies 12320 204266100 205849500
3 Miscellaneous debtors 12330 716132800 698547000
4 Staff 12340 1153200 000
5Current tax assets 12350 000 000
6 Other credits with Public Administration bodies 12360 44279700 824000
7 Called-up share capital 12370 000 000
IV Short-term investments in group companies and sister
companies
12400 381133400 177691400
1 Equity instruments 12410 000 000
2 Credits to companies 12420 000 000
2 Credits to companies 12430 000 000
4 Derivatives 12440 000 000
5 Other financial assets 12450 381133400 177691400
6 Other investments 12460 000 000
V Short-term financial investments 12500 91823800 87421100
1 Equity instruments 12510 000 000
2 Credits to companies 12520 3304400 2774900
2 Credits to companies 12530 305000 305000
4 Derivatives 12540 000 000
5 Other financial assets 12550 88214400 84341200
6 Other investments 12560 000 000
VI Short-term accruals 12600 000 000
VII Cash and other equivalent liquid assets 12700 25648400 27045000
1 T reasury 12710 25648400 27045000
2 Other equivalent liquid assets 12720 000 000
TOTAL ASSETS (A + B) 10000 15458402700 13409090900
S O C I E D A D E J E M P L O S L | C O M P A N Y R E P O R T
W W W I N F O E M P R E S A C O M 20
Financial years
Key 2011 2012 2013 2014
A) EQUITY 20000 -52524217200 -54798767100
A-1) Equity capital 21000 -52524217200 -54798767100
I Capital 21100 1297258500 1297258500
1 Authorised capital 21110 1297258500 1297258500
2 (Uncalled share capital) 21120 000 000
II Premium on issued shares 21200 000 000
IIIReserves 21300 6062179100 6062179100
1 Legal and statutory reserves 21310 259451700 259451700
2 Other reserves 21320 5802727400 5802727400
3 Revaluation reserve 21330 000 000
IV (Companys equity shares and interests) 21400 000 000
V Results of previous financial years 21500 -54791023900 -59883654800
1 Carryover 21510 000 000
2 (Negative results of previous financial years) 21520 -54791023900 -59883654800
VI Other member contributions 21600 000 000
VII Financial year profit amp loss 21700 -5092630900 -2274549900
VIII (Interim dividend) 21800 000 000
IX Other equity instruments 21900 000 000
A-2) Adjustments for changes in value 22000 000 000
I Available-for-sale financial assets 22100 000 000
II Hedging transactions 22200 000 000
III Non-current assets and related liabilities maintained for
sale
22300 000 000
IV T ranslation difference 22400 000 000
V Others 22500 000 000
A3) Grants donations and legacies received 23000 000 000
B) NON-CURRENT LIABILIT IES 31000 46549643600 47908465000
I Long-term provisions 31100 75132300 75132300
1 Long-term staff benefit obligations 31110 000 000
2 Environmental actions 31120 000 000
3 Provisions for restructuring 31130 000 000
4 Other provisions 31140 75132300 75132300
II Long-term debts 31200 5612926800 4945711100
1 Obligations and other negotiable securities 31210 000 000
2 Debts with credit institutions 31220 5322958800 4656526000
3 Financial lease creditors 31230 000 000
4 Derivatives 31240 000 000
5 Other financial liabilities 31250 289968000 289185100
III Long-term debts with group companies and sister
companies
31300 40850000000 42800000000
IV Deferred tax liabilities 31400 11584500 87621600
V Long-term accruals 31500 000 000
VI Non-current trade creditors 31600 000 000
VII Long-term debt with special characteristics 31700 000 000
S O C I E D A D E J E M P L O S L | C O M P A N Y R E P O R T
W W W I N F O E M P R E S A C O M 21
Financial years
Key 2011 2012 2013 2014
C) CURRENT LIABILIT IES 32000 21432976300 20299393000
I Liabilities associated with non-current assets maintained for
sale
32100 000 000
II Short-term provisions 32200 1184371200 1964476900
1 Provisions for rights relating to the emission of
greenhouse gases
32210 000 000
2 Other provisions 32220 1184371200 1964476900
III Short-term debts 32300 17 37108700 1694501200
1 Obligations and other negotiable securities 32310 000 000
2 Debts with credit institutions 32320 17 32982600 1690373500
3 Financial lease creditors 32330 000 000
4 Derivatives 32340 000 000
5 Other financial liabilities 32350 4126100 4127700
IV Short-term debts with group companies and sister
companies
32400 16490887300 14684351300
V T rade creditors and other accounts payable 32500 2020609100 1956063600
1 Providers 32510 1573868600 1464849400
a) Long-term providers 32511 000 000
b) Short-term providers 32512 1573868600 1464849400
2 Providers group companies and sister companies 32520 116553500 78369000
3 Miscellaneous creditors 32530 59204100 60136000
4 Personnel (remunerations pending payment) 32540 1017300 000
5 Current tax liabilities 32550 000 000
6 Other debts with Public Administration bodies 32560 182162900 275878200
7 Advance payments from clients 32570 87802700 76831000
VI Short-term accruals 32600 000 000
VII Short-term debt with special characteristics 32700 000 000
TOTAL EQUITY AND LIABILIT IES (A + B + C) 30000 15458402700 13409090900
S O C I E D A D E J E M P L O S L | C O M P A N Y R E P O R T
W W W I N F O E M P R E S A C O M 22
Income statement(in Euros)
Financial years
Key 2011 2012 2013 2014
1 Net turnover 40100 1261211300 79555900
a) Sales 40110 1230715400 61382900
b) Service provisions 40120 30495900 18173000
c) Financial revenues from holding companies 40130 000 000
2 Change in stocks of finished and semi-finished products 40200 -1169328600 -37611100
3 Capital asset betterments and improvements4 40300 000 000
4Provisions 40400 -4025133400 -1054374100
a) Consumption of merchandise 40410 000 000
b) Consumption of raw materials and other consumables 40420 -1327808600 000
c) Work carried out by other companies 40430 -17488500 -30451500
d) Deterioration in merchandise raw materials and other
provisions
40440 -2679836300 -1023922600
5 Other operating expenses 40500 39235900 26978700
a) Casual income and other current operating income 40510 39235900 26978700
b) Operating grants incorporated into the financial year profit
amp loss
40520 000 000
6 Personnel expenses 40600 -84216100 -28458200
a) Wages salaries and similar expenses 40610 -72780100 -22841400
b) Social security contributions 40620 -11436000 -5616800
c) Provisions 40630 000 000
7 Other operating expenses 40700 -1329387000 -320314800
a) Outsourcing 40710 -167392300 -123318300
b) Fees 40720 -33987800 -39586900
c) Losses deterioration and change in provisions for trade
operations
40730 -1128006900 -157409600
d) Other current operating expenses 40740 000 000
e) Expenses relating to the emission of greenhouse
gases
40750 000 000
8 Depreciation of fixed assets 40800 -18197700 -12851400
9 Allocation of non-financial asset grants and others 40900 000 000
10 Provision excesses 41000 000 000
11 Deterioration and result for transfers of fixed assets 41100 -45795000 300
a) Deterioration and losses 41110 -54236000 000
b) Results for transfers and others 41120 8441000 300
c) Deterioration and results for transfers of holding company
fixed assets
41130 000 000
12 Negative difference in business combinations 41200 000 000
13 Other results 41300 192691700 -52314100
S O C I E D A D E J E M P L O S L | C O M P A N Y R E P O R T
W W W I N F O E M P R E S A C O M 23
Financial years
Key 2011 2012 2013 2014
A1) OPERATING PROFIT (1 + 2 + 3 + 4 + 5 + 6 + 7 + 8 + 9 + 10 + 11
+ 12 + 13)
49100 -5178918900 -1399388800
14 Financial revenues 41400 24914900 26494500
a) Of shareholdings in equity instruments 41410 4200 1400
a 1) In group companies and sister companies 41411 000 000
a 2) In third parties 41412 4200 1400
b) Of negotiable securities and other financial instruments 41420 24910700 26493100
b 1) Of group companies and sister companies 41421 24575700 22972200
b 2) Of third parties 41422 335000 3520900
c) Allocation of financial grants donations and legacies 41430 000 000
15 Financial expenses 41500 -270227700 -476090600
a) For debts with group companies and associated
companies
41510 -270227700 -471686500
b) For debts with third parties 41520 000 -4404100
c) For updating provisions 41530 000 000
16 Change in fair value of financial instruments 41600 000 000
a) T rading portfolio and others 41610 000 000
b) Allocation to financial year profit amp loss account on
available-for-sale financial assets
41620 000 000
17 Exchange differences 41700 -7 50600 -1101100
18 Deterioration and result for transfers of financial instruments 41800 000 63177500
a) Deteriorations and losses 41810 000 000
b) Results for transfers and others 41820 000 63177500
19 Other financial expenses and revenues 42100 000 000
a) Capitalisation of financial assets 42110 000 000
b) Financial revenues from creditors agreements 42120 000 000
c) Other revenues and expenses 42130 000 000
A2) FINANCIAL RESULT (14 + 15 + 16 + 17 18 + 19) 49200 -246063400 -387519700
A3) PRE-TAX RESULT (A1 + A2) 49300 -5424982300 -1786908500
20 Tax on profits 41900 332351400 -487641400
A4) FINANCIAL YEAR PROFIT amp LOSS FROM CONTINUING
OPERATIONS (A3 + 20)
49400 -5092630900 -2274549900
21 Financial year result from discontinued operations after tax 42000 000 000
A5) FINANCIAL YEAR RESULT (A4 + 21) 49500 -5092630900 -2274549900
S O C I E D A D E J E M P L O S L | C O M P A N Y R E P O R T
W W W I N F O E M P R E S A C O M 24
Changes in Equity(in Euros)
Financial years
Key 2011 2012 2013 2014
A) RESULT OF THE PROFIT AND LOSS ACCOUNT 59100 -5092630900 -2274549900
I For valuation of financial instruments 50010 000 000
1 Available-for-sale financial assets 50011 000 000
2 Other revenuesexpenses 50012 000 000
II For cash flow hedges (coverage) 50020 000 000
III Grants donations and legacies received 50030 000 000
IV For actuarial profits and losses and other adjustments 50040 000 000
V For non-current assets and related liabilities maintained
for sale
50050 000 000
VI Conversion Differences 50060 000 000
VII Tax effect 50070 000 000
B) Total revenues and expenses allocated directly in equity (I + II
+ III + IV +V+VI+VII)
59200 000 000
VIII For valuation of financial instruments 50080 000 000
1 Available-for-sale financial assets 50081 000 000
2 Other revenuesexpenses 50082 000 000
IX For cash flow hedges (coverage) 50090 000 000
X Grants donations and legacies received 50100 000 000
XI For non-current assets and related liabilities maintained
for sale
50110 000 000
XII T ranslation differences 50120 000 000
XIII Tax effect 50130 000 000
C) Total transfers to the profit and loss account (VIII + IX + X + XI+
XII+ XIII)
59300 000 000
TOTAL RECOGNISED EXPENDITURE AND REVENUES (A + B + C) 59400 -5092630900 -2274549900
S O C I E D A D E J E M P L O S L | C O M P A N Y R E P O R T
W W W I N F O E M P R E S A C O M 25
Cash Flows(in Euros)
Financial years
Key 2011 2012 2013 2014
1 Financial year result before tax 61100 -5424982300 -1786908500
2 Profit amp Loss adjustments 61200 4984588300 1571951900
a) Amortisation of fixed assets (+) 61201 18197700 12851400
b) Valuation adjustments due to deterioration (+) 61202 3792017100 1023922600
c) Change in provisions (+) 61203 1128006900 157409600
d) Allocation of grants () 61204 000 000
e) Results for derecognitions and transfers of fixed assets (+) 61205 -8441000 -300
f) Results for derecognitions and transfers of financial
instruments (+)
61206 000 -63177500
g) Financial revenues () 61207 -24914900 -26494500
h) Financial expenses (+) 61208 270227700 476090600
j) Change in fair value of financial instruments (+) 61210 000 000
k) Other revenues and expenses (+) 61211 -190505200 -8650000
3 Changes in current capital 61300 -1395076900 48568400
a) Stocks (+) 61301 204651700 62689600
b) Debtors and other accounts receivable (+) 61302 -1215763600 36637800
c) Other current assets (+) 61303 29929500 5136500
d) Creditors and other accounts payable (+) 61304 -413894500 -55895500
e) Other current liabilities (+) 61305 000 000
f) Other non-current assets and liabilities (+) 61306 000 000
4 Other cash flows from operating activities 61400 1170857800 -132232900
a) Interest payments () 61401 -270227700 -476090600
b) Receivables from dividends (+) 61402 000 000
c) Interest receivables (+) 61403 24914900 26494500
d) Tax on profit receivables (payments) (+) 61404 1416170600 317363200
e) Other payments (receivables) (+) 61405 000 000
5 Cash flows from operating activities (1 + 2 + 3 + 4) 61500 -664613100 -298621100
6 Payments for investments () 62100 -224200 -10000
a) Group companies and sister companies 62101 000 000
b) Fixed intangible assets 62102 000 000
c) (Tangible) fixed assets 62103 -224200 -10000
d) Real estate investments 62104 000 000
e) Other financial assets 62105 000 000
f) Non-current assets maintained for sale 62106 000 000
g) Business unit 62107 000 000
h) Other assets 62108 000 000
S O C I E D A D E J E M P L O S L | C O M P A N Y R E P O R T
W W W I N F O E M P R E S A C O M 26
Financial years
Key 2011 2012 2013 2014
7 Receivables from the sale of investments (+) 62200 4689500 1400
a) Group companies and sister companies 62201 000 000
b) Fixed intangible assets 62202 000 000
c) (Tangible) fixed assets 62203 1171100 1400
d) Real estate investments 62204 000 000
e) Other financial assets 62205 3518400 000
f) Non-current assets maintained for sale 62206 000 000
g) Business unit 62207 000 000
h) Other assets 62208 000 000
8 Cash flows from investment activities (6 + 7) 62300 4465300 -8600
9 Receivables and payments for equity instruments 63100 000 000
a) Issuance of equity instruments () 63101 000 000
b) Amortisation of equity instruments () 63102 000 000
c) Acquisition of own equity instruments () 63103 000 000
d) T ransfer of own equity instruments (+) 63104 000 000
e) Grants donations and legacies received (+) 63105 000 000
10 Receivables and payments for financial liability instruments 63200 665197500 300026300
a) Issuance 63201 10558799100 1950000000
1 Obligations and other negotiable securities (+) 63202 000 000
2 Debts with credit institutions (+) 63203 8799100 000
3 Debts with group companies and sister companies (+) 63204 10550000000 1950000000
4 Debts with special characteristics (+) 63205 000 000
5 Other debts (+) 63206 000 000
b) Repayment and amortisation of 63207 -9893601600 -1649973700
1 Obligations and other negotiable securities () 63208 000 000
3 Debts with group companies and sister companies () 63210 -9889617600 -1603328000
4 Debts with special characteristics () 63211 000 000
5 Other debts () 63212 -111200 -781300
11 Dividend payments and remunerations from other equity
instruments
63300 000 000
a) Dividends () 63301 000 000
b) Remuneration of other equity instruments () 63302 000 000
12 Cash flows from financing activities (9 + 10 + 11) 63400 665197500 300026300
D) Effect of changes in exchange types 64000 000 000
E) NET INCREASEDECREASE IN CASH OR EQUIVALENTS (5 + 8
+ 12 + D)
65000 5049700 1396600
Cash or equivalents at the start of the financial year 65100 30698100 25648400
Cash or equivalents at the end of the financial year 65200 25648400 27045000
S O C I E D A D E J E M P L O S L | C O M P A N Y R E P O R T
W W W I N F O E M P R E S A C O M 27
AS N E F E M P R E S AS
There are no defaults recorded in the ASNEF (Spanish National Association of Finance Companies) Empresas (Companies) file
RAI (Unpaid Receivables Registry)
File made up of information on defaults exclusively by legal persons that are
equal to or greater than euro300
The information in this file remains for 30 months
CH E CK D E F A U LTS A N D D E B TS ( R A I )
S O C I E D A D E J E M P L O S L | C O M P A N Y R E P O R T
W W W I N F O E M P R E S A C O M 28
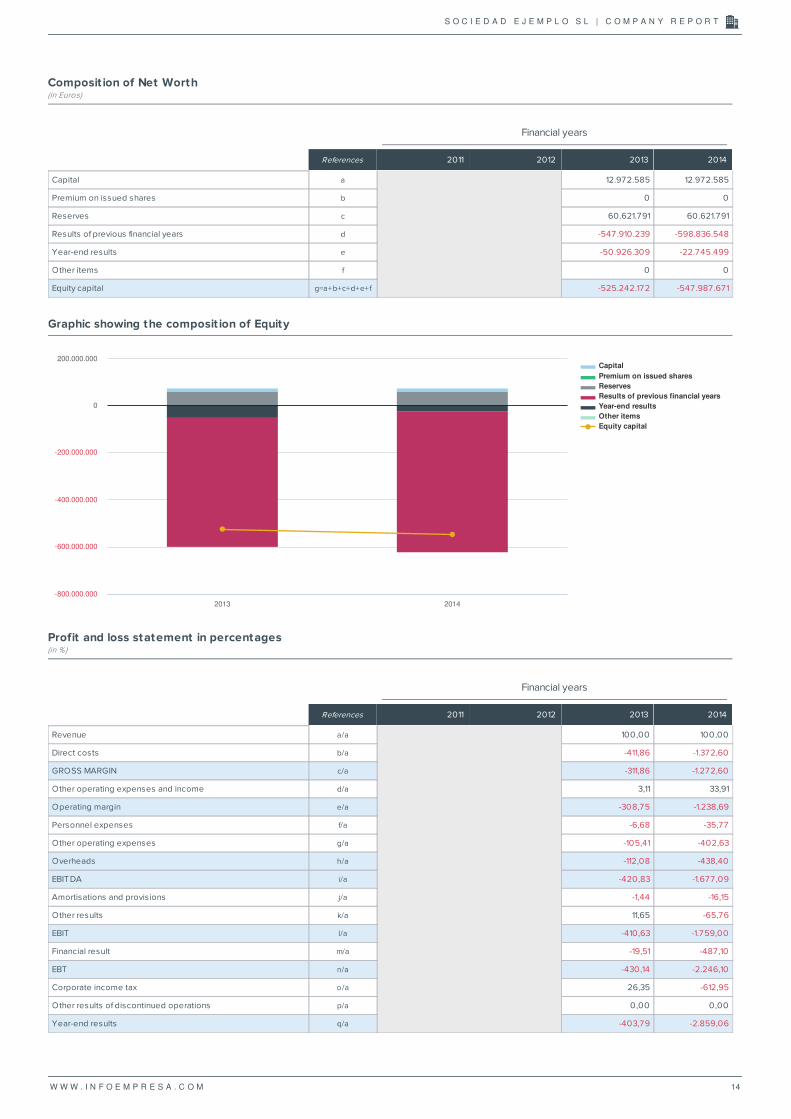

Financial years
Key 2011 2012 2013 2014
A) EQUITY 20000 -52524217200 -54798767100
A-1) Equity capital 21000 -52524217200 -54798767100
I Capital 21100 1297258500 1297258500
1 Authorised capital 21110 1297258500 1297258500
2 (Uncalled share capital) 21120 000 000
II Premium on issued shares 21200 000 000
IIIReserves 21300 6062179100 6062179100
1 Legal and statutory reserves 21310 259451700 259451700
2 Other reserves 21320 5802727400 5802727400
3 Revaluation reserve 21330 000 000
IV (Companys equity shares and interests) 21400 000 000
V Results of previous financial years 21500 -54791023900 -59883654800
1 Carryover 21510 000 000
2 (Negative results of previous financial years) 21520 -54791023900 -59883654800
VI Other member contributions 21600 000 000
VII Financial year profit amp loss 21700 -5092630900 -2274549900
VIII (Interim dividend) 21800 000 000
IX Other equity instruments 21900 000 000
A-2) Adjustments for changes in value 22000 000 000
I Available-for-sale financial assets 22100 000 000
II Hedging transactions 22200 000 000
III Non-current assets and related liabilities maintained for
sale
22300 000 000
IV T ranslation difference 22400 000 000
V Others 22500 000 000
A3) Grants donations and legacies received 23000 000 000
B) NON-CURRENT LIABILIT IES 31000 46549643600 47908465000
I Long-term provisions 31100 75132300 75132300
1 Long-term staff benefit obligations 31110 000 000
2 Environmental actions 31120 000 000
3 Provisions for restructuring 31130 000 000
4 Other provisions 31140 75132300 75132300
II Long-term debts 31200 5612926800 4945711100
1 Obligations and other negotiable securities 31210 000 000
2 Debts with credit institutions 31220 5322958800 4656526000
3 Financial lease creditors 31230 000 000
4 Derivatives 31240 000 000
5 Other financial liabilities 31250 289968000 289185100
III Long-term debts with group companies and sister
companies
31300 40850000000 42800000000
IV Deferred tax liabilities 31400 11584500 87621600
V Long-term accruals 31500 000 000
VI Non-current trade creditors 31600 000 000
VII Long-term debt with special characteristics 31700 000 000
S O C I E D A D E J E M P L O S L | C O M P A N Y R E P O R T
W W W I N F O E M P R E S A C O M 21
Financial years
Key 2011 2012 2013 2014
C) CURRENT LIABILIT IES 32000 21432976300 20299393000
I Liabilities associated with non-current assets maintained for
sale
32100 000 000
II Short-term provisions 32200 1184371200 1964476900
1 Provisions for rights relating to the emission of
greenhouse gases
32210 000 000
2 Other provisions 32220 1184371200 1964476900
III Short-term debts 32300 17 37108700 1694501200
1 Obligations and other negotiable securities 32310 000 000
2 Debts with credit institutions 32320 17 32982600 1690373500
3 Financial lease creditors 32330 000 000
4 Derivatives 32340 000 000
5 Other financial liabilities 32350 4126100 4127700
IV Short-term debts with group companies and sister
companies
32400 16490887300 14684351300
V T rade creditors and other accounts payable 32500 2020609100 1956063600
1 Providers 32510 1573868600 1464849400
a) Long-term providers 32511 000 000
b) Short-term providers 32512 1573868600 1464849400
2 Providers group companies and sister companies 32520 116553500 78369000
3 Miscellaneous creditors 32530 59204100 60136000
4 Personnel (remunerations pending payment) 32540 1017300 000
5 Current tax liabilities 32550 000 000
6 Other debts with Public Administration bodies 32560 182162900 275878200
7 Advance payments from clients 32570 87802700 76831000
VI Short-term accruals 32600 000 000
VII Short-term debt with special characteristics 32700 000 000
TOTAL EQUITY AND LIABILIT IES (A + B + C) 30000 15458402700 13409090900
S O C I E D A D E J E M P L O S L | C O M P A N Y R E P O R T
W W W I N F O E M P R E S A C O M 22
Income statement(in Euros)
Financial years
Key 2011 2012 2013 2014
1 Net turnover 40100 1261211300 79555900
a) Sales 40110 1230715400 61382900
b) Service provisions 40120 30495900 18173000
c) Financial revenues from holding companies 40130 000 000
2 Change in stocks of finished and semi-finished products 40200 -1169328600 -37611100
3 Capital asset betterments and improvements4 40300 000 000
4Provisions 40400 -4025133400 -1054374100
a) Consumption of merchandise 40410 000 000
b) Consumption of raw materials and other consumables 40420 -1327808600 000
c) Work carried out by other companies 40430 -17488500 -30451500
d) Deterioration in merchandise raw materials and other
provisions
40440 -2679836300 -1023922600
5 Other operating expenses 40500 39235900 26978700
a) Casual income and other current operating income 40510 39235900 26978700
b) Operating grants incorporated into the financial year profit
amp loss
40520 000 000
6 Personnel expenses 40600 -84216100 -28458200
a) Wages salaries and similar expenses 40610 -72780100 -22841400
b) Social security contributions 40620 -11436000 -5616800
c) Provisions 40630 000 000
7 Other operating expenses 40700 -1329387000 -320314800
a) Outsourcing 40710 -167392300 -123318300
b) Fees 40720 -33987800 -39586900
c) Losses deterioration and change in provisions for trade
operations
40730 -1128006900 -157409600
d) Other current operating expenses 40740 000 000
e) Expenses relating to the emission of greenhouse
gases
40750 000 000
8 Depreciation of fixed assets 40800 -18197700 -12851400
9 Allocation of non-financial asset grants and others 40900 000 000
10 Provision excesses 41000 000 000
11 Deterioration and result for transfers of fixed assets 41100 -45795000 300
a) Deterioration and losses 41110 -54236000 000
b) Results for transfers and others 41120 8441000 300
c) Deterioration and results for transfers of holding company
fixed assets
41130 000 000
12 Negative difference in business combinations 41200 000 000
13 Other results 41300 192691700 -52314100
S O C I E D A D E J E M P L O S L | C O M P A N Y R E P O R T
W W W I N F O E M P R E S A C O M 23
Financial years
Key 2011 2012 2013 2014
A1) OPERATING PROFIT (1 + 2 + 3 + 4 + 5 + 6 + 7 + 8 + 9 + 10 + 11
+ 12 + 13)
49100 -5178918900 -1399388800
14 Financial revenues 41400 24914900 26494500
a) Of shareholdings in equity instruments 41410 4200 1400
a 1) In group companies and sister companies 41411 000 000
a 2) In third parties 41412 4200 1400
b) Of negotiable securities and other financial instruments 41420 24910700 26493100
b 1) Of group companies and sister companies 41421 24575700 22972200
b 2) Of third parties 41422 335000 3520900
c) Allocation of financial grants donations and legacies 41430 000 000
15 Financial expenses 41500 -270227700 -476090600
a) For debts with group companies and associated
companies
41510 -270227700 -471686500
b) For debts with third parties 41520 000 -4404100
c) For updating provisions 41530 000 000
16 Change in fair value of financial instruments 41600 000 000
a) T rading portfolio and others 41610 000 000
b) Allocation to financial year profit amp loss account on
available-for-sale financial assets
41620 000 000
17 Exchange differences 41700 -7 50600 -1101100
18 Deterioration and result for transfers of financial instruments 41800 000 63177500
a) Deteriorations and losses 41810 000 000
b) Results for transfers and others 41820 000 63177500
19 Other financial expenses and revenues 42100 000 000
a) Capitalisation of financial assets 42110 000 000
b) Financial revenues from creditors agreements 42120 000 000
c) Other revenues and expenses 42130 000 000
A2) FINANCIAL RESULT (14 + 15 + 16 + 17 18 + 19) 49200 -246063400 -387519700
A3) PRE-TAX RESULT (A1 + A2) 49300 -5424982300 -1786908500
20 Tax on profits 41900 332351400 -487641400
A4) FINANCIAL YEAR PROFIT amp LOSS FROM CONTINUING
OPERATIONS (A3 + 20)
49400 -5092630900 -2274549900
21 Financial year result from discontinued operations after tax 42000 000 000
A5) FINANCIAL YEAR RESULT (A4 + 21) 49500 -5092630900 -2274549900
S O C I E D A D E J E M P L O S L | C O M P A N Y R E P O R T
W W W I N F O E M P R E S A C O M 24
Changes in Equity(in Euros)
Financial years
Key 2011 2012 2013 2014
A) RESULT OF THE PROFIT AND LOSS ACCOUNT 59100 -5092630900 -2274549900
I For valuation of financial instruments 50010 000 000
1 Available-for-sale financial assets 50011 000 000
2 Other revenuesexpenses 50012 000 000
II For cash flow hedges (coverage) 50020 000 000
III Grants donations and legacies received 50030 000 000
IV For actuarial profits and losses and other adjustments 50040 000 000
V For non-current assets and related liabilities maintained
for sale
50050 000 000
VI Conversion Differences 50060 000 000
VII Tax effect 50070 000 000
B) Total revenues and expenses allocated directly in equity (I + II
+ III + IV +V+VI+VII)
59200 000 000
VIII For valuation of financial instruments 50080 000 000
1 Available-for-sale financial assets 50081 000 000
2 Other revenuesexpenses 50082 000 000
IX For cash flow hedges (coverage) 50090 000 000
X Grants donations and legacies received 50100 000 000
XI For non-current assets and related liabilities maintained
for sale
50110 000 000
XII T ranslation differences 50120 000 000
XIII Tax effect 50130 000 000
C) Total transfers to the profit and loss account (VIII + IX + X + XI+
XII+ XIII)
59300 000 000
TOTAL RECOGNISED EXPENDITURE AND REVENUES (A + B + C) 59400 -5092630900 -2274549900
S O C I E D A D E J E M P L O S L | C O M P A N Y R E P O R T
W W W I N F O E M P R E S A C O M 25
Cash Flows(in Euros)
Financial years
Key 2011 2012 2013 2014
1 Financial year result before tax 61100 -5424982300 -1786908500
2 Profit amp Loss adjustments 61200 4984588300 1571951900
a) Amortisation of fixed assets (+) 61201 18197700 12851400
b) Valuation adjustments due to deterioration (+) 61202 3792017100 1023922600
c) Change in provisions (+) 61203 1128006900 157409600
d) Allocation of grants () 61204 000 000
e) Results for derecognitions and transfers of fixed assets (+) 61205 -8441000 -300
f) Results for derecognitions and transfers of financial
instruments (+)
61206 000 -63177500
g) Financial revenues () 61207 -24914900 -26494500
h) Financial expenses (+) 61208 270227700 476090600
j) Change in fair value of financial instruments (+) 61210 000 000
k) Other revenues and expenses (+) 61211 -190505200 -8650000
3 Changes in current capital 61300 -1395076900 48568400
a) Stocks (+) 61301 204651700 62689600
b) Debtors and other accounts receivable (+) 61302 -1215763600 36637800
c) Other current assets (+) 61303 29929500 5136500
d) Creditors and other accounts payable (+) 61304 -413894500 -55895500
e) Other current liabilities (+) 61305 000 000
f) Other non-current assets and liabilities (+) 61306 000 000
4 Other cash flows from operating activities 61400 1170857800 -132232900
a) Interest payments () 61401 -270227700 -476090600
b) Receivables from dividends (+) 61402 000 000
c) Interest receivables (+) 61403 24914900 26494500
d) Tax on profit receivables (payments) (+) 61404 1416170600 317363200
e) Other payments (receivables) (+) 61405 000 000
5 Cash flows from operating activities (1 + 2 + 3 + 4) 61500 -664613100 -298621100
6 Payments for investments () 62100 -224200 -10000
a) Group companies and sister companies 62101 000 000
b) Fixed intangible assets 62102 000 000
c) (Tangible) fixed assets 62103 -224200 -10000
d) Real estate investments 62104 000 000
e) Other financial assets 62105 000 000
f) Non-current assets maintained for sale 62106 000 000
g) Business unit 62107 000 000
h) Other assets 62108 000 000
S O C I E D A D E J E M P L O S L | C O M P A N Y R E P O R T
W W W I N F O E M P R E S A C O M 26
Financial years
Key 2011 2012 2013 2014
7 Receivables from the sale of investments (+) 62200 4689500 1400
a) Group companies and sister companies 62201 000 000
b) Fixed intangible assets 62202 000 000
c) (Tangible) fixed assets 62203 1171100 1400
d) Real estate investments 62204 000 000
e) Other financial assets 62205 3518400 000
f) Non-current assets maintained for sale 62206 000 000
g) Business unit 62207 000 000
h) Other assets 62208 000 000
8 Cash flows from investment activities (6 + 7) 62300 4465300 -8600
9 Receivables and payments for equity instruments 63100 000 000
a) Issuance of equity instruments () 63101 000 000
b) Amortisation of equity instruments () 63102 000 000
c) Acquisition of own equity instruments () 63103 000 000
d) T ransfer of own equity instruments (+) 63104 000 000
e) Grants donations and legacies received (+) 63105 000 000
10 Receivables and payments for financial liability instruments 63200 665197500 300026300
a) Issuance 63201 10558799100 1950000000
1 Obligations and other negotiable securities (+) 63202 000 000
2 Debts with credit institutions (+) 63203 8799100 000
3 Debts with group companies and sister companies (+) 63204 10550000000 1950000000
4 Debts with special characteristics (+) 63205 000 000
5 Other debts (+) 63206 000 000
b) Repayment and amortisation of 63207 -9893601600 -1649973700
1 Obligations and other negotiable securities () 63208 000 000
3 Debts with group companies and sister companies () 63210 -9889617600 -1603328000
4 Debts with special characteristics () 63211 000 000
5 Other debts () 63212 -111200 -781300
11 Dividend payments and remunerations from other equity
instruments
63300 000 000
a) Dividends () 63301 000 000
b) Remuneration of other equity instruments () 63302 000 000
12 Cash flows from financing activities (9 + 10 + 11) 63400 665197500 300026300
D) Effect of changes in exchange types 64000 000 000
E) NET INCREASEDECREASE IN CASH OR EQUIVALENTS (5 + 8
+ 12 + D)
65000 5049700 1396600
Cash or equivalents at the start of the financial year 65100 30698100 25648400
Cash or equivalents at the end of the financial year 65200 25648400 27045000
S O C I E D A D E J E M P L O S L | C O M P A N Y R E P O R T
W W W I N F O E M P R E S A C O M 27
AS N E F E M P R E S AS
There are no defaults recorded in the ASNEF (Spanish National Association of Finance Companies) Empresas (Companies) file
RAI (Unpaid Receivables Registry)
File made up of information on defaults exclusively by legal persons that are
equal to or greater than euro300
The information in this file remains for 30 months
CH E CK D E F A U LTS A N D D E B TS ( R A I )
S O C I E D A D E J E M P L O S L | C O M P A N Y R E P O R T
W W W I N F O E M P R E S A C O M 28
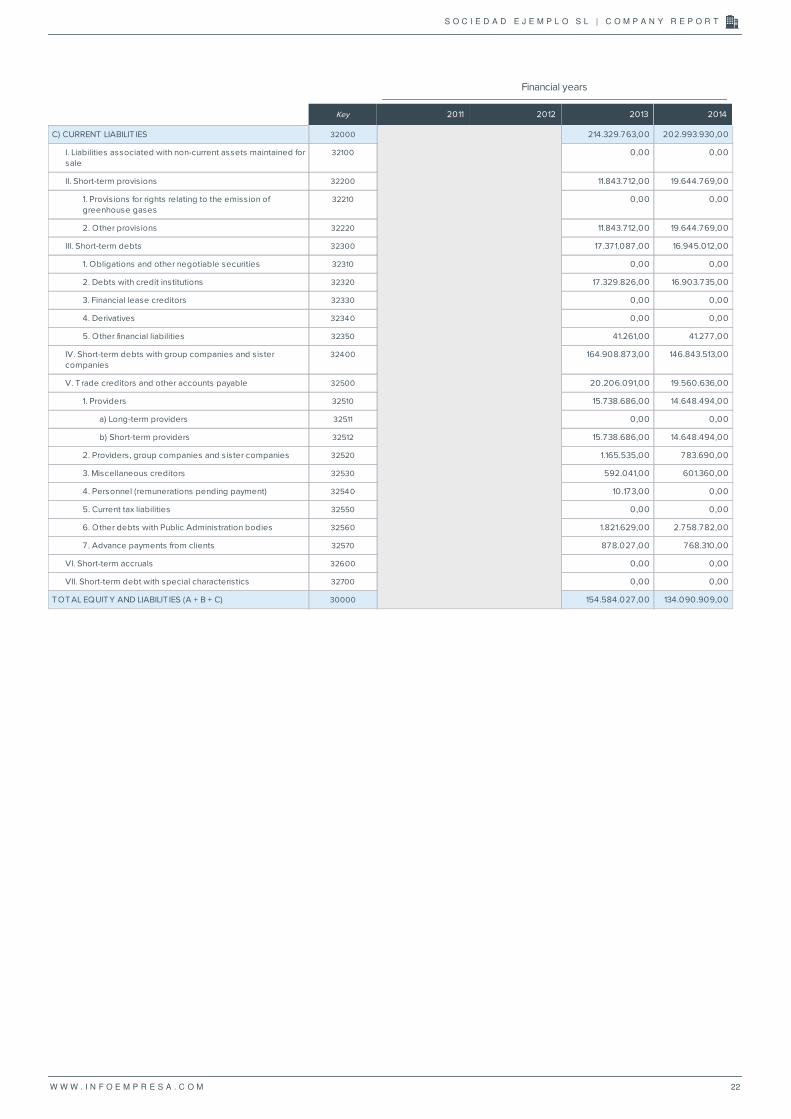
Financial years
Key 2011 2012 2013 2014
C) CURRENT LIABILIT IES 32000 21432976300 20299393000
I Liabilities associated with non-current assets maintained for
sale
32100 000 000
II Short-term provisions 32200 1184371200 1964476900
1 Provisions for rights relating to the emission of
greenhouse gases
32210 000 000
2 Other provisions 32220 1184371200 1964476900
III Short-term debts 32300 17 37108700 1694501200
1 Obligations and other negotiable securities 32310 000 000
2 Debts with credit institutions 32320 17 32982600 1690373500
3 Financial lease creditors 32330 000 000
4 Derivatives 32340 000 000
5 Other financial liabilities 32350 4126100 4127700
IV Short-term debts with group companies and sister
companies
32400 16490887300 14684351300
V T rade creditors and other accounts payable 32500 2020609100 1956063600
1 Providers 32510 1573868600 1464849400
a) Long-term providers 32511 000 000
b) Short-term providers 32512 1573868600 1464849400
2 Providers group companies and sister companies 32520 116553500 78369000
3 Miscellaneous creditors 32530 59204100 60136000
4 Personnel (remunerations pending payment) 32540 1017300 000
5 Current tax liabilities 32550 000 000
6 Other debts with Public Administration bodies 32560 182162900 275878200
7 Advance payments from clients 32570 87802700 76831000
VI Short-term accruals 32600 000 000
VII Short-term debt with special characteristics 32700 000 000
TOTAL EQUITY AND LIABILIT IES (A + B + C) 30000 15458402700 13409090900
S O C I E D A D E J E M P L O S L | C O M P A N Y R E P O R T
W W W I N F O E M P R E S A C O M 22
Income statement(in Euros)
Financial years
Key 2011 2012 2013 2014
1 Net turnover 40100 1261211300 79555900
a) Sales 40110 1230715400 61382900
b) Service provisions 40120 30495900 18173000
c) Financial revenues from holding companies 40130 000 000
2 Change in stocks of finished and semi-finished products 40200 -1169328600 -37611100
3 Capital asset betterments and improvements4 40300 000 000
4Provisions 40400 -4025133400 -1054374100
a) Consumption of merchandise 40410 000 000
b) Consumption of raw materials and other consumables 40420 -1327808600 000
c) Work carried out by other companies 40430 -17488500 -30451500
d) Deterioration in merchandise raw materials and other
provisions
40440 -2679836300 -1023922600
5 Other operating expenses 40500 39235900 26978700
a) Casual income and other current operating income 40510 39235900 26978700
b) Operating grants incorporated into the financial year profit
amp loss
40520 000 000
6 Personnel expenses 40600 -84216100 -28458200
a) Wages salaries and similar expenses 40610 -72780100 -22841400
b) Social security contributions 40620 -11436000 -5616800
c) Provisions 40630 000 000
7 Other operating expenses 40700 -1329387000 -320314800
a) Outsourcing 40710 -167392300 -123318300
b) Fees 40720 -33987800 -39586900
c) Losses deterioration and change in provisions for trade
operations
40730 -1128006900 -157409600
d) Other current operating expenses 40740 000 000
e) Expenses relating to the emission of greenhouse
gases
40750 000 000
8 Depreciation of fixed assets 40800 -18197700 -12851400
9 Allocation of non-financial asset grants and others 40900 000 000
10 Provision excesses 41000 000 000
11 Deterioration and result for transfers of fixed assets 41100 -45795000 300
a) Deterioration and losses 41110 -54236000 000
b) Results for transfers and others 41120 8441000 300
c) Deterioration and results for transfers of holding company
fixed assets
41130 000 000
12 Negative difference in business combinations 41200 000 000
13 Other results 41300 192691700 -52314100
S O C I E D A D E J E M P L O S L | C O M P A N Y R E P O R T
W W W I N F O E M P R E S A C O M 23
Financial years
Key 2011 2012 2013 2014
A1) OPERATING PROFIT (1 + 2 + 3 + 4 + 5 + 6 + 7 + 8 + 9 + 10 + 11
+ 12 + 13)
49100 -5178918900 -1399388800
14 Financial revenues 41400 24914900 26494500
a) Of shareholdings in equity instruments 41410 4200 1400
a 1) In group companies and sister companies 41411 000 000
a 2) In third parties 41412 4200 1400
b) Of negotiable securities and other financial instruments 41420 24910700 26493100
b 1) Of group companies and sister companies 41421 24575700 22972200
b 2) Of third parties 41422 335000 3520900
c) Allocation of financial grants donations and legacies 41430 000 000
15 Financial expenses 41500 -270227700 -476090600
a) For debts with group companies and associated
companies
41510 -270227700 -471686500
b) For debts with third parties 41520 000 -4404100
c) For updating provisions 41530 000 000
16 Change in fair value of financial instruments 41600 000 000
a) T rading portfolio and others 41610 000 000
b) Allocation to financial year profit amp loss account on
available-for-sale financial assets
41620 000 000
17 Exchange differences 41700 -7 50600 -1101100
18 Deterioration and result for transfers of financial instruments 41800 000 63177500
a) Deteriorations and losses 41810 000 000
b) Results for transfers and others 41820 000 63177500
19 Other financial expenses and revenues 42100 000 000
a) Capitalisation of financial assets 42110 000 000
b) Financial revenues from creditors agreements 42120 000 000
c) Other revenues and expenses 42130 000 000
A2) FINANCIAL RESULT (14 + 15 + 16 + 17 18 + 19) 49200 -246063400 -387519700
A3) PRE-TAX RESULT (A1 + A2) 49300 -5424982300 -1786908500
20 Tax on profits 41900 332351400 -487641400
A4) FINANCIAL YEAR PROFIT amp LOSS FROM CONTINUING
OPERATIONS (A3 + 20)
49400 -5092630900 -2274549900
21 Financial year result from discontinued operations after tax 42000 000 000
A5) FINANCIAL YEAR RESULT (A4 + 21) 49500 -5092630900 -2274549900
S O C I E D A D E J E M P L O S L | C O M P A N Y R E P O R T
W W W I N F O E M P R E S A C O M 24
Changes in Equity(in Euros)
Financial years
Key 2011 2012 2013 2014
A) RESULT OF THE PROFIT AND LOSS ACCOUNT 59100 -5092630900 -2274549900
I For valuation of financial instruments 50010 000 000
1 Available-for-sale financial assets 50011 000 000
2 Other revenuesexpenses 50012 000 000
II For cash flow hedges (coverage) 50020 000 000
III Grants donations and legacies received 50030 000 000
IV For actuarial profits and losses and other adjustments 50040 000 000
V For non-current assets and related liabilities maintained
for sale
50050 000 000
VI Conversion Differences 50060 000 000
VII Tax effect 50070 000 000
B) Total revenues and expenses allocated directly in equity (I + II
+ III + IV +V+VI+VII)
59200 000 000
VIII For valuation of financial instruments 50080 000 000
1 Available-for-sale financial assets 50081 000 000
2 Other revenuesexpenses 50082 000 000
IX For cash flow hedges (coverage) 50090 000 000
X Grants donations and legacies received 50100 000 000
XI For non-current assets and related liabilities maintained
for sale
50110 000 000
XII T ranslation differences 50120 000 000
XIII Tax effect 50130 000 000
C) Total transfers to the profit and loss account (VIII + IX + X + XI+
XII+ XIII)
59300 000 000
TOTAL RECOGNISED EXPENDITURE AND REVENUES (A + B + C) 59400 -5092630900 -2274549900
S O C I E D A D E J E M P L O S L | C O M P A N Y R E P O R T
W W W I N F O E M P R E S A C O M 25
Cash Flows(in Euros)
Financial years
Key 2011 2012 2013 2014
1 Financial year result before tax 61100 -5424982300 -1786908500
2 Profit amp Loss adjustments 61200 4984588300 1571951900
a) Amortisation of fixed assets (+) 61201 18197700 12851400
b) Valuation adjustments due to deterioration (+) 61202 3792017100 1023922600
c) Change in provisions (+) 61203 1128006900 157409600
d) Allocation of grants () 61204 000 000
e) Results for derecognitions and transfers of fixed assets (+) 61205 -8441000 -300
f) Results for derecognitions and transfers of financial
instruments (+)
61206 000 -63177500
g) Financial revenues () 61207 -24914900 -26494500
h) Financial expenses (+) 61208 270227700 476090600
j) Change in fair value of financial instruments (+) 61210 000 000
k) Other revenues and expenses (+) 61211 -190505200 -8650000
3 Changes in current capital 61300 -1395076900 48568400
a) Stocks (+) 61301 204651700 62689600
b) Debtors and other accounts receivable (+) 61302 -1215763600 36637800
c) Other current assets (+) 61303 29929500 5136500
d) Creditors and other accounts payable (+) 61304 -413894500 -55895500
e) Other current liabilities (+) 61305 000 000
f) Other non-current assets and liabilities (+) 61306 000 000
4 Other cash flows from operating activities 61400 1170857800 -132232900
a) Interest payments () 61401 -270227700 -476090600
b) Receivables from dividends (+) 61402 000 000
c) Interest receivables (+) 61403 24914900 26494500
d) Tax on profit receivables (payments) (+) 61404 1416170600 317363200
e) Other payments (receivables) (+) 61405 000 000
5 Cash flows from operating activities (1 + 2 + 3 + 4) 61500 -664613100 -298621100
6 Payments for investments () 62100 -224200 -10000
a) Group companies and sister companies 62101 000 000
b) Fixed intangible assets 62102 000 000
c) (Tangible) fixed assets 62103 -224200 -10000
d) Real estate investments 62104 000 000
e) Other financial assets 62105 000 000
f) Non-current assets maintained for sale 62106 000 000
g) Business unit 62107 000 000
h) Other assets 62108 000 000
S O C I E D A D E J E M P L O S L | C O M P A N Y R E P O R T
W W W I N F O E M P R E S A C O M 26
Financial years
Key 2011 2012 2013 2014
7 Receivables from the sale of investments (+) 62200 4689500 1400
a) Group companies and sister companies 62201 000 000
b) Fixed intangible assets 62202 000 000
c) (Tangible) fixed assets 62203 1171100 1400
d) Real estate investments 62204 000 000
e) Other financial assets 62205 3518400 000
f) Non-current assets maintained for sale 62206 000 000
g) Business unit 62207 000 000
h) Other assets 62208 000 000
8 Cash flows from investment activities (6 + 7) 62300 4465300 -8600
9 Receivables and payments for equity instruments 63100 000 000
a) Issuance of equity instruments () 63101 000 000
b) Amortisation of equity instruments () 63102 000 000
c) Acquisition of own equity instruments () 63103 000 000
d) T ransfer of own equity instruments (+) 63104 000 000
e) Grants donations and legacies received (+) 63105 000 000
10 Receivables and payments for financial liability instruments 63200 665197500 300026300
a) Issuance 63201 10558799100 1950000000
1 Obligations and other negotiable securities (+) 63202 000 000
2 Debts with credit institutions (+) 63203 8799100 000
3 Debts with group companies and sister companies (+) 63204 10550000000 1950000000
4 Debts with special characteristics (+) 63205 000 000
5 Other debts (+) 63206 000 000
b) Repayment and amortisation of 63207 -9893601600 -1649973700
1 Obligations and other negotiable securities () 63208 000 000
3 Debts with group companies and sister companies () 63210 -9889617600 -1603328000
4 Debts with special characteristics () 63211 000 000
5 Other debts () 63212 -111200 -781300
11 Dividend payments and remunerations from other equity
instruments
63300 000 000
a) Dividends () 63301 000 000
b) Remuneration of other equity instruments () 63302 000 000
12 Cash flows from financing activities (9 + 10 + 11) 63400 665197500 300026300
D) Effect of changes in exchange types 64000 000 000
E) NET INCREASEDECREASE IN CASH OR EQUIVALENTS (5 + 8
+ 12 + D)
65000 5049700 1396600
Cash or equivalents at the start of the financial year 65100 30698100 25648400
Cash or equivalents at the end of the financial year 65200 25648400 27045000
S O C I E D A D E J E M P L O S L | C O M P A N Y R E P O R T
W W W I N F O E M P R E S A C O M 27
AS N E F E M P R E S AS
There are no defaults recorded in the ASNEF (Spanish National Association of Finance Companies) Empresas (Companies) file
RAI (Unpaid Receivables Registry)
File made up of information on defaults exclusively by legal persons that are
equal to or greater than euro300
The information in this file remains for 30 months
CH E CK D E F A U LTS A N D D E B TS ( R A I )
S O C I E D A D E J E M P L O S L | C O M P A N Y R E P O R T
W W W I N F O E M P R E S A C O M 28
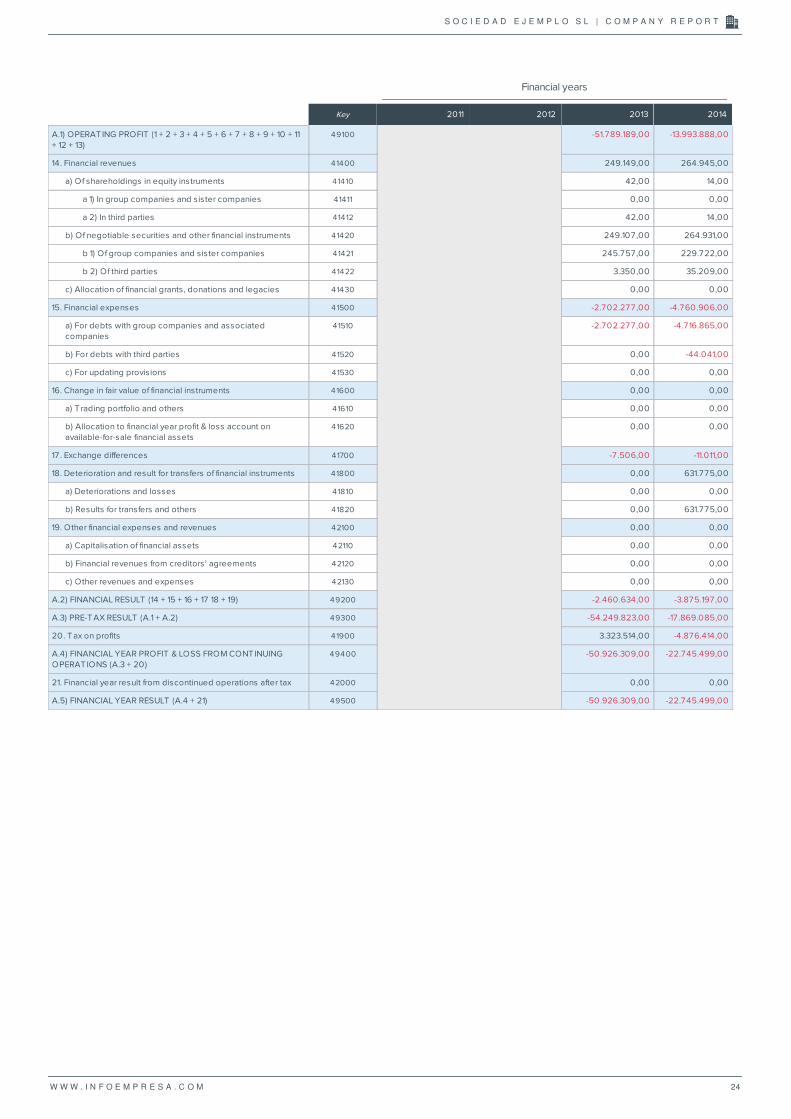
Financial years
Key 2011 2012 2013 2014
A1) OPERATING PROFIT (1 + 2 + 3 + 4 + 5 + 6 + 7 + 8 + 9 + 10 + 11
+ 12 + 13)
49100 -5178918900 -1399388800
14 Financial revenues 41400 24914900 26494500
a) Of shareholdings in equity instruments 41410 4200 1400
a 1) In group companies and sister companies 41411 000 000
a 2) In third parties 41412 4200 1400
b) Of negotiable securities and other financial instruments 41420 24910700 26493100
b 1) Of group companies and sister companies 41421 24575700 22972200
b 2) Of third parties 41422 335000 3520900
c) Allocation of financial grants donations and legacies 41430 000 000
15 Financial expenses 41500 -270227700 -476090600
a) For debts with group companies and associated
companies
41510 -270227700 -471686500
b) For debts with third parties 41520 000 -4404100
c) For updating provisions 41530 000 000
16 Change in fair value of financial instruments 41600 000 000
a) T rading portfolio and others 41610 000 000
b) Allocation to financial year profit amp loss account on
available-for-sale financial assets
41620 000 000
17 Exchange differences 41700 -7 50600 -1101100
18 Deterioration and result for transfers of financial instruments 41800 000 63177500
a) Deteriorations and losses 41810 000 000
b) Results for transfers and others 41820 000 63177500
19 Other financial expenses and revenues 42100 000 000
a) Capitalisation of financial assets 42110 000 000
b) Financial revenues from creditors agreements 42120 000 000
c) Other revenues and expenses 42130 000 000
A2) FINANCIAL RESULT (14 + 15 + 16 + 17 18 + 19) 49200 -246063400 -387519700
A3) PRE-TAX RESULT (A1 + A2) 49300 -5424982300 -1786908500
20 Tax on profits 41900 332351400 -487641400
A4) FINANCIAL YEAR PROFIT amp LOSS FROM CONTINUING
OPERATIONS (A3 + 20)
49400 -5092630900 -2274549900
21 Financial year result from discontinued operations after tax 42000 000 000
A5) FINANCIAL YEAR RESULT (A4 + 21) 49500 -5092630900 -2274549900
S O C I E D A D E J E M P L O S L | C O M P A N Y R E P O R T
W W W I N F O E M P R E S A C O M 24
Changes in Equity(in Euros)
Financial years
Key 2011 2012 2013 2014
A) RESULT OF THE PROFIT AND LOSS ACCOUNT 59100 -5092630900 -2274549900
I For valuation of financial instruments 50010 000 000
1 Available-for-sale financial assets 50011 000 000
2 Other revenuesexpenses 50012 000 000
II For cash flow hedges (coverage) 50020 000 000
III Grants donations and legacies received 50030 000 000
IV For actuarial profits and losses and other adjustments 50040 000 000
V For non-current assets and related liabilities maintained
for sale
50050 000 000
VI Conversion Differences 50060 000 000
VII Tax effect 50070 000 000
B) Total revenues and expenses allocated directly in equity (I + II
+ III + IV +V+VI+VII)
59200 000 000
VIII For valuation of financial instruments 50080 000 000
1 Available-for-sale financial assets 50081 000 000
2 Other revenuesexpenses 50082 000 000
IX For cash flow hedges (coverage) 50090 000 000
X Grants donations and legacies received 50100 000 000
XI For non-current assets and related liabilities maintained
for sale
50110 000 000
XII T ranslation differences 50120 000 000
XIII Tax effect 50130 000 000
C) Total transfers to the profit and loss account (VIII + IX + X + XI+
XII+ XIII)
59300 000 000
TOTAL RECOGNISED EXPENDITURE AND REVENUES (A + B + C) 59400 -5092630900 -2274549900
S O C I E D A D E J E M P L O S L | C O M P A N Y R E P O R T
W W W I N F O E M P R E S A C O M 25
Cash Flows(in Euros)
Financial years
Key 2011 2012 2013 2014
1 Financial year result before tax 61100 -5424982300 -1786908500
2 Profit amp Loss adjustments 61200 4984588300 1571951900
a) Amortisation of fixed assets (+) 61201 18197700 12851400
b) Valuation adjustments due to deterioration (+) 61202 3792017100 1023922600
c) Change in provisions (+) 61203 1128006900 157409600
d) Allocation of grants () 61204 000 000
e) Results for derecognitions and transfers of fixed assets (+) 61205 -8441000 -300
f) Results for derecognitions and transfers of financial
instruments (+)
61206 000 -63177500
g) Financial revenues () 61207 -24914900 -26494500
h) Financial expenses (+) 61208 270227700 476090600
j) Change in fair value of financial instruments (+) 61210 000 000
k) Other revenues and expenses (+) 61211 -190505200 -8650000
3 Changes in current capital 61300 -1395076900 48568400
a) Stocks (+) 61301 204651700 62689600
b) Debtors and other accounts receivable (+) 61302 -1215763600 36637800
c) Other current assets (+) 61303 29929500 5136500
d) Creditors and other accounts payable (+) 61304 -413894500 -55895500
e) Other current liabilities (+) 61305 000 000
f) Other non-current assets and liabilities (+) 61306 000 000
4 Other cash flows from operating activities 61400 1170857800 -132232900
a) Interest payments () 61401 -270227700 -476090600
b) Receivables from dividends (+) 61402 000 000
c) Interest receivables (+) 61403 24914900 26494500
d) Tax on profit receivables (payments) (+) 61404 1416170600 317363200
e) Other payments (receivables) (+) 61405 000 000
5 Cash flows from operating activities (1 + 2 + 3 + 4) 61500 -664613100 -298621100
6 Payments for investments () 62100 -224200 -10000
a) Group companies and sister companies 62101 000 000
b) Fixed intangible assets 62102 000 000
c) (Tangible) fixed assets 62103 -224200 -10000
d) Real estate investments 62104 000 000
e) Other financial assets 62105 000 000
f) Non-current assets maintained for sale 62106 000 000
g) Business unit 62107 000 000
h) Other assets 62108 000 000
S O C I E D A D E J E M P L O S L | C O M P A N Y R E P O R T
W W W I N F O E M P R E S A C O M 26
Financial years
Key 2011 2012 2013 2014
7 Receivables from the sale of investments (+) 62200 4689500 1400
a) Group companies and sister companies 62201 000 000
b) Fixed intangible assets 62202 000 000
c) (Tangible) fixed assets 62203 1171100 1400
d) Real estate investments 62204 000 000
e) Other financial assets 62205 3518400 000
f) Non-current assets maintained for sale 62206 000 000
g) Business unit 62207 000 000
h) Other assets 62208 000 000
8 Cash flows from investment activities (6 + 7) 62300 4465300 -8600
9 Receivables and payments for equity instruments 63100 000 000
a) Issuance of equity instruments () 63101 000 000
b) Amortisation of equity instruments () 63102 000 000
c) Acquisition of own equity instruments () 63103 000 000
d) T ransfer of own equity instruments (+) 63104 000 000
e) Grants donations and legacies received (+) 63105 000 000
10 Receivables and payments for financial liability instruments 63200 665197500 300026300
a) Issuance 63201 10558799100 1950000000
1 Obligations and other negotiable securities (+) 63202 000 000
2 Debts with credit institutions (+) 63203 8799100 000
3 Debts with group companies and sister companies (+) 63204 10550000000 1950000000
4 Debts with special characteristics (+) 63205 000 000
5 Other debts (+) 63206 000 000
b) Repayment and amortisation of 63207 -9893601600 -1649973700
1 Obligations and other negotiable securities () 63208 000 000
3 Debts with group companies and sister companies () 63210 -9889617600 -1603328000
4 Debts with special characteristics () 63211 000 000
5 Other debts () 63212 -111200 -781300
11 Dividend payments and remunerations from other equity
instruments
63300 000 000
a) Dividends () 63301 000 000
b) Remuneration of other equity instruments () 63302 000 000
12 Cash flows from financing activities (9 + 10 + 11) 63400 665197500 300026300
D) Effect of changes in exchange types 64000 000 000
E) NET INCREASEDECREASE IN CASH OR EQUIVALENTS (5 + 8
+ 12 + D)
65000 5049700 1396600
Cash or equivalents at the start of the financial year 65100 30698100 25648400
Cash or equivalents at the end of the financial year 65200 25648400 27045000
S O C I E D A D E J E M P L O S L | C O M P A N Y R E P O R T
W W W I N F O E M P R E S A C O M 27
AS N E F E M P R E S AS
There are no defaults recorded in the ASNEF (Spanish National Association of Finance Companies) Empresas (Companies) file
RAI (Unpaid Receivables Registry)
File made up of information on defaults exclusively by legal persons that are
equal to or greater than euro300
The information in this file remains for 30 months
CH E CK D E F A U LTS A N D D E B TS ( R A I )
S O C I E D A D E J E M P L O S L | C O M P A N Y R E P O R T
W W W I N F O E M P R E S A C O M 28
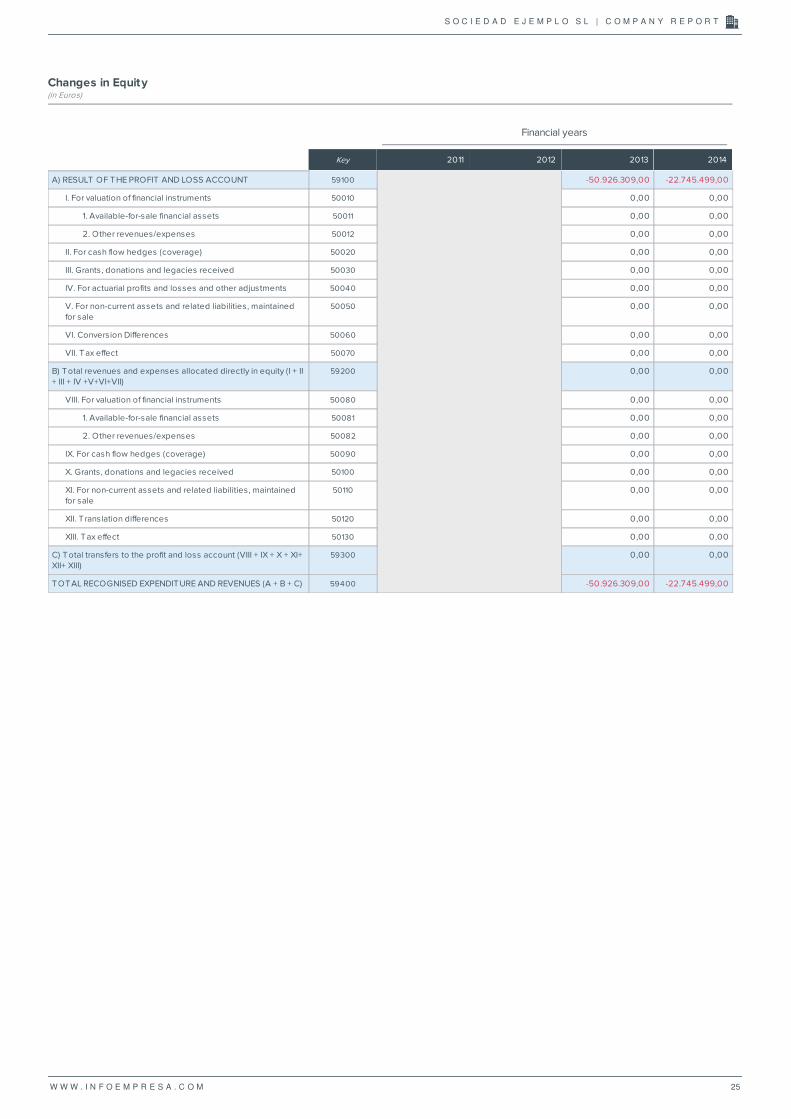
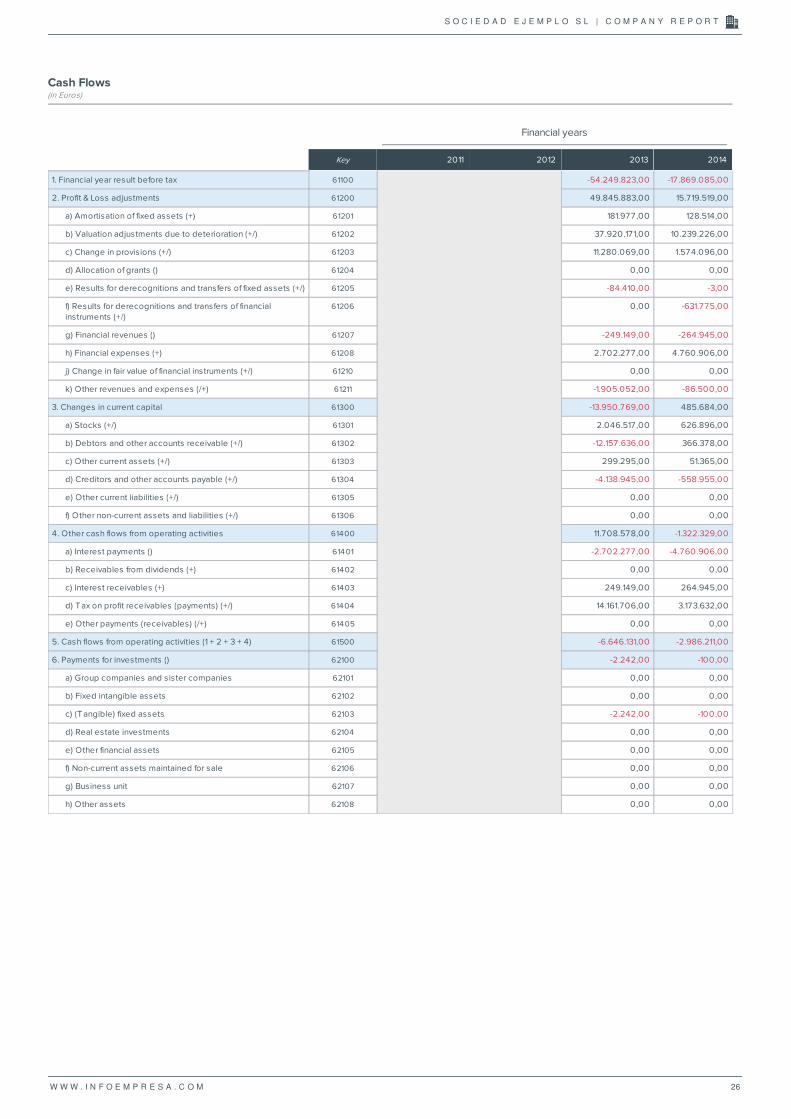
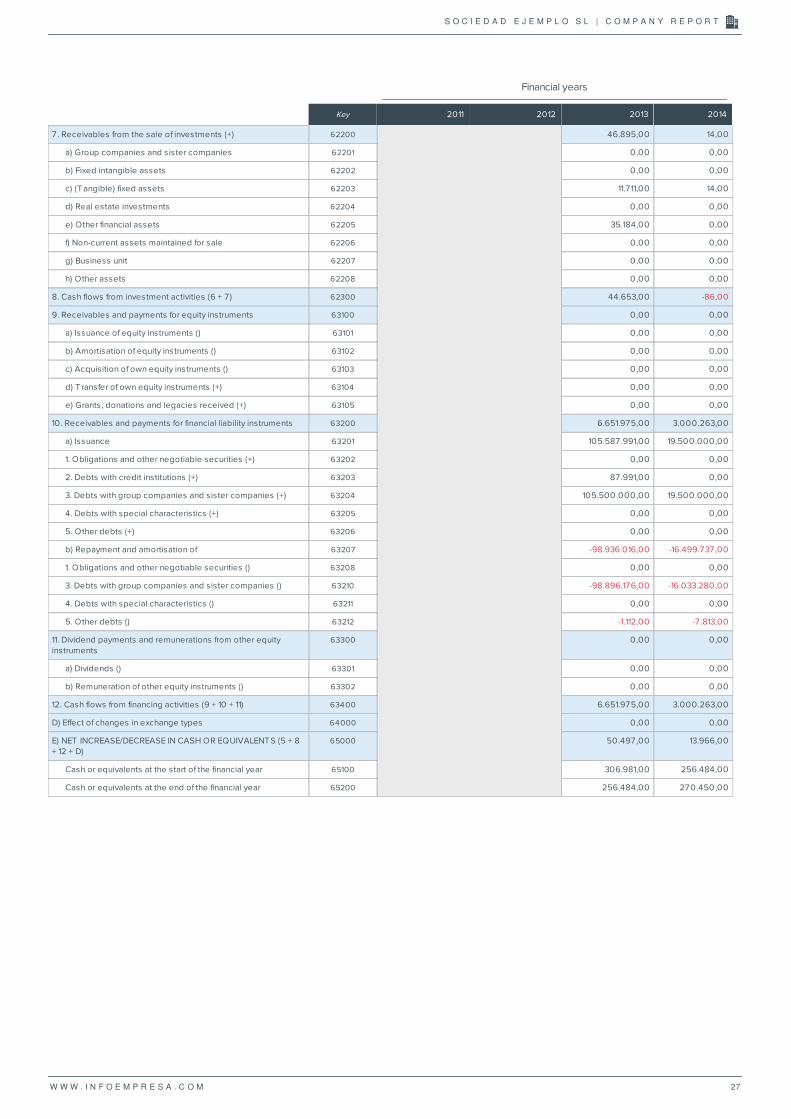
![Ventilinsel MPA-S - festo.com · PDF fileBeschreibung Pneumatik Ventilinselmit MPA-S Pneumatik Typ: MPA-FB MPA-CPI MPA-MPM-und MPA-ASI- 534240 1309f [8028623] Ventilinsel MPA-S](https://img.pdfslide.net/doc/110x75/5a79d19f7f8b9ab83f8b7435/ventilinsel-mpa-s-festocom-pneumatik-ventilinselmit-mpa-s-pneumatik-typ-mpa-fb.jpg)
![Ventilterminal MPA−L...Pneumatik MPA−L Ventilterminal Typ: MPA−L−MPM−VI MPA−L−FB−VI Beskrivning 556 358 sv 1008NH [722 283] Ventilterminal MPA−L. ... betyder att](https://img.pdfslide.net/doc/110x75/60912199dc0d2a008521a11b/ventilterminal-mpaal-pneumatik-mpaal-ventilterminal-typ-mpaalampmavi.jpg)


![Valve terminal MPA-S - Festo USA · Pneumatic components description Valveterminalwith MPA-Spneumatics Type: MPA-FB MPA-CPI MPA-MPM-…and MPA-ASI-… 534241 1309f [8028624] Valve](https://img.pdfslide.net/doc/110x75/5c5bd85409d3f236368c6efe/valve-terminal-mpa-s-festo-usa-pneumatic-components-description-valveterminalwith.jpg)