Embed Size (px)
Citation preview

Coordinated Perspectives and Enhanced Force-Directed Layoutfor the Analysis of Network Motifs
Christian Klukas Falk Schreiber Henning Schwobbermeyer
Leibniz Institute of Plant Genetics and Crop Plant Research GaterslebenCorrensstraße 3, 06466 Gatersleben, Germany,
Email: {klukas,schreibe,schwoebb}@ipk-gatersleben.de
Abstract
The analysis of network motifs, patterns of local inter-connections with potential functional properties, hasapplications in many fields of science. Network motifanalysis is particularly important for the explorationof biological networks. The distribution and multi-ple occurrences of motifs in a network, complicatedby di!erent concepts for the determination of motiffrequency, create various di"culties in understandingand interpretation. We present a system that facili-tates the analysis of network motifs by presenting co-ordinated perspectives simultaneously. A list of mo-tifs supported by the network, visual representationsof motifs of interest, a motif fingerprint and a visuali-sation of motif matches in the network are interwovenin a single interface. A motif and cluster-preservingforce-directed layout algorithm supports the visualanalysis of network motifs. This coordination of per-spectives significantly enhances the explorative powerof network motif analysis.
Keywords: network analysis, network motifs, coordi-nated perspectives, multiple views, information visu-alisation, graph drawing, force-directed layout
1 Introduction
The analysis of local structural properties of net-works, patterns of local interconnections, is of inter-est to many research areas. These patterns, callednetwork motifs, can be seen as the basic build-ing blocks of complex networks (Milo, Shen-Orr,Itzkovitz, Kashtan, Chklovskii & Alon 2002). Thereare di!erent definitions of a network motif. Some au-thors use this term to represent a set of related net-works (Shen-Orr, Milo, Mangan & Alon 2002), forothers it is simply one single small network (Wuchty,Oltvai & Barabasi 2003). Motifs have been describedas patterns of local interconnections which occur innetworks at numbers significantly higher than thosein randomised networks (Milo et al. 2002, Shen-Orret al. 2002), or as patterns with functional proper-ties (Schreiber & Schwobbermeyer 2004). Nowadays,however, the term motif is widely used for a singleCopyright c!2006, Australian Computer Society, Inc. This pa-per appeared at Asia-Pacific Symposium on Information Visu-alization (APVIS 2006), Tokyo, Japan, February 2006. Confer-ences in Research and Practice in Information Technology, Vol.60. K. Misue, K. Sugiyama and J. Tanaka, Ed. Reproductionfor academic, not-for profit purposes permitted provided thistext is included.
We would like to thank Franz J. Brandenburg (University ofPassau, Germany) for the excellent cooperation and for grant-ing usage of Gravisto. This work was supported by the Ger-man Ministry of Education and Research (BMBF) under grant0312706A.
small connected network without consideration of sta-tistical significance or functional properties (Sporns &Kotter 2004, Wuchty et al. 2003) and we adopt thisnotion in this work.
Interesting motifs have been shown to be presentin complex networks of various fields. Network mo-tif analysis is particularly important for the func-tional analysis of biological networks (Shen-Orr et al.2002, Wuchty et al. 2003, Conant & Wagner 2003),where it helps to uncover important properties ofthese networks and assists scientists in understand-ing processes in organisms. The feed-forward loopmotif has gained the most attention and has beenstudied theoretically and experimentally (Shen-Orret al. 2002, Mangan & Alon 2003, Mangan, Zaslaver& Alon 2003). This motif has been shown to per-form information processing tasks in cells (Mangan& Alon 2003, Mangan et al. 2003). Further ex-amples for network motifs are the single-input mo-tif which coordinates specific biological functions,such as the regulation of enzymes (Lee, Rinaldi,Robert, Odom, Bar-Joseph, Gerber, Hannett, Harbi-son, Thompson, Simon, Zeitlinger, Jennings, Murray,Gordon, Ren, Wyrick, Tagne, Volkert, Fraenkel, Gif-ford & Young 2002, Shen-Orr et al. 2002), the multi-input motif which coordinates pathways under severaldi!erent conditions (Lee et al. 2002), and, as a specialcase of a multi-input motif the b-fan motif with ex-actly two regulators and two regulated elements (Miloet al. 2002, Dobrin, Beg, Barabasi & Oltvai 2004).Figure 1 shows the structure of these motifs.
Figure 1: Structure of well-known network motifs(from left to right): feed-forward loop motif, single-input motif, b-fan motif and multi-input motif.
To our knowledge only a few systems exist thatprovide methods for the numerical and statisticalanalysis of motifs in networks. The Mfinder 1.1 is asoftware tool for network motif detection in directedand undirected networks (Kashtan, Itzkovitz, Milo &Alon 2002). It computes the number of occurrencesof a motif of restricted size in the target network anda uniqueness value, which is a lower bound of thenumber of times a subgraph appears in the networkwith completely disjoint groups of vertices. Further-more, the statistical significance is determined on thebasis of the number of occurrences of the motif inrandomised networks. Pajek is a program for the

analysis and visualisation of large networks (Batagelj& Mrvar 2004) and is widely used in social networkanalysis. It contains an algorithm for calculatingthe frequencies of motifs. Sporns and Kotter useda MATLAB module for the computation of networkmotifs (Sporns & Kotter 2004).
The distribution and multiple occurrences of mo-tifs in a network, complicated by di!erent concepts forthe determination of motif frequency, create variousdi"culties in understanding and interpretation andthere are no systems supporting motif exploration.Here we discuss di!erent motif-related informationshown in multiple coordinated views and present amotif- and cluster-preserving layout. These methodsare implemented in a system called MAVisto (MotifAnalysis and Visualisation tool) which supports find-ing motifs of any size and exploring motif distributionand motif matches in an intuitive graphical way.
This paper is organised as follows: in Section 2we define the graph model on which we operate, in-troduce concepts for the determination of motif fre-quency, an algorithm to find the matches in the tar-get graph and a method for calculating the statisticalsignificance of motifs. Section 3 presents the visuali-sation methods, i.e. the di!erent perspectives used todisplay motif-related information such as motif table,motif view, motif fingerprint and motif matches anddiscusses the interaction between these perspectives.Section 4 presents enhancements of the well-knownforce-directed layout method which calculates motif-and cluster-preserving layouts. The MAVisto systemis described in Section 5. Finally, Section 6 containsa general discussion and an example.
2 Definitions and Descriptions
2.1 Graph, Motif, Match
Graphs can be directed or undirected. In the re-minder we consider directed graphs, however the pre-sented method works also for undirected graphs. Adirected graph G = (V,E) consists of a finite set Vof vertices and a finite set of edges E ! V " V ofedges where each edge e = (u, v) # E connects twovertices u and v. We consider loop free graphs, i.e.no edge connects a vertex with itself. Two graphsG1 = (V1, E1) and G2 = (V2, E2) are isomorphic, if(1) there exists a bijective mapping between the ver-tices in V1 and V2, (2) there is an edge between twovertices of one graph if and only if there is an edgebetween the two corresponding vertices in the othergraph. A graph G! = (V !, E!) is a subgraph of a graphG = (V,E) if V ! ! V , E! ! E $ (V ! " V !).
A motif as used here is a small connected graph. Amatch of a motif within a target graph G is a graphG!, which is (1) isomorphic to the motif and (2) asubgraph of G. See Figure 2 for a graph, a motif anda match of the motif.
2.2 Concepts for Determination of Motif Fre-quency
The frequency of a motif in a particular network isthe number of di!erent matches of this motif. Theconcepts for the determination of the frequency of amotif are based on di!erent restrictions on sharing ofnetwork elements (vertices or edges) for the matchescounted for the frequency. These concepts have dif-ferent properties and are used to analyse di!erent as-pects of the motifs.
There are three reasonable frequency con-cepts (Schreiber & Schwobbermeyer 2004). ConceptF1 has no restrictions and counts every match of amotif. This concept gives a complete overview of all
Figure 2: A graph (left) with a match of the motifshown right highlighted with thick lines.
possible occurrences of the motif even if elements ofthe target graph have to be used several times. Fre-quency concepts F2 and F3 restrict the reuse of graphelements shared by di!erent matches counted for thefrequency of a motif. Concept F2 is a common con-cept (Kuramochi & Karypis 2004, Vanetik, Gudes &Shimony 2002) that excludes sharing of edges andonly allows edge disjoint matches. In concept F3no sharing of graph elements is allowed, therefore allmatches have to be vertex and edge disjoint. Theadvantage of concept F3 is that the matches of onemotif can be seen as non-overlapping clusters. Thisclustering of the target graph allows specific analy-sis and navigation methods such as motif-preservinglayout of the network.
The restrictions on the reuse of graph elementsfor concepts F2 and F3 have consequences for thedetermination of motif frequency in case of overlap-ping matches, as not all matches can be counted forthe frequency. To determine the maximum numberof di!erent matches of a motif the maximum set ofnon-overlapping matches has to be calculated. Thisis known as the maximum independent set prob-lem. Since this problem is NP-complete (Garey &Johnson 1979), usually a heuristic is used to computea lower bound for the frequency.
2.3 Motif Search Algorithm
We use a previously presented search algo-rithm (Schreiber & Schwobbermeyer 2004) toidentify all non-isomorphic motifs of a particularsize supported by a target network. It furthermoredetects all occurrences of these motifs. The algorithmuses a method that builds a tree of the motifs foundin the target graph and traverses this tree, startingwith the smallest motif. For the construction of themotif tree each motif m is assigned to one definedparent motif m!, from which m can be derived byextension of m! with one edge. Since more thanone possibility exists for the generation of a motifthrough extension of a smaller motif, this assignmentassures that each motif is discovered only once in thesearch process.
The traversal of the motif tree starts with thesmallest motif consisting of two vertices and one con-necting edge, whose occurrences in the network canbe easily determined. The occurrences of a motif areiteratively extended by one edge using edges adjacentto them within the target network. The newly discov-ered motifs are kept for further extension. This proce-dure is repeated until the requested size for motifs isreached or there are no valid extensions at this branchof the traversal tree. A canonical label is calculated
to identify isomorphic motifs. Since the generation ofnew motifs by extension of already identified motifsis based on the topology of the target network, onlymotifs supported by the target graph are generated.This is important since the number of non-isomorphicmotifs grows exponentially with increasing size of themotif (Harary & Palmer 1973), but in practice only asmall fraction occurs in the network.
2.4 Statistical significance calculation
The statistical over-representation of motifs has beenseen as a first indication for potential functional unitsand design principles that are present in a particu-lar network (Shen-Orr et al. 2002, Milo et al. 2002).Z-score and P-value have been introduced for theanalysis of statistical significance of motifs (Miloet al. 2002, Maslov, Sneppen & Alon 2003). The Z-score is defined as the di!erence of the frequency F1of a motif in the target network and its mean fre-quency F1,r in a su"ciently large set of randomisednetworks, divided by the standard deviation !r of thefrequency values for the randomised networks, see thefollowing Equation.
Z-score(m) =F1(m)% F1,r(m)
!r(m)(1)
The randomised versions of the original networkare generated using a random local rewiring algo-rithm which preserves the degrees of the vertices. Inone step (v1, v2) and (v3, v4) are rewired in such away that v1 becomes connected to v4 and v3 to v2,provided that no such edge already exists in the net-work (Maslov & Sneppen 2002, Maslov et al. 2003).This rewiring step is repeated many times (e.g.,200"|E|) to generate a properly randomised network.
The P-value of a motif m is defined as the proba-bility P that the frequency of m in a randomised net-work is equal or larger to the frequency of m in thetarget network (Milo et al. 2002, Maslov et al. 2003).
3 The Perspectives of MAVisto
3.1 Overview
Coordinated perspectives are used for the comprehen-sive analysis of network motifs, see Figure 3. In Sec-tion 3.2 these perspectives are described and in Sec-tion 3.3 the interaction between them is discussed.
3.2 Perspectives
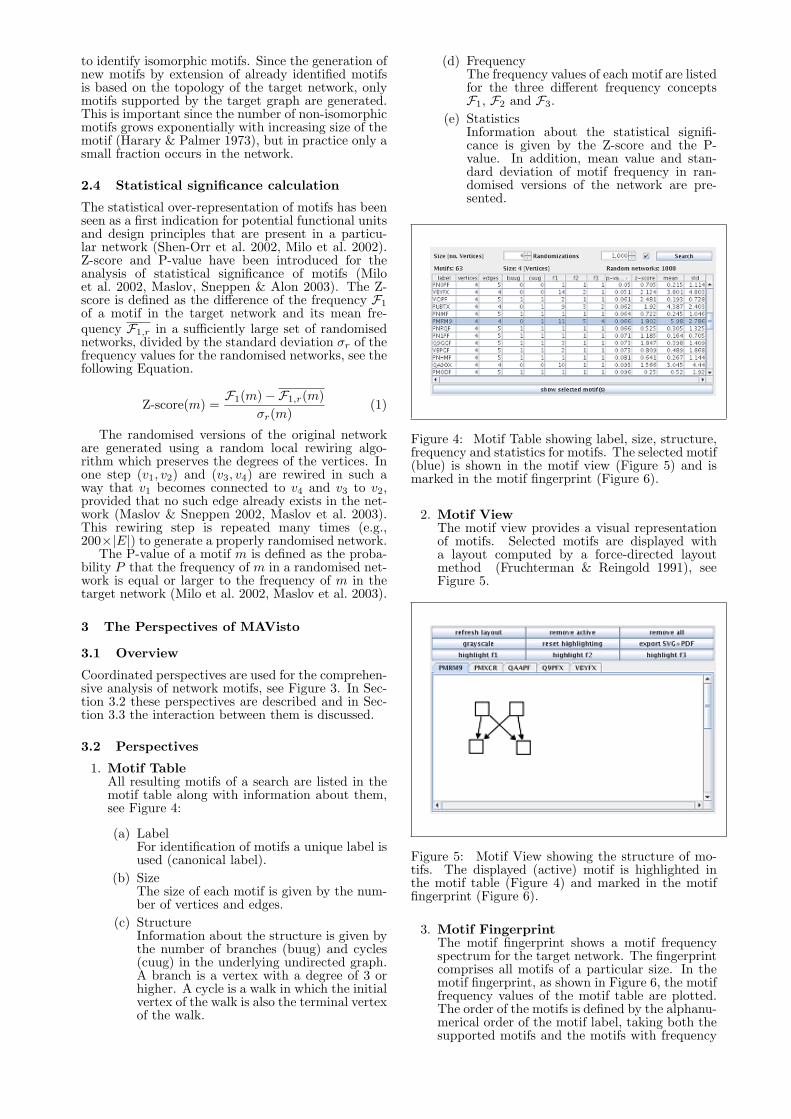
1. Motif TableAll resulting motifs of a search are listed in themotif table along with information about them,see Figure 4:
(a) LabelFor identification of motifs a unique label isused (canonical label).
(b) SizeThe size of each motif is given by the num-ber of vertices and edges.
(c) StructureInformation about the structure is given bythe number of branches (buug) and cycles(cuug) in the underlying undirected graph.A branch is a vertex with a degree of 3 orhigher. A cycle is a walk in which the initialvertex of the walk is also the terminal vertexof the walk.
(d) FrequencyThe frequency values of each motif are listedfor the three di!erent frequency conceptsF1, F2 and F3.
(e) StatisticsInformation about the statistical signifi-cance is given by the Z-score and the P-value. In addition, mean value and stan-dard deviation of motif frequency in ran-domised versions of the network are pre-sented.
Figure 4: Motif Table showing label, size, structure,frequency and statistics for motifs. The selected motif(blue) is shown in the motif view (Figure 5) and ismarked in the motif fingerprint (Figure 6).
2. Motif ViewThe motif view provides a visual representationof motifs. Selected motifs are displayed witha layout computed by a force-directed layoutmethod (Fruchterman & Reingold 1991), seeFigure 5.
Figure 5: Motif View showing the structure of mo-tifs. The displayed (active) motif is highlighted inthe motif table (Figure 4) and marked in the motiffingerprint (Figure 6).
3. Motif FingerprintThe motif fingerprint shows a motif frequencyspectrum for the target network. The fingerprintcomprises all motifs of a particular size. In themotif fingerprint, as shown in Figure 6, the motiffrequency values of the motif table are plotted.The order of the motifs is defined by the alphanu-merical order of the motif label, taking both thesupported motifs and the motifs with frequency

Motif Fingerprint
motif-preserving layout (for F3)
network
Motif Matches
select motifin table
select motifin fingerprint
highlight F1
highlight F3
highlight F2
select motif in view
sort table
lay out motif
Motif View
Motif Tablecompute matches
cluster-preserving layout
motif size
number ofrandomisations
zoom in
Figure 3: Use case diagram showing the di!erent perspectives and possibilities for user interaction. For ascreenshot of MAVisto see also Figure 17.
zero into account. This guarantees the compara-bility of motif fingerprints of di!erent networks.The values for the frequency concepts F1, F2 andF3 are plotted as overlaid columns. The value forF1 is the red column in the background, which iscovered at least partially by the blue column forF2. The green column for the value for F3 is infront of the red and the blue column. This cov-ering does not lead to a loss of information, sincethe frequency of a motif decreases monotonicallyfor concepts F1 to F3. For motifs not supportedby the analysed network, an additional columnis shown using the frequency value %1 as a placeholder (yellow).
4. Motif MatchesFor the visual exploration of the occurrences ofa motif within the network highlighting of thematches is provided, see Figures 7 - 9.For frequency concept F1, which does not restrictthe sharing of network elements, the covering ofnetwork elements by motif matches is displayed.Frequency concept F2 allows sharing of verticesfor di!erent matches, but prohibits sharing ofedges. Therefore, only the edges of each matchare highlighted uniquely. For frequency conceptF3, where network elements are not shared bydi!erent matches, the elements of each match areuniquely highlighted.
Figure 6: The Motif Fingerprint shows a motif fre-quency spectrum for the analysed network (here azoom-in is shown). In the motif fingerprint the activemotif is marked by an arrow on top of the columncorresponding to the active motif of the motif view(Figure 5) and the motif table (Figure 4).
3.3 Interaction
1. Motif TableThe motif table is the starting point of the ex-ploration process. After the search has been car-

Figure 7: Network with highlighted motif matchesof frequency concept F1. The corresponding motifis shown in the motif view, see Figure 5. Networkelements covered by matches are shown in black, el-ements not involved in any match are coloured lightred.
ried out it lists all discovered motifs of the givensize along with additional information. The mo-tif table supports sorting of the entries accord-ing to each column (alpha numerical for the la-bel column and numerical sorting for all othercolumns). Furthermore, multilevel sorting is sup-ported by keeping one (or more columns) sortedand sorting identical values by another column.Motifs can be selected for further analysis to bedisplayed in the motif view. The table supportsthe selection of one or multiple motifs to be dis-played in the motif view. Additionally, the se-lection of a motif in the motif view or in themotif fingerprint leads to the selection of the cor-responding row of the motif in the table, if con-tained in the table.
2. Motif ViewIn the motif view motifs are displayed as smallnetworks allowing for visual analysis of its struc-ture, showing one motif at a time (the active mo-tif). The layout of a motif can be changed usinga force-directed layout algorithm (Fruchterman& Reingold 1991) or can be manually adjusted.The user can switch between di!erent motifs dis-played in the motif view. The active motif isalways marked in the motif fingerprint and is se-lected in the motif table. The matches of theactive motif can be highlighted within the anal-ysed network for the three frequency concepts.The user can select either a colour spectrum or agray scale spectrum for highlighting of matcheswith disjunct network elements (i.e., edges forF2, vertices and edges for F3).
3. Motif FingerprintThe motif fingerprint allows a visual explorationof the motif frequency spectrum. The fingerprint
Figure 8: Network with highlighted motif matchesof frequency concept F2. The corresponding motifis shown in the motif view, see Figure 5. Edges ofeach motif are uniquely coloured. Vertices included inmotif matches are displayed black and the remainingelements not involved in any match are coloured lightred.
supports zooming into a particular region of in-terest. The label of the corresponding motif of acolumn is displayed as a tool tip text by movingthe mouse cursor over this column. By clickingon a column, this column is marked by an ar-row, the motif is displayed in the motif view andthe corresponding row is selected in the motif ta-ble (if present in the table). Furthermore, motifsof the fingerprint not supported by the analysednetwork can also be selected to be displayed inthe motif view.
4. Motif MatchesTo obtain an overview of the network of interestit can be laid out using a force-directed place-ment algorithm (Fruchterman & Reingold 1991).The implementation of the algorithm o!ers thepossibility to interactively change the parametersa!ecting the layout. To explore the distributionof the di!erent motif occurrences the matches ofthe motifs are highlighted within the target net-work. For concept F1 the matches can overlapand the edges and vertices cannot be uniquelyassigned to one match. Therefore, the individ-ual matches are not marked, but the coverage ofthe network elements by matches is shown. Thematches for frequency concept F2 and F3 can beuniquely highlighted by marking the edges (F2),or both vertices and edges (F3), of a match indi-vidually.
4 Enhanced Force-Directed Layout
Motifs structure a network. For example, motifmatches may be relatively isolated parts of the net-work with only few connections to other matches or

Figure 9: Network with highlighted motif matchesof frequency concept F3. The corresponding motif isshown in the motif view, see Figure 5. Each match ishighlighted by colouring the vertices and edges, theremaining vertices and edges are coloured light red.
the remaining network, or may be heavily connectedto them. Furthermore, all matches of a specific mo-tif separate the network into two parts: network ele-ments covered by motif matches and uncovered net-work elements. In this section we discuss enhance-ments of the layout of a network to improve the vi-sual analysis of network motifs based on a flat (non-hierarchical) clustering, and extensions of the motif-preserving force-directed layout algorithm presentedin (Klukas, Koschutzki & Schreiber 2005).
A force-directed layout method (Eades 1984,Fruchterman & Reingold 1991) works by computing a’force’ vector "f for each vertex u. For each edge fromvertex u to a vertex v an attractive force is computedsuch that vertex u gets an optimal distance to v. Forall vertices v not connected to u repulsive forces arecomputed. The vector "f of the vertex u is the sumof the attractive and repulsive forces. Each vertex isthen moved by a small amount in the direction of thecorresponding force. This is repeated until the sum ofall force vectors falls below some threshold or a timelimit is reached.
A motif-preserving layout for disjoint motifmatches (e.g. based on frequency concept F3) hasbeen described previously (Klukas et al. 2005). Everymatch is uniformly laid out corresponding to a givenlayout, e.g. the layout in the Motif View. The algo-rithm works as follows: An initial placement of thevertices is computed which assigns random positionsto all vertices that do not belong to a motif match.Then all vertices of the matches are placed with thegiven layout. A random move vector is calculated andapplied to all vertices that belong to a certain matchsuch that at the end of the initial layout every matchis placed on a di!erent position without overlappinganother match. The modified force-directed layoutloop calculates the usual force vector for each vertex
Figure 10: Here the same matches as in Figure 9 areshown, but the network is laid out by preserving thelayout of the motif for each match (motif-preservinglayout).
not belonging to a motif match. For all vertices be-longing to a particular match a uniform force vectoris calculated which is the average of the forces forall vertices of the match. All vertices of the matchare moved at once, therefore the relative layout ofthe vertices within the match does not change. Fig-ure 10 shows a result of the motif-preserving layoutalgorithm. In addition to the existing algorithm wefound that the introduction of higher repulsive forcesbetween vertices of a motif match and other verticesimproves the overall layout and better separates thematches from the network, see Figures 11 and 12.
To further improve the visual analysis of motifsin networks we introduce a new cluster-preservinglayout. A cluster-graph GC = (VC , EC) to a givengraph G = (V,E) is a graph where each node1
n # VC represents a subgraph Gn of G and eachlink l # EC , l = (ni, nj) represents the set of edgesof G which connects vertices of the subgraph Gi withthe subgraph Gj . We consider simple cluster-graphswhere each vertex of G belongs to one node of GCand each edge of G belongs to either one node orone link of GC . Figures 13 and 14 show a graph Gand a cluster-graph GC , respectively. Here the sizeof a node is proportional to the number of vertices inthe corresponding subgraph and the width of a linkbetween two nodes is proportional to the number ofedges between the corresponding subgraphs.
The idea is to use a layout of the cluster-graphGC to obtain a better layout of the graph G whichhelps in a visual separation of the clusters. Thereforeanother initial step is added: First the cluster-graphhas to be laid out. Any graph drawing algorithm canbe used depending on the structure of the cluster-graph, see for example (Battista, Eades, Tamassia &Tollis 1999). Then the layout of the graph itself is
1Vertices and edges of the cluster-graph are called nodes andlinks, respectively.

Figure 11: Matches of the feed-forward loop motiflaid out by the motif-preserving layout.
computed. Additional gravity forces are introducedin the force-directed layout method. Beside attractiveand repulsive forces the gravity force is also added tothe force vector "f of each vertex. The coordinatesof the nodes of the cluster-graph are the gravity cen-tres for the gravity forces of the corresponding ver-tices of the graph. Depending on the strength of thisforce the clusters are more or less preserved: a forceclose to zero results in a typical force-directed lay-out whereas a high force clusters vertices around thecorresponding gravity centres, see Figures 15 and 16.This method gives an application or user a great flex-ibility for the layout of the cluster-graph. An alterna-tive method which does not use an additional layoutof the cluster-graph but uses additional vertices with-out fixed coordinates as gravity centres is describedby Eades and Huang (Eades & Huang 2000).
Cluster-preserving layouts can be used for twoanalysis tasks: (1) to get a better understandingof the interconnections between motif matches and(2) to visually study the coverage of the network bymatches.
(1) To better understand the function of a motifmatch and also the functional role of the motif it isimportant to help in analysing if motif matches arerelatively separate parts of the network with only fewconnections to other matches or the remaining net-work, or if such matches have many connections. Fig-ure 11 shows a typical example where the connectionsof motif matches are hard to analyse. However, usingthe cluster-preserving layout it is possible to place allmatches apart from the remaining network and em-phasis the connections of a match to other vertices,see Figure 13.
(2) Individual motif matches aggregate into a sub-network of overlapping matches also called a networktheme. Network themes can be tied to specific biolog-ical phenomena and may represent more fundamen-tal network design principles (Zhang, King, Wong,Goldberg, Tong, Lesage, Andrews, Bussey, Boone &
Figure 12: The same motif matches as in Figure 11are shown, however, increased repulsive forces be-tween matches and the remaining vertices separatethe motif matches clearly from the remaining networkand enhance the readability of the diagram.
Rot 2005). Examples of important network themeshave been shown in an integrated S. cerevisiae inter-action network (Zhang et al. 2005) and (as combina-tion of several motifs) in the E. coli transcriptionalregulatory network (Dobrin et al. 2004). Represent-ing networks in terms of network themes provides auseful simplification of complex biological relation-ships (Zhang et al. 2005). By clustering vertices intotwo clusters (vertices covered by a match and uncov-ered vertices) and placing these two clusters in di!er-ent areas, the network theme can be easily shown, seeFigure 15.
5 The MAVisto System
Most of the described features are implementedin MAVisto, the Motif Analysis and Visualisationtool (Schreiber & Schwobbermeyer 2005). MAV-isto is written in Java and is freely available asa Java Webstart application at http://mavisto.ipk-gatersleben.de/. It is based on Grav-isto (Bachmaier, Brandenburg, Forster, Raitner &Holleis 2005), an editor for graphs and a toolkit forimplementing graph visualisation algorithms and sup-ports the Pajek-.net (Batagelj & Mrvar 2004) and theGML-file (Himsolt 2000) formats. Furthermore, ito!ers graph editor functionality for network manip-ulation and for creation of a network from scratch.Networks are interpreted as either directed or undi-rected using this property for all edges. The improvedcluster-preserving layout is currently under evalua-tion and will be included in the next release of MAV-isto.
The running time of the motif search algorithm de-pends on both the size of the analysed network andthe size of the motifs. For searching motifs of sizethree to five the algorithm has been optimised. Here,

Figure 13: Cluster layout for frequency conceptF3. The layout of the corresponding cluster-graphis shown in Figure 14.
the determination of the canonical label is acceleratedby the use of a lookup-table and analysis of motifs canbe reasonably applied for sparse networks with up toseveral hundred vertices. The other important factora!ecting the running time of the search process for allmotifs is the number of randomisation of the network.To obtain significant results at least a thousand net-works have to be considered (Milo et al. 2002, Maslovet al. 2003). However, the running time of the al-gorithms for visualisation and interactive navigationbetween the di!erent perspectives is much faster forthese networks and motif sizes as these algorithms areindependent of the search. For example sorting themotif table takes O(n log n) and computing the motiffingerprint O(n) if n is the number of motifs.
6 Discussion
We have presented coordinated perspectives for theanalysis of network motifs and a cluster-preservingforce-directed layout algorithm. Most parts of thismethodology has been implemented in MAVisto. Thedevelopment of the presented methods has been car-ried out in close collaboration with users from biologyand the tool is used to analyse di!erent biological net-works such as protein-protein interaction, gene regu-latory and metabolic networks. Here we discuss theusage of the system on a practical example.
Network motif analysis with MAVisto starts byloading the network of interest. Here we use a net-work with information about transcriptional regula-tion of genes of E. coli. To get an overview of thenetwork structure, the network can be automaticallylaid out or manually adjusted. After the layout is cal-culated for our E. coli network, di!erent unconnectedcomponents appear: one big connected componentwhich comprises most of the network elements andsome smaller components. Moreover, one frequentlyoccurring network topology is noticeable that consistsof one central vertex pointing to numerous other ver-tices.
For the search for network motifs, parameters suchas the size of motifs to look for and the number ofrandomised networks to consider for the calculation
Figure 14: The layout of the cluster-graph corre-sponding to the graph in Figure 13.
of the statistical significance have to be adjusted. Forthis network we start the search for motifs with fourvertices and use 1000 randomised networks for statis-tics calculation. Once the search has finished, the mo-tifs supported by the network along with informationabout them are listed in the Motif Table and the fre-quency distribution is shown in the Motif Fingerprint.18 motifs with four vertices out of 199 theoreticallypossible motifs have been found in the E. coli net-work covering a broad range of frequency, that nowcan be interactively explored. The motifs in the tablecan be sorted for example by their statistical signifi-cance, by their frequency or by structural propertiessuch as number edges. Motifs found to be interestingcan be analysed by displaying their structure in theMotif View. In the E. coli network four motifs werefound having a Z-score above 10. Displaying thesemotifs in the Motif View reveals that one is the b-fanmotif and the other three motifs are extensions of thefeed-forward loop motif. Motif matches of selectedmotifs can be highlighted in the studied network forthe three frequency concepts to analyse their over-all distribution and which network elements are in-volved. In our network the well-known b-fan motifhas the highest frequency of the four most significantmotifs for all three frequency concepts. Visualisingthe covering of network elements by matches of theb-fan motif reveals that one big motif theme is buildby overlapping matches, see Figure 17.
Now other motifs found to be interesting can beexplored by going back to the Motif Table and MotifView. The di!erent views of MAVisto are coordi-nated as the selection of a motif in one view on theright side also highlights this motif in the other twoviews. The Motif Table is the starting point of the ex-ploration process where the search process is startedand where the results are presented. The Motif Viewis the starting point for the visual exploration of mo-tif matches. This way, the user first can inspect thestructure and significance of the motifs and then startto explore the matches within the network.
MAVisto has so far been used to study networks inthe size of dozens to several hundred vertices and mo-tif sizes of three to five vertices. The motif search mayalways take a long time especially if several hundredrandomised networks are compared for the statistical

Figure 15: Cluster layout for frequency concept F1.Strong cluster-forces separate both clusters in thedrawing. The right side shows the network theme,the subnetwork covered by motif matches.
analysis. However, the interaction between the di!er-ent perspectives as well as the layout for this networksize is fast. An important question is the scalabilityof our approach to analyse larger networks with thou-sands of vertices. Two main problems have to be con-sidered: finding all motif matches and presenting theresults in a readable way. To address the first ques-tion we are working on a parallel version of the searchalgorithm. The second problem is a general problemin information visualisation and graph drawing: howto communicate vast amounts of information to theuser. In MAVisto several methods have been imple-mented to provide overview, zoom and filter as well asdetails on demand. However, for large networks newabstraction techniques are necessary such as foldingand unfolding of matches and sampling to approx-imate information from small parts of the network.Currently we are focusing on biological networks asour users are from the life science community. How-ever, network motif analysis has applications in manyfields of science from biology to electrical engineeringto sociology and we are interested using our systemin these fields.
References
Bachmaier, C., Brandenburg, F. J., Forster, M., Rait-ner, M. & Holleis, P. (2005), Gravisto: Graphvisualization toolkit, in ‘Proceedings of the In-ternational Symposium on Graph Drawing (GD2004)’, Vol. 3383 of Lecture Notes in ComputerScience, Springer, pp. 502–503.
Batagelj, V. & Mrvar, A. (2004), Pajek - Analysis andVisualization of Large Networks, in M. Junger& P. Mutzel, eds, ‘Graph Drawing Software’,Springer, pp. 77–103.
Battista, G. D., Eades, P., Tamassia, R. & Tollis,I. G. (1999), Graph Drawing: Algorithms for theVisualization of Graphs, Prentice-Hall.
Conant, G. C. & Wagner, A. (2003), ‘Convergentevolution of gene circuits’, Nature Genetices34(3), 264–266.
Dobrin, R., Beg, Q. K., Barabasi, A.-L. & Oltvai,Z. N. (2004), ‘Aggregation of topological motifsin the Escherichia coli transcriptional regulatorynetwork’, BMC Bioinformatics 5(1), 10.
Figure 16: Cluster layout for frequency concept F2.In contrast to Figure 15 lower cluster-forces have beenused.
Eades, P. (1984), ‘A heuristic for graph drawing’,Congressus Numerantium 42, 149–160.
Eades, P. & Huang, M. L. (2000), ‘Navigat-ing clustered graphs using force-directed meth-ods.’, Journal of Graph Algorithms Applications4(3), 157–181.
Fruchterman, T. & Reingold, E. (1991), ‘Graphdrawing by force-directed placement’, Software- Practice and Experience 21(11), 1129–1164.
Garey, M. R. & Johnson, D. S. (1979), Computersand Intractability: A Guide to the Theory ofNP-Completeness, W.H. Freeman and Company,New York.
Harary, F. & Palmer, E. M. (1973), Graphical Enu-meration, Academic Press, New York.
Himsolt, M. (2000), ‘Graphlet: design and implemen-tation of a graph editor’, Software - Practice andExperience 30(11), 1303–1324.
Kashtan, N., Itzkovitz, S., Milo, R. & Alon, U. (2002),Mfinder tool guide, Technical report, Depart-ment of Molecular Cell Biology and ComputerScience & Applied Mathematics, Weizman In-stitute of Science.
Klukas, C., Koschutzki, D. & Schreiber, F. (2005),‘Graph pattern analysis with PatternGravisto’,Journal of Graph Algorithms and Applications9(1), 19–29.
Kuramochi, M. & Karypis, G. (2004), Finding fre-quent patterns in a large sparse graph, in ‘SIAMInternational Conference on Data Mining (SDM-04)’.
Lee, T. I., Rinaldi, N. J., Robert, F., Odom, D. T.,Bar-Joseph, Z., Gerber, G. K., Hannett, N. M.,Harbison, C. T., Thompson, C. M., Simon, I.,Zeitlinger, J., Jennings, E. G., Murray, H. L.,Gordon, D. B., Ren, B., Wyrick, J. J., Tagne,J. B., Volkert, T. L., Fraenkel, E., Gi!ord, D. K.& Young, R. A. (2002), ‘Transcriptional regula-tory networks in Saccharomyces cerevisiae’, Sci-ence 298(5594), 799–804.
Mangan, S. & Alon, U. (2003), ‘Structure and func-tion of the feed-forward loop network motif’,Proceedings of the National Academy of Sciences100(21), 11980–11985.

Figure 17: Screenshot of the system showing a step of the anlysis of the E. coli transcriptional regulatorynetwork.
Mangan, S., Zaslaver, A. & Alon, U. (2003), ‘The co-herent feedforward loop serves as a sign-sensitivedelay element in transcription networks’, Journalof Molecular Biology 334(2), 197–204.
Maslov, S. & Sneppen, K. (2002), ‘Specificity and sta-bility in topology of protein networks’, Science296, 910–913.
Maslov, S., Sneppen, K. & Alon, U. (2003), Correla-tion profiles and motifs in complex networks, inS. Bornholdt & H. G. Schuster, eds, ‘Handbookof Graphs and Networks: From the Genome tothe Internet’, Wiley-VCH, Berlin, pp. 168–198.
Milo, R., Shen-Orr, S., Itzkovitz, S., Kashtan, N.,Chklovskii, D. & Alon, U. (2002), ‘Network mo-tifs: Simple building blocks of complex net-works’, Science 298(5594), 824–827.
Schreiber, F. & Schwobbermeyer, H. (2004), Towardsmotif detection in networks: Frequency conceptsand flexible search, in ‘Proceedings of the Inter-national Workshop on Network Tools and Appli-cations in Biology (NETTAB’04)’, pp. 91–102.
Schreiber, F. & Schwobbermeyer, H. (2005), ‘MAV-isto: a tool for the exploration of network mo-tifs’, Bioinformatics 21(17), 3572–3574.
Shen-Orr, S., Milo, R., Mangan, S. & Alon, U. (2002),‘Network motifs in the transcriptional regula-tion network of Escherichia coli’, Nature Genet-ics 31(1), 64–68.
Sporns, O. & Kotter, R. (2004), ‘Motifs in brain net-works’, PLoS Biology 2(11), e369.
Vanetik, N., Gudes, E. & Shimony, E. (2002), Com-puting frequent graph patterns from semistruc-tured data, in ‘Proceedings of the IEEE Inter-national Conference on Data Mining (ICDM)’,pp. 458–465.
Wuchty, S., Oltvai, Z. N. & Barabasi, A.-L. (2003),‘Evolutionary conservation of motif constituentsin the yeast protein interaction network’, NatureGenetics 35(1), 176–179.
Zhang, L. V., King, O. D., Wong, S. L., Goldberg,D. S., Tong, A. H., Lesage, G., Andrews, B.,Bussey, H., Boone, C. & Rot, F. P. (2005),‘Motifs, themes and thematic maps of an inte-grated saccharomyces cerevisiae interaction net-work’, Journal of Biology 4(2), Epub.


![nhanced il ecoer - pumpfundamentals.com1].pdfNitrogen Lift – Coiled Tubing Operations. Nitrogen lifting is a common technique used to initiate production on a well following workover](https://img.pdfslide.net/doc/110x75/611734b4f729ec3552244793/nhanced-il-ecoer-1pdf-nitrogen-lift-a-coiled-tubing-operations-nitrogen-lifting.jpg)