Embed Size (px)
Citation preview

Sustainable Development Report 2011
Transnet SOC Ltd Sustainable Development Report 2011c
Contents
About this report 2
Sustainability highlights 3About Transnet 4
Integrating sustainability into Transnet’s Quantum Leap strategy 7
Quantum Leap strategy 8Quantum Leap focus areas 9Importance of sustainability for Transnet 10
Governance systems that drive accountability 15
Safety, skills and a culture of delivery 21
Efficiency, security and reliability 31
Environmental compliance and climate change 39
Aligning with priorities of the Developmental State 45
Corporate Social Investment 53
Transnet GrI table 2011 56
1
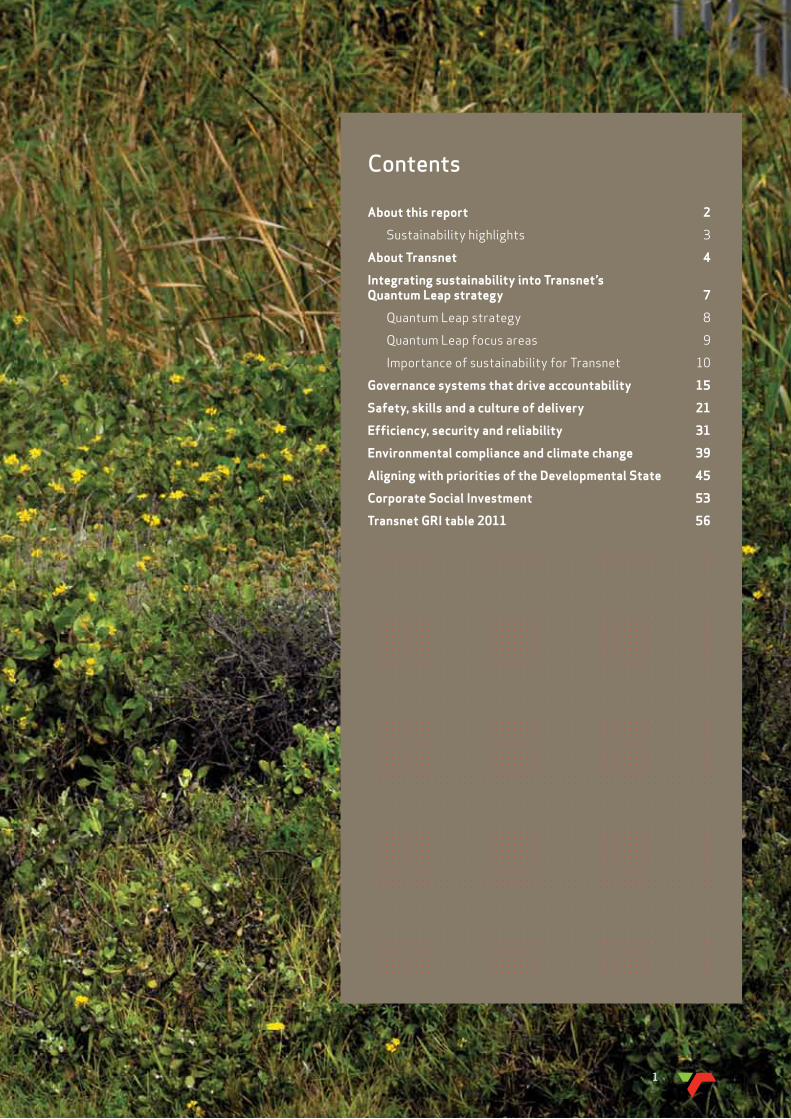
About this report
Transnet SOC Ltd (Transnet or the Company) views sustainable development as an approach to creating and sustaining value for society. As such, the Company’s mandate to lower the cost of doing business in South Africa, enabling economic growth and ensuring security of supply through providing appropriate port, rail and pipeline infrastructure in a cost-effective and efficient manner, is clearly aligned with the overarching goals of sustainable development.
This Sustainable Development Report (SDR or the report) provides details of Transnet’s environmental, social and economic impacts and covers the year ended 31 March 2011. It is published as part of Transnet’s larger commitment to sustainability, and the Company’s efforts to integrate this into its Quantum Leap strategy as well as its Operations.
The SDR covers the Company’s five Operating divisions: Transnet Freight Rail (Freight Rail), Transnet Rail Engineering (Rail Engineering), Transnet National Ports Authority (National Ports Authority), Transnet Port Terminals (Port Terminals) and Transnet Pipelines (Pipelines). The SDR further includes the Company’s Specialist Units: Transnet Capital Projects (Capital Projects), Transnet Property and the Transnet Foundation. Transnet has no active subsidiaries or joint ventures in which the Company’s influence is sufficiently material to include in this report. All significant operations are based in South Africa.
Performance data is presented as an aggregate of these Operating divisions and Specialist Units, with detail on Operating divisions’ specific sustainability performance, which is available in the Operational reviews section of the Integrated Annual Report.
Since 2005, Transnet’s sustainability reports comprised a chapter within the Company’s Annual Report. In compliance with South Africa’s King Code of Governance Principles (King III), 2011 marks the first year of Transnet’s implementation of integrated reporting. Transnet’s first Integrated Annual Report covers governance, financial, social, environmental, broader economic performance and provides a high-level overview, clarifying the linkages between sustainability and the core business. Transnet’s SDR is written overtly from
the perspective of the sustainability “lens” and is a standalone report available on the Transnet website. In line with emerging practice in this field, strategic sustainability topics of specific relevance to business performance and financial shareholders are integrated throughout the Integrated Annual Report. This separate SDR is designed to provide greater detail on Transnet’s Group-wide sustainability performance of interest to a broad array of stakeholders.
The focus areas of the SDR were identified by building on previous report topics, as well as reprioritising key issues. These key issues now frame the structure of this report, acting as section headings under which all relevant areas are clustered. Although the team undertaking this process took into account several stakeholder perspectives, Transnet is still in the process of engaging both internal and external stakeholders more broadly on the Company’s sustainability strategy and its implementation.
The Global Reporting Initiative (GRI) Reporting Framework and G3 guidelines have been used to inform this SDR, focusing on the indicators most material to Transnet. A comprehensive GRI table can be found at the end of this report. Transnet assesses its SDR 2011 to rate as a ‘C’ in terms of the GRI.
SDR 2011 is available on Transnet’s website, as a downloadable document: www.transnet.net
For queries or suggestions contact: Ms Sue Lund General Manager: Public Policy Transnet SOC [email protected]
Transnet SOC Ltd Sustainable Development Report 20112
rELIAbILITy
EnvIronmEnT
DEvELopmEnT
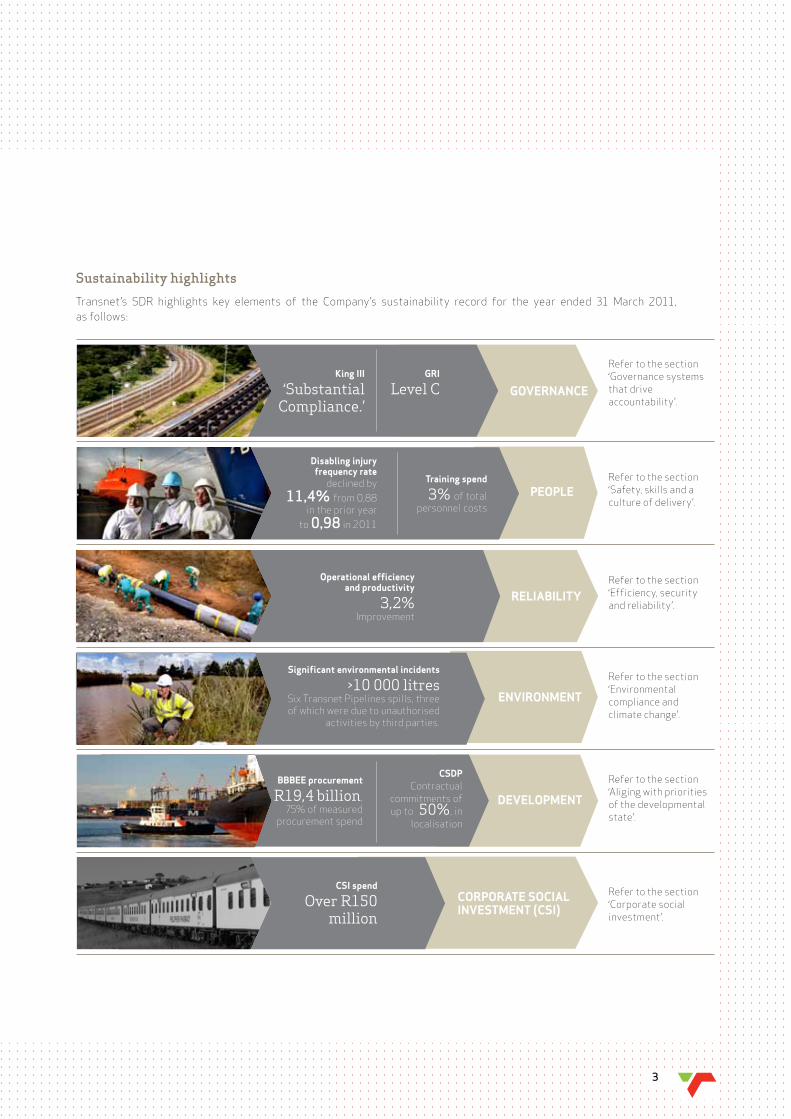
bbbEE procurement
R19,4 billion, 75% of measured
procurement spend
CSDpContractual
commitments of up to 50%, in
localisation
GovErnAnCEKing III
‘Substantial Compliance.’
GrI
Level C
pEopLETraining spend
3% of total personnel costs
Disabling injury frequency rate
declined by 11,4% from 0,88
in the prior year to 0,98 in 2011
CSI spend
Over R150 million
CorporATE SoCIAL InvESTmEnT (CSI)
Sustainability highlights
Transnet’s SDR highlights key elements of the Company’s sustainability record for the year ended 31 March 2011, as follows:
Significant environmental incidents
>10 000 litres Six Transnet Pipelines spills, three of which were due to unauthorised
activities by third parties.
operational efficiency and productivity
3,2% Improvement
Refer to the section ‘Governance systems that drive accountability’.
Refer to the section ‘Safety, skills and a culture of delivery’.
Refer to the section ‘Efficiency, security and reliability’.
Refer to the section ‘Environmental compliance and climate change’.
Refer to the section ‘Aliging with priorities of the developmental state’.
Refer to the section ‘Corporate social investment’.
3
Transnet SOC Ltd Sustainable Development Report 20114
About Transnet
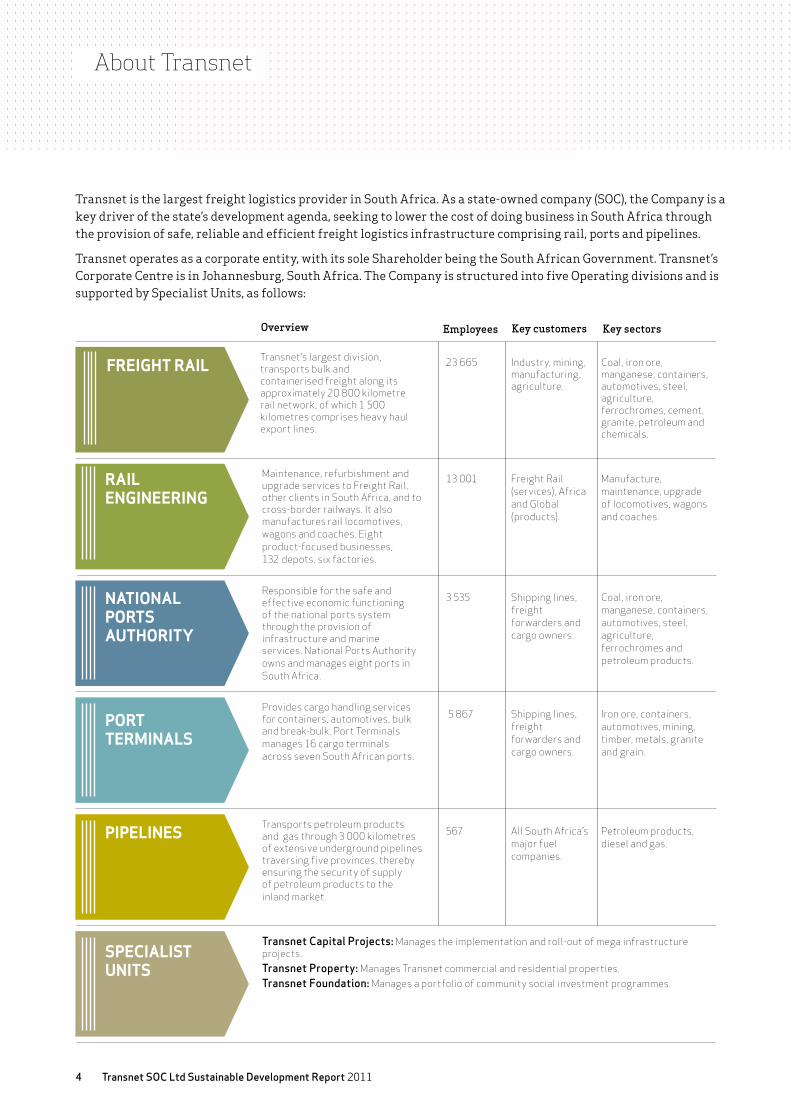
Transnet is the largest freight logistics provider in South Africa. As a state-owned company (SOC), the Company is a key driver of the state’s development agenda, seeking to lower the cost of doing business in South Africa through the provision of safe, reliable and efficient freight logistics infrastructure comprising rail, ports and pipelines.
Transnet operates as a corporate entity, with its sole Shareholder being the South African Government. Transnet’s Corporate Centre is in Johannesburg, South Africa. The Company is structured into five Operating divisions and is supported by Specialist Units, as follows:
Transnet’s largest division, transports bulk and containerised freight along its approximately 20 800 kilometre rail network, of which 1 500 kilometres comprises heavy haul export lines.
23 665 Industry, mining, manufacturing, agriculture.
Coal, iron ore, manganese, containers, automotives, steel, agriculture, ferrochromes, cement, granite, petroleum and chemicals.
13 001 Freight Rail (services), Africa and Global (products).
Manufacture, maintenance, upgrade of locomotives, wagons and coaches.
3 535 Shipping lines, freight forwarders and cargo owners.
Coal, iron ore, manganese, containers, automotives, steel, agriculture, ferrochromes and petroleum products.
5 867 Shipping lines, freight forwarders and cargo owners.
Iron ore, containers, automotives, mining, timber, metals, granite and grain.
567 All South Africa’s major fuel companies.
Petroleum products, diesel and gas.
Maintenance, refurbishment and upgrade services to Freight Rail, other clients in South Africa, and to cross-border railways. It also manufactures rail locomotives, wagons and coaches. Eight product-focused businesses, 132 depots, six factories.
Responsible for the safe and effective economic functioning of the national ports system through the provision of infrastructure and marine services. National Ports Authority owns and manages eight ports in South Africa.
Provides cargo handling services for containers, automotives, bulk and break-bulk. Port Terminals manages 16 cargo terminals across seven South African ports.
Transports petroleum products and gas through 3 000 kilometres of extensive underground pipelines traversing five provinces, thereby ensuring the security of supply of petroleum products to the inland market.
Transnet Capital Projects: Manages the implementation and roll-out of mega infrastructure projects.Transnet Property: Manages Transnet commercial and residential properties. Transnet Foundation: Manages a portfolio of community social investment programmes.
Overview Employees
rAIL EnGInEErInG
nATIonAL porTS AuThorITy
porT TErmInALS
pIpELInES
SpECIALISTunITS
frEIGhT rAIL
Key customers Key sectors
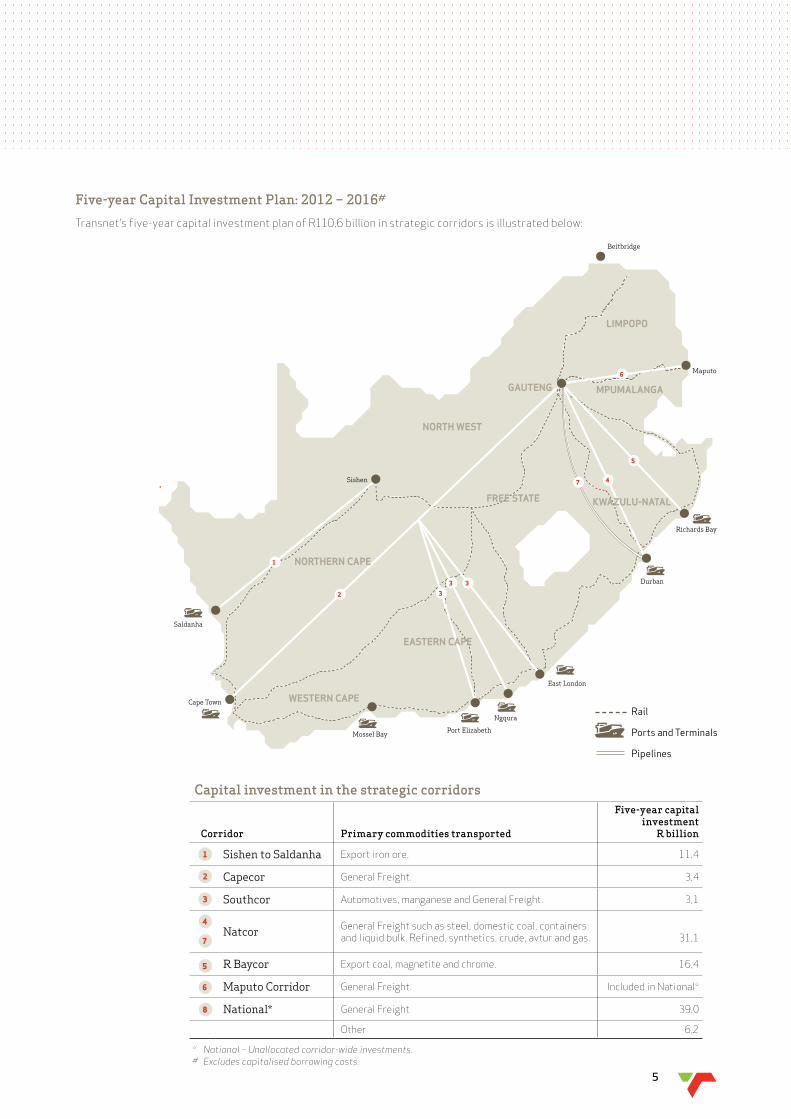
Capital investment in the strategic corridors
Corridor Primary commodities transported
Five-year capital investment
R billion
Sishen to Saldanha Export iron ore. 11,4
Capecor General Freight. 3,4
Southcor Automotives, manganese and General Freight. 3,1
Natcor General Freight such as steel, domestic coal, containers and liquid bulk. Refined, synthetics, crude, avtur and gas. 31,1
R Baycor Export coal, magnetite and chrome. 16,4
Maputo Corridor General Freight. Included in National*
National* General Freight 39,0
Other 6,2
* National – Unallocated corridor-wide investments.# Excludes capitalised borrowing costs.
Rail
Ports and Terminals Pipelines
2
6
8
5
3
4
7
1
Richards Bay
Sishen
East London
Port Elizabeth Mossel Bay
Ngqura
Durban
Saldanha
Cape Town
Maputo
Beitbridge
2
6
47
5
1
3
3 3
WESTErn CApE
norThErn CApE
EASTErn CApE
frEE STATE
norTh WEST
mpumALAnGA
LImpopo
GAuTEnG
KWAZuLu-nATAL
Five-year Capital Investment Plan: 2012 – 2016#
Transnet’s five-year capital investment plan of R110,6 billion in strategic corridors is illustrated below:
5
Transnet SOC Ltd Sustainable Development Report 20116
Integrating sustainability into Transnet’s Quantum Leap strategy
7
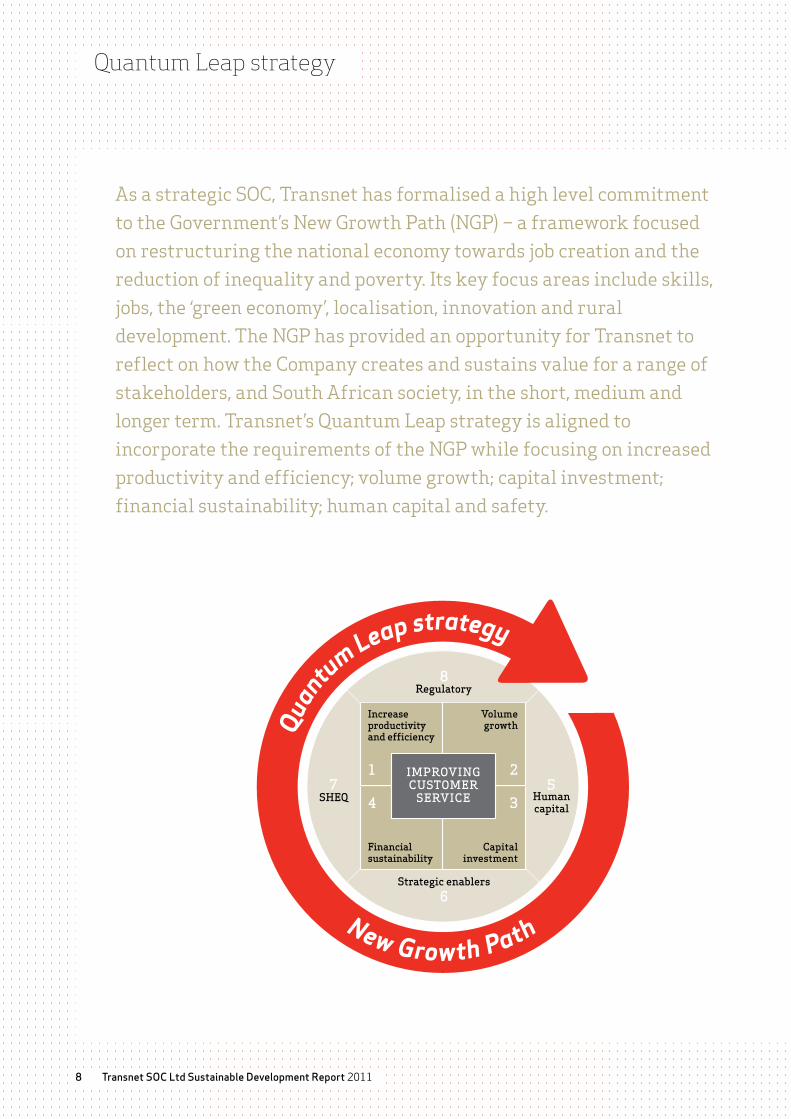
As a strategic SOC, Transnet has formalised a high level commitment to the Government’s New Growth Path (NGP) – a framework focused on restructuring the national economy towards job creation and the reduction of inequality and poverty. Its key focus areas include skills, jobs, the ‘green economy’, localisation, innovation and rural development. The NGP has provided an opportunity for Transnet to reflect on how the Company creates and sustains value for a range of stakeholders, and South African society, in the short, medium and longer term. Transnet’s Quantum Leap strategy is aligned to incorporate the requirements of the NGP while focusing on increased productivity and efficiency; volume growth; capital investment; financial sustainability; human capital and safety.
Increase productivity and efficiency
1
Volume growth
2
3
Capital investment
4 Financial sustainability
ImPROVIngCuStOmER
SERVICE
Regulatory
Humancapital
Strategic enablers6
SHEQ
Quantu
m Leap strategy
New Growth Path
Quantum Leap strategy
Transnet SOC Ltd Sustainable Development Report 20118
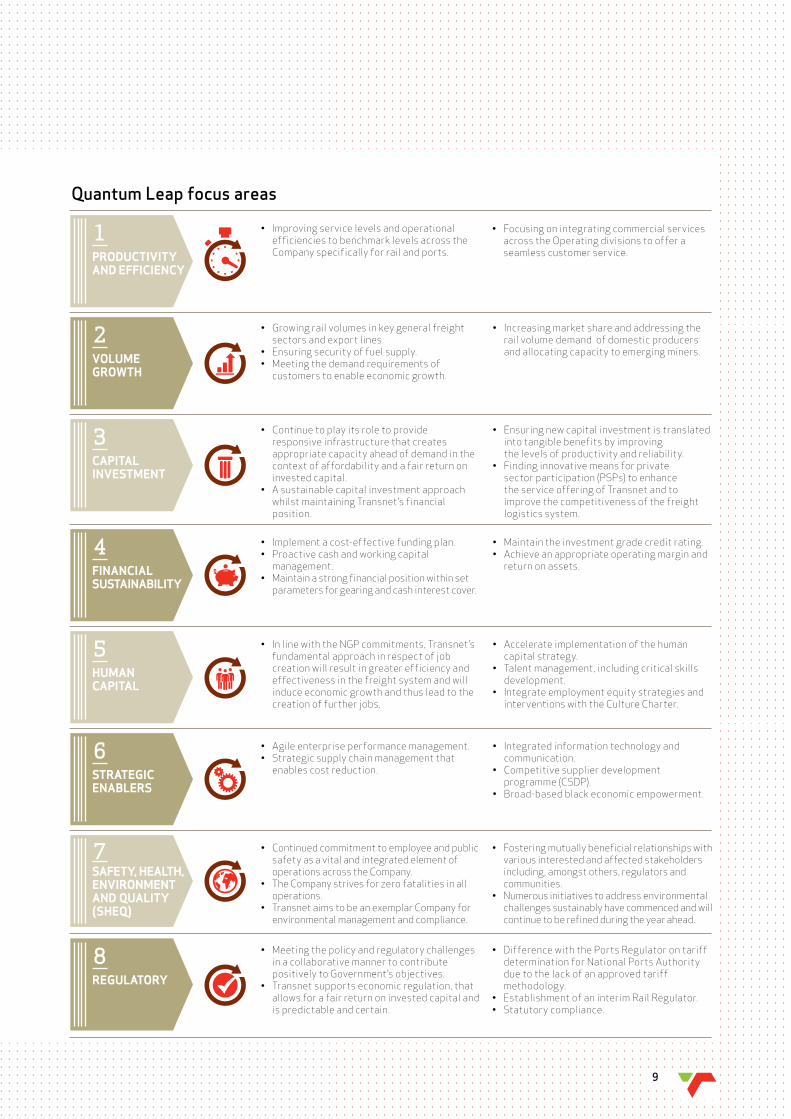
• Growingrailvolumesinkeygeneralfreightsectors and export lines.
• Ensuringsecurityoffuelsupply.• Meetingthedemandrequirementsof
customers to enable economic growth.
• Increasingmarketshareandaddressingtherail volume demand of domestic producers and allocating capacity to emerging miners.
• InlinewiththeNGPcommitments,Transnet’s fundamental approach in respect of job creation will result in greater efficiency and effectiveness in the freight system and will induce economic growth and thus lead to the creation of further jobs.
• Accelerateimplementationofthehumancapital strategy.
• Talentmanagement,includingcriticalskillsdevelopment.
• Integrateemploymentequitystrategiesandinterventions with the Culture Charter.
• Agileenterpriseperformancemanagement.• Strategicsupplychainmanagementthat
enables cost reduction.
• Integratedinformationtechnologyandcommunication.
• Competitivesupplierdevelopmentprogramme (CSDP).
• Broad-basedblackeconomicempowerment.
• Continuedcommitmenttoemployeeandpublicsafety as a vital and integrated element of operations across the Company.
• TheCompanystrivesforzerofatalitiesinalloperations.
• TransnetaimstobeanexemplarCompanyforenvironmental management and compliance.
• Meetingthepolicyandregulatorychallengesin a collaborative manner to contribute positively to Government’s objectives.
• Transnetsupportseconomicregulation,thatallows for a fair return on invested capital and is predictable and certain.
• Improvingservicelevelsandoperationalefficiencies to benchmark levels across the Company specifically for rail and ports.
• Fosteringmutuallybeneficialrelationshipswithvarious interested and affected stakeholders including, amongst others, regulators and communities.
• Numerousinitiativestoaddressenvironmentalchallenges sustainably have commenced and will continue to be refined during the year ahead.
• Focusingonintegratingcommercialservicesacross the Operating divisions to offer a seamless customer service.
• Difference with the Ports Regulator on tariff determination for National Ports Authority due to the lack of an approved tariff methodology.
• Establishment of an interim Rail Regulator.• Statutory compliance.
1proDuCTIvITy AnD EffICIEnCy
2voLumE GroWTh
5humAn CApITAL
6STrATEGIC EnAbLErS
7SAfETy, hEALTh, EnvIronmEnT AnD QuALITy (ShEQ)
8rEGuLATory
• Implement a cost-effective funding plan.• Proactivecashandworkingcapital
management.• Maintainastrongfinancialposition within set
parameters for gearing and cash interest cover.
• Maintaintheinvestmentgradecreditrating.• Achieveanappropriateoperatingmarginand
return on assets.4fInAnCIAL SuSTAInAbILITy
• Continuetoplayitsroletoprovideresponsive infrastructure that creates appropriate capacity ahead of demand in the context of affordability and a fair return on invested capital.
• Asustainablecapitalinvestmentapproachwhilst maintaining Transnet’s financial position.
• Ensuringnewcapitalinvestmentistranslatedinto tangible benefits by improving the levels of productivity and reliability.
• Findinginnovativemeansforprivate sector participation (PSPs) to enhance the service offering of Transnet and to improve the competitiveness of the freight logistics system.
3CApITAL InvESTmEnT
Quantum Leap focus areas
9

Transnet SOC Ltd Sustainable Development Report 201110
When viewing sustainability from the perspective of creating and sustaining value for society, Transnet’s NGP commitments, together with the Quantum Leap strategy, frame Transnet’s sustainability-related contributions.
Importance of sustainability for Transnet
SuSTAInAbILITy DrIvErS rISKS opporTunITIES
Resource constraints. • Costincreases.• Energysecurityissues(electricity,fuel).• Commoditypricefluctuations.
• Enhancedefficiencies.• Cost-savingsthroughresourceoptimisation.
Climate change and associated response.
• Weather-relatedderailments,washawaysandcancellations.• Carbontaxationandothermitigationstrategies.
• Contributiontoaddressingclimatechangepressures (including food distribution).
• Innovationonalternativeenergysources.
green economy and increasing awareness of sustainability issues.
• Costsanddelaysassociatedwithincreasedpermitrequirements.
• Socialandfinancialimpacts.• Reputationalrisksassociatedwithinadequategovernance
and compliance.
• Improvedoverallbusinessmanagement.• IncreasingrecognitionofTransnet’s
contribution. • Technologicalinnovationsinalternative
energy.
Continued social disparities.
• Skillsshortages.• Businessinterruption(strikes,batteryandcabletheft).• Competingpriorities.• Ongoingneedtosafeguardadjacentcommunitiesandtheir
properties.
• Enablingeconomicdevelopment.• Positivecontributionthroughjobcreation,
skills development, social projects.• Socialbenefitsofemploymentequity,
localisation and enterprise development.
geo-political shifts. • Buildssocialcapitalbyaddressingdisparitiesand developmental challenges.
• Populistuprisingsandsocialturbulence.• Shiftingtradepatterns.
• Growingregionalplayer.• EntryintotheBRICSpartnership.
Transnet’s mandate is to assist in lowering the cost of doing business in South Africa, enabling economic growth and ensuring security of supply through providing appropriate port, rail and pipelineinfrastructure.Byenhancingefficiency,expanding rail market share, increasing the New Multi-Product Pipeline’s capacity and increasing port connectivity, Transnet contributes significantly to reduced fuel use per ton of freight, enhanced energy security and socio-economic development. These are the Company’s primary positive impacts.
In line with environmental, social and governance commitments, the Company strives to achieve thesecontributionswithzerofatalities,significantly reduced environmental impact, exemplary levels of governance and accountability,
and with due consideration to the risks and opportunities emerging in a resource-constrained world.
Not only does sustainability inform key aspects of the Transnet strategic mandate, it also highlights key social and environmental risks and opportunities that impact the Company’s ability to achieve these goals.
Transnet recognises various drivers of sustainability that combine to create an increasingly volatile marketplace and consequently uncertainty is likely to impact the Company providing the context within which the Quantum Leap strategy and NGP commitments are implemented.
11
KEy ArEAS of InTEGrATIon
CrEATInG ShArED vALuE
LInK To QuAnTum LEAp AnD STrATEGIC InITIATIvES LInK To nGp
governance systems that drive accountability.
Buildssocialcapitalbypromotingtrust and accountability.
• Financialsustainability.• Regulatory.
• Regionalintegration.
Safety, skills and a culture of delivery.
Buildshumanandsocialcapitalthrough personal and career development.
• Humancapital.• SHEQ.
• Skillsdevelopment.• Jobcreation.
Efficiency, security and reliability.
Buildsfinancial,manufacturedandsocial capital by lowering costs of doing business, enabling economic growth and ensuring security of supply.
• Increaseproductivityandefficiency.
• Volumegrowth.• Capitalinvestment.• Financialsustainability.
• Capitalinvestment.• Achievearesponsiveinfrastructure.• Industrialcapability.• Servicelevelsandefficiencies.
Environmental compliance and climate change.
Reduces environmental degradation; supports the protection and restoration of natural capital.
• SHEQ. • Greeneconomy.
Aligning with priorities of the developmental state.
Buildssocialcapitalbyaddressingdisparities and developmental challenges.
• NGPcommitments. • Collaboratetomeetpolicychallenges.
• Ruraldevelopment.
Basedonthesustainabilitydrivers,aframeworkofkeysustainabilityareashasbeenidentifiedandtheseareasformthestructure of the SDR. Linkages with the Quantum Leap strategy and NGP are indicated below:
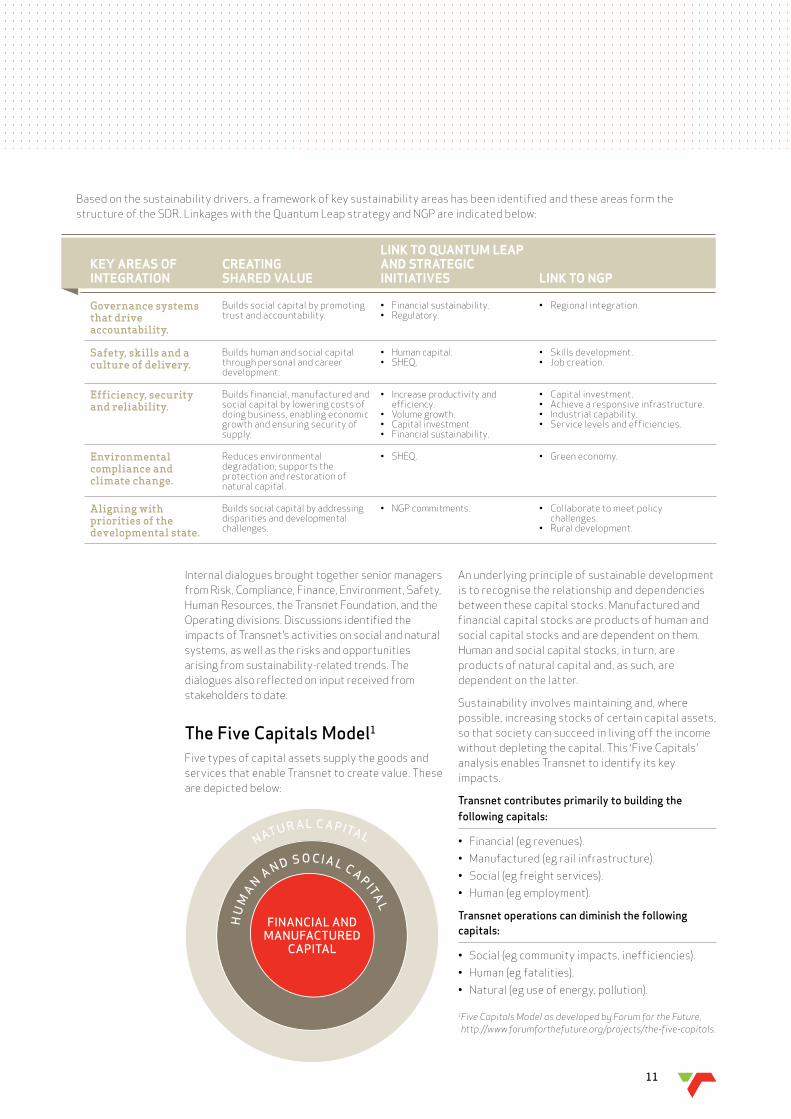
An underlying principle of sustainable development is to recognise the relationship and dependencies between these capital stocks. Manufactured and financial capital stocks are products of human and social capital stocks and are dependent on them. Humanandsocialcapitalstocks,inturn,areproducts of natural capital and, as such, are dependent on the latter.
Sustainability involves maintaining and, where possible, increasing stocks of certain capital assets, so that society can succeed in living off the income without depleting the capital. This ‘Five Capitals’ analysis enables Transnet to identify its key impacts.
Transnet contributes primarily to building the following capitals:
• Financial(egrevenues).• Manufactured(egrailinfrastructure).• Social(egfreightservices).• Human(egemployment).
Transnet operations can diminish the following capitals:
• Social(egcommunityimpacts,inefficiencies).• Human(egfatalities).• Natural(eguseofenergy,pollution).
1 Five Capitals Model as developed by Forum for the Future, http://www.forumforthefuture.org/projects/the-five-capitals.
Internal dialogues brought together senior managers from Risk, Compliance, Finance, Environment, Safety, HumanResources,theTransnetFoundation,andtheOperating divisions. Discussions identified the impacts of Transnet’s activities on social and natural systems, as well as the risks and opportunities arising from sustainability-related trends. The dialogues also reflected on input received from stakeholders to date.
The Five Capitals Model1
Five types of capital assets supply the goods and services that enable Transnet to create value. These are depicted below:
NATU R AL C APITAL
HU
MAN A N D S O CIA L C APITAL
FINANCIAL AND MANUFACTURED
CAPITAL
Transnet SOC Ltd Sustainable Development Report 201112
Managing sustainability at TransnetSustainability issues are cross-cutting and pervasive in the freight logistics business. For this reason, there is no separate sustainability division in Transnet. Rather, the approach has been one of co-ordination, seeking constantly to highlight aspects of stakeholder value creation within the Quantum Leap strategy and NGP commitments.
At present, Transnet is assessing whether the Quantum Leap strategy, together with the NGP commitments, provides an adequate sustainability framework to work within or whether a separate framework for sustainability would be preferable.
Either way, Transnet is committed to consolidating a plan of action around sustainability. Accordingly, the Company will undertake further sustainability processes in the year ahead, both internally and with a range of external stakeholders. Finalisation of the sustainability strategy is the responsibility ofTransnet’snewlyestablishedBoardSocialandEthics Committee, which has executive oversight of sustainability performance.
Key sustainability actions for 2012
The key sustainability commitments are as follows:
• Finalisethesustainabilityframeworkandclarifyits relationship to the NGP strategy and the Quantum Leap strategy;
• Developasustainabilitydashboardtotrackpriority sustainability-related initiatives, indicators and targets, and competencies across the Company;
• Developamanagementsystemforsustainability-related data to facilitate performance management;
• Clarifythesustainabilityreportingstructureasacross-functional, inter-departmental driver within Transnet;
• Usecreativecommunicationstoenhanceunderstanding of the implications of sustainability for Transnet and inspire Group-wide commitment to a sustainable future;
• Engagewithbothinternalandexternalstakeholders on Transnet’s sustainability challenges and opportunities and the priority issues that should be addressed;
• ReviewTransnet’senterpriseriskanalysisfromasustainability perspective and explore the opportunities arising from sustainability trends;
• Developthecapacityofinternalauditteamstointegrate sustainability elements into their audit protocols; and
• Stayabreastofemergingdebatesandthinkingaround sustainability in general, and those pertaining to the freight industry in particular.
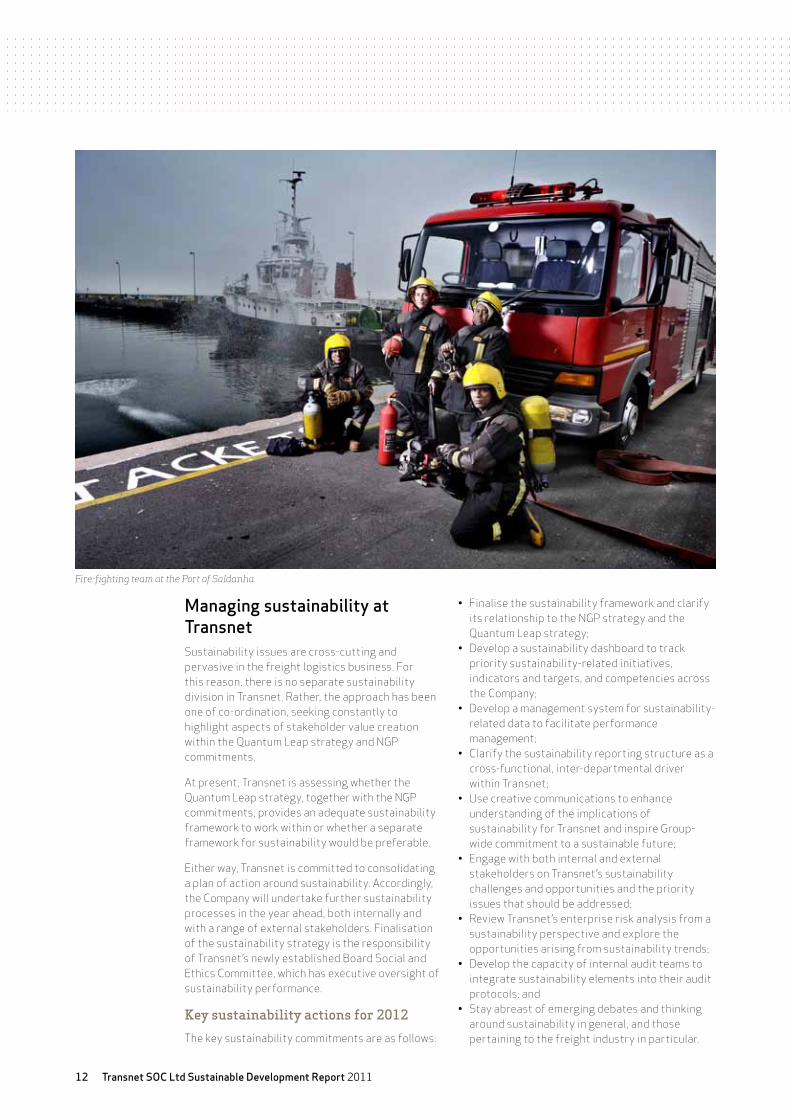
Fire-fighting team at the Port of Saldanha.
13
Engaging stakeholdersTransnet recognises that relations with a broad range of stakeholders are a key aspect of understanding and managing relevant social and environmental business risks. The Company regards reputation as a vital intangible asset upon which social trust is built, enabling long-term operating ability.
Whileinternalsustainabilitydialoguesarecontinuing, the Company has not yet taken this dialogue overtly to external stakeholders. Ongoing engagements with customers, Government, suppliers and others relate to numerous sustainability-related issues. There is also a commitment to continued stakeholder engagement
and actively responding to concerns and issues raised (see Stakeholder engagement table below).
At present, Transnet’s stakeholder engagement is managed as part of its Reputation Management strategy, in which structured and systematic plans are outlined to manage reputation, guide stakeholder engagement processes, and mitigate reputational risks should they arise.
The 2011 Integrated Annual Report, and particularly this SDR, is regarded as an initial step in exploring an overtly sustainability-based dialogue with a broader range of stakeholders in the coming two years.
Structured stakeholder engagement activities are outlined in the following table:
STAKEhoLDEr Group EnGAGEmEnT ApproACh
mAIn ArEA of STAKEhoLDEr ConCErn TrAnSnET’S rESponSE
Shareholder and other SOCs
• Shareholder’s Compact engagements.
• Quarterly report, Annual reports and Corporate Plans.
• SOCs CEO’s, Chairman and Chief Financial Officer forums.
• Annual General Meetings.• Boardengagementwiththe
Shareholder Minister, Deputy Minister and the Director General of DPE.
• PerformanceintermsofShareholder’s Compact.
• Governance.• Productandservice
delivery. • Financialreporting.• Innovation.• Leadership.• ProgressagainstNGP
commitments.
• Compliance with sound principles of corporate governance.
• Implementing vigilant risk management and controls.
• Compliance with the following regulations: Public Finance Management Act, Treasury Regulations, Companies Act.
• Execution of the Quantum Leap strategy and fulfiling the Company’s mandate.
• NGP commitments.
Regulators and other government agencies
• Meetings with policy departments and Ministers.
• Periodic reports and returns to regulatory authorities.
• Periodic submissions to the relevant Parliamentary Portfolio Committees.
• Governance.• Citizenship.• Leadership.• Productsandservices.• Performance.
• Compliance with all applicable laws, rules and standards.
Customers • GCE roadshows.• Customer satisfaction feedback
and reports.• Fact sheets, pamphlets and
newsletters.
• Servicedelivery.• Innovation.• Leadership.• Reliability.• Safety.
• Improved customer service.• Efficiencyandproductivityimprovements.• Capitalinvestmenttocreatecapacity
ahead of demand.• SHEQ.
Suppliers • Transnet Acquisition Council.• BEEforums.• Publications and site visits.• Stakeholder engagement
meetings.
• Governance.• Transparency.
Long-term growth opportunities created by: • Supplier development programmes.• Governance and ethical conduct,
reputation and contract management.• Appointment of a procurement
ombudsman.
Employees and labour unions
• Strategic leadership forum.• Internet/Intranet.• Memoranda from the GCE.• Culture Charter champions.
• Dignityandrespect.• Safety.• Training.• Remuneration.• Culture.
Assurance of: • Sound governance, reputation, ethical
transformation and management.• Culture Charter scoring process and
related initiatives.• Transnet wellness programmes.• Safety programmes.
the public, financiers and media
• Press conferences.• One-on-one interviews.• Roadshows, media breakfasts.• Corporate identity manual.
• Company’sabilitytodeliver on its commitments as set out in its Quantum Leap strategy.
• Affordabilityofcapitalinvestment plans.
• Improveservicedelivery.• Impactofcapital
investment plans on Transnet’s financial position and credit rating.
• Launch of public advertising campaign.• Private sector engagement.• Investor updates and presentations.• Market feedback.
Communities • Partnerships, awareness campaigns.
• Corporate Social Investment initiatives.
• Environment.• Pensioners.• Effectivemanagement.
• Demonstrating principles of accountability and care.
• Caring for pensioners through ex gratia (voluntary) payments and potential enhanced benefits.
• Aim to be an exemplar Company in terms of environmental compliance.
Transnet SOC Ltd Sustainable Development Report 201114
Governance systems that drive accountability
15
Transnet SOC Ltd Sustainable Development Report 201116
Transnet has, as its sole Shareholder, the Government of the Republic of South Africa, with the Shareholder Representative being the Minister of Public Enterprises. As a public entity, Transnet is subject to the provisions of the Public Finance Management Act No 1 of 1999 (PFMA). The PFMA requirestheTransnetBoardtoactwithfidelity,honesty, integrity and in the best interests of the Company in managing its financial affairs.
Leadership and Board structures Transnet’sBoardholdsultimateresponsibilityforensuring sustainable and successful continuation of the Company’s business activities by providing overall strategic direction.
TheBoardcurrentlycomprises16Directors,ofwhich14areNon-ExecutiveDirectors.Withtheexception of three Directors retained for continuity, all the Non-Executive Directors (including the new Chairman) were appointed by the Shareholder Representative on 13 December 2010. The Non-Executive Directors contribute a variety of skills, independent judgement and experience on various issues, including strategy, performance and general leadership, whilst the Executive Directors provide an operational understanding of the Company.
MrBrianMolefewasappointedasGroupChiefExecutive on 17 February 2011 and announced the composition of his Executive Committee on 16 March 2011. Mr Molefe had the following comment after he announced his new team:
“It is my belief that the reconfigured Executive Committee will contribute significantly to ensuring that the Company plays a key role in making South Africa’s New Growth Path a reality, and that Transnet plays its rightful role as custodian of South Africa’s rail, ports and pipeline infrastructure.”
TheBoardhassixcommitteestoassistitincarrying out its role and responsibilities, all of which govern various aspects of sustainability: • CorporateGovernanceandNominations
Committee;• BoardAuditCommittee;• RemunerationCommittee;• BoardRiskCommittee;• BoardSocialandEthicsCommittee,with
oversight of health, safety, and environmental issues(established25January2011);and
• BoardAcquisitionsandDisposalsCommittee,with oversight of procurement, supplier development, and public-private partnerships (established25January2011).
Conflicts of interestGoverned by the Companies Act, 2008, a Transnet Director may not use their position, privileges or access to confidential information for personal gain, or to improperly benefit another person.
‘Declarations of Interest’ and ‘Related Party Disclosures’bytheBoardarerecordedinformalregisters held by the Group Company Secretary.
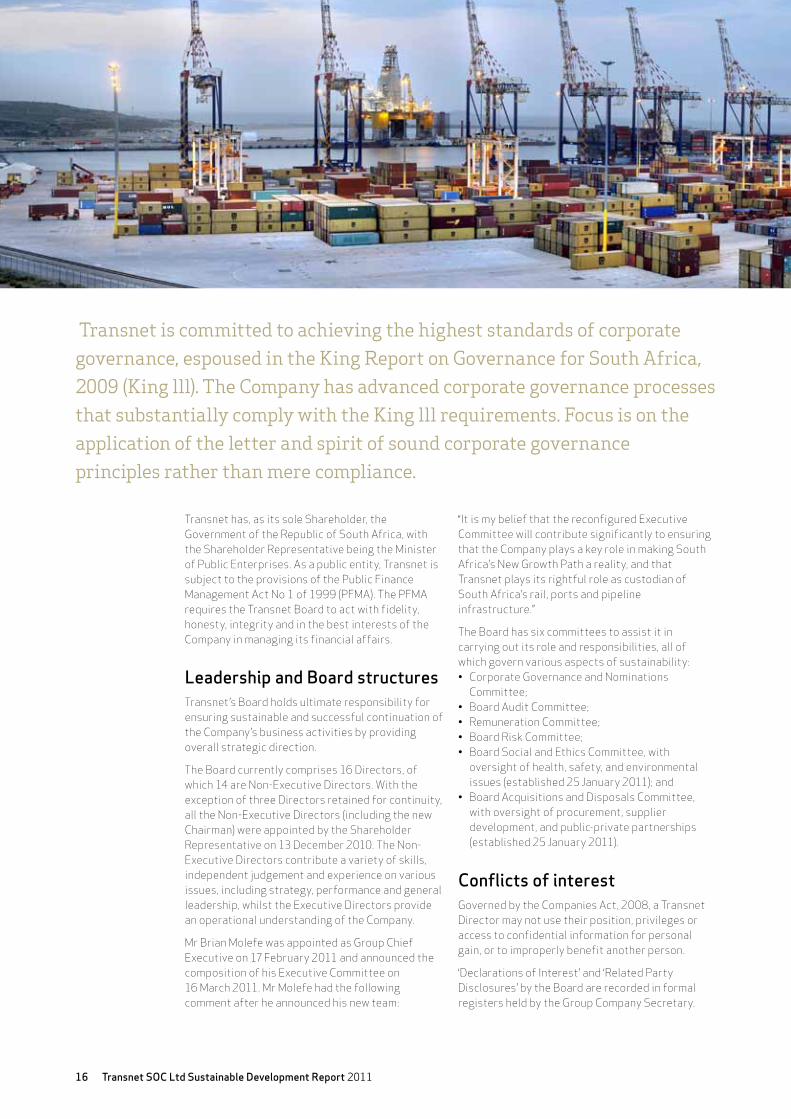
Transnet is committed to achieving the highest standards of corporate governance, espoused in the King Report on Governance for South Africa, 2009 (King lll). The Company has advanced corporate governance processes that substantially comply with the King lll requirements. Focus is on the application of the letter and spirit of sound corporate governance principles rather than mere compliance.
17
IninstanceswhereaBoardmemberhasanyprivatebusiness interests related to a Transnet proceeding, they are required to excuse themselves from the meeting, unless the interest is deemed immaterial bytheBoard.
In addition, all employees are required to sign a ‘Confidentiality and Declaration of Interest’ form when involved in establishing procurement contracts.
Fraud and anti-corruptionTransnet’s Fraud Risk Management Plan, effective from 2008, is focused on the prevention, investigation and corrective action of fraud, corruption and theft incidents.
Ongoing awareness campaigns around the Tip-Offs AnonymousHotlineformsanintegralpartoftheCompany’s anti-fraud and anti-corruption efforts. The relationship between the Tip-Offs Anonymous HotlineandFraudRiskManagementinitiativesis
symbiotic, in that fraud risk management initiatives can directly influence or be influenced by the Tip-OffsAnonymousHotline.
All cases reported on the Tip-Offs Anonymous Hotline,orbyothermeans,areinvestigatedbyTransnet Internal Audit (TIA), following a clear forensics process. Investigations relating to the TransnetBoardmembers,theGroupChiefExecutive,ChiefFinancialOfficer,HeadofInternalAudit and the Group Forensic Manager are conducted. A founded allegation can result in a number of outcomes namely a disciplinary, criminal or civil process.
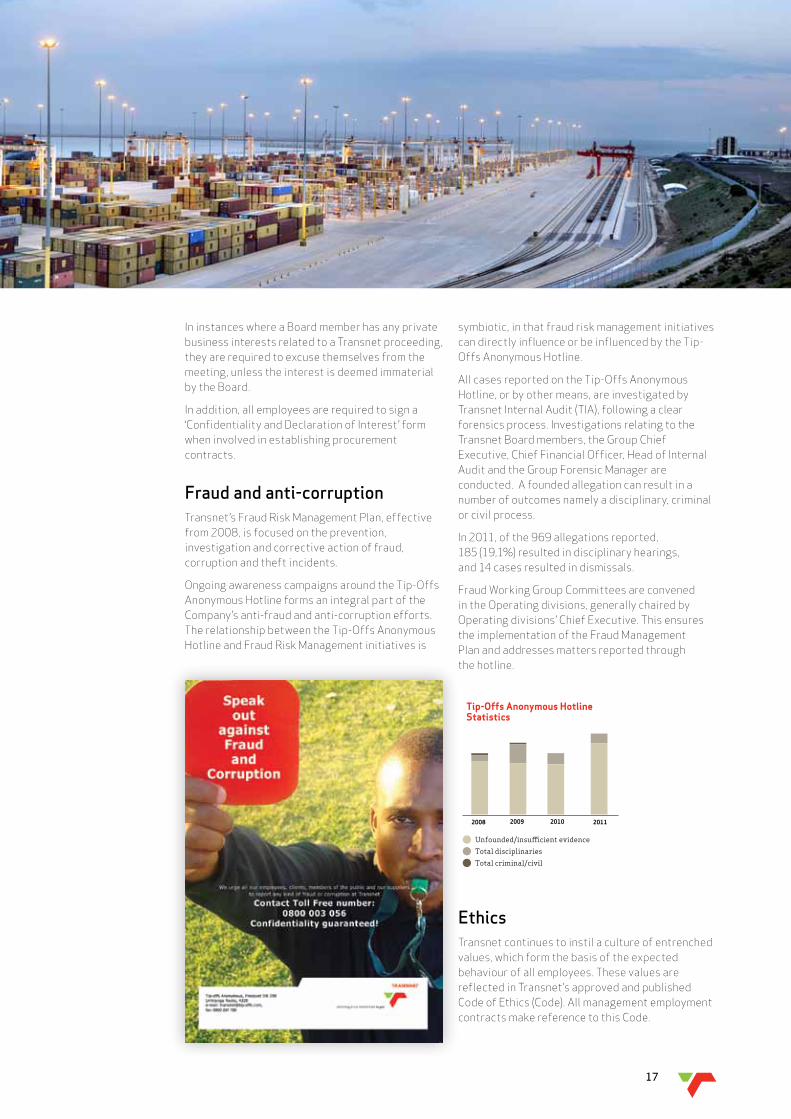
In 2011, of the 969 allegations reported, 185 (19,1%) resulted in disciplinary hearings, and 14 cases resulted in dismissals.
FraudWorkingGroupCommitteesareconvened in the Operating divisions, generally chaired by Operating divisions’ Chief Executive. This ensures the implementation of the Fraud Management Plan and addresses matters reported through the hotline.
2011201020092008
Tip-Offs Anonymous Hotline Statistics
Unfounded/insu�cient evidence
Total disciplinaries
Total criminal/civil
EthicsTransnet continues to instil a culture of entrenched values, which form the basis of the expected behaviour of all employees. These values are reflected in Transnet’s approved and published Code of Ethics (Code). All management employment contracts make reference to this Code.
Transnet SOC Ltd Sustainable Development Report 201118
The Code is reviewed annually and commits the Company’s Directors and employees to the highest standards of behaviour when engaging with both internal and external stakeholders. The Code applies to all Transnet employees, service providers, suppliers and trade partners. In instances where an employee breaches the Code, the necessary disciplinary action is instituted in terms of Transnet’s Disciplinary Code and Procedure.
Adherence to international standards and guidelines
In addition to applicable regulatory requirements, Transnet subscribes to the following non-binding rules, codes and standards:• TheUnitedNationsGlobalCompact;• ISO31000RiskManagementStandard;and• TheKingIIIReportonGovernancefor
South Africa.
Compliance and regulatory environmentCompliance is a standing item on the agenda of all Boardmeetings,inwhichtheBoardreviewscompliance reports. Compliance is managed by the Compliancefunction,whichsupportstheBoardandthe overall business in implementing and adhering to legislative requirements in accordance with a clear risk prioritisation methodology. This partnership ensures that legislation and associated compliance risks are properly managed.
Compliance initiatives are driven and monitored at both the Corporate Centre, where they are applied across the Company, and at Operating division levels.
Due to the ongoing and emerging complexity of Transnet’s legislative environment, the Compliance function publishes an annual ‘Regulatory Universe’, a document outlining all current legislation relevant to Transnet.
It also engages with Government to minimise significant impacts of new legislation on the business in accordance with the Transnet Engagement Protocol.
In an assessment conducted in 2011, the Compliance function was rated as having a high maturity level in the Company.
A significant compliance challenge in 2011 was the directive issued by the Department of Environmental Affairs (DEA) regarding pollution atTransnet’sPortofPortElizabeth(referto‘Environmental Compliance and Climate Change’).
Risk management TheBoardisultimatelyresponsibleforriskmanagement.TheBoardissupportedinthisrolebythe Group Risk Committee, as well as by Operating divisions’ Risk Management Committees, chaired by the Chief Executive of each Operating division.
TransnethasawellestablishedBoardRiskCommittee. The Enterprise Risk Framework is not only in line with industry best practice but also with King III and the global leading practice, ISO 31000:2009 risk management standard.
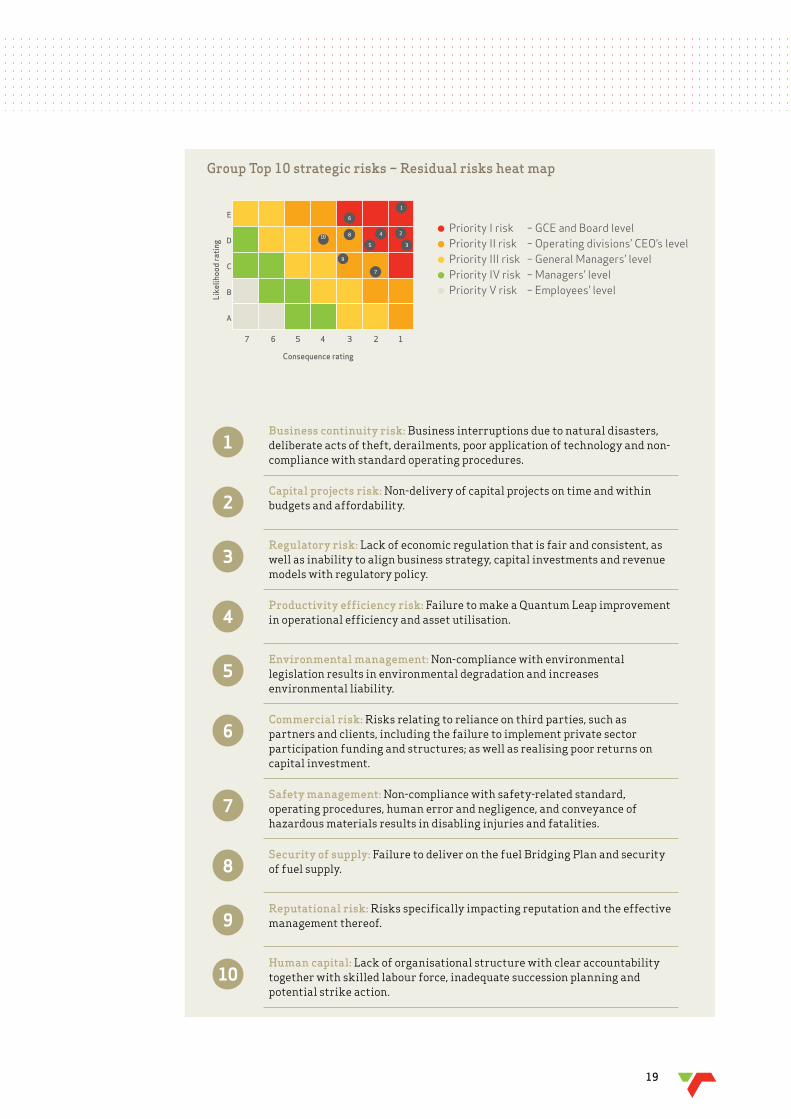
Transnet’s Top 10 risks are updated on a regular basis so that timely and appropriate mitigating plans are put in place as new risks emerge. As illustrated, these Top 10 risks are intrinsically linked to sustainability issues, as they are core to Transnet’s ability to deliver services and create value for South African society.
SHEQ management Governance of safety, health, environment and quality risks remains a key focus area for Transnet. Performance is measured against industry recognised indicators, which are built into management systems implemented across the Company.
Refer to the section on ‘Safety, skills and culture of delivery’ for more detail on safety and health management, as well as the section on ‘Environmental compliance and climate change’ for details on environmental risk management.
19
1Business continuity risk: Business interruptions due to natural disasters, deliberate acts of theft, derailments, poor application of technology and non-compliance with standard operating procedures.
2Capital projects risk: Non-delivery of capital projects on time and within budgets and affordability.
3Regulatory risk: Lack of economic regulation that is fair and consistent, as well as inability to align business strategy, capital investments and revenue models with regulatory policy.
4Productivity efficiency risk: Failure to make a Quantum Leap improvement in operational efficiency and asset utilisation.
5Environmental management: Non-compliance with environmental legislation results in environmental degradation and increases environmental liability.
6Commercial risk: Risks relating to reliance on third parties, such as partners and clients, including the failure to implement private sector participation funding and structures; as well as realising poor returns on capital investment.
7Safety management: Non-compliance with safety-related standard, operating procedures, human error and negligence, and conveyance of hazardous materials results in disabling injuries and fatalities.
8Security of supply: Failure to deliver on the fuel Bridging Plan and security of fuel supply.
9Reputational risk: Risks specifically impacting reputation and the effective management thereof.
10Human capital: Lack of organisational structure with clear accountability together with skilled labour force, inadequate succession planning and potential strike action.
group top 10 strategic risks – Residual risks heat map
Priority I risk – GCE and Board level Priority II risk – Operating divisions’ CEO’s level Priority III risk – General Managers’ level Priority IV risk – Managers’ level Priority V risk – Employees’ level
Like
lihoo
d ra
ting
Consequence rating
E
D
C
B
A
7 6 5 4 3 2 1
1
2
3
4
5
6
810
9
7
Transnet SOC Ltd Sustainable Development Report 201120
21
Safety, skills and a culture of delivery
Transnet SOC Ltd Sustainable Development Report 201122
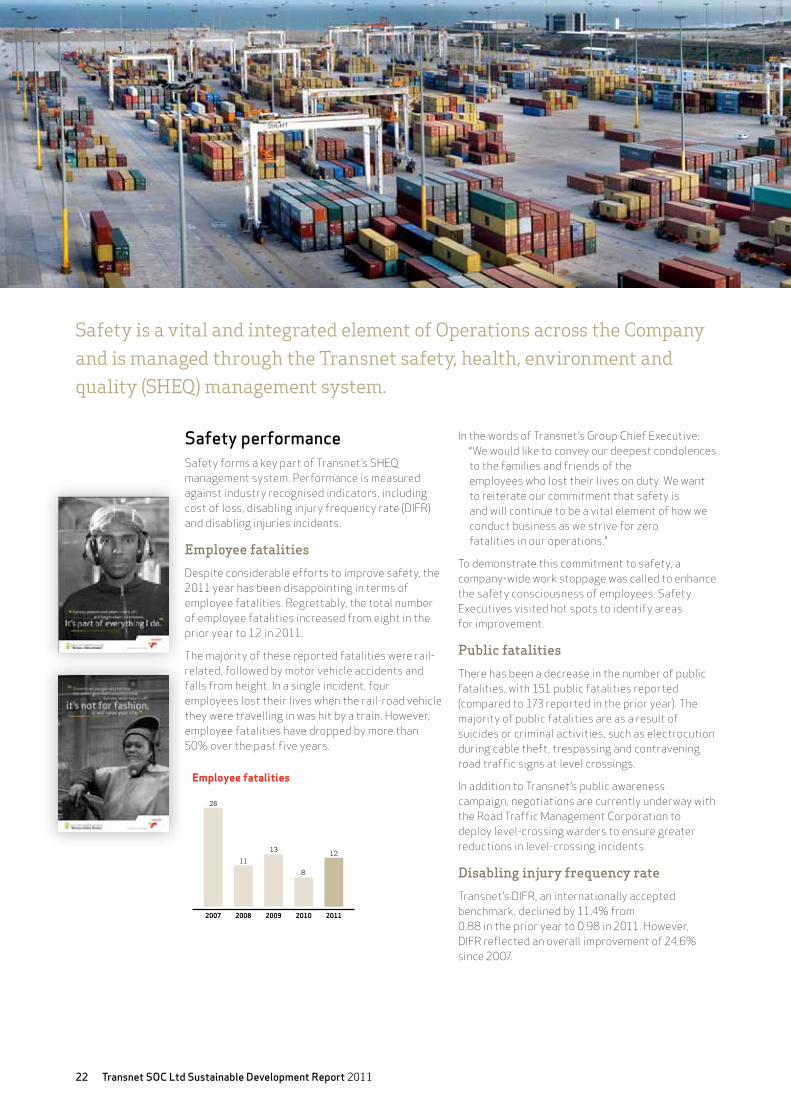
Safety is a vital and integrated element of Operations across the Company and is managed through the Transnet safety, health, environment and quality (SHEQ) management system.
Safety performance SafetyformsakeypartofTransnet’sSHEQmanagement system. Performance is measured against industry recognised indicators, including cost of loss, disabling injury frequency rate (DIFR) and disabling injuries incidents.
Employee fatalities
Despite considerable efforts to improve safety, the 2011 year has been disappointing in terms of employee fatalities. Regrettably, the total number of employee fatalities increased from eight in the prior year to 12 in 2011.
The majority of these reported fatalities were rail-related, followed by motor vehicle accidents and falls from height. In a single incident, four employees lost their lives when the rail-road vehicle theyweretravellinginwashitbyatrain.However,employee fatalities have dropped by more than 50% over the past five years.
2011201020092008
26
11
13
8
12
2007
Employee fatalities
In the words of Transnet’s Group Chief Executive: “Wewouldliketoconveyourdeepestcondolencesto the families and friends of the employeeswholosttheirlivesonduty.Wewantto reiterate our commitment that safety is and will continue to be a vital element of how we conductbusinessaswestriveforzerofatalities in our operations.”
To demonstrate this commitment to safety, a company-wide work stoppage was called to enhance the safety consciousness of employees. Safety Executives visited hot spots to identify areas for improvement.
Public fatalities
There has been a decrease in the number of public fatalities, with 151 public fatalities reported (compared to 173 reported in the prior year). The majority of public fatalities are as a result of suicides or criminal activities, such as electrocution during cable theft, trespassing and contravening road traffic signs at level crossings.
In addition to Transnet’s public awareness campaign, negotiations are currently underway with the Road Traffic Management Corporation to deploy level-crossing warders to ensure greater reductions in level-crossing incidents.
Disabling injury frequency rate
Transnet’s DIFR, an internationally accepted benchmark, declined by 11,4% from 0,88intheprioryearto0,98in2011.However, DIFR reflected an overall improvement of 24,6% since 2007.

23
transnet’s Seven golden Safety Actions
I will not perform unsafe work and put myself and others in danger.
I always prepare, check and report unsafe acts and conditions.
I take responsibility for myself and my team, and I don’t blame others.
I know the standard operating procedures and safety rules, follow them and don’t take shortcuts.
No matter what my level, I contribute to improving safety.
I rest well and work safely.
If I don’t understand and if I have a problem, I speak up and say so.
There has been an increase in reported noise-inducedhearingloss(NIHL)casesduringtheyear,whichhadanadverseimpactontheDIFR.Workenvironments are assessed continually to reduce sources of noise to below 85 decibels (db). The Company will continue to perform noise surveys, reengineer equipment where possible, facilitate medical check-ups, and issue superior hearing protective equipment to those exposed. The CompanywillcontinuetostriveforzeroNIHLwithregular safety campaigns.
Promoting a safety culture
Although employees repeatedly scored high for the behaviour “Safety Mindset” in Transnet’s annual culture scoring process, this is not reflected in the related safety statistics. Consequently, Transnet runs a Safety Culture Programme, built around “Golden Safety Actions” that set the benchmark for safe behaviour.
Safety Culture Programme initiatives
• SevenGoldenSafetyActions:Abenchmarkforsafe ways of working, communicated to employees and management across all levels of the Company, via competitions, events, comics and media.
• GoldenSafetyLeague:Abehaviourchangeprogramme aimed at improving the culture of safety in daily operations, has been implemented at 12 hot spots, where teams are awarded points for improvements on specific safety measures on a monthly and annual basis.
• Leadership:Leadershipandlabourrepresentatives are engaged on their role in supporting a safety culture.
Through the Safety Culture Programme, opportunities are identified to further support the implementation of standard operating procedures (SOPs), provide training for key work functions and improve recruitment processes.
Transnet SOC Ltd Sustainable Development Report 201124
Human capital managementTransnet’s employees are crucial assets in driving the achievement of the Company’s strategic goals. TheHumanResources(HR)strategyhasbeenupdated to support these objectives, with a particular focus on sourcing and developing core skills, creating a productive working environment, and driving performance.
Working environment performance
training
Jobdesignforcareergrowth.
Rewards and incentives.
Recruitment and retention
Fair and legally compliant. Consequence management.
Succession pools
Engaged teams.Culture of safety and performance.Good labour relations.
Inspirational leadership.
Human capital management project
Following the completion of a detailed analysis of human resource management within each Operating division,TransnetembarkedonaphasedHumanCapitalManagement(HCM)projecttostandardiseandconsolidateHRoperationsacrosstheCompany.This significant restructuring will further enable thesuccessfulimplementationoftheHRstrategy.• Phase 1: Payroll, performance and administration
(implementation completed in all Operating divisions, within timelines and budget).
• Phase 2: Talent management and recruitment (implementation completed).
Human resources excellence project
ParalleltotheHCMproject,theCompanyinitiatedtheHumanResourcesExcellence(HRE)project,focusing on the development of a new Group-wide HRoperatingmodel.Thenewmodelwillconsistofthe following centres:• HRBusinessPartners;• CentresofExcellence;anda• SharedServicesCentre.
The ‘design phase’ of the project has been completed and includes the following:• BusinesscaseforimplementinganewHR
operating model; and• Designof:
– business processes and standard operating procedures;
– organisational structure;
– transition strategy;– training, communication and change
management;– facility and supporting technology; and– service management framework (governance
structures, service level agreements customer contact management).
Performance and reward
Transnet is committed to fair remuneration practices that support the business objectives, employee development and retention of critical skills. Reward strategies are integrated with all key performance indicators, thus entrenching a performance driven culture.
Employee profile
Transnet’s total workforce of 49 078 comprises 47 763 permanent employees and 1 315 fixed term employees. In addition, the Company’s permanent workforce is made up of 4 521 employees who form part of the management category (9,5%) and 43 242 employees who form part of the bargaining unit (90,5%).
Employee turnover
Transnet’s net employment rates for 2011 improved compared to the prior year with the number of management employees increasing by 6,5%, and the number of bargaining unit employees increasing by 4,7%.
The current average age of a Transnet employee is 43 years. Thus, the overarching picture for the Company is that of an ageing workforce, with a significant proportion of the Company’s employees falling in the 43 to 60 years age bracket. The chart below indicates the proportion of employees per race and age category in Transnet.
Employee relations
Transnet’s workforce reflects a high level of unionisation, with 79% of the workforce forming part of the bargaining unit, primarily represented by recognised labour unions. These include the United Transport and Allied Trade Union (UTATU) andtheSouthAfricanTransportandAlliedWorkersUnion(SATAWU).
Maintaining sound relations with the trade unions remains a key priority for the Company, as labour co-operation is essential to Transnet’s ability to roll out the Quantum Leap strategy.
Although the 2010 industrial strike action strained the relationship with key union leaders, this is improving with targeted attention.
25
Employment equity and diversity management (%)
Male 80%
Female 20%
Employment equity and diversity management (%)
Black 62%
Coloured 10%
Indian 4%
White 24%
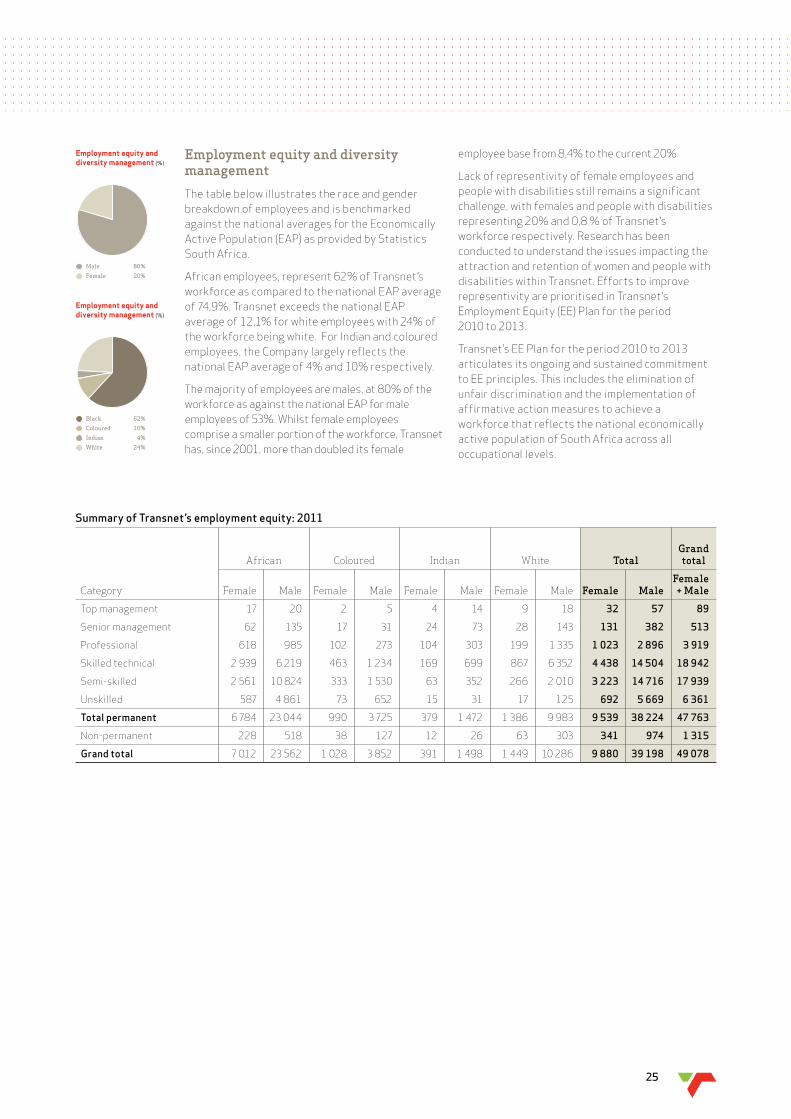
Summary of Transnet’s employment equity: 2011
African Coloured Indian White totalgrandtotal
Category Female Male Female Male Female Male Female Male Female maleFemale + male
Top management 17 20 2 5 4 14 9 18 32 57 89 Senior management 62 135 17 31 24 73 28 143 131 382 513 Professional 618 985 102 273 104 303 199 1 335 1 023 2 896 3 919 Skilled technical 2 939 6 219 463 1 234 169 699 867 6 352 4 438 14 504 18 942 Semi-skilled 2 561 10 824 333 1 530 63 352 266 2 010 3 223 14 716 17 939 Unskilled 587 4 861 73 652 15 31 17 125 692 5 669 6 361 Total permanent 6 784 23 044 990 3 725 379 1 472 1 386 9 983 9 539 38 224 47 763 Non-permanent 228 518 38 127 12 26 63 303 341 974 1 315 Grand total 7 012 23 562 1 028 3 852 391 1 498 1 449 10 286 9 880 39 198 49 078
Employment equity and diversity management
The table below illustrates the race and gender breakdown of employees and is benchmarked against the national averages for the Economically Active Population (EAP) as provided by Statistics South Africa.
African employees, represent 62% of Transnet’s workforce as compared to the national EAP average of 74,9%. Transnet exceeds the national EAP average of 12,1% for white employees with 24% of the workforce being white. For Indian and coloured employees, the Company largely reflects the national EAP average of 4% and 10% respectively.
The majority of employees are males, at 80% of the workforce as against the national EAP for male employeesof53%.Whilstfemaleemployeescomprise a smaller portion of the workforce, Transnet has, since 2001, more than doubled its female
employee base from 8,4% to the current 20%.
Lack of representivity of female employees and people with disabilities still remains a significant challenge, with females and people with disabilities representing 20% and 0,8 % of Transnet’s workforce respectively. Research has been conducted to understand the issues impacting the attraction and retention of women and people with disabilities within Transnet. Efforts to improve representivity are prioritised in Transnet’s Employment Equity (EE) Plan for the period 2010 to 2013.
Transnet’s EE Plan for the period 2010 to 2013 articulates its ongoing and sustained commitment to EE principles. This includes the elimination of unfair discrimination and the implementation of affirmative action measures to achieve a workforce that reflects the national economically active population of South Africa across all occupational levels.
Transnet SOC Ltd Sustainable Development Report 201126
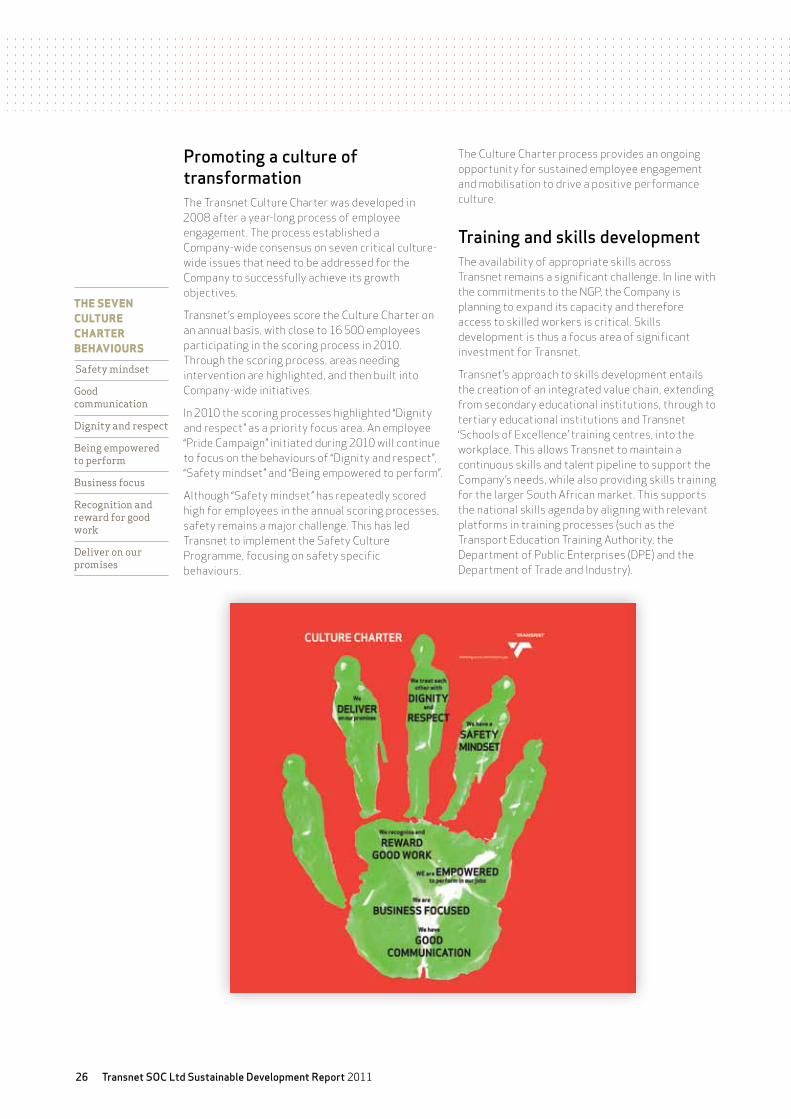
Promoting a culture of transformationThe Transnet Culture Charter was developed in 2008 after a year-long process of employee engagement. The process established a Company-wide consensus on seven critical culture-wide issues that need to be addressed for the Company to successfully achieve its growth objectives.
Transnet’s employees score the Culture Charter on an annual basis, with close to 16 500 employees participating in the scoring process in 2010. Through the scoring process, areas needing intervention are highlighted, and then built into Company-wide initiatives.
In 2010 the scoring processes highlighted “Dignity and respect” as a priority focus area. An employee “Pride Campaign” initiated during 2010 will continue to focus on the behaviours of “Dignity and respect”, “Safetymindset”and“Beingempoweredtoperform”.
Although “Safety mindset” has repeatedly scored high for employees in the annual scoring processes, safety remains a major challenge. This has led Transnet to implement the Safety Culture Programme, focusing on safety specific behaviours.
The Culture Charter process provides an ongoing opportunity for sustained employee engagement and mobilisation to drive a positive performance culture.
Training and skills developmentThe availability of appropriate skills across Transnet remains a significant challenge. In line with the commitments to the NGP, the Company is planning to expand its capacity and therefore access to skilled workers is critical. Skills development is thus a focus area of significant investment for Transnet.
Transnet’s approach to skills development entails the creation of an integrated value chain, extending from secondary educational institutions, through to tertiary educational institutions and Transnet ‘Schools of Excellence’ training centres, into the workplace. This allows Transnet to maintain a continuous skills and talent pipeline to support the Company’s needs, while also providing skills training for the larger South African market. This supports the national skills agenda by aligning with relevant platforms in training processes (such as the Transport Education Training Authority, the Department of Public Enterprises (DPE) and the Department of Trade and Industry).
The seven culTure charTer behaviours
Safety mindset
Good communication
Dignity and respect
Being empowered to perform
Business focus
Recognition and reward for good work
Deliver on our promises
27
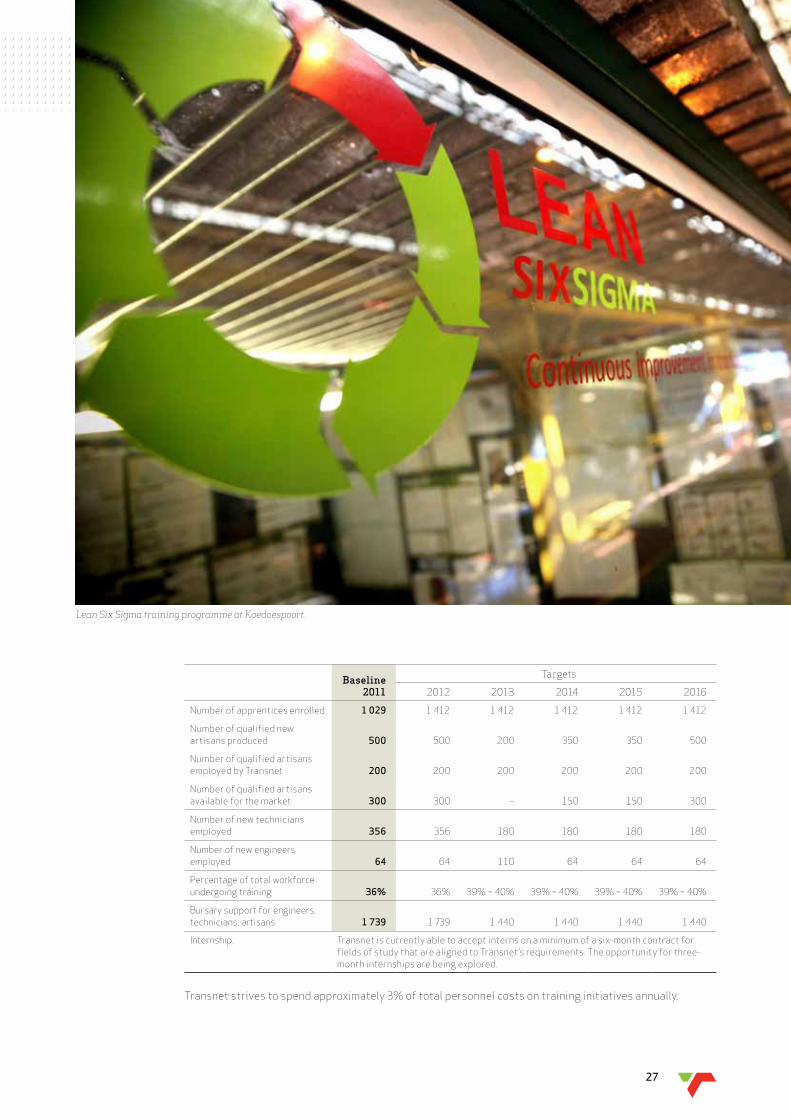
Baseline 2011
Targets
2012 2013 2014 2015 2016
Number of apprentices enrolled 1 029 1 412 1 412 1 412 1 412 1 412
Number of qualified new artisans produced 500 500 200 350 350 500
Number of qualified artisans employed by Transnet 200 200 200 200 200 200
Number of qualified artisans available for the market 300 300 – 150 150 300
Number of new technicians employed 356 356 180 180 180 180
Number of new engineers employed 64 64 110 64 64 64
Percentage of total workforce undergoing training 36% 36% 39% – 40% 39% – 40% 39% – 40% 39% – 40%
Bursarysupportforengineers,technicians, artisans 1 739 1 739 1 440 1 440 1 440 1 440
Internship. Transnet is currently able to accept interns on a minimum of a six-month contract for fields of study that are aligned to Transnet’s requirements. The opportunity for three- month internships are being explored.
Transnet strives to spend approximately 3% of total personnel costs on training initiatives annually.
Lean Six Sigma training programme at Koedoespoort.
Transnet SOC Ltd Sustainable Development Report 201128
transnet training centres upgrade
Additional opportunities for accelerated skills development include the upgrading of training centres to enable a larger intake, and increasing the number of apprentices. Investigations into additional funding for these initiatives are currently underway.
talent management and leadership
In a nation-wide climate of intense competition for skills, Transnet’s ability to attract, manage and retain talent is crucial. The Talent Management Initiative, which manages this key area, reported the following for 2011:• Talentmanagementtrainingwasimplementedfor
managers at various organisational levels to ensure that employee talent is properly nurtured.
• EffortstotrackindividualtalentthroughTalentForums were intensified, with resultant talent pools aligning with the Company’s succession requirements.
Transnet’s Leadership Development Programme is focused on building the supervisory, management and leadership competence in Transnet. The programme includes two sub-programmes: • TheNavigatorLeadershipProgrammefocuseson
building the leadership capacities of managers. The programme celebrated the graduation of 2 400 managers during the year.
• TheExecutiveLeadershipProgramme(aspartofan international leadership programme) enrolled six ‘Stars’ at Extended Executive Committee level for 2011 and plans to increase this number to 20 in the year ahead.
Throughputs on leadership development at senior and middle management levels remain low due to a
range of operational challenges. Transnet is now developing more customised leadership programmes and is reviewing the specific needs of leadership development.
navigator feedback
“I have learned that by all working together we can make a strong winning team.”
“My personal and ultimate outcome of this journey will be my continued efforts to apply the skills and the tools in my daily life and work.”
“Thank you for this knowledge you brought to us, we will remember everything in future.
“I have benefited from all the modules and I am definitely sure that I will be an effective manager and great leader.”
“I will not tackle any task without planning, listening or ensuring all roleplayers are properly informed.”
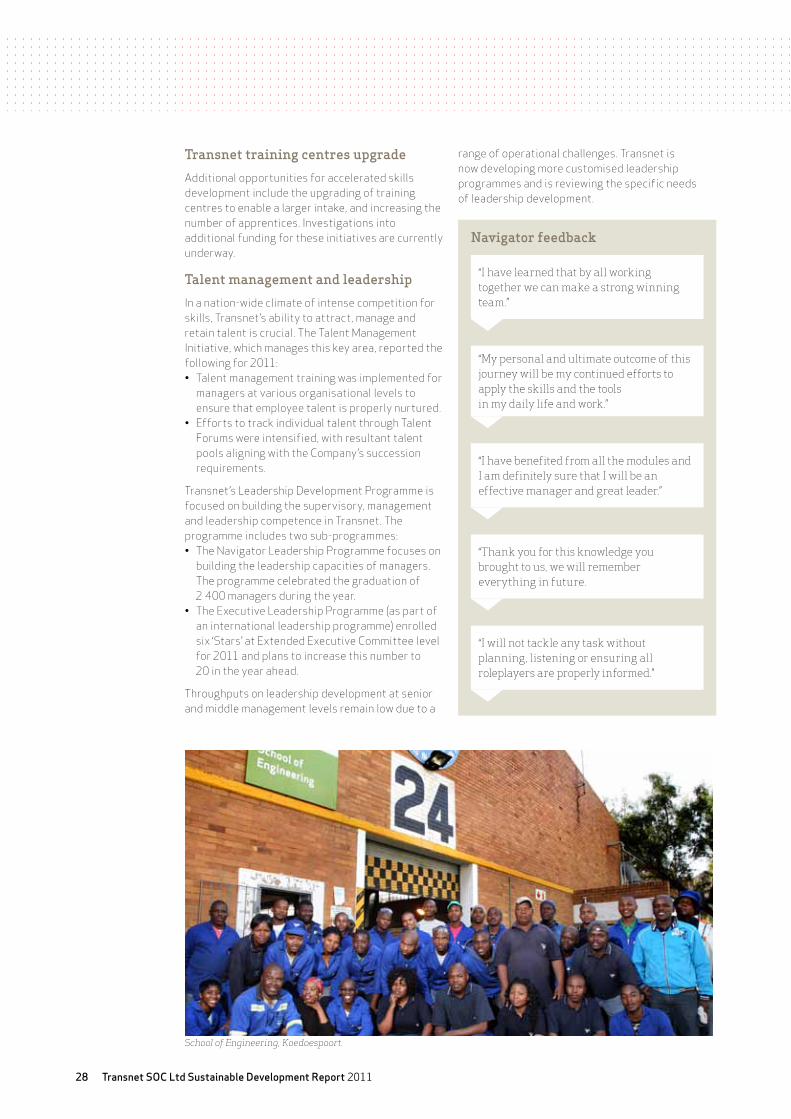
School of Engineering, Koedoespoort.
29
Employee wellnessTransnet regards employee wellness initiatives as key business tools for engaging and optimising the safety and effectiveness of its employees. Byfocusingonpreventativeandsupportiveapproaches to all aspects of employee wellness, the Company aims to reduce risk to the Company and to maximise employee and organisational performance.
Absenteeism management
The direct absenteeism payroll cost increased by R38,5 million (27,5%) in 2011. This increase may be partly attributed to the annual salary increases across different job levels, which leads to a higher absenteeismcostperperson.However,comparedto 2010, there has been a decrease of 25,4% in the number of days lost due to absenteeism during 2011.
Transnet’s employee wellness model consists of the following core programmes: • Absenteeismmanagement;• TheEmployeeAssistanceProgramme;and• HIVandAidsmanagement.
In 2010, absenteeism management forums were successfully introduced across all Transnet Operating divisions. This will support healthier containment of absenteeism and provide access to appropriate and relevant wellness interventions.
Employee Assistance Programme
Transnet’s Employee Assistance Programme (EAP) has been implemented as part of the Company’s commitment towards creating a safe, healthy and productive working environment. The programme focuses on raising employee awareness of various health risks, and supports them in taking responsible action for managing these.
The EAP focuses mainly on psycho-social risks. Three pertinent areas of concern emerged in the year, namely trauma, financial difficulties and couple/family difficulties. Strategies to address the above psycho-social risks through customised services will be implemented in 2012.
Utilisation rates of these programmes also remains a challenge. Plans to increase utilisation rates include:• Assertivemarketingdrives;• Customisedprogrammesforspecificemployee
groups; and• Needsanalysissurveysandfocusgroup
discussions.
During 2011, Transnet focused on employee health by conducting 159 wellness events across the Operating divisions. Altogether 10 663 employees attended, constituting 20% of the Transnet workforce. The following general profile, in terms of health and wellness risks, was identified. The percentages indicate the portion of employees considered to be at risk:• Hypertension:39%.• Cholesterol:32%.• Glucose/hyperglycaemia:28%.• Obesity:76%.
In response, Transnet has initiated various interventions to support improved employee health and wellness.
HIV/Aids Disease management Programme
The number of registrations for the Transmed HIV/AidsProgrammeandtheCompany-sponsoredHIVandAidsDiseaseManagementProgrammehasstabilised at 1 311 enrolments.
EncouragingenrolmentontotheHIVandAidsDisease Management Programme once employees have tested positive, remains a challenge. Transnet’s focus in 2011 will be to continue its integratedapproachtoHIV/AidsTestingandCounselling(HCT),andincorporatingHCTintoanoverall wellness and health testing package. This package incorporates other general health related testing, such as glucose and cholesterol, at wellness events.
ThetotalexpenditureonHIV/Aidsmanagementfor2011 was R2,2 million. This constitutes an 83% increase in Transnet’s spend, which is mainly due to improvedaccesstoHCT.
Transnet SOC Ltd Sustainable Development Report 201130
Efficiency, security and reliability
31
Transnet SOC Ltd Sustainable Development Report 201132
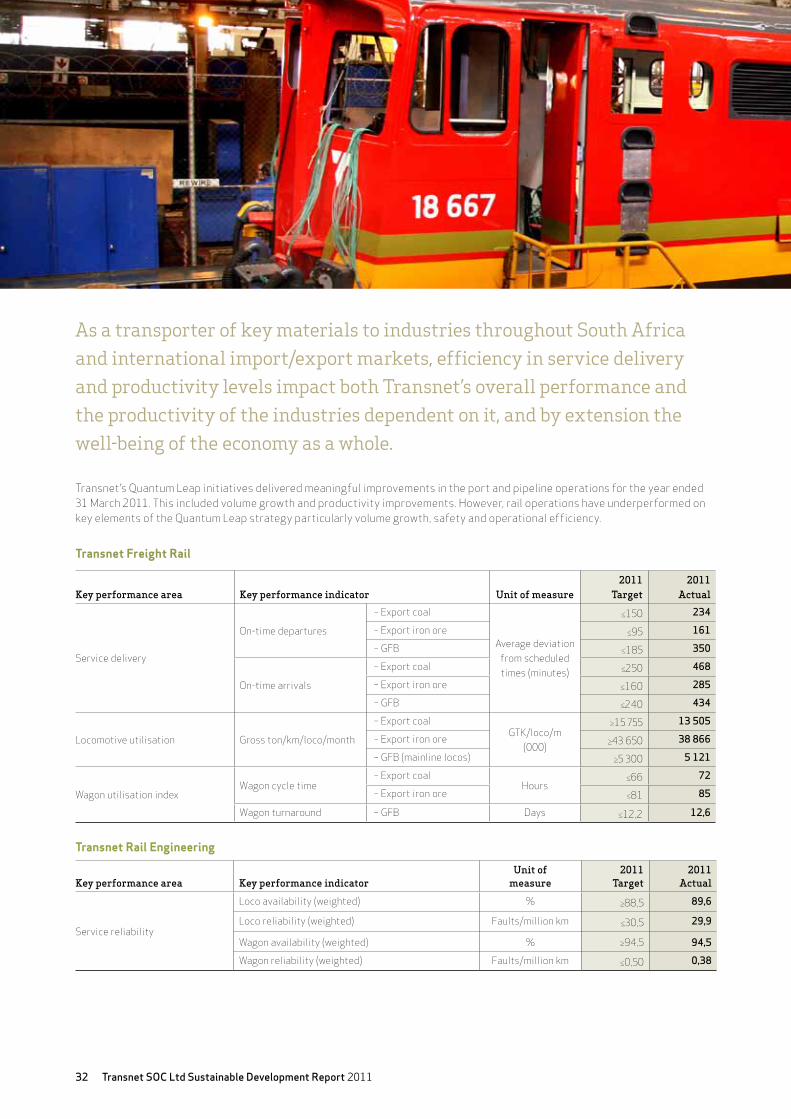
As a transporter of key materials to industries throughout South Africa and international import/export markets, efficiency in service delivery and productivity levels impact both Transnet’s overall performance and the productivity of the industries dependent on it, and by extension the well-being of the economy as a whole.
Transnet’s Quantum Leap initiatives delivered meaningful improvements in the port and pipeline operations for the year ended 31March2011.Thisincludedvolumegrowthandproductivityimprovements.However,railoperationshaveunderperformedonkey elements of the Quantum Leap strategy particularly volume growth, safety and operational efficiency.
Transnet freight rail
Key performance area Key performance indicator unit of measure2011
target2011
Actual
Service delivery
On-time departures
– Export coal
Average deviation from scheduled times (minutes)
≤150 234 – Export iron ore ≤95 161–GFB ≤185 350
On-time arrivals
– Export coal ≤250 468 – Export iron ore ≤160 285–GFB ≤240 434
Locomotive utilisation Gross ton/km/loco/month
– Export coalGTK/loco/m
(000)
≥15 755 13 505 – Export iron ore ≥43 650 38 866–GFB(mainlinelocos) ≥5 300 5 121
WagonutilisationindexWagoncycletime
– Export coalHours
≤66 72 – Export iron ore ≤81 85
Wagonturnaround –GFB Days ≤12,2 12,6
Transnet rail Engineering
Key performance area Key performance indicatorunit of
measure2011
target2011
Actual
Service reliability
Loco availability (weighted) % ≥88,5 89,6
Loco reliability (weighted) Faults/million km ≤30,5 29,9
Wagonavailability(weighted) % ≥94,5 94,5 Wagonreliability(weighted) Faults/million km ≤0,50 0,38
33
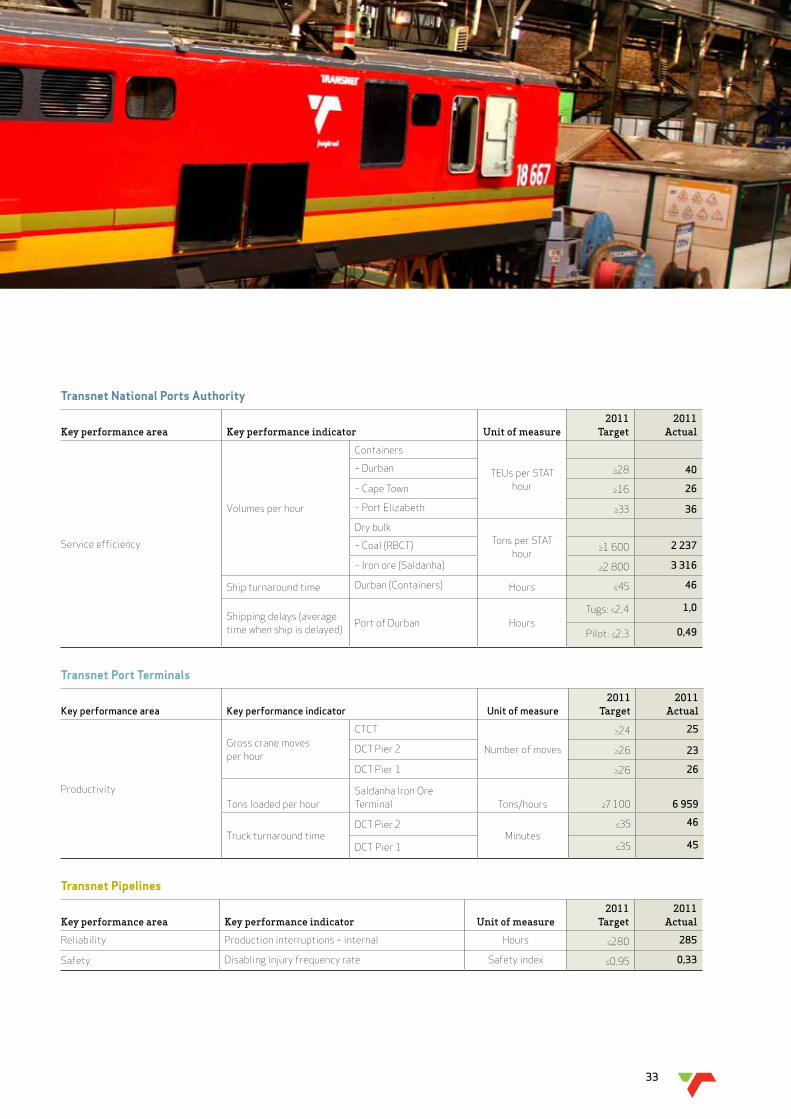
Transnet national ports Authority
Key performance area Key performance indicator unit of measure2011
target2011
Actual
Service efficiency
Volumesperhour
Containers
TEUs per STAT hour
– Durban ≥28 40
– Cape Town ≥16 26
–PortElizabeth ≥33 36Dry bulk
Tons per STAT hour
–Coal(RBCT) ≥1 600 2 237
– Iron ore (Saldanha) ≥2 800 3 316
Ship turnaround time Durban (Containers) Hours ≤45 46
Shipping delays (average time when ship is delayed)
Port of Durban HoursTugs: ≤2,4 1,0
Pilot: ≤2,3 0,49
Transnet port Terminals
Key performance area Key performance indicator Unit of measure2011
target2011
Actual
Productivity
Gross crane moves per hour
CTCT
Number of moves
≥24 25
DCT Pier 2 ≥26 23
DCT Pier 1 ≥26 26
Tons loaded per hourSaldanha Iron Ore Terminal Tons/hours ≥7 100 6 959
Truck turnaround timeDCT Pier 2
Minutes≤35 46
DCT Pier 1 ≤35 45
Transnet pipelines
Key performance area Key performance indicator unit of measure2011
target2011
Actual
Reliability Production interruptions – internal Hours ≤280 285
Safety Disabling injury frequency rate Safety index ≤0,95 0,33
Transnet SOC Ltd Sustainable Development Report 201134
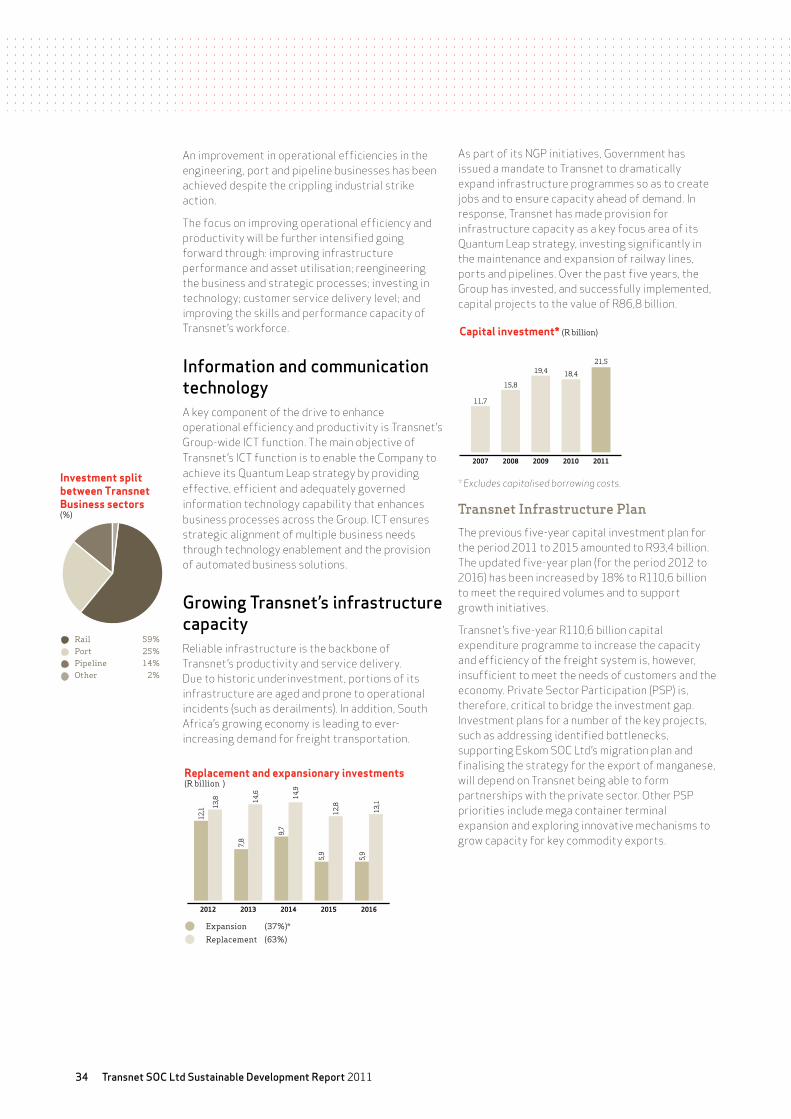
Investment split between Transnet Business sectors (%)
Rail 59%Port 25%Pipeline 14%Other 2%
An improvement in operational efficiencies in the engineering, port and pipeline businesses has been achieved despite the crippling industrial strike action.
The focus on improving operational efficiency and productivity will be further intensified going forward through: improving infrastructure performance and asset utilisation; reengineering the business and strategic processes; investing in technology; customer service delivery level; and improving the skills and performance capacity of Transnet’s workforce.
Information and communication technology A key component of the drive to enhance operational efficiency and productivity is Transnet’s Group-wide ICT function. The main objective of Transnet’s ICT function is to enable the Company to achieve its Quantum Leap strategy by providing effective, efficient and adequately governed information technology capability that enhances business processes across the Group. ICT ensures strategic alignment of multiple business needs through technology enablement and the provision of automated business solutions.
Growing Transnet’s infrastructure capacityReliable infrastructure is the backbone of Transnet’s productivity and service delivery. Due to historic underinvestment, portions of its infrastructure are aged and prone to operational incidents (such as derailments). In addition, South Africa’s growing economy is leading to ever-increasing demand for freight transportation.
Replacement and expansionary investments(R billion )
Expansion (37%)*
Replacement (63%)
20162015201420132012
12,1 13
,8
7,8
14,6
9,7
14,9
5,9
12,8
5,9
13,1
As part of its NGP initiatives, Government has issued a mandate to Transnet to dramatically expand infrastructure programmes so as to create jobs and to ensure capacity ahead of demand. In response, Transnet has made provision for infrastructure capacity as a key focus area of its Quantum Leap strategy, investing significantly in the maintenance and expansion of railway lines, ports and pipelines. Over the past five years, the Group has invested, and successfully implemented, capital projects to the value of R86,8 billion.
21,5
2011
18,4
2010
19,4
2009
15,8
2008
11,7
2007
Capital investment* (R billion)
* Excludes capitalised borrowing costs.
transnet Infrastructure Plan
The previous five-year capital investment plan for the period 2011 to 2015 amounted to R93,4 billion. The updated five-year plan (for the period 2012 to 2016) has been increased by 18% to R110,6 billion to meet the required volumes and to support growth initiatives.
Transnet’s five-year R110,6 billion capital expenditure programme to increase the capacity and efficiency of the freight system is, however, insufficient to meet the needs of customers and the economy. Private Sector Participation (PSP) is, therefore, critical to bridge the investment gap. Investment plans for a number of the key projects, such as addressing identified bottlenecks, supporting Eskom SOC Ltd’s migration plan and finalising the strategy for the export of manganese, will depend on Transnet being able to form partnerships with the private sector. Other PSP priorities include mega container terminal expansion and exploring innovative mechanisms to grow capacity for key commodity exports.
35
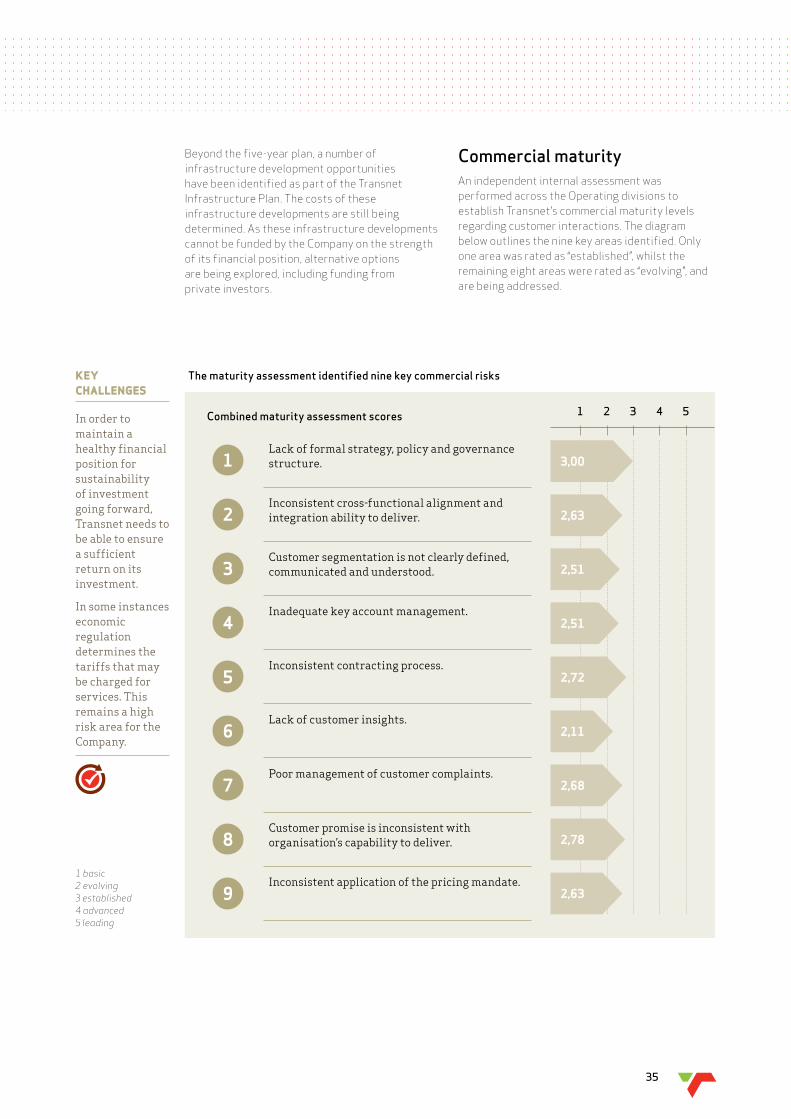
Combined maturity assessment scores
1Lack of formal strategy, policy and governance structure.
2Inconsistent cross-functional alignment and integration ability to deliver.
3Customer segmentation is not clearly defined, communicated and understood.
4Inadequate key account management.
5Inconsistent contracting process.
6Lack of customer insights.
7Poor management of customer complaints.
8Customer promise is inconsistent with organisation’s capability to deliver.
9Inconsistent application of the pricing mandate.
The maturity assessment identified nine key commercial risks
1 2 3 4 5
3,00
2,72
2,51
2,68
2,63
2,11
2,51
2,78
2,63
KeY challenGes
In order to maintain a healthy financial position for sustainability of investment going forward, Transnet needs to be able to ensure a sufficient return on its investment.
In some instances economic regulation determines the tariffs that may be charged for services. This remains a high risk area for the Company.
1 basic2 evolving3 established4 advanced5 leading
Beyondthefive-yearplan,anumberofinfrastructure development opportunities have been identified as part of the Transnet Infrastructure Plan. The costs of these infrastructure developments are still being determined. As these infrastructure developments cannot be funded by the Company on the strength of its financial position, alternative options are being explored, including funding from private investors.
Commercial maturityAn independent internal assessment was performed across the Operating divisions to establish Transnet’s commercial maturity levels regarding customer interactions. The diagram below outlines the nine key areas identified. Only one area was rated as “established”, whilst the remaining eight areas were rated as “evolving”, and are being addressed.
Transnet SOC Ltd Sustainable Development Report 201136
Security management Security is managed at Transnet to align resources and embed a strong security culture. Informed by its Integrated Security Strategy, Transnet’s security initiatives emphasise the protection of clients, employees, assets, income and infrastructure.
Key aspects of the security operations include:• Securityclusters:Provincialsecuritycentresare
co-ordinated by a corporate command centre. This allows co-ordinated security activities to be integrated throughout the business. Efforts and resources are aligned for swift action and resolution.
• Analysissoftware:Newlyacquiredsoftwareanalyses security incidents to pick up trends, profile crime syndicates and criminal groups. This informs more effective mitigation strategies.
• Outsourcedsecurity:Transnethasestablishedanapproved list of preferred service providers, based on stringent compliance and technical criteria. This process has been endorsed by several Government departments for its effectiveness, fairness and consistency. Operating divisions source-in and manage their own security services based on this list.
• BusinessAgainstCrimepartnerships:Crime,ranging from petty theft to international crime syndicates, is a growing problem in South Africa. Transnet builds relationships with key roleplayers through conferences, workshops and forums to
help reduce crime in South Africa and to combat the impacts of crime on operations. Collaborating roleplayers include: Eskom, Telkom, Passenger Rail Agency of South Africa (PRASA), South African Police Services (SAPS), and State Security Agency (SSA) amongst others.
Security incidents cost Transnet approximately R76 million in 2011. This represents a 26% increase in cost from the prior year, although the number of total incidents remained much the same. The increase in cost is largely due to the dramatic increase in replacing stolen copper cables.
Cable theftEscalating demand for copper in developing economies such as India and China, has caused the price of copper to rise astronomically. As a result, organised criminal syndicates have emerged to exploit lucrative illegal trade in copper.
In the past two years, Transnet has experienced a dramatic 40% increase in cable theft along its railway lines, amounting to 51% of all theft incidences in the Company, at a cost of R38 million in 2011. The high cost of replacing cables, damage to wagons and locomotives and disruptions in rail traffic has a detrimental effect on service delivery.
Transnet continues to address this challenge through crime prevention partnerships, security clusters and the proactive use of intelligence software.
Transnet industrial strike action
The 2011 wage negotiations came to a halt when Transnet management and labour were unable to find common ground. This stalemate led to a nation-wide industrial strike action by the unions at Transnet. Calm and passive demonstrations quickly escalated to incidents of intimidation, malicious damage to property and violence.
This alarming situation was evident in operational pockets throughout South Africa. Serious sabotage incidents in the KwaZulu-Natal province, where critical rail components were removed, resulted in the rail line becoming unstable. This, in turn, led to fully loaded trains – one carrying fuel – derailing in close proximity to residential areas.
Withimmediateactionrequired,Transnet’sExecutiveCommitteeestablishedanationalsecuritycommandcentre.Provincial clusters with representatives from all strategic departments were established in support. These efforts were complemented by support from various sections of the South African Police Services and the State Security Agency. Security management teams travelled to all hot spot areas and took direct control until the situation normalised. As a result, criminal exposures during the strike were handled swiftly and effectively.
The Security Cluster model has now been embedded in Transnet’s security operations. In addition, relations with union leaders, which were significantly strained during this period, are receiving targeted attention.

37
FIFA 2010 Soccer World Cup
Transnet’s2010FIFASoccerWorldCupSecurityPlanwasinitiated to protect vulnerable infrastructure from security incidents.Withhundredsofadditionalplanesinairportsrequiring fuel, and millions of people travelling by passenger train, this initiative was key to preventing any disruptions and unnecessary delays.
Owing to integrated efforts throughout Transnet and collaboration with key roleplayers, there was a significant reduction in incidents affecting infrastructure, as well as minimal impact on the running of the FIFA 2010 Soccer WorldCupdesignatedpassengertrains.
Transnet employees joining in the fun of the FIFA 2010 Soccer World Cup.
Transnet employees celebrating the FIFA 2010 Soccer World Cup.

Transnet SOC Ltd Sustainable Development Report 201138

Environmental compliance and climate change
39
Transnet SOC Ltd Sustainable Development Report 201140
In response, Transnet has placed a renewed focus on itsroleasaleadingcorporatecitizenandoncurbingthe potential negative impacts of its operations on the environment. “Environmental matters” have been included as a key Quantum Leap strategy focus area.
Environmental risks are reported to Transnet’s various risk committees and are a standing agenda itematbothExecutiveManagementandBoardmeetings.ThenewlyestablishedBoardSocialandEthicsCommitteemonitorsandadvisestheBoardon Company-wide environmental performance. Transnet also publishes its annual internal ‘Regulatory Universe’, driving Group-wide compliance with key regulations, a number of which are environmental.
Environmental concerns are managed by the Operating divisions. Transnet continues to embed environmental management frameworks (based on the ISO14001 standard for environmental management systems) at all Operatingdivisions.However,thegrowing impacts of environmental compliance risk in recent years have revealed greater need for co-ordinated management.
Significant environmental incidents in 2011Transnet Pipelines experienced six spills (10 000 litres and over), three of which resulted from unauthorised activities by third parties in the servitudes causing damage to the pipelines. All sites are being rehabilitated in accordance with the National Environment Management Act (NEMA).
Transnet is pleased to report that no significant environmental incidents were reported by any other Operating division in 2011.
Managing historic pollution and contamination The more significant contamination challenges addressed during 2011 concerned legacy asbestos issues in rail operating areas, pollution managementatthePortofPortElizabethManganese terminal, as well as spillage and residual wastemanagementattheRichardsBayRailMarshalling Yard.
Asbestos clean-up
Asbestos contamination has occurred in two ways: historic spillages occurred while transporting asbestos in the past, and building materials containing asbestos were used in Transnet property. Environmental conditions such as winds and rains have, over time, been contributing to the spread of asbestos fibres in operational areas and along the railway lines.
As at 31 March 2011, the total environmental provision for Transnet was approximately R1,3 billion.
Transnet Freight Rail has achieved the following: • Completedariskassessmentacrossits
operations in 2008; • ConcludedGeographicInformationSystem
mapping in 2009; and• CompiledanAsbestosEnvironmentHealthandSafety(EHS)PlanandRehabilitationPlanin2010.This plan is now being implemented.
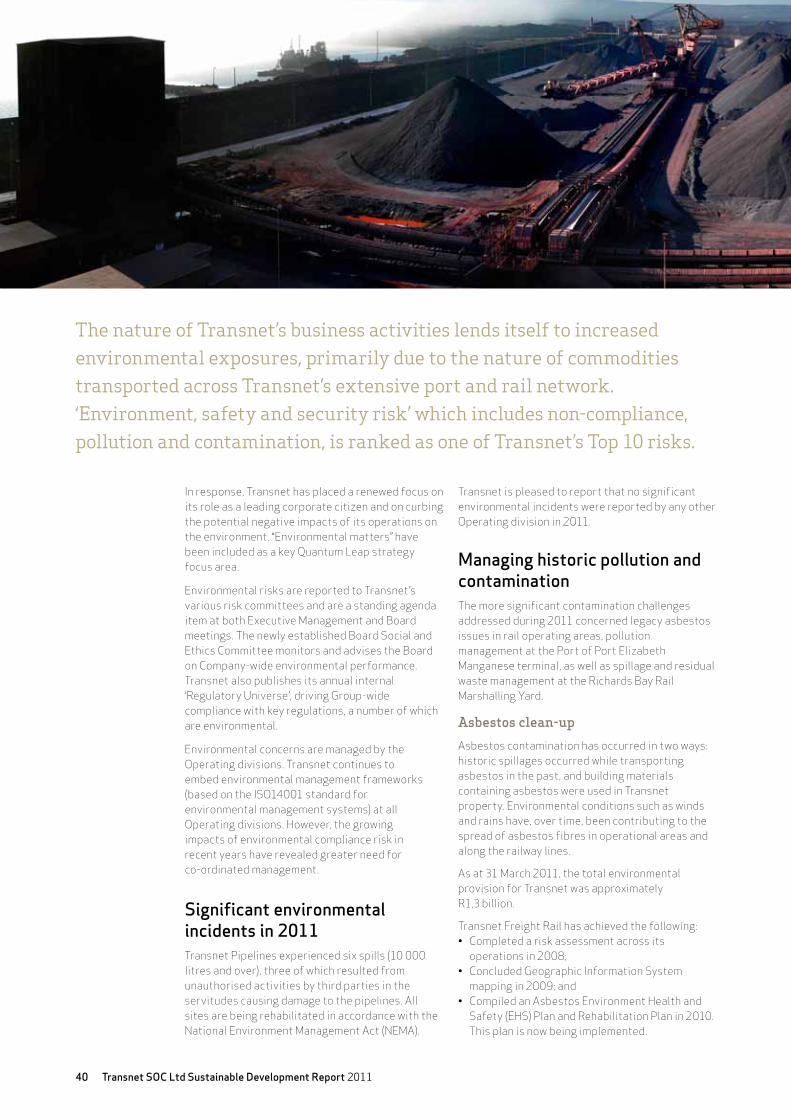
The nature of Transnet’s business activities lends itself to increased environmental exposures, primarily due to the nature of commodities transported across Transnet’s extensive port and rail network. ‘Environment, safety and security risk’ which includes non-compliance, pollution and contamination, is ranked as one of Transnet’s Top 10 risks.
41
In terms of the National Environmental Management:WasteActNo59of2008,theclean-up of asbestos now requires ‘basic assessments’ to be done for each of these areas. Transnet Freight Rail has appointed environmental assessment practitioners to conduct the ‘basic assessments’ during 2011.
Transnet Rail Engineering has also completed risk assessments and is in the process of cleaning up identified sites.
Asbestos was also used in buildings across Transnet. Transnet Property keeps a register of assets that contain asbestos and oversees replacement plans. Each Operating division has appointed a co-ordinator and replacement of asbestos in buildings has commenced. Transnet’s Risk Management Committee is providing oversight.
Port Elizabeth manganese terminal
Since 2008, Transnet has been involved in an ongoing stakeholder process regarding pollution at thePortElizabethManganeseTerminalandTankFarm (fuel storage facilities). Transnet has invested significantlyinthePortElizabethManganeseTerminal to improve efficiency and address environmental concerns. Despite these efforts, the terminal has been deemed to pose a prevailing environmental risk. As a result, a Directive was issued by the Department of Environment Affairs (DEA) on 26 May 2010.
The Directive specifies the following:• CompletionoftheManganeseTerminal
refurbishment initiatives; • Rehabilitationoftheberm(rubbleandsand
mound) inside the terminal; • Rehabilitationofvegetation;• Waterqualitymonitoring;• Investigationsintotherelocationofthe
manganese terminal; • Awastelicenseforhandlingandstorageofwaste
on site; and• TherelocationoftheTankFarm.
Upon receipt of the Pre-Directive, Transnet established a task team with oversight from two Group Executives and with representation from the Operating divisions. A plan has been developed to address issues outlined in the Directive, containing short, medium and long-term objectives. Progress is being tracked.
The last site visit by the Environmental Monitoring Inspectors was on 6 December 2010 and officials were satisfied with the progress made. To date, no formal report has been received from DEA. All issues have been closed out, except for the ongoing water quality monitoring inside the terminal, as well as the assessment of potential contamination on land outside the terminal. The latter assessment willbecompletedbyJune2011andanyrequiredfollow-up actions will then commence.
The Manganese Terminal is expected to be relocated. Feasibility studies will be conducted to support formal decision-making regarding the site for relocation, as well as the future use of the Port Elizabethlandandinfrastructuredevelopmentofthe new port.
This stakeholder process has been challenging but constructive for Transnet, highlighting areas requiring improvement in environmental management. Efforts are underway throughout the Company to address this through a renewed focus and prioritisation of compliance-related issues.
Richard’s Bay Rail marshalling Yard
Contamination-related health and environmental risks were identified at the Rail Marshalling Yard in thePortofRichardsBay.Theareahashistoricallybeen exposed to bulk cargo spillages, and residual waste during cargo sorting.
In October 2010, Transnet commissioned an independent environmental risk assessment. The removal and disposal of residual waste in the area was recommended. The Environmental Monitoring Inspectors of DEA also visited the port to conduct compliance assessments. Transnet awaits formal reports from these reviews.
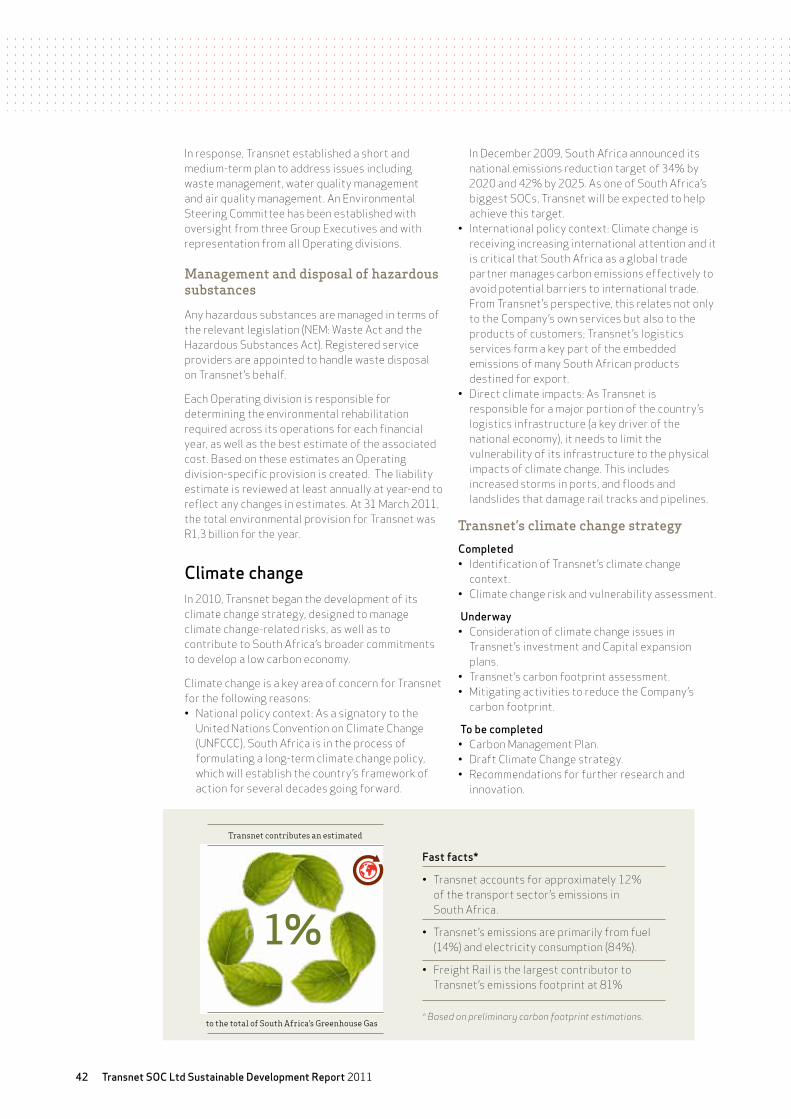
Transnet SOC Ltd Sustainable Development Report 201142
Fast facts*
• Transnetaccountsforapproximately12% of the transport sector’s emissions in South Africa.
• Transnet’semissionsareprimarilyfromfuel(14%) and electricity consumption (84%).
• FreightRailisthelargestcontributortoTransnet’s emissions footprint at 81%
* Based on preliminary carbon footprint estimations.
1%
Transnet contributes an estimated
to the total of South Africa’s Greenhouse Gas
In response, Transnet established a short and medium-term plan to address issues including waste management, water quality management and air quality management. An Environmental Steering Committee has been established with oversight from three Group Executives and with representation from all Operating divisions.
management and disposal of hazardous substances
Anyhazardoussubstancesaremanagedintermsoftherelevantlegislation(NEM:WasteActandtheHazardousSubstancesAct).Registeredserviceproviders are appointed to handle waste disposal on Transnet’s behalf.
Each Operating division is responsible for determining the environmental rehabilitation required across its operations for each financial year, as well as the best estimate of the associated cost.BasedontheseestimatesanOperatingdivision-specific provision is created. The liability estimate is reviewed at least annually at year-end to reflect any changes in estimates. At 31 March 2011, the total environmental provision for Transnet was R1,3 billion for the year.
Climate change In 2010, Transnet began the development of its climate change strategy, designed to manage climate change-related risks, as well as to contribute to South Africa’s broader commitments to develop a low carbon economy.
Climate change is a key area of concern for Transnet for the following reasons:• Nationalpolicycontext:Asasignatorytothe
United Nations Convention on Climate Change (UNFCCC), South Africa is in the process of formulating a long-term climate change policy, which will establish the country’s framework of action for several decades going forward.
In December 2009, South Africa announced its national emissions reduction target of 34% by 2020 and 42% by 2025. As one of South Africa’s biggest SOCs, Transnet will be expected to help achieve this target.
• Internationalpolicycontext:Climatechangeisreceiving increasing international attention and it is critical that South Africa as a global trade partner manages carbon emissions effectively to avoid potential barriers to international trade. From Transnet’s perspective, this relates not only to the Company’s own services but also to the products of customers; Transnet’s logistics services form a key part of the embedded emissions of many South African products destined for export.
• Directclimateimpacts:AsTransnetisresponsible for a major portion of the country’s logistics infrastructure (a key driver of the national economy), it needs to limit the vulnerability of its infrastructure to the physical impacts of climate change. This includes increased storms in ports, and floods and landslides that damage rail tracks and pipelines.
transnet’s climate change strategy
Completed• IdentificationofTransnet’sclimatechange
context. • Climatechangeriskandvulnerabilityassessment.
Underway• Considerationofclimatechangeissuesin
Transnet’s investment and Capital expansion plans.
• Transnet’scarbonfootprintassessment.• MitigatingactivitiestoreducetheCompany’s
carbon footprint.
To be completed• CarbonManagementPlan.• DraftClimateChangestrategy.• Recommendationsforfurtherresearchand
innovation.
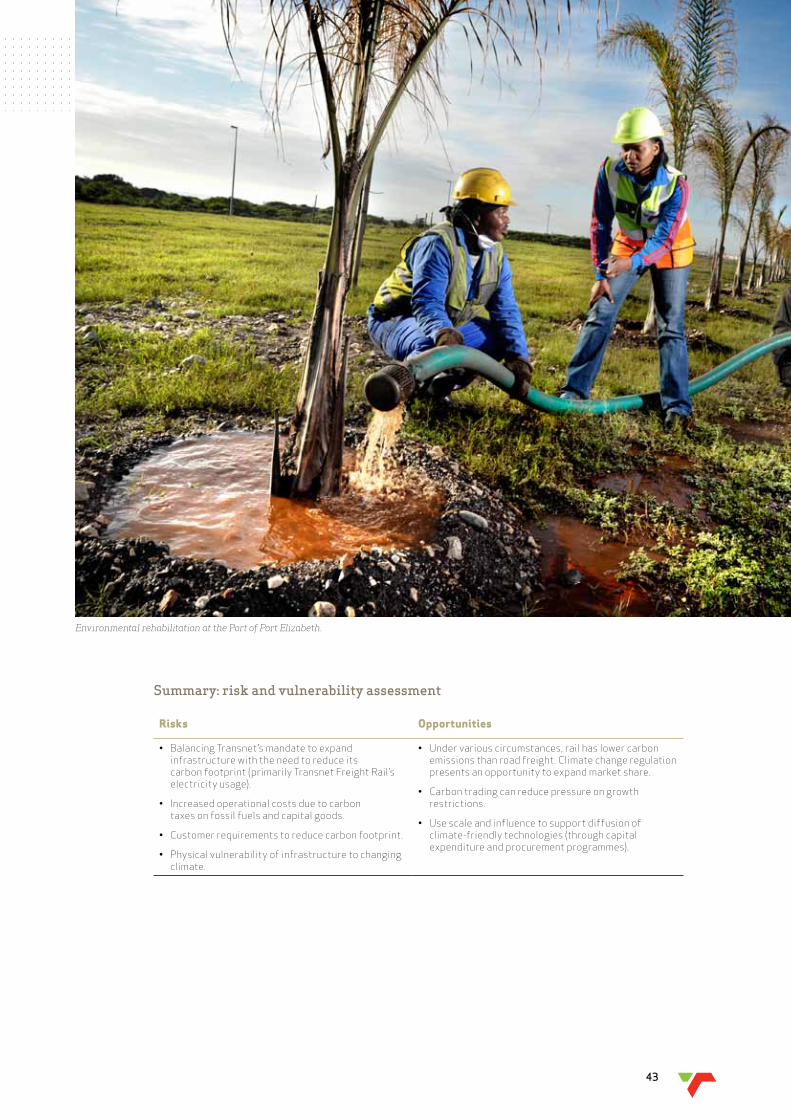
43
Summary: risk and vulnerability assessment
risks opportunities
• BalancingTransnet’smandatetoexpandinfrastructure with the need to reduce its carbon footprint (primarily Transnet Freight Rail’s electricity usage).
• Increasedoperationalcostsduetocarbon taxes on fossil fuels and capital goods.
• Customerrequirementstoreducecarbonfootprint.
• Physicalvulnerabilityofinfrastructuretochangingclimate.
• Undervariouscircumstances,railhaslowercarbonemissions than road freight. Climate change regulation presents an opportunity to expand market share.
• Carbontradingcanreducepressureongrowthrestrictions.
• Usescaleandinfluencetosupportdiffusionofclimate-friendly technologies (through capital expenditure and procurement programmes).
Environmental rehabilitation at the Port of Port Elizabeth.
Transnet SOC Ltd Sustainable Development Report 201144
Aligning with priorities of the Developmental State
45
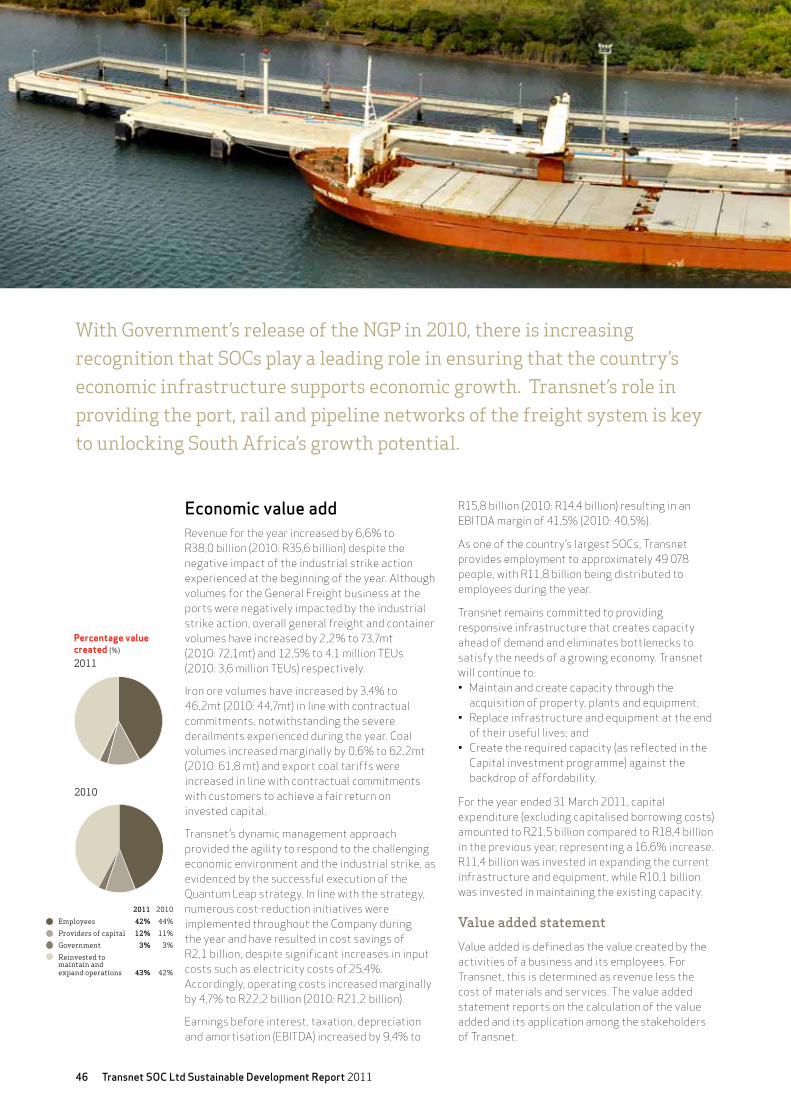
Transnet SOC Ltd Sustainable Development Report 201146
With Government’s release of the NGP in 2010, there is increasing recognition that SOCs play a leading role in ensuring that the country’s economic infrastructure supports economic growth. Transnet’s role in providing the port, rail and pipeline networks of the freight system is key to unlocking South Africa’s growth potential.
Percentage value created (%)
2011
2010
2011 2010
Employees 42% 44%
Providers of capital 12% 11%
Government 3% 3%
Reinvested to maintain andexpand operations 43% 42%
Economic value add Revenue for the year increased by 6,6% to R38,0 billion (2010: R35,6 billion) despite the negative impact of the industrial strike action experienced at the beginning of the year. Although volumes for the General Freight business at the ports were negatively impacted by the industrial strike action, overall general freight and container volumes have increased by 2,2% to 73,7mt (2010: 72,1mt) and 12,5% to 4,1 million TEUs (2010: 3,6 million TEUs) respectively.
Iron ore volumes have increased by 3,4% to 46,2mt (2010: 44,7mt) in line with contractual commitments, notwithstanding the severe derailments experienced during the year. Coal volumes increased marginally by 0,6% to 62,2mt (2010: 61,8 mt) and export coal tariffs were increased in line with contractual commitments with customers to achieve a fair return on invested capital.
Transnet’s dynamic management approach provided the agility to respond to the challenging economic environment and the industrial strike, as evidenced by the successful execution of the Quantum Leap strategy. In line with the strategy, numerous cost-reduction initiatives were implemented throughout the Company during the year and have resulted in cost savings of R2,1 billion, despite significant increases in input costs such as electricity costs of 25,4%. Accordingly, operating costs increased marginally by 4,7% to R22,2 billion (2010: R21,2 billion).
Earnings before interest, taxation, depreciation andamortisation(EBITDA)increasedby9,4%to
R15,8 billion (2010: R14,4 billion) resulting in an EBITDAmarginof41,5%(2010:40,5%).
As one of the country’s largest SOCs, Transnet provides employment to approximately 49 078 people, with R11,8 billion being distributed to employees during the year.
Transnet remains committed to providing responsive infrastructure that creates capacity ahead of demand and eliminates bottlenecks to satisfy the needs of a growing economy. Transnet will continue to: • Maintainandcreatecapacitythroughthe
acquisition of property, plants and equipment; • Replaceinfrastructureandequipmentattheend
of their useful lives; and• Createtherequiredcapacity(asreflectedinthe
Capital investment programme) against the backdrop of affordability.
For the year ended 31 March 2011, capital expenditure (excluding capitalised borrowing costs) amounted to R21,5 billion compared to R18,4 billion in the previous year, representing a 16,6% increase. R11,4 billion was invested in expanding the current infrastructure and equipment, while R10,1 billion was invested in maintaining the existing capacity.
Value added statement
Valueaddedisdefinedasthevaluecreatedbytheactivities of a business and its employees. For Transnet, this is determined as revenue less the cost of materials and services. The value added statement reports on the calculation of the value added and its application among the stakeholders of Transnet.
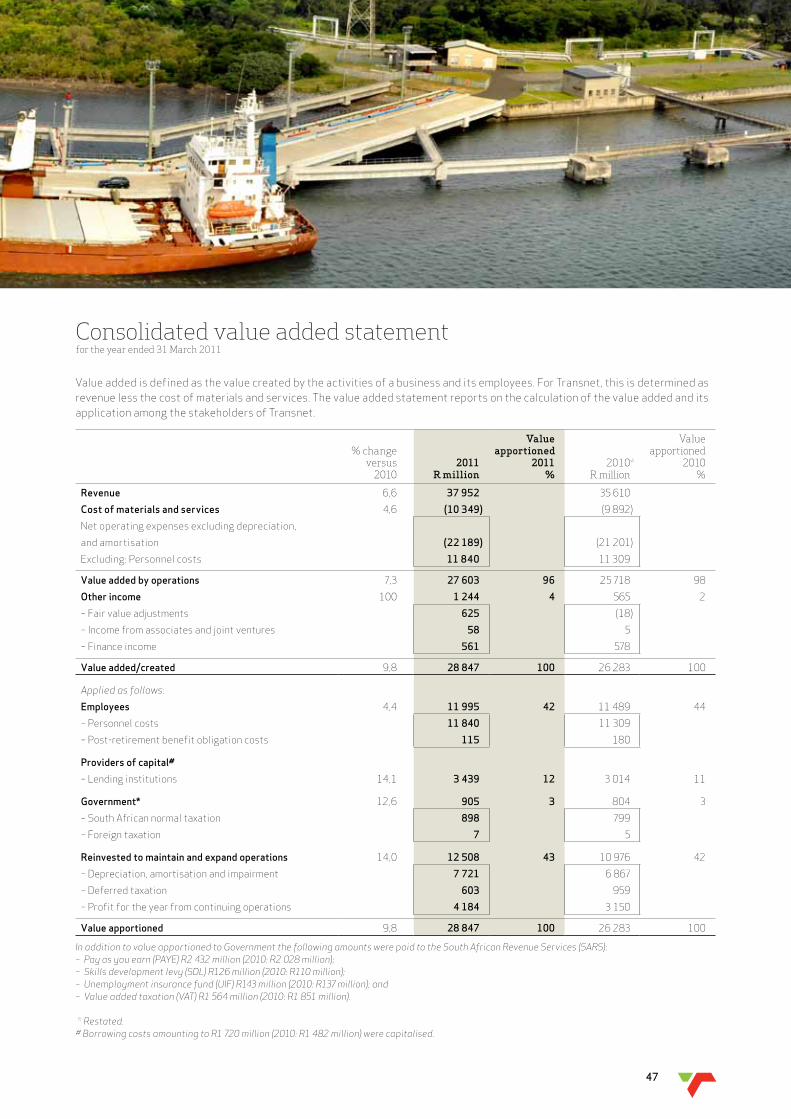
47
Consolidated value added statementfor the year ended 31 March 2011
Valueaddedisdefinedasthevaluecreatedbytheactivitiesofabusinessanditsemployees.ForTransnet,thisisdeterminedasrevenue less the cost of materials and services. The value added statement reports on the calculation of the value added and its application among the stakeholders of Transnet.
% changeversus
20102011
R million
Valueapportioned
2011%
2010*R million
Valueapportioned
2010%
Revenue 6,6 37 952 35 610
Cost of materials and services 4,6 (10 349) (9 892)
Net operating expenses excluding depreciation,
and amortisation (22 189) (21 201)
Excluding: Personnel costs 11 840 11 309
Value added by operations 7,3 27 603 96 25 718 98
Other income 100 1 244 4 565 2
– Fair value adjustments 625 (18)
– Income from associates and joint ventures 58 5
– Finance income 561 578
Value added/created 9,8 28 847 100 26 283 100
Applied as follows:
Employees 4,4 11 995 42 11 489 44
– Personnel costs 11 840 11 309
– Post-retirement benefit obligation costs 115 180
Providers of capital#
– Lending institutions 14,1 3 439 12 3 014 11
Government* 12,6 905 3 804 3
– South African normal taxation 898 799
– Foreign taxation 7 5
Reinvested to maintain and expand operations 14,0 12 508 43 10 976 42
– Depreciation, amortisation and impairment 7 721 6 867
– Deferred taxation 603 959
– Profit for the year from continuing operations 4 184 3 150
Value apportioned 9,8 28 847 100 26 283 100
In addition to value apportioned to Government the following amounts were paid to the South African Revenue Services (SARS):– Pay as you earn (PAYE) R2 432 million (2010: R2 028 million);– Skills development levy (SDL) R126 million (2010: R110 million);– Unemployment insurance fund (UIF) R143 million (2010: R137 million); and– Value added taxation (VAT) R1 564 million (2010: R1 851 million).
* Restated.# Borrowing costs amounting to R1 720 million (2010: R1 482 million) were capitalised.
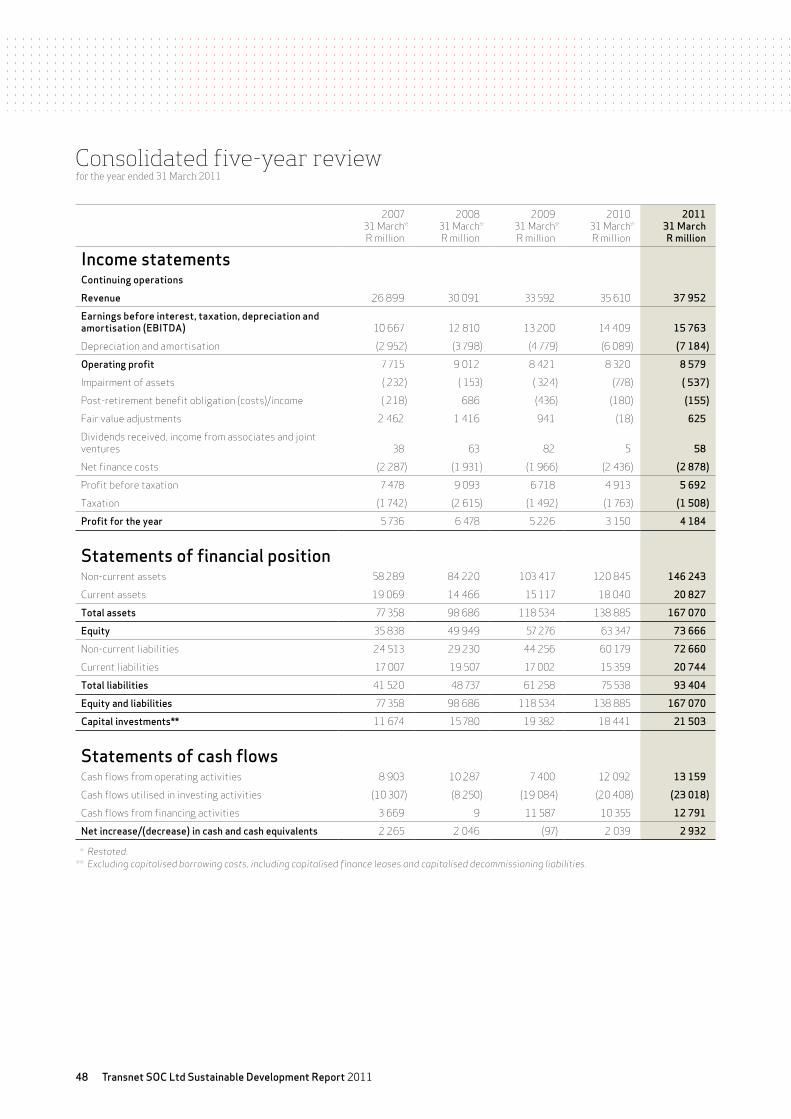
Transnet SOC Ltd Sustainable Development Report 201148
Consolidated five-year reviewfor the year ended 31 March 2011
200731 March* R million
2008 31 March* R million
2009 31 March*R million
2010 31 March*R million
201131 MarchR million
Income statementsContinuing operationsRevenue 26 899 30 091 33 592 35 610 37 952Earnings before interest, taxation, depreciation and amortisation (EBITDA) 10 667 12 810 13 200 14 409 15 763Depreciation and amortisation (2 952) (3 798) (4 779) (6 089) (7 184)Operating profit 7 715 9 012 8 421 8 320 8 579Impairment of assets ( 232) ( 153) ( 324) (778) ( 537)Post-retirement benefit obligation (costs)/income ( 218) 686 (436) (180) (155)Fair value adjustments 2 462 1 416 941 (18) 625Dividends received, income from associates and joint ventures 38 63 82 5 58Net finance costs (2 287) (1 931) (1 966) (2 436) (2 878)Profit before taxation 7 478 9 093 6 718 4 913 5 692Taxation (1 742) (2 615) (1 492) (1 763) (1 508)Profit for the year 5 736 6 478 5 226 3 150 4 184
Statements of financial positionNon-current assets 58 289 84 220 103 417 120 845 146 243Current assets 19 069 14 466 15 117 18 040 20 827Total assets 77 358 98 686 118 534 138 885 167 070Equity 35 838 49 949 57 276 63 347 73 666Non-current liabilities 24 513 29 230 44 256 60 179 72 660Current liabilities 17 007 19 507 17 002 15 359 20 744Total liabilities 41 520 48 737 61 258 75 538 93 404Equity and liabilities 77 358 98 686 118 534 138 885 167 070Capital investments** 11 674 15 780 19 382 18 441 21 503
Statements of cash flowsCash flows from operating activities 8 903 10 287 7 400 12 092 13 159Cash flows utilised in investing activities (10 307) (8 250) (19 084) (20 408) (23 018)Cash flows from financing activities 3 669 9 11 587 10 355 12 791Net increase/(decrease) in cash and cash equivalents 2 265 2 046 (97) 2 039 2 932
* Restated.** Excluding capitalised borrowing costs, including capitalised finance leases and capitalised decommissioning liabilities.
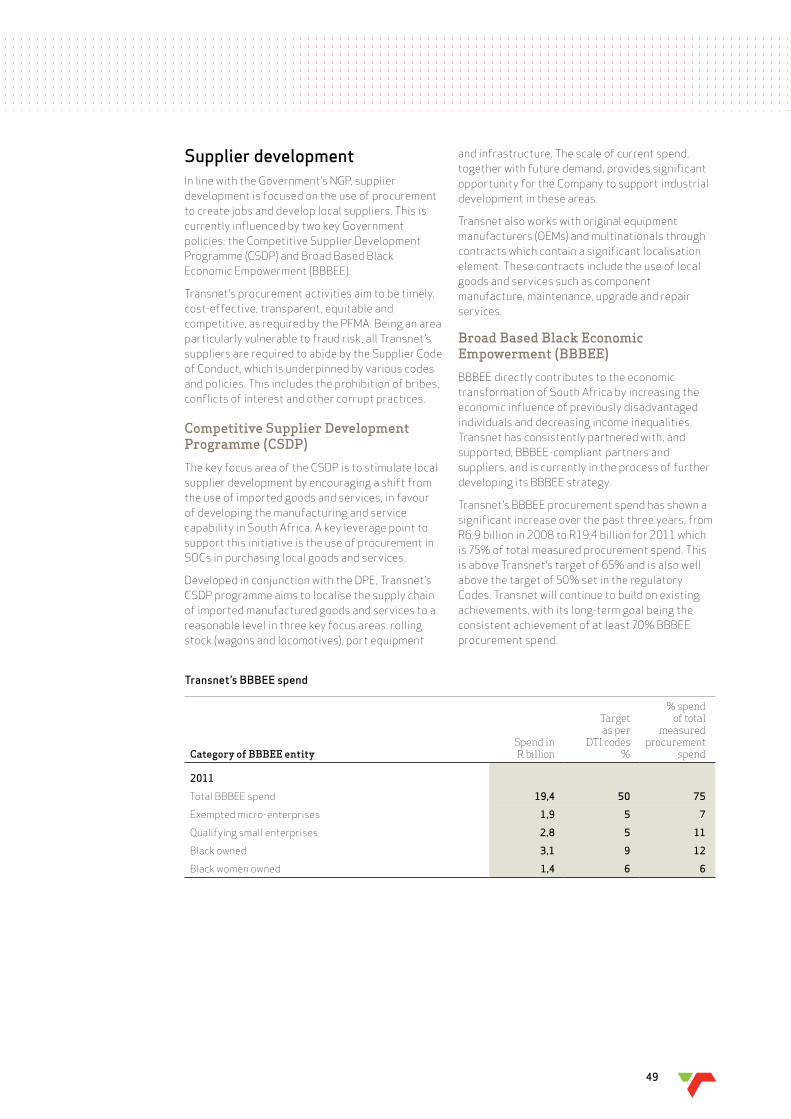
49
Supplier development In line with the Government’s NGP, supplier development is focused on the use of procurement to create jobs and develop local suppliers. This is currently influenced by two key Government policies: the Competitive Supplier Development Programme(CSDP)andBroadBasedBlackEconomicEmpowerment(BBBEE).
Transnet’s procurement activities aim to be timely, cost-effective, transparent, equitable and competitive,asrequiredbythePFMA.Beinganareaparticularly vulnerable to fraud risk, all Transnet’s suppliers are required to abide by the Supplier Code of Conduct, which is underpinned by various codes and policies. This includes the prohibition of bribes, conflicts of interest and other corrupt practices.
Competitive Supplier Development Programme (CSDP)
The key focus area of the CSDP is to stimulate local supplier development by encouraging a shift from the use of imported goods and services, in favour of developing the manufacturing and service capability in South Africa. A key leverage point to support this initiative is the use of procurement in SOCs in purchasing local goods and services.
Developed in conjunction with the DPE, Transnet’s CSDP programme aims to localise the supply chain of imported manufactured goods and services to a reasonable level in three key focus areas: rolling stock (wagons and locomotives), port equipment
and infrastructure. The scale of current spend, together with future demand, provides significant opportunity for the Company to support industrial development in these areas.
Transnet also works with original equipment manufacturers (OEMs) and multinationals through contracts which contain a significant localisation element. These contracts include the use of local goods and services such as component manufacture, maintenance, upgrade and repair services.
Broad Based Black Economic Empowerment (BBBEE)
BBBEEdirectlycontributestotheeconomictransformation of South Africa by increasing the economic influence of previously disadvantaged individuals and decreasing income inequalities. Transnet has consistently partnered with, and supported,BBBEE-compliantpartnersandsuppliers, and is currently in the process of further developingitsBBBEEstrategy.
Transnet’sBBBEEprocurementspendhasshownasignificant increase over the past three years, from R6.9 billion in 2008 to R19,4 billion for 2011 which is 75% of total measured procurement spend. This is above Transnet’s target of 65% and is also well above the target of 50% set in the regulatory Codes. Transnet will continue to build on existing achievements, with its long-term goal being the consistentachievementofatleast70%BBBEEprocurement spend.
Transnet’s BBBEE spend
Category of BBBEE entitySpend in R billion
Target as per
DTI codes%
% spend of total
measured procurement
spend
2011TotalBBBEEspend 19,4 50 75 Exempted micro-enterprises 1,9 5 7 Qualifying small enterprises 2,8 5 11 Blackowned 3,1 9 12 Blackwomenowned 1,4 6 6
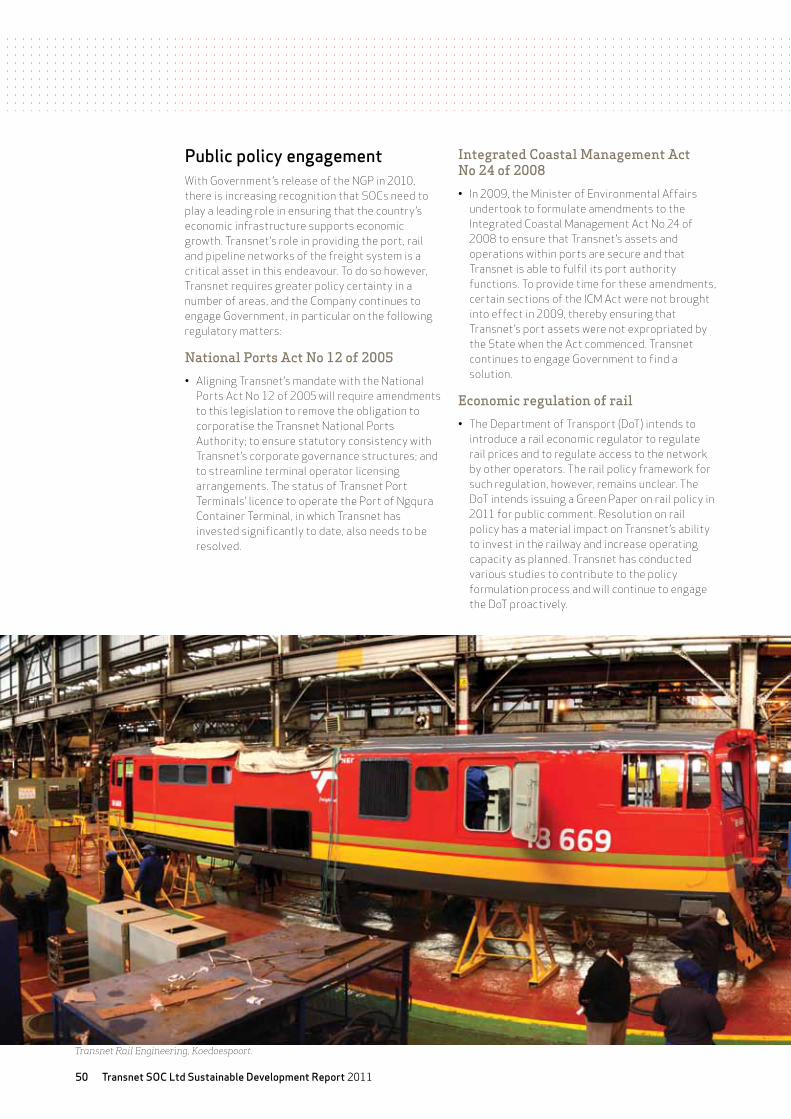
Transnet SOC Ltd Sustainable Development Report 201150
Public policy engagement WithGovernment’sreleaseoftheNGPin2010,there is increasing recognition that SOCs need to play a leading role in ensuring that the country’s economic infrastructure supports economic growth. Transnet’s role in providing the port, rail and pipeline networks of the freight system is a critical asset in this endeavour. To do so however, Transnet requires greater policy certainty in a number of areas, and the Company continues to engage Government, in particular on the following regulatory matters:
national Ports Act no 12 of 2005
• AligningTransnet’smandatewiththeNationalPorts Act No 12 of 2005 will require amendments to this legislation to remove the obligation to corporatise the Transnet National Ports Authority; to ensure statutory consistency with Transnet’s corporate governance structures; and to streamline terminal operator licensing arrangements. The status of Transnet Port Terminals’ licence to operate the Port of Ngqura Container Terminal, in which Transnet has invested significantly to date, also needs to be resolved.
Integrated Coastal management Act no 24 of 2008
• In2009,theMinisterofEnvironmentalAffairsundertook to formulate amendments to the Integrated Coastal Management Act No 24 of 2008 to ensure that Transnet’s assets and operations within ports are secure and that Transnet is able to fulfil its port authority functions. To provide time for these amendments, certain sections of the ICM Act were not brought into effect in 2009, thereby ensuring that Transnet’s port assets were not expropriated by the State when the Act commenced. Transnet continues to engage Government to find a solution.
Economic regulation of rail
• TheDepartmentofTransport(DoT)intendstointroduce a rail economic regulator to regulate rail prices and to regulate access to the network by other operators. The rail policy framework for such regulation, however, remains unclear. The DoT intends issuing a Green Paper on rail policy in 2011 for public comment. Resolution on rail policy has a material impact on Transnet’s ability to invest in the railway and increase operating capacity as planned. Transnet has conducted various studies to contribute to the policy formulation process and will continue to engage the DoT proactively.
Transnet Rail Engineering, Koedoespoort.
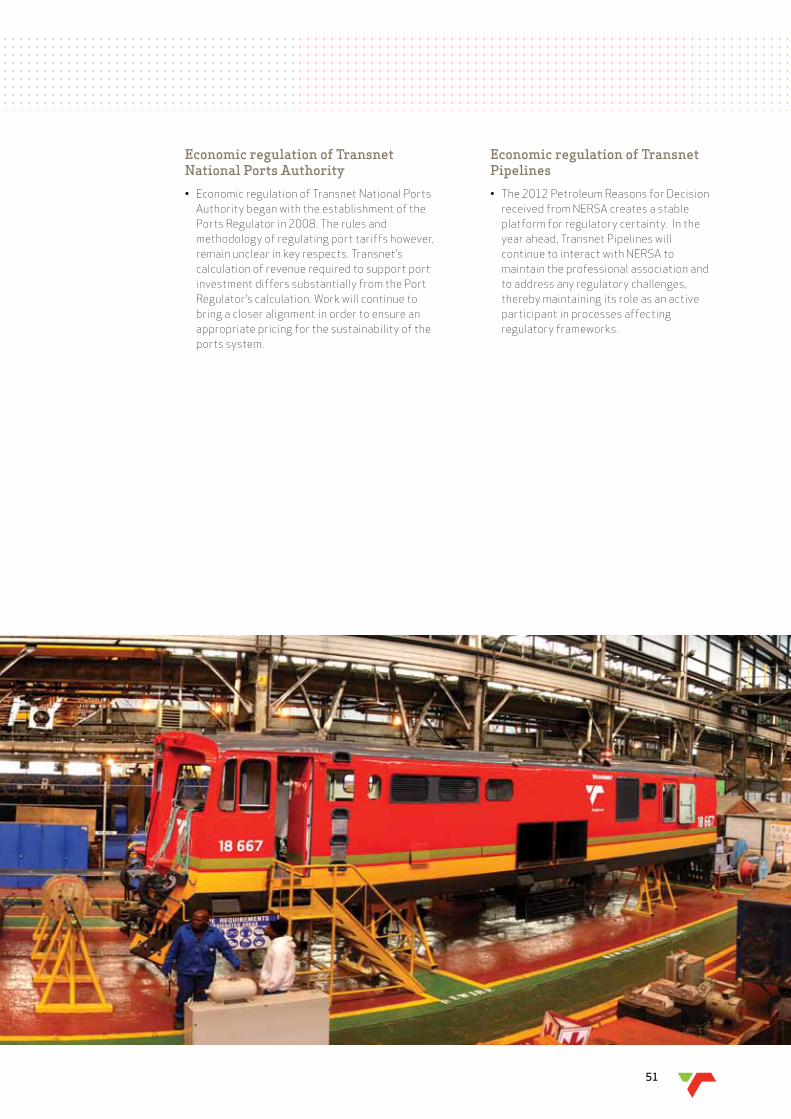
51
Economic regulation of transnet national Ports Authority
• EconomicregulationofTransnetNationalPortsAuthority began with the establishment of the Ports Regulator in 2008. The rules and methodology of regulating port tariffs however, remain unclear in key respects. Transnet’s calculation of revenue required to support port investment differs substantially from the Port Regulator’scalculation.Workwillcontinuetobring a closer alignment in order to ensure an appropriate pricing for the sustainability of the ports system.
Economic regulation of transnet Pipelines
• The2012PetroleumReasonsforDecisionreceived from NERSA creates a stable platform for regulatory certainty. In the year ahead, Transnet Pipelines will continue to interact with NERSA to maintain the professional association and to address any regulatory challenges, thereby maintaining its role as an active participant in processes affecting regulatory frameworks.
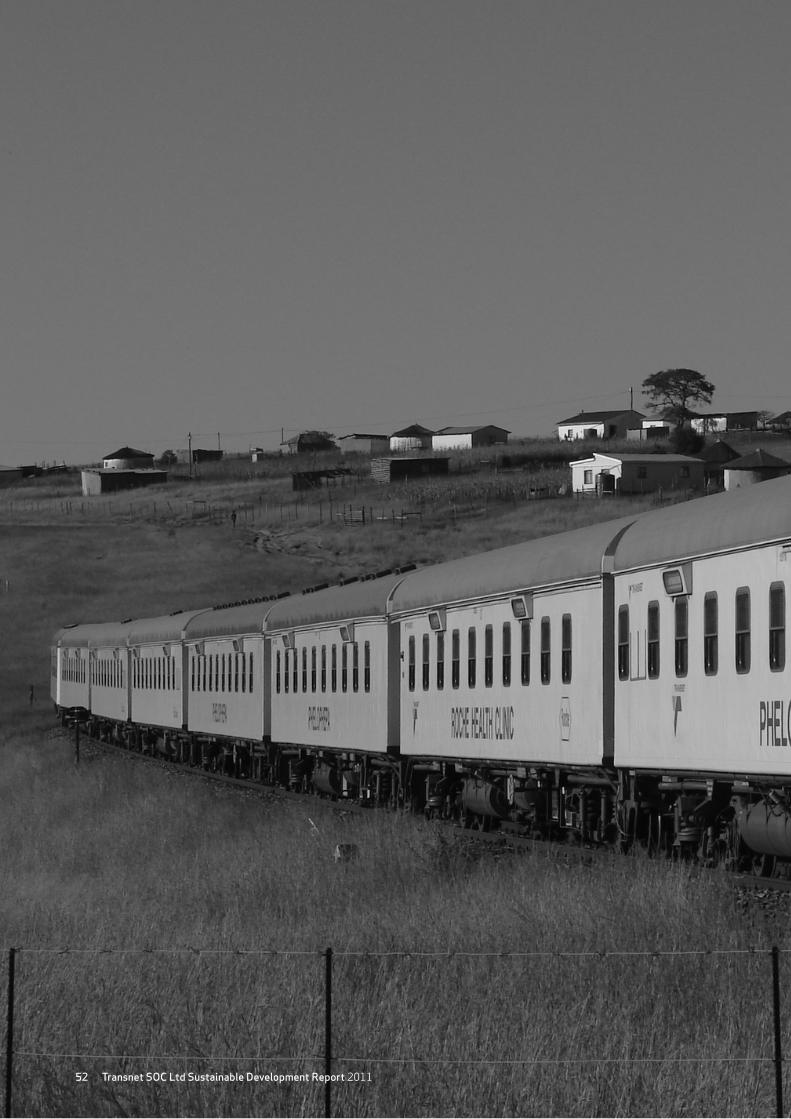
Transnet SOC Ltd Sustainable Development Report 201152
Corporate Social Investment
53
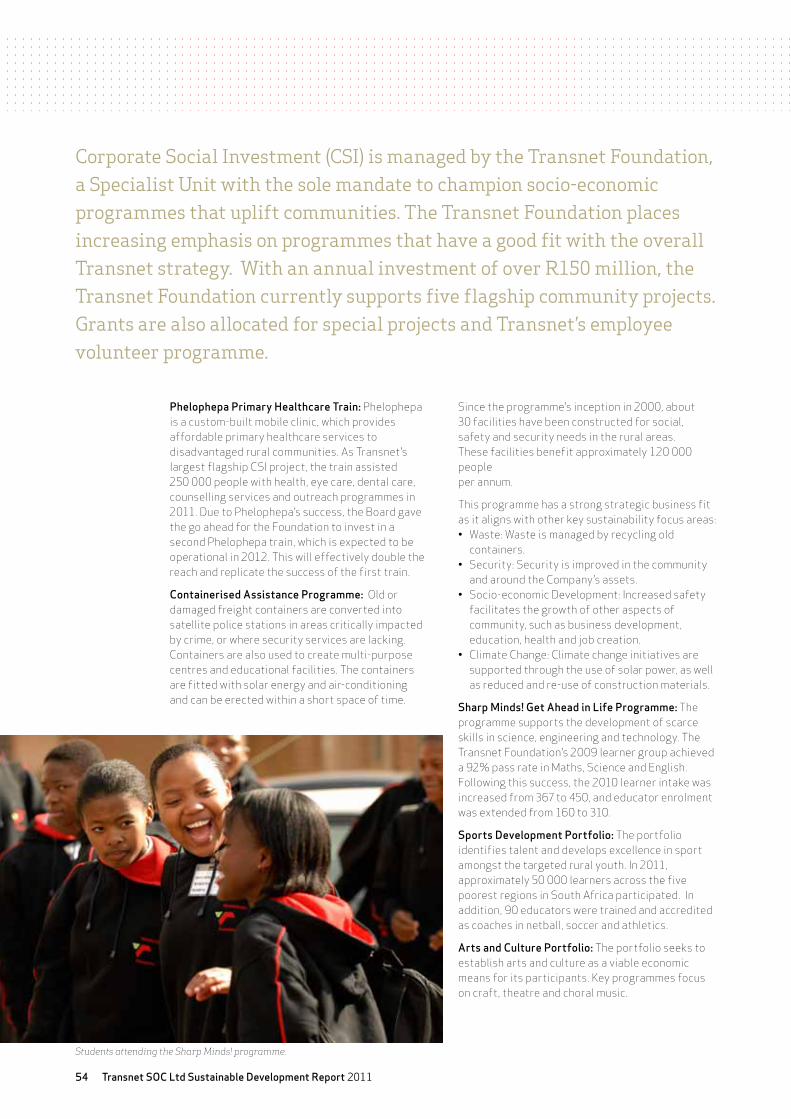
Transnet SOC Ltd Sustainable Development Report 201154
Phelophepa Primary Healthcare Train: Phelophepa is a custom-built mobile clinic, which provides affordable primary healthcare services to disadvantaged rural communities. As Transnet’s largest flagship CSI project, the train assisted 250 000 people with health, eye care, dental care, counselling services and outreach programmes in 2011.DuetoPhelophepa’ssuccess,theBoardgavethe go ahead for the Foundation to invest in a second Phelophepa train, which is expected to be operational in 2012. This will effectively double the reach and replicate the success of the first train.
Containerised Assistance Programme: Old or damaged freight containers are converted into satellite police stations in areas critically impacted by crime, or where security services are lacking. Containers are also used to create multi-purpose centres and educational facilities. The containers are fitted with solar energy and air-conditioning and can be erected within a short space of time.
Corporate Social Investment (CSI) is managed by the Transnet Foundation, a Specialist Unit with the sole mandate to champion socio-economic programmes that uplift communities. The Transnet Foundation places increasing emphasis on programmes that have a good fit with the overall Transnet strategy. With an annual investment of over R150 million, the Transnet Foundation currently supports five flagship community projects. Grants are also allocated for special projects and Transnet’s employee volunteer programme.
Since the programme’s inception in 2000, about 30 facilities have been constructed for social, safety and security needs in the rural areas. These facilities benefit approximately 120 000 people per annum.
This programme has a strong strategic business fit as it aligns with other key sustainability focus areas:• Waste:Wasteismanagedbyrecyclingold
containers.• Security:Securityisimprovedinthecommunity
and around the Company’s assets. • Socio-economicDevelopment:Increasedsafety
facilitates the growth of other aspects of community, such as business development, education, health and job creation.
• ClimateChange:Climatechangeinitiativesaresupported through the use of solar power, as well as reduced and re-use of construction materials.
Sharp Minds! Get Ahead in Life Programme: The programme supports the development of scarce skills in science, engineering and technology. The Transnet Foundation’s 2009 learner group achieved a 92% pass rate in Maths, Science and English. Following this success, the 2010 learner intake was increased from 367 to 450, and educator enrolment was extended from 160 to 310.
Sports Development Portfolio: The portfolio identifies talent and develops excellence in sport amongst the targeted rural youth. In 2011, approximately 50 000 learners across the five poorest regions in South Africa participated. In addition, 90 educators were trained and accredited as coaches in netball, soccer and athletics.
Arts and Culture Portfolio: The portfolio seeks to establish arts and culture as a viable economic means for its participants. Key programmes focus on craft, theatre and choral music.
Students attending the Sharp Minds! programme.

55
Phelophepa train.
Toddler waiting his turn outside the Phelophepa Health train.
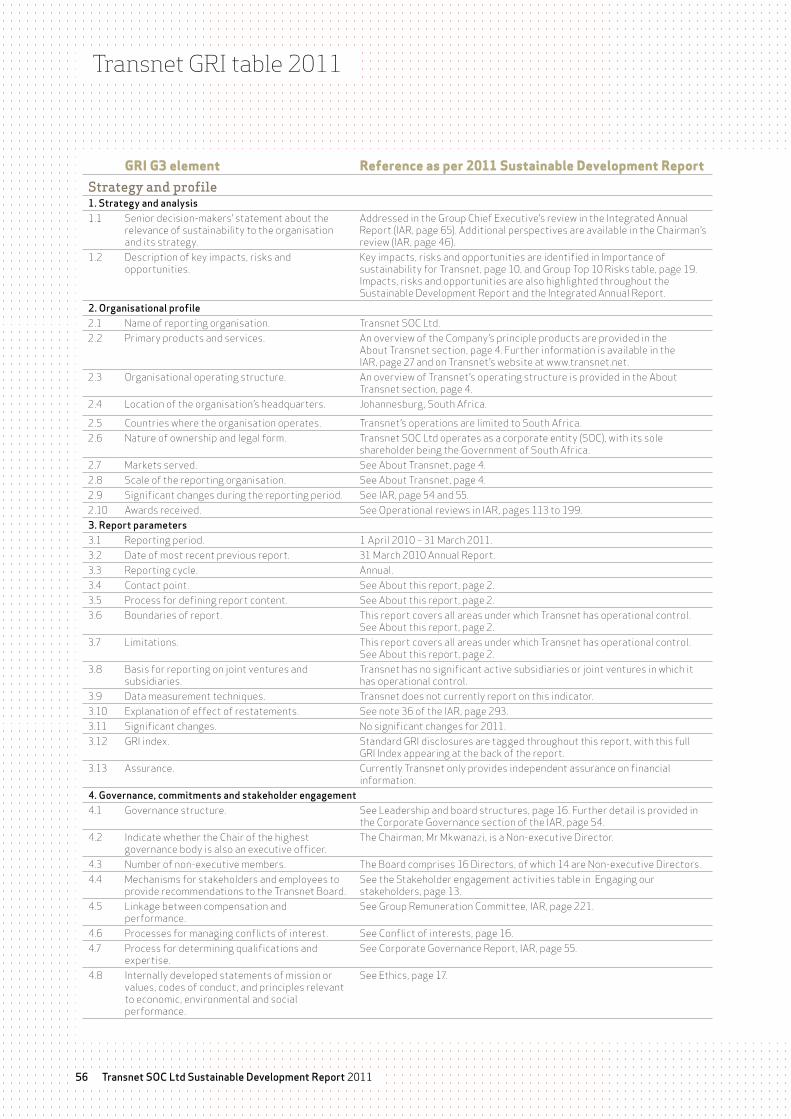
Transnet GRI table 2011
Transnet SOC Ltd Sustainable Development Report 201156
Gri G3 element reference as per 2011 sustainable Development reportStrategy and profile1. Strategy and analysis1.1 Senior decision-makers’ statement about the
relevance of sustainability to the organisation and its strategy.
Addressed in the Group Chief Executive’s review in the Integrated Annual Report (IAR, page 65). Additional perspectives are available in the Chairman’s review (IAR, page 46).
1.2 Description of key impacts, risks and opportunities.
Key impacts, risks and opportunities are identified in Importance of sustainability for Transnet, page 10, and Group Top 10 Risks table, page 19. Impacts, risks and opportunities are also highlighted throughout the Sustainable Development Report and the Integrated Annual Report.
2. Organisational profile2.1 Name of reporting organisation. Transnet SOC Ltd.2.2 Primary products and services. An overview of the Company’s principle products are provided in the
About Transnet section, page 4. Further information is available in the IAR, page 27 and on Transnet’s website at www.transnet.net.
2.3 Organisational operating structure. An overview of Transnet’s operating structure is provided in the About Transnet section, page 4.
2.4 Location of the organisation’s headquarters. Johannesburg,SouthAfrica.
2.5 Countries where the organisation operates. Transnet’s operations are limited to South Africa. 2.6 Nature of ownership and legal form. Transnet SOC Ltd operates as a corporate entity (SOC), with its sole
shareholder being the Government of South Africa.2.7 Markets served. See About Transnet, page 4. 2.8 Scale of the reporting organisation. See About Transnet, page 4. 2.9 Significant changes during the reporting period. See IAR, page 54 and 55.2.10 Awards received. See Operational reviews in IAR, pages 113 to 199.3. Report parameters3.1 Reporting period. 1 April 2010 – 31 March 2011.3.2 Date of most recent previous report. 31 March 2010 Annual Report.3.3 Reporting cycle. Annual.3.4 Contact point. See About this report, page 2.3.5 Process for defining report content. See About this report, page 2.3.6 Boundariesofreport. This report covers all areas under which Transnet has operational control.
See About this report, page 2. 3.7 Limitations. This report covers all areas under which Transnet has operational control.
See About this report, page 2. 3.8 Basisforreportingonjointventuresand
subsidiaries.Transnet has no significant active subsidiaries or joint ventures in which it has operational control.
3.9 Data measurement techniques. Transnet does not currently report on this indicator.3.10 Explanation of effect of restatements. See note 36 of the IAR, page 293. 3.11 Significant changes. No significant changes for 2011.3.12 GRI index. Standard GRI disclosures are tagged throughout this report, with this full
GRI Index appearing at the back of the report. 3.13 Assurance. Currently Transnet only provides independent assurance on financial
information.4. Governance, commitments and stakeholder engagement4.1 Governance structure. See Leadership and board structures, page 16. Further detail is provided in
the Corporate Governance section of the IAR, page 54.4.2 Indicate whether the Chair of the highest
governance body is also an executive officer. TheChairman,MrMkwanazi,isaNon-executiveDirector.
4.3 Number of non-executive members. TheBoardcomprises16Directors,ofwhich14areNon-executiveDirectors.4.4 Mechanisms for stakeholders and employees to
providerecommendationstotheTransnetBoard.See the Stakeholder engagement activities table in Engaging our stakeholders, page 13.
4.5 Linkage between compensation and performance.
See Group Remuneration Committee, IAR, page 221.
4.6 Processes for managing conflicts of interest. See Conflict of interests, page 16.4.7 Process for determining qualifications and
expertise. See Corporate Governance Report, IAR, page 55.
4.8 Internally developed statements of mission or values, codes of conduct, and principles relevant to economic, environmental and social performance.
See Ethics, page 17.
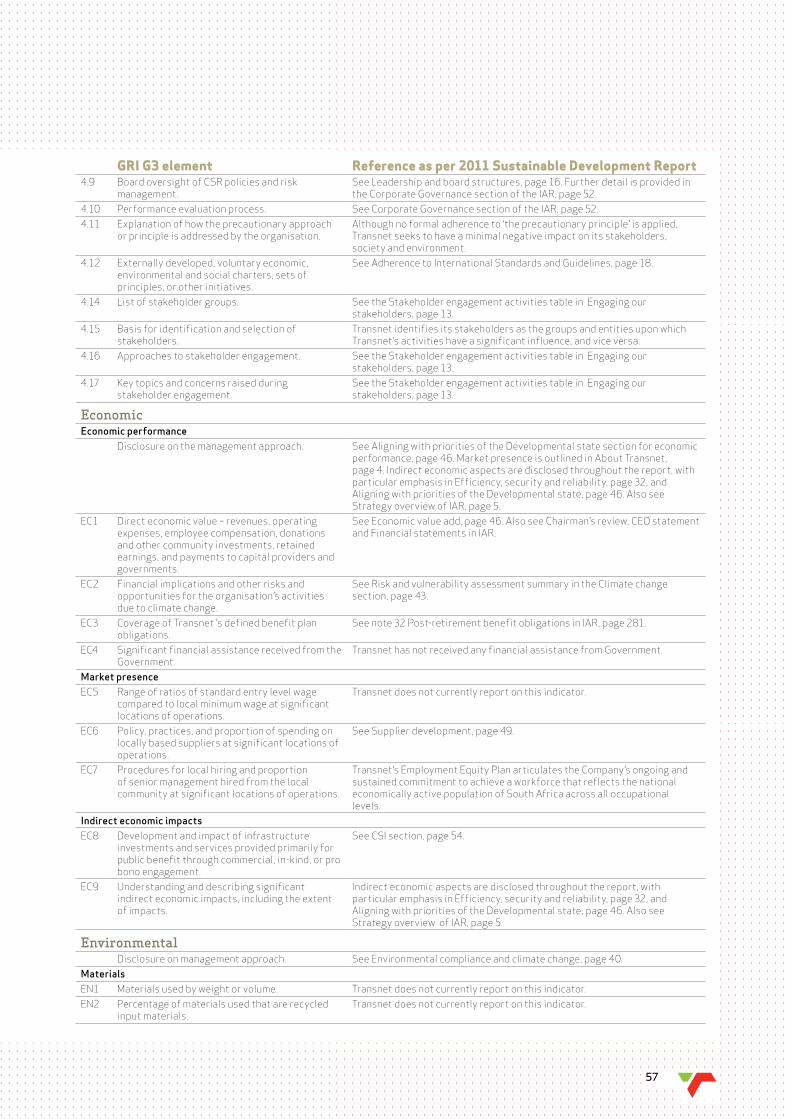
Gri G3 element reference as per 2011 sustainable Development report4.9 BoardoversightofCSRpoliciesandrisk
management.See Leadership and board structures, page 16. Further detail is provided in the Corporate Governance section of the IAR, page 52.
4.10 Performance evaluation process. See Corporate Governance section of the IAR, page 52.4.11 Explanation of how the precautionary approach
or principle is addressed by the organisation.Although no formal adherence to ‘the precautionary principle’ is applied, Transnet seeks to have a minimal negative impact on its stakeholders, society and environment.
4.12 Externally developed, voluntary economic, environmental and social charters, sets of principles, or other initiatives.
See Adherence to International Standards and Guidelines, page 18.
4.14 List of stakeholder groups. See the Stakeholder engagement activities table in Engaging our stakeholders, page 13.
4.15 Basisforidentificationandselectionofstakeholders.
Transnet identifies its stakeholders as the groups and entities upon which Transnet’s activities have a significant influence, and vice versa.
4.16 Approaches to stakeholder engagement. See the Stakeholder engagement activities table in Engaging our stakeholders, page 13.
4.17 Key topics and concerns raised during stakeholder engagement.
See the Stakeholder engagement activities table in Engaging our stakeholders, page 13.
EconomicEconomic performance
Disclosure on the management approach. See Aligning with priorities of the Developmental state section for economic performance, page 46. Market presence is outlined in About Transnet, page 4. Indirect economic aspects are disclosed throughout the report, with particular emphasis in Efficiency, security and reliability, page 32, and Aligning with priorities of the Developmental state, page 46. Also see Strategy overview of IAR, page 5.
EC1 Direct economic value – revenues, operating expenses, employee compensation, donations and other community investments, retained earnings, and payments to capital providers and governments.
See Economic value add, page 46. Also see Chairman’s review, CEO statement and Financial statements in IAR.
EC2 Financial implications and other risks and opportunities for the organisation’s activities due to climate change.
See Risk and vulnerability assessment summary in the Climate change section, page 43.
EC3 Coverage of Transnet ’s defined benefit plan obligations.
See note 32 Post-retirement benefit obligations in IAR, page 281.
EC4 Significant financial assistance received from the Government.
Transnet has not received any financial assistance from Government.
Market presenceEC5 Range of ratios of standard entry level wage
compared to local minimum wage at significant locations of operations.
Transnet does not currently report on this indicator.
EC6 Policy, practices, and proportion of spending on locally based suppliers at significant locations of operations.
See Supplier development, page 49.
EC7 Procedures for local hiring and proportion of senior management hired from the local community at significant locations of operations.
Transnet’s Employment Equity Plan articulates the Company’s ongoing and sustained commitment to achieve a workforce that reflects the national economically active population of South Africa across all occupational levels.
Indirect economic impactsEC8 Development and impact of infrastructure
investments and services provided primarily for public benefit through commercial, in-kind, or pro bono engagement.
See CSI section, page 54.
EC9 Understanding and describing significant indirect economic impacts, including the extent of impacts.
Indirect economic aspects are disclosed throughout the report, with particular emphasis in Efficiency, security and reliability, page 32, and Aligning with priorities of the Developmental state, page 46. Also see Strategy overview of IAR, page 5.
EnvironmentalDisclosure on management approach. See Environmental compliance and climate change, page 40.
MaterialsEN1 Materials used by weight or volume. Transnet does not currently report on this indicator.EN2 Percentage of materials used that are recycled
input materials.Transnet does not currently report on this indicator.
57
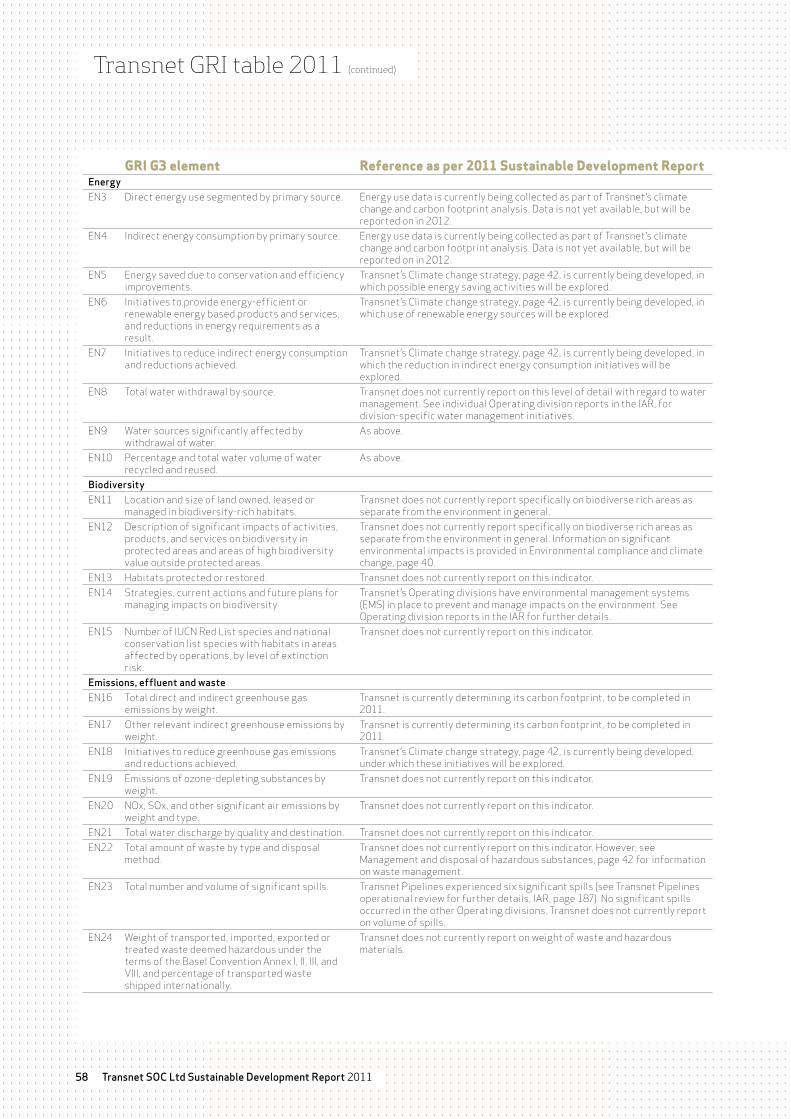
Transnet GRI table 2011 (continued)
Gri G3 element reference as per 2011 sustainable Development reportEnergyEN3 Direct energy use segmented by primary source. Energy use data is currently being collected as part of Transnet’s climate
change and carbon footprint analysis. Data is not yet available, but will be reported on in 2012.
EN4 Indirect energy consumption by primary source. Energy use data is currently being collected as part of Transnet’s climate change and carbon footprint analysis. Data is not yet available, but will be reported on in 2012.
EN5 Energy saved due to conservation and efficiency improvements.
Transnet’s Climate change strategy, page 42, is currently being developed, in which possible energy saving activities will be explored.
EN6 Initiatives to provide energy-efficient or renewable energy based products and services, and reductions in energy requirements as a result.
Transnet’s Climate change strategy, page 42, is currently being developed, in which use of renewable energy sources will be explored.
EN7 Initiatives to reduce indirect energy consumption and reductions achieved.
Transnet’s Climate change strategy, page 42, is currently being developed, in which the reduction in indirect energy consumption initiatives will be explored.
EN8 Total water withdrawal by source. Transnet does not currently report on this level of detail with regard to water management. See individual Operating division reports in the IAR, for division-specific water management initiatives.
EN9 Watersourcessignificantlyaffectedbywithdrawal of water.
As above.
EN10 Percentage and total water volume of water recycled and reused.
As above.
BiodiversityEN11 Locationandsizeoflandowned,leasedor
managed in biodiversity-rich habitats.Transnet does not currently report specifically on biodiverse rich areas as separate from the environment in general.
EN12 Description of significant impacts of activities, products, and services on biodiversity in protected areas and areas of high biodiversity value outside protected areas.
Transnet does not currently report specifically on biodiverse rich areas as separate from the environment in general. Information on significant environmental impacts is provided in Environmental compliance and climate change, page 40.
EN13 Habitatsprotectedorrestored. Transnet does not currently report on this indicator. EN14 Strategies, current actions and future plans for
managing impacts on biodiversityTransnet’s Operating divisions have environmental management systems (EMS) in place to prevent and manage impacts on the environment. See Operating division reports in the IAR for further details.
EN15 Number of IUCN Red List species and national conservation list species with habitats in areas affected by operations, by level of extinction risk.
Transnet does not currently report on this indicator.
Emissions, effluent and wasteEN16 Total direct and indirect greenhouse gas
emissions by weight.Transnet is currently determining its carbon footprint, to be completed in 2011.
EN17 Other relevant indirect greenhouse emissions by weight.
Transnet is currently determining its carbon footprint, to be completed in 2011.
EN18 Initiatives to reduce greenhouse gas emissions and reductions achieved.
Transnet’s Climate change strategy, page 42, is currently being developed, under which these initiatives will be explored.
EN19 Emissionsofozone-depletingsubstancesbyweight.
Transnet does not currently report on this indicator.
EN20 NOx, SOx, and other significant air emissions by weight and type.
Transnet does not currently report on this indicator.
EN21 Total water discharge by quality and destination. Transnet does not currently report on this indicator.EN22 Total amount of waste by type and disposal
method.Transnetdoesnotcurrentlyreportonthisindicator.However,seeManagementanddisposalofhazardoussubstances,page42forinformationon waste management.
EN23 Total number and volume of significant spills. Transnet Pipelines experienced six significant spills (see Transnet Pipelines operational review for further details, IAR, page 187). No significant spills occurred in the other Operating divisions. Transnet does not currently report on volume of spills.
EN24 Weightoftransported,imported,exportedortreatedwastedeemedhazardousunderthetermsoftheBaselConventionAnnexI,II,III,andVIII,andpercentageoftransportedwasteshipped internationally.
Transnetdoesnotcurrentlyreportonweightofwasteandhazardousmaterials.
Transnet SOC Ltd Sustainable Development Report 201158
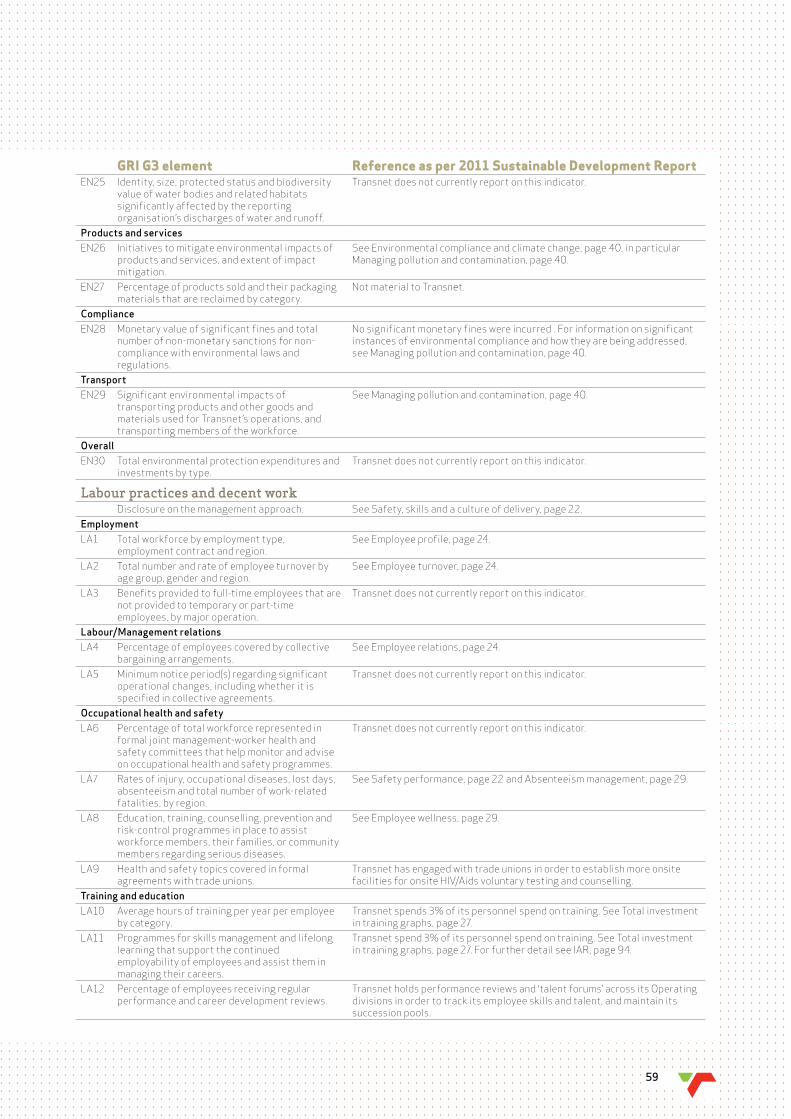
Gri G3 element reference as per 2011 sustainable Development reportEN25 Identity,size,protectedstatusandbiodiversity
value of water bodies and related habitats significantly affected by the reporting organisation’s discharges of water and runoff.
Transnet does not currently report on this indicator.
Products and servicesEN26 Initiatives to mitigate environmental impacts of
products and services, and extent of impact mitigation.
See Environmental compliance and climate change, page 40, in particular Managing pollution and contamination, page 40.
EN27 Percentage of products sold and their packaging materials that are reclaimed by category.
Not material to Transnet.
ComplianceEN28 Monetary value of significant fines and total
number of non-monetary sanctions for non-compliance with environmental laws and regulations.
No significant monetary fines were incurred . For information on significant instances of environmental compliance and how they are being addressed, see Managing pollution and contamination, page 40.
TransportEN29 Significant environmental impacts of
transporting products and other goods and materials used for Transnet’s operations, and transporting members of the workforce.
See Managing pollution and contamination, page 40.
OverallEN30 Total environmental protection expenditures and
investments by type.Transnet does not currently report on this indicator.
Labour practices and decent workDisclosure on the management approach. See Safety, skills and a culture of delivery, page 22.
EmploymentLA1 Total workforce by employment type,
employment contract and region.See Employee profile, page 24.
LA2 Total number and rate of employee turnover by age group, gender and region.
See Employee turnover, page 24.
LA3 Benefitsprovidedtofull-timeemployeesthatarenot provided to temporary or part-time employees, by major operation.
Transnet does not currently report on this indicator.
Labour/Management relationsLA4 Percentage of employees covered by collective
bargaining arrangements.See Employee relations, page 24.
LA5 Minimum notice period(s) regarding significant operational changes, including whether it is specified in collective agreements.
Transnet does not currently report on this indicator.
Occupational health and safetyLA6 Percentage of total workforce represented in
formal joint management-worker health and safety committees that help monitor and advise on occupational health and safety programmes.
Transnet does not currently report on this indicator.
LA7 Rates of injury, occupational diseases, lost days, absenteeism and total number of work-related fatalities, by region.
See Safety performance, page 22 and Absenteeism management, page 29.
LA8 Education, training, counselling, prevention and risk-control programmes in place to assist workforce members, their families, or community members regarding serious diseases.
See Employee wellness, page 29.
LA9 Healthandsafetytopicscoveredinformalagreements with trade unions.
Transnet has engaged with trade unions in order to establish more onsite facilitiesforonsiteHIV/Aidsvoluntarytestingandcounselling.
Training and educationLA10 Average hours of training per year per employee
by category.Transnet spends 3% of its personnel spend on training. See Total investment in training graphs, page 27.
LA11 Programmes for skills management and lifelong learning that support the continued employability of employees and assist them in managing their careers.
Transnet spend 3% of its personnel spend on training. See Total investment in training graphs, page 27. For further detail see IAR, page 94.
LA12 Percentage of employees receiving regular performance and career development reviews.
Transnet holds performance reviews and ‘talent forums’ across its Operating divisions in order to track its employee skills and talent, and maintain its succession pools.
59

Transnet GRI table 2011 (continued)
Gri G3 element reference as per 2011 sustainable Development reportDiversity and equal opportunityLA13 Composition of governance bodies and
breakdown of employees per category according to gender, age group, minority group membership, and other indicators of diversity.
See Governance section of IAR, page 54 and 92.
LA14 Ratio of basic salary of men to women by employee category.
Transnet does not currently report on this indicator.
Human rightsDisclosure management approach. Transnet’s Code of Ethics, which includes human rights, commits the
Company’s Directors and employees to the highest standards of behaviour when engaging with both internal and external stakeholders.
Investment and procurement activitiesHR1 Percentage and total number of significant
investment agreements that include human rights clauses or that have undergone human rights screening.
Transnetdoesnotcurrentlyreportonthisindicator.However,Transnet’sBoardAcquisitionandDisposalCommitteeoverseesitsprocurementpolicies and procedures, ensuring that they are legally compliant.
HR2 Percentage of significant suppliers and contractors that have undergone screening on human rights and actions taken.
Transnetdoesnotcurrentlyreportonthisindicator.However,allsuppliersand contractors are required to abide by the Supplier Code of Conduct, page 49), which is underpinned by various codes and policies prohibiting corrupt practices.
HR3 Total hours of employee training on policies and procedures concerning aspects of human rights that are relevant to operations, and percentage of employees that are trained.
Transnet does not currently report on this indicator.
Non-discriminationHR4 Total number of incidents of discrimination and
actions taken.Transnetdoesnotcurrentlyreportonthisindicator.However,Transnet’sEmployment Equity (EE) Plan, page 25, articulates the organisation’s continued commitment to the elimination of unfair discrimination.
Freedom of association and collective bargainingHR5 Operations identified in which the right to
exercise freedom of association or collective bargaining may be at significant risk, and actions taken to support these rights.
No such operations were identified. Transnet’s employee profile reflects a high level of unionisation (79%), with labour unions comprising a major stakeholder with whom Transnet engages.
Child labourHR6 Operations identified as having significant risk
for incidents of child labour, and measures taken to contribute to the elimination of child labour.
Transnet does not make use of child labour.
Forced and compulsory labourHR7 Operations identified as having significant risk
for incidents of forced or compulsory labour, and measures taken to contribute to the elimination of forced or compulsory labour.
Transnet does not make use of compulsory or forced labour.
Security practicesHR8 Percentage of security personnel trained in the
organisation’s policies or procedures concerning aspects of human rights that are relevant to operations.
Humanrightstrainingofsecuritypersonnelhassuccessfullybeenimplemented in TNPA, TPT and partially in TFR. An estimated 75% of employees have been trained, with the balance to be concluded by end June2011.
Indigenous rightsHR9 Total number of incidents of violations involving
rights of indigenous people and actions taken. Transnetdoesnotcurrentlyreportonthisindicator.However,‘DignityandRespect’, which includes cultural tolerance is a core behaviour of Transnet’s Culture Charter – an indicator which is scored yearly, with organisation-wide initiatives initiated, when performance gaps are found.
SocietyDisclosure management approach. See Community impacts and Corporate social investment, page 54, Public
policy engagement, page 50, Compliance and regulatory environment, page 18, Fraud, page 17.
CommunitySO1 Nature, scope, and effectiveness of any
programmes and practices that assess and manage the impacts of operations on communities, including entering, operating, and exiting.
See Community impacts and Corporate social investment, page 54.
Transnet SOC Ltd Sustainable Development Report 201160
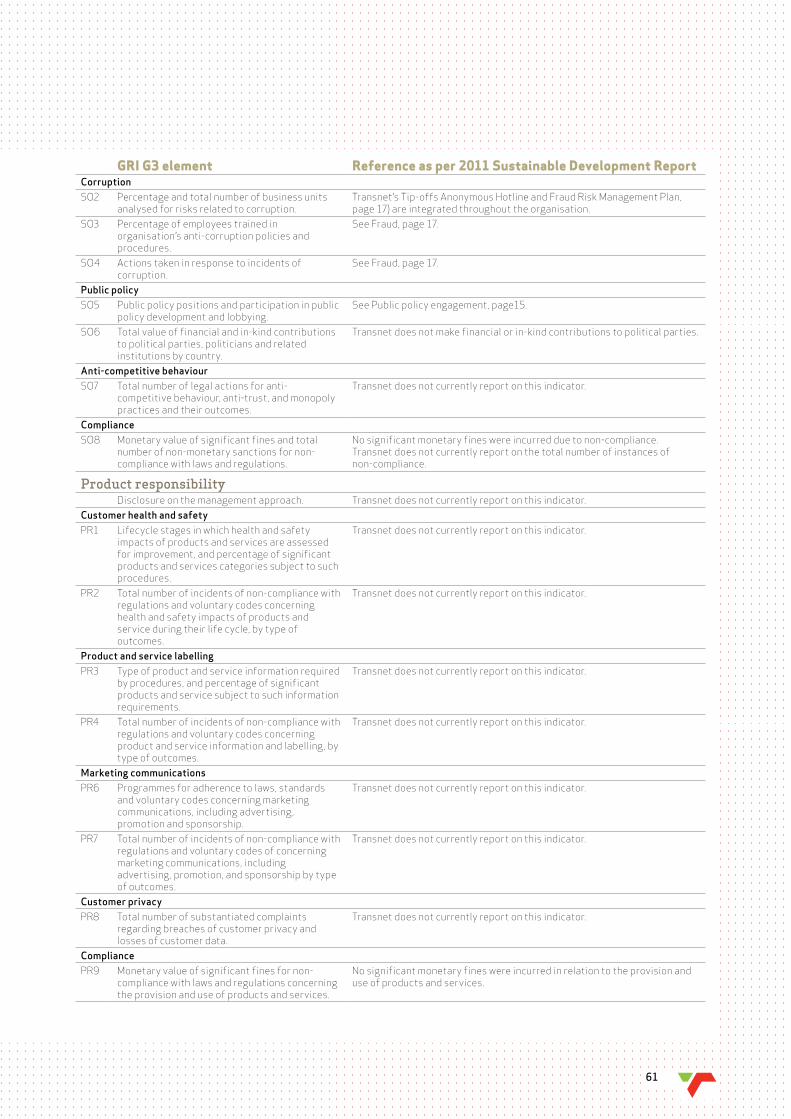
Gri G3 element reference as per 2011 sustainable Development reportCorruptionSO2 Percentage and total number of business units
analysed for risks related to corruption.Transnet’sTip-offsAnonymousHotlineandFraudRiskManagementPlan,page 17) are integrated throughout the organisation.
SO3 Percentage of employees trained in organisation’s anti-corruption policies and procedures.
See Fraud, page 17.
SO4 Actions taken in response to incidents of corruption.
See Fraud, page 17.
Public policySO5 Public policy positions and participation in public
policy development and lobbying.See Public policy engagement, page15.
SO6 Total value of financial and in-kind contributions to political parties, politicians and related institutions by country.
Transnet does not make financial or in-kind contributions to political parties.
Anti-competitive behaviourSO7 Total number of legal actions for anti-
competitive behaviour, anti-trust, and monopoly practices and their outcomes.
Transnet does not currently report on this indicator.
ComplianceSO8 Monetary value of significant fines and total
number of non-monetary sanctions for non-compliance with laws and regulations.
No significant monetary fines were incurred due to non-compliance. Transnet does not currently report on the total number of instances of non-compliance.
Product responsibilityDisclosure on the management approach. Transnet does not currently report on this indicator.
Customer health and safetyPR1 Lifecycle stages in which health and safety
impacts of products and services are assessed for improvement, and percentage of significant products and services categories subject to such procedures.
Transnet does not currently report on this indicator.
PR2 Total number of incidents of non-compliance with regulations and voluntary codes concerning health and safety impacts of products and service during their life cycle, by type of outcomes.
Transnet does not currently report on this indicator.
Product and service labellingPR3 Type of product and service information required
by procedures, and percentage of significant products and service subject to such information requirements.
Transnet does not currently report on this indicator.
PR4 Total number of incidents of non-compliance with regulations and voluntary codes concerning product and service information and labelling, by type of outcomes.
Transnet does not currently report on this indicator.
Marketing communicationsPR6 Programmes for adherence to laws, standards
and voluntary codes concerning marketing communications, including advertising, promotion and sponsorship.
Transnet does not currently report on this indicator.
PR7 Total number of incidents of non-compliance with regulations and voluntary codes of concerning marketing communications, including advertising, promotion, and sponsorship by type of outcomes.
Transnet does not currently report on this indicator.
Customer privacyPR8 Total number of substantiated complaints
regarding breaches of customer privacy and losses of customer data.
Transnet does not currently report on this indicator.
CompliancePR9 Monetary value of significant fines for non-
compliance with laws and regulations concerning the provision and use of products and services.
No significant monetary fines were incurred in relation to the provision and use of products and services.
61
Transnet SOC Ltd47th floor, Carlton Centre150 Commissioner StreetJohannesburg, 2001www.transnet.net


![TRANSNET SOC LTD Notices/90 19 CT … · TRANSNET SOC LTD Registration Number 1990/000900/30 [hereinafter referred to as Transnet] REQUEST FOR QUOTATION [RFQ] No. TPT CT 90/19 FOR](https://img.pdfslide.net/doc/110x75/5f09352f7e708231d425bc27/transnet-soc-ltd-notices90-19-ct-transnet-soc-ltd-registration-number-199000090030.jpg)

![a division of TRANSNET SOC LTD - transnetfreightrail.co.za · a division of TRANSNET SOC LTD Registration Number 1990/000900/30 [hereinafter referred to as Transnet] ... Page 2 of](https://img.pdfslide.net/doc/110x75/5ae841f17f8b9a08778f796a/a-division-of-transnet-soc-ltd-division-of-transnet-soc-ltd-registration-number.jpg)
![Transnet]...TRANSNET FRAIGHT RAIL, a division of TRANSNET SOC LTD Registration Number 1990/000900/30 [thereinafter referred to as Transnet] REQUEST FOR QUOTATION …](https://img.pdfslide.net/doc/110x75/6050751b455b0f3d741c0d14/transnet-transnet-fraight-rail-a-division-of-transnet-soc-ltd-registration.jpg)

![Transnet Port Terminals...Template RFQ without LC April 2020 Transnet Port Terminals An Operating Division of TRANSNET SOC LTD REQUEST FOR QUOTATION [RFQ] TPT SLD 51/20 PROVISION OF](https://img.pdfslide.net/doc/110x75/5fb1362f5130d044904936f2/transnet-port-terminals-template-rfq-without-lc-april-2020-transnet-port-terminals.jpg)
![TRANSNET PORT TERMINALS Notices... · TRANSNET PORT TERMINALS An Operating Division of TRANSNET SOC LTD [Hereinafter referred to as Transnet] Registration Number 1990/000900/30 REQUEST](https://img.pdfslide.net/doc/110x75/600560c52af56b6cdb7b80d6/transnet-port-notices-transnet-port-terminals-an-operating-division-of-transnet.jpg)
![TRANSNET SOC LTD Tenders/RFP GSM-13-10-0892...Transnet Integrated Supply Chain Management Template iSCM 12 [RFP for Services/PPPFA] Version April 2013 TRANSNET SOC LTD [Registration](https://img.pdfslide.net/doc/110x75/5e78c1e986075b48390a9c1b/transnet-soc-ltd-tendersrfp-gsm-13-10-0892-transnet-integrated-supply-chain.jpg)
![TRANSNET SOC LTD · request for quotation [rfq] no iclm hq 298/tpt . provision for basic assessment air emissions license saldanha bay multi-purpose terminal for transnet soc ltd](https://img.pdfslide.net/doc/110x75/5d3c00de88c99319308c2608/transnet-soc-ltd-request-for-quotation-rfq-no-iclm-hq-298tpt-provision.jpg)

![Transnet Port Terminal, a division of · Transnet Port Terminal, a division of TRANSNET SOC LTD Registration Number 1990/000900/30 [Hereinafter referred to as Transnet] REQUEST FOR](https://img.pdfslide.net/doc/110x75/5f5e4faa6b0e6821912b906b/transnet-port-terminal-a-division-of-transnet-port-terminal-a-division-of-transnet.jpg)


![TRANSNET SOC LTD Registration Number 1990/000900/30 ... · TRANSNET SOC LTD . Registration Number 1990/000900/30 [hereinafter referred to as Transnet] REQUEST FOR QUOTATION [RFQ]](https://img.pdfslide.net/doc/110x75/5ecfff24d3ee0724a0699820/transnet-soc-ltd-registration-number-199000090030-transnet-soc-ltd-registration.jpg)
![TRANSNET SOC LTD Transnet] ONLY · 10 Specification/Scope of Work ... Locomotive movement facility . Main Infrastructure: PREVIEW COPY ... • Workshop • Offices](https://img.pdfslide.net/doc/110x75/5ada130c7f8b9a137f8cf587/transnet-soc-ltd-transnet-specificationscope-of-work-locomotive-movement-facility.jpg)

![TRANSNET SOC LTD · 2020-06-01 · transnet soc ltd registration number 1990/000900/30 [hereinafter referred to as transnet] request for quotation [rfq] no: tpt sld 11/20 for the](https://img.pdfslide.net/doc/110x75/5f09352b7e708231d425bc17/transnet-soc-ltd-2020-06-01-transnet-soc-ltd-registration-number-199000090030.jpg)