Embed Size (px)
Citation preview
CULTURAL RELEVANCE AND SWPBIS
Rob Horner, Bob Algozzine, Scott Ross, and Cayce McCamish
2012 National PBIS Leadership Forum
October 18, 2012

WELCOME
Maximizing Your Session Participation
Work with your team
Consider 4 questions:
– Where are we in our implementation?– What do I hope to learn?– What did I learn?– What will I do with what I learned?
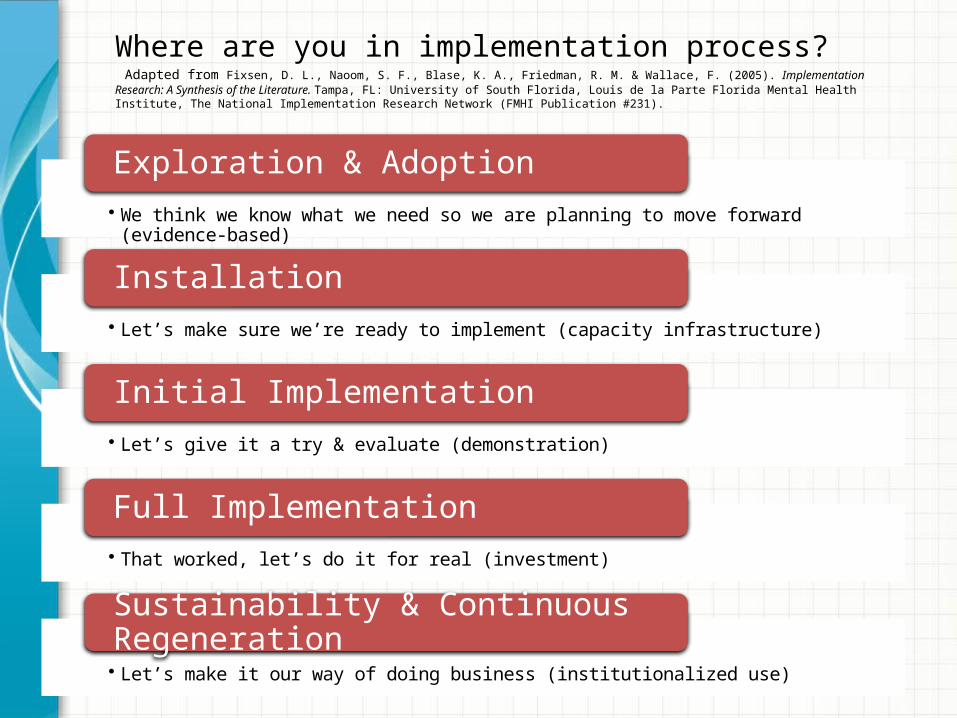
Where are you in implementation process? Adapted from Fixsen, D. L., Naoom, S. F., Blase, K. A., Friedman, R. M. & Wallace, F. (2005). Implementation Research: A Synthesis of the Literature. Tampa, FL: University of South Florida, Louis de la Parte Florida Mental Health Institute, The National Implementation Research Network (FMHI Publication #231).
• We think we know what we need so we are planning to move forward (evidence-based)
Exploration & Adoption
• Let’s make sure we’re ready to implement (capacity infrastructure)
Installation
• Let’s give it a try & evaluate (demonstration)
Initial Implementation
• That worked, let’s do it for real (investment)
Full Implementation
• Let’s make it our way of doing business (institutionalized use)
Sustainability & Continuous Regeneration
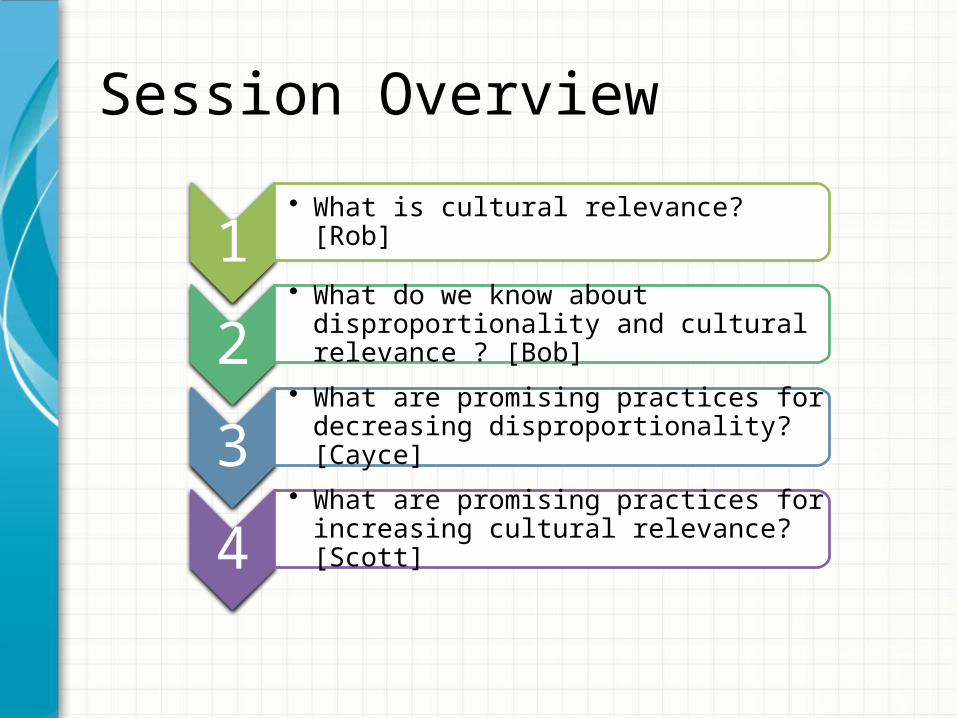
1• What is cultural relevance? [Rob]
2• What do we know about disproportionality
and cultural relevance ? [Bob]
3• What are promising practices for decreasing
disproportionality? [Cayce]
4• What are promising practices for increasing
cultural relevance? [Scott]
Session Overview
WHAT IS CULTURAL RELEVANCE AND
DISPROPORTIONALITY?
Culture/ Cultural Relevance/ Disproportionality
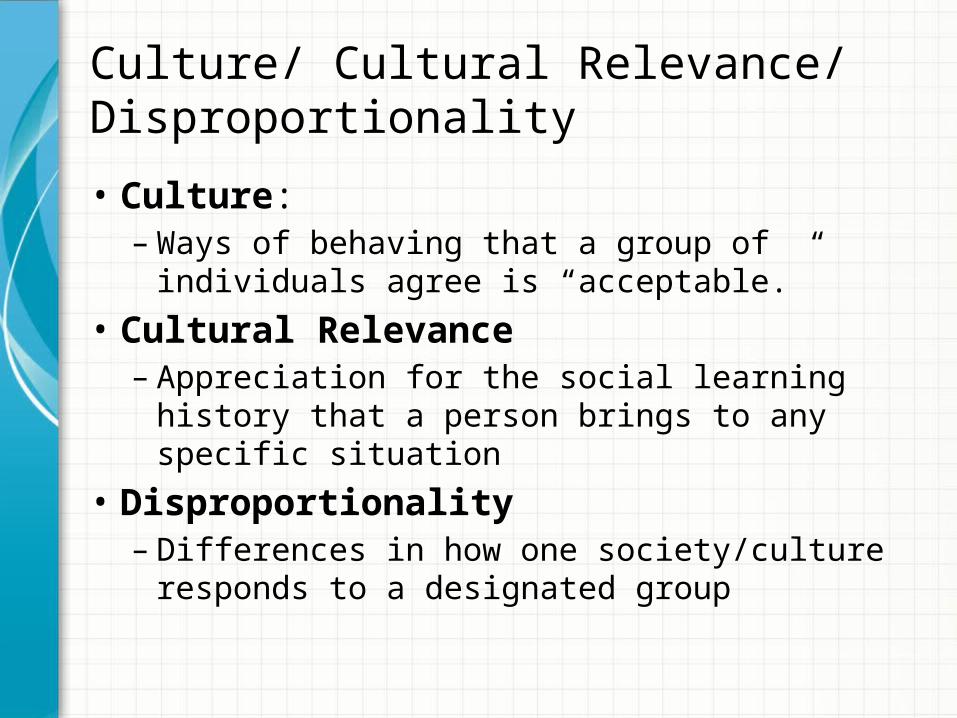
• Culture: – Ways of behaving that a group of individuals agree
is “acceptable.”• Cultural Relevance
– Appreciation for the social learning history that a person brings to any specific situation
• Disproportionality– Differences in how one society/culture responds
to a designated group
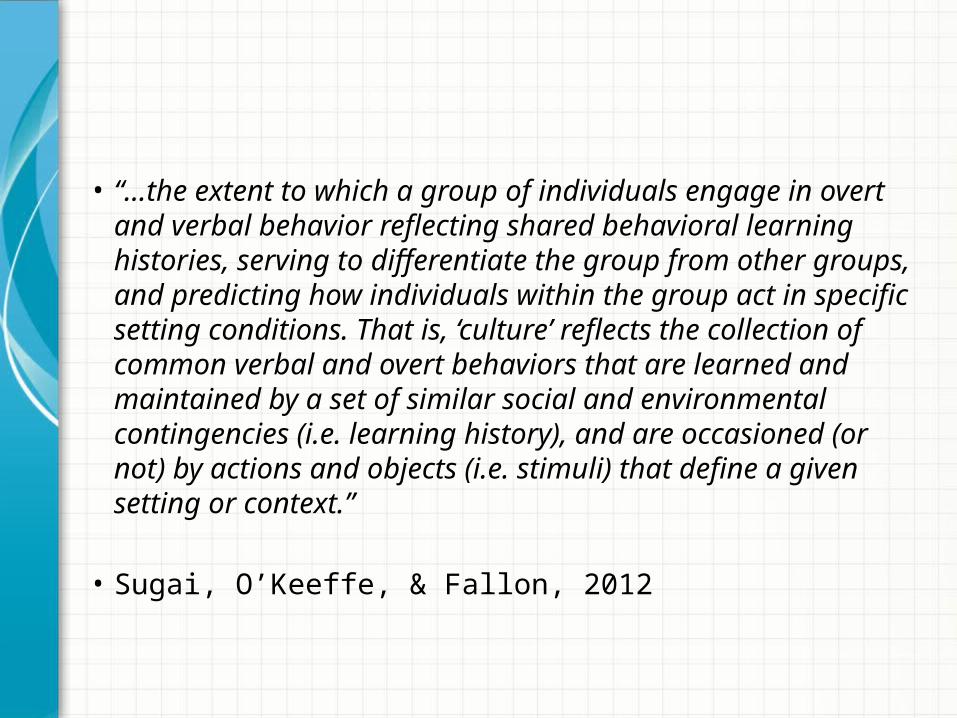
• “…the extent to which a group of individuals engage in overt and verbal behavior reflecting shared behavioral learning histories, serving to differentiate the group from other groups, and predicting how individuals within the group act in specific setting conditions. That is, ‘culture’ reflects the collection of common verbal and overt behaviors that are learned and maintained by a set of similar social and environmental contingencies (i.e. learning history), and are occasioned (or not) by actions and objects (i.e. stimuli) that define a given setting or context.”
• Sugai, O’Keeffe, & Fallon, 2012
Importance for SWPBIS
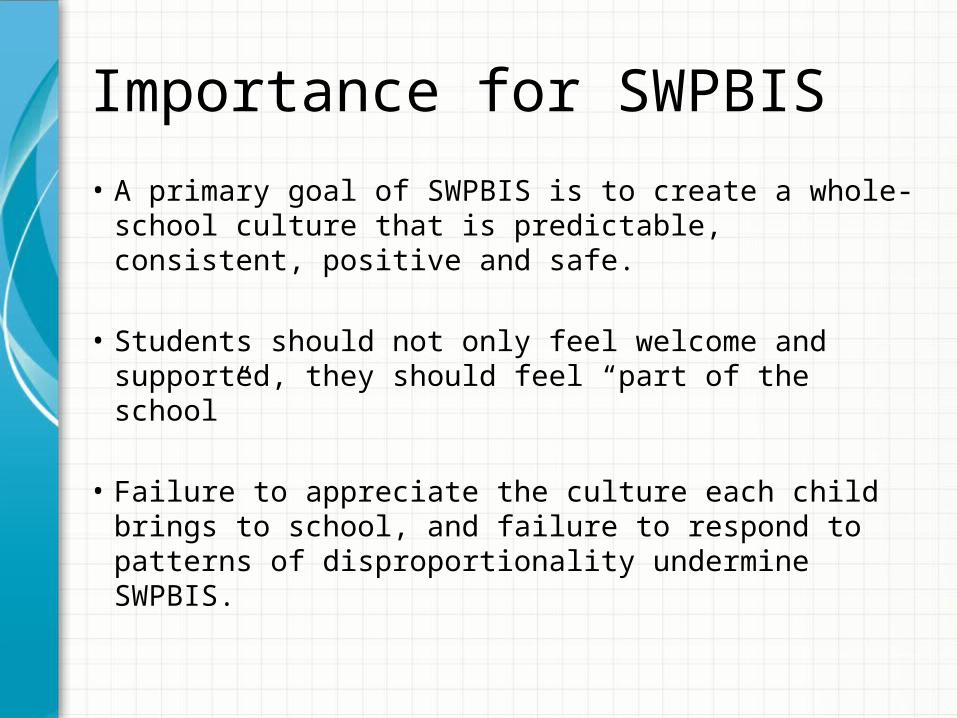
• A primary goal of SWPBIS is to create a whole-school culture that is predictable, consistent, positive and safe.
• Students should not only feel welcome and supported, they should feel “part of the school”
• Failure to appreciate the culture each child brings to school, and failure to respond to patterns of disproportionality undermine SWPBIS.
WHAT DO WE KNOW ABOUT
DISPROPORTIONALITY AND CULTURAL RELEVANCE?
Information provided is generalization and application to individual case requires verification.
Every school, district, and state has different needs, none of which was the basis for this presentation.
Implementation of any intervention must be tailored to school, district, and state needs and its impact verified with data.
Disclaimer
Do we have a problem? What is our goal for improvement? How are we going to address the problem? Was solution implemented with fidelity? Was desired goal achieved? Has the problem been solved?
Team-Initiated Problem Solving
WHAT DO WE KNOW ABOUT DISPROPORTIONALITY AND
CULTURAL RELEVANCE?
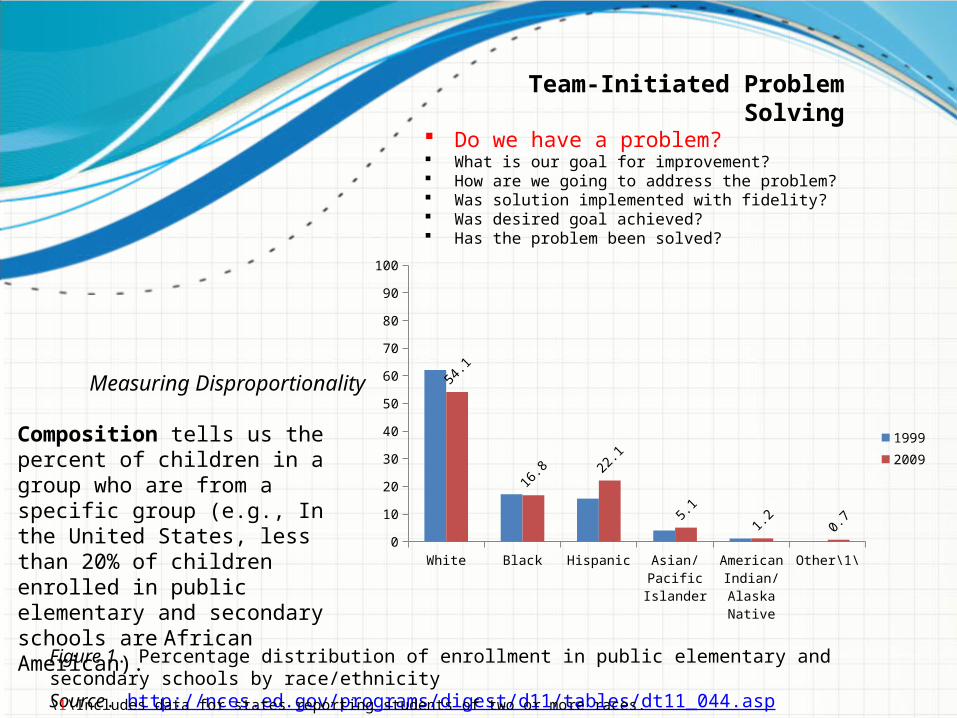
Figure 1. Percentage distribution of enrollment in public elementary and secondary schools by race/ethnicitySource. http://nces.ed.gov/programs/digest/d11/tables/dt11_044.asp
White
Black
Hispan
ic
Asian/ P
acific Is
lander
American
Indian
/ Alas
ka Nati
ve
Other\1\
0
10
20
30
40
50
60
70
80
90
100
54.1
16.8 22.1
5.11.2 0.7
19992009
\1\Includes data for states reporting students of two or more races.
Measuring Disproportionality
Composition tells us the percent of children in a group who are from a specific group (e.g., In the United States, less than 20% of children enrolled in public elementary and secondary schools are African American).
Team-Initiated Problem Solving Do we have a problem? What is our goal for improvement? How are we going to address the problem? Was solution implemented with fidelity? Was desired goal achieved? Has the problem been solved?
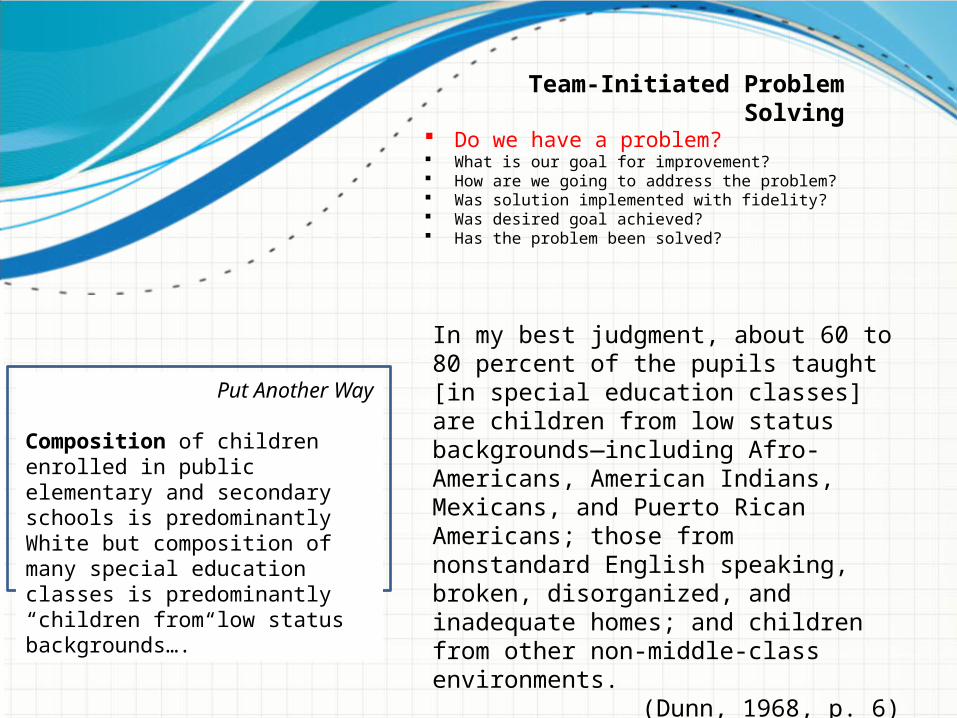
In my best judgment, about 60 to 80 percent of the pupils taught [in special education classes] are children from low status backgrounds—including Afro-Americans, American Indians, Mexicans, and Puerto Rican Americans; those from nonstandard English speaking, broken, disorganized, and inadequate homes; and children from other non-middle-class environments.
(Dunn, 1968, p. 6)
Put Another Way
Composition of children enrolled in public elementary and secondary schools is predominantly White but composition of many special education classes is predominantly “children from low status backgrounds….”
Team-Initiated Problem Solving Do we have a problem? What is our goal for improvement? How are we going to address the problem? Was solution implemented with fidelity? Was desired goal achieved? Has the problem been solved?
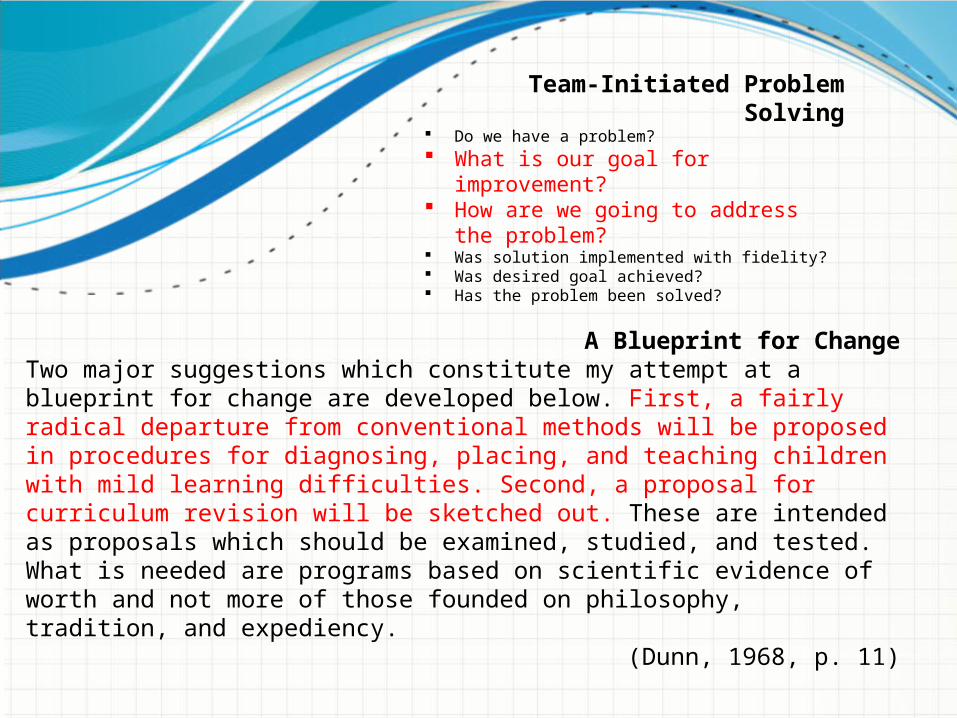
A Blueprint for ChangeTwo major suggestions which constitute my attempt at a blueprint for change are developed below. First, a fairly radical departure from conventional methods will be proposed in procedures for diagnosing, placing, and teaching children with mild learning difficulties. Second, a proposal for curriculum revision will be sketched out. These are intended as proposals which should be examined, studied, and tested. What is needed are programs based on scientific evidence of worth and not more of those founded on philosophy, tradition, and expediency.
(Dunn, 1968, p. 11)
Team-Initiated Problem Solving Do we have a problem? What is our goal for improvement? How are we going to address the problem? Was solution implemented with fidelity? Was desired goal achieved? Has the problem been solved?
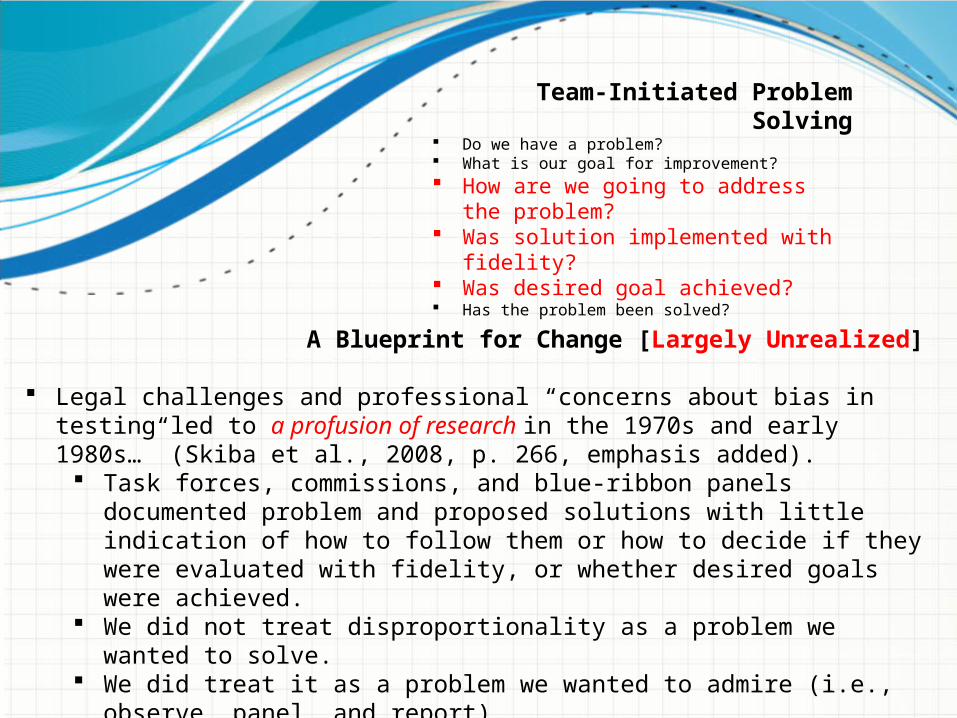
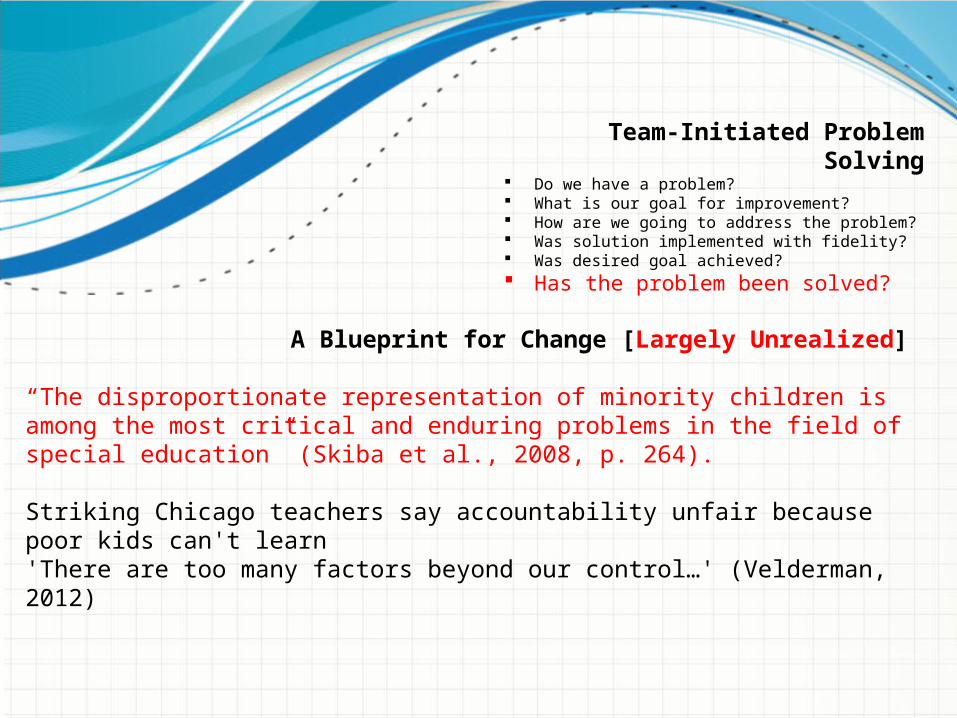
A Blueprint for Change [Largely Unrealized]
Legal challenges and professional “concerns about bias in testing led to a profusion of research in the 1970s and early 1980s…” (Skiba et al., 2008, p. 266, emphasis added).
Task forces, commissions, and blue-ribbon panels documented problem and proposed solutions with little indication of how to follow them or how to decide if they were evaluated with fidelity, or whether desired goals were achieved.
We did not treat disproportionality as a problem we wanted to solve. We did treat it as a problem we wanted to admire (i.e., observe, panel, and report).
Focus on documenting causes without solutions. Focus on documenting barriers to change without addressing them.
Team-Initiated Problem Solving Do we have a problem? What is our goal for improvement? How are we going to address the problem? Was solution implemented with fidelity? Was desired goal achieved? Has the problem been solved?
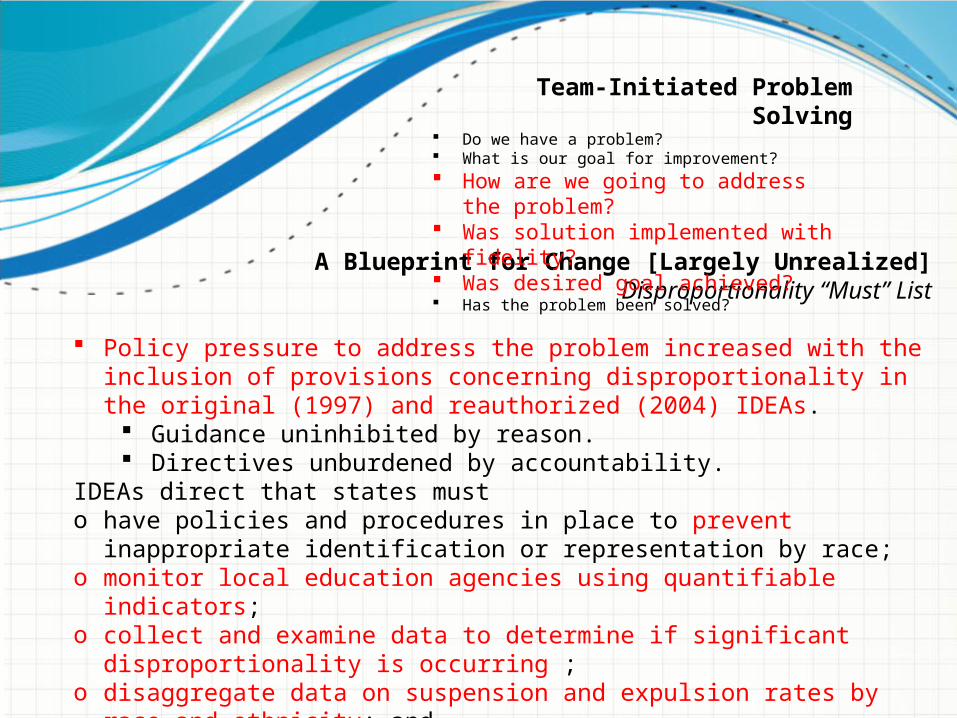
A Blueprint for Change [Largely Unrealized]Disproportionality “Must” List
Policy pressure to address the problem increased with the inclusion of provisions concerning disproportionality in the original (1997) and reauthorized (2004) IDEAs.
Guidance uninhibited by reason. Directives unburdened by accountability.
IDEAs direct that states musto have policies and procedures in place to prevent inappropriate identification or
representation by race; o monitor local education agencies using quantifiable indicators; o collect and examine data to determine if significant disproportionality is occurring ; o disaggregate data on suspension and expulsion rates by race and ethnicity; and, o provide for a review and, if appropriate, revision of policies, practices, and
procedures (cf. Dunn’s blueprint /curriculum revision dream).
Team-Initiated Problem Solving Do we have a problem? What is our goal for improvement? How are we going to address the problem? Was solution implemented with fidelity? Was desired goal achieved? Has the problem been solved?
A Blueprint for Change [Largely Unrealized]
“The disproportionate representation of minority children is among the most critical and enduring problems in the field of special education” (Skiba et al., 2008, p. 264).
Striking Chicago teachers say accountability unfair because poor kids can't learn'There are too many factors beyond our control…' (Velderman, 2012)
Team-Initiated Problem Solving Do we have a problem? What is our goal for improvement? How are we going to address the problem? Was solution implemented with fidelity? Was desired goal achieved? Has the problem been solved?
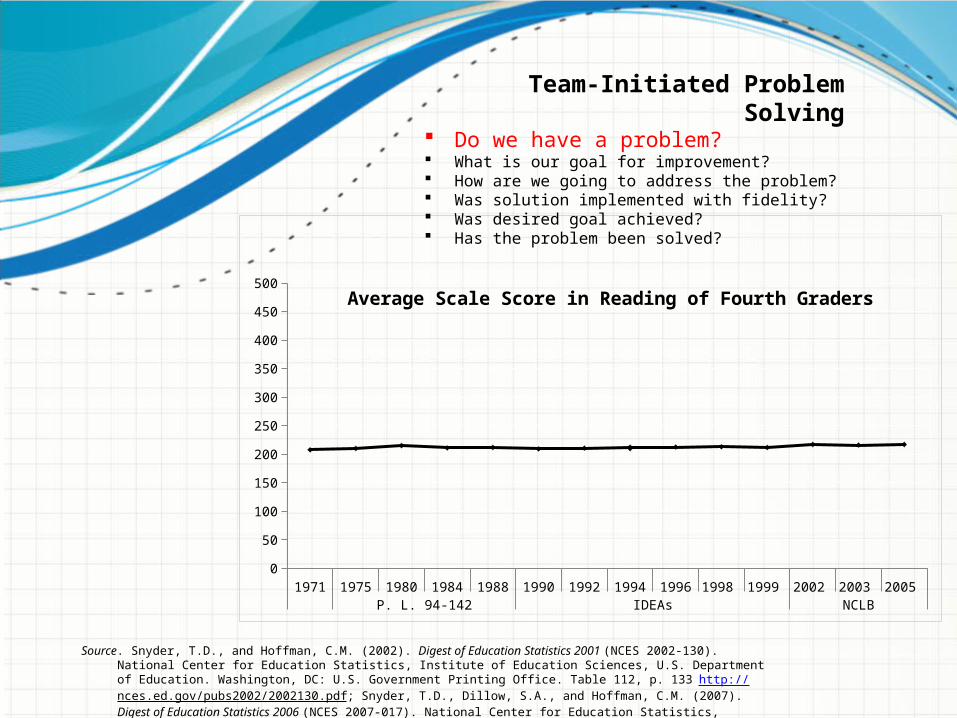
1971 1975 1980 1984 1988 1990 1992 1994 1996 1998 1999 2002 2003 2005 P. L. 94-142 IDEAs NCLB
0
50
100
150
200
250
300
350
400
450
500
Average Scale Score in Reading of Fourth Graders
Source. Snyder, T.D., and Hoffman, C.M. (2002). Digest of Education Statistics 2001 (NCES 2002-130). National Center for Education Statistics, Institute of Education Sciences, U.S. Department of Education. Washington, DC: U.S. Government Printing Office. Table 112, p. 133 http://nces.ed.gov/pubs2002/2002130.pdf; Snyder, T.D., Dillow, S.A., and Hoffman, C.M. (2007). Digest of Education Statistics 2006 (NCES 2007-017). National Center for Education Statistics, Institute of Education Sciences, U.S. Department of Education. Washington, DC: U.S. Government Printing Office. Table 114, pp. 180-181 http://nces.ed.gov/pubs2007/2007017.pdf
Team-Initiated Problem Solving Do we have a problem? What is our goal for improvement? How are we going to address the problem? Was solution implemented with fidelity? Was desired goal achieved? Has the problem been solved?
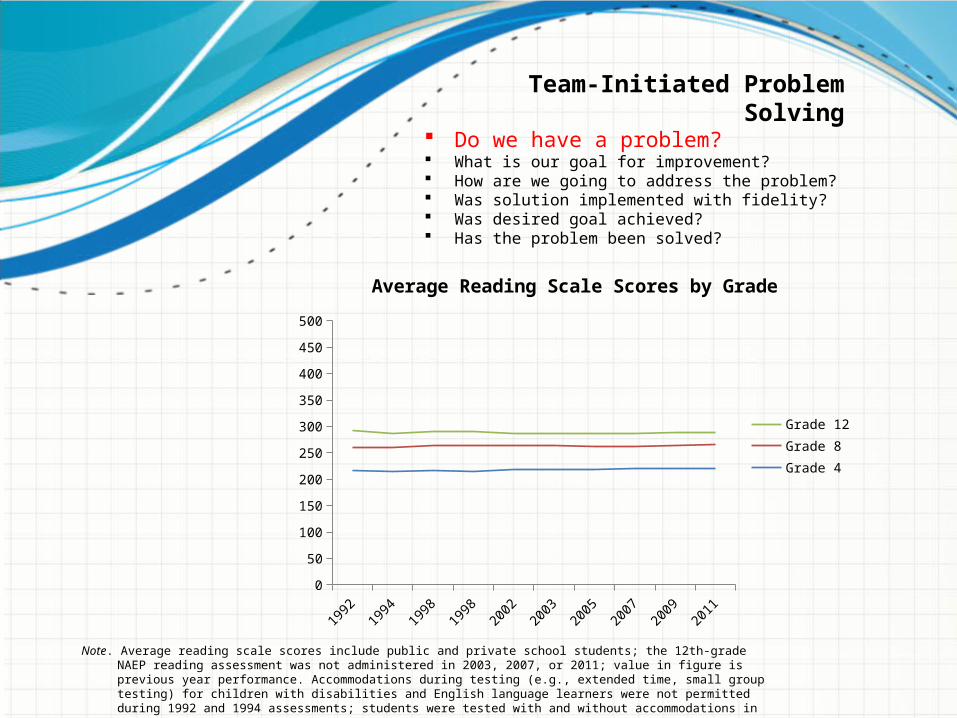
Note. Average reading scale scores include public and private school students; the 12th-grade NAEP reading assessment was not administered in 2003, 2007, or 2011; value in figure is previous year performance. Accommodations during testing (e.g., extended time, small group testing) for children with disabilities and English language learners were not permitted during 1992 and 1994 assessments; students were tested with and without accommodations in 1998.
Source. http://nces.ed.gov/programs/coe/tables/table-rd2-1.asp
19921994
19981998
20022003
20052007
20092011
0
50
100
150
200
250
300
350
400
450
500
Average Reading Scale Scores by Grade
Grade 12Grade 8Grade 4
Team-Initiated Problem Solving Do we have a problem? What is our goal for improvement? How are we going to address the problem? Was solution implemented with fidelity? Was desired goal achieved? Has the problem been solved?
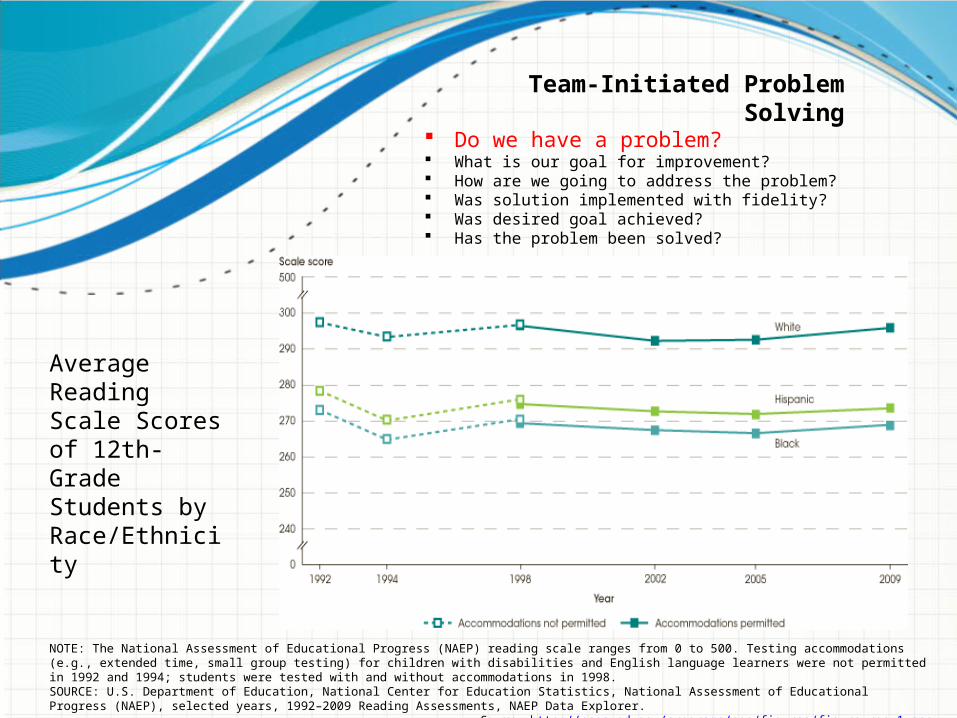
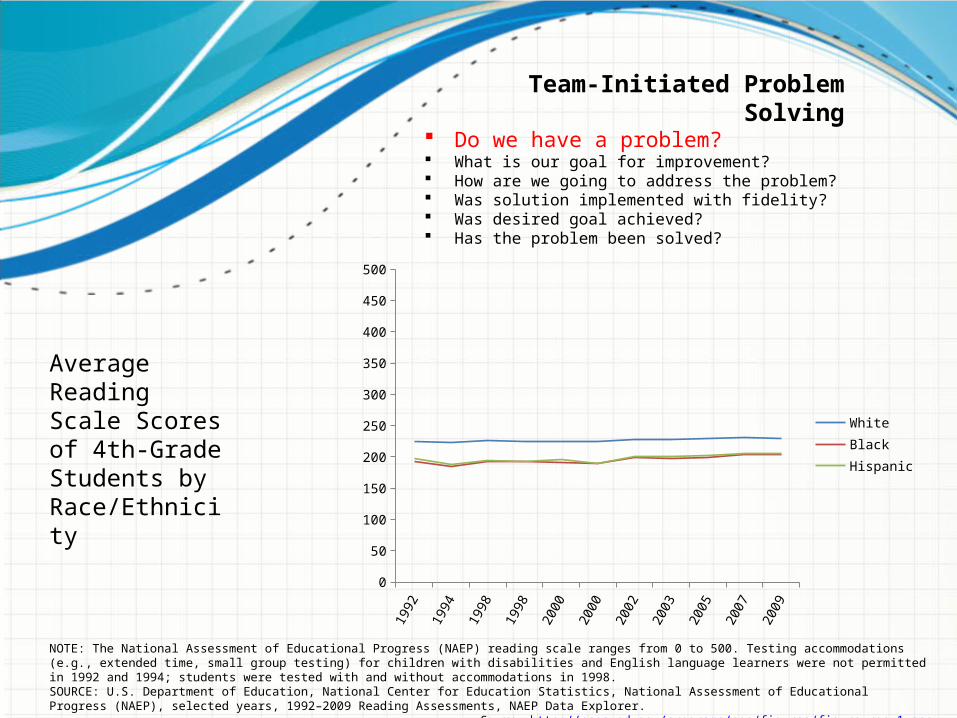
NOTE: The National Assessment of Educational Progress (NAEP) reading scale ranges from 0 to 500. Testing accommodations (e.g., extended time, small group testing) for children with disabilities and English language learners were not permitted in 1992 and 1994; students were tested with and without accommodations in 1998. SOURCE: U.S. Department of Education, National Center for Education Statistics, National Assessment of Educational Progress (NAEP), selected years, 1992–2009 Reading Assessments, NAEP Data Explorer.
Source. http://nces.ed.gov/programs/coe/figures/figure-rgp-1.asp
Team-Initiated Problem Solving Do we have a problem? What is our goal for improvement? How are we going to address the problem? Was solution implemented with fidelity? Was desired goal achieved? Has the problem been solved?
Average Reading Scale Scores of 12th-Grade Students by Race/Ethnicity
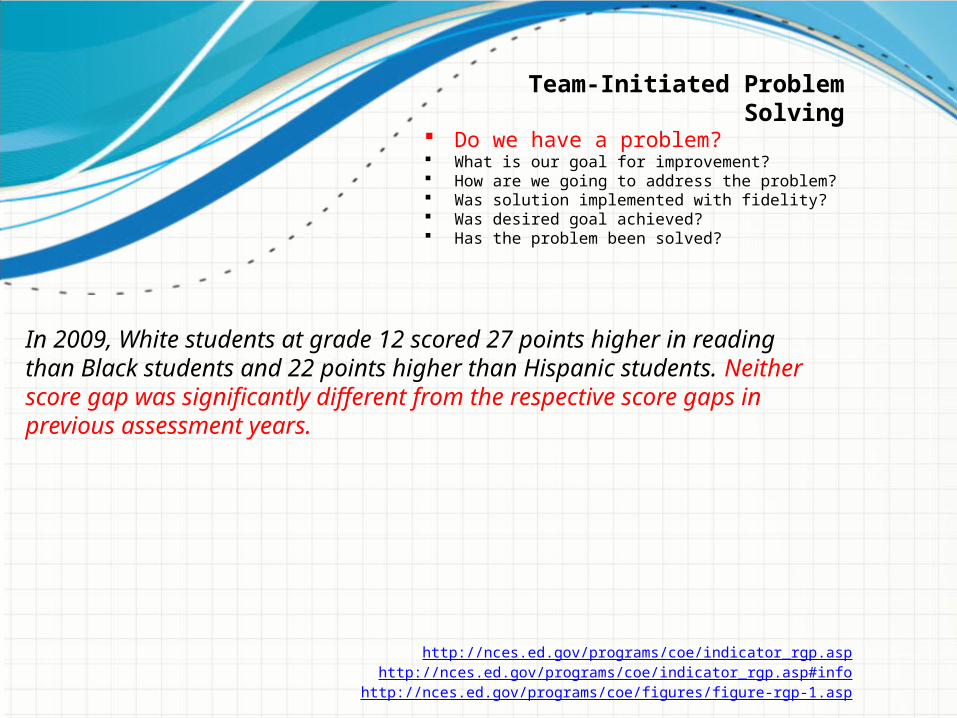
In 2009, White students at grade 12 scored 27 points higher in reading than Black students and 22 points higher than Hispanic students. Neither score gap was significantly different from the respective score gaps in previous assessment years.
Team-Initiated Problem Solving Do we have a problem? What is our goal for improvement? How are we going to address the problem? Was solution implemented with fidelity? Was desired goal achieved? Has the problem been solved?
http://nces.ed.gov/programs/coe/indicator_rgp.asphttp://nces.ed.gov/programs/coe/indicator_rgp.asp#info
http://nces.ed.gov/programs/coe/figures/figure-rgp-1.asp
NOTE: The National Assessment of Educational Progress (NAEP) reading scale ranges from 0 to 500. Testing accommodations (e.g., extended time, small group testing) for children with disabilities and English language learners were not permitted in 1992 and 1994; students were tested with and without accommodations in 1998. SOURCE: U.S. Department of Education, National Center for Education Statistics, National Assessment of Educational Progress (NAEP), selected years, 1992–2009 Reading Assessments, NAEP Data Explorer.
Source. http://nces.ed.gov/programs/coe/figures/figure-rgp-1.asp
1992
1994
1998
1998
2000
2000
2002
2003
2005
2007
2009
0
50
100
150
200
250
300
350
400
450
500
WhiteBlackHispanic
Team-Initiated Problem Solving Do we have a problem? What is our goal for improvement? How are we going to address the problem? Was solution implemented with fidelity? Was desired goal achieved? Has the problem been solved?
Average Reading Scale Scores of 4th-Grade Students by Race/Ethnicity
Parsing the Achievement Gap (I)Does research reveal relationships between life experiences and life conditions and cognitive development and achievement? (Barton, 2003) Yes
Are there differences in life experiences and life conditions among subgroups that mirror differences in cognitive development and achievement observed in schools? (Barton, 2003) Yes
Team-Initiated Problem Solving Do we have a problem? What is our goal for improvement? How are we going to address the problem? Was solution implemented with fidelity? Was desired goal achieved? Has the problem been solved?
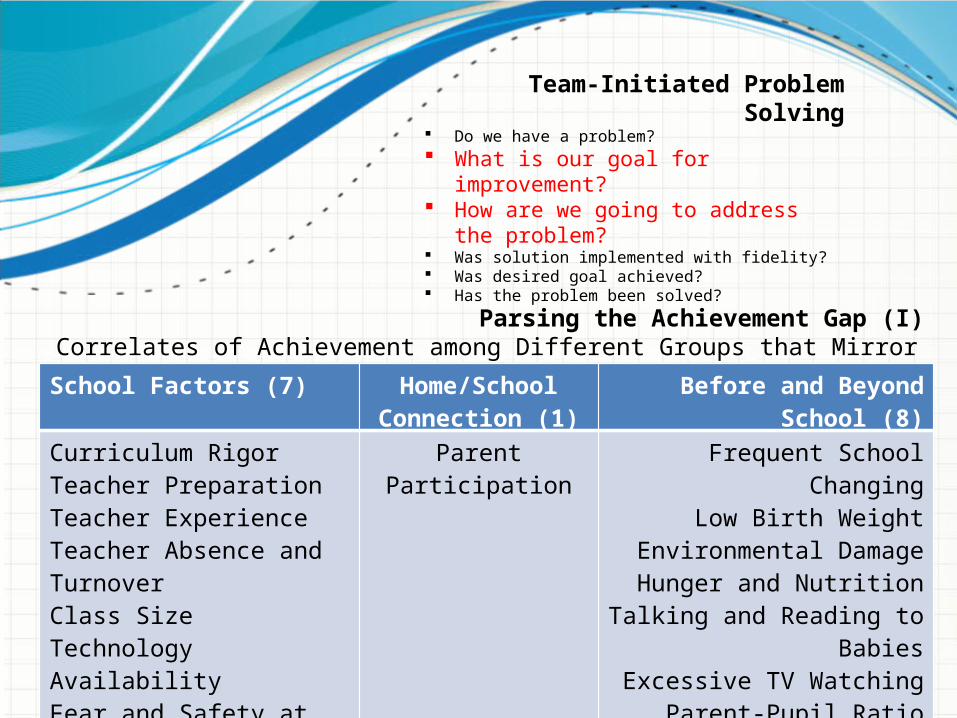
Parsing the Achievement Gap (I)Correlates of Achievement among Different Groups that Mirror Gaps in Achievement
Barton, P. E., (2003). Parsing the achievement gap: Baselines for tracking progress. Princeton, NJ: Educational Testing Service.Barton, P. E., & Coley, R. J. (2009). Parsing the achievement gap II. Princeton, NJ: Educational Testing Service.
Team-Initiated Problem Solving Do we have a problem? What is our goal for improvement? How are we going to address the problem? Was solution implemented with fidelity? Was desired goal achieved? Has the problem been solved?
School Factors (7) Home/School Connection (1)
Before and Beyond School (8)
Curriculum RigorTeacher PreparationTeacher ExperienceTeacher Absence and TurnoverClass SizeTechnology AvailabilityFear and Safety at School
Parent Participation Frequent School ChangingLow Birth Weight
Environmental DamageHunger and Nutrition
Talking and Reading to BabiesExcessive TV Watching
Parent-Pupil RatioSummer Achievement Lapse
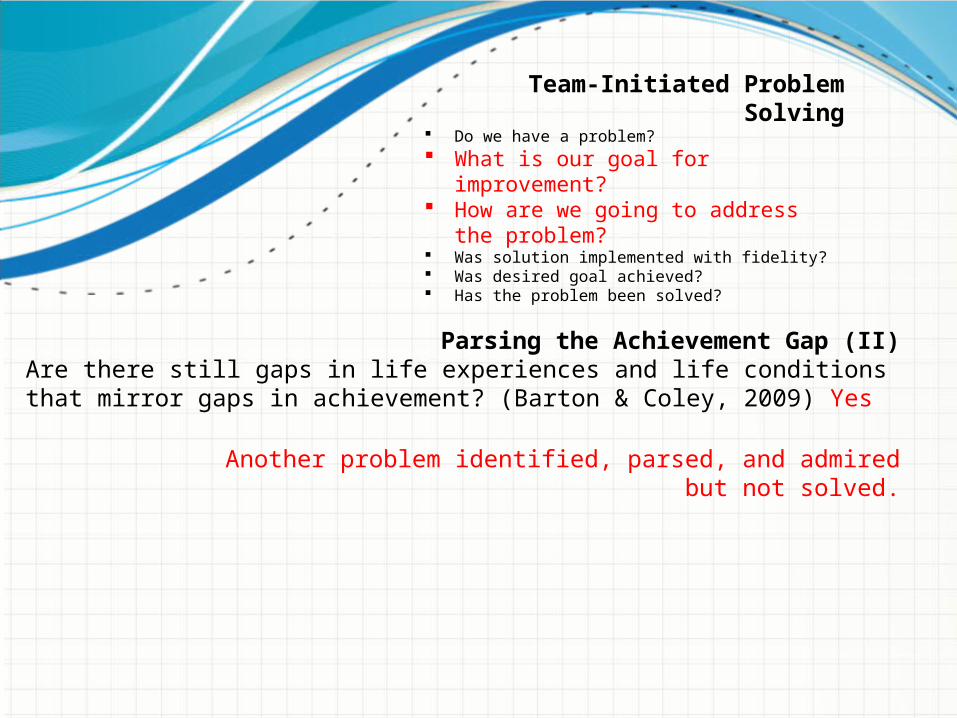
Parsing the Achievement Gap (II)Are there still gaps in life experiences and life conditions that mirror gaps in achievement? (Barton & Coley, 2009) Yes
Team-Initiated Problem Solving Do we have a problem? What is our goal for improvement? How are we going to address the problem? Was solution implemented with fidelity? Was desired goal achieved? Has the problem been solved?
Another problem identified, parsed, and admired but not solved.
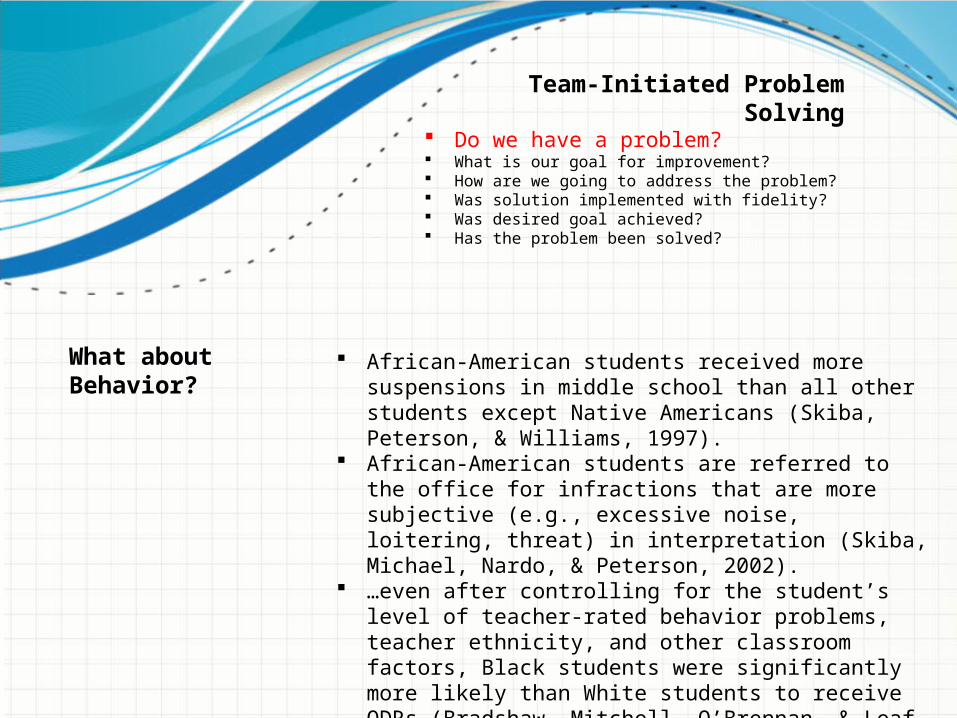
African-American students received more suspensions in middle school than all other students except Native Americans (Skiba, Peterson, & Williams, 1997).
African-American students are referred to the office for infractions that are more subjective (e.g., excessive noise, loitering, threat) in interpretation (Skiba, Michael, Nardo, & Peterson, 2002).
…even after controlling for the student’s level of teacher-rated behavior problems, teacher ethnicity, and other classroom factors, Black students were significantly more likely than White students to receive ODRs (Bradshaw, Mitchell, O’Brennan, & Leaf, 2010, p. 508).
What about Behavior?
Team-Initiated Problem Solving Do we have a problem? What is our goal for improvement? How are we going to address the problem? Was solution implemented with fidelity? Was desired goal achieved? Has the problem been solved?
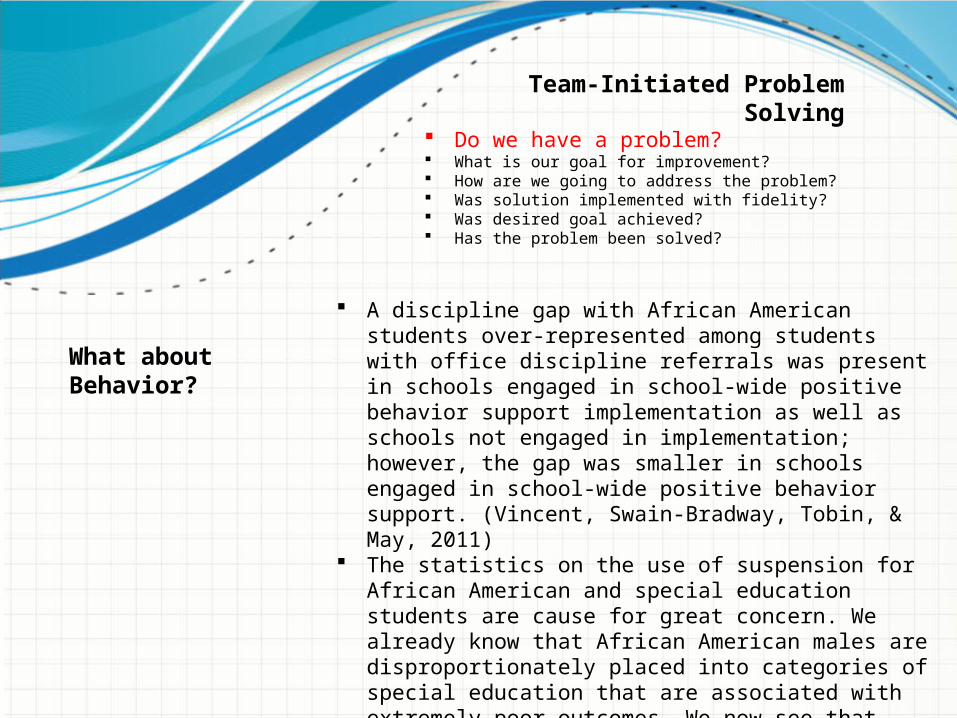
A discipline gap with African American students over-represented among students with office discipline referrals was present in schools engaged in school-wide positive behavior support implementation as well as schools not engaged in implementation; however, the gap was smaller in schools engaged in school-wide positive behavior support. (Vincent, Swain-Bradway, Tobin, & May, 2011)
The statistics on the use of suspension for African American and special education students are cause for great concern. We already know that African American males are disproportionately placed into categories of special education that are associated with extremely poor outcomes. We now see that these same students face incredibly high rates of suspension. (Orfield, 2012, p. 4)
What about Behavior?
Team-Initiated Problem Solving Do we have a problem? What is our goal for improvement? How are we going to address the problem? Was solution implemented with fidelity? Was desired goal achieved? Has the problem been solved?
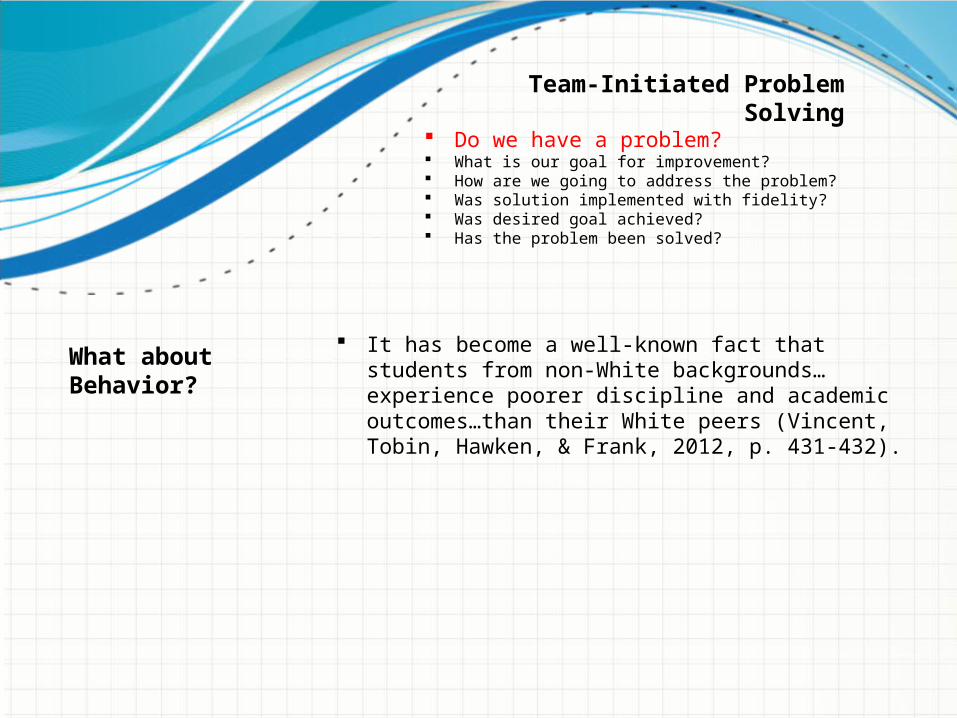
It has become a well-known fact that students from non-White backgrounds…experience poorer discipline and academic outcomes…than their White peers (Vincent, Tobin, Hawken, & Frank, 2012, p. 431-432).
What about Behavior?
Team-Initiated Problem Solving Do we have a problem? What is our goal for improvement? How are we going to address the problem? Was solution implemented with fidelity? Was desired goal achieved? Has the problem been solved?
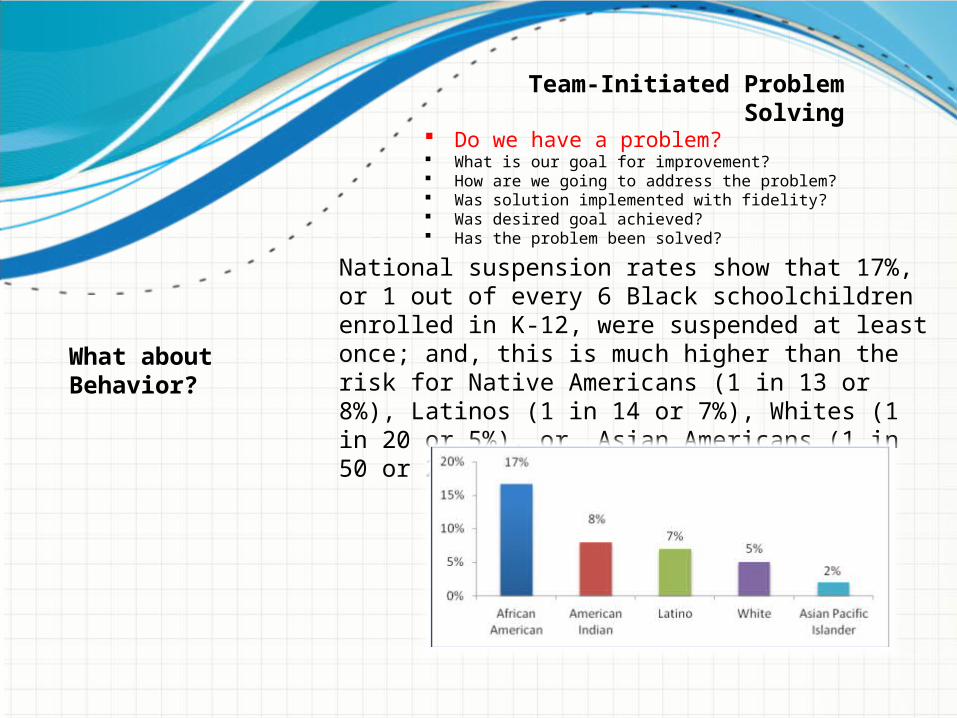
National suspension rates show that 17%, or 1 out of every 6 Black schoolchildren enrolled in K-12, were suspended at least once; and, this is much higher than the risk for Native Americans (1 in 13 or 8%), Latinos (1 in 14 or 7%), Whites (1 in 20 or 5%), or Asian Americans (1 in 50 or 2%). (Losen & Gillespie, 2012)
Team-Initiated Problem Solving Do we have a problem? What is our goal for improvement? How are we going to address the problem? Was solution implemented with fidelity? Was desired goal achieved? Has the problem been solved?
What about Behavior?
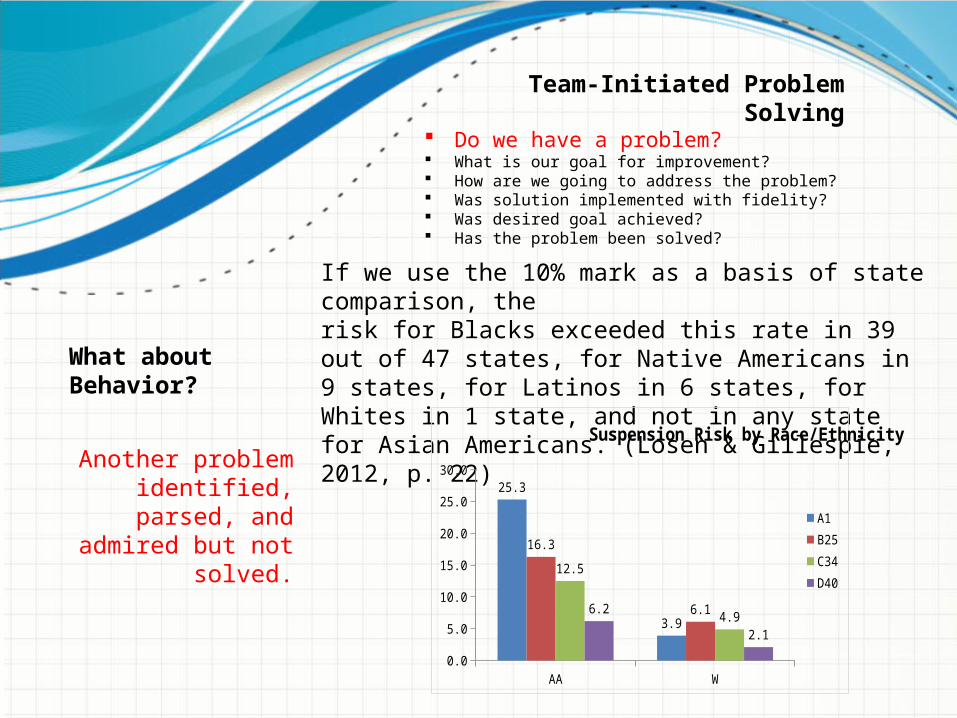
If we use the 10% mark as a basis of state comparison, therisk for Blacks exceeded this rate in 39 out of 47 states, for Native Americans in 9 states, for Latinos in 6 states, for Whites in 1 state, and not in any state for Asian Americans. (Losen & Gillespie, 2012, p. 22)
AA W0.0
5.0
10.0
15.0
20.0
25.0
30.0
25.3
3.9
16.3
6.1
12.5
4.96.2
2.1
Suspension Risk by Race/Ethnicity
A1B25C34D40
Team-Initiated Problem Solving Do we have a problem? What is our goal for improvement? How are we going to address the problem? Was solution implemented with fidelity? Was desired goal achieved? Has the problem been solved?
What about Behavior?
Another problem identified, parsed, and
admired but not solved.
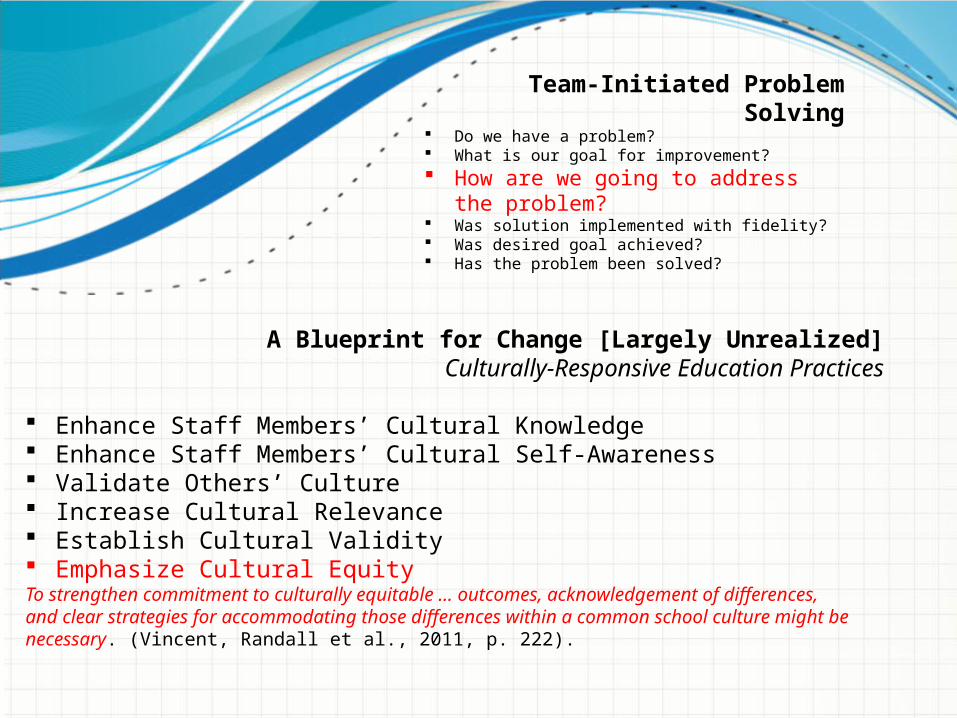
A Blueprint for Change [Largely Unrealized]Culturally-Responsive Education Practices
Enhance Staff Members’ Cultural Knowledge Enhance Staff Members’ Cultural Self-Awareness Validate Others’ Culture Increase Cultural Relevance Establish Cultural Validity Emphasize Cultural EquityTo strengthen commitment to culturally equitable … outcomes, acknowledgement of differences,and clear strategies for accommodating those differences within a common school culture might be necessary. (Vincent, Randall et al., 2011, p. 222).
Team-Initiated Problem Solving Do we have a problem? What is our goal for improvement? How are we going to address the problem? Was solution implemented with fidelity? Was desired goal achieved? Has the problem been solved?
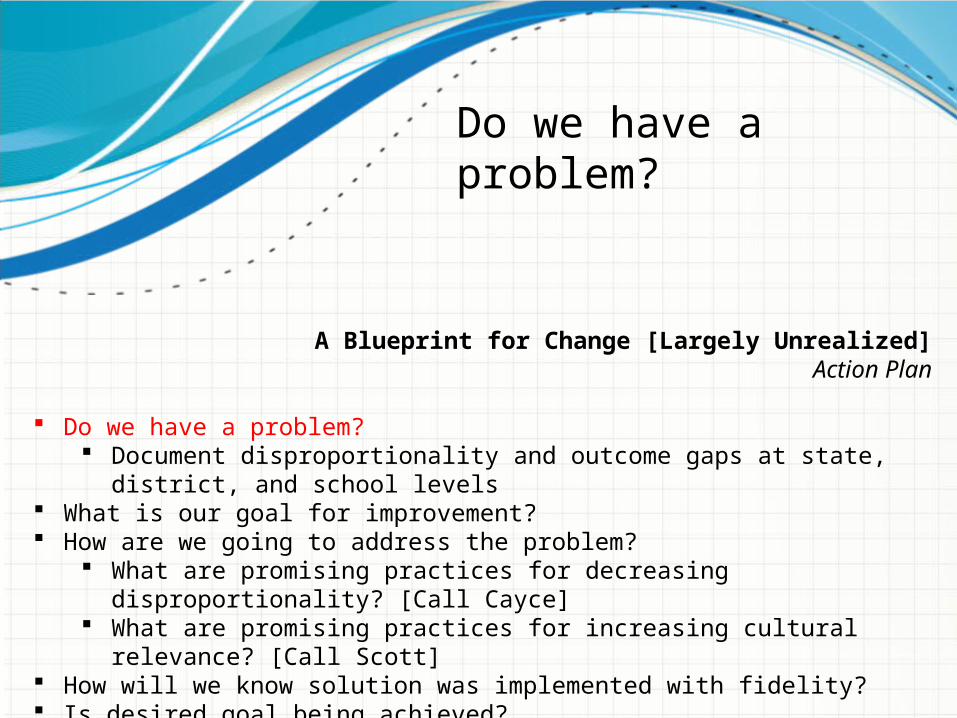
Do we have a problem?
A Blueprint for Change [Largely Unrealized]Action Plan
Do we have a problem? Document disproportionality and outcome gaps at state, district, and school levels
What is our goal for improvement? How are we going to address the problem?
What are promising practices for decreasing disproportionality? [Call Cayce] What are promising practices for increasing cultural relevance? [Call Scott]
How will we know solution was implemented with fidelity? Is desired goal being achieved? Has the problem been solved?
WHAT ARE PROMISING PRACTICES FOR
DECREASING DISPROPORTIONALITY?
Discipline Disproportionality and Promising Practices for Increasing Cultural
Relevance
Cayce McCamish, M.S., Ed. S.
Overview
• Disciplinary disproportionality and the Organization of Power
• Grounding this presentation• Color-blind Racism• Framework for investigating and problem-
solving disciplinary disproportionality
Disciplinary Disproportionality and the Organization of Power
• One school• Methods:
– Comprehensive disciplinary data analysis– Disciplinary policy crosswalk– Whole-school staff survey*– 7 staff member interviews
*staff members were asked to offer responses about the whole school
Grounding this Presentation
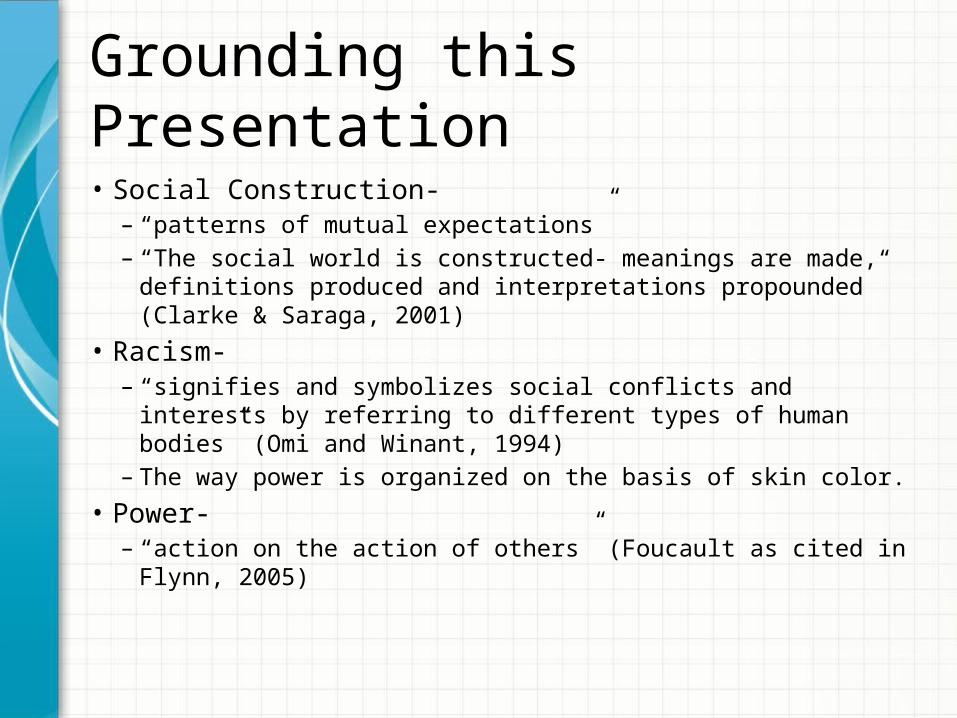
• Social Construction- – “patterns of mutual expectations”– “The social world is constructed- meanings are made, definitions
produced and interpretations propounded” (Clarke & Saraga, 2001)• Racism-
– “signifies and symbolizes social conflicts and interests by referring to different types of human bodies” (Omi and Winant, 1994)
– The way power is organized on the basis of skin color.• Power-
– “action on the action of others” (Foucault as cited in Flynn, 2005)
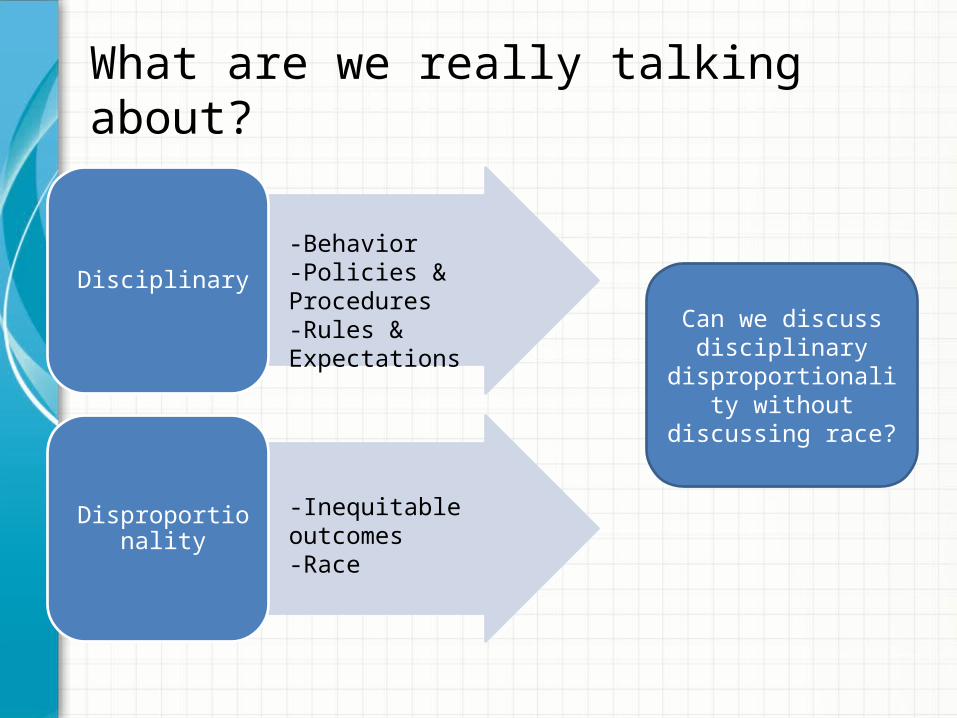
What are we really talking about?
Disciplinary
Disproportionality
Can we discuss disciplinary
disproportionality without discussing
race?
-Behavior-Policies & Procedures-Rules & Expectations
-Inequitable outcomes-Race
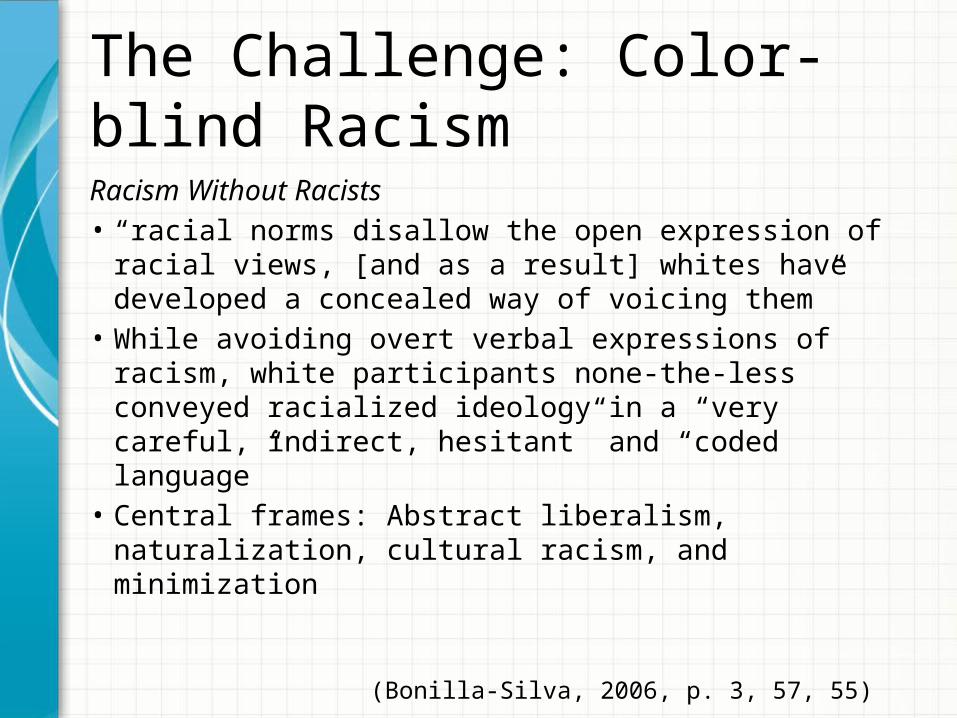
The Challenge: Color-blind Racism
Racism Without Racists• “racial norms disallow the open expression of racial
views, [and as a result] whites have developed a concealed way of voicing them”
• While avoiding overt verbal expressions of racism, white participants none-the-less conveyed racialized ideology in a “very careful, indirect, hesitant” and “coded language”
• Central frames: Abstract liberalism, naturalization, cultural racism, and minimization
(Bonilla-Silva, 2006, p. 3, 57, 55)
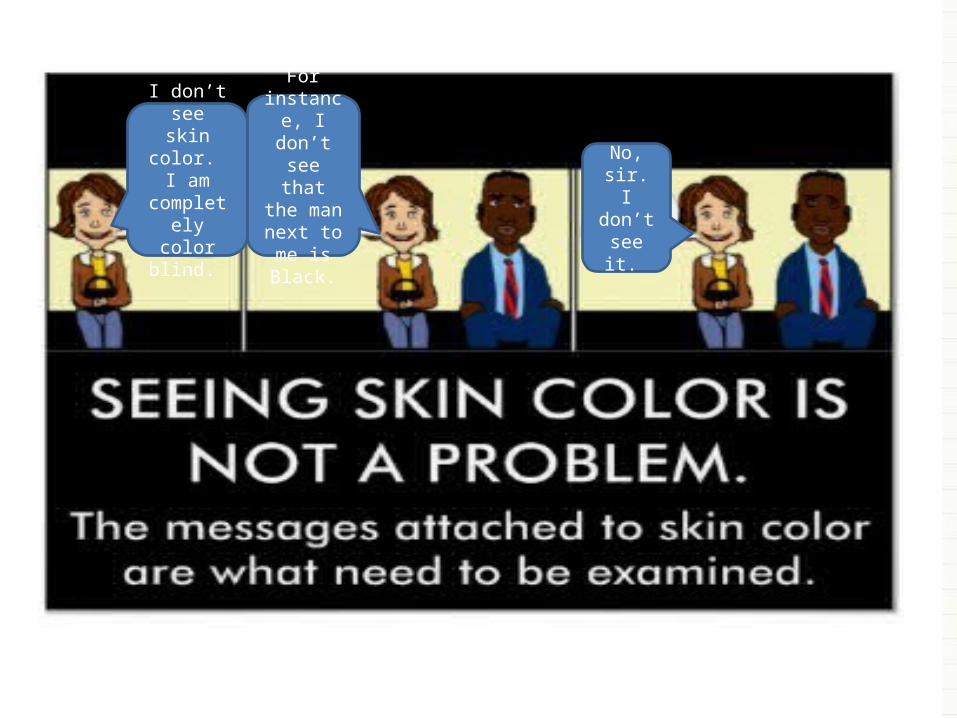
I don’t see skin color.
I am completely color blind.
For instance, I don’t see that the
man next to me is Black.
No, sir. I don’t
see it.
Color-blind Racism and Power
• Patricia Hill-Collins asserts “racism is a system of power with four domains” which are: structural, disciplinary, cultural, and interpersonal (Hill-Collins, 2009, p. 53).
• Racism is “produced and resisted within each domain of power as well as across all four domains” (Hill-Collins, 2009, p. 55).
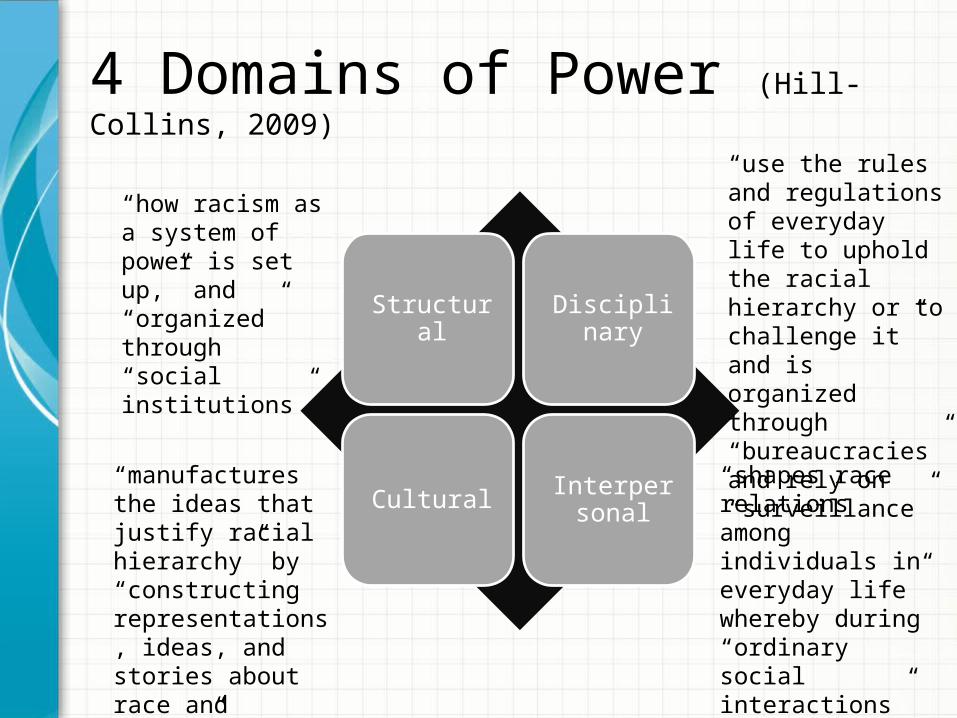
4 Domains of Power (Hill-Collins, 2009)
Structural Disciplinary
Cultural Interpersonal
“how racism as a system of power is set up,” and “organized” through “social institutions”
“use the rules and regulations of everyday life to uphold the racial hierarchy or to challenge it” and is organized through “bureaucracies” and rely on “surveillance”
“manufactures the ideas that justify racial hierarchy” by “constructing representations, ideas, and stories about race and racism”
“shapes race relations among individuals in everyday life” whereby during “ordinary social interactions”
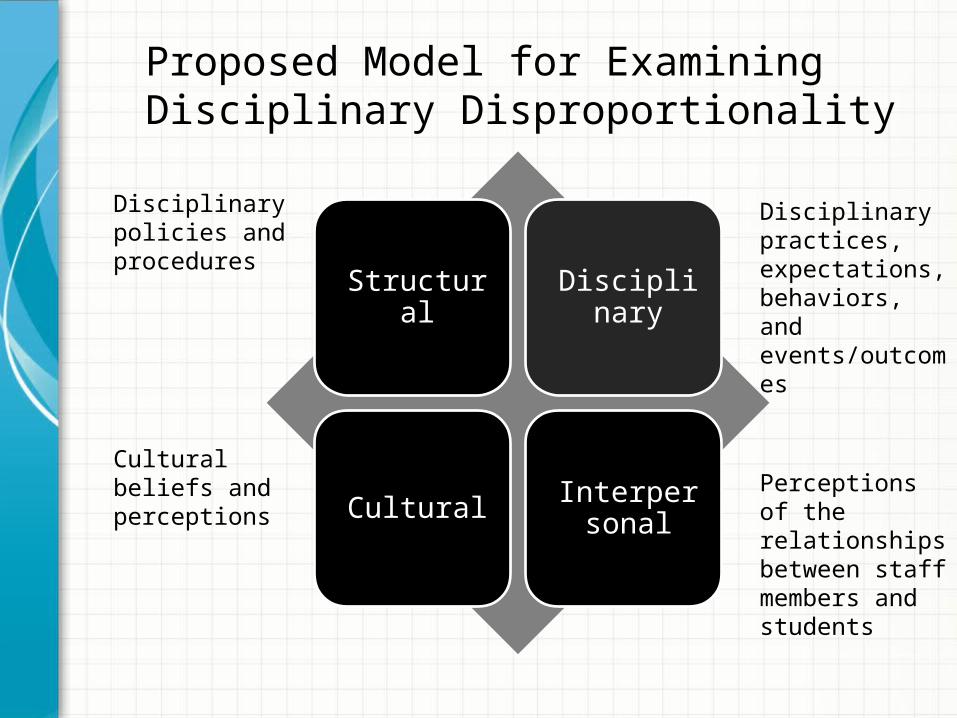
Proposed Model for Examining Disciplinary Disproportionality
Structural Disciplinary
Cultural Interpersonal
Disciplinary policies and procedures
Disciplinary practices, expectations, behaviors, and events/outcomes
Cultural beliefs and perceptions Perceptions of the
relationships between staff members and students
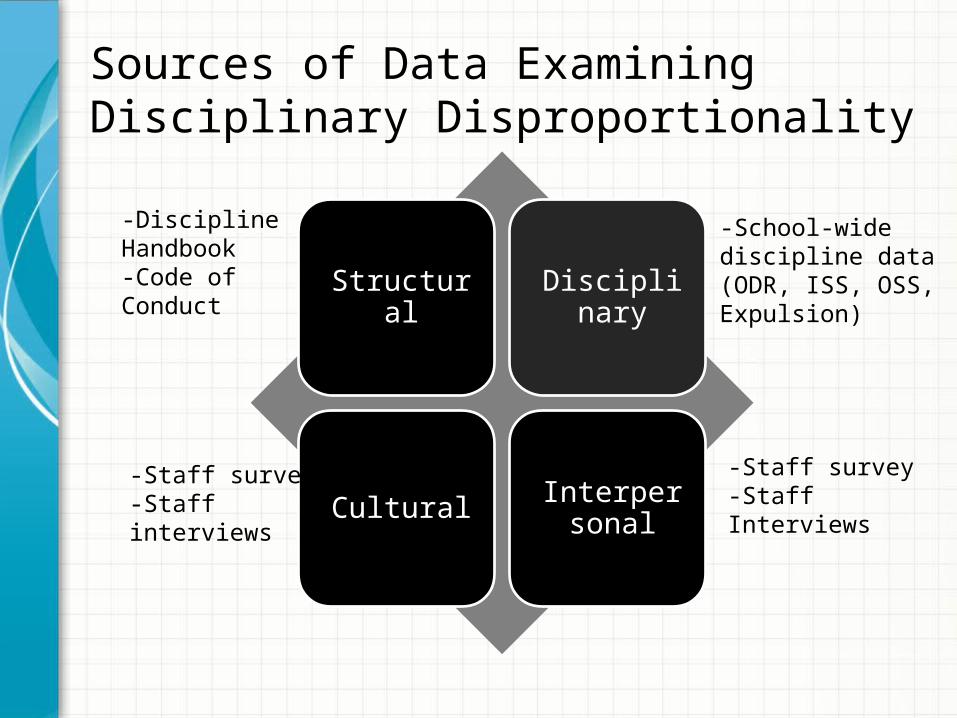
Sources of Data Examining Disciplinary Disproportionality
Structural Disciplinary
Cultural Interpersonal
-Discipline Handbook-Code of Conduct
-School-wide discipline data (ODR, ISS, OSS, Expulsion)
-Staff survey-Staff interviews
-Staff survey-Staff Interviews
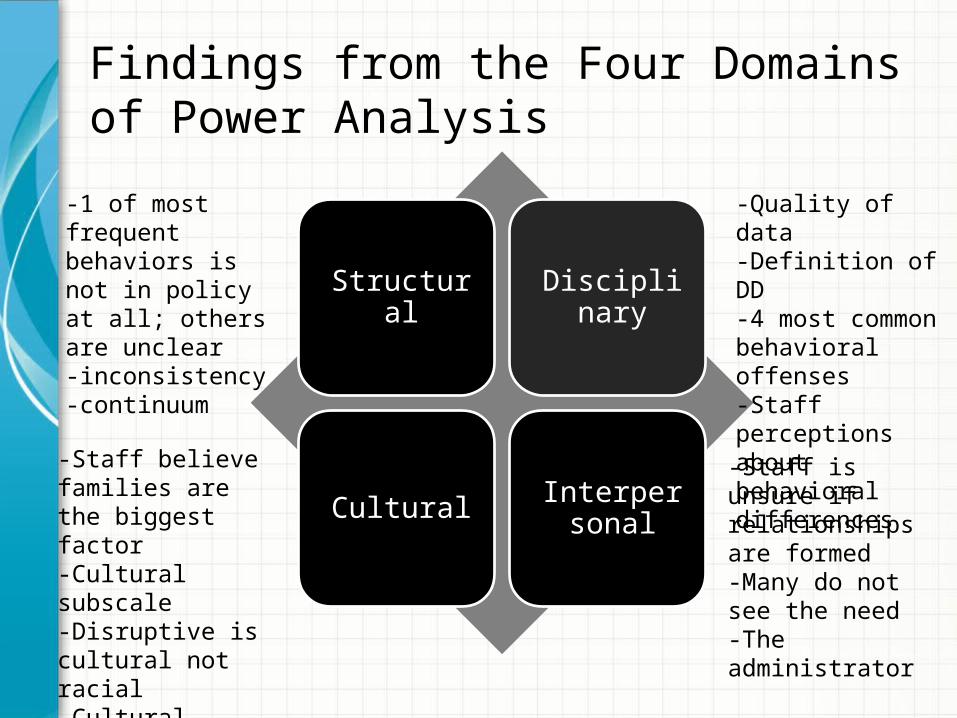
Findings from the Four Domains of Power Analysis
Structural Disciplinary
Cultural Interpersonal
-1 of most frequent behaviors is not in policy at all; others are unclear-inconsistency-continuum
-Quality of data-Definition of DD-4 most common behavioral offenses-Staff perceptions about behavioral differences
-Staff believe families are the biggest factor-Cultural subscale-Disruptive is cultural not racial-Cultural beliefs appear to have replaced racial beliefs
-Staff is unsure if relationships are formed-Many do not see the need-The administrator
Implications
• Findings are contextually relevant• Offers a framework for expanding efforts
beyond disciplinary data analysis• Creates opportunity for dialogue about race-
related issues within a color-blind context• Provides a basis for strategically responding
or implementing interventions to address disproportionalty
RESPONDING TO DISCIPLINARY DISPROPORTIONALITY
Phase II Problem Solving
• Working with PBIS problem-solving team(s)• Utilizing the TIPs Problem-solving process• Support teams with engaging in the problem-
solving process with a focus on the data related to each domain
• Indentify and implement strategies that respond to needs revealed within each domain
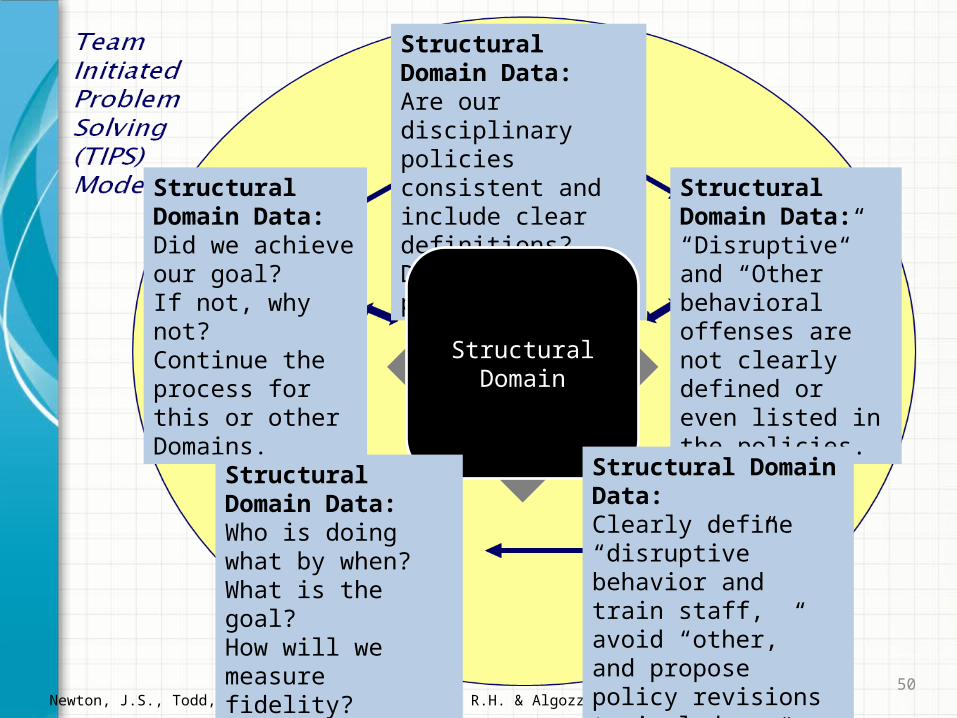
50Newton, J.S., Todd, A.W., Algozzine, K, Horner, R.H. & Algozzine, B. (2009).
Structural Disciplinary
Cultural Interpersonal
Structural Domain Data: Are our disciplinary policies consistent and include clear definitions?Do we have a problem?
Structural Domain Data: “Disruptive” and “Other” behavioral offenses are not clearly defined or even listed in the policies.
Structural Domain Data: Did we achieve our goal?If not, why not?Continue the process for this or other Domains.
Structural Domain
Structural Domain Data: Clearly define “disruptive” behavior and train staff, avoid “other,” and propose policy revisions to include “disruptive.”
Structural Domain Data: Who is doing what by when?What is the goal?How will we measure fidelity?
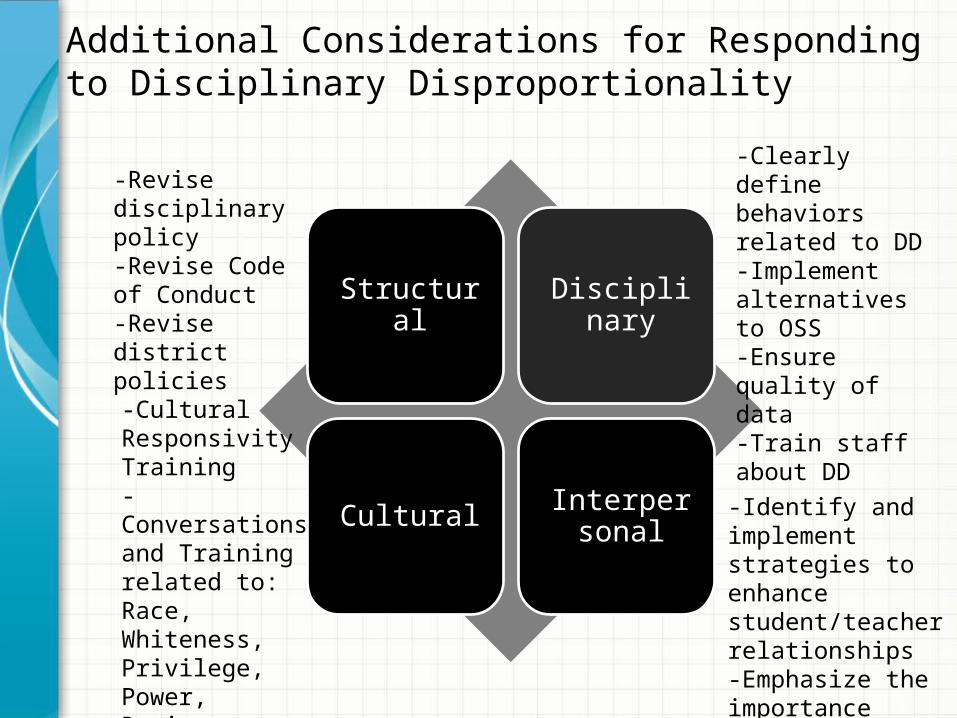
Additional Considerations for Responding to Disciplinary Disproportionality
Structural Disciplinary
Cultural Interpersonal
-Revise disciplinary policy-Revise Code of Conduct -Revise district policies
-Clearly define behaviors related to DD-Implement alternatives to OSS-Ensure quality of data-Train staff about DD
-Cultural Responsivity Training-Conversations and Training related to:Race, Whiteness, Privilege, Power, Racism, Culture, etc.-Examination of specific beliefs
-Identify and implement strategies to enhance student/teacher relationships-Emphasize the importance
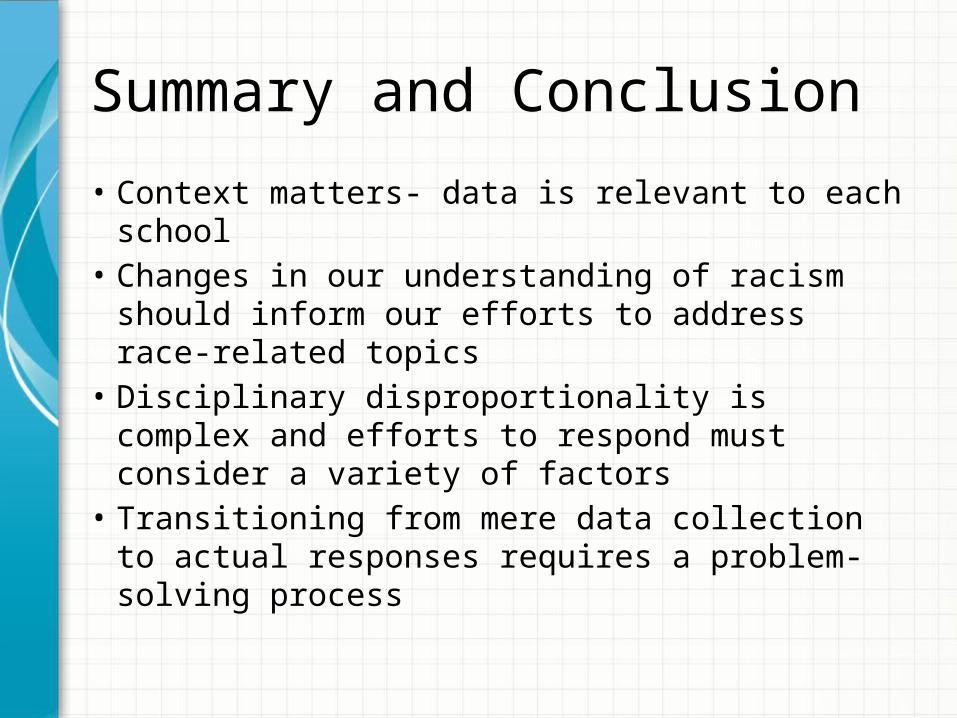
Summary and Conclusion
• Context matters- data is relevant to each school• Changes in our understanding of racism should
inform our efforts to address race-related topics• Disciplinary disproportionality is complex and efforts
to respond must consider a variety of factors• Transitioning from mere data collection to actual
responses requires a problem-solving process
ReferencesBonilla-Silva, E. (2006). Racism without racists: Color-blind racism and the
persistence of racial inequality in the United States (2nd ed.) Lanham, MD: The Rowman & Littlefield Publishing Group, Inc.
Hill-Collins, P. (2009). Another Kind of Public Education: Race, Schools, the Media, and Democratic Possibilities. Boston, MA: Beacon Press.
Newton, J.S., Todd, A.W., Algozzine, K, Horner, R.H. & Algozzine, B. (2009). The Team Initiated Problem Solving (TIPS) Training Manual. Educational and Community Supports, University of Oregon unpublished training manual.
Omi, M. & Winant, H. (1994). Racial Formation in the United States: From the 1960’s to the 1990’s (2nd Ed.) New York, NY: Routledge.
Ransom, J. (1997). Foucault’s Discipline: The politics of subjectivity. Durham, NC: Duke University Press.

WHAT ARE PROMISING PRACTICES FOR
INCREASING CULTURAL RELEVANCE?
Promising Practices for Increasing Cultural Relevance
Scott Ross, PhDUtah State University
www.pbis.org
Think, Pair, and Share
• Think: – About the impact that cultural diversity has had
on behavior support strategies in your school
• Pair: – Share with your partner
• Share: – With all table members an idea or experience
you heard from your partner
Challenges to Effective School Discipline
Doing more with lessIncreased diversity
(abilities, needs) in the classroom
Students with severe problem behavior in the classroom
Keeping the good stuff going
Achieving consistency among adults
Investing in Culturally Relevant Prevention (school-wide)
• Define and Teach behavioral expectations• Monitor and reward appropriate behavior• Provide corrective consequences for behavioral
errors.• Information-based problem solving
• Define and Teach behavioral expectations
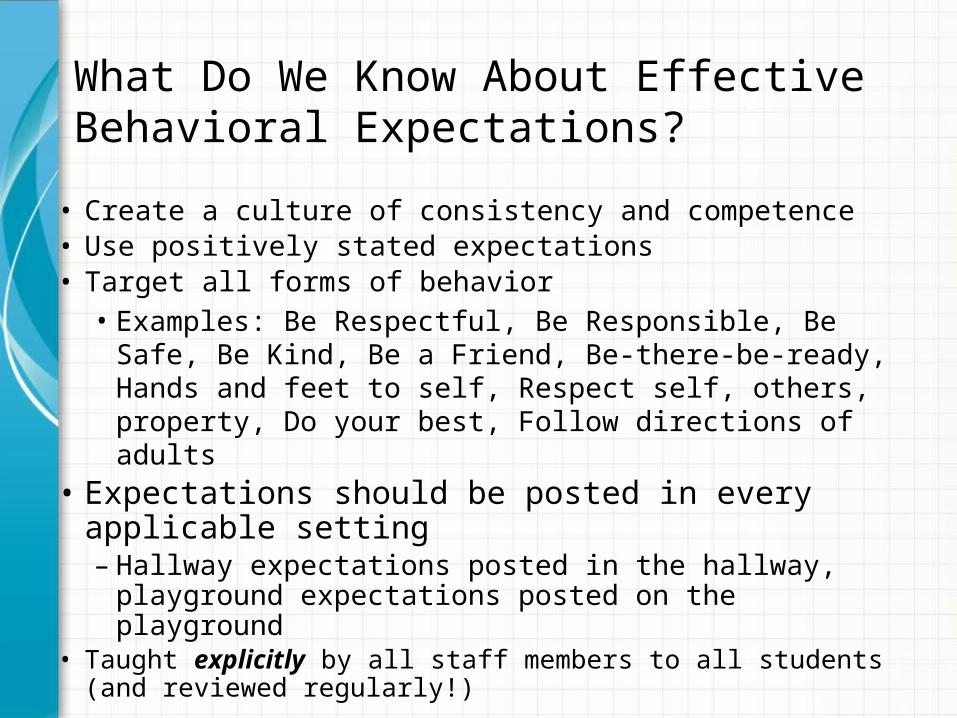
What Do We Know About Effective Behavioral Expectations?
• Create a culture of consistency and competence• Use positively stated expectations• Target all forms of behavior
• Examples: Be Respectful, Be Responsible, Be Safe, Be Kind, Be a Friend, Be-there-be-ready, Hands and feet to self, Respect self, others, property, Do your best, Follow directions of adults
• Expectations should be posted in every applicable setting– Hallway expectations posted in the hallway, playground
expectations posted on the playground• Taught explicitly by all staff members to all students (and
reviewed regularly!)
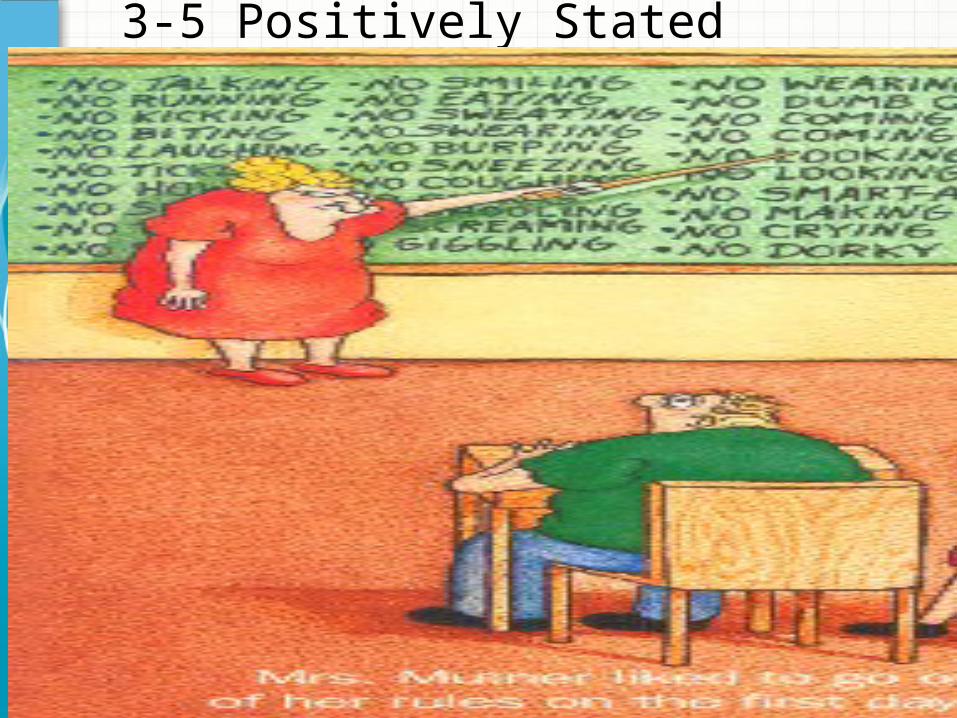
3-5 Positively Stated Expectations
Why 3-5 Expectations?
They are easier to Learn & Remember
Why positively stated?
Prompt teacher to catch kids doing right thing, not just wrong
Why posted?
Reminder & Keep Accountable to ‘our rules’
Why taught explicitly?
Increase consist understanding among students and staff
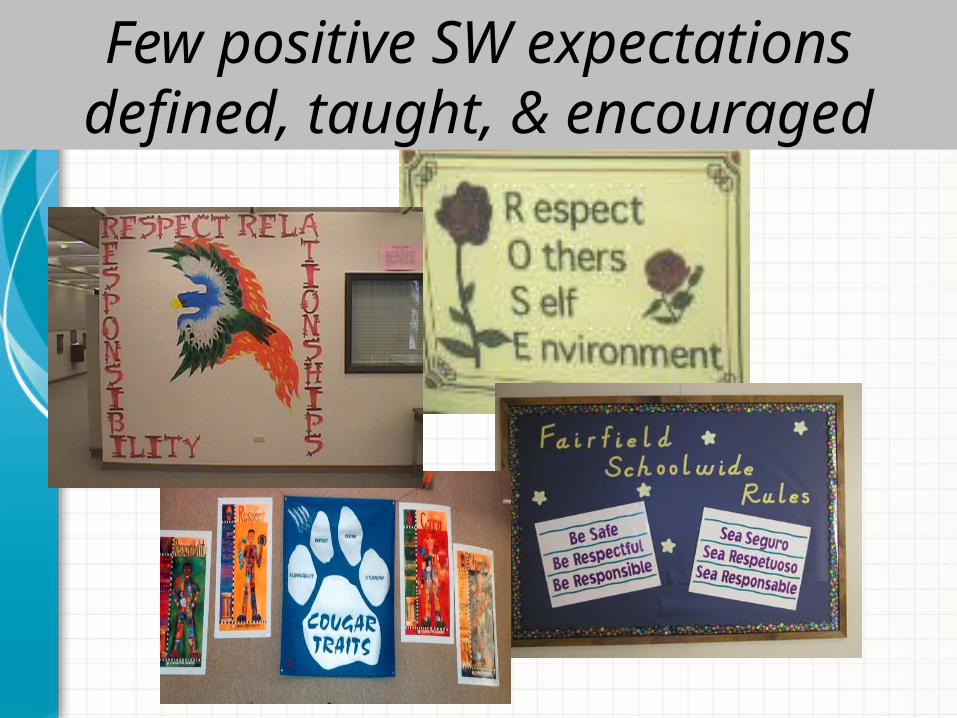
Few positive SW expectations defined, taught, & encouraged
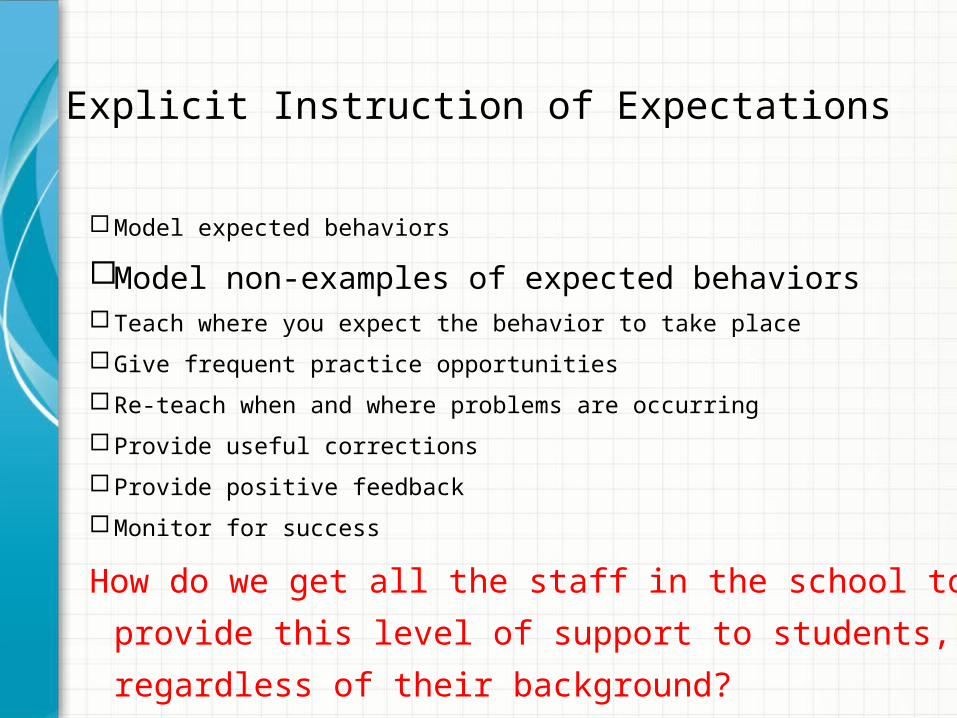
Explicit Instruction of Expectations
Model expected behaviors
Model non-examples of expected behaviors Teach where you expect the behavior to take place
Give frequent practice opportunities
Re-teach when and where problems are occurring
Provide useful corrections
Provide positive feedback
Monitor for success
How do we get all the staff in the school to provide this level
of support to students, regardless of their background?
Activity: Develop a Lesson Plan for your Expectations
• Review lesson plan example • Develop a lesson plan for teaching expectations.
Get into groups of 2 or 3– What level of detail is needed to ensure that all
staff deliver effective lessons? • You are encouraged to borrow freely from
examples and each other. It is always “ A work in progress!”
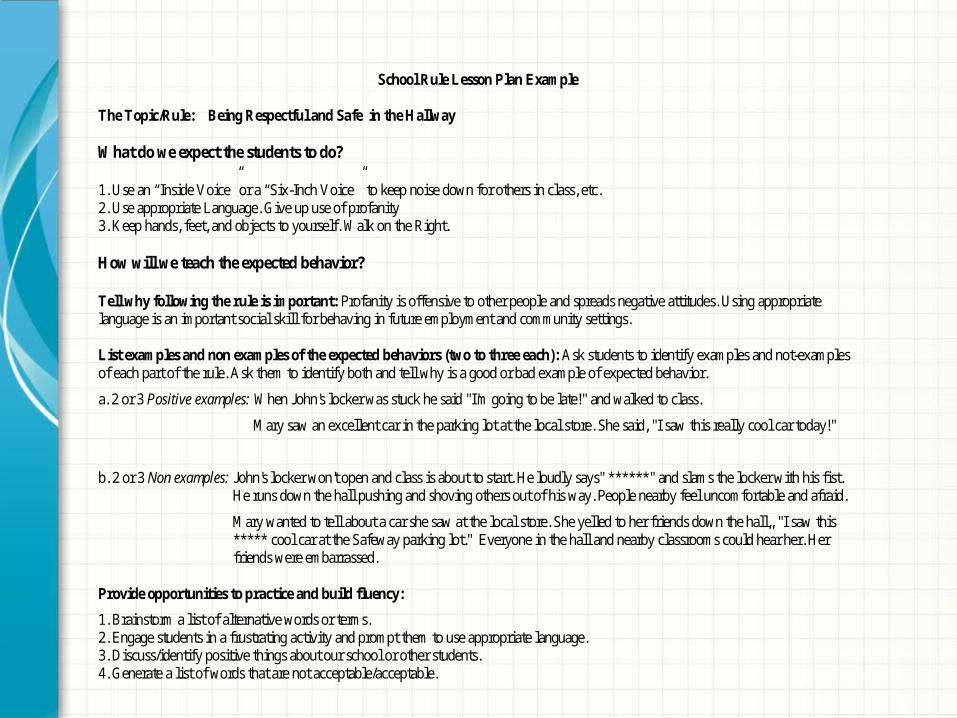
School Rule Lesson Plan Example The Topic/Rule: Being Respectful and Safe in the Hallway What do we expect the students to do? 1. Use an “Inside Voice” or a “Six-Inch Voice” to keep noise down for others in class, etc. 2. Use appropriate Language. Give up use of profanity 3. Keep hands, feet, and objects to yourself. Walk on the Right. How will we teach the expected behavior? Tell why following the rule is important: Profanity is offensive to other people and spreads negative attitudes. Using appropriate language is an important social skill for behaving in future employment and community settings. List examples and non examples of the expected behaviors (two to three each): Ask students to identify examples and not-examples of each part of the rule. Ask them to identify both and tell why is a good or bad example of expected behavior.
a. 2 or 3 Positive examples: When John's locker was stuck he said "I'm going to be late!" and walked to class.
Mary saw an excellent car in the parking lot at the local store. She said, "I saw this really cool car today!"
b. 2 or 3 Non examples: John's locker won't open and class is about to start. He loudly says" ******" and slams the locker with his fist. He runs down the hall pushing and shoving others out of his way. People nearby feel uncomfortable and afraid.
Mary wanted to tell about a car she saw at the local store. She yelled to her friends down the hall,, "I saw this ***** cool car at the Safeway parking lot." Everyone in the hall and nearby classrooms could hear her. Her friends were embarrassed.
Provide opportunities to practice and build fluency:
1. Brainstorm a list of alternative words or terms. 2. Engage students in a frustrating activity and prompt them to use appropriate language. 3. Discuss/identify positive things about our school or other students. 4. Generate a list of words that are not acceptable/acceptable.

School Rule Lesson Plan The Topic/Rule: (Use one square of your rules and expectations grid, i.e., Be Safe in the Hall) What do we expect the student to do? (Use the expectations from your grid) 1. 2. 3. Tell why following the rule is important: List examples and non examples of the expected behaviors (two to three each): a:2 or 3 positive examples: b: 2 or 3 non-examples: Provide opportunities to practice and build fluency: 1. 2. 3. 4.
SUMMARY AND DISCUSSION
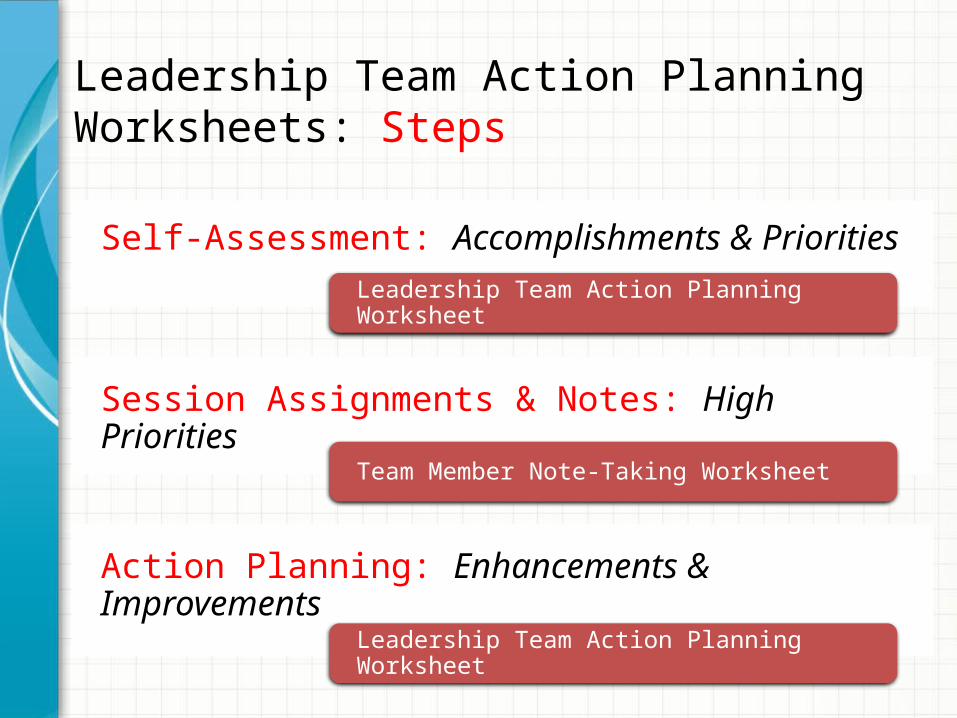
Leadership Team Action Planning Worksheets: Steps
Self-Assessment: Accomplishments & Priorities
Leadership Team Action Planning Worksheet
Session Assignments & Notes: High Priorities
Team Member Note-Taking Worksheet
Action Planning: Enhancements & Improvements
Leadership Team Action Planning Worksheet

RESOURCES


![MCAMIS/MCAMISH/ MCCAMISH BROTHERS: JAMES ......MCAMIS/MCAMISH/ MCCAMISH BROTHERS: JAMES - THOMAS - [and possibly WILLIAM] From First Settlers and Soldiers, Page 431 published by Edward](https://img.pdfslide.net/doc/110x75/5faaec92a25fe9346e382a6d/mcamismcamish-mccamish-brothers-james-mcamismcamish-mccamish-brothers.jpg)


![[Dawson R. Hancock, Robert Algozzine] Doing Case S(BookFi.org)](https://img.pdfslide.net/doc/110x75/55338ed64a795936578b4938/dawson-r-hancock-robert-algozzine-doing-case-sbookfiorg.jpg)