Embed Size (px)
Citation preview

Mapping Value in the Built Urban Environment
A Report to the Commission for Architecture and the Built Environment (CABE)
From the Young Foundation (Geoff Mulgan, Gareth Potts, James Audsley)
Bartlett School of Planning, UCL (Matthew Carmona, Claudio de Magalhaes, Louie Sieh)
Sharpe and Pelipenko, (Chris Sharpe)
March 31st 2006

2
Contents
Executive Summary ............................................................................................... 3
Acknowledgements................................................................................................. 7
Introduction............................................................................................................ 8
What Is Meant By ‘Built Urban Environment’ and ‘Value’ ........................... 14
Stakeholders and Their Needs ............................................................................ 22
Valuation and The Development Process .......................................................... 31
Methods For Assessing Value – An Overview................................................... 36
Methods For Assessing The Value For Developers .......................................... 43
Methods For Assessing The Value For The Public........................................... 55
Negotiation and Decision..................................................................................... 64
Conclusions – Taking Value Mapping Forward............................................... 67
Bibliography ......................................................................................................... 70
Project Management............................................................................................ 76
The Project Team................................................................................................. 77
Appendix 1: Suggested Value Mapping Pilot.................................................... 81

3
Executive Summary
The Value Mapping project was commissioned by CABE in late 2005 and was
managed by the Young Foundation, drawing on a team with experience of
research and practice. The project was commissioned in order to better capture
less tangible things that people value from places – specifically new buildings.
This would look at aspects of the built urban environment for which markets (and
therefore hard monetary values) do not exist. The aim would be to ensure these
values receive greater prominence in future decisions on proposed developments.
This would bring decision-making that inspired more confidence and ensure that
public values would receive greater prominence in relation to the more easily
calculable private ones.
It should be stressed that, at no stage, was ‘good design’ equated, by CABE or the
project team with ‘what the public want’. The aim was instead to look for
valuation exercises that establish dialogue with the public – professionals would
make the lay participants aware of technical issues and the public would make
professionals aware of their needs.
Through a literature review and series of seminars the project team addressed the
brief in a series of stages.
• Stage 1 defined the built urban environment and the concept of value. The
built environment was seen as consisting of several key aspects: use;
connectivity with the wider urban area and its needs; size of development;
lay-out; physical content (such as street furniture) and human activity.
Value was defined as becoming meaningful when people are willing to
make a sacrifice (usually monetary) to get something.
• Stage 2 sought to map all the stakeholders who might have an interest in a
proposed development. It noted how numerous stakeholder perspectives

4
needed to be factored in although the key players in most developments are
likely to be: the developer and their team; the general public; other adjacent
property owners; the local authority and, sometimes, national government.
• Stage 3 looked at the various methods currently in use to understand value.
These included stated and revealed preference methods used by
environmental economists and Multi-Criteria Analysis approaches used by
built environment professionals. All were found to have problems but,
crucially, all offered an angle on the issue of value.
• Stage 4 addressed how methods might be used to generate options for
stakeholders to discuss – the particular need being to identify the scope for
win-win solutions (aspects of a development that all parties wanted) as well
as opportunities for tradeoffs (give and take).
• Stage 5 set out a suggested framework for taking the work forward – that is
ensuring decisions that have greater legitimacy in the eyes of the public.
Summary of the Main Valuation/Decision Methods
Method Strengths Weaknesses
Hedonics • captures monetary
contribution that
environmental elements
make to a development’s
private value.
• ignores buildings for
which there is no market.
Design Quality
Indicators
(DQI)I
• easy to use.
• allows for the involvement
of numerous stakeholders
– the public can feel
• not enough attention to
public space issues.
• weak at assisting
resource allocation.

5
engaged.
VALID • all the advantages of DQI
• gets people to narrow
down what they want from
a development (more than
DQI does).
• participants consider costs
and compromises they
might make.
• not enough on public
space
• weak at assisting
resource allocation.
Contingent
Choice
• simple to grasp
• useable in investment
decisions.
• hypothetical
• the poor are seen as
having less value
• its measurement not
dialogue
Choice
Modelling
• captures value of different
elements
• useable in investment
decisions.
• hypothetical
• miss out the poor
• its measurement not
dialogue
The project succeeded in providing a conceptual framework for thinking about the
options for conducting various types of valuations of the built urban environment
and in delivering visual value maps that make valuation and value negotiation
more comprehensible and, potentially, transparent. The project broke new ground
in unifying two quite different approaches – namely, the multi-criteria analysis
approach used in tools such as DQI and VALID with monetary methods used by
environmental economists. Not only were the literatures brought together but,

6
through a series of seminars, various different individuals were brought together
and the concept of Value Mapping was promoted and made more concrete.
The clear need in the next (post-project) phase is for CABE to oversee the
application of the framework to an actual development – for example, a mixed-use
town centre development, a transport interchange or a suburban residential
development. However, before this step there needs to be dialogue about the report
with property developers, other experts in the field of economic valuation and
urban design valuation and, ideally, with software developers.
The report also suggests other possible developments that would drive work
forward in the future, including a team within CABE focused on valuation work
and building up a database of examples; a unit within a university, probably in an
economics department; a network of practitioners and academics working in the
field to accelerate mutual learning.

7
Acknowledgements Stuart Reid (Transport Research Laboratory Ltd.); David Chisholm and Eric
Holding (both John Thomson Partners); Professor Colin Lizieri (Head of Real
Estate and Planning, Reading University); Professor John Elkington
(Sustainability); Dr David Hardman (Department of Psychology, London
Metropolitan University); Lisa Sanfillipo (New Economics Foundation); Professor
David Gamm (Imperial College, London); Dr Jonathan Fisher (Economics Policy
Manager, Environment Agency); John Wallett (IDZ Design); Professor Jonathon
Rosenhead (Department of Operational Research, LSE), Sara Olsen (SVT
Consulting, San Francisco); Claire Williams, (South East Economic Development
Agency, former Young Foundation intern).

8
Introduction Aims and Objectives
This report is the primary output of a project funded by the Commission for
Architecture and the Built Environment. It ran from December 2005 to March
2006.The project was commissioned in order to better capture less tangible things
that people value from places – specifically new buildings. This would look at
aspects of the built urban environment for which markets (and therefore hard
monetary values) do not exist. The aim would be to ensure these values receive
greater prominence in future decisions on proposed developments. This would
lead to decision-making that inspired more confidence and should help to ensure
that public values would receive greater prominence in relation to the more easily
calculable private ones.
However, it should be stressed that, at no stage, was ‘good design’ equated, by
CABE or the project team with ‘what the public want’. The aim was instead to
look for valuation exercises that establish dialogue with the public – professionals
would make the lay participants aware of technical issues and the public would
make professionals aware of their needs.
In terms of operationalising the above aims, three key tasks were required of the
project team. Specifically, they were asked to:
• outline methods that either are used or could be used for valuing the built
urban environment before and/or after development.
• find or develop methods for ensuring an appropriate balance between
developments that achieve the aims of the (public or private sector)
developer and the wishes of the general public.
• develop visual tools (Value Maps) that outline methods that those seeking
to evaluate proposed developments might employ.

9
The exercise aimed to generate several main value maps. Firstly, there needed to
be a visual that outlined the overall development and valuation process – the
stages of development, the issues being valued, the scale at which valuation can
occur, the types of choices available and the types of information offered. A
second set of visuals needed to illustrate the choices in more detail and which
make it clear how there might be trade-offs that can be made.
Project Team
The project team was a partnership of staff from the Young Foundation and the
Bartlett School of Planning at University College London. The project was
overseen by Dr. Geoff Mulgan, Director of the Young Foundation and the day-to-
day management, seminar presentations and report writing was led by Dr. Gareth
Potts, also of the Young Foundation. UCL (Professor Matthew Carmona, Louie
Sieh and Claudio de Magalhaes) provided input at the literature review stages.
Valuable input also came from Chris Sharpe, a co-founder of Sharpe and
Pelipenko, London-based design and design software firm; James Audsley a
Young Foundation staff member and from Dr Susana Mourato of Imperial College
London.
Seminars
Two seminars were held with leading academics and practitioners to test out ideas
and to get feedback and input from the considerable collected intelligence present.
A further presentation was given to a seminar on the Business Case for Good
Design organized jointly by CABE and Transport for London.

10
Context
Britain, like most countries, continues to see exciting additions to the built
environment (buildings, infrastructure and spaces) that delight, appall and amaze
people who encounter them. Examples include the new Selfridges in Birmingham
(the ‘blue bubble wrap’ building), the Lowry in Salford, Gateshead’s Sage Centre
and Angel of the North, the Oracle retail and leisure complex built around the
River Kennett in central Reading and the Millenium Bridge in London.
Portsmouth’s Tricorn Centre, now demolished, often used to top lists of loathed
buildings. That city can also now boast the impressive new 170m tall Spinnaker
Tower. Improvements to the environment haven’t all been new build – in
Birmingham, for example, recent decades have seen New Street reclaimed from
buses in favour of pedestrians and Victoria Square converted from a roundabout to
a fine civic space.
Interest has grown in the idea that well designed buildings and spaces might
deliver wider social and economic benefits. The Office of Government
Commerce’s procurement pack Achieving Excellence in Construction contains a
whole section devoted to the delivery of design quality, and the Treasury’s Green
Book recognises that non-monetary benefits need to be included among value-for-
money assessment criteria for public building proposals. In March 2005, the
National Audit Office endorsed the positive impact of buildings on service
delivery in its report Improving Public Services through better construction.
Concerns with economic benefits of design have been particularly prominent at a
regional level.
The Industrial Revolution spawned many attractive town centres and those
charged with reviving these many of these same areas economies are hoping that
good design can now attract today’s footloose entrepreneurs and skilled staff.
Several Regional Development Agencies (RDAs), notably Yorkshire Forward,

11
One North East and the North West RDA are funding work into design and
regional competitiveness.
Opportunities for high standard design in public buildings should be growing. The
UK has seen very low levels of public capital investment in recent decades by
comparison with other countries, during a period when per capita income has
caught up with and in some cases overtaken others (the rate of investment has
risen rapidly but remains well below OECD norms (Mulgan 2005). The result is
an evident imbalance between private affluence and public poverty (and in some
cases squalor), that is likely to persist for some time (ibid).
The architecture and built environment community are eager to see design
receiving higher prominence – in public and private sectors alike. The Urban Task
Force, led by the architect Lord Rogers of Riverside, recently reconvened and
included increased attention to the design of buildings and public spaces amongst
its calls. Specifically, it argued for placing design champions at strategic board
level in public regeneration and development bodies and reinforcing this in the
way Government funds and tasks the activity of such bodies. The Task Force also
recommended a strengthening of design advice to ministers, mayors, local
authority leaders and cabinets (UTF 2005). Such calls build upon the increased
emphasis on design in the planning regime (notably through PPG 3). In London
the GLA has an Architecture and Urbanism Unit and the Mayor is championing a
project to create a 100 new public spaces.
Evidence is now starting to emerge of how buildings with well designed interiors
can have a corresponding effect on workforce productivity; patient recovery rates,
pupil performance etc. (see Eclipse 2005). Methods also exist for isolating the
ways in which a development with a good frontage can see higher sales for

12
developers. Such external spaces invariably have benefits to the public that cannot
easily be charged for – what economists term positive externalities.
However none of these methods go far enough in assessing:
• whether developers’ schemes will yield as much benefit as they could for
wider stakeholders (neighbouring property owners and the general public)
• how these other stakeholders might negotiate with the developer to ensure a
development that delivered more benefits for them (stakeholders).
A value mapping methodology that is robust, replicable and comprehensive can
provide tools for ensuring that
• developments receiving planning permission are valued (or not hated) by
the public.
• the public sector have mechanisms for allocating resources to jointly fund
developments with the private sector.
Report Structure
The report structure is outlined in table 1. Having outlined the rationale for the
exercise, the first section of the report proper seeks to better define the terms built
environment and value. The report has attempted to offer a very broad definition
of stakeholders and to outline which groups are perhaps under-represented in
deliberations around proposed developments. The next section looks at all the
methods that were reviewed and then focuses down on those deemed to offer the
greatest purchase on the questions in hand. Once the methods have been decided
the remaining task is to look at how valuation occurs at present. The case is made
for opening up the consultation/valuation process to more people, to making it as
much about an educative dialogue as about measurement of value and to seeing
earlier stages of the development process opened up to a wider body of

13
stakeholders. Finally, there is the question of ‘where next’ – here the report
outlines a conceptual framework for tackling developments but, inevitably, the
method needs to be applied and refined.
Table 1: Outline of the Report
Question Section
Why Introduction
What Defining ‘Built Urban Environment’ and ‘Value’
Who Stakeholders and their Needs
Methods for Assessing Values: An Overview
Methods for Assessing the Value To Developers
Methods for Assessing the Value To The Public
How
Negotiation and Decision
When Valuation and the Development Process
What Now Taking Value Mapping Forward

14
What Is Meant By ‘Built Urban Environment’ and ‘Value’ The Built Urban Environment
As Table 2 indicates, there are numerous aspects of the built urban environment. It
can be defined as place, buildings, public space (loosely, the space between
buildings) and landscaped elements of the natural environment within towns and
cities. The valuation task ahead is considerably more challenging than simply
identifying key aspects of the built urban environment. The value people will
place upon this environment will depend not so much on any one element but
upon the relationship of these elements to each other – the whole realm of urban
design.
Table 2: Elements of the Built Urban Environment
Building Elements Artwork
Balconies/projections
Building lighting Canopies
Colonnades Corners
Decoration Entrances/exists
Flags and banners Floodlighting
Monuments/landmarks
Shop fronts Signage
Skyline/roofscape Structure
Walls Windows
Landscape Advertising
Bollards Boundary
walls/fences/railings
Festive decorations
Fountains/water features
Lawns and verges Paving
Planters/hanging baskets
Planting beds and areas
Public art Road surfaces Shelters/band
stands Signage Squares Steps
Infrastructure Bridges
Bus stops/shelters Canals
CCTV polls and cameras
Gutters/drainage Harbours
Home Zones Parking
bays/meters/car parks
Public toilets Railways
Roads and cycle lanes
Servicing bays/turning heads
Street lighting Telecommunicatio
ns equipment Telegraph polls
Telematics
Uses and Spaces Colleges
Community uses Factories Gardens Homes
Hospitals Industrial uses
Kiosks Law Courts
Leisure uses(active/passiv
e) Offices Parks
Performance Venues
Play grounds Plazas
Police Stations Prisons
Restaurants and Eateries

15
Street Furniture Traffic calming
Trees
Telephone/post boxes
Traffic lights/road signage
Tram/bus lanes Underground
services Utilities boxes
Waste and recycling bins
Retail Parks Schools
Shopping Malls Shops
Sports facilities Sports Stadia
Tourism Transport Terminals
Universities (Source: adapted from Living Places, Caring for Quality, (ODPM, 2004)).
Value
Economics textbooks highlight the importance of scarcity to value. People have
certain goods, and services they want to consume although the value they place on
these will diminish the more frequently they experience them – beyond a certain
point the experience will actually become a negative one. Prices will thus be low if
goods and services are in abundance and can sometimes be high simply because
the opposite is the case (i.e. some luxury goods). Consumers need to strike a
balance between enjoyment and over-indulgence – the market price will tend to
represent this trade-off point. Producers need to tailor their supply in line with
market needs – although they will forever make efforts (through advertising) to
make people want more of some existing goods or services or to offer consumers
something that is new and exciting.
The economists’ definition of value as representing a consumer’s willingness to
pay for something (based on their estimation of the net benefits in relation to the
cost) is applicable to all goods and services whether traded in the market or not.
Thus, people are typically willing to pay for something like access to sunset even
though no direct market exists for sunset – indeed, it should be possible to discern
this value by comparing the prices of west-facing houses with other similar

16
houses. The ‘willingness to pay’ definition is actually a value in use – as opposed
to a real or estimated market price for something (value in exchange).
Just as what people value will vary in accordance with their needs and the
availability of the good/service so too will the things people value change over
their lifetimes and between generations. Although people often share common
perceptions of beauty, value is nonetheless a social construct and, as such, does
not reside in any good or service indefinitely. In other words, nothing is valuable
forever. Investment decisions by companies (and, for that matter, governments)
have then to find a balance between something known to be valuable today and the
considerable uncertainty about what future demand will be.
Just as there no such thing as indefinite value so too there is no such thing as
intrinsic value. Members of the arts and economics communities have debated this
latter issue – the former believing it exists, the latter believing it doesn’t. The
economists accept that there may be a case for educating the general public about
things they are unaware of (such as the historical importance of a particular work
of art) but that everything can be valued – even human life. It is indeed true that
human life can be valued – certain Government Departments do just this.
There has been a considerable interest amongst many key figures in Westminster,
Whitehall and the think-tank world in the notion of ‘public value’ a term coined by
Harvard University’s Mark Moore (Moore 1997). The key aspect of public value
is that it is the public who determine what is valuable – rather than professional
economists advising government. According to Moore and other writings on this
(e.g. Kelly, Mulgan, Muers, 2002) public agencies have to constantly engage with
the public to get a better understanding of citizens preferences and priorities. For
something to be of value, citizens - either individually or collectively, must be
willing to give something up in return for it. Such sacrifices may be through the

17
conventional channel of taxation but can also involve giving time – for example,
serving as a part-time special police officer.
The idea of being willing to paying for something in order for it to be valuable is
crucial. Everything people value is something they do, or are willing to, pay for –
whether in monetary terms or through some other sacrifice (such as time). People
consider the benefits they get alongside the disbenefits incurred and then they
consider whether the net benefits warrant the time/money cost outlay required.
Which Aspects of the Built Environment Can Be Valued?
Figure 1 indicates how the ideal development will be one where, for each type of
value (over and above the land value), there will be a gain in terms of value. In
terms of valuing the physical elements there are established techniques for
measuring land values and building values. It is the broader area of urban design
where the public value and contextual value are added – considered ahead.

18
Figure 1: Ways to Maximise Value from a Proposed Development
The most defining characteristic of a development is its use or, as is often the case,
mix of uses. Also, important is tenure mix. For example, one of the most frequent
issues in urban areas is a requirement from the planning authority that
developments contribute to affordable housing. There is the more general question
of how places work and whether they are likely to prove sustainable. Key issues
for consideration are whether places are well connected, via various transport
means, to other places; are they (if its an older area) in keeping with local
character; are they safe; are they places where young children can play and places
where older children can hang out away from the prying eyes of adults; is there
adequate for rubbish collection vehicles to manoeuvre; are these away from the

19
main public areas; is there adequate parking; adequate greenery; is there a full
range of neighbourhood facilities – notably shops and a primary school. In short,
is it well designed.
More generally, the public will have needs that are not currently being met and the
local plan may well outline these. It may be that the site in question offers the
opportunity to give the public what they want. As figure 2 below indicates, the
development area (the blank area adjoining the waterfront) is located near a much
older town centre. Even a cursory glance at the area sketched reveals the apparent
absence of any play space for young children. This is just one example of how
anyone looking to develop the existing site could be expected to make concessions
to the public – or partner with a public body in funding play areas.
Figure 2: Context - Riverside Site in Kingston, South West London

20
The initial calculations will be about the nature of the development (i.e. use(s))
and about the quantity and spatial configuration of development. This latter term
refers to the area of space open to the public and the lay-out of open space and
buildings. These two aspects are depicted in figure 3. As can be seen, there are
three options in terms of volume and, if (as depicted) the second one is chosen,
there are three further options for arranging this volume. In reality of course there
are a potentially infinite range of options – any valuation exercise needs to
acknowledge this and decide on an appropriate balance between costs and choice.
If computer software was available to produce and cost different shapes this would
help.
Figure 3: Quantity and Spatial Configuration of Development

21
The next key issues are ‘physical content’ and ‘human activity content’. The
former includes the whole range of building frontages, street furniture, materials
etc. It can also include trees and landscaping. Human activity is also important –
as the celebrated New York sociologist-planner William H. Whyte once aptly put
it, “what attracts people most, it would appear, is other people” (Whyte 1980).
This point is important in that public valuations of developments will be based on
how they believe the places will be used – not simply on the size and shape of
proposed developments. For spaces intended as a place to seek solace, people will
need to be helped to visualize these spaces with just a few people reading or
talking quietly, for retail areas, they will want to see people laden with shopping,
for streets they will want to see pedestrian movement and for night-clubs they will
want to see revelry.
Given the considerable debate around the extent to which public space is being
privatised (Minton 2006), attention also needs to be drawn to who is and isn’t in
being served by a development – wearers of certain clothing, security guards,
certain age groups, colours, cyclists, buskers, leaflet distributors etc. Where visual
materials are used to depict the proposed development (see ahead) exclusion
should be clearly marked. As a further check, there needs to be clear
representation at the negotiating table for these groups.
This is not quite the end of the story in terms of options. Consideration also has to
be given to ‘Time’ - time of day, time of week, and time of year. Ideally, there
need to be enough uses in or around a development to ensure that they are well
used (and therefore yielding value) around the day (subject to residential
requirements for quiet) and around the year.
There are many other factors that actually determine whether developments that
do get built then go on to become good spaces. These include numerous services:

22
• maintenance
• policing
• cleansing
• wider planning and transport policy
• place marketing
So, as part of any deal-making, there needs to be attention given to the subsequent
management of space and the monitoring of those who committed to doing this –
whether they be in the public or private sectors.
Stakeholders and their Needs Who Has A Stake?
As figure 4 below shows there are numerous different types of individual that
might have an interest in a development. These groups may overlap – for example,
a local resident might also be a member of a community group. Each individual
consulted is likely to have a different reason for valuing or not valuing a proposed
development – for example, a cyclist might want bike racks, a pedestrian may
want benches and an architect will be concerned with the materials used in a
proposed building. A blind person might be very much concerned with hearing
lots of activity and a deaf person eager to see as many visual stimuli as possible.
The Figure was designed with a view to outlining a broad range of stakeholders
thereby building on other stakeholder definitions that been more focused on
building developers and users (table 3).

23
Figure 4: Possible External Stakeholders in a Proposed Development

24
Table 3: Key Stakeholders in the Development of the Built Environment
Category Stakeholder
Finance Financiers, banks, PFI consortia,
developers, government
Design and construction Architects, engineers, sub-/contractors,
Quantity Surveyor, an Urban Designer,
an Environmental / Planning
Consultant, a Highways/Transportation
Engineer; a Civil engineer; a PR
Consultant and a Socio-economic
advisor sub-contractors and suppliers.
Occupant organisation Chief Executive, Project Directors,
Communications and Marketing
Managers, General Workforce, HR,
Facilities Manager, Security staff,
Cleaners.
Public Realm Local Authority; Local Community;
Regional and National Community (see
below).
Visitors to Building Hospital patients, hotel guests, retail
customers, students, pupils, the general
public.
(Adapted from Eclipse 2005).

25
The Potential Value of (Funding) High Quality Design to Developers
Private developers are interested in making profits from the built environment.
Non-profit organisations will be interested in developments that are fit for purpose
rather than worrying about profit. Nonetheless, whilst local authorities may wish
to consider the effect of developments on the wider wellbeing of the local public
(part of the remit of local authorities in the UK) the realities of budget heads may
well mean that the non-profit sector, like the private, have a tightly defined view
of what they want from a development. It will take a good ‘business’ case to see
them fund or co-fund developments with positive value for a wider public. This
case is now considered more fully.
Developers are unlikely to spend on public frontages and open spaces if they can’t
see profits from this. Open space may be public in some senses – for example,
bye-laws may operate and people may be allowed to protest if they get permission.
Yet in many other senses spaces may be quasi-public – parking is for patrons only
and skateboarding and board games are forbidden. It makes more economic sense
to invest in internals spaces so that workers, shoppers and residents (i.e. those who
are paying) can benefit. Many publicly constructed buildings are not necessarily
very public – hospital and school grounds are closed to all but those members of
the public who are treated/educated there. With prisons the grounds are not only
very closed to the public but there is also a strong case for the buildings being out
of sight of the public.
However there are reasons why developers might be interested in ensuring they
make a positive impact on their local surrounds. These can be individual – for
example, workers may want to leave because the public space is so poor.
Collectively, developers (and existing owners) may recognise that they can
overcome the problem of making investments that don’t always benefit them
directly. This same principal can apply to privately-owned residential or office

26
developments – i.e. the value of an individual painting their own door or trimming
their hedge and the collective value (greater than the sum of the parts) of everyone
painting their doors. The key factors in making this happen is a brokerage
mechanism – with private developers in town centres and business areas this
occurs to some extent through Business Improvement Districts (BIDS).
Table 4: Benefits for Developers (Co-)Funding Good Public Spaces
Type of Benefit for Public and/or Private Developers
Individual
Developer
• Worker rest - Summer lunch breaks mingling with the public
• Worker pride in their company’s building/surrounds
• Developer/Owner’s public relations – seen as good
neighbour
• Play areas for kids can mean more family shopping days out
• Secure planning permission
Collective
Investment
• Neighbouring properties will impact one another
• With collective investment all gain in an upward spiral
The Potential Value of Good Public Space to the Public
In discussing ‘public value’ Kelly et al. (2002) note that the things which citizens
value, and demand from governments most are services, outcomes and trust. It is
not difficult to make potential connections between public value and the built
environment.
• Services: If the public have been involved in the development of public
buildings or spaces and have access to those spaces, it should augur well for
increased receptiveness to the public services subsequently offered from
those same premises.

27
• Outcomes: links can include the effects of good design of schools and
hospitals buildings on positive welfare outcomes such as pupil attainment
and recovery rates. There is also a considerable evidence base on designing
out crime.
• Trust: refers here to the relationship between state and citizens – something
that should improve if the two sides regularly discuss the shape of the urban
environment. Trust can also be an outcome in itself.
More generally, the public can derive numerous benefits from the built
environment – whether publicly funded or not. However, in contrast to the benefits
to developers, the benefits to the public are much harder to calculate since, by
definition, there is no market in public space – use of public space is free at the
point of use. As with developers these benefits can be both felt by individuals and
distributed amongst individuals – a whole that is more than the sum of the parts.
The extent to which a public site generates collective benefits will be a function of
how often people meet there – for example, neighbours meeting in a cul-de-sac or
local shopping parade versus tourists on a once-in-a-lifetime visit to Trafalgar
Square.
Table 5: Individual and Collective Benefits for the Public from Good Public Spaces
Type of Benefit for the Public
• wellbeing from spaces to unwind in
• wellbeing from urban greenery
• wellbeing from buildings that stimulate
• wellbeing from places where people can watch the
World go by
Individual
• wellbeing from places/spaces that encourage walking
28
(links)
• wellbeing from being safe – and feeling safe
• civic pride from great developments
Collective • social capital (mutual trust, sense of obligation, sense
of community, shared norms and values) is greater with
certain development types that foster frequent
meetings.
• community cohesion – places where ethnically and
culturally diverse groups can co-exist peacefully.
• social inclusion – places where often-excluded groups
can be welcomed by the mainstream.
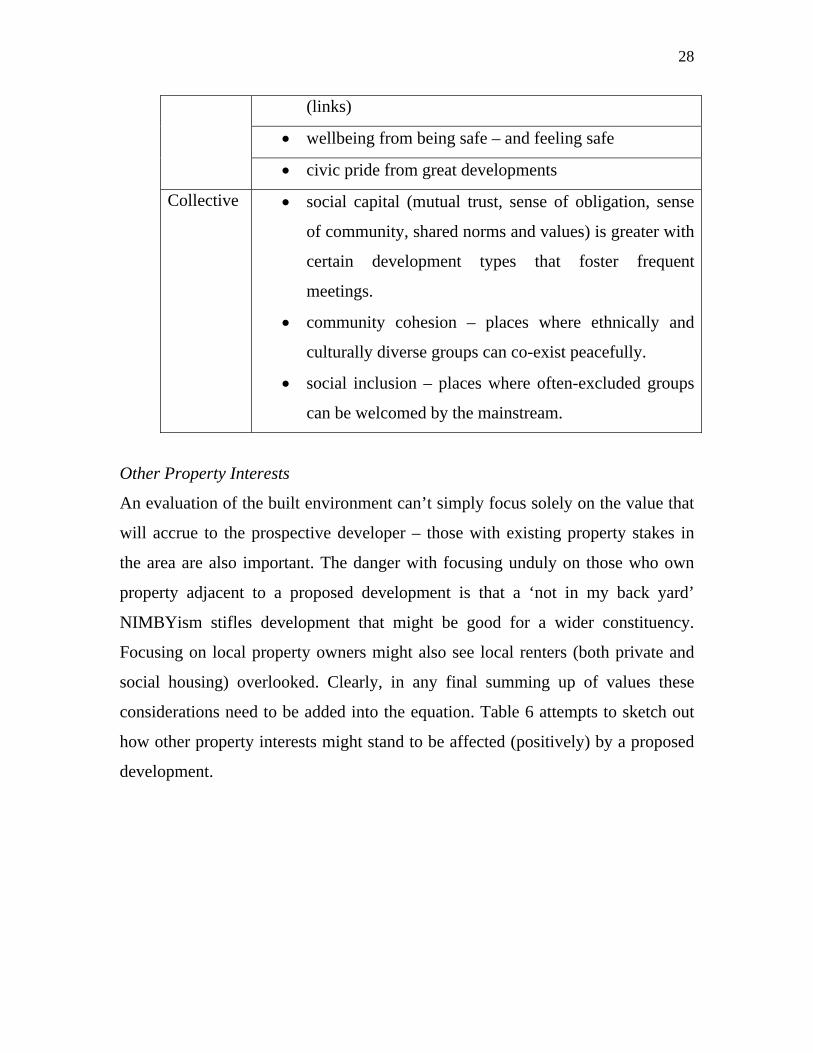
Other Property Interests
An evaluation of the built environment can’t simply focus solely on the value that
will accrue to the prospective developer – those with existing property stakes in
the area are also important. The danger with focusing unduly on those who own
property adjacent to a proposed development is that a ‘not in my back yard’
NIMBYism stifles development that might be good for a wider constituency.
Focusing on local property owners might also see local renters (both private and
social housing) overlooked. Clearly, in any final summing up of values these
considerations need to be added into the equation. Table 6 attempts to sketch out
how other property interests might stand to be affected (positively) by a proposed
development.

29
Table 6: Types of Benefit for Other Property Interests from Good Public Spaces
Type of Benefit for Other property Interests
• private commercial property values may increase
• private residential property values may increase
• private commercial rents may increase
• private residential rents may increase
• assets owned by community groups may increase
• assets owned by local authorities may increase
‘Social Valuation’
So far the focus has been on the values that may accrue to developers and
individuals from the built environment. However, there will inevitably be knock-
on effects – for example, if an individual’s wellbeing benefits from regularly
spending time at a local public place this will have knock-on effects for the
taxpayer due to the reduced likelihood of needing to treat that individual for
physical or mental ill-health. Similarly, a place for teenagers to ‘hang out’ may
well reduce the incidences of anti-social behaviour with their attendant costs for
victims’ welfare and the costs incurred by the police and criminal justice system.
This issue of wider knock-on societal effects must also hold for the actions of the
developer – for example, they will have to pay a price for the materials and land
they use but what is the wider effect on the value that society has for the
environment? It may be that the public doesn’t value these aspects highly – so it
seems worthwhile to inform people of these factors when making their valuations
but also to keep a tab on the various impacts (which may or may not have
monetary values attached to them). Hopefully, the public would become more

30
aware of these as the body of knowledge on how developments actually fared built
up – in time, they might alter their preferences/values in light of this evidence.
Table 7: Types of Issues to be Considered in ‘Social Valuation’
Type of Issue for Social Valuation
• cost of physical wellbeing to society
• cost of mental wellbeing to society
• cost of crime to society
• cost of environmental impact to society
Local Authority
The local authority, or indeed the state if a proposed development is of major
national importance, will have certain perspectives that it wants to see reflected in
valuations and deliberations on the built environment. These included issues such
as whether a development will yield more or less money in terms of Council Taxes
and, to some extent, through Uniform Business Rates. Although issues such as job
creation and various local economic multiplier effects are not really within the
remit of this account it is nonetheless the case that some proposed schemes will
generate much more jobs and income for an area than others. Finally, the local
authority also has to consider the various associated pressures that a proposed
development will put on the area and its environs. This can include pressure on
local primary schools associated with residential developments, pressure on local
shops caused by supermarkets or pressure on the transport system. Such pressures
can perhaps be taxed via the Section 106 (planning gain) system whereby the
developer would agree to some sort of funding to lessen these effects – e.g.
funding a school classroom. Again, not all of these impacts need have a monetary
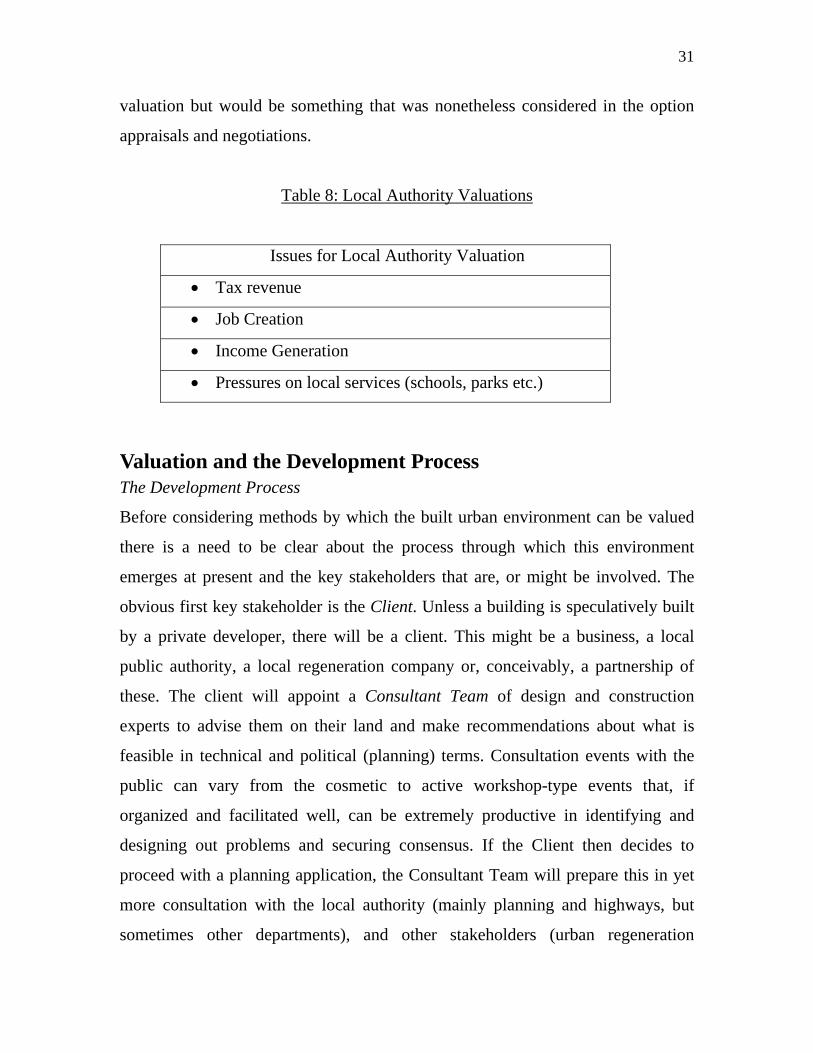
31
valuation but would be something that was nonetheless considered in the option
appraisals and negotiations.
Table 8: Local Authority Valuations
Issues for Local Authority Valuation
• Tax revenue
• Job Creation
• Income Generation
• Pressures on local services (schools, parks etc.)
Valuation and the Development Process The Development Process
Before considering methods by which the built urban environment can be valued
there is a need to be clear about the process through which this environment
emerges at present and the key stakeholders that are, or might be involved. The
obvious first key stakeholder is the Client. Unless a building is speculatively built
by a private developer, there will be a client. This might be a business, a local
public authority, a local regeneration company or, conceivably, a partnership of
these. The client will appoint a Consultant Team of design and construction
experts to advise them on their land and make recommendations about what is
feasible in technical and political (planning) terms. Consultation events with the
public can vary from the cosmetic to active workshop-type events that, if
organized and facilitated well, can be extremely productive in identifying and
designing out problems and securing consensus. If the Client then decides to
proceed with a planning application, the Consultant Team will prepare this in yet
more consultation with the local authority (mainly planning and highways, but
sometimes other departments), and other stakeholders (urban regeneration

32
companies, regional development agencies, local landowners, bus operators, local
businesses, residents). The process, at present, is outlined more fully in Table 9.
The post-development monitoring is perhaps seen as something of a Cinderella
area – why do it after the development has occurred. There are several reasons.
Firstly, if developers know this is going to occur they are likely to take their
obligations and promises very seriously. It is also useful as part of the process of
educating the general public about the built environment to show them that people
often change their minds on developments (particularly somewhat avant-garde
ones). The Angel of the North was, for example, initially unpopular in the North
East whereas now the opposite is true.
Table 9: Key Stages in the Typical Development Process
Stage Key Tasks
Feasibility • Outline brief by developer
• Local planning policy – land use designations, conservation
areas etc.?
• Back-of-the-envelope financial appraisal – very broad
assumptions.
• Preliminary site investigations
• Desk study - historic maps (previous uses) and broad site
constraints
• Site visit and photographic survey of visible site features.
• First design sketches and strategies.
Design • Detailed development and refinement of developer’s brief
• Detailed development of design – plans, sections, elevations,
model

33
• Floor areas and numbers of residential units quantified
• More detailed financial assessment – fewer assumptions, more
detail
• Some discussion / consultation with local planning authority
and others
• Full site investigation – engineering constraints and ecological
assessment
• Discussions / negotiations with neighbouring landowners
• Preparation of design codes and some other detailed design
information
• Production of detailed specialist reports in transport,
environment etc
Planning • Planning application produced and submitted (drawings, A3
reports)
• Meetings with planning authority – discussions with
stakeholders
• Some detailed design may continue in anticipation of planning
approval
• Public Exhibition
• Public / stakeholder consultation process.
• Negotiation of planning conditions and section 106
agreements.
• Planning approval / decision to proceed with construction.
After
completion
• Development of later phases
• Ongoing sales and lettings
• Ongoing operation of infrastructure e.g. buses, hospitals
• Some roads built by developer adopted by local authority

34
Opening up the Development Process
As Table 9 reveals, there are four key stages in the development process. The
crucial aspect to note is the late stage at which the views of the general public are
sought – namely when the volume and lay-out decisions have been taken. As was
discussed earlier, it is difficult to really consult (a valuation of sorts) the public
unless there are some options on the table – and there will not be any such options
without a developer first undertaking some preliminary feasibility studies. It’s also
true that the public would already have had the opportunity to comment on the
local plan and that they elect Councillors to negotiate on their behalf when it
comes to planning and other matters. The local plan will determine land-use and
the heights of buildings – so there are already limits placed on the potential
quantities and lay-outs. Council Planning Officers, architects and other
professionals all have a professional duty to take the public into consideration in a
development – as does the local Member of Parliament and the local media.
The local plan will offer protection against an inappropriate use and a building
completely at odds with the local environment. But it doesn’t allow the public an
early decision on a key building. The pride that a community could derive from
such involvement could be considerable – a pride that might lead to a greater
interest in the stewardship of the developments in question.
Lay Knowledge and Interest
Public involvement is helped by well-designed methods for engagement,
definition of options and dialogue. It also depends on information and some
education. If people are to comment on a development’s safety or environmental
impact they need to be appraised of ways to do this. If they are to be asked on a
scheme’s architectural daring they need to be informed (without giving them a
lecture on architectural history) why this is so.

35
People may know what they like when they see it but if asked for their views on
how to change their environment the answers tend to be very mundane – people
may know their area and its needs but their environmental vision often extends
little beyond curbing dog fouling and mending broken paving. They need to
explore possibilities with a committed, approachable design team that is there to
genuinely take their views on board.
There may well be areas where education is futile. Not everyone will be interested
in storage and collection space, parking standards, turning circles, kerb radius at
pedestrian crossings, utility service infrastructure etc. Similarly, if the public are
consulted on urban design questions, are their views likely to be shared by leading
architects and urban designers? An analogy here might be the fact that television
soaps appear to be valued more highly by the public than the works of
Shakespeare. Building by opinion poll may herald the death-knell of inspiring
built environments. Part of the answer may lie in showing people innovative
developments from elsewhere in the World whilst also keeping local context and
budget in mind. It would also show people that they can get it wrong occasionally
– there are numerous examples (such as the Angel of the North) where proposed
developments have met with public criticism only to subsequently be very popular
when built.
Any valuation derived from public consultation is unlikely to give appropriate
weight to more obscure, technical points, despite their importance. By far the
commonest misunderstanding of the project is that it aimed to achieve the ‘best
design’. Inevitably when the professions involve the laity in decision-making
decisions will be different to those professionals would have made. This is not to
say that design principles are jettisoned or, conversely, that whatever meets the
least public resistance will dominate. Concerns of safety and economic
sustainability will inevitably have to hold sway – that is, they will shape public

36
decisions. The ideal is for democratically accountable design experts to arbitrate
between public wishes and those of a developer. Inevitably the more views and
opinions that are fed in the better the eventual decision will be – assuming all are
happy with the method employed from the outset.
Finally, it is worth stressing that developers and others with a professional interest
in the built environment may also lack a thorough understanding of the ways in
which a development’s immediate external environment can impact, for better or
worse, upon its market value. Even some major developers admit to using rules-
of-thumb – for example, that a £20m development should have £3m spent on the
surrounds. So these individuals too can benefit from good value mapping.
Methods for Assessing Value – An Overview The Literature Review
The literature review, available as a separate document, covered a handful of
broad approaches to assessing environmental value. These were: Design;
Environmental Economics; Impacts and Indicators; Organisational Performance;
and Property Market. A handful of different approaches emerged from the initial
review that were seen as helpful to the exercise in hand but not, ultimately, as core
methods that could be used. This ‘complementary’ literature is now summarised.
Figure 5 is useful in showing the different techniques that are available for
assessing value or, at the least, thinking about aspects of a development that
people might value. The figure is useful in that it also shows just how accessible
tools are to the lay public. There doesn’t appear to be a major problem in terms of
a lack of methods – for local small scale evaluations of a proposed environmental
change tools such as Placecheck doubtless are appropriate in that they require few
resources, little/no prior education and because few variables are under study.

37
Figure 5: Principal Approaches for Considering Value in the Built Environment
Quality of Spaces
Several approaches consider the quality of existing places – most notable amongst
them being Placecheck (by Urban Design Group), Local Environmental Quality
Survey (by ENCAMS – Environmental Campaigns) and Landscape Area
Characterisation (by English Heritage). The latter is used specifically to assess and
categorise historic aspects of areas and landscapes – its relevance to proposed
urban developments is likely to lie in informing all stakeholders of the site’s
significance. All of the methods offer something in terms of ways for thinking

38
about the built environment - if a community (or group of interested people)
establishes what an area needs before a development is proposed this will put
those same people in a good position to then judge what they are likely to value in
any proposed development. The Area Characterisation’s historical focus is
particularly interesting in that it offers to help in uncovering the (often) hidden
history of a place – a history that, once people become aware of it, may alter their
valuations of the site.
Like almost all methods reviewed the approaches vary in cost depending upon the
extent and rigour with which they are pursued. The tool that probably best
addresses (non-monetary) value is the DQI for Public Space (currently being
piloted1 by CABE) which gauges the views of members of the public and of
professionals running a space on nine issues (that the individuals have weighted
beforehand). The nine are a mix of issues about design and about the use and
compared against the group management of the space. They are: access; activities
on offer; how it serves different needs; maintenance; performance; materials used;
shelter and seasonality; role of the space in the community; how the space makes
individuals feel. A score is then given by participants for each area of public space
– so that, after the scores have been weighted, individual values can be compared
with the groups. Only the DQI for Public Space method offers any real framework
for stakeholder dialogue – and even this is somewhat unstructured (certainly when
compared to the methods discussed subsequently).
One other tool worth mentioning is Planning for Real – developed by the
Neighbourhood Initiatives Foundation. This is an easy to use tool that uses a three
dimensional model of a neighbourhood as a way of helping people to put forward 1 In 2006 CABE Space will merge the ‘DQI for public space’, ‘GreenStat’ (a customer survey for
park users) and the ‘Green Flag Awards’ method of appraising green parks and open spaces.

39
and prioritise ideas on how their area can be improved. The basis for making the
model, such as models of houses to assemble, and problem and ideas cards, as
well as instructions for facilitators, are all contained in the Planning for Real kit.
The tool is visual and fun to use and people of all abilities can get involved. The
tool needs initial facilitation (recruiting residents to make their neighbourhood
model using the kit provided). It allows communities to identify problems and
agree solutions in a collaborative way. Participants are asked to prioritise the most
practicable course using a Now-Soon-Later chart. As a consultation tool for the
less educated and poor, the approach has much mileage but as a mechanism for
valuation and decision-making on monetary issues, it is inappropriate.
Quality of Life
The Quality of Life Capital developed by a consortium of Government
environment bodies is the most strategic of the various variant quality of life
approaches – albeit one whose rural pre-occupations are fairly visible. It is all
about identifying and maintaining benefits for an area – it is much less concerned
with damage to an aspect of the environment than it is to the loss of benefits that
were provided by that aspect. The approach stipulates that any change that reduces
or damages the benefit is offset by some other change that increases or improves
the same benefit to at least the same degree – a useful concept that might inform
Section 106 agreements2. In some cases the recommendation will be that the
development doesn’t proceed at all. The method is very much a broad-brush style
rather than a fixed check-list. It is also very much about protection rather than any
creative process for use in shaping a future development.
2 Compensation by developers to local authorities for pressures on the local environment.

40
Arts Impacts
Traditionally the arts sector has relied primarily on aesthetic rationales and
arguments emphasising their intrinsic and ‘civilising’ values. David Throsby
(2000) defines cultural value as consisting of: aesthetic value; spiritual value;
social value (sense of identity and space); historical value, symbolic value and
authenticity value (its genuineness). Similarly, Kelly and Kelly (2000) stress the
need to value and support art which is difficult and new and for which there is no
market. Delgado (2001 in Reeves 2002) notes too that issues such as cultural
preservation and cultural diversity must also be factored into discussions about
what is valuable. This has clear implications for the built environment – we
should, so the argument goes, support the avant-garde because it may become
popular and, if it doesn’t, it will anyway still add to the stock of cultural diversity.
Environmental economists, including David Pearce, in work on preserving
heritage buildings have recently taken issue with those who would see cultural
values as somehow exempt from the formal valuation applied to other goods. The
economists in question (see EFTEC 2005) concede that, a building that almost no-
one values may have great value to a few experts who are aware of its cutting-
edge technology or its historical significance. EFTEC argue that without the
ability to compare costs and benefits the quality of decisions will forever be in
question. In reality we do put implicit or explicit prices on all assets – even human
life. They offer some hope for the aesthete - suggesting there may be a need to
educate the wider public about the case for reconsidering their initial values
(which creates the further problem of how much should be spent on such
education).

41
What about the value of the life changing effects an arts project may have? Landry
et al. (1993) described these as effects that have a “continuing influence upon, and
directly touch, peoples’ lives”. These effects may not be apparent at the point of
consumption (the admission price might be repaid many times over). So a
valuation based on market value or willingness to pay might be misleading. Of
course, measuring the effect of a building on a person is fraught with difficulty.
The effects on one individual could be far more significant than any number of
visitor pounds – it may be that seeing an impressive piece of architecture has
swayed many talented people into the field of architecture and urban design.
Alternatively, it may instead be that attraction to these professions is caused by
bad design.
The arts impacts literature also discusses how an areas’ image and, as a result of
this, its economic fortunes can be changed if it can boast some great artistic works.
Although we are avoiding discussion of economic impacts here, this particular
issue is relevant in that urban environments can often be converted to images such
as posters and postcards. These images can also then be used in tourism and
advertising (see Kelly and Kelly 2000). So there is an additional source of value
that conventional environmental economics doesn’t appear to mention.
Environmental and Ecological Impacts
There are two main ecological approaches that focus upon impacts over a wider
geographic reach - Ecological Footprints and Ecological Rucksacks. With the
Footprints approach we can find the biologically productive area that is required to
maintain the flows of much of what we consume and compare what we use with
the area on the planet that is biologically productive. Urbanised economies are of
course more likely, by definition, to need to import resources to meet their needs.
It is perhaps unsurprising then that various towns and cities have developed
detailed accounts for their ecological impacts and demands. Cities and

42
developments that can discourage car use without hampering movement are
clearly a key factor in footprint reduction - in industrial countries, fossil fuel use
accounts for about half of the footprint. The Ecological Rucksack is a similar tool
that shows that anything we use has invisible environmental impacts in production
and subsequent disposal – albeit one that extends well beyond the local place and,
even, the local city and country. The Rucksack approach uses the idea of a
consumed product’s true weight – the weight of biosphere that is disturbed to
make a good or service. Showing the true environmental impact of what we
consume. Neither approach is applied at the level of buildings. With footprints the
impact is by person (not by weight) so it is not entirely clear how the consumption
of materials used for a building would be related to people.
The last approach is Environmental Impact Assessment (EIA). EIA provides
evidence and analysis of environmental impacts of activities from conception to
decision making. An EIA must include a detailed risk assessment and provide
alternative solutions or options. It may cover any engineering or industrial project,
legislative proposal, policy programme or operational procedure with
environmental implications. It is more about being reactive rather than any
creative process for deciding what the valuable features of a new building might
be. Neither EIA nor the other two approaches is specifically concerned with
measuring the costs of the impacts – which are different again, of course, from the
value of these costs (society’s willingness to pay to rectify the damage or to accept
compensation for its occurrence).

43
Methods for Assessing the Value for Developers Property Valuation
Development appraisals will vary in complexity depending on the type of
development and the attitude of the developer. The aim is to produce valuations
that tell private developers what their proposed scheme will yield in terms of
profits and to tell public sector developers what their asset is worth. Most
developers accept that there are significant margins of error in appraisals, and will
work to limit the risk they undertake. In the UK there are five recognised valuation
models – see table 10.
Table 10: Methods of Market-Based Property Valuation
Method Description Use
Comparable
method
estimates the value of a property by
comparing it to the prices of similar
properties sold in similar locations
within a recent period of time. The
basic assumption is therefore that a
property is worth what it will sell for.
for most types of
property where there is
good evidence of
previous sales.
Accounts /
Profits Method
rent decided upon is based upon the
earnings potential of the building in
the hands of the existing or, if for
sale, a likely future type of owner.
This is then used in the investments
method (see below).
to determine an
appropriate rent where
evidence of rents is
slight because the
properties in question
tend not to be held as
investments – e.g.
cinemas and theatres.
Investment/
Income Method
the present worth of a property is
estimated on the grounds of projected
for most commercial
and residential property

44
future net income (in rent, for
example) and re-sale value. Assumes
money is of more value to its holder
today than in the future. Uses the
discounted cash flow (DCF) model to
determine the present value of an
investment. Internal rate of return
(IRR) is that discount rate for a series
of cash flows that will allow the
project to break even.
the alternative method is an implicit
model, that determines value by
reference to previous similar sales –
generally referred to as the All Risk
Yield model.
that is producing or has
the potential to produce
future cash flows
through being let.
Developers of
investment properties
are more likely to start
off with a yield in
mind. This will be less
than the profit on a
speculative
development, as the
risk is lower.
Development/
Residual
Method
assesses the value of developable land
– which may or may not have
property on it.
where sites are ripe for
development.
Contractor’s
Cost Method
cost of constructing replacement. for properties not
bought and sold on the
market – for example,
churches.
(see Pagourtzi et al. 2003 for a full review; see also the RICS Red Book)
At the Feasibility Stage appraisal is likely to be little more than adding up
estimated sales costs (including profits required) and subtracting them from the
estimated value of the site. As the scheme is worked up further and more costs
known (for example utility and section 106 costs) are known there will then be
analysis of cash flows – including discounted cash flow analysis. There are more

45
advanced methods that can be employed. These still take into account income
flows, but which tend to try and take into account the changes to this flow over
time, or to model more accurately various variables (such as geographic
variations). These include:
• Artificial Neural Networks
• Spatial Analysis Method
• Fuzzy Logic
• Autoregressive Integrated Moving Averages
• Hedonic Price Models (now considered)
Valuing the External Impacts of Developments
The Hedonic Pricing Method aims to determine the relationship between the
attributes of a good and its price. It has as its basic proposition the notion that any
good has a range of characteristics, each with its own implicit or ‘shadow’ price.
The final price of that good is the sum of the shadow prices of all its attributes, and
thus reflects the consumer’s valuation of the marginal differences between
attributes. Applied to property (notably private housing and offices), it involves
analysis of data (usually for the previous twelve months) relevant databases to
disentangle the various attributes of a building or a development from the other
factors making up their market price. Using regression analysis it is possible to
estimate the relationship between the level of any one housing characteristic and
the price of the property. It would then be possible to use the information from the
hedonic price function to see how the quantity of a particular characteristic
influenced the overall price commanded by a property. If the data is available, a
big ‘if’, the exercise should be relatively cheap and easy to undertake. It has been
used to examine the impact on market prices of the location of buildings in
relation to factors such as:
• amenities

46
• architectural features
• external design characteristics
• health facilities
• internal design characteristics
• landscape features
• public transport
• school quality
The use of such techniques lie in knowing what will and won’t add value to a
similar development in the same property market at roughly the same time – that
is, it allows developers to confidently prioritise one aspect of a development over
another. The caveats about similarity and sameness are important – value transfer
can only occur where there are considerable similarities between developments
(and assuming that a new development doesn’t steal customers away from an
existing one). The method is telling the developer what the property buyer is
willing to pay for from a development. Of key interest here are external design,
landscape, and architecture. If the general public want developers to offer more
than this then they must somehow find ways of paying them to do so. The
hedonics method can also be employed by neighbouring property owners to assess
how their property values are likely to be affected.
Despite the usefulness of the method to ascertaining developer value there are
several concerns:
• change is at the margin - so there is no sense of willingness to pay beyond
the margins (i.e. times of unusually high/low prices or supply). This makes
it difficult to predict the effects of increasing/decreasing a particular aspect
of property.

47
• the method uses regression and differentiation techniques and geographical
information systems (GISs) – so it is not a method that anyone (for
example, a community group) can apply.
• the method relies on there being a well-functioning, data-rich property
market - in the UK; this has seen the method limited to housing.
• if transaction costs (searching, buying and moving) in property markets are
sufficiently high, they may negate the benefits of moving.
• the method requires all other variables that could explain price differences
to be isolated and quantified – evidence suggests this is difficult.
• as it concentrates on property prices, it ignores those with non-use values
for a particular piece of the built environment and it ignores visitors.
• as it focuses on what buyers want it overlooks that fact that much of what
they value may be distributed very unevenly in geographical and class
terms (i.e. wealthy people buying proximity to rivers, parks etc.).
• developments in the public sector are not bought and sold in the way
houses and offices are – there is, for example, no market for universities,
hospitals or tube stations. So developers of buildings for the public sector
cannot really know how much their building will gain in terms of its value.
• there is no obvious place for aesthetic considerations.
• looking at what people buy and responding to this may lead to a circular
situation whereby buyers buy what is on offer rather than what they would
like. This ties in with the point made earlier about whether valuation is a
measurement exercise or a dialogue between key stakeholders.

48
Multi-Criteria Analysis
The Design Quality Indicators (DQI) and the Value in Design (VALID) are both
examples of the most common technique used to compare unvalued costs and
benefits – namely, weighting and scoring (sometimes called multi-criteria analysis
(MCA)).
With DQI there are three main headings for valuing a design (usually a building).
These are:
• Functionality (usefulness) – access, space and uses. These are concerned
with the arrangement, quality and inter-relationship of spaces and how the
facility is designed to be useful to all.
• Build quality (building fabric) – performance, engineering systems and
construction. These relate to the engineering performance of a facility,
which includes structural stability and the integration of health and safety
aspects throughout the project lifecycle. They also relate to the robustness
of the systems, finishes and fittings.
• Impact (sense of place) – urban & social integration; internal environment,
form & materials; character and innovation. These refer to the facility’s
ability to create a sense of place and to have a positive effect on the local
community and environment. They also cover the wider influence the
design may have on the disciplines of building and architecture.
The Stages of DQI
1] Weighting: For the ten sub-headings referred to above initial weightings of 1-3
are set, by each stakeholder, for lots of different indicators within the ten headings
– see figure 6 below which looks at the access sub-heading (part of functionality).
The ultimate aim is for a design that has achieves excellence in all three main
spheres.

49
Figure 6: Example of DQI Initial Weighting
2] Ranking: a design is then rated using a Likert scale (agree strongly through to
disagree strongly). This is outlined in figure 7 – that looks at the impact sphere and
the internal environment sub-heading.
Figure 7: Example of DQI Ranking

50
3] Calculation an Overall DQI: The Likert marks are then weighted using the
initial weighting to give an overall DQI – for each individual and collectively.
Individuals can see (using diagrams such as the one below – figure 8) where they
are getting or not getting what they want and the Co-ordinator can see how the
Group overall are ranking different design issues.
Figure 8: Calculating the Overall DQI
DQI is essentially an exercise that can take place during the course of a day –
some of the discussion may centre on data generated in advance (such as heating
data) and some will simply be reflections on building characteristics (such as
extent to which it ‘raises your spirits’). The focus is certainly upon the building
quality – rather than the specific interest here, namely the factors that make for
successful places and spaces. The method can be employed throughout the design
process although, strictly speaking, any comparison between buildings or over
time will need the same stakeholders to be involved. One factor that would appear
to be somewhat flawed is that the initial weighting is constrained to three/four
choices – 1-3 and not applicable. The problem is that stakeholders are allowed to
51
give everything the top rank – rather than being expected to rank heading and sub-
headings.
The VALiD method also involves weighting and ranking although it seems to be a
more sophisticated model. It has a first stage of trying to tease out the
organisational values of the likely participants in order to gauge their expectations
and to anticipate their preferred ways of working in the project team. This activity
is not however connected with design in general and certainly not with the
specifics of the impacts a development makes on urban places and spaces. It seems
somewhat too nebulous – headings of different value types considered include
hedonism, stimulating, others-orientated, security.
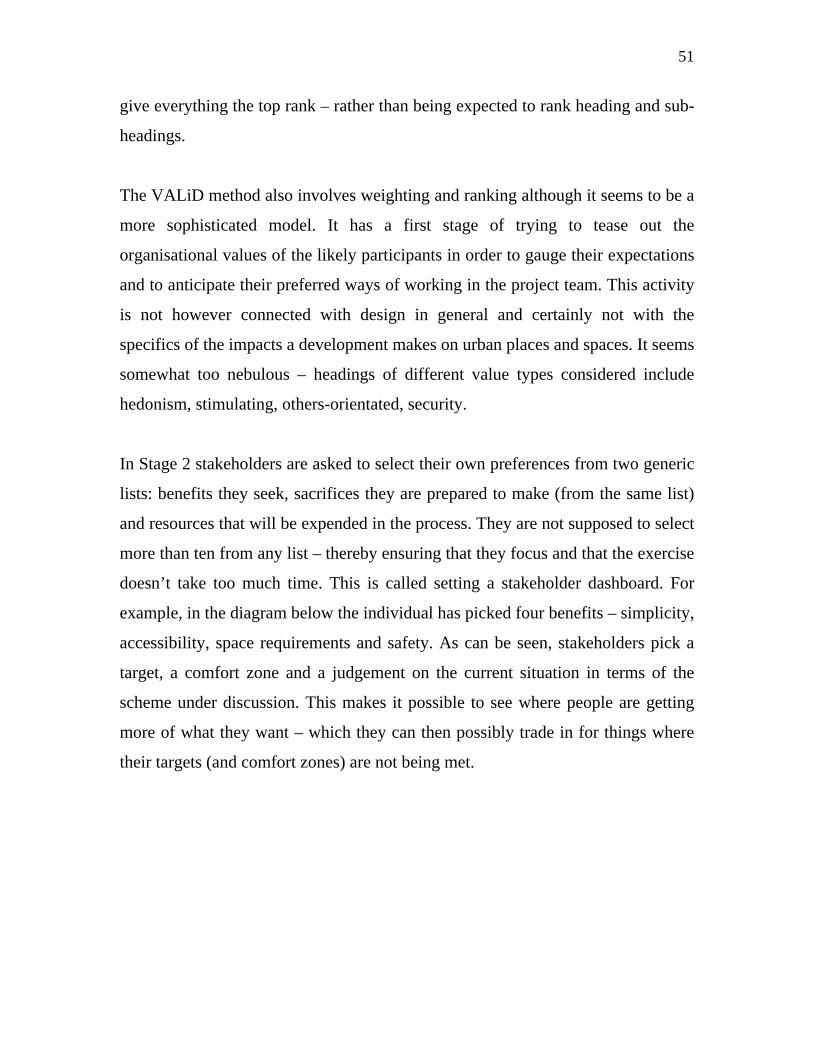
In Stage 2 stakeholders are asked to select their own preferences from two generic
lists: benefits they seek, sacrifices they are prepared to make (from the same list)
and resources that will be expended in the process. They are not supposed to select
more than ten from any list – thereby ensuring that they focus and that the exercise
doesn’t take too much time. This is called setting a stakeholder dashboard. For
example, in the diagram below the individual has picked four benefits – simplicity,
accessibility, space requirements and safety. As can be seen, stakeholders pick a
target, a comfort zone and a judgement on the current situation in terms of the
scheme under discussion. This makes it possible to see where people are getting
more of what they want – which they can then possibly trade in for things where
their targets (and comfort zones) are not being met.

52
Figure 9: Setting Benefits in a Stakeholder Dashboard
The sacrifice scale consists of things that the stakeholder is prepared to
compromise on in order to derive benefits.
Figure 10: Setting Sacrifices in a Stakeholder Dashboard

53
The final aspect of resources is a further way in which the stakeholder is forced to
reflect on what they are looking for. Resources include risk (delays in securing
planning approval), costs (such as security and waste disposal) and time delays
(such as community consultation).
VALiD considers value delivery performance as the fulfilment of stakeholders’
expectations. By comparing each stake holder’s current judgement of the project
solution’s current fulfilment of their benefits, sacrifices and resource with the
targets they set for those benefits, sacrifices and resources, a measure of
expectation fulfilment (i.e. “value delivery”) is arithmetically determined as the
ratio of judgements to targets. This calculation is performed within each
stakeholder’s individual dashboard. Taking any stakeholder importance
weightings into account, VALiD then aggregates these “value ratios” to provide
pictures of value delivery performance in further numerical dashboards that
summarise project performance in delivering value to all customer stakeholders,
all provider stakeholders, and to the project as a whole. Data entered into the pro-
forma excel spreadsheet is periodically used to (instantly) calculate a ‘value ratio’
for each stakeholder and for the project as a whole. Analysis is likely to be done
by the project facilitator.
As the figure below also shows, there are also various methods for weighting
according to the stakeholders’ importance – thereby helping lessen, if not
removing, the worry that stakeholders are all treated equally when, in fact, their
ability to resource their differing claims may vary wildly (i.e. between a poor
representative from a community group and someone from a large construction
company).

54
Figure 11: The Overall VALiD Dashboard
What Methods Exist – and What are Needed?
Various methods exist for developers to gauge likely rental streams over a
prolonged period. There is also the Hedonic approach that helps to isolate the
value that the property market places upon different elements of the external
environment. However, the information offered here is very much about how the
market performs. Thus, it is not about the nature or amount that buyers might like
if they had more choice. Nor is it about what designs developers would offer if
they could be more certain of benefiting. Such certainty could come through some
sort of collective investment pact with neighbouring property owners and/or other
developers. Multi-Criteria Analysis, although it doesn’t offer any sort of monetary
valuation, does allow the opportunities for the sorts of dialogue that would appear
to be needed for these new market possibilities to emerge.

55
Methods for Assessing the Value for the Public Stated Preference Techniques
Stated preference approaches deal with hypothetical environmental futures and, as
such, are something those interested in valuing proposed changes to the built
environment must consider. The techniques also, crucially, discuss valuations in
money terms – asking whether the value people claim to have for some
environmental change (or preservation of the status quo – such as preservation of
an old building) exceeds the costs of that change. The poor are seen as having no
value for things – those unable to afford some environmental good are treated as
having zero value for it. From an economic viewpoint this is perfectly valid. The
two approaches that are of most direct relevance (Contingent Valuation and
Choice Modelling) gauge peoples’ views about what they would be willing to pay
for something – whether they actually use it or not.
Stated Preference methods are the main way of estimating non-use. This can
include:
• altruistic use – knowing someone else might like it
• option use – having the opportunity to do something if you want
• bequest use – leaving something for the future
• existence use – satisfaction that things exist even if you don’t enjoy them
personally
Because users have difficulty saying how much of their value is attributable to use
and non-use values, non-use value is only measured by talking to non-users.
There is a dilemma that affects both contingent and choice modelling approaches –
namely, that when people say what they would value there is no way of knowing
how other people will actually use it. Admittedly, contingent and choice methods
might make it possible to discern that people value some places more if they have
few visitors (a small space near a church, say) and value others because of the

56
‘urban buzz’ factor. But, once a building is built it’s impossible to know whether
everyone will then visit and be disappointed because too many people are there –
or because the reverse is the case. Hopefully, the transfer of data from existing
visit studies (see ahead) can help here.
The two methods differ in that one asks directly about willingness to pay for a
proposed change to an environmental good (usually a specific site) or service
whereas the other attempts to tease out this willingness by exploring peoples’
preferences for various different environmental variables (including cost).
Contingent Valuation
This is the most widely accepted method in environmental economics for dealing
with total economic value – both use and non-use. The most common form is
discrete/dichotomous choice which asks: would you pay the following to get a
certain change – yes or no. There are various checks in place to stop people
exaggerating their willingness or ability to pay. Questions are asked of a randomly
selected sample (usually 350-500) of the relevant population and are conducted by
mail, phone or in person. Participants are randomly assigned different values
(payment amounts) and asked if they would be willing to pay this amount to
secure a proposed change. The amounts are usually small – as the costs of a
development are likely to be spread over many people (rate/taxpayers) and many
years. Ideally, the values should hover around the actual costs likely to be
involved for different changes to the status quo.
Respondents are typically asked to comment on three choice options. One of these
will be the status quo (do nothing) situation. In the case of a proposed urban
development the do-nothing situation would most probably be replaced by the
development that would go ahead anyway – and then a couple of options that the
public might wish to pay more for but which the developer might feel would not

57
lead to direct returns to them on their investments. It is important that respondents
think that there is a payment vehicle by which the questions they are being asked
might genuinely happen – for example, they might be asked ‘would you be willing
to pay amount x on your Council Tax to secure the following change’. Examples
of the sort of visual material a respondent might face are given below. It relates to
an imminent re-design of Finsbury Park tube and bus station – essentially the first
figure is the planned development and the two subsequent minor options offer the
respondents a cctv system and, secondly, a cctv system and a bike racks. The
material is attractive and clear – if presentations are too elaborate there is evidence
that respondents start valuing the presentation as well as the development.

58
Figure 12 a, b and c: Proposed Development at Finsbury Park – No Payment Required
would you pay an extra 10p a year on your Council Tax to support this?
would you pay an extra 11p a year on your Council Tax to support this?

59
Once the data has been collected researchers estimate3 the average value for an
ne key drawback is that, in everyday life, people are rarely asked to perform
hoice Modelling
lling a survey respondent is given a number of situations on a
individual or household and then extrapolate this to the relevant wider population.
The results can be disaggregated into several variables, like income and age.
Median willingness to pay is more robust to outliers and of more interest to policy
makers worried about political support yet, for the purposes of cost benefit
analysis, it is mean/average WTP which is most appropriate.
O
such difficult cognitive tasks. Instead they have the opportunity to engage in
repeated transactions over time, they have opportunities to explore in some detail
the markets for substitutes and complements and have the opportunity to acquire
substantial information.
C
With choice mode
set of cards that differ according to a few key attributes. In some cases, visual aids
such as videos or photos may be used to help respondents understand the scenario
they are being asked to value. Respondents are then asked to select their preferred
set. The inclusion of price as one of the attributes allows for the derivation (using
logit modelling techniques) of implicit prices for each of the other attributes. This
approach is particularly suitable for the valuation of environmental goods, since
these goods are almost invariably multidimensional in character. An example is
given below of one such choice experiment. There are often just three sets on offer
(one being the ‘do neither of the other two’ option) - if a respondent is faced with
too many choice cards/images it may simply be too much of confusing task. It is
then a bit like hedonics in that it splits up value into contributing factors.
3 Analysis includes regression (for open-ended data) and Logit models (for yes-no responses).

60
Choice can also help in refining which aspects of the built environment people do
and don’t care about. Whilst choice modelling makes it possible to isolate values
for individual aspects of an environment it can also show things that people simply
don’t really have preferences for – this may be revealed statistically through
various repeat exercises that establish what is and isn’t important or simply by
people saying they don’t care when doing the exercise. In this case things like the
type of materials proposed for a building might well be left to the experts. The
Choice approach is also useful because it can discern between whether it is the
buildings or the activities that take place around them that people like (for
example, the bookstalls, street performers and outdoor cafes on London’s South
Bank) rather than the building and design aspects. If these activities turn out to be
highly valued it has useful implications for designers and building/space
managers. It should even be possible to assess how our knowledge of what goes
on inside a building affects our valuations of it - for example how peoples’ views
on gambling affect their enjoyment of a casino’s design.

61
Figure 13: (Environmental) Example of Choice Modelling
Forest A Forest B
Type of trail
Multi-use trails + dedicated way marked, long distance (+ 20 miles)
cross country bike trails.
+
Multi-use trails + dedicated technical single track mountain bike
trails.
+
Optional trail obstacles
No optional trail obstacles.
A range of optional trail obstacles provided including jumps, drop-offs,
and north shore.
Bike wash facilities
Bike washing facilities available.
No bike wash facilities.
Changing and shower facilities
Changing / shower facilities available.
No changing / shower facilities.
General facilities
Facilities included car parking, toilets, BBQ / picnic area, café and
forest shop.
Facilities include car parking and toilets only.
Information
Only basic information on the forest,
trails, and wildlife provided.
Detailed and up-to-date information on the forest, trails, and wildlife
provided at forest centre, in leaflets, along trails and on website
Surrounding
Forest not managed to increase opportunities to view wildlife, points
of interest and view points.
Forest enhanced to increase opportunities to view wildlife,
features of interest and view points.
Distance Forest located
300 miles from your home.
Forest located 150 miles
from your home. Forest A Forest B
My preferred forest is: I would allocate my next 5 trips (to be taken within the next year) to:
Forest A Forest B Stay at home
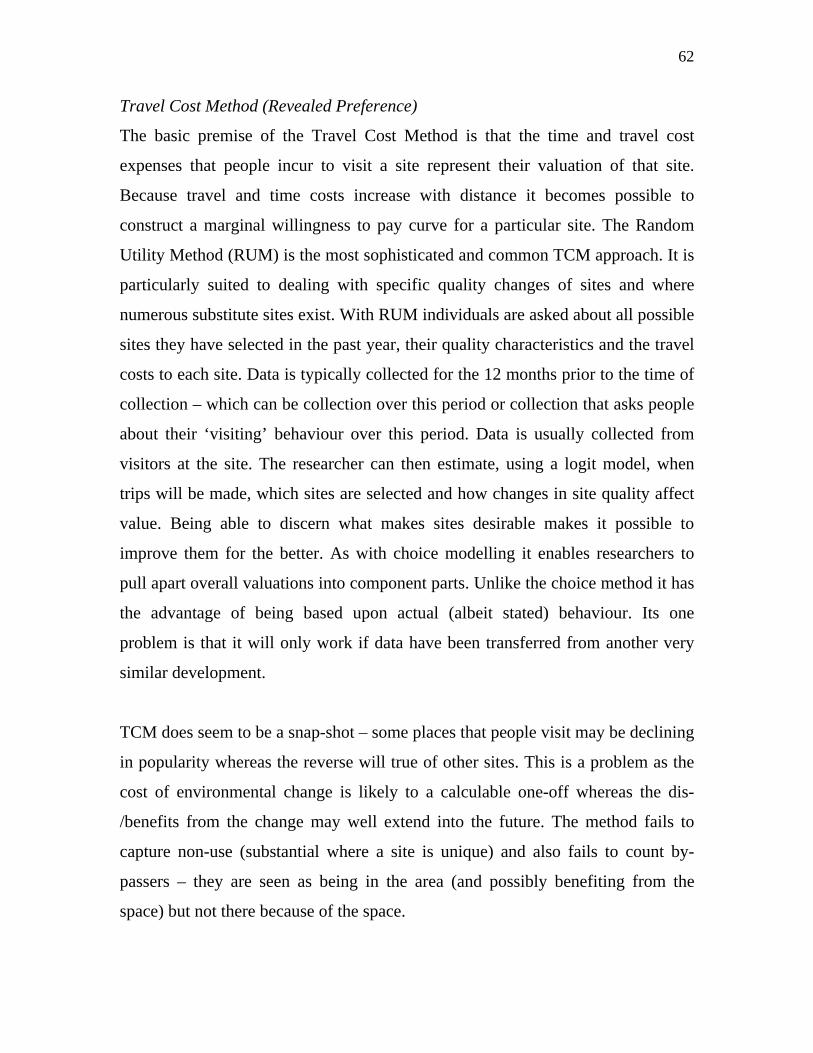
62
Travel Cost Method (Revealed Preference)
The basic premise of the Travel Cost Method is that the time and travel cost
expenses that people incur to visit a site represent their valuation of that site.
Because travel and time costs increase with distance it becomes possible to
construct a marginal willingness to pay curve for a particular site. The Random
Utility Method (RUM) is the most sophisticated and common TCM approach. It is
particularly suited to dealing with specific quality changes of sites and where
numerous substitute sites exist. With RUM individuals are asked about all possible
sites they have selected in the past year, their quality characteristics and the travel
costs to each site. Data is typically collected for the 12 months prior to the time of
collection – which can be collection over this period or collection that asks people
about their ‘visiting’ behaviour over this period. Data is usually collected from
visitors at the site. The researcher can then estimate, using a logit model, when
trips will be made, which sites are selected and how changes in site quality affect
value. Being able to discern what makes sites desirable makes it possible to
improve them for the better. As with choice modelling it enables researchers to
pull apart overall valuations into component parts. Unlike the choice method it has
the advantage of being based upon actual (albeit stated) behaviour. Its one
problem is that it will only work if data have been transferred from another very
similar development.
TCM does seem to be a snap-shot – some places that people visit may be declining
in popularity whereas the reverse will true of other sites. This is a problem as the
cost of environmental change is likely to a calculable one-off whereas the dis-
/benefits from the change may well extend into the future. The method fails to
capture non-use (substantial where a site is unique) and also fails to count by-
passers – they are seen as being in the area (and possibly benefiting from the
space) but not there because of the space.

63
What Methods Exist – and What Are Needed?
The methods reviewed in this section have shown that, if a developer (or collective
of developers) feels unable to commit to creating a public frontage beyond that
which will yield a commensurate benefit, there are still techniques that might be
applied that could see the development of space that is public (or directly abuts
public space) ‘topped up’ with public money (the money people claim to be
willing to pay). There is then a way to attribute value to the sorts of public spaces
that and building frontages that developers want and that the public wants. With a
development that consists of, say, a whole housing estate.
What doesn’t exist is any way of attributing value to the poor using existing
economic valuation techniques. This is not something that occurs in other spheres
of life – people on the most meagre income are entitled to vote and to undertake
jury service. In other words, there are areas where the public are free, irrespective
of income, to make valuations that are important to society. The children and the
elderly are likely to be very prominent amongst those seen as having no value.
Perhaps then a method can be derived that gives the poor (and other groups) an
environmental allowance of some description – to be used in contingent valuation
surveys. It is not the aim here to come up with such a mechanism – merely to raise
the issue.
Reference was made in the stated preference work to surveying the ‘relevant
population’ without any discussion of what this might mean. Who should be
surveyed when a development is being proposed? Reference was also made earlier
(figure 3) to the numerous stakeholders that might have an interest in a
development. So far the focus has been on the developer (and, possibly,
neighbouring organisations and other developers investing in adjacent sites) and
the general public. The key task here is to identify who should be surveyed
amongst the general public? Perhaps the answer then is for any proposed

64
development to have an agreed geographical sphere of influence and for a random
sample survey to then be conducted over this sphere but with some form of
distance decay applied to results. This idea of distance decay is particularly useful
for development in regeneration areas since these may simply not have a
neighbouring population. This survey could also include tourists.
Negotiation and Decision Negotiating Positions
Figure 14 shows the process through which any proposed development can be
considered. It serves as a conceptual framework for thinking about the valuation
process from start to finish. The monetary techniques are left until the latter stages
because it is only then that there will be concrete options to put to the public – the
aim being to ask about their willingness to pay. This could be done earlier in the
development process but people cannot be expected to state willingness to pay
unless there is a strong chance a development will actually proceed.

65
Figure 14: Conceptual Framework for Valuing the Built Urban Environment
Table 11 is an attempt to start mapping out the potential win-wins – those that all
parties put a positive value on. It can also identify conflicts – where one party sees
something as negative and another as positive.
With a multi-criteria analysis approach there will be differences in how people
score an option overall and also in terms of which aspects are particularly
contentious. With the VALID approach there can be trading between different
stakeholders in terms of what they will concede. However, in terms of making
decisions between two factors that rank equally there isn’t, in the absence of a

66
monetary value, a way of saying with certainty which factor should take
precedence and by how much. With monetary techniques it will be possible to
calculate which aspect about a development is valued more.
One issue not mentioned so far is how to compensate those who are opposed to a
development and yet have no property (and so have nothing whose value can
decline). One technique that can be employed here is willingness to accept
compensation (WtA). Since it is not constrained by income, this is something that
the poor, like the rich, can state when asked.
Table 11: Framework for Negotiation Between Developer and Stakeholders for an Option
Option 1 Costs Developer
Ability to PayStakeholder Value (including willingness to pay or be compensated)
Calculations (total value minus costs)
Deals (identify win-wins &conflicts)
Land Value
Property Value
Scale Interior Quality Use(s) Exterior environment
Public Value Parking Servicing Crime Reduction Space for exercise Contextual Value
Transport links Effect on urban character
Effect on urban economy
Etc.
This column can assess whether there is a net value from the proposed development and will make it possible to identify who does and does not value each different element.
This column is where win-win spending is decided and where finance is sought for aspects that are under-valued. This money may come from a land tax, Section 106, public spend or, where people are willing to pay more than the costs.

67
Conclusions – Taking Value Mapping Forward Reflections on the Project
The research work has synthesised a great deal of knowledge and experience that
is, or could be, brought to bear upon valuing the built urban environment. The
seminars that were held revealed that no-one actually felt they had the answer to
valuing different options and making deals on the different elements that make up
these options. The project has moved forward in offering ways for doing this and,
in the process, created a community of interest in the issue of value mapping.
Value maps have been designed that give an overview of the key issues at stake.
The initial map identified four main layers of value and then pointed to different
aspects of these layers. Of particular importance was the notion of needed to
increase the overlaps between what is valuable for the development and value for
the potential site users and the wider urban area. The second map outlined out the
overall process and the points at which different methods could be employed. The
third map offered a way for starting to tackle the values (rankings or, preferably,
willingness to pay) that developers and the public have for different options on the
table.
The project also revealed that the public is rarely involved in the design process at
an early stage. Until this can occur decisions will not have full legitimacy. This
involvement needs to be one of dialogue – (two-way) education and discussion
rather than ticking boxes. By opening up the development process we can
hopefully make it more transparent.
Another measure would be to consider ways of ensuring that the public have
genuine opportunities to value the urban environment. They can only really do this
if they genuinely believe that their choices will require them to make some form of
sacrifice. For wealthier individuals and groups this might be mechanisms to assess

68
public willingness to pay on different development options. For the cash poor
there might instead be mechanisms that allowed them a say on environmental
decisions in return for them offering to give time to some good cause (this time
then could be converted by the planning authority into monetary terms). In
discussing the process and offering ways for the poor to value options, the project
will hopefully help in making the process more democratic and egalitarian.
All of the methods have weaknesses. The MCA approaches will need to be re-
designed to incorporate a much more sophisticated version of values – both
tangible and intangible. These values will go beyond the normal building focus of
MCA to a wider concern with good places.
The Way Forward
The obvious next step for the value maps sketched out here is to test their
robustness and relevance in real contexts. The steps for a value mapping pilot are
outlined in Appendix 1. This also discusses management issues and the
practicalities of finding appropriate sites and willing participants.
The issue of language is important here. In addition to the value mapping term
itself, it would be useful if other terms came to be commonplace in the lexicon of
designers, architects and developers. An example might be ‘public value added’
(or in the worst cases ‘public value destroyed’).
In addition to the practical action the case is strong for other developments that
would drive work forward in the future, including:
• a team within CABE focused on valuation work and building up a database
of examples, from around the World. The database would look at the
application of valuation and decision-making tools to proposed and existing
urban developments.

69
• a unit within a university, preferably a new type of centre that brings
economists and designers together. This would look to start applying the
environmental economics techniques to the built environment. It would also
look to design an MCA tool that was much more suitable for looking at
what makes good places rather than just good buildings. Ideally, there
would also be individuals whose skill sets bridge design and economics.
• a network of practitioners and academics working in the field to accelerate
mutual learning.
The clear need is for practical action rather than research – resources should focus
very much upon the former. However, there are issues where research is needed:
• knowledge on design quality and its relationship with economic value.
• knowledge on design quality and its relationship with public value.
• knowledge on how mainstream valuation can better reflect place design.
• knowledge on how to extrapolate current values into the future.
One thing that has been clear from project discussions and seminars is that
participants, including non-designers, have favourite places and spaces and like
talking about them. People may lack design expertise but know what they like.
Discussion on design can be very sociable in that all can have an opinion. So the
Value Mapping project should have as a good reserve of good will to draw upon.
The key issue is that those championing the agenda take the time necessary to
produce quality methods – valuation methods and the developments they lead to
are likely to outlast those involved in commissioning and conducting this project.

70
Bibliography Impacts and Indicators
Guetzkow, J. (2002), How the Arts Impact Communities, Centre for Arts and
Cultural Policy Studies-Working Paper, (Princeton University, New Jersey).
Kelly, A. and Kelly, M. (2000), Impact and Values: Assessing the Arts and
Creative Industries in the South West, (Bristol Cultural Development Partnership,
Bristol).
Landry, C. et al. (1993), The Social Impact of the Arts: a Discussion Document,
(Comedia, Stroud),
Lichfield, N. (1996), Community Impact Evaluation, (UCL Press, London).
McCarthy, K. et al. (2004), Gifts of the Muse-Reframing the Debate about the
Benefits of the Arts, (RAND Corporation, Santa Monica).
Reeves, M. (2002), Measuring the Economic and Social Impact of the Arts: A
Review, (The Arts Council of England, London).
Throsby, D. (2000), Economics and Culture, (Cambridge University Press,
Cambridge).
Environmental and Ecological
Chambers, N. et al. (2000). Sharing Nature's Interest: Using Ecological
Footprints as an Indicator of Sustainability, (Earthscan, London).
Reid, A. (2004), Environmental Impact Assessment, (Scottish Parliament
Information Centre, Edinburgh).
Schmidt-Bleek, F., (1992), MIPS - A Universal Ecological Measure, Fresenius
Environmental Bulletin, 2, pp. 407-412.
Wackernagel, M. and Rees, W. (1996) Our Ecological Footprint, (New Society
Publishers, Cabriola Island).
Weizsäcker, E. von, et al. (1997) Factor Four: Doubling Wealth - Halving
Resource Use. (Earthscan, London).

71
Property and Environmental Economics
Bateman, I. ed. (1998), The Economics of Non-Market Goods and Resources,
(Kluwer Academic Publishers, Dordrecht, NL)
Bateman, I. et al. (2002), Economic Valuation with Stated Preferences
Techniques. A Manual, (Edward Elgar, Cheltenham).
Boyd, T. (2005), Assessing the Triple Bottom Line Impact on Commercial
Buildings, presentation to the Queensland University of Technology Research
Week International Conference, 4-8 July 2005 Brisbane, Australia.
Boyle, K. et al. (2003), A Primer on Non-market Valuation, (Kluwer Academic
Publishers, Dordrecht, NL)
Brouwer, R. (2000), Environmental Value Transfer: State of the Art and Future
Prospects, Ecological Economics, 32, pp. 137–152
Eclipse Research Consultants, (June 2005), Better Designed Buildings: Improving
the Valuation of Intangibles, (RIBA/DTI, London).
Eftec Consultancy, (2005), Valuation of the Historic Environment, (Eftec,
London).
Frontier Economics, (2004), Quality of Place and Regional Economic
Performance, Draft Evaluation of the Existing Evidence and Investment Checklist,
(Frontier Economics, London).
Garrod, G., and Willis, K. (1999), Economic Valuation of the Environment,
(Edward Elgar, Cheltenham).
Hicks, R. (2002), A Comparison of Stated and Revealed Preference Methods for
Environmental Management, (The College of William and Mary, Williamsburg,
VA).
Hildreth, P, (2005), Quality of Place: the Economic Case for Investment,
Museums Association Conference October 25th, Queen Elizabeth II Conference
Centre, (ODPM, London).

72
Kingston University, The Sustainable Property Appraisal Project,
http://www.sustainableproperty.ac.uk
Millington, A. (2001), An Introduction to Property Valuation, (Estates Gazette,
London).
Pearce, D. (2003), An Executive Summary of the Social and Economic Value of
Construction, (nCRISP, London).
Taylor, L. (2003), The Hedonic Method, in A Primer on the Economic Valuation
of the Environment, eds. Champ, P. et al. (Kluwer, Dordrecht).
Ward, F. and Beal, D. (2000), Valuing Nature with Travel Cost Models, (Edward
Elgar, Cheltenham).
Organisational Performance
Emerson, J. (2003), The Blended Value Proposition: Integrating Social and
Financial Returns, in California Management Review, 45, 4 (Summer).
FRC Group, (2005), Our Social Report 2003-2004, (Furniture Resource Centre,
Liverpool).
Guardian, The (2005), Living Our Values, Social, Ethical and Environmental
Audit, (The Guardian, London).
Henriques, A. and Richardson, J. (2004), The Triple Bottom Line: Does It All Add
Up? (Earthscan, London)
ISEA, (2005), Social and Ethical Accounting, Auditing and Reporting, (The
Institute of Social and Ethical AccountAbility, London)
NEF, (2004), Getting Out to Work Merseyside: A Social Return on Investment
Analysis, (NEF, London)
NEF, (2004), Social Return on Investment - Valuing What Matters, (NEF,
London)
Pearce, J. et al (year), Social Auditing for Small Organisations: The Workbook,
(NEF, London).
People & Planet (2003), Social Audit 2002-2003, (People and Planet, Oxford).

73
REDF, (2001), SROI Methodology, (Roberts Foundation, San Francisco).
Design
Area Characterisation - http://www.english-heritage.org.uk/server/show/nav.1292
CABE SPACE, (2005), The Value Of Public Space-How High Quality Parks And
Public Spaces Create Economic, Social And Environmental Value, (CABE,
London).
Carmona M. and Sieh, L. (2004), Measuring Quality in Planning: Managing the
Performance Process, (Spon Press, London).
Carmona M., et al. (2001), The Value of Urban Design, (CABE, London).
Design Quality Indicator - http://www.dqi.org.uk/DQI/default.htm
Historic Landscape Characterisation Project - http://www.english-heritage.org.uk
Local Environmental Quality Survey tool – http://www.encams.org
Minton, A. (2006), The Privatisation of Public Space, (RICS, London).
Placecheck – http://www.placecheck.info
Quality of Life Capital – http://www.countryside.gov.uk
Sustainable Development Indicators http://www.sustainable-development.gov.uk
The Design Dividend Project http://www.propertyoz.com.
Valid, (2005), The VALID Practice Manual, (Kingston University, London).
VALID, (2005), Valid Practice Manual, (Loughborough University,
Loughborough)
Mapping and Visualisation
Card, S. et al, (1999), Readings in Information Visualisation: Using Vision to
Think, (Morgan Kaufmann Series in Interactive Technologies, San Francisco).
Harris, R. (1999), Information Graphics: A Comprehensive Illustrated Reference,
(Oxford University Press, Oxford).
Spence, R. (2001), Information Visualization, (ACM Press Books, New York).
Tufte, E. (2001), Visual Display of Quantitative Information, (Graphic Press, US).
74
Tufte, E. (1990), Envisioning Information, (Graphic Press, US).
Wildbur, P. and Burke, M. (1998). Information Graphics: Innovative Solutions in
Contemporary Design, (Thames and Hudson, London).
General
CABE, (2005), Physical Capital - How Great Places Boost Public Value, (CABE,
London).
Crabtree, J. (2004), Public Value, New Statesman, Sept 27.
DCMS, (2005), Better Places to Live - Government, Identity and the Value of the
Historic and Built Environment, (DCMS, London).
Kelly, G. et al. (2002), Creating Public Value: An Analytical Framework for
Public Service Reform, (Strategy Unit, Cabinet Office).
Moore, M. (1997), Creating Public Value: Strategic Management in Government,
(Harvard University Press, Boston).
Mootanah, D. (2005), Researching Whole Life Value Methodologies for
Construction, (Construction Industry Research and Information Association,
London).
Mulgan, G, (2005), Public Value, Physical Capital and the Potential of Value
Maps, in Physical Capital-How Great Places Boost Public Value, (CABE,
London).
NERA, (2002), DTLR Multi-Criteria Analysis Manual, (National Economic
Research Associates, London).
ODPM, (2004), Living Places: Caring for Quality, Urban Research Summary, No.
15, (ODPM, London).
OGC (2005), Successful Delivery Toolkit - Life Cycle Costing, (Office of
Government Commerce, London).
UTF, (2004), Towards a Strong Urban Renaissance, (Urban Task Force, London)
Hausman, D. and McPherson, M., (1996), Economic Analysis and Moral
Philosophy, (Cambridge University Press, Cambridge).

75
Werhane, P. and Westra, L. (eds.), (1998), The Business of Consumption:
Environmental Ethics and the Global Economy, (Rowman & Littlefield, New
York).

76
Project Management Geoff Mulgan - The project has been overseen by Dr Geoff Mulgan CBE, Young
Foundation Director. Geoff became director of the Young Foundation in
September 2004. Between 1997 and 2004 he had various roles in government
including director of the Government’s Strategy Unit and head of policy in the
Prime Minister’s office. Before that he was the founder and director of the think-
tank Demos, described by the Economist as the UK’s most influential think-tank;
chief adviser to Gordon Brown MP; a consultant and lecturer in
telecommunications; and an investment executive. He began his career in local
government in London. He has been a reporter for BBC TV and radio and a
columnist for national newspapers including the Guardian and Independent. Geoff
is a World Economic Forum Global Leader of Tomorrow, and was ranked in 2004
as one of the UK’s 100 leading public intellectuals. He has lectured in over 30
countries. He is a visiting professor at LSE and UCL, and a senior fellow at the
Australia New Zealand School of Government. His most recent book is Connexity
(Harvard Business Press and Jonathon Cape, 1998). Previous books include:
Saturday Night or Sunday Morning (Comedia, 1987); Communication and
Control: Networks and the New Economies of Communication (Blackwells,
1991); Politics in an Anti-political Age (Polity, 1994); Life After Politics (Harper
Collins, 1997). He has two books forthcoming in 2006: Good and Bad Power; and
The Art of Public Strategy.
Gareth Potts - the report-writing, seminar presentations and day-to-day project co-
ordination was led by Dr. Gareth Potts, a Young Foundation Research Associate.
In addition to his PhD (economic geography) he holds a Masters degree in Civic
Design and a first degree in Social Policy and Administration. After his PhD (on
universities’ roles in regional economic development) he worked on the ESRC-
funded Cities Programme where his work included a book chapter on the links

77
between economic competitiveness and the social fabric (social capital, social
cohesion and social inclusion). After this he worked at the New Economics
Foundation where his work included co-authoring two reports for the Inner City
100 project (researching and promoting the UK’s most dynamic inner city
entrepreneurs) and two reports for central Government on enterprise in deprived
areas. Between that post and his present job he worked for Marsh Farm
Community Development Trust, Luton covering various capacity building and
strategic tasks. He is author of a review article for the journal Economics and
Philosophy on the work of Professor John O’Neill, Director of Lancaster
University’s Institute for Environment, Philosophy and Public Policy. He has also
reviewed the book ‘Environmental Ethics and the Global Economy’ for the
Journal of Applied Philosophy. He has contributed numerous articles to the
regeneration press ranging from professional football clubs’ community schemes
to the idea of establishing a national Citizens Research Network whereby residents
in disadvantaged areas can be supported to conduct research on these areas locally
and, through the Network, nationally. He currently serves on the Research
Advisory Board of the Urban Forum.
The Project Team The Bartlett School of Planning, UCL
The Bartlett team has been led by Professor Matthew Carmona, who has
successfully undertaken a range of research projects for CABE. Matthew Heads
up the Bartlett School of Planning and has published extensively around issues of
urban design, public space and its management, design policy and control, design
value, and the measurement of design quality. Currently, Matthew serves on the
‘Urban Design Skills Working Group’, and is a member of the Royal Town
Planning Institute’s General Assembly. He is on the editorial board of ‘Urban
Design Quarterly’, is European Associate Editor for the ‘Journal of Urban

78
Design’, and is series editor for the ‘Design in the Built Environment’ book series
from Ashgate. In 2002 Matthew worked with Norman Foster & Associates to win
the West Kowloon Cultural District International Master-planning competition.
He has undertaken a wide range of research projects from funders that include:
DETR, CABE, RTPI, ESRC, ODPM, the Housing Corporation, and the Audit
Commission.
Claudio de Magalhaes is a senior lecturer in planning and urban regeneration, with
a background in architecture and town planning. Prior to moving to the UK in the
early 1990s, he worked for 12 years a senior planner in local and regional
government in Brazil, acquiring considerable experience in urban governance and
in the management of urban investment programmes for urban and regional
development. As an academic, his interests are in urban planning and the
governance of the built environment, property development processes and urban
regeneration policy. He has conducted research for ESRC, RICS, CABE, local
authorities and UK Government Departments and published on property markets
and globalisation, capacity building for urban governance, and the relationship
between urban governance, the built environment and property markets. His more
recent research focuses on the relationship between urban governance and
increasingly globalised property markets, design and the management of public
spaces.
Louie Sieh is an Architect and Senior Research Fellow at the Bartlett School of
Planning. She trained as an architect at Cambridge University and the
Architectural Association in London. She has practised as a built environment
consultant, primarily as a master-planner and urban designer. Louie joined the
Bartlett in 2002 where she worked in the area of performance management in the
public sector through which she contributed to the ODPM Working Group for a
national planning quality indicator. Her research interests span strategic

79
management in the public sector, the creation of value in urban public space, and
the relationship between built environment production, consumption and its
governance. She is currently completing a PhD entitled “Public Space
Governance – Questions of Value in the Urban Public Realm”. Louie is on the
editorial board of “Transactions”, a journal of the Centre for Education in the Built
Environment (CEBE).
Imperial College, University of London
Guidance around the environmental economics field was commissioned from Dr
Susana Mourato, a Lecturer in Environmental Economics at Imperial College
London’s Department of Environmental Science and Technology. Susana is an
economist (MSc Economics, New University of Lisbon; PhD Economics,
University College London), specialising in environmental economics and an
expert in the application of non-market valuation techniques to the measurement
of environmental, social and cultural change. Her recent research has focused on
testing and developing choice modelling techniques: her work in this area has been
published in various international journals. She has worked on more than 40
research projects and consultancies for research councils, governments, industry,
charities and international organisations.
Sharpe and Pelipenko
At both stages of the project we have involved a practising designer involved. In
this particular individuals’ case, he also has the capacity to develop new software
tools using these methods. The person who has agreed to work with us, Chris
Sharpe (BArch, DipArch, Mackintosh School of Architecture, Glasgow), is
founding partner of Sharpe and Pelipenko, an urban design software company that
recently created the street design program ‘Streetscape’ and continues to develop
urban design and planning tools. He has worked as an urban designer at Alan
Baxter and Associates and Bernard Engle Architects and Planners in London. He

80
has had experience of residential-led and retail-led mixed-use master-planning,
movement engineering, conservation, characterization and community planning
exercises.
Young Foundation
James Audsley provided valuable intellectual and practical input to the CABE
project between late 2005 and March 2006 when he worked as a Research
Assistant at the Young Foundation. He has a BA in Geography from Oxford
University and worked as an intern on the Transforming Neighbourhoods project
over the summer of 2005. His interests focus on regeneration, city design and
community issues. He is currently developing his research dissertation on the
redevelopment of the World Trade Centre for publication. Previously he has
interned with Transport for London’s Policy and Strategy team, as an MP’s
assistant and in George Wimpey’s Land and Development team (City Region).
His main work at the Young Foundation consisted of working on the development
of the Neighbourhood team’s ‘neighbourhood wiki’ and conducting research
across the spectrum of the project’s work.

81
Appendix 1: Suggested Value Mapping Pilot Stage 1 – Getting the Site and Participants
• Use Type: The method would be applied to a planned development that is
at the very early stages. Sites might fall into categories such as: residential
development – housing or flats; transport interchange; city centre mixed-
use development; offices / factories; stadia. Resources permitting, each of
the developments would be valued – thereby making it possible to see if
some types/scales of development proved harder to value than others. For
example, a proposed building overlooking a large public open space might
be considerably easier to value than a sizeable neighbourhood housing
development that had numerous different foci (cul-de-sacs, playing areas,
housing styles etc.).
• Stakeholders: the next stage is to identify the developer and their
consultant team of professionals. Also important will be neighbouring
property owners – somehow these individuals seem worthy of being given
additional weighting to the wider general public. The ‘general public’ will
need to be randomly selected. The selection method for participation in all
the main types of approaches advocated here ensures that the population
chosen will vary in incomes – so no one group should dominate (at least not
until willingness to pay methods are employed - and adjustments can be
made even when those measures are adopted). he geographical coverage of
the selection will be determined by the intended scale of the development –
a community building will need to see the general public meaning those
within, say, a mile radius whereas an international arts venue will need, at
the least, a national level definition of the public. The more local a
development is the less the cost is likely to be and the less the money spent
on consultation is likely to be.

82
• Persuading Participants – Private Sector: The key with a private
developer in particular is to talk profit – the methods discussed here offer
the possibility of funding the types of high-yielding developments that the
developer couldn’t afford on their own. Also, the more that public
objections are identified and addressed early in the development process,
the less likely developers are to be stuck in lengthy and costly planning
enquiries. However, a developer could just decide to hope that other
developers will be the first guinea-pigs. The more sophisticated their
understanding of what makes places that last the greater will be the chance
of them identifying long-term profits.
• Persuading Participants – Public Sector: An alternative here is to
persuade a public sector developer to adopt the approaches outlined here –
if, say, a local authority is interested in good design it should also consider
engaging in a value mapping exercise for its own proposed developments.
One approach might be to identify where a local authority is keen to release
land for development. For logistical reasons (i.e. meetings with key
stakeholders) the local authority should ideally be located in or near to the
organisation conducting the valuation exercise. Given that several types of
development are likely to be involved it would be most practical to involve
several authorities – one per development. There are several high profile
opportunities for piloting – obvious ones being developments in the
Thames Gateway and the Northern Way. That the methods were being
applied in such settings would further raise their profile. If a ‘live’
development is still not forthcoming there could be a 'retrospective' exercise
– i.e. using projects that have already happened.

83
• Persuading Participants – the Public: Retrospective exercises might be
hard to enthuse people about. In terms of getting the public to engage in a
value mapping pilot they could be reminded that it is them who will have to
live, for better or worse, with the eventual development. Ideally, there
would be ways of making them pay for the development when it was built
too – unlikely though for a pilot exercise.
Stage 2 – Ascertaining Needs
• Ascertaining Needs: This will be a mix of the developer deciding what
they want from a development and the public being asked (by an
independent body with design expertise – ideally a local planning authority
since it is democratic) what they want. The public will be engaged in two-
way discussion and the developer will generate the chosen volume and lay-
out that they think will give them the maximum profit (within the bounds of
the uses and scales permitted in the local plan). This is often a somewhat
‘back of the envelope’ affair – an attempt to work out what might be
achieved in terms of flats, offices floor-space etc. (i.e. how much profit
might be made).
• The techniques used here would be the MCA approach (a revised version of
VALID probably – one more attuned to buildings’ wider environs). It
would outline all the key design and place aspects referred to earlier and
would also encourage discussion of what the area needed according to
peoples’ statements when asked and what local authorities consider needs
to be. This MCA tool would inevitably need experimentation to get it right.

84
Stage 3 – Option Generation
• Options: The independent body will then seek to generate a few options.
These options can serve as the basis for discussion between the developer
and public participants in the valuation exercise. Bringing in a design
expert to assist the public at this early stage would be a radical break with
past planning practice – making mainstream development consultation
more analogous to community planning processes. There is always the
danger of a developer claiming that they can’t afford to depart from their
preferred development without it becoming uneconomic. To offset the
likelihood of this happening the developer would, ideally, be asked to ‘open
their books’ to an independent auditor (e.g. the local planning authority). So
the development options will all be ones that the developer could afford.
Here methods are somewhat irrelevant – the option generation is down to
the design team interpreting the brief set for them in the previous stage.
Stage 4 – Option Appraisals
• Appraisal Methods: MCA and stated preference approaches could both be
used here. At present there is no adequate MCA tool in existence that will
assist a good value mapping exercise. Similarly, there has been very limited
application of stated preference techniques to the built urban environment.
Ideally, both types of approach would be attempted – this might be on the
same options or on different developments altogether. This would at least
start to show what was possible – highlighting potential pitfalls that have
perhaps not been seen by those using existing MCA and economic
techniques. The MCA approaches are clearly more comfortable to the
architecture and built environment professions where detailed familiarity
with statistics and micro-economics are not pre-requisites of entry to the
field. The methods are also more accessible. However, it is the stated
preference methods that offer most hope of making actual calculations

85
about where the public and developers are actually willing to put their
money.
• Scale: The scale at which the methods can be used has been ignored so far
simply because it has been so ignored in the literature. There is no real
MCA or stated preference approach that has addressed the issue of
geographical scale. In theory the methods should be operable at any scale –
only the conduct of value mapping exercises will really start and cast light
on this.
• Cost: this too has been underplayed as it too has been little discussed in the
literature. MCA approaches are usually cheap in that they involve key
stakeholders gathered around a table – for a day or two. Stated preference
approaches can vary greatly – from a few weeks work to many months. The
sensible course is to tailor the methods according to the overall cost of the
proposed development – with a slice of the land value perhaps being used
to foot the bill.
Stage 5 – Calculations and Negotiations
• Calculations: the different options should be relatively easy to cost up. It is
then a matter of ascertaining which options (and which elements within
these options) are valued by the various stakeholders. This makes it
possible to see which developments will be affordable in terms of overall
costs minus willingness to pay. Within this overall picture will be numerous
other variations between aspects of the development and between different
stakeholder groups. This makes it possible to identify: conflicts (where one
values something positively and another wants compensation for it) and
aspects that perhaps have too much or too little funding committed. There
could actually be a built in mechanism for ensuring that too much might be

86
committed to a particular development (or aspect of development) –
namely, by making some willingness to pay options exceed the actual costs
of the option.
• Negotiations: this is where any excess willingness to pay for an option
might be redistributed to options/aspects that some want but which are not
collectively affordable at present. Where there were conflicts between
developers and the public there might be concessions and swaps made – a
development that is more likely to limit crime in return for one that less
green space. Other funds might also be made available to ensure a better
social outcome - for example, section 106 funds or planning gain
supplement (essentially a tax on the land value). Particularly important
amongst the ‘public’ are local property owners – who stand to lose/gain by
a neighbouring development. These might be expected to invest more in
their property’s frontage and the external environment – as, in a
development area; property should be set to rise.
Stage 6: Implementation and Monitoring Agreements
• Monitoring: there will need to be agreement on the monitoring of what has
been agreed – to ensure that the developer does what they had promised and
to see if the public are genuinely satisfied with what they have got.
• Evidence Base: A completed account of the whole process would need to
be fed into a data bank to inform those contemplating similar developments
in future. This would make it possible to build up an overview of what
people do and don’t value – thereby making option generation an
increasingly sophisticated process. Inevitably there needs to be a sufficient
body of knowledge before it is fed into initial designs – the danger of not

87
doing this is of prejudicing designs (thereby skewing the evidence base
towards the earliest monitoring and data collected).
Timescale
There is the inevitable question of how long the whole process will take. Ideally,
the value mapping pilot might be on a development scheme where it was
envisaged that the period between initial site survey and planning permission was
short.
An alternative approach raised in some project meetings is to try and condense the
whole exercise into a day or two – known as a charette in the design profession.
This could be further facilitated by focusing on an area where a lot of preliminary
evidence had been gathered about the town/city and the needs of the immediate
locality. This would certainly prove popular with many – in that it would all be
resolved in an intense burst.
It should be stressed however that concern with the time in which the exercise is
done should not detract from the main aim of getting a value mapping approach
that is realistic in terms of being able to support design. As urban design seldom
takes place in such intense burst, there seems little point in attempting methods
that achieve this.
Managing the Pilot
The pilot value mapping exercise should, ideally, bring together a team familiar
with both economic and MCA methods. To encourage such team formations there
need to be more opportunities for the different parties to meet and discuss these
issues. It would be a good idea to bring together a handful of environmental
economists and MCA experts to review the report.