Embed Size (px)
Citation preview

Optimizing the Sulphates Content of Cement Using Multivariable Modellingand Uncertainty Analysis
D. Tsamatsoulis* and N. Nikolakakos
Halyps Building Materials S.A., Italcementi Group,17th Klm Nat. Rd. Athens – Korinth, 19300, Greece
This study aims at determining the effect of the cement composition and mortar ageon the optimum content of sulphates using maximization of compressive strength as acriterion. Extensive experimentation has been performed to achieve this purpose byutilizing four cement types and measuring the strength at ages ranging from 2 days up to63 months. Strength is correlated with the ratio of sulphates to clinker content, SO3/CLand moles SO3/ moles C3A. A generalized model correlating SO3, cement compositionand curing time is developed, intensely indicating the necessity of placing the SO3 targetwithin the optimum region and realizing it as well. The set of four equations involvespolynomial and logarithmic equations correlating the variables. A variance analysisbased on error propagation technique, proves that SO3 affects not only average value ofstrength but also its variability.
Key words:
Cement, sulphates, clinker, strength, optimization, model
Introduction
Two of the main properties characterizing ce-ment quality are the setting time and the compres-sive strength. Gypsum acts in parallel as a regulatorof both characteristics. Thus its impact on cementquality is crucial and dual. Gypsum addition retardsthe fast exothermic reaction of tricalcium aluminate(3CaO.Al2O3 or C3A) by forming ettringite. Gener-ally C3A reacts with the calcium sulphate phases –bassanite (Cs.0.5H), gypsum (Cs.2H) and anhydrite(Cs) – according to the equation (1).
C A Cs H C A Cs H3 33 32 3 32� � � � � (1)
During the concrete production, transfer andplacing, the formation of ettringite prevents thefalse set. However excessive amount of gypsumleads to abnormal and detrimental expansion ofconcrete and mortar. Hence a maximum limit needsto be defined. European norm EN 197-1:2011 putssuch constraints, whose values depend on the ce-ment type. Several cement types are currently per-mitted to be produced, based on various clinkerqualities and a variety of other main components.
The existence of an optimum value of the gyp-sum content within the cement composition hasbeen already pointed out by several researchers.Lerch1 found that the optimal sulphates content ofPortland cement with respect to mortar strength isclosely related with several parameters likehydration heat, length changes of mortar specimens
cured in water, alkalis, C3A content and cementfineness as well. The impact of SO3 on thehydration of the clinker mineral phases has been in-vestigated by several researchers.1–7 Soroka et al.4
concluded that gypsum accelerates the rate ofhydration, when its addition is below the optimumSO3 content, but produces significant retardationwhen the addition exceeds the optimum.
Hanhan5 investigated the influence of the SO3
content of cement on the durability and strength ofconcrete exposed to sodium sulphate environment,studying cements containing clinker and gypsum.He concluded that there is an optimum SO3 contentfor the lowest expansion that is different from thatdetermined from the highest compressive strength.Optimum values also differed for the different ce-ments and from one age to another for the same ce-ment. The results also indicate the dependence ofSO3 content on tricalcium aluminate and alkali con-tent of cements. Jansen et al.6 analysed the changesdetected in the phase composition during thehydration process. They concluded that the cementphases involved in the aluminate reaction(bassanite, gypsum, anhydrite and C3A) react suc-cessively. The importance of both amount andphases of SO3 that is incorporated in clinker hasbeen investigated by Miller et al.,8 Taylor9 andHorkoss et al.10 Taylor9 concluded that in concretemade with present-day cements and not subjectedto an elevated temperature, no damage through de-layed ettringite formation can occur for reasons as-sociated with the SO3 present in the clinker. Milleret al.8 proved also that under ambient curing condi-
D. TSAMATSOULIS and N. NIKOLAKAKOS, Optimizing the Sulphates Content …, Chem. Biochem. Eng. Q. 27 (2) 133–144 (2013) 133
*Corresponding Author: e-mail: [email protected]
Original scientific paperReceived: April 14, 2012
Accepted: February 26, 2013
tions, the sulphur-containing phases present in pres-ent-day commercial clinkers are unlikely to causeany internal sulphate attack that might lead to ex-pansive stress and cracking.
Several also researchers have investigated theimpact of the limestone addition to the hydrationprocess and sulphates optimum. 11,12,13 Campiteliand Florindo11 examined the effects of limestonecontent and cement fineness on the optimum SO3 ofcement according to ASTM C 563. They found thatoptimum SO3 increases with increasing finenessand decreases with increasing limestone content,but neither relationships is linear. Yamashita et al.12
investigated the influence of limestone powder(LSP) on the optimum SO3 for Portland cement ofdifferent content in Al2O3, that was found not negli-gible. The analysis showed that, a lower than opti-mal SO3 content, by increasing SO3, the cementhydration was promoted mainly into C3A and thecompressive strength increased. At the higher SO3
content, excess formation of expansive ettringite in-troduced more pores and compressive strength de-creased. By the addition of LSP, the maximumcompressive strength was obtained at lower SO3
content. This effect was significant for cement withhigh C3A and C4AF proportions. Thermodynamicmodelling of Lothenbach et al.13 showed that thestabilisation of monocarbonate in the presence oflimestone indirectly stabilised ettringite leading toan increase of the volume of the hydrate phase anda decrease in porosity. The function between gyp-sum content, porosity and strength of cementmortars has also been examined by Sersale et al. 14
According to this research a content of about2–3.5% SO3 promotes a shifting of the pore sizedistribution to lower values as well as a variation intotal porosity. This latter appears to be the main fac-tor governing the influence of SO3 on the compres-sive strength. Sideris et al. 15 determined the opti-mum gypsum content of Portland cement using thehydration criterion of maximum ultimate compres-sive strength. Tsamatsoulis and Nikolakakos 16 in-vestigated the effect of cement composition andmortar age on the optimum content of sulphates us-ing the maximization of compressive strength as acriterion. Based on extensive experimentation, theyderived parabolic and logarithmic formulae to ex-press the above functions. Alexander and Ivanusec17 studied the long-term effects of cement SO3 con-tent on the properties of concrete. Strengths weredetermined, at up to one year, in concretes of highand low water/cement ratio. Strength has been usu-ally independent of, or linearly related to, the SO3
content of cement. With one-year concrete strength,the dominant factor of cement composition wasC3A. At this age the correlation coefficient ofstrength with C3A varied with SO3. Undersulphated
cements displayed a strong negative association be-tween strength and C3A content, which could ac-count for up to 10 MPa difference in strength.
From the above studies it is derived that SO3
optimum firstly depends on the cement property un-der examination. If this objective has been decided,then there are several features affecting the opti-mum value such as clinker composition and mineralphases, cement composition and fineness, gypsumcomposition. The compressive strength is usuallythe main property defining the cement quality and itcould be an indicator of the mortar and concrete du-rability. For this reason the present study focuses onthe SO3 optimization with the objective of maxi-mizing this cement characteristic. For a givenclinker quality produced in Halyps cement plant,the main independent parameters analysed are thecement composition and type, the gypsum qualityand the age of the mortar. The data presented in anearlier study16 have been utilized. Mathematicalmodels of the simplest possible form are developedto relate SO3 with the above variables. The derivedequations are generalized as much as possible,aiming at determining the values of SO3 that can beused as targets in the daily production of the men-tioned cement types. The purpose of this general-ization is to obtain a multivariable function betweenthe proportions of sulphates and clinker, the curingtime and compressive strength describing a large setof data comprising both compositions of cementand time. Moreover, a variance analysis is per-formed, to determine the effect of SO3 variance onthe variance of strength results.
Experimental
Two series of laboratory experiments havebeen performed: (a) to optimize SO3 content per ce-ment type and (b) to find the SO3 optimum at dif-ferent ages for the same type. All the types utilizedconform to EN 197-1:2011. The norm requirementsas regards composition and strength limits areshown in Table 1. The Gypsum is not included inthe nominal composition: The producer is responsi-ble for adjusting the gypsum content by respectingthe maximum SO3 limit, which for the given ce-ment types is 3.5%. For the first series of experi-ments the subsequent procedure described furtherwas followed:
(i) All the raw materials have been ground sep-arately in a laboratory mill in order to pass 100%from the 90 microns sieve.
(ii) Convenient quantities were mixed to obtainthe designed cement composition.
134 D. TSAMATSOULIS and N. NIKOLAKAKOS, Optimizing the Sulphates Content …, Chem. Biochem. Eng. Q. 27 (2) 133–144 (2013)

(iii) Four cement types were obtained: (a)CEM I 42.5 N, (b) CEM II A-L 42.5 N, (c) CEM IIB-M(P-L) 32.5 N, (d) CEM IV B (P-W) 32.5 N.
(iv) For each type different percentages of gyp-sum have been added.
(v) For each type, the same batch of clinker wasused. The clinker was analysed with XRF. Physical
and chemical characteristics of the clinker as well asthe mineral composition according to Bogue formu-lae are shown in Table 2. The standard equationsprovided by ASTM C 150 have been utilized tocompute the Bogue equations. The chemical analy-ses of the rest remaining raw materials are presentedin Table 3. The loss on ignition (LOI) as 975 °C was
D. TSAMATSOULIS and N. NIKOLAKAKOS, Optimizing the Sulphates Content …, Chem. Biochem. Eng. Q. 27 (2) 133–144 (2013) 135
T a b l e 1 – Cement types conforming to EN 197-1:2011
TypeClinker
%Limestone
%Pozzolans
%Fly ash
%
MinorConstituents
%
28 daysStrength
Low LimitMpa
28 daysStrength
High LimitMpa
CEM I42.5 N
95–100 0–5 42.5 62.5
CEM II A-L42.5 N
80–94 16–20 0–5 42.5 62.5
CEM II B-M (P-L)32.5 N
65–79 21–35 0–5 32.5 52.5
CEM IV B (P-W)32.5 N
45–64 36–55 0–5 32.5 52.5
T a b l e 2 – Clinker physical, chemical and mineral characteristics
Blainem2 kg–1
R40%
C3S%
C2S%
C3A%
C4AF%
Clinker 1 360 16 56.1 19.8 9.2 9.8
Clinker 2 360 18 57.0 18.3 8.7 9.7
Clinker 3 340 22 57.5 17.7 8.3 9.6
LOI%
SiO2
%Al2O3
%Fe2O3
%CaO%
MgO%
SO3
%K2O%
Na2O%
Ins. Res.%
Clinker 1 0.20 21.66 5.53 3.22 66.08 1.81 1.08 0.61 0.00 0.35
Clinker 2 0.30 21.35 5.31 3.20 65.54 2.05 1.38 0.81 0.06 0.30
Clinker 3 0.51 21.27 5.14 3.14 65.48 2.05 1.47 0.90 0.03 0.30
T a b l e 3 – Chemical analyses of the raw materials
LOI at975 °C
%
LOI at215 °C
%
SiO2
%Al2O3
%Fe2O3
%CaO%
MgO%
SO3
%K2O%
Na2O%
Mineral gypsum 21.73 18.08 0.52 0.05 0.05 34.23 1.18 43.81 0.04 0.00
Chemical gypsum 22.57 17.55 0.85 0.22 0.14 35.85 0.14 41.27 0.04 0.00
Pozzolans 7.00 71.40 12.15 0.99 1.03 0.47 0.00 3.97 2.98
Fly ash 0.96 47.15 16.97 9.23 17.63 2.77 3.14 1.82 0.33
Limestone 43.28 0.34 0.13 0.13 54.80 1.27 0.00 0.04 0.00
CaCO3
%MgCO3
%
Total GypsumCs · 2H, Cs · 0.5H, Cs
%
Cs · 2H%
Cs.0.5H%
Cs%
Mineral gypsum 5.3 2.5 91.6 84.0 0.0 7.6
Chemical gypsum 11.1 0.3 87.4 82.3 0.0 5.1
measured according to EN 196-2 while LOI at 215°C was determined according to ASTM C 471M.
(vi) Two kinds of gypsum were utilized: Min-eral and chemical gypsum from desulphurization(FGD). For both materials and based on the massbalance of the oxides and LOI at 975 °C and215 °C, the percentages of CaCO3, MgCO3, gyp-sum dihydrate (Cs.2H), hemihydrate (Cs.0.5H) andanhydrite (Cs) were calculated. The results areshown in Table 3.
From Table 2 it can be observed that the threeclinker batches do not differ from one another con-siderably with regard to the measured characteris-
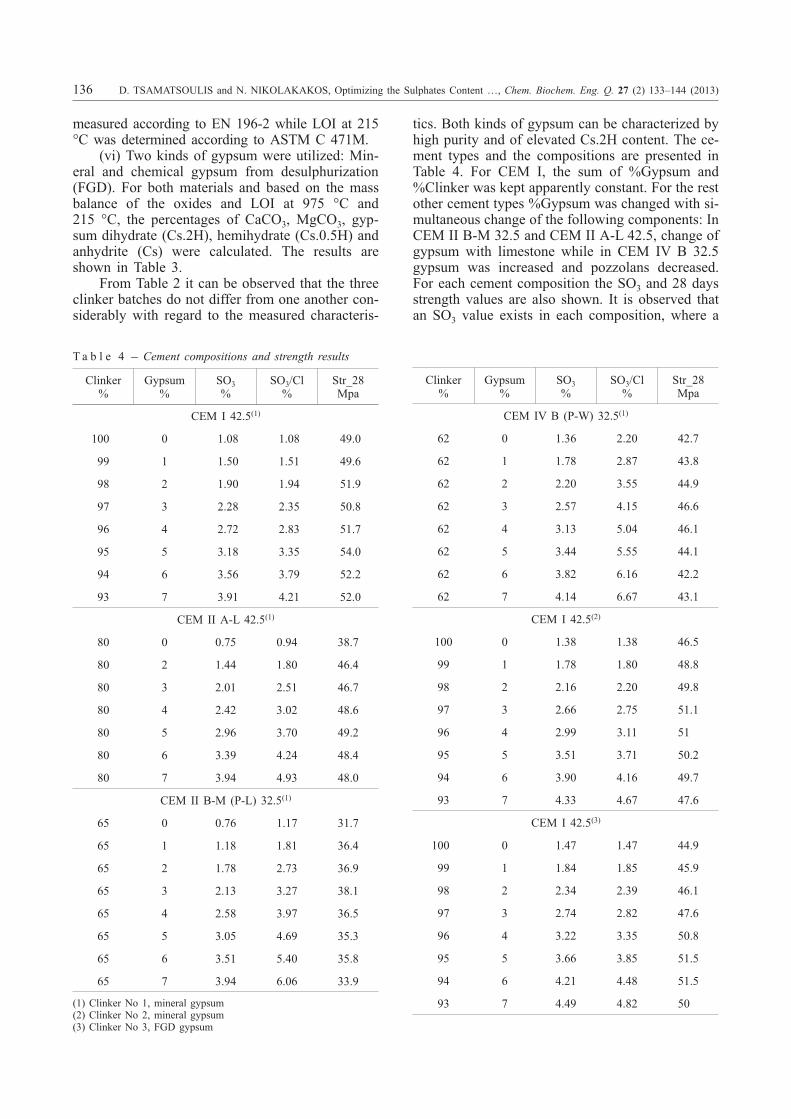
tics. Both kinds of gypsum can be characterized byhigh purity and of elevated Cs.2H content. The ce-ment types and the compositions are presented inTable 4. For CEM I, the sum of %Gypsum and%Clinker was kept apparently constant. For the restother cement types %Gypsum was changed with si-multaneous change of the following components: InCEM II B-M 32.5 and CEM II A-L 42.5, change ofgypsum with limestone while in CEM IV B 32.5gypsum was increased and pozzolans decreased.For each cement composition the SO3 and 28 daysstrength values are also shown. It is observed thatan SO3 value exists in each composition, where a
136 D. TSAMATSOULIS and N. NIKOLAKAKOS, Optimizing the Sulphates Content …, Chem. Biochem. Eng. Q. 27 (2) 133–144 (2013)
T a b l e 4 – Cement compositions and strength results
Clinker%
Gypsum%
SO3
%SO3/Cl
%Str_28Mpa
CEM I 42.5(1)
100 0 1.08 1.08 49.0
99 1 1.50 1.51 49.6
98 2 1.90 1.94 51.9
97 3 2.28 2.35 50.8
96 4 2.72 2.83 51.7
95 5 3.18 3.35 54.0
94 6 3.56 3.79 52.2
93 7 3.91 4.21 52.0
CEM II A-L 42.5(1)
80 0 0.75 0.94 38.7
80 2 1.44 1.80 46.4
80 3 2.01 2.51 46.7
80 4 2.42 3.02 48.6
80 5 2.96 3.70 49.2
80 6 3.39 4.24 48.4
80 7 3.94 4.93 48.0
CEM II B-M (P-L) 32.5(1)
65 0 0.76 1.17 31.7
65 1 1.18 1.81 36.4
65 2 1.78 2.73 36.9
65 3 2.13 3.27 38.1
65 4 2.58 3.97 36.5
65 5 3.05 4.69 35.3
65 6 3.51 5.40 35.8
65 7 3.94 6.06 33.9
(1) Clinker No 1, mineral gypsum(2) Clinker No 2, mineral gypsum(3) Clinker No 3, FGD gypsum
Clinker%
Gypsum%
SO3
%SO3/Cl
%Str_28Mpa
CEM IV B (P-W) 32.5(1)
62 0 1.36 2.20 42.7
62 1 1.78 2.87 43.8
62 2 2.20 3.55 44.9
62 3 2.57 4.15 46.6
62 4 3.13 5.04 46.1
62 5 3.44 5.55 44.1
62 6 3.82 6.16 42.2
62 7 4.14 6.67 43.1
CEM I 42.5(2)
100 0 1.38 1.38 46.5
99 1 1.78 1.80 48.8
98 2 2.16 2.20 49.8
97 3 2.66 2.75 51.1
96 4 2.99 3.11 51
95 5 3.51 3.71 50.2
94 6 3.90 4.16 49.7
93 7 4.33 4.67 47.6
CEM I 42.5(3)
100 0 1.47 1.47 44.9
99 1 1.84 1.85 45.9
98 2 2.34 2.39 46.1
97 3 2.74 2.82 47.6
96 4 3.22 3.35 50.8
95 5 3.66 3.85 51.5
94 6 4.21 4.48 51.5
93 7 4.49 4.82 50

maximum strength is achieved. This value is not thesame for all the cement types but is strongly relatedto the clinker content.
The second series of experiments was designedas follows: During an industrial scale grinding ofCEM II A-L 42.5N, initially the gypsum was de-creased to 0.5% with a parallel increase of the lime-stone content. Sampling was performed after the ce-ment mill reached a steady state (sample (A)). Thenthe gypsum content was increased to 7% whilelimestone was reduced accordingly. A second sam-ple, named sample (B), was taken after the mill wasstable. The characteristics of the clinker and of thetwo samples are indicated in Table 5. The same ta-ble also shows the chemical analysis of the mineralgypsum used, as well as its content in Cs · 2H,Cs · 0.5H and Cs. As it can be seen, the gypsumcomposition is very similar to the one used in thefirst series of tests. The temperature at the mill out-let is kept continuously less than 100° C, therefore,transformation of Cs · 2H to Cs · 0.5H is not ex-pected during grinding. Using the extreme cementsamples (A) and (B), additional ones were also pre-pared and chemical analyses were performed. Thefull series of samples is presented in Table 6. The
benefit of this method of sample preparation is thatthe cement is industrially produced. With these fivesamples, mortars were prepared and the compres-sive strength was measured at various ages rangingfrom 2 days up to 63 months.
Correlation of strengthwith the sulphates content
Optimum gypsum for different cement types
The measurable quantity with which the per-centage of gypsum is regulated is the %SO3 contentof cement. Sulphates become mainly from gypsumbut also from fly ash and clinker, especially whenpet coke is used as fuel. Thus, the function betweenstrength measured at 7 and 28 days – Str7 and Str28respectively – and the mass ratio %SO3/Clinker –SO3/CL – is studied. These functions for each testedcement composition are given in Figures 1 and 2. Asecond order equation is fitted for each age and ce-ment type studied. Clear SO3 optimum points ap-pear for each cement type. For all cement types, ex-cept CEM IV, the maximum strength seems to ap-pear in a narrow area of SO3/CL.
To analyse in more detail this initial observa-tion, the following dimensionless strength at 7 and28 days are considered:
RelStrStr
MaxStr7
7
7� (1)
RelStrStr
MaxStr28
28
28� (2)
D. TSAMATSOULIS and N. NIKOLAKAKOS, Optimizing the Sulphates Content …, Chem. Biochem. Eng. Q. 27 (2) 133–144 (2013) 137
T a b l e 5 – Clinker, gypsum and cement characteristics
C3S%
C2S%
C3A%
C4AF%
Clinker 53.3 21.0 8.9 9.3
CementBlaine
m2 kg–1
R40%
SO3
%Clinker
%
(A) 318 14 1.47 79.5
(B) 324 13 3.64 79.5
LOI at975 °C
%
LOI at215 °C
%
SiO2
%Al2O3
%Fe2O3
%CaO%
MgO%
SO3
%K2O%
Na2O%
Gypsum
20.80 17.26 0.51 0.03 0.04 34.53 1.18 42.28 0.04 0.00
CaCO3
%MgCO3
%
Total GypsumCs · 2H, Cs · 0.5H, Cs
%
Cs · 2H%
Cs · 0.5H%
Cs%
5.1 2.5 91.8 84.1 0.0 7.7
T a b l e 6 – Samples of variable SO3 content
Sample Composition SO3
1 100% (A) 1.47
2 75% (A) + 25% (B) 2.02
3 50% (A) + 50% (B) 2.50
4 25% (A) + 75% (B) 3.04
5 100% (B) 3.64

Where strX = the compressive strength for acertain SO3/CL at age X, MaxStrX = the maximumstrength of the given cement type at age X, RelStrX =the relative strength for a value of SO3/CL at age Xand X = 7 or 28 days. The results of relative strengthat 7 and 28 days as a function of the ratio SO3/CL areshown in Figures 3 and 4. Parabolic equations de-scribe satisfactorily the actual functions for both 7and 28 days strength given by the general formula(3). Two second-order equations have been com-puted for all the CEM type except CEM IV and twomore equations specifically for CEM IV. The posi-tion of SO3/CL where the maximum relative strengthoccurs is provided by equation (4). The coefficientsof the four equations, the respecting regression coef-ficients, R and the SO3/CL position of the maximumstrength are demonstrated in Table 7.
RelStr X CSO
CLC
SO
CLC� �
�
��
�
� �
�
��
�
�2
3
2
1
3
0 (3)
SO
CL
C
COpt
3 1
22� � (4)
From Figures 3, 4 and results of Table 7 thesubsequent conclusions can be drawn:
(i) Parabolic equations correlate sufficiently theexperimental results with acceptable regression co-efficients.
(ii) The optimum SO3/CL ratio for CEM IV ishigher than that of all the other cement types, due tothe high percentage of fly ash in this cement type,as fly ash contains ~3% SO3. It is concluded that
138 D. TSAMATSOULIS and N. NIKOLAKAKOS, Optimizing the Sulphates Content …, Chem. Biochem. Eng. Q. 27 (2) 133–144 (2013)
F i g . 1 – Function between Str7 and %SO3/Cl
F i g . 2 – Function between Str28 and %SO3/Cl
F i g . 3 – Relative 7 days strength as function of %SO3/Cl
F i g . 4 – Relative 28 days strength as function of %SO3/Cl
T a b l e 7 – Coefficients and parameters of equations (3), (4)
All CEM types exceptCEM IV
CEM IV
RelStr7 RelStr28 RelStr7 RelStr28
C2 –0.034 –0.019 –0.028 –0.020
C1 0.24 0.14 0.21 0.17
C0 0.56 0.73 0.56 0.63
R 0.90 0.84 0.95 0.96
(SO3/CL)opt 3.5 3.7 3.8 4.3

not all SO3 of the fly ash act like the gypsumsulphates.
(iii) For CEM I, CEM II A-L and CEM II B-Mthe function between compressive strength andSO3/CL is described from one single equation. Con-sequently the significant issue as concerns SO3 con-trol, is not only the gypsum content, but the ratiobetween gypsum and clinker, for a given clinkerquality.
(iv) The optimum SO3/CL for the 28 daysstrength is located in a position higher than that of 7days strength.
A function between clinker C3A and SO3 opti-mum is already mentioned in the literature.1,5,6 Toinvestigate this relation the function betweenstrength at 7 and 28 days and the ratio of molesSO3/ moles C3A is plotted in Figures 5, 6 in a simi-lar way with that of Figures 3, 4. The C3A con-tained in the cement is considered. Four parabolicequations expressing the functions shown in Fig-ures 5, 6 have been derived, described by the gen-eral formula (5).
RelStr X CMSO
MC AC
MSO
MC AC� �
�
���
�
� �
�
���
�
�2
3
3
2
1
3
30 (5)
MSO
MC A
C
COpt
3
3
1
22
� � (6)
Where MSO3/MC3A = the molecular ratio ofsulphates to tricalcium aluminate. The position ofMSO3/MC3A where the maximum relative strengthoccurs is provided by equation (6). The coefficientsof the four equations, the regression coefficients andthe (MSO3/MC3A)Opt are shown in Table 8. For allthe CEM types except CEM IV, the optimum ratio isfound between 1.1 and 1.2. The optimum of 28 daysstrength is located in a higher position than that of 7days. The corresponding optimum molecular ratiofor the CEM IV is higher, indicating that not all SO3
of the fly ash behave like gypsum sulphates.
Optimum gypsum for different agesof the mortars
Using the five samples shown in Table 6, stan-dard mortars were prepared and the compressivestrength was measured at 2, 3, 7, 14, 28 days aswell at 3, 6, 14, 30 and 63 months. The results areshown in Figure 7. The parabolic equations fitting
D. TSAMATSOULIS and N. NIKOLAKAKOS, Optimizing the Sulphates Content …, Chem. Biochem. Eng. Q. 27 (2) 133–144 (2013) 139
F i g . 5 – Relative 7 days strength as function of MolesSO3/Moles C3A
F i g . 6 – Relative 28 days strength as function of MolesSO3/Moles C3A
T a b l e 8 – Coefficients and parameters of equations (5), (6)
All CEM types exceptCEM IV
CEM IV
RelStr7 RelStr28 RelStr7 RelStr28
C2 –0.32 –0.176 –0.27 –0.20
C1 0.74 0.42 0.67 0.54
C0 0.55 0.74 0.56 0.63
R 0.90 0.83 0.95 0.96
(MSO3/MC3A)opt 1.14 1.19 1.22 1.35
F i g . 7 – Strength as function of %SO3/Cl and age
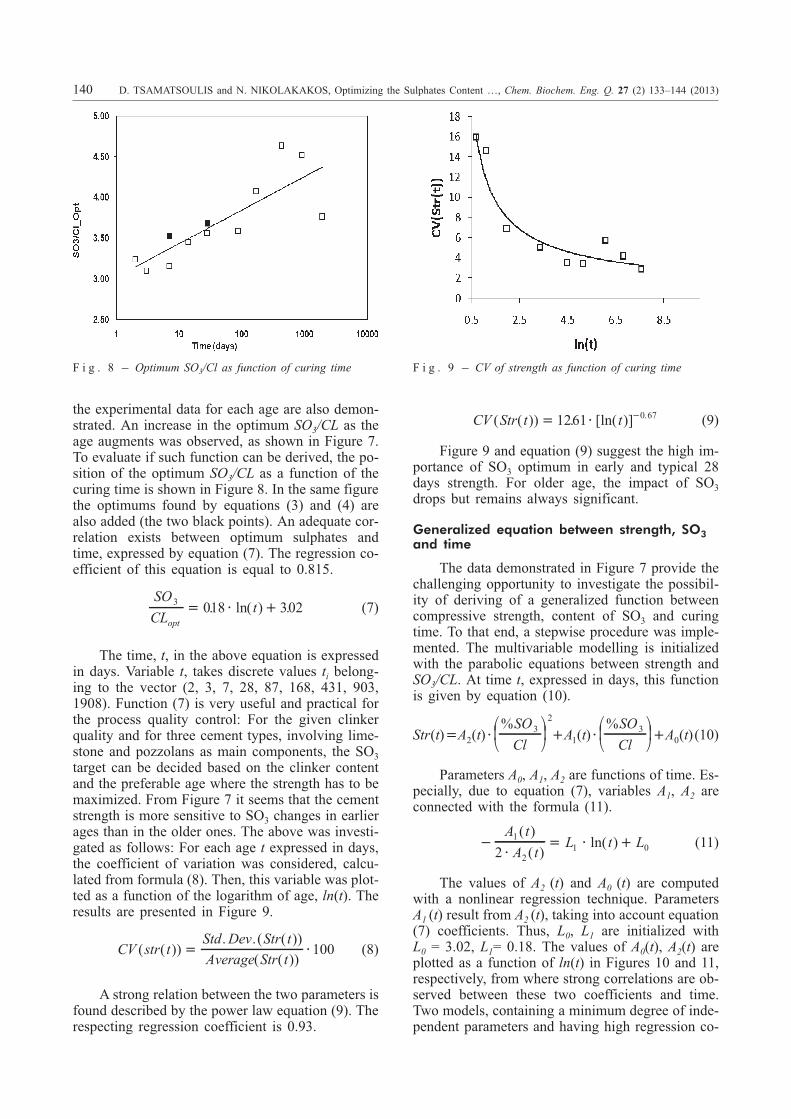
the experimental data for each age are also demon-strated. An increase in the optimum SO3/CL as theage augments was observed, as shown in Figure 7.To evaluate if such function can be derived, the po-sition of the optimum SO3/CL as a function of thecuring time is shown in Figure 8. In the same figurethe optimums found by equations (3) and (4) arealso added (the two black points). An adequate cor-relation exists between optimum sulphates andtime, expressed by equation (7). The regression co-efficient of this equation is equal to 0.815.
SO
CLt
opt
3018 302� � �. ln( ) . (7)
The time, t, in the above equation is expressedin days. Variable t, takes discrete values ti belong-ing to the vector (2, 3, 7, 28, 87, 168, 431, 903,1908). Function (7) is very useful and practical forthe process quality control: For the given clinkerquality and for three cement types, involving lime-stone and pozzolans as main components, the SO3
target can be decided based on the clinker contentand the preferable age where the strength has to bemaximized. From Figure 7 it seems that the cementstrength is more sensitive to SO3 changes in earlierages than in the older ones. The above was investi-gated as follows: For each age t expressed in days,the coefficient of variation was considered, calcu-lated from formula (8). Then, this variable was plot-ted as a function of the logarithm of age, ln(t). Theresults are presented in Figure 9.
CV str tStd Dev Str t
Average Str t( ( ))
. . ( ( ))
( ( ))� �100 (8)
A strong relation between the two parameters isfound described by the power law equation (9). Therespecting regression coefficient is 0.93.
CV Str t t( ( )) . [ln( )] .� � �1261 0 67 (9)
Figure 9 and equation (9) suggest the high im-portance of SO3 optimum in early and typical 28days strength. For older age, the impact of SO3
drops but remains always significant.
Generalized equation between strength, SO3and time
The data demonstrated in Figure 7 provide thechallenging opportunity to investigate the possibil-ity of deriving of a generalized function betweencompressive strength, content of SO3 and curingtime. To that end, a stepwise procedure was imple-mented. The multivariable modelling is initializedwith the parabolic equations between strength andSO3/CL. At time t, expressed in days, this functionis given by equation (10).
Str t A tSO
ClA t
SO
ClA t( ) ( )
%( )
%(� �
�
��
�
� �
�
��
�
�2
3
2
1
3
0 )(10)
Parameters A0, A1, A2 are functions of time. Es-pecially, due to equation (7), variables A1, A2 areconnected with the formula (11).
��
� � �A t
A tL t L
1
21 02
( )
( )ln( ) (11)
The values of A2 (t) and A0 (t) are computedwith a nonlinear regression technique. ParametersA1 (t) result from A2 (t), taking into account equation(7) coefficients. Thus, L0, L1 are initialized withL0 = 3.02, L1= 0.18. The values of A0(t), A2(t) areplotted as a function of ln(t) in Figures 10 and 11,respectively, from where strong correlations are ob-served between these two coefficients and time.Two models, containing a minimum degree of inde-pendent parameters and having high regression co-
140 D. TSAMATSOULIS and N. NIKOLAKAKOS, Optimizing the Sulphates Content …, Chem. Biochem. Eng. Q. 27 (2) 133–144 (2013)
F i g . 8 – Optimum SO3/Cl as function of curing time F i g . 9 – CV of strength as function of curing time
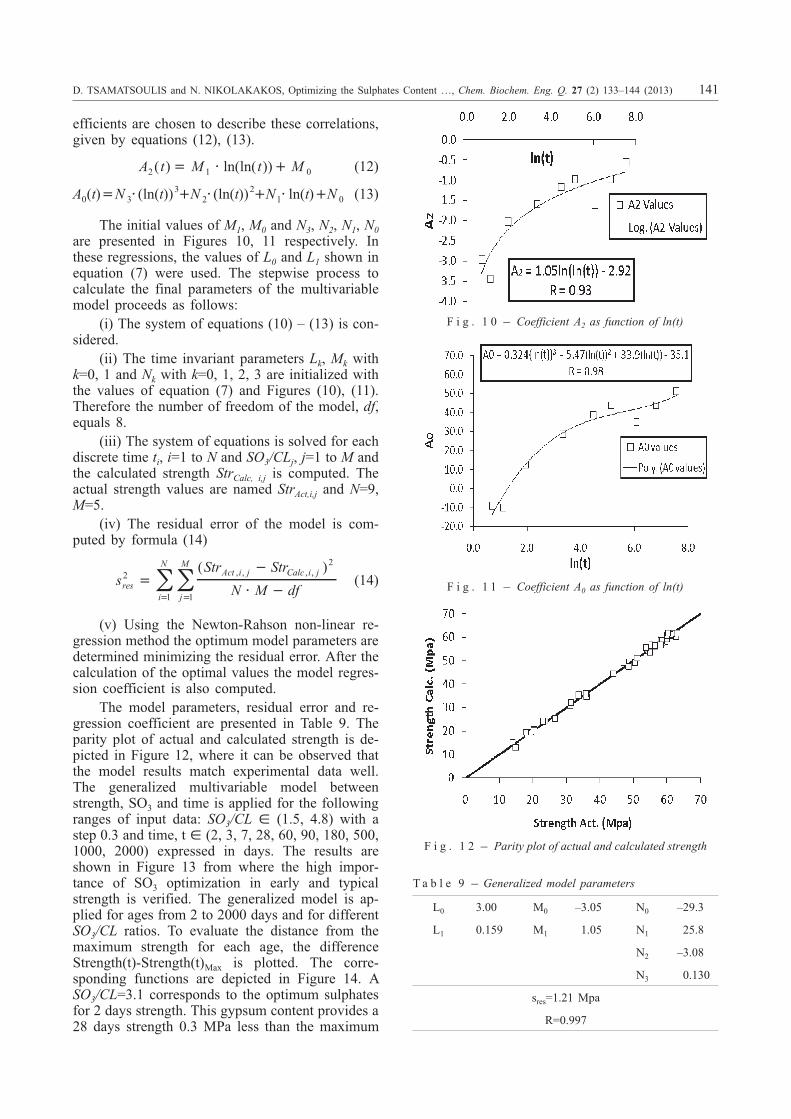
efficients are chosen to describe these correlations,given by equations (12), (13).
A t M t M2 1 0( ) ln(ln( ))� � � (12)
A t N t N t N t N0 33
22
1 0( ) (ln( )) (ln( )) ln( )� � � � � � � (13)
The initial values of M1, M0 and N3, N2, N1, N0
are presented in Figures 10, 11 respectively. Inthese regressions, the values of L0 and L1 shown inequation (7) were used. The stepwise process tocalculate the final parameters of the multivariablemodel proceeds as follows:
(i) The system of equations (10) – (13) is con-sidered.
(ii) The time invariant parameters Lk, Mk withk=0, 1 and Nk with k=0, 1, 2, 3 are initialized withthe values of equation (7) and Figures (10), (11).Therefore the number of freedom of the model, df,equals 8.
(iii) The system of equations is solved for eachdiscrete time ti, i=1 to N and SO3/CLj, j=1 to M andthe calculated strength StrCalc, i,j is computed. Theactual strength values are named StrAct,i,j and N=9,M=5.
(iv) The residual error of the model is com-puted by formula (14)
sStr Str
N M dfres
Act i j Calc i j
j
M
i
N
2
2
11
��
� ���
��( ), , , ,
(14)
(v) Using the Newton-Rahson non-linear re-gression method the optimum model parameters aredetermined minimizing the residual error. After thecalculation of the optimal values the model regres-sion coefficient is also computed.
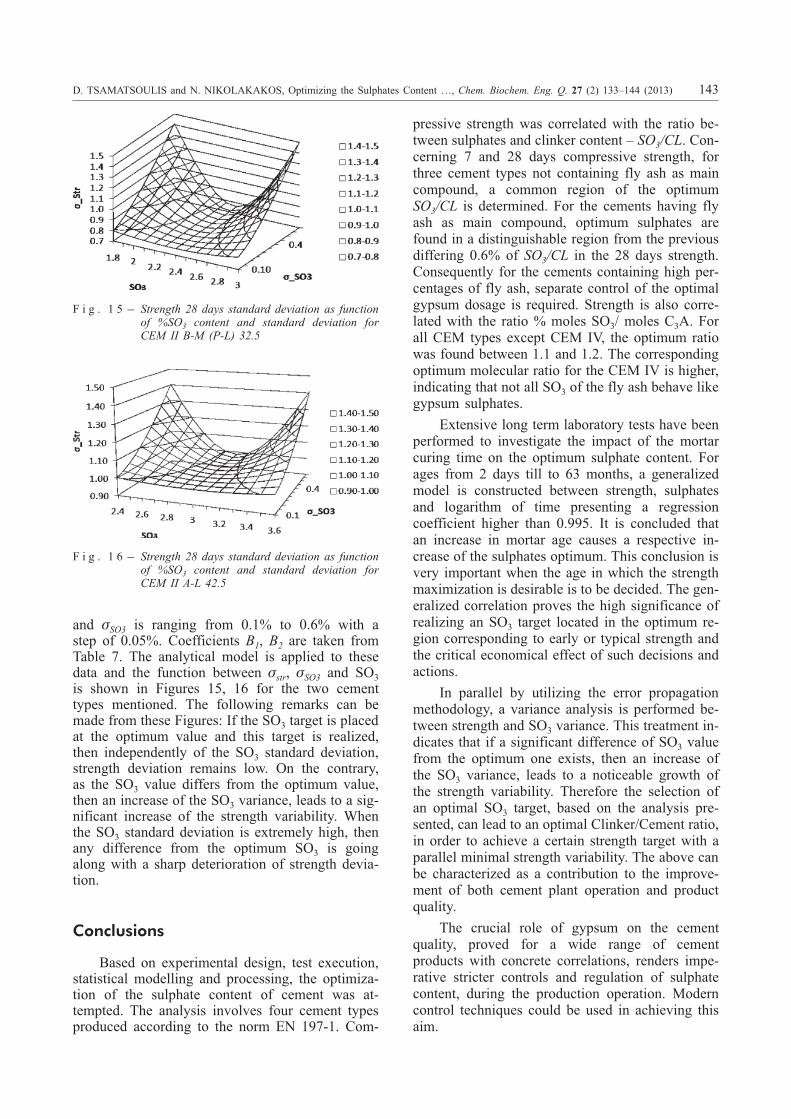
The model parameters, residual error and re-gression coefficient are presented in Table 9. Theparity plot of actual and calculated strength is de-picted in Figure 12, where it can be observed thatthe model results match experimental data well.The generalized multivariable model betweenstrength, SO3 and time is applied for the followingranges of input data: SO3/CL (1.5, 4.8) with astep 0.3 and time, t (2, 3, 7, 28, 60, 90, 180, 500,1000, 2000) expressed in days. The results areshown in Figure 13 from where the high impor-tance of SO3 optimization in early and typicalstrength is verified. The generalized model is ap-plied for ages from 2 to 2000 days and for differentSO3/CL ratios. To evaluate the distance from themaximum strength for each age, the differenceStrength(t)-Strength(t)Max is plotted. The corre-sponding functions are depicted in Figure 14. ASO3/CL=3.1 corresponds to the optimum sulphatesfor 2 days strength. This gypsum content provides a28 days strength 0.3 MPa less than the maximum
D. TSAMATSOULIS and N. NIKOLAKAKOS, Optimizing the Sulphates Content …, Chem. Biochem. Eng. Q. 27 (2) 133–144 (2013) 141
F i g . 1 0 – Coefficient A2 as function of ln(t)
F i g . 1 1 – Coefficient A0 as function of ln(t)
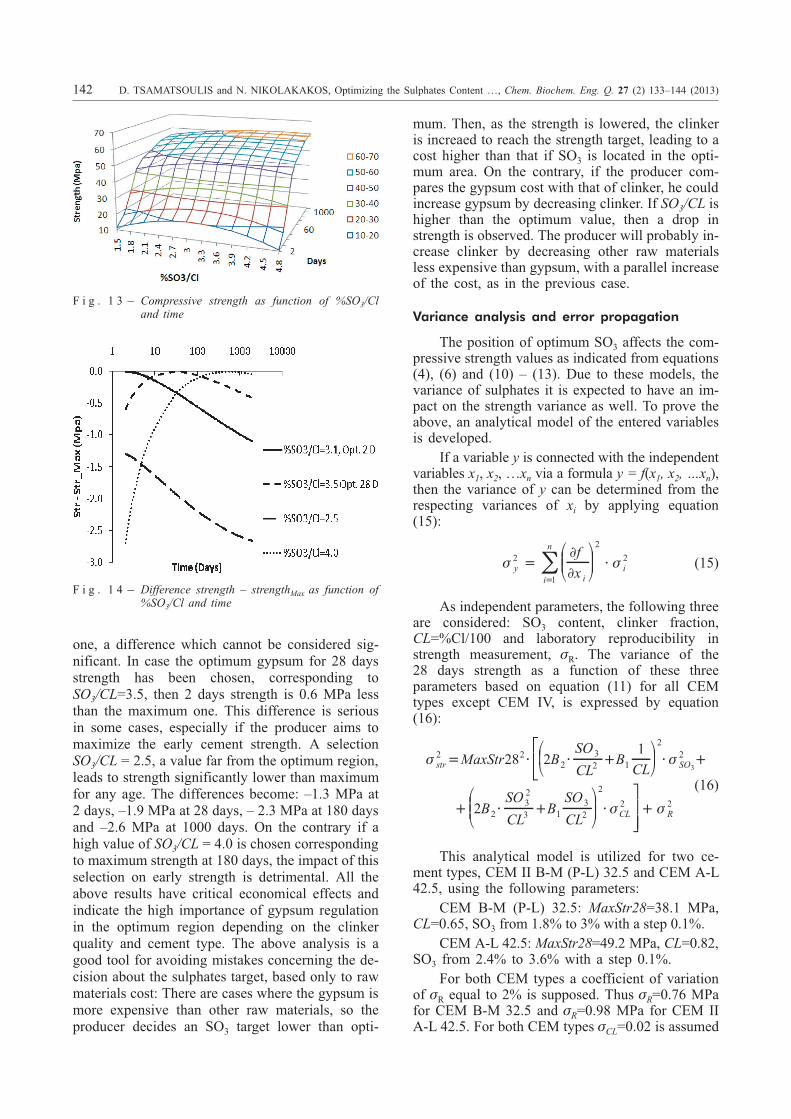
F i g . 1 2 – Parity plot of actual and calculated strength
T a b l e 9 – Generalized model parameters
L0 3.00 M0 –3.05 N0 –29.3
L1 0.159 M1 1.05 N1 25.8
N2 –3.08
N3 0.130
sres=1.21 Mpa
R=0.997
one, a difference which cannot be considered sig-nificant. In case the optimum gypsum for 28 daysstrength has been chosen, corresponding toSO3/CL=3.5, then 2 days strength is 0.6 MPa lessthan the maximum one. This difference is seriousin some cases, especially if the producer aims tomaximize the early cement strength. A selectionSO3/CL = 2.5, a value far from the optimum region,leads to strength significantly lower than maximumfor any age. The differences become: –1.3 MPa at2 days, –1.9 MPa at 28 days, – 2.3 MPa at 180 daysand –2.6 MPa at 1000 days. On the contrary if ahigh value of SO3/CL = 4.0 is chosen correspondingto maximum strength at 180 days, the impact of thisselection on early strength is detrimental. All theabove results have critical economical effects andindicate the high importance of gypsum regulationin the optimum region depending on the clinkerquality and cement type. The above analysis is agood tool for avoiding mistakes concerning the de-cision about the sulphates target, based only to rawmaterials cost: There are cases where the gypsum ismore expensive than other raw materials, so theproducer decides an SO3 target lower than opti-
mum. Then, as the strength is lowered, the clinkeris increaed to reach the strength target, leading to acost higher than that if SO3 is located in the opti-mum area. On the contrary, if the producer com-pares the gypsum cost with that of clinker, he couldincrease gypsum by decreasing clinker. If SO3/CL ishigher than the optimum value, then a drop instrength is observed. The producer will probably in-crease clinker by decreasing other raw materialsless expensive than gypsum, with a parallel increaseof the cost, as in the previous case.
Variance analysis and error propagation
The position of optimum SO3 affects the com-pressive strength values as indicated from equations(4), (6) and (10) – (13). Due to these models, thevariance of sulphates it is expected to have an im-pact on the strength variance as well. To prove theabove, an analytical model of the entered variablesis developed.
If a variable y is connected with the independentvariables x1, x2, …xn via a formula y = f(x1, x2, …xn),then the variance of y can be determined from therespecting variances of xi by applying equation(15):
��
��y
ii
i
nf
x
2
2
2
1
��
���
�
�
�
� (15)
As independent parameters, the following threeare considered: SO3 content, clinker fraction,CL=%Cl/100 and laboratory reproducibility instrength measurement, �R. The variance of the28 days strength as a function of these threeparameters based on equation (11) for all CEMtypes except CEM IV, is expressed by equation(16):
� �str SOMaxStr BSO
CLB
CL
2 22
3
2 1
2
228 21
3� � � �
�
��
�
� �
�
��
� � ��
���
�
�
�
���
�2 2
32
3 1
3
2
2
2 2BSO
CLB
SO
CLCL R� �
(16)
This analytical model is utilized for two ce-ment types, CEM II B-M (P-L) 32.5 and CEM A-L42.5, using the following parameters:
CEM B-M (P-L) 32.5: MaxStr28=38.1 MPa,CL=0.65, SO3 from 1.8% to 3% with a step 0.1%.
CEM A-L 42.5: MaxStr28=49.2 MPa, CL=0.82,SO3 from 2.4% to 3.6% with a step 0.1%.
For both CEM types a coefficient of variationof �R equal to 2% is supposed. Thus �R=0.76 MPafor CEM B-M 32.5 and �R=0.98 MPa for CEM IIA-L 42.5. For both CEM types �CL=0.02 is assumed
142 D. TSAMATSOULIS and N. NIKOLAKAKOS, Optimizing the Sulphates Content …, Chem. Biochem. Eng. Q. 27 (2) 133–144 (2013)
F i g . 1 3 – Compressive strength as function of %SO3/Cland time
F i g . 1 4 – Difference strength – strengthMax as function of%SO3/Cl and time
and �SO3 is ranging from 0.1% to 0.6% with astep of 0.05%. Coefficients B1, B2 are taken fromTable 7. The analytical model is applied to thesedata and the function between �str, �SO3 and SO3
is shown in Figures 15, 16 for the two cementtypes mentioned. The following remarks can bemade from these Figures: If the SO3 target is placedat the optimum value and this target is realized,then independently of the SO3 standard deviation,strength deviation remains low. On the contrary,as the SO3 value differs from the optimum value,then an increase of the SO3 variance, leads to a sig-nificant increase of the strength variability. Whenthe SO3 standard deviation is extremely high, thenany difference from the optimum SO3 is goingalong with a sharp deterioration of strength devia-tion.
Conclusions
Based on experimental design, test execution,statistical modelling and processing, the optimiza-tion of the sulphate content of cement was at-tempted. The analysis involves four cement typesproduced according to the norm EN 197-1. Com-
pressive strength was correlated with the ratio be-tween sulphates and clinker content – SO3/CL. Con-cerning 7 and 28 days compressive strength, forthree cement types not containing fly ash as maincompound, a common region of the optimumSO3/CL is determined. For the cements having flyash as main compound, optimum sulphates arefound in a distinguishable region from the previousdiffering 0.6% of SO3/CL in the 28 days strength.Consequently for the cements containing high per-centages of fly ash, separate control of the optimalgypsum dosage is required. Strength is also corre-lated with the ratio % moles SO3/ moles C3A. Forall CEM types except CEM IV, the optimum ratiowas found between 1.1 and 1.2. The correspondingoptimum molecular ratio for the CEM IV is higher,indicating that not all SO3 of the fly ash behave likegypsum sulphates.
Extensive long term laboratory tests have beenperformed to investigate the impact of the mortarcuring time on the optimum sulphate content. Forages from 2 days till to 63 months, a generalizedmodel is constructed between strength, sulphatesand logarithm of time presenting a regressioncoefficient higher than 0.995. It is concluded thatan increase in mortar age causes a respective in-crease of the sulphates optimum. This conclusion isvery important when the age in which the strengthmaximization is desirable is to be decided. The gen-eralized correlation proves the high significance ofrealizing an SO3 target located in the optimum re-gion corresponding to early or typical strength andthe critical economical effect of such decisions andactions.
In parallel by utilizing the error propagationmethodology, a variance analysis is performed be-tween strength and SO3 variance. This treatment in-dicates that if a significant difference of SO3 valuefrom the optimum one exists, then an increase ofthe SO3 variance, leads to a noticeable growth ofthe strength variability. Therefore the selection ofan optimal SO3 target, based on the analysis pre-sented, can lead to an optimal Clinker/Cement ratio,in order to achieve a certain strength target with aparallel minimal strength variability. The above canbe characterized as a contribution to the improve-ment of both cement plant operation and productquality.
The crucial role of gypsum on the cementquality, proved for a wide range of cementproducts with concrete correlations, renders impe-rative stricter controls and regulation of sulphatecontent, during the production operation. Moderncontrol techniques could be used in achieving thisaim.
D. TSAMATSOULIS and N. NIKOLAKAKOS, Optimizing the Sulphates Content …, Chem. Biochem. Eng. Q. 27 (2) 133–144 (2013) 143
F i g . 1 5 – Strength 28 days standard deviation as functionof %SO3 content and standard deviation forCEM II B-M (P-L) 32.5
F i g . 1 6 – Strength 28 days standard deviation as functionof %SO3 content and standard deviation forCEM II A-L 42.5
N o m e n c l a t u r e
A0, A1, A2 � Coefficients of equation (10)
B1, B2 � Coefficients of equation (16)
Blaine � Cement specific surface, m2 Kg–1
C0, C1, C2 � Coefficients of equations (3) and (5)
C2S � Dicalcium silicate, %
C3A � Tricalcium aluminate, %
C3S � Tricalcium silicate, %
C3A · 3Cs · 32H � ettringite
C4AF� Tetracalcium ferroaluminate, %
CL � Clinker fraction
CV � Coefficient of variation
Cs · 2H � Dihydrate gypsum, %
Cs · 0.5H � Hemihydrate gypsum, bassanite, %
Cs � Anhydrite, CaSO4, %
df � degrees of freedom in equation (14)
LOI � Loss on ignition, %
L0, L1 � Coefficients of equation (11)
M � Maximum number of cement compositions inequation (14)
MaxStr7 � Maximum strength at 7 days, MPa
MaxStr28 � Maximum strength at 28 days, MPa
MSO3/MC3A � Molecular ratio between SO3 and C3A
M0, M1 � Coefficients of equation (12)
N � Maximum number of time intervals in equation(14)
N0, N1, N2, N3 � Coefficients of equation (13)
R � Regression coefficient
R40 � Residue on sieve of 40 microns, %
RelStr7 � Dimensionless strength at 7 days
RelStr28 � Dimensionless strength at 28 days
RelStrX � Dimensionless strength at X days, X=7, 28
SO3 � Sulphates, %
SO3/CL � Mass ratio between SO3 and clinker content, %
StrAct� Actual strength in equation (14), MPa
StrCalc� Strength calculated from the model in equation(14), MPa
Str7 � Compressive strength at 7 days, MPa
Str28� Compressive strength at 28 days, MPa
Str(t) � Strength at time t, MPa
sres � Residual error in equation (14), MPa
t � Time, days
xi � Independent variables in equation (15)
y � Dependent variable in equation (15)
G r e e k s y m b o l s
�i2 � Variance of the variable xi in equation (15)
�CL2 � Variance of the variable CL
�R � Laboratory reproducibility in 28 days strength,MPa
�SO32 � Variance of the SO3, (%)2
�str2 � Variance of the strength, MPa2
�y2 � Variance of the variable y in equation (15)
R e f e r e n c e s
1. Lerch, W., Proceedings of the American Society for Test-ing Materials, 46 (1946) 1252.
2. Bentur, A., J. Am. Ceram. Soc., 59 (1976) 210.
3. Jeleniæ, I., Panoviæ, A., Halle, R., Gaæeša, T., Cem. Concr.Res., 7 (1977) 239.
4. Soroka, I., Abayneh, M., Cem. Concr. Res., 16 (1986) 495.
5. Hanhan, A.A., Influence of the SO3 Content of Cement onthe Durability and Strength of Concrete Exposed to So-dium Sulfate Environment, Thesis, University of SouthFlorida: College of Engineering, Florida, 2004.
6. Jansen, D., Goetz-Neunhoeffer, F., Stabler, C., Neubauer,J., Cem. Concr. Res., 41 (2011) 602.
7. Jansen, D., Goetz-Neunhoeffer, F., Lothenbach, B.,Neubauer, J., Cem. Concr. Res., 42 (2012) 134.
8. Miller, F.M., Tang, F.J., Cem. Concr. Res., 26 (1996) 1821.
9. Taylor, H.F.W., Cem. Concr. Res., 29 (1999) 1173.
10. Horkoss, S., Lteif, R., Rizk, T., Cem. Concr. Res., 41
(2011) 913.
11. Campiteli, V. C., Florindo, M. C., The Influence of Lime-stone Additions on Optimum Sulfur Trioxide Content inPortland Cements, P. Klieger and R. D. Hooton, (Eds.),Carbonate Additions to Cement, American Society forTesting and Materials, Philadelphia, 1990.
12. Yamashita, H.,Yamada, K., Hirao H., Hoshino, S., Con-crete Research and Technology, 18 (2007).
13. Lothenbach, B., Le Saout, G., Gallucci, E., Scrivener, K.,Cem. Concr. Res., 38 (2008) 848.
14. Sersale, R., Cioffi, R., Frigione, G., Zenone, F., Cem.Concr. Res., 21 (1991) 120.
15. Sideris, K.K., Manita, P., Sideris, K., Determination ofOptimum Gypsum Content of Portland Cement Using TheHydration Criterion Of Maximum Ultimate CompressiveStrength, Grieve, G., Owens, G. (Ed.), Proceedings of 11th
International Congress on the Chemistry of Cement, pp1913–1920, Durban, South Africa, Cement Concrete In-stitute of South Africa, 2003.
16. Tsamatsoulis, D., Nikolakakos, N., Investigation of SomeBasic Parameters Affecting the Optimum Sulphates Contentof Cement, Recent Researches in Circuits and Systems,Balas, V.E., Koksal, M. (Ed.), Proceedings of the 16thWSEAS International Conference on Circuits and Systems,pp 152–157, Kos Island, Greece, 2012, WSEAS Press 2012.
17. Alexander, K.M., Ivanusec, I., Cem. Concr. Res., 12
(1982) 51.
144 D. TSAMATSOULIS and N. NIKOLAKAKOS, Optimizing the Sulphates Content …, Chem. Biochem. Eng. Q. 27 (2) 133–144 (2013)