Embed Size (px)
Citation preview

Cathie Associates Ltd
Collingwood Buildings
38 Collingwood Street
Newcastle upon Tyne
NE1 1JF
United Kingdom
Tel: +44 191 269 6920
www.cathie-associates.com
NorthConnect
Cable Burial Risk Assessment
CA Report No.: C831R01 - 04
18/05/18

NorthConnect
Cable Burial Risk Assessment
C831R01 Issue 04
Page i of vi
18/05/18
DOCUMENT CONTROL
Project Title : NorthConnect
Report Title : Cable Burial Risk Assessment
CA Client Name :
:
NorthConnect KS
Client Ref. : Client reference
Document Ref. : C831R01
Issue : 04
Date : 18/05/18
Issue Status : Final
Revision History Date Author Reviewed Approved
01 Draft 06/11/17 PTH EJO JIR
02 For Comment 15/03/18 PTH DHI EJO
03 For Comment 04/05/18 PTH EJO RCO
04 Final 18/05/18 PTH EJO RCO
Project team
PTH Peter Thompson Project Engineer I
EJO Ed Jones Senior Engineer
JIR Jamie Irvine Senior Engineer
DHI David Higgs Senior Project Engineer
RCO Robin Comrie UK Director

NorthConnect
Cable Burial Risk Assessment
C831R01 Issue 04
Page ii of vi
18/05/18
SUMMARY
NorthConnect is a project set up to develop, consent, build, own and operate an HVDC
electrical interconnector between Peterhead in Scotland and Simadalen in Norway. The
665km long, 1400MW interconnector will provide an electricity transmission link allowing the
two nations to exchange power and increase use of renewable energy. The intention is for
the HVDC interconnector to be operational by 2023.
Under instruction from the Client, Cathie Associates has undertaken a Cable Burial Risk
Assessment (CBRA) for the subsea cable route corridor from Boddam, Peterhead to
Simadalen at the head of Hardangerfjord. This report presents the results of the CBRA for the
complete subsea cable route corridor based upon the best industry practice as documented
by the Carbon Trust CBRA Guidance and DNV guidelines.
The shallow geology of the survey corridor varies considerably across the entire route length:
from loose to dense sands and extremely low to high strength clays; through to gravels, glacial
Tills, boulder areas and outcropping bedrock.
The North Sea section mainly comprises of sands and lower strength clays. However, glacial
Tills are expected to be subcropping at varying depth within the surveyed corridor between
KP 1.35 and KP 5.1 in the UK nearshore, with some localised bedrock outcrops. High strength
clays are also found within the first 5km of the UK landfall, generally overlying the Till, and in
localised areas of the eastern slope of the Norwegian Trench (KP 447.5 to KP 456.2). Boulders
are common within the first 62.5km of the route and within the Fjord.
Localised bedrock outcrops are noted on the approach to the Norwegian coastline, in
particular between KP 470 and KP 474, and within the Hardangerfjord. Bedrock/Till is
interpreted periodically in raised areas across the width of the Hardangerfjord. These may
represent terminal moraine features; however the presence of bedrock has not been ruled
out by the survey contractor. In the bottom of the Fjord, the sides of which are steep and
rocky, clays of very low to extremely low strength are found. In many areas, these sediments
are interpreted as being mass-transport deposits. Historic slip-scarp features occur regularly
perpendicular to the Fjord length.
A HAZID workshop was conducted between Cathie Associates and NorthConnect KS. The
outcome of this workshop was a set of hazard considerations to progress forward into this
CBRA. Through the undertaking of the risk assessment, the most onerous hazards to the cables
were identified as;
➢ Anchors from transiting vessels (Dropped in emergency circumstances)
➢ Fishing gear seabed interaction (Trawling, potting)
➢ Rock fall / Landslides (Fjord section)
➢ Submarine Slope Failures (Fjord section)
As agreed with NorthConnect KS a quantitative approach has been undertaken to
understand the level of protection offered against anchoring by a range of burial depths as
presented in Appendix B and discussed in detail in Appendix D. Maximum threatline depths
NorthConnect
Cable Burial Risk Assessment
C831R01 Issue 04
Page iii of vi
18/05/18
have also been determined for the other main hazards identified, and recommended
minimum depths of lowering are proposed to mitigate these hazards as detailed in the CBRA
table in Appendix B.
It should be noted that the Cable Burial Risk Assessment only considers hazards anticipated
during the operational lifespan of the cable (and not during installation). The findings of this
assessment have been used to inform a separate Cable Protection Analysis Report, which
covers installation risks to the subsea cables.

NorthConnect
Cable Burial Risk Assessment
C831R01 Issue 04
Page iv of vi
18/05/18
TABLE OF CONTENTS
1. Introduction ...................................................................................................................................... 1
1.1 Background ................................................................................................................................ 1
1.2 Objectives and Purpose of Document ................................................................................. 1
1.3 Aim and Scope of Work ........................................................................................................... 3
1.4 Abbreviations ............................................................................................................................. 3
2. Data Adequacy Review ............................................................................................................... 5
2.1 Data Sources .............................................................................................................................. 5
2.2 Data Adequacies and Gaps .................................................................................................. 7
2.2.1 A note on Route Positioning Lists (RPL’s) .......................................................................... 8
3. Assessment of Seabed Conditions .............................................................................................. 9
3.1 Bathymetry and Seabed Features ......................................................................................... 9
3.2 Existing Infrastructure ................................................................................................................ 9
3.3 Regional Geology Summary ................................................................................................. 10
3.4 Shallow Geology ..................................................................................................................... 13
3.4.1 Inner Fjord Ridges ............................................................................................................... 14
3.4.2 Geological and Geotechnical conditions along the route ...................................... 16
4. Burial Risk Assessment Methodology ......................................................................................... 20
4.1 Introduction .............................................................................................................................. 20
4.2 Methodology ........................................................................................................................... 20
4.3 Hazard Classification .............................................................................................................. 20
5. Threat/Hazard Identification and Assessment ........................................................................ 23
5.1 Geotechnical Risk Register .................................................................................................... 23
5.2 Primary Hazards ....................................................................................................................... 23
5.2.1 Shipping ............................................................................................................................... 23
5.2.2 Anchorages and Fish-Farms ............................................................................................. 24
5.2.3 Fishing ................................................................................................................................... 24
5.2.4 On-bottom Stability ............................................................................................................ 26
5.2.5 Dredging/Soil Dumping ..................................................................................................... 26
5.2.6 Rockfall ................................................................................................................................. 26
5.2.7 Submarine Slopes ............................................................................................................... 27
5.3 Secondary Hazards ................................................................................................................. 29
5.3.1 Mobile Sediments ............................................................................................................... 29
6. Conclusions and Recommendations ....................................................................................... 31
NorthConnect
Cable Burial Risk Assessment
C831R01 Issue 04
Page v of vi
18/05/18
LIST OF TABLES
Table 1: List of abbreviations ..................................................................................................................... 3 Table 2: Data appraisal .............................................................................................................................. 7 Table 3: Shallow soil formations expected in the UK Sector (upper 3m) ........................................ 11 Table 4: Shallow soils expected in the Norwegian Sector (upper 3m) ........................................... 12 Table 5: Approximate Distribution of Geological Formations ........................................................... 13 Table 6: Route Section Geology ............................................................................................................. 16 Table 7: Undrained Shear Strength Definitions ..................................................................................... 18 Table 8: MMT seabed index ..................................................................................................................... 19 Table 9: Primary hazards ........................................................................................................................... 21 Table 10: Typical secondary hazards ..................................................................................................... 21 Table 11: Summary of findings of probabilistic assessment (return period, years) ........................ 24 Table 12: MMT mobile bedform size classification .............................................................................. 29
LIST OF FIGURES
Figure 1: Overview of the NorthConnect survey corridor and original survey sections (Ref. 1) ... 2 Figure 2: Bathymetry and interpretation of a Fjord ridge (MMT Chart 4114) ................................. 15 Figure 3: Route Bathymetry (Ref. 2) ........................................................................................................ 15 Figure 4: Norwegian Fishing Authority Fishing Intensity Data ............................................................ 25

NorthConnect
Cable Burial Risk Assessment
C831R01 Issue 04
Page vi of vi
18/05/18
LIST OF APPENDICES
Appendix A – Risk Register
Appendix B – Cable Burial Risk Assessment Table
Appendix C – Shipping Assessment
Appendix C.1.1 Shipping Data
Appendix C.1.2 Data Processing
Appendix C.1.3 Data assessment / data gaps
Appendix C.1.4 Traffic Patterns and Trends
Appendix C.1.5 Vessel Type
Appendix C.1.6 Vessel Size
Appendix C.1.7 Anchorages
Appendix D – Anchor Risk Probabilistic Methodology
Appendix D.1.1 Anchor Frequency Assessment
Appendix D.1.2 Anchor Threatline Assessment
Appendix D.1.3 Probabilistic Assessment Results
Appendix E – Shipping Drawings
Appendix F – Alignment Charts
NorthConnect
Cable Burial Risk Assessment
C831R01 Issue 04
Page 1 of 31
18/05/18
1. INTRODUCTION
1.1 Background
NorthConnect is a project set up to develop, consent, build, own and operate an HVDC
electrical interconnector between Peterhead in Scotland and Simadalen in Norway. The
665km long, 1400MW interconnector will provide an electricity transmission link allowing the two
nations to exchange power and increase use of renewable energy. The intention is for the
HVDC interconnector to be operational by 2023.
NorthConnect KS is a Joint Venture (JV) project company owned by four community and state-
owned partners from Norway and Sweden: Agder Energi AS, E-CO Energi AS, Lyse Produksjon
AS, and Vattenfall AB. The partnership was established on 1st February 2011.
A 550m corridor has been surveyed by MMT and the cable routes will be optimised within this
corridor based on the results of the survey. Within the UK 12NM limit, a 60m wide “Conceptual
Installation Corridor” will be defined for the purposes of environmental consenting.
Under instruction from the Client, Cathie Associates has undertaken a Cable Burial Risk
Assessment (CBRA) for the complete route from Long Haven Bay, Peterhead to Simadalen,
Handangerfjord. The findings of this assessment (cable risk threatlines and other seabed
features) will be used to inform protection levels and a separate Cable Protection Analysis
Report. The Cable Protection Analysis Report (CPAR, C831R02) will comprise a burial assessment
of the cable corridor for different tool types and a review of burial tools currently available in
the market along with consideration of alternative forms of cable protection where these may
be required.
1.2 Objectives and Purpose of Document
The objectives of this study are to summarise all available data pertaining to the seabed
conditions along the length and width of the cable route corridor and identify potential
hazards to the NorthConnect Interconnector cables. This report is focussed on hazards which
pose a threat during the operational lifetime of the cables, whilst the CPAR focusses on risks
associated with installation.
Based upon the threatlines identified, minimum recommended depths of lowering (depth from
mean seabed level to top of product) have been derived based upon the fishing threatline
depth and mobile sediment amplitude (of large ripple class and smaller) to protect the cable
from fishing as a minimum (residual risk from shipping is discussed separately within the report).
Separately, NorthConnect have developed front-end engineering design (FEED) protection
levels (A, B, C, D) that are to apply to each section. These use the threatlines, probabilistic
anchor risk and seabed conditions as presented in this report to produce two burial depths for
both “Hard” and “Soft” sediment conditions, with the definitions of being those as-used for
anchor assessment (namely soft soils comprising clays of <40kPa shear strength, and hard soils
comprising higher strength clays and/or sands).
NorthConnect
Cable Burial Risk Assessment
C831R01 Issue 04
Page 2 of 31
18/05/18
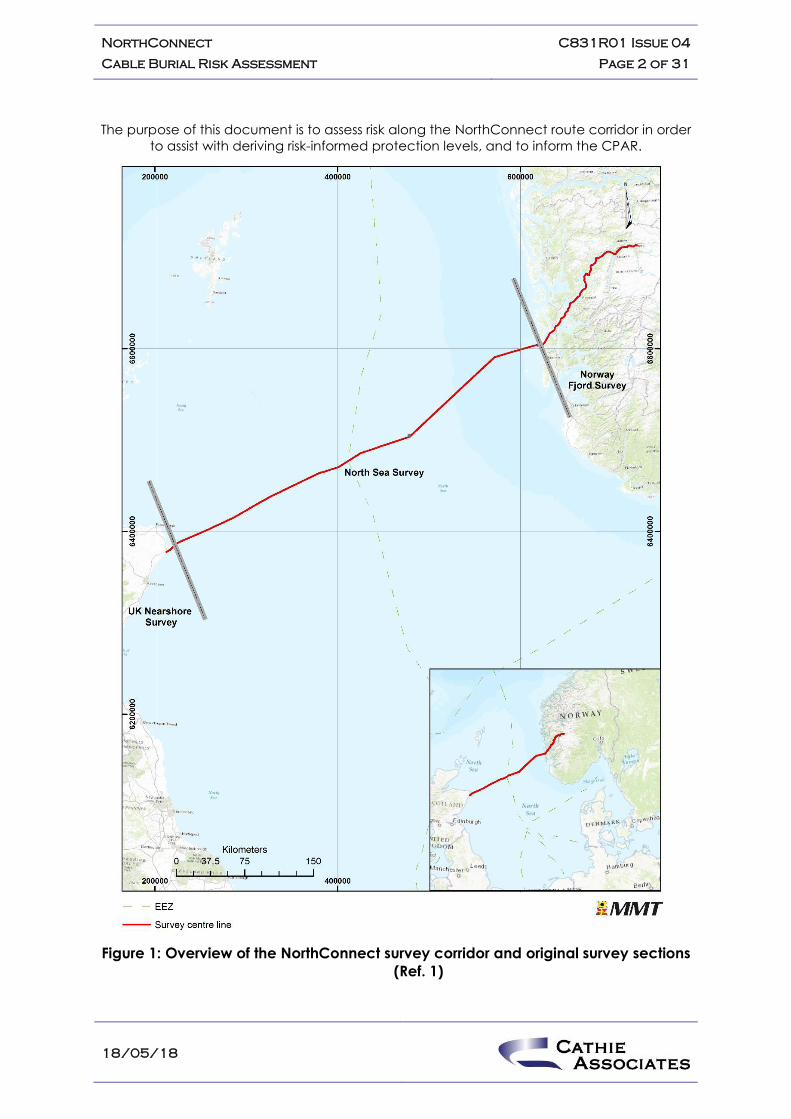
The purpose of this document is to assess risk along the NorthConnect route corridor in order
to assist with deriving risk-informed protection levels, and to inform the CPAR.
Figure 1: Overview of the NorthConnect survey corridor and original survey sections
(Ref. 1)

NorthConnect
Cable Burial Risk Assessment
C831R01 Issue 04
Page 3 of 31
18/05/18
1.3 Aim and Scope of Work
The aim of this work scope is to inform the route engineering and cable protection strategy.
The scope of work is as follows:
➢ Review of all available data to establish ground conditions and establish any data gaps
➢ Review of existing hazard and risk assessments and update as necessary based upon
latest available information
➢ HAZID workshop and establishment of Risk Register
➢ Characterisation of areas of mobile bedforms
➢ Shipping assessment based on third party AIS dataset
➢ Derivation of threatline depths below the seabed for the identified hazards
➢ Anchor penetration study including probabilistic assessment to inform risk-based target
burial depths
➢ Production of a CBRA Report including Alignment Charts to document the findings of
the study and inform the next phase of the engineering i.e. the CPAR
1.4 Abbreviations
A list of the abbreviations used in this report is provided in Table 1.
Table 1: List of abbreviations
Abbreviation Description
AIS Automatic Identification System
ALARP As Low As Reasonably Practicable
BAS Burial Assessment
bsbl Below Sea bed level
CBRA Cable Burial Risk Assessment
Client NorthConnect KS
CPAR Cable Protection Analysis Report
DOL Depth of Lowering (to top of product)
DTS Desk Top Study

NorthConnect
Cable Burial Risk Assessment
C831R01 Issue 04
Page 4 of 31
18/05/18
Abbreviation Description
FEED Front End Engineering Design
IMR Inspection Maintenance Repair
KP Kilometre Post
LAT Lowest Astronomical Tide
MAG Magnetometer
MBES Multi-beam Echo Sounder
mbsbl Metres Below Sea Bed Level
MSL Mean Sea Level
N/A Not Available
NM Nautical Mile
CPT Cone Penetration Test
RSBL Reference Sea Bed Level
SBP Sub Bottom Profiler
SCL Survey Centre Line
SSS Side Scan Sonar
UXO Unexploded Ordnance
VC Vibrocore
OOS Out of Service (infrastructure)
NorthConnect
Cable Burial Risk Assessment
C831R01 Issue 04
Page 5 of 31
18/05/18
2. DATA ADEQUACY REVIEW
2.1 Data Sources
Several Front-End Engineering Design reports have been undertaken for the project including
a Desk Top Study (DTS), incorporating a preliminary hazard assessment and cable route
engineering; and an initial Cable Protection Study comprising risk assessment and trenchability
assessment by the Client. In addition, a geophysical, benthic and geotechnical investigation
of the cable route has been performed: the results of which have been used to inform both
this CBRA report and the CPAR.
The Client supplied the following documents for use in the assessment:
1. MMT, Geotechnical Report: 102273-NOC-MMT-SUR-REP-GEOTECH (Feb 18)
2. MMT, Geophysical, Benthic and Geotechnical Route Survey: Final Survey Report, Ref:
102273-NOC-MMT-SUR-REP-SURVEYRE (May 18)
3. MMT, Geophysical, Benthic and Geotechnical Route Survey: Field Operations Report,
Crossing and Inspection Survey, Ref: 102273-NOC-MMT-SUR-REP-CIFREPLB (Nov 17)
4. MMT, Geophysical, Benthic and Geotechnical Route Survey: Field Archaeological
Report, Ref: 102273-NOC-MMT-SUR-REP-FIELDALB (Apr 17)
5. MMT, Geophysical, Benthic and Geotechnical Route Survey: Geophysical and
Geotechnical Alignment Chart(s), RPL-R09, Route B (Mar 18)
6. NorthConnect, RPL-RouteB-R09 (Nov 17)
7. MMT, Contact and Anomaly lists, UK Nearshore and North Sea, project 102273 (Survey
Report Appendix)
8. NorthConnect, Attachment E01.10 - Requirements to Submarine Cable Protection
(16/04/18)
9. Xodus, Desk Top Survey and Route Engineering Study: Route Option Analysis Report,
Ref: A-30722-S04-REPT-002 (Sep 12)
10. MMT, GIS data, WebGIS portal data
11. Riggall & Associates, Conceptual HDD Design Norther / Southern Alignment, Drawing
No. 20160401RA-C/01 and 04 (May 16)
12. 6 Alpha, UXO desk top study (May 17)
13. NGI, Hardangerfjord Geohazard Assessment, Document number 20180094-01-R (Mar
18)
14. NorthConnect, Attachment E02.02.01 Annex 1: List of Crossings (25/04/18)

NorthConnect
Cable Burial Risk Assessment
C831R01 Issue 04
Page 6 of 31
18/05/18
The following additional non-project specific references have been used:
15. BGS, 1994. Geology of the central North Sea. London: HMSO
16. BGS 1:250000 UTM series of the United Kingdom and continental shelf, sheet 57N-02W,
Peterhead, 1986.
17. Carbon Trust, Cable Burial Risk Assessment Methodology, Guidance for the Preparation
of Cable Burial Depth of Lowering Specification, CTC835, February 2015
18. Carbon Trust, Application Guide for the Specification of the Depth of Lowering using
the Cable Burial Risk Assessment (CBRA) methodology, Dec 2015
19. DNV-RP-F107, Recommended Practice, Risk Assessment of Pipeline Protection, October
2010
20. Deltares, 2013. Anchor Tests German Bight. Document Number 1207052-002-GEO-0003
21. Eigaard, O.R. et al, 2015. Estimating seabed pressure from demersal trawls, seines and
dredges based on gear design and dimensions. ICES Journal of Marine Science.
22. Marine Management Organisation, UK Sea Fisheries Statistics 2015, 2015.
23. Marine Traffic, AIS Traffic Data, whole NSL route – two full calendar years 10/2015 to
09/2017 © marinetraffic.com 2015/2017
24. Shapiro S., Murray J., Gleason R., Barnes S., Eales B., and Woodward P., (1997) Threats
to Submarine Cable, SubOptic ’07, San Francisco.
25. DNV, Subsea Power Cables in Shallow Water, DNV-RP-J301, 2014.
26. Vryhof Anchors, Anchor Manual 2010 – The Guide to Anchoring, 2010
27. MAIB, 1997. Report of the Inspector’s Inquiry into the loss of the Fishing Vessel Westhaven
AH 190 with four lives on 10 March 1997 in the North Sea.
28. Marine Scotland web GIS portal: https://marinescotland.atkinsgeospatial.com/nmpi/
29. Norwegian fisheries map data: https://kart.fiskeridir.no/
30. Postglacial mass movements and depositional environments in a high-latitude fjord
system – Hardangerfjorden, Western Norway (Benjamin Bellwald, Berit Oline Hjelstuen,
Hans Petter Sejrup, Haflidi Haflidason)
Under instruction from NorthConnect KS, Cathie Associates has also completed the following
separate studies:
31. Cathie Associates, Cable Protection Analysis Report, C831 R02
32. Cathie Associates, UK 12 NM Detailed Burial Assessment, C831 R03
NorthConnect
Cable Burial Risk Assessment
C831R01 Issue 04
Page 7 of 31
18/05/18
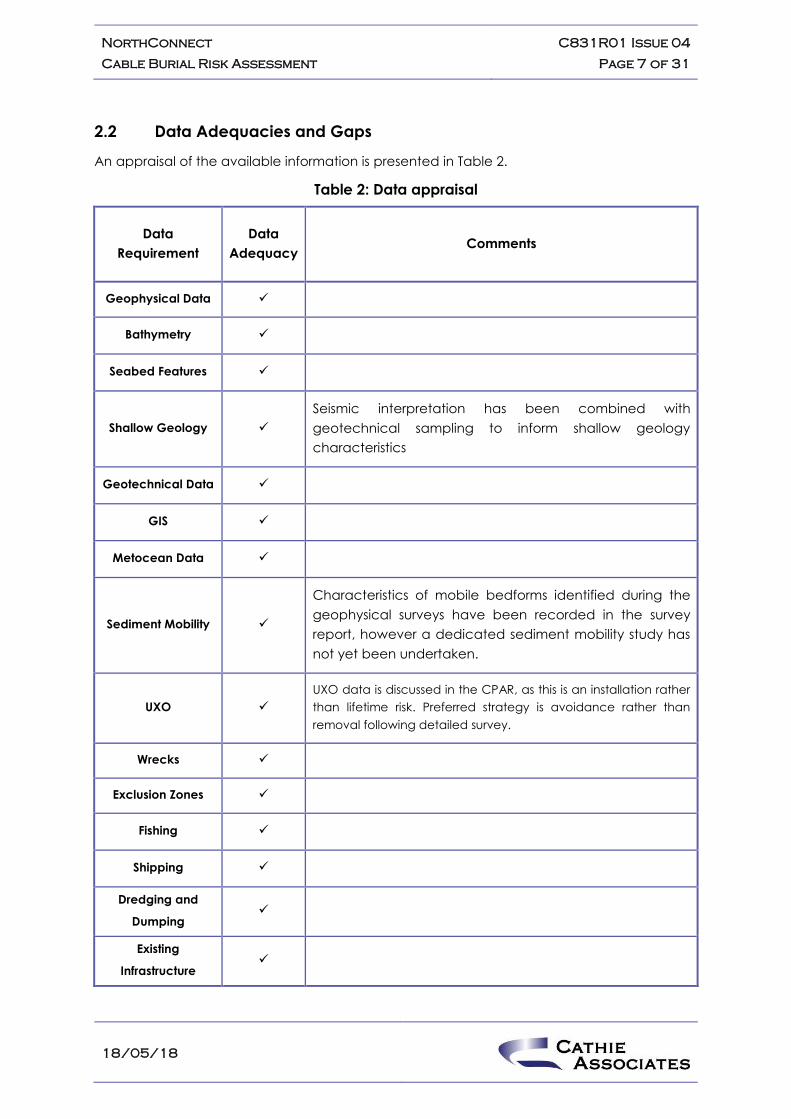
2.2 Data Adequacies and Gaps
An appraisal of the available information is presented in Table 2.
Table 2: Data appraisal
Data
Requirement
Data
Adequacy Comments
Geophysical Data ✓
Bathymetry ✓
Seabed Features ✓
Shallow Geology ✓
Seismic interpretation has been combined with
geotechnical sampling to inform shallow geology
characteristics
Geotechnical Data ✓
GIS ✓
Metocean Data ✓
Sediment Mobility ✓
Characteristics of mobile bedforms identified during the
geophysical surveys have been recorded in the survey
report, however a dedicated sediment mobility study has
not yet been undertaken.
UXO ✓
UXO data is discussed in the CPAR, as this is an installation rather
than lifetime risk. Preferred strategy is avoidance rather than
removal following detailed survey.
Wrecks ✓
Exclusion Zones ✓
Fishing ✓
Shipping ✓
Dredging and
Dumping ✓
Existing
Infrastructure ✓

NorthConnect
Cable Burial Risk Assessment
C831R01 Issue 04
Page 8 of 31
18/05/18
Data
Requirement
Data
Adequacy Comments
Cable
Specification Not yet available
RPL ✓
References to KPs are based on the Survey Centre Line.
KPs are correct for RPL09.
Slope stability ✓ NGI report has assessed slopes identified as most critical
The available data supplied by the Client and gathered by Cathie Associates during the
assessment from third party sources has been deemed generally acceptable to undertake this
cable burial risk assessment.
2.2.1 A note on Route Positioning Lists (RPL’s)
KP distances are given according to RPL09, however sample localities and the start and end
of each assessed section are also referenced in Easting/Northing co-ordinates in the event that
the RPL is updated further.
This report (C831R01), as well as the CPAR (Ref. 31) has been carried out using the survey centre-
line of RPL09 as the basis of the KP system and recording of seabed features. According to
RPL09, the HDD exit is located at KP 0.1. A separate report (Ref. 32) covers the UK 12 Nautical
Mile area (to KP 27.7) in greater detail and presents an amended RPL/KP system to account for
some minor re-routing.

NorthConnect
Cable Burial Risk Assessment
C831R01 Issue 04
Page 9 of 31
18/05/18
3. ASSESSMENT OF SEABED CONDITIONS
3.1 Bathymetry and Seabed Features
The bathymetry and seabed features have been summarised from the latest survey data (Ref.
1) and alignment charts (Ref. 5) in the CBRA table in Appendix B. The main seabed features
observed are:
➢ Surface boulders: Surface boulders of varying density are found mostly within the first
50km from the UK landfall, and in parts of the Fjord. The implications of boulders on
cable installation are discussed in detail in the CPAR (C831R02) and 12NM BAS
(C831R03).
➢ Mobile sediments: Found mostly within the first 62.5km of the UK landfall (see section
5.3.1 for discussion on mobile sediments)
➢ Iceberg plough marks: The base of icebergs during the previous ice age have carved
marks into the seabed between KP 415 and KP 456. Clay strength is variable in parts of
this area depending upon the level of reworking and soft clay infill.
➢ Trawl marks: Evidence of demersal fishing, found across most of the North Sea. See
section 5.2.3 for discussion of fishing.
➢ Pockmarks: Naturally occurring depressions in the seabed found regularly between KP
80 and KP 415, noted in the CBRA table, Appendix B. These should be avoided by the
final route as they are generally steep-sided their formation is associated with
potentially corrosive gas.
➢ Potential slip scarps across the cable route and landslides from the Fjord sides. See
sections 5.2.6 and 5.2.7 for further discussion.
➢ Outcropping / thinly covered bedrock: In the UK nearshore c. KP 4, outcropping
bedrock is noted (avoided though later routing). Within the Fjord, Bedrock/Till and
Bedrock areas are common. In the latter case, many of these areas may be avoided
by routing (See CPAR Appendix Table, Ref. 31) to allow the cable to be buried in soft
sediment, however between KP 470 and KP 474, shallow bedrock is generally
unavoidable.
A bathymetric profile of the route is given in Figure 3, section 3.4.1. This shows the rapid
deepening from the UK end of the route into the North sea , the deep Norwegian Trench
(maximum 280m on route), and the very deep water found within Handangerfjord (maximum
c. 850m). Water depth holds implications for anchor strike risk and the probabilities of successful
anchor deployment. This is discussed in Appendix D. Discussed in section 3.4.1 are the potential
moraine Till or bedrock ridges that can be seen on the profile between KP 450 and KP 600.
3.2 Existing Infrastructure
A large number of cables and pipelines (both in service and decommissioned) are indicated
to cross the cable route. A comprehensive list is provided in Ref. 14, and crossing locations,
infrastructure type and burial status (North Sea only) are also detailed in Appendix B (note this

NorthConnect
Cable Burial Risk Assessment
C831R01 Issue 04
Page 10 of 31
18/05/18
includes some repeat crossings). Not all of this infrastructure will be crossed using a designed
crossing, e.g. disused cables will be cut and cleared from the route.
It should also be noted that the presence of some of this infrastructure could not be confirmed
during the survey e.g. the disused Aberdeen-Bergen telegraph cable, where nothing was
found at the expected location, however a cable was detected c. 4km closer to the UK. The
telegraph cable could either have been cut and subsequently moved from its original position,
or the as-found location could represent an unrecorded cable, leaving the Aberdeen-Bergen
cable unfound.
At the time of the subsea inspection, the Hywind export cable at KP 10.964 (RPL09) was located
in a partially covered, very shallow trench. At the time of writing, the cable has been protected
using placed rock berms. This has required almost 60,000 tons of rock placed along the majority
of the length of the 24km export cable. The example of the Hywind export cable and how any
lessons-learned may impact the cable installation strategy of NorthConnect is discussed in
detail in the detailed 12NM burial assessment (Ref. 32).
Consultation with the relevant stakeholders and appropriate crossing agreements should
ensure that the risk associated with these assets is safely mitigated. Once the specific
requirements of the Crossing Owners are understood, a suitable cable protection strategy for
these areas can be developed to ensure the residual risk is ALARP. Crossing protection e.g.
mattressing/rock placement will be discussed in the CPAR.
3.3 Regional Geology Summary
Publicly available information from the BGS (Ref. 15, 16) and the DTS (Ref. 9) has been consulted
to provide an initial assessment of the of regional geology in the North Sea. The principal
formations within the uppermost 3m of the seabed are listed in the following tables for
information purposes, although detailed information is taken from the more recent MMT survey.

NorthConnect
Cable Burial Risk Assessment
C831R01 Issue 04
Page 11 of 31
18/05/18
Table 3: Shallow soil formations expected in the UK Sector (upper 3m)
Soil
Formation General Description
Holocene Veneer of surficial SANDS
Forth
Formation
Upper
Medium dense to very dense fine SAND, locally gravelly
Forth
Formation
Lower
Very soft to stiff slightly sandy CLAY, partings and layers of
sand. Near the Scottish coast, includes the St Andrew's Bay
member, soft to stiff laminated plastic CLAY with gravel
Wee
Bankie
Formation
Till interbedded with thin layers of sand and silty clay, coarse
sand and gravel deposits, resting on bedrock or pre-
Quaternary Sediments
Witch
Ground
Formation
Very soft to soft slightly sandy CLAY with fine to coarse gravel,
can grade to SILT or to SAND soils at the margins of the Witch
Ground Basin
Coal Pit
Formation Firm to very stiff CLAY and dense to very dense SAND

NorthConnect
Cable Burial Risk Assessment
C831R01 Issue 04
Page 12 of 31
18/05/18
Table 4: Shallow soils expected in the Norwegian Sector (upper 3m)
Soil
Formation General Description
Flags
Formation
Correlates with Witch Ground Formation in UK sector. Very soft
to soft CLAY
Viking Bank
Formation
Generally well-sorted sands, forming topographic rises, clays
at base can form channel-fill deposits
Kleppe
Senior
Formation
Very soft to soft CLAY, correlates with Witch Ground in time
and soil character
Norwegian
Trench
Formation
Gravelly stiff to hard CLAY
Tampen
Formation
Firm to very stiff sandy silty CLAY, sand partings and local
gravel lenses
Sperus
Formation
Mainly firm to very stiff, sandy silty CLAY with shells and
pebbles
Cape Shore
Formation
Reworked soil, predominantly sandy with pebbles. Grades to
more clay-dominated soil further north
Ferder
Formation
Mainly firm to hard sandy gravelly CLAY, some sections more
laminated with silt and sand layers
Bedrock
(Pre-
Quaternary)
May outcrop (depending on interpretation) locally at seabed
approaching the coast, crystalline.

NorthConnect
Cable Burial Risk Assessment
C831R01 Issue 04
Page 13 of 31
18/05/18
Table 5: Approximate Distribution of Geological Formations
Approx.
KP from
Approx.
KP to Formation(s)
0 45
Forth Upper/Lower Formations
Wee Bankie Formation (sub-cropping,
outcropping on Port survey line) between KP
1.35 and KP 5.1
45 60 Coal Pit Formation
60 224 Witch Ground Formation
224 360 Flags, Viking, Sperus, Cape Shore, Ferder
Formations
360 370 Tampen, Viking Bank, Sperus Formations
370 380 Kleppe Snr., Norwegian Trench Formations
380 460 Kleppe Snr. Formation
460 480 Tills, Bedrock
480 664
Fjord. Soft sediments punctuated by Till
(possibly glacial moraine) or bedrock ridges
across Fjord.
Note that these KP distances (For the range 0 - 480) are approximate and obtained from
geological map information, with the exception of the Wee Bankie Formation, which is likely to
be correlated with the sub-cropping Till observed on the MMT alignment charts 4000 and 4001
(Ref. 5).
The bedrock at the UK coastline (which the HDD will pass through) is granite. Consultation with
BGS maps suggests that the bedrock encountered in the vicinity of KP 4 is conglomeritic
sandstone, although this is to be avoided (See C831R03 detailed BAS)
Any bedrock encountered approaching the Norwegian coast or within the Fjord is expected
to be granitic or metamorphic in nature, such as between KP 470 and KP 474.
3.4 Shallow Geology
The shallow geology has been assessed based upon the findings of the detailed geophysical
survey and the geotechnical sampling undertaken by MMT and presented on their charts (Ref.
1, Ref. 2, Ref. 6). Where further interpretation has been undertaken by Cathie Associates this
has been indicated.

NorthConnect
Cable Burial Risk Assessment
C831R01 Issue 04
Page 14 of 31
18/05/18
The shallow geology of the survey corridor varies considerably across the entire route length:
from loose to dense sands and extremely low to high strength clays; through to gravels, glacial
Tills, boulder areas and outcropping bedrock.
The North Sea section mainly comprises of sands and lower strength clays. However, glacial Tills
are expected to be subcropping at varying depth within the surveyed corridor between KP
1.35 and KP 5.1 in the UK nearshore (Possibly the Wee Bankie Formation), with some localised
bedrock outcrops. High strength clays are also found within the first 5km of the UK landfall,
generally overlying the Till, and in localised areas of the eastern slope of the Norwegian Trench
(KP 447.5 to KP 456.2). Boulders are common within the first 62.5km of the route and within the
Fjord.
Localised bedrock outcrops are noted on the approach to the Norwegian coastline, in
particular between KP 470 and KP 474, and within the Hardangerfjord. Bedrock/Till is interpreted
periodically in raised areas across the width of the Hardangerfjord, with a veneer of soft
sediment. These may represent terminal moraine features; however the presence of bedrock
has not been ruled out by the survey contractor. In the bottom of the Fjord, the sides of which
are steep and rocky, clays of very low to extremely low strength are found. In many areas,
these sediments are interpreted as being mass-transport deposits. Historic slip-scarp features
occur regularly perpendicular to the Fjord length.
Geological conditions are summarised on a section by section basis in Table 6 of section 3.4.2.
Further discussion of the expected geology is also included in the CPAR, (C831R02, Ref. 31) and
12NM Detailed BAS (C831R03, Ref.32) where it is discussed in relation to anticipated burial tool
performance.
3.4.1 Inner Fjord Ridges
Relatively steep, pronounced, bathymetric ridges periodically cross the Fjord perpendicular to
the cable. MMT sub-bottom profile sections interpret these features as Till or Bedrock/Till in
different locations. The example shown in Figure 2 below (Peak KP 521.75) is interpreted as Till.
The scale of these features is best seen on an overview profile of route bathymetry (Right hand
side of Figure 2). This profile between KP 400 and KP 600 suggests these features could be
interpreted as terminal or push moraines, left behind after pulses of re-advancement during
overall glacial retreat following the last glacial maximum (LGM), although where Bedrock/Till is
interpreted, shallow rock should not be ruled out. Only one sample (VC 15-SS-01, KP 592.698)
appears to possibly encounter the top of this Till, recording fine to medium sand below 0.7m.

NorthConnect
Cable Burial Risk Assessment
C831R01 Issue 04
Page 15 of 31
18/05/18
Figure 2: Bathymetry and interpretation of a Fjord ridge (MMT Chart 4114)
Figure 3: Route Bathymetry (Ref. 2)
Significant seabed gradients are associated with the area. The issue of seabed gradients, slope
stability hazards and how they will impact the installation is covered in more detail in the CPAR
(Ref. 31), although if burial tools cannot be used due to gradient, external protection may be
provided.
If and where bedrock is exposed or covered by very thin sediments (insufficient for burial),
stabilisation and protection of the cable will be achieved by means other than burial, most
likely using rock placement. It is often possible to route the cable away from interpreted
outcropping/sub-cropping bedrock and allow burial into the seabed. Steep seabed gradients
that are impassable by burial equipment may also see the cable surface-laid and protected
NorthConnect
Cable Burial Risk Assessment
C831R01 Issue 04
Page 16 of 31
18/05/18
by external protection. Another solution could be to operate a jet trencher in free-flying mode,
as discussed in the CPAR report (Ref. 31).
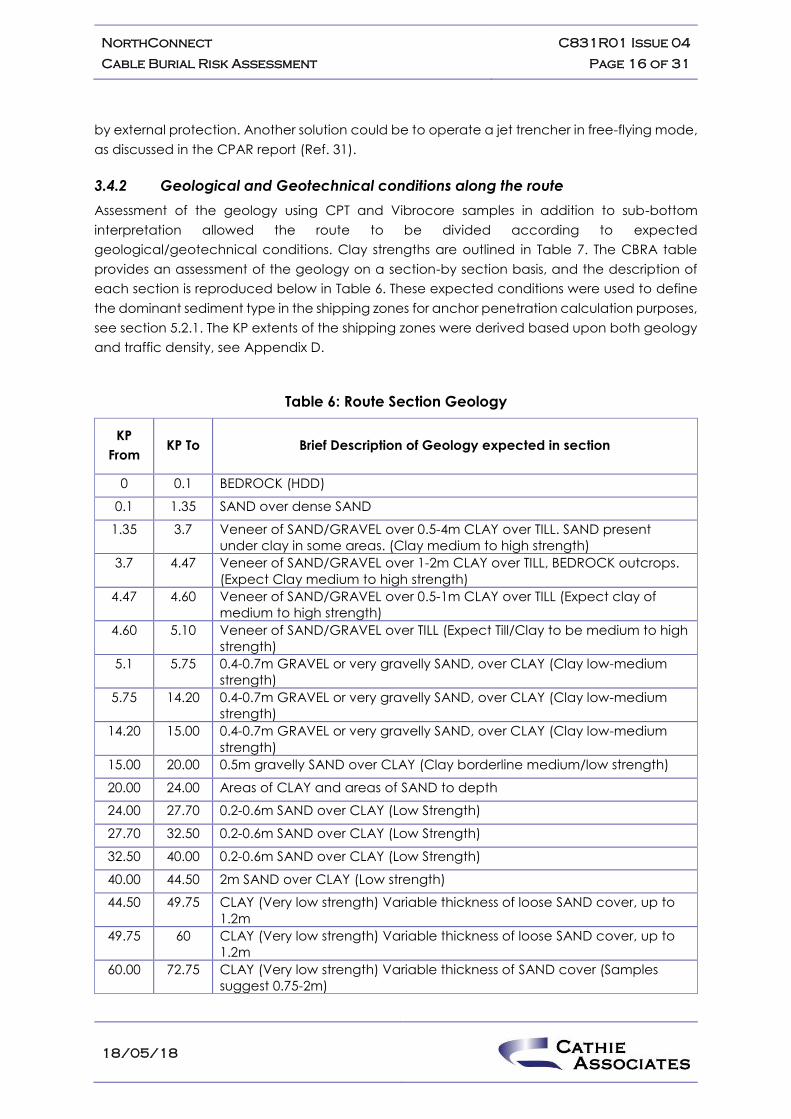
3.4.2 Geological and Geotechnical conditions along the route
Assessment of the geology using CPT and Vibrocore samples in addition to sub-bottom
interpretation allowed the route to be divided according to expected
geological/geotechnical conditions. Clay strengths are outlined in Table 7. The CBRA table
provides an assessment of the geology on a section-by section basis, and the description of
each section is reproduced below in Table 6. These expected conditions were used to define
the dominant sediment type in the shipping zones for anchor penetration calculation purposes,
see section 5.2.1. The KP extents of the shipping zones were derived based upon both geology
and traffic density, see Appendix D.
Table 6: Route Section Geology
KP
From KP To Brief Description of Geology expected in section
0 0.1 BEDROCK (HDD)
0.1 1.35 SAND over dense SAND
1.35 3.7 Veneer of SAND/GRAVEL over 0.5-4m CLAY over TILL. SAND present
under clay in some areas. (Clay medium to high strength)
3.7 4.47 Veneer of SAND/GRAVEL over 1-2m CLAY over TILL, BEDROCK outcrops.
(Expect Clay medium to high strength)
4.47 4.60 Veneer of SAND/GRAVEL over 0.5-1m CLAY over TILL (Expect clay of
medium to high strength)
4.60 5.10 Veneer of SAND/GRAVEL over TILL (Expect Till/Clay to be medium to high
strength)
5.1 5.75 0.4-0.7m GRAVEL or very gravelly SAND, over CLAY (Clay low-medium
strength)
5.75 14.20 0.4-0.7m GRAVEL or very gravelly SAND, over CLAY (Clay low-medium
strength)
14.20 15.00 0.4-0.7m GRAVEL or very gravelly SAND, over CLAY (Clay low-medium
strength)
15.00 20.00 0.5m gravelly SAND over CLAY (Clay borderline medium/low strength)
20.00 24.00 Areas of CLAY and areas of SAND to depth
24.00 27.70 0.2-0.6m SAND over CLAY (Low Strength)
27.70 32.50 0.2-0.6m SAND over CLAY (Low Strength)
32.50 40.00 0.2-0.6m SAND over CLAY (Low Strength)
40.00 44.50 2m SAND over CLAY (Low strength)
44.50 49.75 CLAY (Very low strength) Variable thickness of loose SAND cover, up to
1.2m
49.75 60 CLAY (Very low strength) Variable thickness of loose SAND cover, up to
1.2m
60.00 72.75 CLAY (Very low strength) Variable thickness of SAND cover (Samples
suggest 0.75-2m)

NorthConnect
Cable Burial Risk Assessment
C831R01 Issue 04
Page 17 of 31
18/05/18
72.75 79.50 CLAY (Extremely low strength) Variable thickness of SAND / SILT cover
(Sample suggest 0.8-2m.
79.50 102.00 0.6-1m SAND/SILT over extremely/very low strength CLAY
102.00 107.50 CLAY (Extremely low strength)
107.50 119.60 CLAY (Extremely / very low strength)
119.60 126.00 CLAY (Extremely low strength)
126.00 200.00 CLAY (Extremely low strength)
200.00 224.00 CLAY (Extremely low strength)
224.00 240.50 SAND and CLAY (Extremely low strength)
240.50 276.00 SAND to depth
276.00 290.50 SAND to depth
290.50 341.50 Areas of SAND and CLAY (Extremely/Very Low Strength)
341.50 348.50 CLAY (Extremely/Very Low Strength)
348.50 363.50 CLAY (Extremely Low Strength)
363.50 390 CLAY (Extremely/Very Low Strength)
390 409.50 CLAY (Extremely Low Strength)
409.50 413.00 CLAY (Extremely Low Strength)
413.00 415.00 CLAY (Extremely Low Strength)
415.00 427.75 CLAY (Extremely Low Strength)
427.75 430.00 CLAY (Extremely Low Strength)
430.00 447.50 CLAY (Extremely Low Strength)
447.50 456.25 CLAY (Very low to high strength)
456.25 460.75 CLAY (Extremely low strength)
460.75 470.00 CLAY (Extremely low strength), highly localised sub-cropping
BEDROCK/TILL
470.00 480.65 Sub-cropping/exposed BEDROCK, BEDROCK/TILL interspersed with areas
of CLAY and SAND
BEDROCK outcrops are particularly prevalent between KP 470 and KP
474, although found locally across the section
480.65 482.25 BEDROCK/TILL
482.25 502.30 CLAY (Extremely/Very Low Strength)
502.30 505.75 CLAY (Extremely/Very Low Strength), some areas of BEDROCK/TILL with
veneer of CLAY
505.75 508.75 BEDROCK/TILL with veneer of CLAY, and CLAY (Extremely/Very Low
Strength)
508.75 509.80 BEDROCK/TILL with veneer of CLAY, and CLAY (Extremely/Very Low
Strength)
509.8 520.6 CLAY (Extremely/Very Low Strength)
520.60 524.65 TILL with veneer of CLAY (Veneer thickness unknown, TILL not sampled)
524.65 531.50 CLAY (Extremely/Very Low Strength)
NorthConnect
Cable Burial Risk Assessment
C831R01 Issue 04
Page 18 of 31
18/05/18
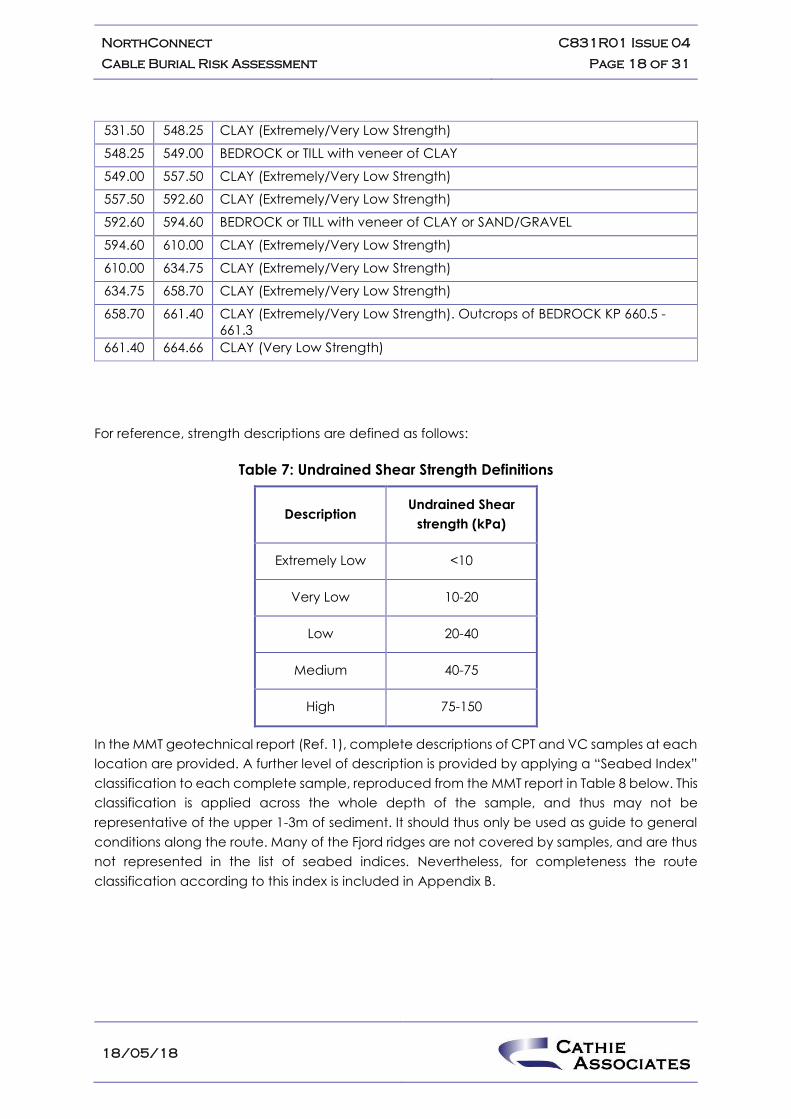
531.50 548.25 CLAY (Extremely/Very Low Strength)
548.25 549.00 BEDROCK or TILL with veneer of CLAY
549.00 557.50 CLAY (Extremely/Very Low Strength)
557.50 592.60 CLAY (Extremely/Very Low Strength)
592.60 594.60 BEDROCK or TILL with veneer of CLAY or SAND/GRAVEL
594.60 610.00 CLAY (Extremely/Very Low Strength)
610.00 634.75 CLAY (Extremely/Very Low Strength)
634.75 658.70 CLAY (Extremely/Very Low Strength)
658.70 661.40 CLAY (Extremely/Very Low Strength). Outcrops of BEDROCK KP 660.5 -
661.3
661.40 664.66 CLAY (Very Low Strength)
For reference, strength descriptions are defined as follows:
Table 7: Undrained Shear Strength Definitions
Description Undrained Shear
strength (kPa)
Extremely Low <10
Very Low 10-20
Low 20-40
Medium 40-75
High 75-150
In the MMT geotechnical report (Ref. 1), complete descriptions of CPT and VC samples at each
location are provided. A further level of description is provided by applying a “Seabed Index”
classification to each complete sample, reproduced from the MMT report in Table 8 below. This
classification is applied across the whole depth of the sample, and thus may not be
representative of the upper 1-3m of sediment. It should thus only be used as guide to general
conditions along the route. Many of the Fjord ridges are not covered by samples, and are thus
not represented in the list of seabed indices. Nevertheless, for completeness the route
classification according to this index is included in Appendix B.

NorthConnect
Cable Burial Risk Assessment
C831R01 Issue 04
Page 19 of 31
18/05/18
Table 8: MMT seabed index

NorthConnect
Cable Burial Risk Assessment
C831R01 Issue 04
Page 20 of 31
18/05/18
4. BURIAL RISK ASSESSMENT METHODOLOGY
4.1 Introduction
The basis of a risk assessment for a submarine cable relies on identifying the potential hazards,
associated risks and evaluating the level of protection that may be afforded to the cable by
its armouring (internal and/or external), cable burial beneath the seabed and any other
means, such as rock placement or concrete mattressing.
The most reliable and cost-effective form of cable protection is generally recognised to be
ensuring no interaction between the cable and the identified hazards. This is most easily
achieved by routing the cable away from such hazards or, where this is not practical, by burial
below the seabed. Armouring of the cable provides protection against some external threats
and impact resistance of the cable will be documented in the Cable Contractor
documentation. However, damage to the cable due to fishing gear impact still represents a
significant threat therefore it is recommended to protect the cable by burial as a primary
choice or by other means where this is impractical.
The Cable Burial Risk Assessment only considers hazards anticipated during the operational
lifespan of the cable. Installation risks will be discussed separately in the CPAR.
4.2 Methodology
The methodology followed in this report is adopted in accordance with the industry guidance
documents: the Carbon Trust Cable Burial Risk Assessment (CBRA) Methodology (Ref. 17), CBRA
Application Guide (Ref. 18), and DNV Subsea Power Cables in Shallow Water (Ref. 25).
The principles of the methodology are that following the identification of the initial cable routes
(in this case the cable routes have been provided by the Client) the following steps are taken:
1. Seabed conditions are assessed.
2. Threat/hazard identification assessment.
3. Identified risks to the cable are assessed in more detail – either through a probabilistic
approach, where applicable and/or data quality permits, or through a more
qualitative approach.
4. Minimum Depths of Lowering are recommended to mitigate the risks identified to an
appropriate level.
4.3 Hazard Classification
There are a wide range of obstacles and seabed users which present a hazard to subsea
cables. Many of these can be avoided by considered routing; however, activities such as
fishing and accidental anchoring generally cannot be avoided through routing alone.
Hazards can typically be classified as primary or secondary. A primary hazard has a direct
impact upon the cable and can cause damage. Such hazards include ship anchors with

NorthConnect
Cable Burial Risk Assessment
C831R01 Issue 04
Page 21 of 31
18/05/18
associated anchor penetration into the seabed and fishing, where bottom trawling gear can
snag and damage cables.
A secondary hazard is one which does not directly damage a cable but can result in an
increased risk of damage from primary hazards. Such hazards include sediment
mobility/mobile bedforms where shifting surface sediments can reduce burial cover or expose
a previously buried cable.
For each hazard, whether primary or secondary, there are specific associated risks which are
discussed below.
Table 9: Primary hazards
Hazard Risks
Fishing Impact, pull over damage or hooking of cable.
Vessel Anchoring Impact, hooking or pull over damage from dragged
or dropped anchors.
Offshore Construction/
Maintenance
Contact from jack up legs, impact from dropped
objects.
Marine Survey Operations Dropped / deployed objects.
Military Activity Impact damage from live ordnance.
Dredging Impact and damage during dredging activity.
Spoil Dumping Impact damage / deep burial causing overheating.
Cable on-bottom stability (fatigue
and/or abrasion)
Excessive movement on the seabed causing
abrasion / fatigue issues.
Submarine Slope Failure (natural or
potentially induced by installation)
Impact damage / deep burial causing overheating,
excessive cable bending.
Rock Fall / Landslides Impact damage and excessive cable bending.
The common secondary hazards are detailed in the table below.
Table 10: Typical secondary hazards
Hazard Necessary Conditions
Sediment Mobility / Coastal
processes
Suitable sediment
Energetic wave / current regime
Excessive Seabed Slope Ledges, sand waves, steep outcrops, slide back-
scars.
Hard Substrates Bedrock/hard sediment exposure

NorthConnect
Cable Burial Risk Assessment
C831R01 Issue 04
Page 22 of 31
18/05/18
Dredging Dredging activity over cable reducing
cover/increased exposure to other hazards
Historic slides and rockfalls Earthquakes may trigger new movement of
potentially unstable features (from previous events).

NorthConnect
Cable Burial Risk Assessment
C831R01 Issue 04
Page 23 of 31
18/05/18
5. THREAT/HAZARD IDENTIFICATION AND ASSESSMENT
5.1 Geotechnical Risk Register
Based upon the supplied data set and data acquired by Cathie Associates from third parties
a geotechnical risk register was compiled to outline the threats to the cables across the route
for the operational lifetime of the project. The risk register was reviewed during the HAZID
workshop held with the Client on 5th October 2017 and updated accordingly.
The purpose of this exercise was to ensure that all hazards were identified and assessed and
the risk to cables appropriately acknowledged. The geotechnical risk register is presented in
Appendix A and the main hazards are discussed in more detail below. It should be noted that
not all hazards detailed in Section 4.3 are present along the proposed route, therefore several
hazards were discounted during the initial risk assessment. Installation risks will be presented and
assessed separately in the CPAR, with its own dedicated risk register covering risks associated
with the installation process.
5.2 Primary Hazards
5.2.1 Shipping
Vessel traffic is discussed in detail in Appendix C. The probabilistic anchoring assessment
methodology is discussed in more detail in Appendix D and briefly summarised in this section.
The risk from shipping arises from the accidental or emergency dragging of an anchor across
the cable resulting in damage or even complete severance, resulting in lost capacity and
necessitating repair. For the purposes of anchor analysis, the shallow geology has been
classified into “soft” and “hard” seabed. Anchor penetration is c. 3 times as deep in low
strength clay due to a combination of the low resistance to shear and the angle at which the
anchor fluke penetrates this type of substrate. Thus, in our classification of the seabed for the
CBRA, “Soft” substrates are considered to be low strength CLAY <40kPa, with “Hard” substrate
including everything else (SAND or CLAY ≥ 40kPa).
For the purposes of anchor analysis calculations, the top 3m is assessed. Of course, there is
often likely to be significant soil type and strength variation within this depth, therefore each
sampled soil profile has been individually appraised in order to place it into a classification. This
approach differs from the CPAR where the anticipated target trench depth is used to focus
the assessment of soil conditions.

NorthConnect
Cable Burial Risk Assessment
C831R01 Issue 04
Page 24 of 31
18/05/18
Table 11: Summary of findings of probabilistic assessment (return period, years)
KP
Accidental/Emergency Scenario Anchor Strike Return period [years] at burial
depths indicated [mbsl] (route cumulative – rounded to the nearest 1000)
0 0.25 0.5 0.75 1.0 1.5 2 3 4 5
0 –
664.66
4000 4000 4000 4000 6000 7000 7000 7000 40000 59000
As can be seen from Table 11, the most significant increases in protection (through lower
probability of anchor strike) occur between 0.75m and 1m burial and between 3m and 4m
burial. This is a product of the DWT (dead weight tonnage) distribution of ships that are
recorded crossing the route and the different penetration models for “soft” versus “hard” soils.
See Appendix C for more discussion about the methodology and results of the shipping
assessment, and Appendix D which discusses the anchor strike risk methodology use to
produce the results in Table 11.
Minimum recommended depths of lowering have been derived using the fishing threatline
(section 5.2.2) and consideration for mobile sediments (section 5.3.1). Anchor strike probability
for these depths (see CBRA table) was calculated in each section, with the route-total
calculated anchor-strike return-period being 4000 years. As discussed in section Appendix
D.1.3, this provides a level of protection such that the residual risk from accidental/emergency
anchoring is deemed to be low compared to the potential lifetime of the project.
5.2.2 Anchorages and Fish-Farms
There are no dedicated anchorages on the survey centre line, however an anchorage is noted
to exist near Simadalen landfall for quarry vessel traffic. Increased burial has been stipulated
by the Client in this area (ref. Appendix B). Anchoring behaviour is also noted at the UK end of
the route (See C831R01 D09) and increased burial is to be applied here also.
A risk has also been identified in areas near fish-farms, where a vessel collision, bad weather or
careless placement could result in a static anchor (which secures the floating structure) being
dragged cross the HVDC cables. Enhanced protection is similarly stipulated by Client in these
areas as detailed in Appendix B.
5.2.3 Fishing
Commercial fishing is a hazard to s u b s e a cables (even armoured cables) where fishing
gear interacts with the seafloor: potentially resulting in damage due to impact or snagging.
It should also be noted that a cable can pose a risk to the fishing vessels themselves if left on
the seabed, as small vessels can founder if snagged on a significant obstruction (Ref. 27).
The depths of penetration of the fishing gear govern the potential interaction risks to the
proposed cable. It should be noted that excessive seabed penetration increases risk to loss of
equipment and increases towing forces required, increasing fuel costs, so fisherman generally
look to limit penetration where possible.

NorthConnect
Cable Burial Risk Assessment
C831R01 Issue 04
Page 25 of 31
18/05/18
Information regarding intensity of fishing, based on the assessment of AIS data is presented in
drawing C831R01 D03 in Appendix E. It can be seen from this information that trawling is
prevalent across most of the route. The CBRA table in Appendix B details the presence and
location of trawl marks which occur along large sections of route.
Marine Scotland (Ref. 28) provides information concerning fishing types in the North Sea and
the following broad observations are noted:
➢ Intense potting and scallop trawling activity from UK coast out to approximately KP 20,
year-round
➢ Demersal fishing along the majority of the route, year-round
➢ Trawling for Nephrops prevalent for much of the route (~KP 40 to ~KP 290) during
spring/summer months
➢ Trawling for Herring for most of the route (~KP 105 to ~KP 480) during summer months
Additional fishing intensity information has been supplied to the project by the Norwegian
Fishing Authority (see Figure 4), although exact details of the fishing types are not included.
Activity appears particularly intense along the length of the Norwegian Trench, intersected by
North connect c.KP 300 to KP 400. Demersal fishing activity is evidenced by trawl marks, which
are commonly found by the survey, even in water depths approaching 300m.
Figure 4: Norwegian Fishing Authority Fishing Intensity Data

NorthConnect
Cable Burial Risk Assessment
C831R01 Issue 04
Page 26 of 31
18/05/18
(Areas of greatest activity signified by darker colours)
Norwegian fisheries data maps (Ref. 29) show that there is active fishing taking place in many
parts of Hardangerfjord, usually confined to areas near to the shore, although the map data
does not show the type and method of fishing, and whether this may impact the seabed.
Although fishing is noted in the deeper parts of the Fjord, it is not thought to reach the seabed
(see 600m cut-off, below). Discussions with the client suggested that fishing is not expected to
occur in the furthest upper reaches of the Fjord (where water depth is <600m, KP 634.75 – KP
664.66)
In the case of the identified fishing methods currently employed along the route the following
threatline depths are considered reasonable based upon previous experience and available
references (Ref. 17):
• Fishing gear penetration in surficial sand ~0.2m
• Fishing gear penetration in low strength clay ~0.3m
The application of this risk is presented in the CBRA table in Appendix B. A 600m bathymetric
depth cut-off has been applied to the fishing threatline in agreement with the Client, as below
this depth fishing activity is not considered a genuine risk to the cable, however, if further
information regarding fishing activity in these areas becomes available, this threatline should
be re-assessed.
5.2.4 On-bottom Stability
Surface laid cables are subject to loading from waves and currents and this could result in
cable movement and migration across the seabed. Relatively high tidal/storm currents are
observed in UK waters, and excessive movement on the seabed could cause abrasion and/or
fatigue issues. It is recommended that the cable should be buried or externally protected as
soon as possible following cable lay, to avoid any damage.
Cable migration is also likely to increase the shipping risk profile, as the cable position will no
longer be accurately identified on marine charts and this is likely to result in an increased risk
from other primary hazards such as vessel anchors, fishing and construction activities.
In this case it is understood that cable burial/protection is planned therefore on-bottom stability
and cable fatigue are not considered as threats as long as the cable remains buried or
protection (i.e. rock placement) remains in place.
5.2.5 Dredging/Soil Dumping
Spoil grounds have been identified near Peterhead landfall (Ref. 9), however no known
dredging/dumping sites have been identified within or close to the survey corridor.
5.2.6 Rockfall
Along the length of the Fjord, rockfall is highlighted as a risk originating from the steep, sheer
sides of the Fjord. Rockfall poses a risk of cable impact damage or lateral displacement.
Boulders falling at high velocity may be expected to penetrate the very soft Fjord-bottom
sediments beyond reasonable burial depths. Areas interpreted as past rockfall and mass-

NorthConnect
Cable Burial Risk Assessment
C831R01 Issue 04
Page 27 of 31
18/05/18
transport deposits originating from the Fjord sides have been identified within the survey
corridor and avoiding these areas through routing is likely to offer the best protection for the
cable.
The risk of future events is still present in areas where rockfall/boulders are not observed and
routing the cable in the centre of the Fjord where possible could reduce its exposure to future
rockfalls from either side.
5.2.7 Submarine Slopes
Significant slip-scarps are found periodically along the length of the Fjord, generally
perpendicular to the Fjord and survey centre line. The implications for cable installation across
these features are discussed in the CPAR (Ref. 31). Transverse slopes are not expected to be
encountered if the cable is routed on the base of the Fjord, however any detailed routing
should consider the difficulties transverse slopes pose to cable installation.
5.2.7.1 Slope Failure
In terms of lifetime risks to the cable, ground movements beneath the cable could result in free-
span and strain, also movement of material originating from upslope could displace and strain
a cable. Further burial by mass-transport deposits could also result in excess thermal insulation
and overheating of the cable. The effect of loading the crest of these slopes with further
material (rock placement) may potentially destabilise the material, although loading of the
toe of the slope could also be expected to increase the stability. This scenario has not been
assessed in the NGI scope of work (see below).
Further detailed assessment of submarine slope failures in the fjords has been performed by the
Norwegian Geotechnical Institute (NGI) (Ref. 13). Previous research is summarised below in
section 5.2.7.2, and the conclusions of the NGI report are summarised in section 5.2.7.3.
5.2.7.2 Bergen University research
Seismic profiles in the upper regions of Hardangerfjorden (Inner Samlafjorden and
Utnefjorden/Eidfjorden) combined with a 15.7m core sample from Inner Samlafjorden, (at c.KP
614 on the NorthConnect survey centre line) have been used by Bellwald et al of the University
of Bergen to investigate mass-transport deposits in the area.
To summarise the paper (Ref. 30), the work suggests that at the particular sample location,
above rockhead lies 160m of glaciomarine deposits which in turn are overlain by 55m of
stacked mass-transport deposits, comprising 19 identified separate movement events
depositing up to 13m of turbidite deposits.
The chronostratigraphic record suggests high movement activity 11100 – 8200 years BP and
4100 years BP to present. 14 mass-transport deposit (MTD) events are dated early Holocene
with a return period of 200 years, during a period of high sedimentation. Low sedimentation in
the mid-Holocene marks a quiet period. Activity in the late Holocene has a return period of
1000 years and is hypothesised to be triggered by glaciotectonic induced earthquakes
(related to ice unloading) or large rockfalls.
NorthConnect
Cable Burial Risk Assessment
C831R01 Issue 04
Page 28 of 31
18/05/18
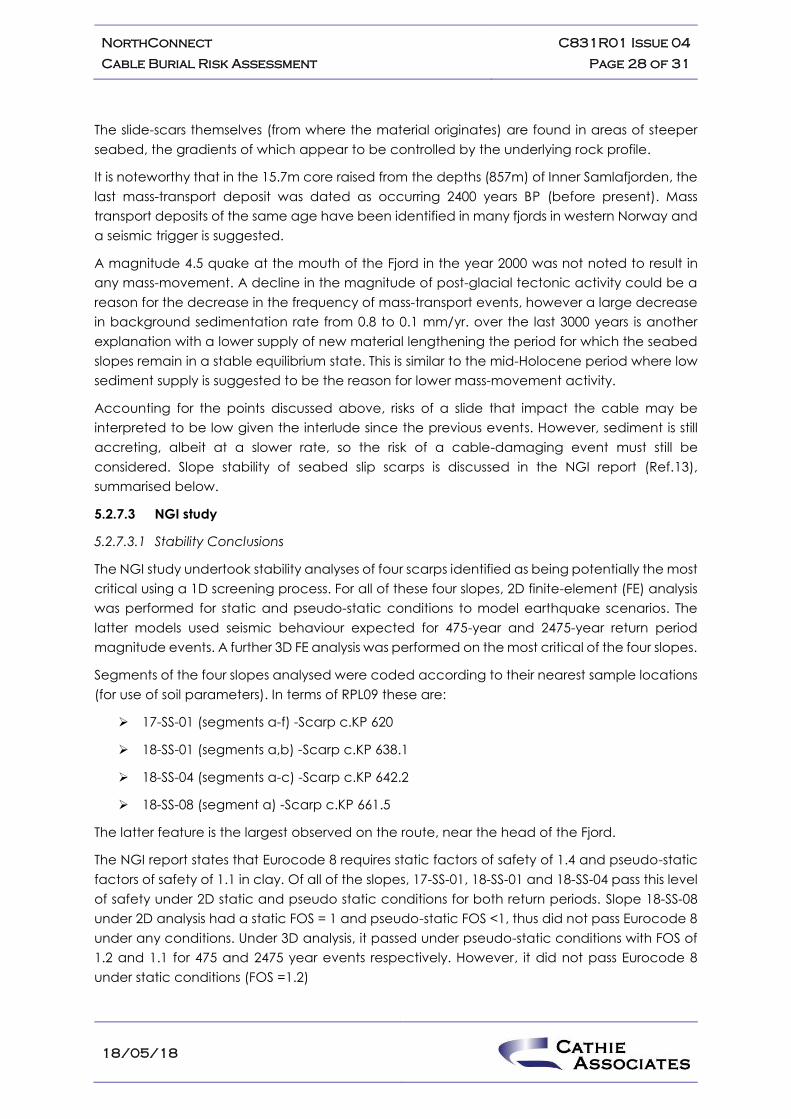
The slide-scars themselves (from where the material originates) are found in areas of steeper
seabed, the gradients of which appear to be controlled by the underlying rock profile.
It is noteworthy that in the 15.7m core raised from the depths (857m) of Inner Samlafjorden, the
last mass-transport deposit was dated as occurring 2400 years BP (before present). Mass
transport deposits of the same age have been identified in many fjords in western Norway and
a seismic trigger is suggested.
A magnitude 4.5 quake at the mouth of the Fjord in the year 2000 was not noted to result in
any mass-movement. A decline in the magnitude of post-glacial tectonic activity could be a
reason for the decrease in the frequency of mass-transport events, however a large decrease
in background sedimentation rate from 0.8 to 0.1 mm/yr. over the last 3000 years is another
explanation with a lower supply of new material lengthening the period for which the seabed
slopes remain in a stable equilibrium state. This is similar to the mid-Holocene period where low
sediment supply is suggested to be the reason for lower mass-movement activity.
Accounting for the points discussed above, risks of a slide that impact the cable may be
interpreted to be low given the interlude since the previous events. However, sediment is still
accreting, albeit at a slower rate, so the risk of a cable-damaging event must still be
considered. Slope stability of seabed slip scarps is discussed in the NGI report (Ref.13),
summarised below.
5.2.7.3 NGI study
5.2.7.3.1 Stability Conclusions
The NGI study undertook stability analyses of four scarps identified as being potentially the most
critical using a 1D screening process. For all of these four slopes, 2D finite-element (FE) analysis
was performed for static and pseudo-static conditions to model earthquake scenarios. The
latter models used seismic behaviour expected for 475-year and 2475-year return period
magnitude events. A further 3D FE analysis was performed on the most critical of the four slopes.
Segments of the four slopes analysed were coded according to their nearest sample locations
(for use of soil parameters). In terms of RPL09 these are:
➢ 17-SS-01 (segments a-f) -Scarp c.KP 620
➢ 18-SS-01 (segments a,b) -Scarp c.KP 638.1
➢ 18-SS-04 (segments a-c) -Scarp c.KP 642.2
➢ 18-SS-08 (segment a) -Scarp c.KP 661.5
The latter feature is the largest observed on the route, near the head of the Fjord.
The NGI report states that Eurocode 8 requires static factors of safety of 1.4 and pseudo-static
factors of safety of 1.1 in clay. Of all of the slopes, 17-SS-01, 18-SS-01 and 18-SS-04 pass this level
of safety under 2D static and pseudo static conditions for both return periods. Slope 18-SS-08
under 2D analysis had a static FOS = 1 and pseudo-static FOS <1, thus did not pass Eurocode 8
under any conditions. Under 3D analysis, it passed under pseudo-static conditions with FOS of
1.2 and 1.1 for 475 and 2475 year events respectively. However, it did not pass Eurocode 8
under static conditions (FOS =1.2)

NorthConnect
Cable Burial Risk Assessment
C831R01 Issue 04
Page 29 of 31
18/05/18
This slope, the final slip-scarp before landfall, is thus identified as being most critical regarding
danger to the cable.
It should be noted that the NGI study did not assess the risk of slides/falls from the sides of the
Fjord, and also did not analyse any potential impacts of installation or placement of material
on these slopes which should be considered prior to construction.
5.2.7.3.2 Clay Strength
NGI has suggested that the lab testing performed by MMT may have underestimated the shear
strength of the clay in the Fjords due to unavoidable disturbance to the soil during vibrocore
sampling. These lab results are fed back into the calibration of CPT correlation (Nkt).
Consequently, NGI reduced Nkt from 17.5 (MMT) to 13 based upon their experience of Fjord
sediments. As an example, a clay previously interpreted as 10kPa shear strength would have a
small increase to 13.5kPa. It is acknowledged that further reinterpretation of the survey results
would be merited at the detailed design stage.
5.3 Secondary Hazards
5.3.1 Mobile Sediments
The presence of bedforms of potentially mobile sediments were identified during the survey
work (Ref. 2). Bedforms of varying size identified and have been summarised in the CBRA table
in Appendix B, and the majority of these are found between KP 0 and KP 62.5. The maximum
observed bedform size reported by MMT on the survey centre line is 0.7m (large ripples, see
Table 12) and these are found between KP 24 and KP 45. Some larger bedforms were identified
in the survey report as lying to the north or south of the SCL, and it is possible that these may
have migrated onto the cable alignment prior to installation. This possibility should be
considered following further surveys by the installation contractor.
The MMT bedform size classification as supplied in the survey data is given below for
information:
Table 12: MMT mobile bedform size classification
Bedform
Type Length (m) Height (m)
Ripples < 5 0.01-0.1
Large Ripples 5 – 15 0.1-1
Megaripples 15 - 50 1- 3
Sandwaves 50 – 200 > 3
In the absence of repeat surveys to analyse mobility, it is recommended that an allowance for
sediment mobility is included in the cable protection strategy where bedforms have been
identified, equivalent to the bedform height.
NorthConnect
Cable Burial Risk Assessment
C831R01 Issue 04
Page 30 of 31
18/05/18

NorthConnect
Cable Burial Risk Assessment
C831R01 Issue 04
Page 31 of 31
18/05/18
6. CONCLUSIONS AND RECOMMENDATIONS
Through the undertaking of the risk assessment, the most onerous lifetime hazards to the cables
were identified as;
➢ Anchors from transiting vessels
➢ Fishing gear seabed interaction
➢ Rock fall / Landslides
➢ Submarine Slope Failures
As agreed with the Client, a quantitative approach has been undertaken to understand the
level of protection offered against anchoring by a range of burial depths as presented in
Appendix B and discussed in detail in Appendix D.
The outcome of the shipping and probabilistic analyses suggest that accidental or emergency
anchor-strike risk is considered to be low. At the minimum recommended depths of lowering
(defined in Appendix B), the average annual anchor strike return period is 4000 years for the
complete route, meaning that an anchor drag across the cable, at sufficient depth to cause
damage would only be expected to occur once every 4000 years. This equates to a probability
of an anchor strike of 0.026% in any given year of operation. For a planned infrastructure
lifespan of 25 years (0.64% chance), 50 years (1.28% chance), or even 100 years (2.56%
chance), this represents a low risk (equivalent to DNV Category 3). This assessment should be
revisited in the future if significant changes in shipping traffic or levels of vessel redundancy are
observed.
Maximum threatline depths have also been determined for the other main hazards identified,
notably fishing, as detailed in the CBRA table in Appendix B. Burial to mitigate the threat from
fishing (0.2m to 0.3m) is deemed a minimum requirement, except where (in agreement with
the Client) the risk from fishing activity has been deemed to be low.
In addition to the above, the hazard assessment has identified the presence of potentially
mobile bedforms in localised areas along the cable route, mostly located within the first 62.5km
of the route, having a maximum size of 0.7m. Currently no repeat bathymetric data set is
available, therefore, it was not possible to confirm the full extent of sediment mobility. In the
absence of more detailed analysis it is recommended that an additional allowance for
sediment mobility is included in the cable protection strategy where bedforms have been
identified. However, there is not expected to be any requirement for pre-sweeping operations
prior to installation operations.
The primary method of protection for the cable will be burial, accounting for efficiency and
cost effectiveness. Rock placement will be used for cable crossings. It is anticipated that rock
placement will also be used where adequate burial cannot be achieved due to the presence
high strength material at shallow depth. Assessment of burial methods as well as additional
protection options is provided in the CPAR report (31) and Detailed BAS for the UK 12NM (Ref.
32) which build upon the findings of this report.
End of main text

NorthConnect
Cable Burial Risk Assessment
C831R01 Issue 04
18/05/18
Appendix A – Risk Register

GEOTECHNICAL RISK REGISTERFront Sheet
CA Client : NorthConnect KS
Project : NorthConnect
Project No : C831R01
Revision History
Revision Author(s) Reviewed: Approved: Date
1 EJO EJO JIR 06/11/2017
2 PTH EJO EJO 15/03/2018
3 PTH EJO EJO 03/05/2018
Risk Rating
Probability Consequence
1 1
2 2
3 3
4 4
5 5
1 2 3 4 5
1 1 2 3 4 5
2 2 4 6 8 10
3 3 6 9 12 15
4 4 8 12 16 20
5 5 10 15 20 25
Issued
Never heard of in Industry
Heard of in Industry
Incident has occurred near
the project area
Happens several times a
year in Industry
Definition
Draft
Purpose
Extensive Damage -
replacement of significant
section of cable/ Unplanned
loss of capacity
Consequence
Probability
Geotechnical Risk Matrix
Happens several times a
year at project location
Definition
Negligible Damage
Minor Damage / Exposure to
other hazards
Localised Damage / No
unplanned loss of capacity
Major Damage - replacement
of small section / Unplanned
loss of capacity
Final

CA Client : NorthConnect KS
Project : NorthConnect GEOTECHNICAL RISK REGISTER
Project No : C831R01
Freq Cons Rank Freq Cons Rank
Shipping - current WebGIS, AIS Dataset 10/2015 to
09/2017, DTS
Ships can cause direct damage to exposed or insufficiently buried
cables by deploying anchors either deliberately (in case of
anchorages) or accidentally over / next to a cable. Direct cable
strike or more likely snagging of cable can cause damage to cable
(and vessel).
The cable corridor is subject to shipping traffic of various natures,
and will be assessed in detail based on the AIS dataset.
The presence of designated anchorages to be assessed based on
available charting/AIS data.
2 4 8
Probabilistic assessment of shipping and estimation of likely
anchor penetration depth relative to seabed geology and
shipping activity. Conservative approach to be taken with regard
to unknown factors.
Determination of appropriate cable burial depths to afford
adequate protection.
Protection against dropped objects from construction/
maintenance vessels
Identification of new cables on nautical charts / anchorage
exclusion zones.
1 4 4
Shipping - future variations WebGIS, AIS Dataset 10/2015 to
09/2017, DTS
Shipping traffic could vary over time for various reasons
including:
- Activity relating to construction/decommissioning of nearby
offshore assets such as oil & gas structures or offshore wind
farms
- Exclusion zones surrounding work sites or new assets may cause
shipping to cross the cable at different points
2 4 8
Determination of appropriate cable burial depths to afford
adequate protection for existing traffic levels.
Regular monitoring of vessel traffic as part of IMR regime.
The risk to the cables should be continually reassessed in line
with any significant changes in shipping that are identified,
allowing better quantification of the risk and if necessary the
planning of potential mitigation actions (such as AIS monitoring
services, guard vessels, deeper burial, etc.).1 4 4
Fishing WebGIS, AIS Dataset 10/2015 to
09/2017, DTS, UK fishing reports
Fishing activities can result in direct damage to exposed or
insufficiently buried cables by fishing gear snagging on the cable.
Also (greater) risk to the fishing vessel in the event of a snagging
incident.
Multiple types of fishing have been observed including:
- Trawling
- Dredging
- Potting
2 4 8
Assessment of likely fishing gear penetration based on identified
fishing types relative to seabed geology and recommendation of
burial to sufficient depth to afford adequate protection. A
recommended minimum level of burial has been given to protect
from this threatline.
Ongoing monitoring of fishing activity and methods as part of
IMR regime.
Identification of new cables on nautical charts / fishermen
awareness initiatives.
1 4 4
Fishing - future variations in equipment WebGIS, AIS Dataset 10/2015 to
09/2017, DTS
Fishing methods and equipment could vary with time resulting in
increased risk to the cables.
2 4 8
Ongoing monitoring of fishing activity and methods as part of
IMR regime.
The risk to the cables should be reassessed if there is a significant
change in fishing activities which results in greater penetration of
fishing equipment into the seabed. If necessary, mitigation
actions to be taken (deeper burial, rock placement, fishing
exclusion zones, etc.).
Given the increased vessel running costs of deeper penetrating
fishing gear (higher towing force), increase in this factor is
considered unlikely, however it is possible that the locations of
fishing grounds will change in future.
1 4 4
Bathymetry and Metocean Conditions
(On-bottom Stability)
WebGIS, Block Reports,
MetOcean Report, DTS
Water depth and metocean conditions influence cable on bottom
stability (abrasion / fatigue effects on surface laid cables). Both
variables are also key factors in sediment mobility (considered
separately) and water depth is a consideration in the probabilistic
assessment of anchor strike (considered separately).
Water depths vary from c.23m at UK HDD exit to maximum of
>850m in the Fjord. Shallow water wave effects anticipated in
the approach to landfall. North Sea tidal currents in the area
have been observed to exceed 2 knots.
3 2 6
Provided offshore cables are to be buried, surface laid sections
should be minimal. Potential movement / fatigue of any residual
sections of exposed cable should be monitored with appropriate
IMR regime e.g. regular survey to monitor bathymetry changes,
using a risk-based approach to prioritise surveys, continual
assessment of the risks to the cable and the need for remedial
works should the cable be exposed.
Stability of remedial rock berms under metocean loadings has
been assessed as part of a technical note (C831T01).
2 2 4
Dredging / Dumping WebGIS, Block Reports, DTS Dredging activity can result in direct damage to cables as well as
exposure of buried cables or reduction in burial, increasing risk to
primary hazards such as shipping or fishing. Over-burial by
dumping, can result in exceeding cable thermal / physical design
parameters.
Spoil grounds noted within corridor at UK end, but not within the
survey corridor. 2 4 8
TCE no dredging zone 235m either side of 30m cable corridor
within 12NM (500m buffer).
RPL developed according to constraints.
Consultation with dredging licence holders, as required.
Identification of new cables on nautical charts / implementation
of exclusion zones for dredging / dumping activity.1 4 4
Rock Fall WebGIS, Survey Report, Academic
Papers
Rockfall or other mass movement from the Fjord sides may cause
impact damage to the cable, or lateral displacement inducing
tensions or kinks.
Rockfall is recorded all the way along the Fjord, and the survey
provides evidence of these deposits on the Fjord bottom.3 2 6
Softness of sediment in the majority of the Fjord area means that
protection from rockfall is unlikely to be gained by burial.
The simplest way to reduce the risk will be to use routeing to
avoid areas of historic mass transport deposition originating
from the side of the Fjord, as recorded by the survey. Keeping the
cable route central to the Fjord where possible should reduce the
likelihood that material will strike the cable from either side.
1 2 3
Primary Hazards
GEOTECHNICAL RISK (LIFETIME RISKS)
Risks to Installed Cable
Hazard Details
Initial Risk
Quantification / Mitigation
Residual RiskData Sources / Data Adequacy

CA Client : NorthConnect KS
Project : NorthConnect GEOTECHNICAL RISK REGISTER
Project No : C831R01
Freq Cons Rank Freq Cons Rank
Primary Hazards
GEOTECHNICAL RISK (LIFETIME RISKS)
Risks to Installed Cable
Hazard Details
Initial Risk
Quantification / Mitigation
Residual RiskData Sources / Data Adequacy
Submarine Slope Failures WebGIS, Survey Report, Academic
Papers
Numerous slip-scarp features cross the width of the Fjord,
generally perpendicular to the survey centre line. The installed
cable will have to traverse these features.
Failure of the ground underneath the cable at the scarp-slope
crest or impact by mass-movement material originating upslope
could cause cable damage by inducing cable tension, creating
freespans or causing slack areas of cable to become kinked.
NGI research suggests that only one scarp (Major feature c. KP
661.5) is naturally unstable under static and seismic conditions,
however this modelling does not include disturbances or loadings
as a consequence of cable installation.
3 4 12
Avoid slopes where possible, transition of cable across existing
slip-scarps or potential future scarps is in many cases
unavoidable.
Triggering of failure may be seismic, with a suggested return
period of 1000 years (based upon dating mass-flow deposit
sequences), which may be considered ALARP.
Further investigation into the risks of loading the slope with rock
placement etc during installation (as many scarps are too steep
for burial tools). The use of a burial tool with a free-flying mode
of operation and skids may allow steep areas to be traversed and
the cable buried.
2 4 8
Anchorages and static fish-farm anchors WebGIS, Block Reports, DTS A quarry vessel anchorage exists near the route at Simadalen,
this has been identified by NorthConnect to be justifying extra
protection from possible anchor-strike damage. No other
anchorages have been noted in the survey corridor, and once the
cable is marked on admiralty charts, no future anchorages would
be expected to appear on the cable alignment.
A risk has also been highlighted near fish-farms, where bad
weather or third-party collision could cause a (usually) static
anchor to be dragged across the cable and cause damage.
A shipyard at Stoord (Kvaerner) and mobilisation area raised
some concerns about the proximity of the cable route to their
operations.
Ships have been noted anchoring in proximity to the cable route
at the UK Landfall
2 4 8
Increased protection through burial (FEED level D) has been
specified near fish farm anchoring points, the Kvaerner yards,
the Simadalen quarry cargo vessel anchorage and the first
c.850m of the route from the HDD exit at UK landfall.
Identification of new cables on nautical charts / anchorage
exclusion zones.
1 4 4
Mobile Sediment / Seabed Mobility WebGIS, Block Reports, DTS Sediment movement following cable installation can result in
exposed or over-buried cables, increasing the risk to the cables
from external and internal threats.
3 2 6
Sympathetic routing. Adequate burial mitigating mobile sediment
layer. Monitoring of residual risk from external threats.
Appropriate cable design to withstand possible over-burial;
thermal effects etc.
Survey prior to the cable lay to confirm assessment of site /
RPL(s). Regular survey of cables as part of IMR regime - with
emphasis on areas anticipated to be mobile. Reassessment of
cable risks and mitigation works as required if cable becomes
over-buried or exposed.
2 1 2
Coastal Processes / Landfall WebGIS, Block Reports, DTS, HDD
outline design
Exposure of near shore cables may result from coastal processes;
increasing risk to cables from external threats.
3 2 6
Cables in intertidal zone will be protected via HDD UK end.
Regular survey of cable as part of IMR regime, particularly the
inshore area, to monitor residual risk.2 2 4
Secondary Hazards
NorthConnect
Cable Burial Risk Assessment
C831R01 Issue 04
18/05/18
Appendix B – Cable Burial Risk Assessment
Table

Project
number: C831
NorthConnect KS
Location: Northern North Sea
0 0.1 1 212349, 6377615 212447, 6377634 0.1 BEDROCK (HDD) 18 to 24.5
0.1 0.85 212447, 6377634 213135, 6377906 0.75
CPT/VC_A_001 SI not applied 0.193 212508 6377506
24.5 to 28.5
Ripples KP:
0.1 - 0.222 <0.2 (limited area) 0.27 See Note 7 D
0.85 1.35 213135, 6377906 213564, 6378161 0.5
CPT/VC_A_003 SI not applied 1.277 213503 6378129
28.5 to 40Large Ripples KP:
1.338 - 1.3680.7 (limited area) 0.27 See Note 7 C
1.35 3.7 213564, 6378161 215583, 6379364 2.35
Veneer of SAND/GRAVEL
over 0.5-4m CLAY over TILL.
SAND present under clay in
some areas. (Clay medium
to high strength)
CPT/VC_A_004/A SI not applied 3.376 215308 6379193
40 to 51.5
High density boulders
<50% are >0.75m in size
Ripples KP:
1.685 - 2.180
2.518 - 2.603
3.169 - 3.652
<0.2 0.27 See Note 7 C
3.7 4.47 215583, 6379364 216245, 6379758 0.77
Veneer of SAND/GRAVEL
over 1-2m CLAY over TILL,
BEDROCK outcrops. (Expect
Clay medium to high
strength)
50 to 55
Mix of high density and numerous boulders.
<50% are >0.75m in size.
Ripples KP:
4.270 - 4.521
Megaripples KP:
4.096 - 4.169
Rock outcrops
0.5 (limited area) 0.27 See Note 7 C
4.47 4.60 216245, 6379758 216348, 6379835 0.13
Veneer of SAND/GRAVEL
over 0.5-1m CLAY over TILL
(Expect clay of medium to
high strength)
Shallow bedrock KP 4.5
54 to 55
Numerous boulders
<50% are >0.75m in size.
Ripples and large ripples KP:
4.467 - 4.878
0.3 0.27 See Note 7 C
4.60 5.10 216348, 6379835 216697, 6380193 0.50
Veneer of SAND/GRAVEL
over TILL(Expect Til l/Clay to
be medium to high
strength)55 to 57
Numerous boulders
<50% are >0.75m in size.
Ripples and large ripples KP:
4.467 - 4.878
0.3 0.2 1.2 2 0.50 SAND or CLAY ≥ 40kPa >100000 >100000 >100000 >100000 >100000 >100000 >100000 >100000 >100000 >100000 0.27 See Note 7 0.2 7.99059E-06 125000 C
5.1 5.75 216697, 6380193 217151, 6380658 0.65
0.4-0.7m GRAVEL or very
gravelly SAND, over CLAY
(Clay low-medium
strength)57 to 59
Numerous boulders
<50% are >0.75m in size.0 0.2 C
5.75 14.20 217151, 6380658 223191, 6386521 8.45
0.4-0.7m GRAVEL or very
gravelly SAND, over CLAY
(Clay low-medium
strength)
CPT/VC 01-SS-02
CPT/VC 01-SS-03
7
4
8.570
12.850
219119
222108
6382680
6385750
59 to 73
Numerous boulders (patchy from KP 9.5)
<50% are >0.75m in size.
Ripples & Large Ripples KP:
6.634 - 7.413
Ripples KP:
7.162 - 8.891
9.925 - 10.852
11.212 - 11.940
12.556 - 16.571
10.964 Active cable (B in progress)0.5
0.37
(0.1m accounts for ripples,
more advised for
megaripples)
See Note 7 C
14.20 15.00 223191, 6386521 223896, 6386898 0.80
0.4-0.7m GRAVEL or very
gravelly SAND, over CLAY
(Clay low-medium
strength)73 to 79
Occasional boulders
<50% are >0.75m in size.
Ripples KP:
12.556 - 16.571
<0.20.3
(0.1m accounts for ripples)C
15.00 20.00 223896, 6386898 228191, 6389279 5.00
0.5m gravelly SAND over
CLAY (Clay borderline
medium/low strength)
CPT/VC 01-SS-04/4A 7 17.232 225902 6387974
78 to 95
Occasional boulders
<50% are >0.75m in size.
Ripples KP:
12.556 - 16.571
16.951 - 19.141
18.009 -19.2 (start alt-course)
See next section for alt-course
16.597 Disused cable B (MMT not found)
18.558 Active pipeline S<0.2
0.3
(0.1m accounts for ripples)C
20.00 24.00 228191, 6389279 231952, 6390641 4.00Areas of CLAY and areas of
SAND to depth
CPT/VC 02-SS-01 6 23.872 231832 6390595
78 to 96
Occasional boulder patches on alt course KP 0 -
KP 0.75
Alt-course to be used avoiding sandwave / ridge.
Alt-course mobile sediments:
Occasional ripple patches, area of megaripples
on SCL KP 2.097 - KP 2.251
Alt course end c.KP 23.5 c.KP 4.6 on Alt)
Ripple patches continue beyond end of section.
0.2
(0.5 Limited area)0.2 2.0 4 4.00 SAND or CLAY ≥ 40kPa >100000 >100000 >100000 >100000 >100000 >100000 >100000 >100000 >100000 >100000
0.37
(0.1m accounts for ripples,
more advised for
megaripples)
See Note 7 0.3 6.69711E-06 149000 C
24.00 27.70 231952, 6390641 235431, 6391900 3.700.2-0.6m SAND over CLAY
(Low Strength)
78 to 91
Numerous boulders KP 27.25-27.7
<50% are >0.75m in size.
Large Ripples KP:
24.590 - 41.440
0.7 0.3 6.0 5 3.70LOW STRENGTH CLAY
(<40kPa)>100000 >100000 >100000 >100000 >100000 >100000 >100000 >100000 >100000 >100000
1
(0.7m accounts for large
ripples)
1 5.63865E-06 177000 C
27.70 32.50 235431, 6391900 239944, 6393535 4.800.2-0.6m SAND over CLAY
(Low Strength)
CPT/VC 02-SS-02/A 7 28.300 235991 6392098
89 to 96
Numerous boulders KP 31.5-32.5
<50% are >0.75m in size.
Large Ripples KP:
24.590-41.440
0.7
1
(0.7m accounts for large
ripples)
C
32.50 40.00 239944, 6393535 246996, 6396089 7.500.2-0.6m SAND over CLAY
(Low Strength)
CPT/VC 02-SS-03/A/B 8-9 39.08 246124 6395776
94 to 99
Numerous boulders KP 32.5-34, KP 35.9-40
<50% are >0.75m in size.
Large Ripples KP:
24.590-41.440
0.7
1
(0.7m accounts for large
ripples)
C
40.00 44.50 246996, 6396089 251227, 6397621 4.502m SAND over CLAY (Low
strength)
CPT 02-SS-04/A 8 40.610 247575 6396299
90 to 99
Numerous boulders KP 40-41.6
<50% are >0.75m in size.
Large Ripples KP:
24.590-41.440
43.076 - 45.111
Megaripples KP
40.727 - 43.967
Sandwaves (see note)* KP:
44.183 - 45.389
0.7
(*Interpreted
sandwave 4.5m,
limited area).
Potentially
immobile relict
feature.
0.2 2.0 7 4.50 SAND or CLAY ≥ 40kPa >100000 >100000 >100000 >100000 >100000 >100000 >100000 >100000 >100000 >100000
0.9
(0.7m accounts for large
ripples)
0.9 1.56E-06 642000 C
44.50 49.75 251227, 6397621 256163, 6399408 5.25
CLAY (Very low strength)
(Variable thickness of loose
SAND cover, up to 1.2m
80 to 93
Mix of occasional, numerous and high density
boulders KP 44.5 - 48.3
<50% are >0.75m in size.
Large Ripples KP:
44.557 - 45.546
45.564 - 50.345
0.4
0.7
(0.4m accounts for large
ripples)
C
49.75 60 256163, 6399408 265035, 6404168 10.25
CLAY (Very low strength)
(Variable thickness of loose
SAND cover, up to 1.2m
CPT/VC 02-SS-05
CPT 02-SS-06
CPT/VC 03-SS-01
8-9
8
7
50.609
51.918
57.830
256969
258163
263120
6399704
6400243
640315793 to 109
Large Ripples KP:
52.889 - 58.792
59.717 - 62.423
53.403 S Active pipeline 0.5
0.8
(0.5m accounts for large
ripples)
C
60.00 72.75 265035, 6404168 276319, 6410105 12.75
CLAY (Very low strength)
(Variable thickness of SAND
cover (Samples suggest
0.75-2m)
Occurrence. Thickness of
sand not well constrained,
section considered low
strength for anchoring.
SAND is very loose and
silty.
CPT/VC 03-SS-02/A/B
CPT/VC 03-SS-03
8
9
64.105
67.976
268668
272094
6406077
6407883
99 to 121
Large Ripples KP:
59.717 - 62.423
Trawl marks KP 64.6 - 72.75
60.326 B Active pipeline 0.5 0.37 See Note 7 C
72.75 79.50 276319, 6410105 282292, 6413248 6.75
CLAY (Extremely low
strength) (Variable
thickness of SAND / SILT
cover (Sample suggest 0.8-
2m.
Occurrence. Thickness of
sand not well constrained,
section considered low
strength for anchoring. VC
records 0.84m SILT over
CLAY, CPT suggests 1.6m
very silty SAND.
CPT/VC 03-SS-04 8-9 73.950 277389 6410665
112 to 120 Trawl marks across whole section. 0 0.3 C
79.50 102.00 282292, 6413248 301920, 6424244 22.50
0.6-1m SAND/SILT over
extremely/very low
strength CLAY
CPT/VC 03-SS-05
CPT 03-SS-06
CPT/VC 03-SS-07
8-9
9
9
80.655
86.549
98.243
283317
288497
298666
6413786
6416591
6422374 108 to 117Trawl marks across whole section.
Occasional pockmarks on or near centreline.0 0.3 C
102.00 107.50 301920, 6424244 306670, 6427016 5.50CLAY (Extremely low
strength)
CPT/VC 03-SS-
08/A1/A2
9 107.039 306267 6426782113 to 114
Trawl marks across whole section. Pockmark
nearby at KP 1050 0.3 C
107.50 119.60 306670, 6427016 317149, 6433064 12.10CLAY (Extremely / very low
strength)
CPT/VC 03-SS-09
CPT/VC 03-SS-10
9-10
9
108.500
117.990
307533
315735
6427518
6432299113 to 124
Trawl marks across whole section.
Occasional pockmarks from KP 114 onward, c.4m
deep.
115.131 B Disused cable (Found in
unexpected position)0 0.3 C
119.60 126.00 317149, 6433064 322757, 6436147 6.40CLAY (Extremely low
strength)
CPT/VC 03-SS-11 9 122.005 319272 6434199124 to 128
Frequent pockmarks.0 0.3 C
126.00 200.00 322757, 6436147 389837, 6467085 74.00CLAY (Extremely low
strength)
CPT/VC 03-SS-12
CPT 04-SS-01
CPT 04-SS-02
9
9
10
126.99
150.270
179.100
323621
344489
370410
6436633
6446916
6459492
128 to 154Frequent pockmarks.
Trawl marks KP 145.4 - 200
137.347 B Group 4 x Active pipelines
137.391 B -
137.391 B -
137.449 B -
140.250 B Group 2 x Active pipelines
140.288 B -
142.830 B Group 5 x Disused pipelines
142.861 B -
142.895 B -
142.926 B -
142.926 B -
156.395 S Active pipeline
0 0.3 C
200.00 224.00 389837, 6467085 411413, 6477119 24.00CLAY (Extremely low
strength)
CPT 04-SS-03
CPT 04-SS-04
CPT/VC 04-SS-05
9
9
9
203.280
215.985
222.454
392987
404653
410106
6468008
6472813
6476287 139 to 124
Trawlmarks across c.50% of section.
Frequent possible gas seeps. MMT suggest that
signal in water column unlikely to be caused by
fish.
205.053 S Active pipeline
219.410 S Active pipeline0 0.3 6.6 10 24.00
LOW STRENGTH CLAY
(<40kPa)>100000 >100000 >100000 >100000 >100000 >100000 >100000 >100000 >100000 >100000 0.3 0.3 4.54341E-06 220000 C
FOR INFORMATION ONLY
Cable Burial Risk Assessment
165000
121000
87000
19000
48000
>100000
>100000 >100000>100000 >100000
Occurrence of sand not
well constrained, section
considered low strength
for anchoring. SAND is very
loose and silty.
SAND over dense SAND
Seabed Geology and Samples
2.08107E-050.21 4.601.20.2 48000 48000 49000 52000 >100000 >100000 >100000 >100000 >100000SAND or CLAY ≥ 40kPa
SAND or CLAY ≥ 40kPa
LOW STRENGTH CLAY
(<40kPa)0.3
Recommended minimum
Depth of Lowering (DOL)¹² to
protect from fishing+mobile
sediments
Probability of
anchor strike at
recommended
minimum DOL
Additional
Notes
5.28428E-05
1.15021E-05
8.26674E-06
>100000
>100000
>100000
1
Representative DOL
across shipping
zone for anchor risk
calculation
Accidental/Emergency Anchor Strike Annual Failure Frequency (Return Period in Years, nearest 1000)4
1.50
>100000
>100000
NorthConnect
Client name:
Project name:
HDD
>100000 >100000 >100000
19000
>100000 >100000
Hazard Interaction Depth [m]
0.255
19000 >100000 >100000
8
9 >100000
0.3
>100000LOW STRENGTH CLAY
(<40kPa)140.00
3
6.0
6.6 6
0.2
0.3
1.8
>1000006.6
19000
LOW STRENGTH CLAY
(<40kPa)15.50
19000 >100000 >100000 >100000
>100000 >100000 >100000 >100000
87000 87000 87000 87000 87000 90000 90000
14.90
12.30
0.3
From
KP
(RPL09 Corridor)
Length
(km)
Co-ordinates
ETRS 1989 UTM Zone 31N
To
Northing
To From
Shipping
Zone
Seabed features2
(Survey Centre Line)
Geotech test / sample location
KP Easting
Relevant CPT/VC tests
/ samples in section
Crossings (KP as-found by MMT)
Status (B - Buried, S - Surface laid)
-North sea survey, as-found location
given
*Fjord section as-found location
Additional notes on
shallow geology
Summary of geology in
upper 3m in section14
Bathymetry
range within
section
[m below MSL]
Maximum
potentially mobile
bedform height in
section on SCL
MMT Seabed
Index at
sample
locations
(1-10)
Slide-scarp and mass transport
areasSlides and rockfalls from Fjord side
Seabed Features
0.3
0.75
>10000087000
>100000
HDD
FEED
Protection Level13
Burial Recommendations
50.7505
Deepest
observed
anchor
threat
Fishing
2.00 3 40.50
Return Period
(years, nearest
1000)1.00
Zone Length
(km)
Dominant Sediment
Type in Shipping Zone
(for anchoring
assessment)
6.04929E-06

Seabed Geology and Samples
Recommended minimum
Depth of Lowering (DOL)¹² to
protect from fishing+mobile
sediments
Probability of
anchor strike at
recommended
minimum DOL
Additional
Notes
Representative DOL
across shipping
zone for anchor risk
calculation
Accidental/Emergency Anchor Strike Annual Failure Frequency (Return Period in Years, nearest 1000)4
1.50
Hazard Interaction Depth [m]
0.255
From
KP
(RPL09 Corridor)
Length
(km)
Co-ordinates
ETRS 1989 UTM Zone 31N
To
Northing
To From
Shipping
Zone
Seabed features2
(Survey Centre Line)
Geotech test / sample location
KP Easting
Relevant CPT/VC tests
/ samples in section
Crossings (KP as-found by MMT)
Status (B - Buried, S - Surface laid)
-North sea survey, as-found location
given
*Fjord section as-found location
Additional notes on
shallow geology
Summary of geology in
upper 3m in section14
Bathymetry
range within
section
[m below MSL]
Maximum
potentially mobile
bedform height in
section on SCL
MMT Seabed
Index at
sample
locations
(1-10)
Slide-scarp and mass transport
areasSlides and rockfalls from Fjord side
Seabed Features
FEED
Protection Level13
Burial Recommendations
50.7505
Deepest
observed
anchor
threat
Fishing
2.00 3 40.50
Return Period
(years, nearest
1000)1.00
Zone Length
(km)
Dominant Sediment
Type in Shipping Zone
(for anchoring
assessment)
224.00 240.50 411413, 6477119 425382, 6485874 16.50SAND and CLAY (Extremely
low strength)
Clay/Sand boundary
located in this section
(Loose sand sampled at
very end of section. Charts
suggest change at c. KP
233, however reflectors
don't show clear change.
Consider section as low
strength clay.
CPT/VC 05-SS-01 7 239.305 424324 6485339
112 to 124
Trawlmarks across c.50% of section.
Frequent possible gas seeps. MMT suggest that
signal in water column unlikely to be caused fish.
235.929 B Active cable 0 0.3 6.0 11 16.50LOW STRENGTH CLAY
(<40kPa)>100000 >100000 >100000 >100000 >100000 >100000 >100000 >100000 >100000 >100000 0.3 0.3 8.47326E-07 118000 C
240.50 276.00 425382, 6485874 459805, 6492945 35.50 SAND to depth
CPT/VC 05-SS-02
CPT/VC 05-SS-03
CPT/VC 06-SS-01
5
3
3
247.138
261.600
275.730
431674
445792
459549
6487988
6490447
6492852
88 to 111Occasional Trawl marks.
Rare pockmarks
244.610 S Active pipeline
246.750 S Active pipeline
248.384 B Active cable
248.414 S 2 x Active pipelines
248.445 S -
259.413 B Active cable
264.888 S Active pipeline
268.635 S Active pipeline
280.857 S Active pipeline
287.657 B Active cable
0 0.2 C
276.00 290.50 459805, 6492945 472700, 6499251 14.50 SAND to depth 96 to 103 Featureless 298.564 B Disused cable 0 0.2 C
290.50 341.50 472700, 6499251 513994, 6528958 51.00
Areas of SAND and CLAY
(Extremely/Very Low
Strength)
*Loose clayey silty sand
interpreted in vicinity of 06-
SS-02 and 07-SS-01 not well
defined by reflectors,
section considered low
strength clay for
anchoring to remain
conservative.
CPT 06-SS-02*
CPT/VC 06-SS-03
CPT/VC 06-SS-04
CPT/VC 07-SS-01*
7
9
9
8
293.196
303.800
319.900
331.600
474850
483355
496197
505777
6500877
6507264
6516926
6523407
103 to 119
Trawl marks KP 294.5-324.1
Ripples KP:
309.048 - 309.882
Ripples & Large Ripples KP:
328.480 - 345.408
304.477 B Active cable
326.208 S Active pipeline
338.965 Planned cable
<0.2,
some 0.60.37 See Note 7 C
341.50 348.50 513994, 6528958 519794, 6532877 7.00CLAY (Extremely/Very Low
Strength)
CPT/VC 07-SS-02 9 345.43 517253 6531157123 to 152
Ripples KP:
328.480 - 345.408
<0.2,
some 0.6
0.4
(0.1m accounts for ripples)C
348.50 363.50 519794, 6532877 532223, 6541275 15.00CLAY (Extremely Low
Strength)
CPT 07-SS-03 10 357.300 527033 6537758152 to 238
Frequent small pockmarks.
Trawl marks KP 348.5-351.5, 359.5-361.8351.365 Planned cable 0 0.3 C
363.50 390 532223, 6541275 554181, 6556111 26.50CLAY (Extremely/Very Low
Strength)
CPT/VC 07-SS-04
CPT 08-SS-01
9
10
363.620
387.600
532308
552194
6541337
6554771103 to 285
Very frequent pockmarks up to 8m deep, c.100m
across.
Trawl marks across whole section.374.606 Planned pipeline 0 0.3 C
390 409.50 554181, 6556111 570338, 6567028 19.50CLAY (Extremely Low
Strength)
CPT/VC 08-SS-02 10 405.880 567341 6565008
274 to 290
Very frequent pockmarks up to 8m deep, c.100m
across.
Trawl marks across whole section.
390.661 B Active cable
397.186 B Active cable0 0.3 C
409.50 413.00 570338, 6567028 573239, 6568987 3.50CLAY (Extremely Low
Strength)269 to 274 Trawl marks across whole section. 0 0.3 C
413.00 415.00 573239, 6568987 574896, 6570107 2.00CLAY (Extremely Low
Strength)267 to 271
Iceberg plough marks throughout section.
Pockmark on centre line at KP 413.0 0.3 C
415.00 427.75 574896, 6570107 585460, 6577245 12.75CLAY (Extremely Low
Strength)
CPT/VC 08-SS-03 10 419.800 578862 6572791
256 to 267Iceberg plough marks throughout section.
Pockmark on centre line at KP 413.0 0.3 C
427.75 430.00 585460, 6577245 587325, 6578505 2.25CLAY (Extremely Low
Strength)266 to 272
Iceberg plough marks throughout section.
Occasional boulders,
<50% are >0.75m in size0 0.3 C
430.00 447.50 587325, 6578505 601825, 6588302 17.50CLAY (Extremely Low
Strength)
CPT/VC 09-SS-01
CPT 09-SS-02
CPT 09-SS-03
9
10
10
431.800
442.720
444.490
588811
597860
599317
6579503
6585619
6586602 231 to 274
Iceberg plough marks throughout section.
Occasional boulders,
<50% are >0.75m in size
446.595 S Active pipeline0 0.3 C
447.50 456.25 601825, 6588302 609264, 6592719 8.75CLAY (Very low to high
strength*)
(*Variable degrees of
iceberg reworking and soft
sediment fil l)
CPT/VC 09-SS-04
CPT/VC 09-SS-05
CPT/VC 09-SS-06
7
7
9
449.707
449.783
452.660
603656
603718
606052
6589531
6589579
6591259
165 to 235
Iceberg plough marks throughout section.
Numerous boulders,
<50% are >0.75m in size0 0.3 C
456.25 460.75 609264, 6592719 613607, 6593354 4.50CLAY (Extremely low
strength)
CPT/VC 09-SS-07 9 457.363 610355 6592493165 to 205 Featureless 456.816 S Active pipeline 0 0.3 C
460.75 470.00 613607, 6593354 621415, 6596941 9.25
CLAY (Extremely low
strength), highly localised
subcropping BEDROCK/TILL
CPT/VC 09-SS-08
CPT/VC 09-SS-09
CPT/VC 09-SS-10
CPT/VC 09-SS-11
9
7
10
9
461.949
464.259
465.232
465.805
614686
616769
617395
617913
6593862
6594370
6595014
6595256190 to 270
Numerous boulders, <50% are >0.75m in size:
KP 460.75 - 462.25
KP 464.1 - 466
Occasional boulders, <50% are >0.75m in size:
KP 462.25 - 463.65
Interpreted mass-transport
deposit:
KP 467.55 - 467.65
0 0.3 C
470.00 480.65 621415, 6596941 625174 ,6601722 10.65
Subcropping/exposedBEDROCK, BEDROCK/TILL
interspersed with areas of
CLAY and SAND
BEDROCK outcrops are
particularly prevalent
between KP 470 and KP474,
although found across the
section.
Appears particularly rocky
between KP 471.1 -
KP472.8
Considered LOW
STRENGTH CLAY for
shipping assessment as this
comprises the majority of
this section.
VC 09-SS-12A
VC 09-SS-13
VC 09-SS-15
CPT/VC 09-SS-14
VC 09-SS-16
8
9
9
9
7
471.417
472.274
475.505
477.137
622313
623075
625365
625228
6596333
6596621
6596679
6598293
142 to 372
Frequent areas of numerous/high density boulders
<50% ore >0.75m in size, Diamicton Til l, Reefs.
Where sampled, ,Til l appears to comprise
gravelly sand.
Ripples KP:
473.393 - 473.4498
Extreme gradients, thin sediment cover over
bedrock.
<0.2 (limited area) 0.3 6.0 17 10.65
Consider as LOW
STRENGTH CLAY
(<40kPa)
(Overall)
53000 53000 53000 53000 53000 53000 58000 58000 >100000 >100000 0.37 See Note 7
See Note 80.3 1.89196E-05 53000 C
480.65 482.25 625174 ,6601722 624204 ,6602969 1.60 BEDROCK/TILL
Unsampled
282.5 to 352
High density boulders
<50% are > 0.75m in size 0 0.2 1.8 18 1.60
Bedrock/Til l(Consider as
SAND or CLAY ≥ 40kPa) >100000 >100000 >100000 >100000 >100000 >100000 >100000 >100000 >100000 >100000 0.2 See Note 8 0.2 6.29986E-06 159000 C
482.25 502.30 624204 ,6602969 634429 ,6618436 20.05CLAY (Extremely/Very Low
Strength)
VC-B10-SS-01
CPT/VC-B10-SS-02
9
9
489.723
499.138
627790
631809
6608737
6616669
290 to 424
Occasional pinnacles of bedrock at seabed c.KP
487.5 -488.5, (avoidable)
Occasional boulders KP 488.3-489.1
<50% are >0.75m in size
Trawl marks KP 488.3 - 501.0
Patches interpreted mass
transport deposits KP 483.25-484
0 0.3 6.0 19 20.05LOW STRENGTH CLAY
(<40kPa)50000 50000 50000 50000 51000 51000 58000 58000 >100000 >100000 0.3 0.3 1.98063E-05 50000 C
502.30 505.75 634429 ,6618436 637330, 66210583.45
CLAY (Extremely/Very Low
Strength), some areas of
BEDROCK/TILL with veneer
of CLAY
VC 10-SS-03A 9 502.328 634454 6618450
217 to 334
Routeing should be able to avoid rock/hard
sediment and bury the cable in soft clay . Thus
considered soft clay for anchoring assessment.
Patches occasional/numerous boulders KP 502.5-
505.6,505.435 Active cable
Mass transport deposits across
section (contains disturbed
reflectors indicative of mass
transport deposits.)
0
LOW STRENGTH CLAY
(<40kPa)
(*Detailed routing
should be able to avoid
bedrock i in which case
cable installation will
be on/in soft clay)
0.3 See Note 8 C
505.75 508.75 637330, 6621058 638422, 6623764 3.00
BEDROCK/TILL with veneer
of CLAY, and CLAY
(Extremely/Very Low
Strength)
217 to 120
Route consistently on "bedrock" (MMT
interpretation), KP 507.75 - 508.75 (unavoidable,
clay veneer thickness unknown. "Bedrock" may be
Till). Other 2km in section may be possible to route
on soft material.
High density boulders KP 505.75-507.75,
<50% are >0.75m in size.
Reef on or near centreline KP 506.5 - 508.0.
Relict bedforms on centre-line KP 507.555 - 507.743
Bedforms are
Relict
<0.2, 3
(Megaripples)
Bedrock/Til l, Consider
as SAND or CLAY ≥
40kPa
(Shipping zone 20 uses
soft sediment for anchor
calculations risks to be
conservative)
0.3 See Note 8 C
508.75 509.80 638422, 6623764 638211, 6623745 1.05
BEDROCK/TILL with veneer
of CLAY, and CLAY
(Extremely/Very Low
Strength)
187 to 225Numerous boulders ,<50% are >0.75m in size. KP
508.75-509.8
Mass transport deposits across
section
0
LOW STRENGTH CLAY
(<40kPa)
(*Detailed routing may
be able to avoid
bedrock/til l in which
case cable installation
will be in soft clay)
0.3 See Note 8C
(D 509-509.8)
509.8 520.6 638211, 6623745 644395 ,6631769 10.80CLAY (Extremely/Very Low
Strength)
CPT/VC-B10-SS-04
CPT/VC 10-SS-05
9
9
509.983
514.708
638407
641978
6623841
6626604
290 to 354
Rock pinnacle at KP 519.5 (avoidable)
Numerous boulders
KP 509.8- 510.25,
Mix of numerous and occasional boulders KP 516.4
- 516.75
KP 517.4 -520.4
<50% are >0.75m in size.
510.916 Active cable
511.116 Active cable
511.249 Active cable
511.307 Active cable
511.548 Active cable
Mass transport deposits
outcrop KP 510-520.6.
Possible historic slip-scarp at KP
510.6 0 0.3 6.0 21 10.8LOW STRENGTH CLAY
(<40kPa)53000 53000 53000 53000 53000 56000 65000 65000 >100000 >100000 0.3 0.3 1.87684E-05 53000
D
(B
KP 520-520.8)
520.60 524.65 644395 ,6631769 647271 ,6634614 4.05
TILL with veneer of CLAY
(Veneer thickness unknown,
TILL not sampled)
11-SS-01 samples pocket
of thicker clay (not
representative of
surrounding geophysical
interpretation of Til l with
veneer)
11-SS-01 samples CLAY
veneer, TILL not reached
after 1.6m
VC-B11-SS-01
VC-B11-SS-02A
9
9
521.803
523.993
645197
646790
6632666
6634169
152 to 430
Raised area is interpreted as Til l with a clay
veneer. This (and later) features may have been
formed as terminal moraines by periods of glacial
re-advancement during the overall final retreat.
High density boulders KP 521.1 - 524.4
<50% are >0.75m in size
Routing may be able to avoid exposed
til l/bedrock KP 524.25-524.6
Reef patch at KP 521.7
523.223 Active cable
0 0.2 1.8 22 4.05
Consider as SAND or
CLAY ≥ 40kPa >100000 >100000 >100000 >100000 >100000 >100000 >100000 >100000 >100000 >100000 0.2 0.2 2.58901E-06 386000 B
524.65 531.50 647271 ,6634614 650232 ,6640121 6.85CLAY (Extremely/Very Low
Strength)
*Assuming cable is routed
through low strength clay
areas, avoiding bedrock
Unsampled
400 to 503
Large very steep "islands" of bedrock in Fjord
bottom. Port/Starboard survey lines suggest these
areas are easily avoidable to allow the cable to
be installed in soft sediment.
Occasional boulders, <50% are >0.75m in size.
KP 526.3 - 526.4
KP 528.2 - 528.6
525.92 Active cable Section consists mostly of mass
transport deposits outcrop
unless bedrock/til l is found.
0 0.3 (0) 23 6.85
LOW STRENGTH CLAY
(<40kPa)* 0.3 - 0 - B
58000
80000
282000
78000
106000
394000
6.0
>100000
>100000
1.24718E-05
>100000
>100000 >100000
78000 >100000
>100000
>100000
78000
0.3 6.0
0.2 1.8
78000 78000 78000 78000
82000 >100000
>100000 >100000
ANCHORING NOT CONSIDERED TO POSE A RISK BEYOND ZONE 22 DUE TO WATER DEPTH BEING >400m
58000 58000 58000 59000 65000 65000 >100000
80000 80000 80000 80000
>100000>100000
78000 >100000
>100000 >100000 >100000 >100000
>100000 >100000 >100000 >100000 >100000 >100000
80000 80000 82000 >100000
>100000 >100000
78000
16
>100000
58000
0.3 7.3
0.3 7.3
>100000 >100000
>100000
SAND or CLAY ≥ 40kPa
LOW STRENGTH CLAY
(<40kPa)
LOW STRENGTH CLAY
(<40kPa)
LOW STRENGTH CLAY
(<40kPa)
>100000
12
0.3
50.00
99.50
25.00
15.00
40.00
15
13
14
0.3
>100000
20
6.0
>100000
7.50 58000
>100000 0.2
0.3
0.3
0.3
0.3
0.3
2.53627E-06
9.41706E-06
3.5501E-06
1.73527E-05
LOW STRENGTH CLAY
(<40kPa) (Dominant
type)
1.28367E-05

Seabed Geology and Samples
Recommended minimum
Depth of Lowering (DOL)¹² to
protect from fishing+mobile
sediments
Probability of
anchor strike at
recommended
minimum DOL
Additional
Notes
Representative DOL
across shipping
zone for anchor risk
calculation
Accidental/Emergency Anchor Strike Annual Failure Frequency (Return Period in Years, nearest 1000)4
1.50
Hazard Interaction Depth [m]
0.255
From
KP
(RPL09 Corridor)
Length
(km)
Co-ordinates
ETRS 1989 UTM Zone 31N
To
Northing
To From
Shipping
Zone
Seabed features2
(Survey Centre Line)
Geotech test / sample location
KP Easting
Relevant CPT/VC tests
/ samples in section
Crossings (KP as-found by MMT)
Status (B - Buried, S - Surface laid)
-North sea survey, as-found location
given
*Fjord section as-found location
Additional notes on
shallow geology
Summary of geology in
upper 3m in section14
Bathymetry
range within
section
[m below MSL]
Maximum
potentially mobile
bedform height in
section on SCL
MMT Seabed
Index at
sample
locations
(1-10)
Slide-scarp and mass transport
areasSlides and rockfalls from Fjord side
Seabed Features
FEED
Protection Level13
Burial Recommendations
50.7505
Deepest
observed
anchor
threat
Fishing
2.00 3 40.50
Return Period
(years, nearest
1000)1.00
Zone Length
(km)
Dominant Sediment
Type in Shipping Zone
(for anchoring
assessment)
531.50 548.25 650232 ,6640121 659120 ,6652619 16.75CLAY (Extremely/Very Low
Strength)
CPT/VC 11-SS-03
CPT/VC 11-SS-04
CPT/VC 12-SS-01
CPT/VC 12-SS-02
9
9
9
9
539.651
542.718
543.438
547.61
653856
654541
655111
658692
6646994
6649993
6650532
6652147
464 to 547
Occasional boulders, <50% are >0.75m in size:
KP 534.25 - 534.5
Occasional boulders, >50% are >0.75m in size:
KP 540.55 - 540.6
KP 544.9 - 545.1
Numerous boulders, >50% are >0.75m in size:
KP 535.7 - 535.8
533.666 Active cable
533.758 Active cable
533.873 Active cable
533.96 Active cable
534.077 Active cable
534.191 Active cable
534.357 Active cable
534.376 Active cable
534.742 Active cable
538.650 Out of use cable
539.229 Out of use cable
539.24 Out of use cable
Slip-scarp at KP 542.45
Possible historic slip-scarp at KP
547.7
Interpreted mass-transport
deposits:
KP 534.8 - 535.1
KP 539.4 - 540.6
KP 541.3 - 542.45
KP 543 - 543.8
KP 539.4 to 539.94 -Interpreted from
MBES and SBP; from east, rather gentle
side slopes, could be from sliding
during decreasing sea level
KP 540.13 to 540.67 -Interpreted from
MBES and SBP; across, rather gentle
side slopes, could be from sliding
during decreasing sea level
KP 543.43 to 543.77 -Interpreted from
MBES and SBP; from south, rather
gentle side slopes, could be from
sliding during decreasing sea level
0 0.3 (0) 24 16.75
LOW STRENGTH CLAY
(<40kPa) - - - - - - - - - - 0.3 - 0 -
B
(D
KP 543.2 -544.8)
548.25 549.00 659120 ,6652619 659619 ,6653179 0.75BEDROCK or TILL with veneer
of CLAY
Unsampled
547 to 605 Bedrock or Til l interpreted, with a veneer of clay. 0 0.2 (0) 25 0.75Consider as SAND or
CLAY ≥ 40kPa- - - - - - - - - - 0.2 See Note 8 - 0 - B
549.00 557.50 659619 ,6653179 665014 ,6659116 8.50CLAY (Extremely/Very Low
Strength)
VC B12-SS-03 9 555.018 663766 6657473
605 to 660
Raised area across Fjord: KP 554.9 - 555.3
interpreted as Bedrock/Til l with overlying clay
mass-transport deposit.
Slip-scarps:
KP 549.75
KP 549.9
Interpreted mass-transport
deposits:
KP 549.75 - 550.6
KP 555.25 - 556
0
Fishing not
considered
a risk at
these depths
(0) 26 8.50LOW STRENGTH CLAY
(<40kPa)- - - - - - - - - - 0 - 0 - A
557.50 592.60 665014 ,6659116 676238 ,6684411 35.10CLAY (Extremely/Very Low
Strength)
VC B12-SS-04
VC B13-SS-01A
VC B14-SS-01
9
9
9
572.419
586.194
590.893
671601
673305
675629
6671067
6681516
6682836
528 to 668
Raised area across Fjord: KP 586 - 588.95
interpreted as Bedrock/Til l with veneer/cover of
clay.
Occasional boulders, <50% are >0.75m in size:
KP 585.9 - 586.65
563.317 Active cable
566.707 Active cable
573.047 Active cable
577.246 Active cable
578.652 Active cable
582.517 Out of use cable
583.406 Active cable
584.179 Active cable
584.681 Active cable
584.707 Active cable
584.933 Active cable
585.063 Out of use cable
Slip-scarp:
KP 585.25
Mass transport deposits
outcrop:
592.1 - 592.7
Interpreted mass-transport
deposits:
KP 585.3 - 585.7
0 0.3 (0) 27 35.10LOW STRENGTH CLAY
(<40kPa)- - - - - - - - - - 0.3 See Note 10 - 0 -
B
(D
KP 586.7 - 588.7,
KP 591 - 592.6)
592.60 594.60 676238 ,6684411 677261 ,6686119 2.00BEDROCK or TILL with veneer
of CLAY or SAND/GRAVEL
Sample records clay
(0.7m) over SAND to 0.7-
2m (end of sample)
VC B15-SS-01A 9 592.698 676289 6684498
530 to 800
Raised area across Fjord interpreted as
Bedrock/Til l with clay or sand/gravel veneer. Very
rapid deepening, from -530m to -800m from KP
592.7- 595.5
Occasional boulders, >50% are >0.75m in size:
KP 594 - 594.5, although found on port and
starboard survey lines throughout section.
0 0.2 (0) 28 2.00Consider as SAND or
CLAY ≥ 40kPa- - - - - - - - - - 0.2 - 0 - D
594.60 610.00 677261 ,6686119 682547 ,6698306 15.40CLAY (Extremely/Very Low
Strength)
CPT/VC B16-SS-01
VC B16-SS-02
9
9
598.768
609.308
676934
682546
6690101
6697615
805 to 857Route in proximity of explosive dumping ground KP
609.5 - 611.5
596.216 Active cable
596.306 Active cable
598.021 Out of use cable
598.39 Active cable
600.323 DCC 142 Active cable
601.067 Out of use cable
Slip-scarp: KP 599.1 - 599.15
Mass transport deposits
outcrops:
KP 594.60 - 595.7
KP 599.15 - 599.8
Interpreted mass-transport
deposits:
KP 599.25 - 599.75
KP 603.5 - 603.9
KP 595.81 to 595.96 -Interpreted from
MBES and SBP; from east, steep side
slope, could be old rockfall
KP 597.48 to 597.59 -Interpreted from
MBES, small lobes from east and west
KP 603.54 to 603.91 -Interpreted from
MBES and SBP; from southeast, steep,
high side slope10
0
Fishing not
considered
a risk at
these depths
(0) 29 15.40LOW STRENGTH CLAY
(<40kPa)- - - - - - - - - - 0 See Note 10 - 0 -
A
(D
KP 594.6 - 596,
KP 598.5, 599.5)
610.00 634.75 682547 ,6698306 702765 ,6703392 24.75CLAY (Extremely/Very Low
Strength)
CPT/VC B17-SS-01
CPT/VC B17-SS-02
9
9
620.377
630.507
690357
699382
6703185
6706051
716 to 857
Numerous boulders, <50% are >0.75m in size:
KP 612.8 - 613.4
Occasional boulders, >50% are >0.75m in size:
KP 630.5 - 631
High-density boulders, >50% are >0.75m in size:
KP 632.95 - 633.25
610.622 Active cable
612.582 Active cable
618.476 Active cable
619.307 Active cable
633.396 Active cable
634.611 Active cable
634.647 Active cable
Slip-scarps:
Multiple small scarps KP 620 -
620.5
Possible older scarp KP 621.2
Scarp KP 630.7
Mass transport deposits
outcrop:
KP 611.4 - 611.75
KP 619.2 - 621.2
KP 627.9 - 630.9
Interpreted mass-transport
deposits:
KP 611.4 - 611.65
KP 619.9 - 620.25
630.35 - 630.7
0
Fishing not
considered
a risk at
these depths
(0) 30 24.75LOW STRENGTH CLAY
(<40kPa)- - - - - - - - - - 0 See Note 10 - 0 -
A
(D
KP 616.5 - 619.3,
KP 621 - 625)
634.75 658.70 702765 ,6703392 721786 ,6712367 23.95CLAY (Extremely/Very Low
Strength)
CPT/VC B18-SS-01
VC B18-SS-02
CPT/VC B18-SS-03
CPT/VC B18-SS-04
CPT/VC B18-SS-05
CPT/VC B18-SS-06
CPT/VC B18-SS-07
9
9
9
9
9
9
9
638.405
639.678
640.688
642.449
646.638
650.663
655.334
704936
705442
706161
707330
710206
714281
718610
6704601
6705780
6706496
6707787
6710922
6711097
6712745330 to 720
Raised section across Fjord interpreted as
Bedrock/Til l, covered by soft mass-transport clay
deposit.
KP 646.4 - 647.0
Occasional boulders, <50% are >0.75m in size:
KP 636.6 - 637.1
Occasional boulders, >50% are >0.75m in size:
KP 657.9 - 658.2
636.228 Active cable
637.338 Active cable
637.556 Active cable
637.887 Active cable
641.7 Active cable
642.007 Out of use cable
642.044 Active cable
647.387 Active cable
654.534 Active cable
Slip-scarps:
KP 638.1 - 638.25
KP 642.25
KP 650.45
KP 657.1
Mass transport deposits
outcropping throughout.
Interpreted mass-transport
deposits occur regularly from
KP 637.4 onwards, from scarps
on centre and sides of Fjord.
KP 644.1 to 644.9 -Interpreted from
MBES and SBP; from north west, covers
1/3 of corridor, steep, high side slope10
KP 645.88 to 646.32 -Interpreted from
MBES and SBP; from north northeast ,
crosses the corridor, steep, high side
slope (looks fresh) 11
KP 654.86 to 655.2 -Interpreted from
MBES and SBP; from north, steep,
covers more than half of the corridor,
steep side slope (looks fresh) 11
0 0 See Note 10 A
658.70 661.40 721786 ,6712367 724305 ,6712302 2.70
CLAY (Extremely/Very Low
Strength). Outcrops of
BEDROCK KP 660.5 - 661.3
*Bedrock outcrops appear
to be avoidable
Unsampled
330 to 76
Complex section. Mix of soft sediment and
Bedrock. Incidence of soft/harder material is
patchy across all 3 survey lines. Considered as
LOW STRENGTH CLAY for shipping assessment to
remain risk-conservative and due to the very low
levels of traffic.
Exposed/subcropping bedrock KP 660.5 - 661.3
Numerous / occasional boulder patches across
section, <50% are >0.75m in size.
Exposed bedrock may be avoidable.
661.244 Out of use cable Extreme gradients
Patches of interpreted mass-
transport deposits KP 659.9 -
661.3.
Mass transport deposits (Where
not interpreted as Til l/bedrock)
^Begins in above section
KP 658.64 to 658.88 -Interpreted from
MBES and SBP; from north, steep,
covers more than half of the corridor,
steep side slope (looks fresh).
Correlates with gully onshore?11
KP 659.9 to 660.18 -Interpreted from
MBES and SBP; from north, steep,
covers more than half of the corridor,
steep side slope (looks fresh).
Correlates with gully onshore?11
0 0 See Note 10 A
661.40 664.66 724305 ,6712302 727248 ,6713622 3.26 CLAY (Very Low Strength)
CPT/VC B18-SS-08 9 661.687 724538 6712493
76 to 13
High density boulders, >50% are >0.75m in size, KP
663.65 - 663.8.
662.89 Active cable
664.018 Active cable
664.273 Active cable
Extreme gradients
Very large slip-scarp KP 661.4 -
661.6, likely source of mass
transport deposits in previous
sections.
KP 663.72 to 663.82 -Lobe from south,
covering 1/3 of corridor, steep
mountain side with gully above.11
0 0*See Note 10
D
4000 4000 4000 4000 6000 7000 7000 7000 40000 59000 Total 0.000251293 4000
MMT Seabed Index DNV Cat 1
DNV Cat 2
DNV Cat 3
-
>100000
10000 to 100000
1000 to 10000
- -- -
Fishing not
considered
to pose a risk
this far up
the Fjord (as
agreed with
client)
29.91 - -
Cumulative return period if full route at this depth
(0) Anchor
risk not
considered
due to
extremely
low vessel
count.
Protection
level D
protects
against
quarry
anchorage
KP 661.4 - KP
664.66)
31 - - - - 0LOW STRENGTH CLAY
(<40kPa)-
Notes on Burial Risk Assessment Parameters:
1. HDD exit at 170 degrees from North, 170m away from and perpendicular to RPL09 survey centre line at KP 0.12. Patches of mobile sediments are recorded to their full KP extent if they lie in part or fullywithin a zone.3. Intra-zone KP ranges of potential mobile sediments are given in the "Seabed features" column. The mobile sediments column gives the largest thickness of potential mobile sediment
observed within the zone. Bedform size classification is given in the report.4. Probabilistic assessment has been undertaken using a yearly average from the two year dataset. Return periods are large in some cases for individual route sections - however the
cumulative risk to the entire route should be considered when considering target burial depths.5. The cable may be at significant risk from fishing and/or instability at this depth
6. All references to KP's and coordinates are based on RPL09.
7. Avoid, remove or increase burial where significant bedforms are encountered in order to bury cable below mobile sediment level to prevent subsequent exposure to threat lines.Note that the maximum bedform size is based upon MMT bedform size classification.
8. Rock placement may be required (due to unavoidable slopes etc)9. Increase burial to protection level D in vicinity of fish farms (buffer c.200m suggested, varied case-by-case)
10. Further assessment / routeing avoidance of potentially unstable slopes should be conducted.11. Landslide/rockfall from Fjord side is identified as being potentially critical in this area12. Recommended minimum (short section) DOL based upon mobile sediments and fishing threat line. Actual burial targets will be driven by NorthConnect FEED document. Burial to be
refined based upon precise location of mobile bedforms immediately before installation. These recommendations provide no extra factor of safety for the fishing threatline. Probabilisticassessment results should also be considered with regard to residual risk from anchoring.
13. Protection levels are defined in the NorthConnect FEED document

NorthConnect
Cable Burial Risk Assessment
C831R01 Issue 04
18/05/18
Appendix C – Shipping Assessment
NorthConnect
Cable Burial Risk Assessment
C831R01 Issue 04
18/05/18
Appendix C.1.1 Shipping Data
The hazard to subsea cables from shipping is associated with the deployment of anchors either
in designated anchorage zones (which should be avoided through routing) or in emergency
situations that result in anchor deployment through mechanical failure or deployment without
due care. The potential impact on the seabed and/or the resultant snagging of a deployed
anchor can result in damage to a buried cable.
An Automatic Identification System (AIS) dataset covering the NorthConnect RPL for a 2-year
period (01/09/15 to 31/08/17) was acquired (Ref. 23).
Appendix C.1.2 Data Processing
The AIS data generally includes the following:
• Vessel MMSI identification no.
• Vessel type
• Position
• Time
• Length
• Deadweight
The data was provided as point data, therefore, it required processing to convert into tracks
for each vessel. The vessel tracks were then broken down in GIS such that in the event of
multiple crossings by the same vessel they would all be counted.
Figures showing the track plots for each type of vessel are presented in Appendix E.
Appendix C.1.3 Data assessment / data gaps
The data is considered fit for purpose; however, it does have some limitations. The following
was noted:
A deadweight tonnage (DWT) value was not recorded in the dataset for some vessels detailed
in the shipping assessment. These vessels’ DWT values were determined by conducting an
online search of ship tracking websites using the unique MMSI numbers of the most frequently
reoccurring vessels. Where the precise DWT values were found, these were added. Where not,
the ship was assigned to the most appropriate category depending on its size and purpose as
determined by the information available.
Due to project time constraints, it has not been possible to individually look up DWT values for
all vessels, and for some vessels no online data was available, consequently a number of
“unknown” vessels remain. In the probabilistic assessment, the distribution of known vessels was
scaled up by the number of unknown vessels. For example, if the AIS dataset for a particular
route section contained DWT values for 90% of vessels and 10% were unknown, the number of
known vessels in each DWT bin would be multiplied by 1.11* such that the shape of the
distribution remained the same and the total number of vessels equalled 100% of vessel
crossings.

NorthConnect
Cable Burial Risk Assessment
C831R01 Issue 04
18/05/18
There are several harbours towards the western end of the RPL that are home to a considerable
number of small pleasure craft. Small vessels are not required to carry AIS equipment. Therefore,
values in the AIS dataset may underestimate of the volume of pleasure craft. Given the
relatively small size and low power of these vessels, their anchors are not anticipated to
penetrate far into the seabed and may not pose a significant threat to the cable however an
impact/snagging assessment would be required to confirm this. It should also be noted that,
the cable may pose a hazard to the craft themselves.
Vessel tracks were broken down in GIS such that in the event of multiple crossings by the same
vessel they would all be counted.
Appendix C.1.4 Traffic Patterns and Trends
The density of traffic (for the period 01/09/2015 to 31/08/2017) on the cable route along the full
route is shown in accompanying drawing C831R01 D01. The main points are briefly described
here.
➢ Traffic is very dense near the UK end of the route from KP 0-50, with declines beyond KP
25 and then KP 50
➢ Traffic is comparatively lighter from KP 70 to KP 390 except for a moderately busy
shipping lane KP 200 – 225.
➢ Traffic is dense on the approach to the Norwegian coast, KP 390 -470.
➢ Traffic is very dense around the Fjord entrance and the lower reaches of the Fjord, KP
470 to KP 530, From there to the end of the route at KP 664.66, where traffic is very light.
➢ A monthly breakdown of cable route crossings (Figure C.1, C.2) shows a clear seasonal
pattern with significantly lower traffic during the winter months, although the baseline
level shows significant traffic in all seasons. Data is consistent for the two-year period
with no obvious anomalous skews to the dataset, although Summer 2017 appeared to
show a higher level of traffic compared to the previous year, both in the Fjord (C.2) and
the North Sea (C.1).

NorthConnect
Cable Burial Risk Assessment
C831R01 Issue 04
18/05/18
Figure C.1. Crossing counts by month, KP 0.1 – 480.65.
Note: Incomplete months from the beginning and end of the dataset were discarded.
Figure C.2. Crossing counts by month, KP 480.65 – 664.66.
Note: Incomplete months from the beginning and end of the dataset were discarded.

NorthConnect
Cable Burial Risk Assessment
C831R01 Issue 04
18/05/18
Appendix C.1.5 Vessel Type
The AIS dataset included a diverse range of vessel types. For the purpose of the assessment
these were divided into the eight categories shown in Table C.1 and are presented in Appendix
E. The “government” group includes police, search and rescue and military vessels.
In addition to the vessels logged in the pleasure craft group, the values shown in the tables and
appendix of this section may underestimate the volume of pleasure craft as small vessels such
as these are not required to carry AIS equipment and so they would not be represented in the
AIS dataset. Given the relatively small size and low power of these vessels, their anchors are not
anticipated to penetrate far into the seabed and may not pose a significant threat to the
cable however an impact/snagging assessment would be required to confirm this. It should
also be noted that, the cable may pose a hazard to the craft themselves.

NorthConnect
Cable Burial Risk Assessment
C831R01 Issue 04
18/05/18
Table C.1: Number of crossings per vessel type (1-year average)
Type Number of crossings
Cargo/Tanker 56424
Offshore Industry 14067
Passenger/pleasure 15777
Survey 560
Port/Dredging 2959
Government 907
Tug 4994
Fishing 9512
Unknown / Other 4359
TOTAL 109558
Figure C.3: Percentage of cable-route crossings in two-year period by vessel
category

NorthConnect
Cable Burial Risk Assessment
C831R01 Issue 04
18/05/18
Figure C.3 shows that the majority of the 89040 crossings of the route over the two years
comprise the Cargo/Tanker vessels (51.5%), Passenger/pleasure vessels (14.4%), shipping
related to the offshore industry (12.8%) and fishing vessels (8.7%).
Individual vessel tracks according to vessel category are presented in drawings C831R01 D02
to D09.
Appendix C.1.6 Vessel Size
Figure C.4 below show the distribution of deadweight tonnage (DWT) of vessels which crossed
the proposed cable route (KP 0.1 to 480.65) during the period covered by the AIS dataset.
These proportions include a significant percentage of unknowns which remain even after the
most commonly crossing vessels of unknown DWT were looked up. Figure C.5 shows the
distribution of known DWT vessels only, which also represents the size distribution after the DWT
unknowns had been reallocated proportionally among the known size ranges, according to
their proportion)
The majority of vessels fall into the 1000 to 10000 Te category (71% of vessels for which DWT is
known). Vessels of unknown DWT comprise 37% of vessel cable route crossings. For undertaking
the probabilistic analysis, each class is scaled-up as discussed. Thus 45% of known vessel
crossing DWT’s in the 1000-10000 category scales to 71% of the upscaled probabilistic data. This
scaling may represent an element of conservatism, as the unknown vessels appear to generally
be smaller ships (fishing vessels etc) when looked up. However, there are also often large
vessels, which for whatever reason, do not have their DWT information inputted to the AIS
record, as received for processing. At present, no research has been conducted as to an
average size distribution of vessels of unknown DWT, thus the directly proportional scaling has
been applied. A much larger proportion of vessels in the Fjord are of unknown DWT. This may
reflect their size, or the fact that many will be used as inshore vessels only and not deem it
necessary to report statistics such as DWT on their AIS transmissions.

NorthConnect
Cable Burial Risk Assessment
C831R01 Issue 04
18/05/18
Figure C.4: Vessel sizes (Nearest %, including unknowns)
Figure C.5 Vessel sizes (Nearest %, excluding unknowns)

NorthConnect
Cable Burial Risk Assessment
C831R01 Issue 04
18/05/18
Table C.2: Vessel size categories
DWT (Te) Average annual* number of
crossings for the full route
Unknown** 40118
0 to 10 63
10 to 100 2775
100 to 1000 12395
1000 to 10000 49243
10000 to 25000 2208
25000 to 50000 859
50000 to 75000 402
75000 to 100000 458
100000 to 200000 1024
200000 to 325000 15
325000 to 500000 1
TOTAL 109558
*Averaged from the 2-year AIS dataset running 1/09/15 to 31/08/17.
**For the probabilistic assessment, each category in each zone is scaled up proportionally to
account for unknown DWT values.
This methodology is inherently conservative, as, as is explained in Appendix D, anchor sizes are
assumed for vessels in each DWT classification based upon the upper bound DWT for each bin.
Appendix C.1.7 Anchorages
No designated anchorages were noted on the SCL, although discussions with NorthConnect
have highlighted an anchorage near Simadalen landfall, for quarry freight vessels. Enhanced
burial is planned for this area (FEED Level D).
Enhanced burial (D) is also proposed in the vicinity of the Kvaerner Stord yards and mobilisation
area in Hardangerfjord.

NorthConnect
Cable Burial Risk Assessment
C831R01 Issue 04
18/05/18
Vessels with their AIS status set to anchored in the area during the year of data are shown in
Drawing C831R01D09. The shipping assessment indicates that anchoring occurs in the vicinity
of the oil and gas installations; these activities are assumed to be carefully planned and
undertaken with caution due to the difficulties and dangers anchoring in deep water and with
sensitive subsea infrastructure nearby. Therefore, this is not considered in the emergency
anchoring assessment.
FEED protection level D is planned for the first c. 850m of route following the HDD exit at UK
landfall, as vessels have been visually observed anchoring in this area by members of the
NorthConnect project team, as well as recorded by the AIS data. Post installation, once the
cable is marked on marine charts it is expected that vessels will anchor elsewhere and not
present a threat to the cables.
Anchorages in the form of static fish-farm anchors are noted in multiple locations crossing over
the route. Extra protection has been agreed with the Client in these areas to mitigate against
the risk of an anchor being dragged across the cable, possibly due to bad weather or a third-
party collision with the floating farm.

NorthConnect
Cable Burial Risk Assessment
C831R01 Issue 04
18/05/18
Appendix D – Anchor Risk Probabilistic
Methodology

NorthConnect
Cable Burial Risk Assessment
C831R01 Issue 04
18/05/18
Appendix D.1.1 Anchor Frequency Assessment
The probabilistic method evaluates the exposure of the cable to external threats by
considering the amount of time vessels spend within a critical distance of the cable and the
probability that a vessel might have an incident that requires the deployment of an anchor.
The effect of water depth and bathymetric profile is considered very important and is included
as a qualitative factor.
The calculation for the probability of an anchor striking a cable is given by:
𝑃𝑠𝑡𝑟𝑖𝑘𝑒 = 𝑃𝑡𝑟𝑎𝑓𝑓𝑖𝑐 ∗ 𝑃𝑤𝑑 ∑ 𝑡 ∗ 𝑃𝑖𝑛𝑐𝑖𝑑𝑒𝑛𝑡
𝑁𝑜.𝑠ℎ𝑖𝑝𝑠 𝑖𝑛 𝑠𝑒𝑐𝑡𝑖𝑜𝑛
1
Where:
𝑃𝑡𝑟𝑎𝑓𝑓𝑖𝑐 : Traffic probability modifier based on the tolerable level of risk
𝑃𝑤𝑑 : Probability modifier for nature and depth of seabed
t : Vessel time in ‘critical zone’, 𝑡 =𝐷𝑠ℎ𝑖𝑝
𝑉𝑠ℎ𝑖𝑝𝑥 8760ℎ𝑟𝑠 𝑝𝑒𝑟 𝑦𝑒𝑎𝑟
𝑉𝑠ℎ𝑖𝑝 : Ship speed (metre/hr)
𝐷𝑠ℎ𝑖𝑝 : Distance travelled by a ship in area under consideration (in metres)
𝑃𝑖𝑛𝑐𝑖𝑑𝑒𝑛𝑡 : Probability of an incident occurring for that vessel size and type
8670 hrs : Factor to annualise the results
The derivation and application of each of the terms in the formula for Pstrike is discussed below:
Ptraffic: is intended to be modified iteratively based on an agreed tolerable level of risk, this
assessment has been undertaken taking into account all vessels recorded during the survey
period i.e. Ptraffic = 1. The assessment is therefore conservative in this regard.
Pwd: accounts for changes in water depth, and proximity to anchorages varies along the route
and is discussed in detail later.
Vship: Has been assumed to be 2 knots based on previous Cathie Associates consultations with
industry
Dship: is a key item and can vary significantly depending upon the vessel size and speed. The
CBRA method suggests either assessing every AIS track or using the 90th percentile vessel to
conservatively estimate the critical anchor drag length. In this assessment, Dship has been
calculated according to the vessel categories listed in Table C.2 using the following formula:
𝐷𝑠ℎ𝑖𝑝 =𝑚 × 𝑉2
𝑠ℎ𝑖𝑝
4 × 𝑈𝐻𝐶
Where:
m = vessel mass (taken as displacement, in tons)
UHC = Ultimate Holding Capacity of anchor

NorthConnect
Cable Burial Risk Assessment
C831R01 Issue 04
18/05/18
Pincident: A conservative value for frequency of machinery breakdown of 2.0 x 10⁻⁵ per hour of
operation per vessel has been assumed for this assessment based on industry guidance
Table D.1: Water depth modifier, Pwd
Water depth / Profile Carbon Trust
Pwd Utilised Pwd
Water depth >400m 0 0
Water depth greater than 100m 0 0.01
Water depth 50 to100m 0 0.05
Water depth 30 to 50m 0.1 0.1
Water depth 10 to 30m 0.5 0.5
In areas of water 100-400m deep we have decided to use a Pwd of 0.01 to reflect the minimal
but not impossible probability of an anchor penetrating the seabed in deep water. The
workshop held with NorthConnect KS resulted in an agreed cut off for anchor risk at 400m
bathymetric depth, below which the probability of anchor will be considered to be zero given
the limitations on maximum chain length. This is in addition to the fishing threatline being
capped at 600m water depth.
Appendix D.1.2 Anchor Threatline Assessment
To assess the shipping density in the study area, the number and type of AIS tracks entering the
study area were mapped. The output was then factored to an annual basis. This data was then
used to represent the number and type of vessels anticipated to cross the subsea cables over
the course of a year. With the range of vessel sizes and deadweight established, the
displacement of a vessel can be estimated and this used to derive the indicative anchor size
of the vessel. From the anchor size, it is possible to estimate the fluke length from standard
anchor geometries. For this assessment, stockless anchors were used as defined by Vryhof in
their publication ‘Anchor Manual 2010 – The Guide to Anchoring’, 2010 (Ref. 26).
Having defined the indicative fluke lengths for the anchor, it is possible to define the potential
anchor penetration depths into the seabed based on the following approach:
➢ Sands and high strength clays = 1 x fluke length x sin 45°
➢ Low strength clays* = 3 x fluke length x sin 45°
*For this assessment anchor penetrating in clay units described as “low strength”
(corresponding to “Soft” in the NorthConnect FEED document) or below (i.e. less than 40
kPa) followed the low strength clay method.
Several of the MMT units describe medium strength clay and for these zones the sands
and high strength clays anchor penetration method has been followed. If, in some parts
NorthConnect
Cable Burial Risk Assessment
C831R01 Issue 04
18/05/18
of these zones, the clay is towards the lower bound of this bracket the depth of anchor
penetration may be underestimated however as other conservatisms are built in to the
probabilistic method the overall risk should still be captured. As an example: the largest
anchor size for each bin is assumed for the calculations – i.e. all vessels in the 100 to 1000
DWT category are assumed to be 1000DWT.
This approach is based on the work completed by Shapiro et al (Ref. 24). It is recognised that
anchor penetrations may vary significantly in mixed ground conditions; however, there is
limited published literature or field trials available to allow an accurate prediction of drag
anchor penetrations for each anchor size and soil type and detailed numerical modelling or
field trials would be required to estimate anchor penetrations in mixed ground conditions. As a
consequence, a significant simplification of the ground conditions had to be made on the
basis of ground investigation data available to provide a realistic estimate of the penetrations
likely to be achieved by dragged anchors for each relevant cable zone.
The anticipated anchor penetration depths for each vessel size in sand or low strength clay are
summarised Table D.2.

NorthConnect
Cable Burial Risk Assessment
C831R01 Issue 04
18/05/18
Table D.2: Estimated anchor penetration depth
DWT (Te)
Estimated
Displacement
(Tons)
Estimated
Anchor Size
(kg)*
Estimated
Fluke
Length (m)*
Estimated Anchor
Penetration Depth (m)*
Sands
Low
strength
Clay
0 to 10 17 36 0.33 0.24 0.77
10 to 100 170 123 0.50 0.35 1.15
100 to 1000 1700 524 0.81 0.57 1.86
1000 to 10000 17000 2388 1.34 0.95 3.08
10000 to 25000 42500 4388 1.64 1.16 3.77
25000 to 50000 85000 6959 1.91 1.35 4.39
50000 to 75000 127500 9114 2.09 1.48 4.80
75000 to 100000 170000 11039 2.23 1.58 5.12
100000 to 150000 255000 14461 2.44 1.72 5.60
150000 to 200000 340000 17516 2.60 1.84 5.97
200000 to 325000 552500 24206 2.89 2.04 6.64
325000 to 500000 850000 32255 3.18 2.25 7.31
*Note: Precision of numbers reflects formula outputs rather than an indicator of confidence. Final output
probabilities (Table D.3) have been rounded to reflect this.
To enable better utilisation of the data and accurately assess the potential hazards presented
by shipping to the cables, each zone has been considered separately according to the
geology and annual shipping density from the AIS shipping data (Ref. 23). The maximum
anchor penetration depths for the proposed zones are detailed in the burial assessment table
in Appendix B.
Appendix D.1.3 Probabilistic Assessment Results
Cumulative frequency of a vessel anchor strike across each cable was calculated and the
return period determined. It should be noted that an acceptable level of risk has not yet been
agreed between all stakeholders hence hazard return periods have been detailed in the table

NorthConnect
Cable Burial Risk Assessment
C831R01 Issue 04
18/05/18
below in relation to increased burial depth. The cable route has been split into encountered
shallow geology and expected type of vessel. The most onerous types of vessel to cross the
cable route are those of high DWT e.g. the section of the cable where the shipping lane with
frequent Cargo/ Bulk Carrier traffic or the areas with large oil tankers crossing. The return periods
need to be considered differently for sand and low strength clay for the following reasons:
➢ Anchor drag length in low strength clay is greater resulting in a larger area of
influence around the cable.
➢ Anchors can penetrate deeper into low strength clay and so are more likely to be
able to reach and damage the cable at a given depth.
The return periods for each individual cable section are detailed in the CBRA table in Appendix
B, an example of one zone (zone 21) is shown in Table D.3. During the workshop with
NorthConnect KS in Oslo, protection levels were preliminarily outlined for the route, drawn from
the outcomes of the threatline assessments. These provide a framework that specifies a
minimum acceptable burial depth from the chosen contractor (short sections only, case by
case basis), as well as a target burial depth. Independent of this, in the CBRA recommendations
are made for the absolute minimum depth of lowering to protect from the threatline posed by
fishing alone, accounting for an allowance mobile sediments where encountered (large ripples
or smaller in size, a different strategy is advised for larger bedforms). As discussed earlier in this
report, this provides a level of protection such that the residual risk from accidental/emergency
anchoring is deemed to be low.
In the example given in Table D.3 below, the change in anchor strike return period with
increased burial is relatively small until between 3 and 4m depth. This is because the most
common vessel size is the 1000 to 10 000Te DWT range. An accidental anchor deployment with
an estimated weight of 2400kg for a 10 000Te vessel would be expected to penetrate 3.08m
into the soft clay. A degree of conservatism is incorporated, as, for the purposes of the
calculation all vessels within the 1000 to 10 000Te class are assumed to be carrying anchors of
a size suitable for the upper-bound of the class (10 000Te vessel), whereas an estimated anchor
for a 1000Te DWT vessel (524kg) would be estimated to penetrate 1.86m into the seabed. The
risks in this section are considered low according to the probabilistic assessment, and to
completely protect against the most common class of vessel would require burial >3m.

NorthConnect
Cable Burial Risk Assessment
C831R01 Issue 04
18/05/18
Table D.3: Probabilistic Assessment Return Period Summary: Example shipping zone
21
Cable Burial Depth
(m)
Hazard Return Period (years,
nearest 1000)
0 53000
0.25 53000
0.5 53000
0.75 53000
1 53000
1.5 56000
2 65000
3 65000
4 >100000
5 >100000

NorthConnect
Cable Burial Risk Assessment
C831R01 Issue 04
18/05/18
Appendix E – Shipping Drawings

NorthConnect
Cable Burial Risk Assessment
C831R01 Issue 04
18/05/18
Appendix F – Alignment Charts
Alignment charts are supplied in a separate file.


![MeyGen EIA Scoping Document [DRAFT] - Marine Scotlandmarine.gov.scot/datafiles/lot/Meygen/MeyGen_Offshore_Tidal_Array_SoS_Scoping_Opinion...MeyGen Phase 1 EIA Scoping Document MEYGEN-ER-002-EIA](https://img.pdfslide.net/doc/110x75/5e7ebfe8a85be0141b417522/meygen-eia-scoping-document-draft-marine-meygen-phase-1-eia-scoping-document.jpg)