Embed Size (px)
Citation preview
Caffeine Occupancy of Human Cerebral A1
Adenosine Receptors: In Vivo Quantification with18F-CPFPX and PET
David Elmenhorst*1, Philipp T. Meyer*1,2, Andreas Matusch1, Oliver H. Winz1, and Andreas Bauer1,3
1Institute of Neuroscience and Medicine (INM-2), Forschungszentrum Jülich, Jülich, Germany; 2Department of Nuclear Medicine,University Hospital Freiburg, Freiburg, Germany; and 3Department of Neurology, Medical Faculty, Heinrich-Heine-UniversityDüsseldorf, Düsseldorf, Germany
Caffeine is the neuroactive agent in coffee and tea and is a broadlyconsumed stimulant. It is a nonselective antagonist of the neuro-modulator adenosine and, if applied in commonly consumeddoses, evokes its stimulating effects through the blockade ofadenosine receptors. 18F-8-cyclopentyl-3-(3-fluoropropyl)-1-propylxanthine (18F-CPFPX) has been established as a highly se-lective and affine PET ligand for the A1 adenosine receptor (A1AR).The objective of the present study was to visualize and quantify thein vivo occupancy of the human cerebral A1AR by caffeine using18F-CPFPX and PET. Methods: Fifteen subjects (age range, 24–68 y) underwent a 140-min bolus–plus–constant-infusion PET exper-iment after at least 36 h of caffeine abstinence. Metabolite-correctedblood data were used to calculate steady-state distribution volumes(VT) during the baseline condition of the scan between 70 and90min. Subsequently, subjects received a 10-min infusion of varyingconcentrations (0.5–4.3 mg/kg of body weight) of caffeine at 90 min.Occupancy VT of the A1AR was thereafter estimated using dataacquired between 120 and 140 min. Occupancy levels were calcu-lated using the Lassen plot, from which the inhibitory concentrationsof 50% were derived. Plasma levels of caffeine were determined atregular intervals. One subject received an intravenous vehicle as aplacebo.Results:Caffeine displaced 5%–44% of 18F-CPFPX bind-ing in a concentration-dependent manner. There was no changeof radioligand binding after the administration of placebo. Half-maximal displacement was achieved at a plasma caffeine concen-tration of 67 mM, which corresponds to 450 mg in a 70-kg subjector approximately 4.5 cups of coffee. Conclusion: Given a biologichalf-life of about 5 h, caffeine might therefore occupy up to 50% ofthe cerebral A1AR when caffeinated beverages are repeatedly con-sumed during a day. Furthermore, the present study providesevidence that 18F-CPFPX PET is suitable for studying the cerebralactions of caffeine, the most popular neurostimulant worldwide.
Key Words: caffeine; adenosine A1 receptor; CPFPX; positronemission tomography; human; brain
J Nucl Med 2012; 53:1723–1729DOI: 10.2967/jnumed.112.105114
Caffeine is the most commonly consumed psychoactivesubstance worldwide and an active ingredient in innumera-ble beverages and foods. Its neurobiologic effects comprisemainly stimulatory actions on alertness, attention (1), cogni-tive performance (2,3), and cerebral perfusion (4). It is knownto reduce sleepiness, to prolong sleep latency, and to enhancewake periods after sleep onset (5,6).
The consumption of approximately 3 cups of coffeecorresponds to an oral uptake of 5–8 mg of caffeine perkilogram of bodyweight (7), leading to plasma peak levelsof 8–10 mg/L (8,9). The plasma–to–cerebrospinal fluid(CSF) ratio was reported to be 1 for caffeine (10) at equi-librium conditions. CSF concentrations of caffeine willtherefore amount to approximately 50 mM (molar weightof caffeine, 194.19 g/mol) after intake of the aforemen-tioned dose of caffeine, which is frequently consumed ona daily basis.
The biologic actions of caffeine are generally assigned toits antagonizing effects at cerebral adenosine receptors.There are 4 different subtypes of adenosine receptors, ofwhich the A1 adenosine receptor (A1AR) has the mostabundant distribution and highest concentration in thehuman brain.
Genetic constitutional knockout animals for the differentadenosine receptors suggest that the psychostimulant andarousal effects are mainly mediated by the A2A adenosinereceptor (11–13). However, these data cannot readily beextrapolated to the human condition because there are sub-stantial interspecies differences with regard to the cerebraldistribution and concentration of adenosine receptor sub-types. In the human brain, the A1AR is the most abundantadenosine receptor. It is highly concentrated in human neo-cortical areas and shows an area- and layer-specific distributionpattern (14) that is strikingly different from its distribution inrodents (15).
The compound 8-cyclopentyl-3-(3-fluoropropyl)-1-pro-pylxanthine (CPFPX) (14,16) shows a high affinity forthe A1AR (dissociation constant, 1.26 nM in cloned humanreceptors) and a high selectivity (A2A adenosine receptoraffinity, 940 nM). It has been applied in autoradiographic in
Received Feb. 27, 2012; revision accepted May 31, 2012.For correspondence or reprints contact: David Elmenhorst, Institute of
Neuroscience and Medicine (INM-2), Forschungszentrum Jülich, 52425Jülich, Germany.E-mail: [email protected]*Contributed equally to this work.Published online Sep. 10, 2012.COPYRIGHT ª 2012 by the Society of Nuclear Medicine and Molecular
Imaging, Inc.
CAFFEINE OCCUPANCY OF A1 ADENOSINE RECEPTORS • Elmenhorst et al. 1723
by on January 6, 2019. For personal use only. jnm.snmjournals.org Downloaded from
vitro binding experiments in its tritiated form (3H-CPFPX)and in PET experiments as a radiofluorinated compound(18F-CPFPX) to determine A1AR densities in human, non-human primate, and rodent brain tissue. Another PET li-gand that has been successfully implemented and has beenextensively characterized in humans is the xanthine derivate11C-MPDX (17). Because 18F has a longer half-life than11C, 18F-CPFPX is especially suited for bolus–plus–constant-infusion studies with long scan durations.Various pharmacokinetic modeling approaches have been
validated (14,18), and the feasibility of in vivo displacementof 18F-CPFPX has been shown by an occupancy study withunlabeled CPFPX (19). The proposed models for quantifica-tion have a high test–retest reliability and stability (20).In a recent in vitro study, we measured the concentration
of caffeine that displaces 50% of the binding (inhibitoryconcentration of 50%, or IC50) of 3H-CPFPX to A1ARs inhuman postmortem brain tissue (21). The respective IC50
values were in the range of 113–170 mM, implying that theaforementioned commonly consumed doses of caffeine ledto an A1AR occupancy that was accessible in vivo using18F-CPFPX and PET. A preliminary PET study with ratsserved as a proof of principle (22).The objective of the present study was, therefore, to
quantify the in vivo occupancy of A1AR by caffeine in thehuman brain with a bolus–plus–constant-infusion paradigmusing 18F-CPFPX and PET.
MATERIALS AND METHODS
SubjectsAll procedures were approved by the Ethics Committee of the
Medical Faculty of the University of Duesseldorf, Germany, andthe German Federal Office for Radiation Protection. Male volunteers(n5 15; mean age, 27.46 3.5 y; age range, 20–34 y) participated inthis study after having given written informed consent. One subjectwas scanned twice; thus, a total of 16 displacement studies wereanalyzed. Volunteers were screened for a history of neurologicand psychiatric diseases, head injury, and alcohol or substanceabuse. With the exception of one subject on thyroxin and a sec-ond one on antihistaminic medication (fexofenadine), all sub-jects were without any acute or chronic medication. Caffeineintake was not allowed for at least 36 h before the subjectsunderwent PET. The chronic daily caffeine consumption wasassessed as a multiple of cups (0.15 L) of coffee per day (1 Lof caffeine-containing soft drinks was estimated to be equal to;1.5 cups of coffee (23)).
MRI AcquisitionTo exclude structural brain abnormalities and to define regions
of interest, individual high-resolution MRI datasets were acquired(Magnetom Vision, 1.5 T; Siemens) using a 3-dimensionalT1-weighted magnetization-prepared rapid-acquisition gradient-echo sequence (voxel size, 1 · 1 · 1 mm).
PET AcquisitionPET measurements were performed in 3-dimensional mode on
an ECAT EXACT HR1 scanner (Siemens-CTI) equipped witha circular lead shield to reduce scatter radiation from outside thefield of view (NeuroInsert; Siemens-CTI). Scanning took place
with the subjects supine in quiet ambience. The volunteers’ headswere immobilized in the canthomeatal orientation by a vacuumcushion or by customized head shells of polyurethane foam. A10-min 68Ge/68Ga transmission scan was acquired to correct forattenuation. Head positions were permanently monitored and, if nec-essary, manually corrected under guidance of a video system andreference skin marks.
A venous catheter in a forearm vein served for tracer application.Arterialized venous blood samples were drawn from a forearmvein contralateral to the injection side. The arm was warmed byheating pads to achieve sufficient arterialization (oxygen satura-tion . 80%).
Radiosynthesis and formulation of 18F-CPFPX were performedas previously described (16). The mean specific radioactivity was75.6 6 70 GBq/mmol at the start times of the scans.
18F-CPFPX PET was performed according to a bolus infusionschedule as previously described (18). Three slightly differentratios of bolus versus infusion (Kbol [time required for injectingthe dose of the bolus at a selected infusion rate]) were used:45 min (n 5 6), 48 min (n 5 7), and 61 min (n 5 3). The radio-ligand was diluted with sterile saline solution (0.9%) and filled intoa 50-mL syringe. A standard syringe pump was used for tracerapplication. Dynamic PET acquisition (140 min) in list mode beganwith the application of the 18F-CPFPX bolus.
Blood samples were collected at 15-s intervals for the first2 min; then at 3, 4, 5, 6, 8, and 10 min; and finally at 10-minintervals until 60 min and at 15-min intervals until 140 min. Anadditional blood sample was taken before 18F-CPFPX administra-tion, serving for the assessment of the caffeine plasma level.
List-mode data were framed into a dynamic sequence of 9 · 30,3 · 60, 3 · 150, and 25 · 300 s. Slices (n 5 63; thickness, 2.425mm; pixel size, 2 · 2 mm) were reconstructed per time frame byfiltered backprojection (Shepp filter, cutoff, 2.5 mm) after Fourierrebinning into 2-dimensional sinograms. Datasets were fully cor-rected for random coincidences, scatter radiation, and attenuation.The resolution of the reconstructed images varied between 4.1 mm(in full width at half maximum) in the center and 7.8 mm at 20 cmfrom the center. The sensitivity of the scanner for true events was5.7 cps/Bq/mL (24).
Metabolite AnalysisThe activity concentration of the whole blood and plasma (after
centrifugation of whole blood for 3 min at 1,000g) was quantified.The fraction of intact radioligand of total plasma activity wasdetermined as previously described (25).
Caffeine AdministrationCaffeine (Bedford Laboratories) was dissolved in 50 mL of
saline (vehicle) and applied with a standard syringe pump as shortintravenous infusions between 90 and 100 min. Caffeine concen-trations were determined before the start of scanning and addition-ally in all blood samples from the time of caffeine administrationonward. Plasma levels were assessed by high-performance liquidchromatography (in triplicate). Caffeine doses were initially in-creased in 1 mg/kg steps from 1 mg/kg to approximately 4 mg/kg.However, because the subjects in the upper dose range complainedabout mild to moderate dizziness and nausea, we did not pursuea further dose escalation. Instead, we attempted to cover theaforementioned dose range in approximately equally spaceddose steps (minor deviations from perfectly equal spacing arecaused by the use of a caffeine ampulla of a predefined dosage).
1724 THE JOURNAL OF NUCLEAR MEDICINE • Vol. 53 • No. 11 • November 2012
by on January 6, 2019. For personal use only. jnm.snmjournals.org Downloaded from
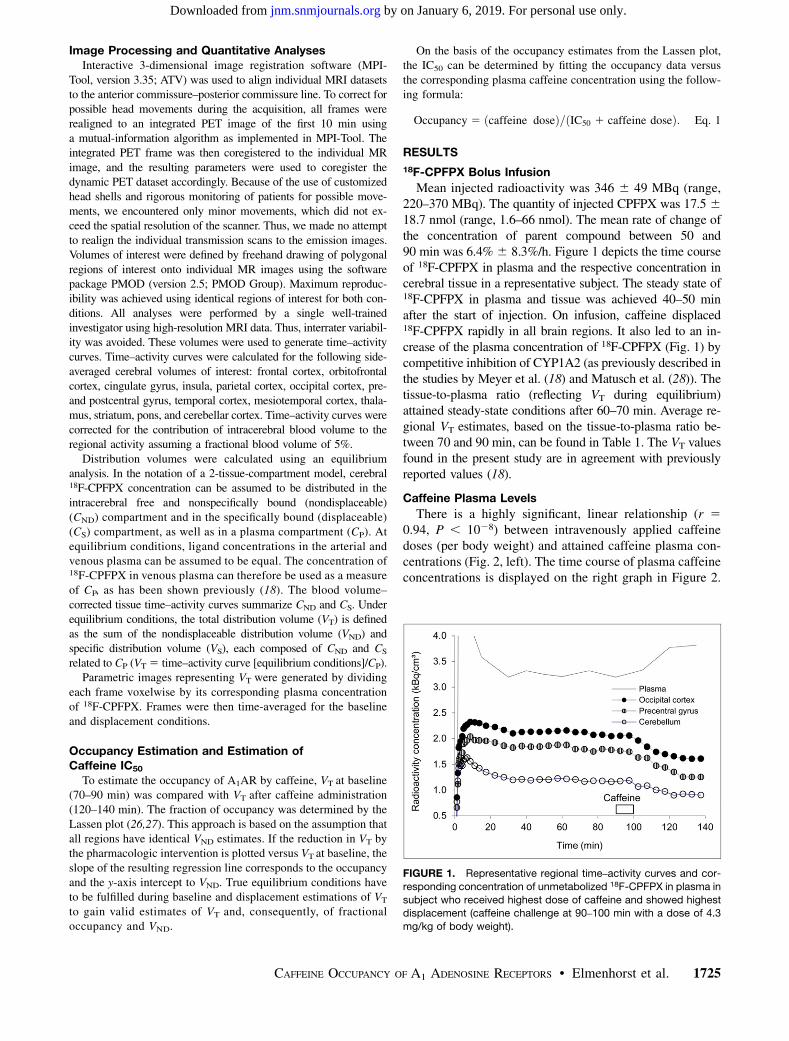
Image Processing and Quantitative AnalysesInteractive 3-dimensional image registration software (MPI-
Tool, version 3.35; ATV) was used to align individual MRI datasetsto the anterior commissure–posterior commissure line. To correct forpossible head movements during the acquisition, all frames wererealigned to an integrated PET image of the first 10 min usinga mutual-information algorithm as implemented in MPI-Tool. Theintegrated PET frame was then coregistered to the individual MRimage, and the resulting parameters were used to coregister thedynamic PET dataset accordingly. Because of the use of customizedhead shells and rigorous monitoring of patients for possible move-ments, we encountered only minor movements, which did not ex-ceed the spatial resolution of the scanner. Thus, we made no attemptto realign the individual transmission scans to the emission images.Volumes of interest were defined by freehand drawing of polygonalregions of interest onto individual MR images using the softwarepackage PMOD (version 2.5; PMOD Group). Maximum reproduc-ibility was achieved using identical regions of interest for both con-ditions. All analyses were performed by a single well-trainedinvestigator using high-resolution MRI data. Thus, interrater variabil-ity was avoided. These volumes were used to generate time–activitycurves. Time–activity curves were calculated for the following side-averaged cerebral volumes of interest: frontal cortex, orbitofrontalcortex, cingulate gyrus, insula, parietal cortex, occipital cortex, pre-and postcentral gyrus, temporal cortex, mesiotemporal cortex, thala-mus, striatum, pons, and cerebellar cortex. Time–activity curves werecorrected for the contribution of intracerebral blood volume to theregional activity assuming a fractional blood volume of 5%.
Distribution volumes were calculated using an equilibriumanalysis. In the notation of a 2-tissue-compartment model, cerebral18F-CPFPX concentration can be assumed to be distributed in theintracerebral free and nonspecifically bound (nondisplaceable)(CND) compartment and in the specifically bound (displaceable)(CS) compartment, as well as in a plasma compartment (CP). Atequilibrium conditions, ligand concentrations in the arterial andvenous plasma can be assumed to be equal. The concentration of18F-CPFPX in venous plasma can therefore be used as a measureof CP, as has been shown previously (18). The blood volume–corrected tissue time–activity curves summarize CND and CS. Underequilibrium conditions, the total distribution volume (VT) is definedas the sum of the nondisplaceable distribution volume (VND) andspecific distribution volume (VS), each composed of CND and CS
related to CP (VT 5 time–activity curve [equilibrium conditions]/CP).Parametric images representing VT were generated by dividing
each frame voxelwise by its corresponding plasma concentrationof 18F-CPFPX. Frames were then time-averaged for the baselineand displacement conditions.
Occupancy Estimation and Estimation ofCaffeine IC50
To estimate the occupancy of A1AR by caffeine, VT at baseline(70–90 min) was compared with VT after caffeine administration(120–140 min). The fraction of occupancy was determined by theLassen plot (26,27). This approach is based on the assumption thatall regions have identical VND estimates. If the reduction in VT bythe pharmacologic intervention is plotted versus VT at baseline, theslope of the resulting regression line corresponds to the occupancyand the y-axis intercept to VND. True equilibrium conditions haveto be fulfilled during baseline and displacement estimations of VT
to gain valid estimates of VT and, consequently, of fractionaloccupancy and VND.
On the basis of the occupancy estimates from the Lassen plot,the IC50 can be determined by fitting the occupancy data versusthe corresponding plasma caffeine concentration using the follow-ing formula:
Occupancy 5 ðcaffeine doseÞ=ðIC50 1 caffeine doseÞ: Eq. 1
RESULTS
18F-CPFPX Bolus Infusion
Mean injected radioactivity was 346 6 49 MBq (range,220–370 MBq). The quantity of injected CPFPX was 17.5 618.7 nmol (range, 1.6–66 nmol). The mean rate of change ofthe concentration of parent compound between 50 and90 min was 6.4% 6 8.3%/h. Figure 1 depicts the time courseof 18F-CPFPX in plasma and the respective concentration incerebral tissue in a representative subject. The steady state of18F-CPFPX in plasma and tissue was achieved 40–50 minafter the start of injection. On infusion, caffeine displaced18F-CPFPX rapidly in all brain regions. It also led to an in-crease of the plasma concentration of 18F-CPFPX (Fig. 1) bycompetitive inhibition of CYP1A2 (as previously described inthe studies by Meyer et al. (18) and Matusch et al. (28)). Thetissue-to-plasma ratio (reflecting VT during equilibrium)attained steady-state conditions after 60–70 min. Average re-gional VT estimates, based on the tissue-to-plasma ratio be-tween 70 and 90 min, can be found in Table 1. The VT valuesfound in the present study are in agreement with previouslyreported values (18).
Caffeine Plasma Levels
There is a highly significant, linear relationship (r 50.94, P , 1028) between intravenously applied caffeinedoses (per body weight) and attained caffeine plasma con-centrations (Fig. 2, left). The time course of plasma caffeineconcentrations is displayed on the right graph in Figure 2.
FIGURE 1. Representative regional time–activity curves and cor-
responding concentration of unmetabolized 18F-CPFPX in plasma in
subject who received highest dose of caffeine and showed highestdisplacement (caffeine challenge at 90–100 min with a dose of 4.3
mg/kg of body weight).
CAFFEINE OCCUPANCY OF A1 ADENOSINE RECEPTORS • Elmenhorst et al. 1725
by on January 6, 2019. For personal use only. jnm.snmjournals.org Downloaded from
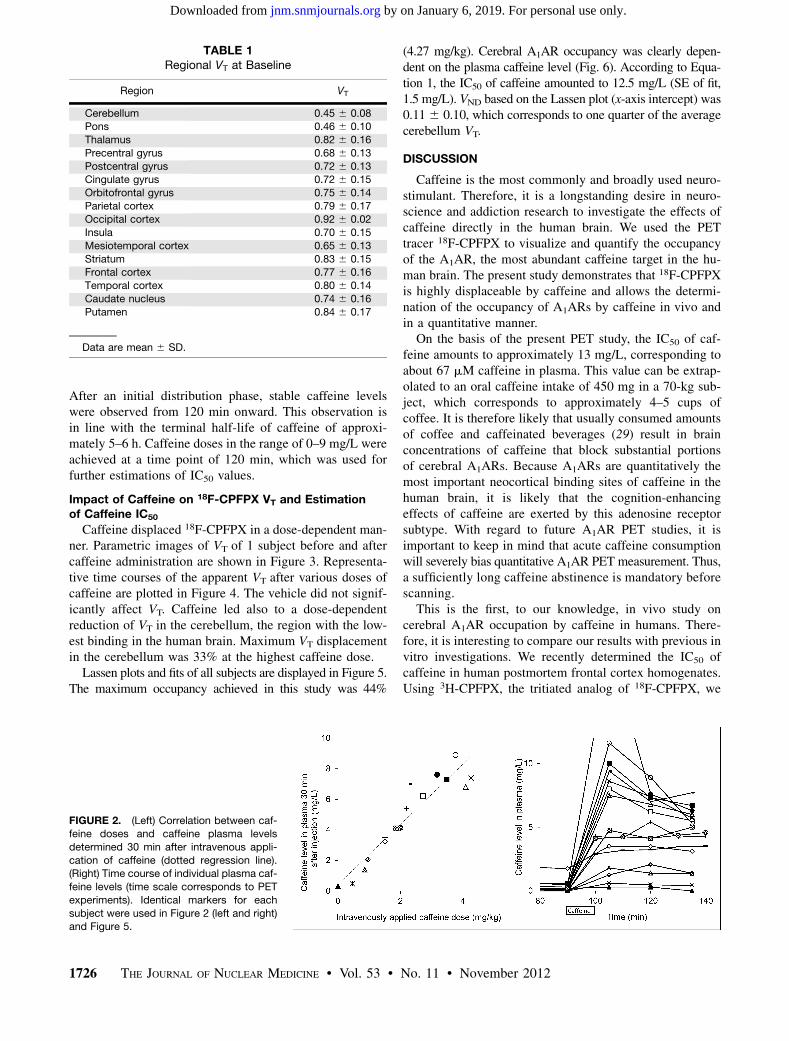
After an initial distribution phase, stable caffeine levelswere observed from 120 min onward. This observation isin line with the terminal half-life of caffeine of approxi-mately 5–6 h. Caffeine doses in the range of 0–9 mg/L wereachieved at a time point of 120 min, which was used forfurther estimations of IC50 values.
Impact of Caffeine on 18F-CPFPX VT and Estimationof Caffeine IC50
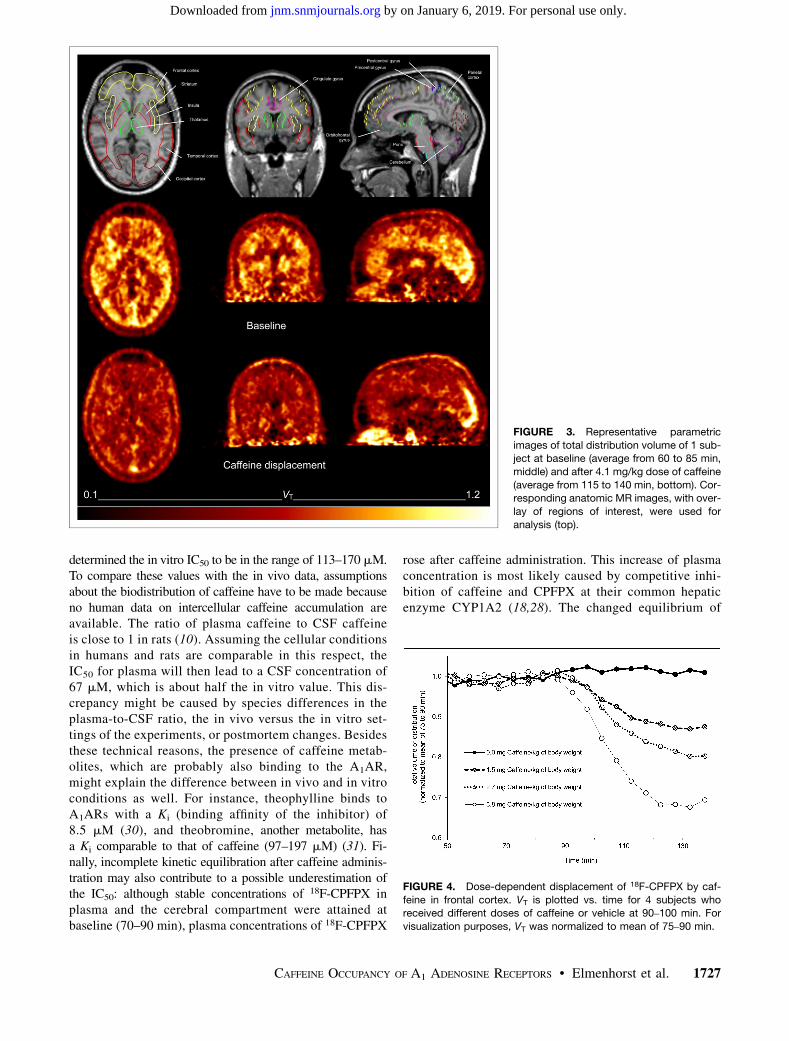
Caffeine displaced 18F-CPFPX in a dose-dependent man-ner. Parametric images of VT of 1 subject before and aftercaffeine administration are shown in Figure 3. Representa-tive time courses of the apparent VT after various doses ofcaffeine are plotted in Figure 4. The vehicle did not signif-icantly affect VT. Caffeine led also to a dose-dependentreduction of VT in the cerebellum, the region with the low-est binding in the human brain. Maximum VT displacementin the cerebellum was 33% at the highest caffeine dose.Lassen plots and fits of all subjects are displayed in Figure 5.
The maximum occupancy achieved in this study was 44%
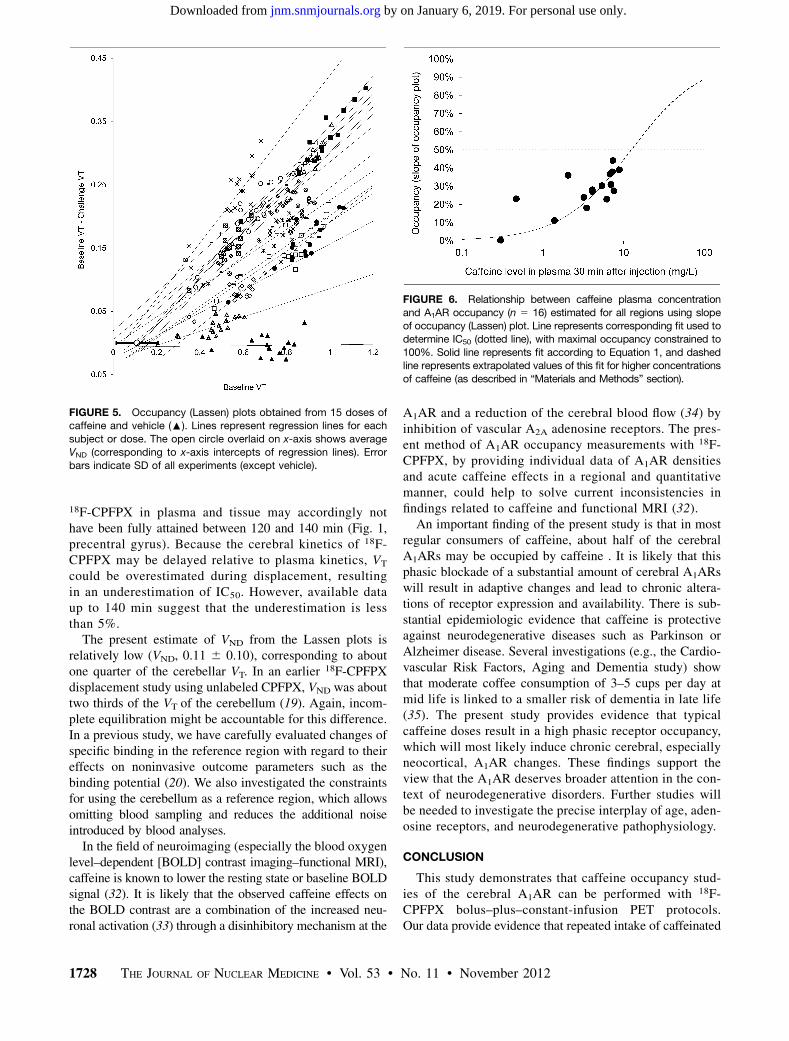
(4.27 mg/kg). Cerebral A1AR occupancy was clearly depen-dent on the plasma caffeine level (Fig. 6). According to Equa-tion 1, the IC50 of caffeine amounted to 12.5 mg/L (SE of fit,1.5 mg/L). VND based on the Lassen plot (x-axis intercept) was0.116 0.10, which corresponds to one quarter of the averagecerebellum VT.
DISCUSSION
Caffeine is the most commonly and broadly used neuro-stimulant. Therefore, it is a longstanding desire in neuro-science and addiction research to investigate the effects ofcaffeine directly in the human brain. We used the PETtracer 18F-CPFPX to visualize and quantify the occupancyof the A1AR, the most abundant caffeine target in the hu-man brain. The present study demonstrates that 18F-CPFPXis highly displaceable by caffeine and allows the determi-nation of the occupancy of A1ARs by caffeine in vivo andin a quantitative manner.
On the basis of the present PET study, the IC50 of caf-feine amounts to approximately 13 mg/L, corresponding toabout 67 mM caffeine in plasma. This value can be extrap-olated to an oral caffeine intake of 450 mg in a 70-kg sub-ject, which corresponds to approximately 4–5 cups ofcoffee. It is therefore likely that usually consumed amountsof coffee and caffeinated beverages (29) result in brainconcentrations of caffeine that block substantial portionsof cerebral A1ARs. Because A1ARs are quantitatively themost important neocortical binding sites of caffeine in thehuman brain, it is likely that the cognition-enhancingeffects of caffeine are exerted by this adenosine receptorsubtype. With regard to future A1AR PET studies, it isimportant to keep in mind that acute caffeine consumptionwill severely bias quantitative A1AR PET measurement. Thus,a sufficiently long caffeine abstinence is mandatory beforescanning.
This is the first, to our knowledge, in vivo study oncerebral A1AR occupation by caffeine in humans. There-fore, it is interesting to compare our results with previous invitro investigations. We recently determined the IC50 ofcaffeine in human postmortem frontal cortex homogenates.Using 3H-CPFPX, the tritiated analog of 18F-CPFPX, we
TABLE 1Regional VT at Baseline
Region VT
Cerebellum 0.45 6 0.08Pons 0.46 6 0.10
Thalamus 0.82 6 0.16
Precentral gyrus 0.68 6 0.13
Postcentral gyrus 0.72 6 0.13Cingulate gyrus 0.72 6 0.15
Orbitofrontal gyrus 0.75 6 0.14
Parietal cortex 0.79 6 0.17Occipital cortex 0.92 6 0.02
Insula 0.70 6 0.15
Mesiotemporal cortex 0.65 6 0.13
Striatum 0.83 6 0.15Frontal cortex 0.77 6 0.16
Temporal cortex 0.80 6 0.14
Caudate nucleus 0.74 6 0.16
Putamen 0.84 6 0.17
Data are mean 6 SD.
FIGURE 2. (Left) Correlation between caf-feine doses and caffeine plasma levels
determined 30 min after intravenous appli-
cation of caffeine (dotted regression line).(Right) Time course of individual plasma caf-
feine levels (time scale corresponds to PET
experiments). Identical markers for each
subject were used in Figure 2 (left and right)and Figure 5.
1726 THE JOURNAL OF NUCLEAR MEDICINE • Vol. 53 • No. 11 • November 2012
by on January 6, 2019. For personal use only. jnm.snmjournals.org Downloaded from
determined the in vitro IC50 to be in the range of 113–170 mM.To compare these values with the in vivo data, assumptionsabout the biodistribution of caffeine have to be made becauseno human data on intercellular caffeine accumulation areavailable. The ratio of plasma caffeine to CSF caffeineis close to 1 in rats (10). Assuming the cellular conditionsin humans and rats are comparable in this respect, theIC50 for plasma will then lead to a CSF concentration of67 mM, which is about half the in vitro value. This dis-crepancy might be caused by species differences in theplasma-to-CSF ratio, the in vivo versus the in vitro set-tings of the experiments, or postmortem changes. Besidesthese technical reasons, the presence of caffeine metab-olites, which are probably also binding to the A1AR,might explain the difference between in vivo and in vitroconditions as well. For instance, theophylline binds toA1ARs with a Ki (binding affinity of the inhibitor) of8.5 mM (30), and theobromine, another metabolite, hasa Ki comparable to that of caffeine (97–197 mM) (31). Fi-nally, incomplete kinetic equilibration after caffeine adminis-tration may also contribute to a possible underestimation ofthe IC50: although stable concentrations of 18F-CPFPX inplasma and the cerebral compartment were attained atbaseline (70–90 min), plasma concentrations of 18F-CPFPX
rose after caffeine administration. This increase of plasmaconcentration is most likely caused by competitive inhi-bition of caffeine and CPFPX at their common hepaticenzyme CYP1A2 (18,28). The changed equilibrium of
FIGURE 3. Representative parametric
images of total distribution volume of 1 sub-ject at baseline (average from 60 to 85 min,
middle) and after 4.1 mg/kg dose of caffeine
(average from 115 to 140 min, bottom). Cor-responding anatomic MR images, with over-
lay of regions of interest, were used for
analysis (top).
FIGURE 4. Dose-dependent displacement of 18F-CPFPX by caf-
feine in frontal cortex. VT is plotted vs. time for 4 subjects whoreceived different doses of caffeine or vehicle at 90–100 min. For
visualization purposes, VT was normalized to mean of 75–90 min.
CAFFEINE OCCUPANCY OF A1 ADENOSINE RECEPTORS • Elmenhorst et al. 1727
by on January 6, 2019. For personal use only. jnm.snmjournals.org Downloaded from
18F-CPFPX in plasma and tissue may accordingly nothave been fully attained between 120 and 140 min (Fig. 1,precentral gyrus). Because the cerebral kinetics of 18F-CPFPX may be delayed relative to plasma kinetics, VT
could be overestimated during displacement, resultingin an underestimation of IC50. However, available dataup to 140 min suggest that the underestimation is lessthan 5%.The present estimate of VND from the Lassen plots is
relatively low (VND, 0.11 6 0.10), corresponding to aboutone quarter of the cerebellar VT. In an earlier 18F-CPFPXdisplacement study using unlabeled CPFPX, VND was abouttwo thirds of the VT of the cerebellum (19). Again, incom-plete equilibration might be accountable for this difference.In a previous study, we have carefully evaluated changes ofspecific binding in the reference region with regard to theireffects on noninvasive outcome parameters such as thebinding potential (20). We also investigated the constraintsfor using the cerebellum as a reference region, which allowsomitting blood sampling and reduces the additional noiseintroduced by blood analyses.In the field of neuroimaging (especially the blood oxygen
level–dependent [BOLD] contrast imaging–functional MRI),caffeine is known to lower the resting state or baseline BOLDsignal (32). It is likely that the observed caffeine effects onthe BOLD contrast are a combination of the increased neu-ronal activation (33) through a disinhibitory mechanism at the
A1AR and a reduction of the cerebral blood flow (34) byinhibition of vascular A2A adenosine receptors. The pres-ent method of A1AR occupancy measurements with 18F-CPFPX, by providing individual data of A1AR densitiesand acute caffeine effects in a regional and quantitativemanner, could help to solve current inconsistencies infindings related to caffeine and functional MRI (32).
An important finding of the present study is that in mostregular consumers of caffeine, about half of the cerebralA1ARs may be occupied by caffeine . It is likely that thisphasic blockade of a substantial amount of cerebral A1ARswill result in adaptive changes and lead to chronic altera-tions of receptor expression and availability. There is sub-stantial epidemiologic evidence that caffeine is protectiveagainst neurodegenerative diseases such as Parkinson orAlzheimer disease. Several investigations (e.g., the Cardio-vascular Risk Factors, Aging and Dementia study) showthat moderate coffee consumption of 3–5 cups per day atmid life is linked to a smaller risk of dementia in late life(35). The present study provides evidence that typicalcaffeine doses result in a high phasic receptor occupancy,which will most likely induce chronic cerebral, especiallyneocortical, A1AR changes. These findings support theview that the A1AR deserves broader attention in the con-text of neurodegenerative disorders. Further studies willbe needed to investigate the precise interplay of age, aden-osine receptors, and neurodegenerative pathophysiology.
CONCLUSION
This study demonstrates that caffeine occupancy stud-ies of the cerebral A1AR can be performed with 18F-CPFPX bolus–plus–constant-infusion PET protocols.Our data provide evidence that repeated intake of caffeinated
FIGURE 5. Occupancy (Lassen) plots obtained from 15 doses ofcaffeine and vehicle (:). Lines represent regression lines for each
subject or dose. The open circle overlaid on x-axis shows average
VND (corresponding to x-axis intercepts of regression lines). Error
bars indicate SD of all experiments (except vehicle).
FIGURE 6. Relationship between caffeine plasma concentration
and A1AR occupancy (n 5 16) estimated for all regions using slopeof occupancy (Lassen) plot. Line represents corresponding fit used to
determine IC50 (dotted line), with maximal occupancy constrained to
100%. Solid line represents fit according to Equation 1, and dashedline represents extrapolated values of this fit for higher concentrations
of caffeine (as described in “Materials and Methods” section).
1728 THE JOURNAL OF NUCLEAR MEDICINE • Vol. 53 • No. 11 • November 2012
by on January 6, 2019. For personal use only. jnm.snmjournals.org Downloaded from
beverages results in a 50% occupancy of the cerebral A1ARduring longer periods of the day. 18F-CPFPX PET representsa valuable technique for studying the neurostimulant andchronic neuroplastic effects of caffeine in humans.
DISCLOSURE STATEMENT
The costs of publication of this article were defrayed inpart by the payment of page charges. Therefore, and solelyto indicate this fact, this article is hereby marked “adver-tisement” in accordance with 18 USC section 1734.
ACKNOWLEDGMENTS
We thank Dirk Bier, Marcus H. Holschbach, JürgenBurhenne, and Walter E. Haefeli for the determination ofplasma caffeine levels. We gratefully acknowledge MarleneVögeling, Lutz Tellmann, Elisabeth Theelen, SuzanneSchaden, Hans Herzog, and Markus Lang for excellent tech-nical assistance and Johannes Ermert, Silke Grafmüller,Bettina Palm, and Erika Wabbals for the synthesis of 18F-CPFPX. This work was supported by the Federal Ministryof Education and Research, Germany (FKZ01GP1002B).No other potential conflict of interest relevant to this articlewas reported.
REFERENCES
1. Brunyé TT, Mahoney CR, Lieberman HR, Taylor HA. Caffeine modulates at-
tention network function. Brain Cogn. 2010;72:181–188.
2. Suzuki F, Shimada J, Shiozaki S, et al. Adenosine A1 antagonists. 3. Structure-activity
relationships on amelioration against scopolamine- or N6-((R)-phenylisopropyl)
adenosine-induced cognitive disturbance. J Med Chem. 1993;36:2508–2518.
3. Prediger RD, Takahashi RN. Modulation of short-term social memory in rats by
adenosine A1 and A2A receptors. Neurosci Lett. 2005;376:160–165.
4. Chen Y, Parrish TB. Caffeine dose effect on activation-induced BOLD and CBF
responses. Neuroimage. 2009;46:577–583.
5. Landolt HP, Retey JV, Tonz K, et al. Caffeine attenuates waking and sleep
electroencephalographic markers of sleep homeostasis in humans. Neuropsycho-
pharmacology. 2004;29:1933–1939.
6. Landolt HP, Dijk DJ, Gaus SE, Borbely AA. Caffeine reduces low-frequency
delta activity in the human sleep EEG. Neuropsychopharmacology. 1995;12:229–238.
7. Blanchard J, Sawers SJ. The absolute bioavailability of caffeine in man. Eur J
Clin Pharmacol. 1983;24:93–98.
8. Arnaud MJ, Bracco I, Welsch C. Metabolism and distribution of labeled theoph-
ylline in the pregnant rat: impairment of theophylline metabolism by pregnancy
and absence of a blood-brain barrier in the fetus. Pediatr Res. 1982;16:167–171.
9. Bonati M, Latini R, Galletti F, Young JF, Tognoni G, Garattini S. Caffeine
disposition after oral doses. Clin Pharmacol Ther. 1982;32:98–106.
10. Liu X, Smith BJ, Chen C, et al. Evaluation of cerebrospinal fluid concentration
and plasma free concentration as a surrogate measurement for brain free con-
centration. Drug Metab Dispos. 2006;34:1443–1447.
11. Lazarus M, Shen HY, Cherasse Y, et al. Arousal effect of caffeine depends on
adenosine A2A receptors in the shell of the nucleus accumbens. J Neurosci.
2011;31:10067–10075.
12. Chen JF, Yu L, Shen HY, He JC, Wang X, Zheng R. What knock-out animals tell
us about the effects of caffeine. J Alzheimers Dis. 2010;20(suppl 1):S17–S24.
13. Huang ZL, Qu WM, Eguchi N, et al. Adenosine A2A, but not A1, receptors
mediate the arousal effect of caffeine. Nat Neurosci. 2005;8:858–859.
14. Bauer A, Holschbach MH, Meyer PT, et al. In vivo imaging of adenosine A1
receptors in the human brain with [18F]CPFPX and positron emission tomogra-
phy. Neuroimage. 2003;19:1760–1769.
15. Bauer A, Holschbach MH, Cremer M, et al. Evaluation of 18F-CPFPX, a novel
adenosine A1 receptor ligand: in vitro autoradiography and high-resolution small
animal PET. J Nucl Med. 2003;44:1682–1689.
16. Holschbach MH, Olsson RA, Bier D, et al. Synthesis and evaluation of no-
carrier-added 8-cyclopentyl-3-(3-[18F]fluoropropyl)-1-propylxanthine ([18F]
CPFPX): a potent and selective A1-adenosine receptor antagonist for in vivo
imaging. J Med Chem. 2002;45:5150–5156.
17. Fukumitsu N, Ishii K, Kimura Y, et al. Imaging of adenosine A1 receptors in the
human brain by positron emission tomography with [11C]MPDX. Ann Nucl Med.
2003;17:511–515.
18. Meyer PT, Elmenhorst D, Bier D, et al. Quantification of cerebral A1 adenosine
receptors in humans using [18F]CPFPX and PET: an equilibrium approach. Neu-
roimage. 2005;24:1192–1204.
19. Meyer PT, Elmenhorst D, Matusch A, Winz O, Zilles K, Bauer A. A1 adenosine
receptor PET using [18F]CPFPX: displacement studies in humans. Neuroimage.
2006;32:1100–1105.
20. Elmenhorst D, Meyer PT, Matusch A, Winz OH, Zilles K, Bauer A. Test-retest
stability of cerebral A1 adenosine receptor quantification using [18F]CPFPX and
PET. Eur J Nucl Med Mol Imaging. 2007;34:1061–1070.
21. Elmenhorst D, Garibotto V, Prescher A, Bauer A. Adenosine A1 receptors in
human brain and transfected CHO cells: inhibition of [3H]CPFPX binding by
adenosine and caffeine. Neurosci Lett. 2011;487:415–420.
22. Meyer PT, Bier D, Holschbach MH, Cremer M, Tellmann L, Bauer A. Image of
the month: in vivo imaging of rat brain A1 adenosine receptor occupancy by
caffeine. Eur J Nucl Med Mol Imaging. 2003;30:1440.
23. Mandel HG. Update on caffeine consumption, disposition and action. Food
Chem Toxicol. 2002;40:1231–1234.
24. Brix G, Zaers J, Adam LE, et al. Performance evaluation of a whole-body PET
scanner using the NEMA protocol. National Electrical Manufacturers Associa-
tion. J Nucl Med. 1997;38:1614–1623.
25. Meyer PT, Bier D, Holschbach MH, et al. Quantification of cerebral A1 aden-
osine receptors in humans using [18F]CPFPX and PET. J Cereb Blood Flow
Metab. 2004;24:323–333.
26. Cunningham VJ, Rabiner EA, Slifstein M, Laruelle M, Gunn RN. Measuring
drug occupancy in the absence of a reference region: the Lassen plot re-visited.
J Cereb Blood Flow Metab. 2010;30:46–50.
27. Lassen NA, Bartenstein PA, Lammertsma AA, et al. Benzodiazepine receptor
quantification in vivo in humans using [11C]flumazenil and PET: application of
the steady-state principle. J Cereb Blood Flow Metab. 1995;15:152–165.
28. Matusch A, Meyer PT, Bier D, et al. Metabolism of the A1 adenosine receptor
PET ligand [18F]CPFPX by CYP1A2: implications for bolus/infusion PET stud-
ies. Nucl Med Biol. 2006;33:891–898.
29. Fredholm BB, Battig K, Holmen J, Nehlig A, Zvartau EE. Actions of caffeine in
the brain with special reference to factors that contribute to its widespread use.
Pharmacol Rev. 1999;51:83–133.
30. Bruns RF, Lu GH, Pugsley TA. Characterization of the A2 adenosine receptor
labeled by [3H]NECA in rat striatal membranes. Mol Pharmacol. 1986;
29:331–346.
31. Fredholm BB, Lindstrom K. Autoradiographic comparison of the potency of
several structurally unrelated adenosine receptor antagonists at adenosine A1
and A(2A) receptors. Eur J Pharmacol. 1999;380:197–202.
32. Laurienti PJ, Field AS, Burdette JH, Maldjian JA, Yen YF, Moody DM. Re-
lationship between caffeine-induced changes in resting cerebral perfusion and
blood oxygenation level-dependent signal. AJNR. 2003;24:1607–1611.
33. Koppelstaetter F, Poeppel TD, Siedentopf CM, et al. Does caffeine modulate verbal
working memory processes? An fMRI study. Neuroimage. 2008;39:492–499.
34. Chen Y, Parrish TB. Caffeine’s effects on cerebrovascular reactivity and
coupling between cerebral blood flow and oxygen metabolism. Neuroimage.
2009;44:647–652.
35. Santos C, Costa J, Santos J, Vaz-Carneiro A, Lunet N. Caffeine intake and
dementia: systematic review and meta-analysis. J Alzheimers Dis. 2010;20(suppl
1):S187–S204.
CAFFEINE OCCUPANCY OF A1 ADENOSINE RECEPTORS • Elmenhorst et al. 1729
by on January 6, 2019. For personal use only. jnm.snmjournals.org Downloaded from
Doi: 10.2967/jnumed.112.105114Published online: September 10, 2012.
2012;53:1723-1729.J Nucl Med. David Elmenhorst, Philipp T. Meyer, Andreas Matusch, Oliver H. Winz and Andreas Bauer
F-CPFPX and PET18Quantification with Adenosine Receptors: In Vivo1Caffeine Occupancy of Human Cerebral A
http://jnm.snmjournals.org/content/53/11/1723This article and updated information are available at:
http://jnm.snmjournals.org/site/subscriptions/online.xhtml
Information about subscriptions to JNM can be found at:
http://jnm.snmjournals.org/site/misc/permission.xhtmlInformation about reproducing figures, tables, or other portions of this article can be found online at:
(Print ISSN: 0161-5505, Online ISSN: 2159-662X)1850 Samuel Morse Drive, Reston, VA 20190.SNMMI | Society of Nuclear Medicine and Molecular Imaging
is published monthly.The Journal of Nuclear Medicine
© Copyright 2012 SNMMI; all rights reserved.
by on January 6, 2019. For personal use only. jnm.snmjournals.org Downloaded from