Embed Size (px)
Citation preview
City of BostonMassachusetts
Comprehensive Annual Financial Report
Fiscal Year Ended June 30, 2016
Martin J. Walsh, Mayor
David Sweeney, Chief Financial Officer & Collector Treasurer
Sally D. Glora, City Auditor

Prepared by the City of Boston Auditing Department
Table of Contents
Page
INTRODUCTORY SECTION (Unaudited)Transmittal Letter ..................................................................................................................................................
GFOA Certificate of Achievement ..........................................................................................................................
Organizational Chart of City Government ..............................................................................................................
List of Elected and Appointed Officials ..................................................................................................................
Organizational Chart of Auditing Department .......................................................................................................
List of Auditing Department Personnel ..................................................................................................................
FINANCIAL SECTIONIndependent Auditors’ Report ...............................................................................................................................
Management’s Discussion and Analysis (Unaudited) .............................................................................................
Basic Financial Statements:
Government-wide Financial Statements
Statement of Net Position .....................................................................................................................................
Statement of Activities ..........................................................................................................................................
Fund Financial Statements
Balance Sheet – Governmental Funds ...................................................................................................................
Reconciliation of the Balance Sheet of the Governmental Funds to the Statement of Net Position......................
Statement of Revenues, Expenditures, and Changes in Fund Balances – Governmental Funds .........................................................................................................................................
Reconciliation of the Statement of Revenues, Expenditures, and Changes in Fund Balance of Governmental Funds to the Statement of Activities .....................................................................................
Statement of Revenues and Expenditures – Budgetary Basis, General Fund – Budget and Actual .............................................................................................................................................
Statement of Net Position – Proprietary Fund .......................................................................................................
Statement of Revenues, Expenses, and Changes in Net Position – Proprietary Fund ............................................
Statement of Cash Flows – Proprietary Fund .........................................................................................................
Statement of Fiduciary Net Position – Fiduciary Funds ..........................................................................................
Statement of Changes in Fiduciary Net Position – Fiduciary Funds .......................................................................
Notes to the Basic Financial Statements .............................................................................................
Required Supplementary Information (Unaudited):
Schedules of Funding Progress – Other Postemployment Benefits .......................................................................
Schedules of Employer Contributions – Other Postemployment Benefits .............................................................
Schedule of City’s Proportionate Share of the Net Pension Liability – BostonRetirement System ................................................................................................................................................
Schedule of City’s Contributions – Boston Retirement System ..............................................................................
Combining, Individual Fund Statements and Schedules:General Fund
Fund Description ...................................................................................................................................................
Comparative Balance Sheets .................................................................................................................................
i
ix
x
xii
xiii
xiv
1
4
17
18
20
21
22
23
24
25
26
27
28
29
30
69
69
70
70
72
74
Page
Comparative Statements of Revenues, Expenditures and Changes in Fund Balance .............................................................................................................................................................
Schedule of Revenues and Other Financing Sources Compared to Budget ............................................................
Schedule of Expenditures Compared to Budget ....................................................................................................
Special Revenue Fund
Fund Description ...................................................................................................................................................
Comparative Balance Sheets .................................................................................................................................
Comparative Statements of Revenues, Expenditures, and Changes in Fund Balance .............................................................................................................................................................
Capital Projects Fund
Fund Description ...................................................................................................................................................
Comparative Balance Sheets .................................................................................................................................
Comparative Statements of Revenues, Expenditures, and Changes in Fund Balance .............................................................................................................................................................
Other Governmental Funds
Funds Descriptions ................................................................................................................................................
Combining Balance Sheet ......................................................................................................................................
Combining Statement of Revenues, Expenditures, and Changes in Fund Balance .................................................
Internal Service Fund
Fund Description ...................................................................................................................................................
Comparative Statements of Net Position ...............................................................................................................
Comparative Statements of Revenues, Expenses, and Changes in Net Position ....................................................
Comparative Statements of Cash Flows .................................................................................................................
Fiduciary Funds
Funds Descriptions ................................................................................................................................................
Comparative Statements of Plan Net Position – Boston Retirement System .........................................................
Comparative Statements of Plan Net Position – OPEB Trust Fund .........................................................................
Combining Statements of Net Position – Private Purpose Trust Funds ..................................................................
Comparative Statements of Net Position – Agency Fund .......................................................................................
Comparative Statements of Changes in Plan Net Position – Boston Retirement System.......................................
Comparative Statements of Changes in Plan Net Position – OPEB Trust Fund.......................................................
Combining Statements of Changes in Net Position – Private Purpose Trust Funds................................................
Statement of Changes in Assets and Liabilities – Agency Fund ..............................................................................
Discretely Presented Component Units
Discretely Presented Component Units Description ..............................................................................................
Combining Statements of Net Position ..................................................................................................................
Combining Statements of Activities .......................................................................................................................
75
76
79
82
84
85
86
88
89
90
92
93
94
96
97
98
100
102
103
104
106
107
108
109
112
114
116
118
Page
STATISTICAL SECTION (Unaudited)
Statistical Section Overview ...................................................................................................................................
General Government Expenditures by Function (GAAP Basis) ...............................................................................
General Government Revenues by Source (GAAP Basis) .......................................................................................
Net Position by Component ...................................................................................................................................
Changes in Net Position .........................................................................................................................................
Fund Balances of Governmental Funds .................................................................................................................
Changes in Fund Balances of Governmental Funds ...............................................................................................
Assessed and Estimated Actual Value of All Taxable Property ...............................................................................
Property Tax Rates – Direct and Overlapping Governments ..................................................................................
Largest Principal Taxpayers ....................................................................................................................................
Property Tax Levies and Collections .......................................................................................................................
Ratios of Outstanding Debt by Type ......................................................................................................................
Ratios of Net General Obligation Bonded Debt to Assessed Value and Net Bonded Debt per Capita ..........................................................................................................................................................
Legal Debt Margin Information ..............................................................................................................................
Demographic and Economic Statistics ...................................................................................................................
Principal Employers ...............................................................................................................................................
Full-Time Equivalent City Government Employees by Department .......................................................................
Operating Indicators by Function ..........................................................................................................................
Capital Asset Statistics by Department ..................................................................................................................
120
122
124
126
128
132
134
136
137
138
139
140
142
144
146
147
148
150
152

(This page intentionally left blank)
December 29, 2016
The Honorable Mayor,
Members of the City Council,
and Citizens of Boston:
We are pleased to submit to you the Comprehensive Annual Financial Report (CAFR) of the City of
Boston (City) for the fiscal year ended June 30, 2016. The CAFR is prepared by the City’s Auditing Department,
and is intended to provide information regarding the financial position of the City. This report is prepared
in accordance with U.S. generally accepted accounting principles (GAAP), as established by the
Governmental Accounting Standards Board (GASB), and meets all requirements of state finance law of the
Commonwealth of Massachusetts, as well as the City Charter.
The responsibility for the accuracy, completeness, and fairness of the data presented, including
disclosures, rests with the City. City management believes this report is accurate in all material respects
and is presented in a manner which fairly sets forth the financial position and results of operations of the
City. Management is also responsible for establishing and maintaining internal accounting controls designed
to provide reasonable, but not absolute, assurance that these financial statements are complete and
accurate in their presentation.
The Auditing Department uses an integrated financial and human resources management system
referred to as the Boston Administrative Information System (BAIS). The system is designed to track and
control daily activities and report the financial position of the City. This cutting edge software allows
management to directly evaluate the financial status of individual programs as well as the entire department,
and also supports the rigorous monitoring and reporting requirements enforced by the City.
The Commonwealth of Massachusetts, through Chapter 190 of the Acts of 1982, requires that the City
undergo an annual audit performed by a firm of independent public accountants. The City has selected
KPMG LLP to perform the June 30, 2016 audit. This audit is conducted in accordance with generally accepted
government auditing standards (GAGAS) issued by the Comptroller General of the United States. The audit
provides an independent review to help assure a fair presentation of the City’s financial position and results
of operations.
The City also undergoes an annual audit of its federal grant funds as required by Title 2 U.S. Code of
Federal Regulations Part 200, Uniform Administrative Requirements, Cost Principles, and Audit
Requirements for Federal Awards (Uniform Guidance). KPMG LLP issues separate reports on the City’s
ii • City of Boston Comprehensive Annual Financial Report
internal control systems and compliance with applicable laws and regulations that meet the requirements
of the Uniform Guidance. A substantial focus of the Single Audit is to evaluate the City’s internal control
structure. The evaluation includes testing a significant number of the major federal program transactions
that occurred during the fiscal year. The Single Audit also requires that the auditors determine whether the
organization has complied with laws and regulations that may have a material effect on each of its major
federal financial assistance programs. All of the City’s major federal programs are evaluated for the adequacy
of internal controls and compliance with laws and regulations. The report is publicly issued under a separate
cover.
Management’s Discussion and Analysis (MD&A) follows the independent auditors’ report and provides
a narrative introduction, overview, and analysis to accompany the basic financial statements. This letter of
transmittal is intended to complement the MD&A and should be read in conjunction with it.
Introductory Section • iii
Profile of the Government
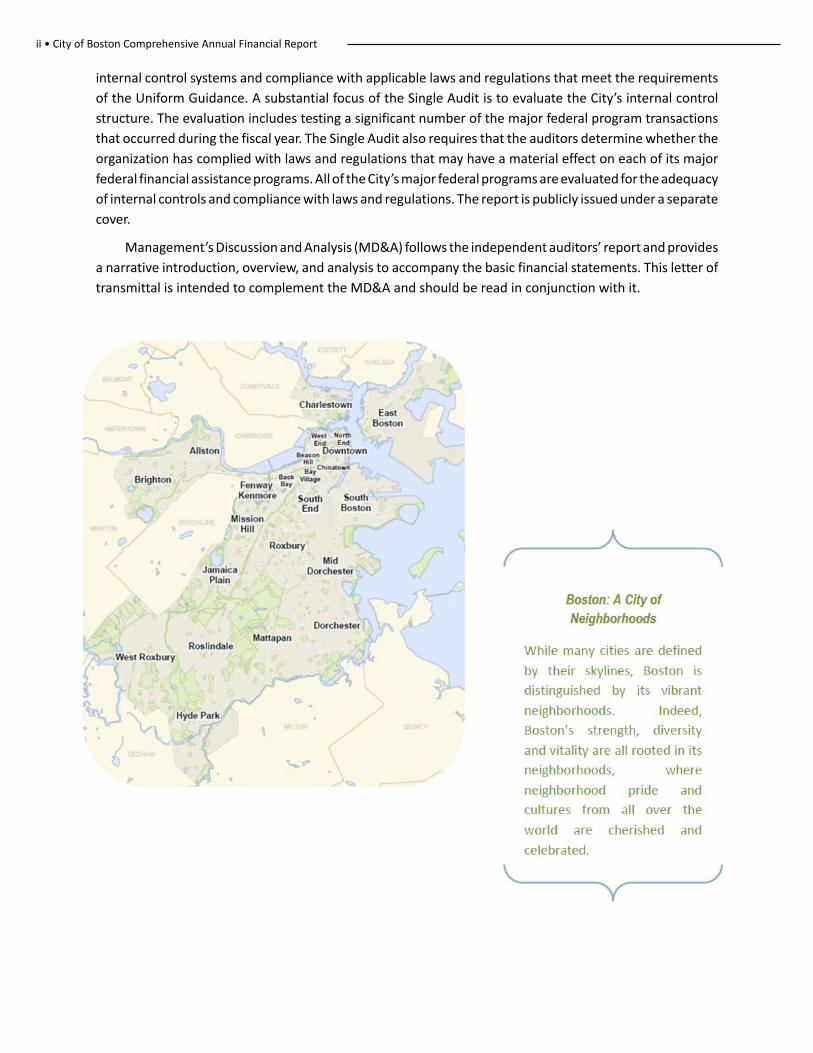
The City of Boston, incorporated as a town in 1630 and as a City in 1822, is located on the Shawmut
Peninsula, at the confluence of the Charles and Mystic Rivers. The City lies adjacent to Boston Harbor, which
is a part of Massachusetts Bay and leads ultimately to the North Atlantic Ocean. The Charles River separates
Boston from Cambridge and Watertown, while the Mystic River determines the boundaries between
Chelsea and Everett. The Neponset River separates the southern neighborhoods of Boston from the Town
of Milton and City of Quincy.
The City of Boston exists under Chapter 486 of the Acts of 1909 and Chapter 452 of the Acts of 1948
of the Commonwealth of Massachusetts, which, as amended, constitute the City’s Charter. The Mayor is
elected to a four-year term and serves as chief executive officer of the City. The Mayor has general
supervision of and control over the City’s boards, commissions, officers and departments. The legislative
body of the City is the City Council, which consists of 13 elected members serving two-year terms.
The City’s Mayor, Martin J. Walsh, was elected to serve a 4 year-term from January 2014 through
January 2018 and was sworn in on January 6, 2014 as the City’s 54th Mayor. Prior to his service as Mayor,
Mayor Walsh was a member of the Massachusetts House of Representatives, serving as the State
Representative from the Thirteenth Suffolk District from 1997 through 2013. Mayor Walsh continues to
work tirelessly towards making Boston a city where everyone has the opportunity to succeed. He has
identified five key priorities that build upon Boston’s strengths while bringing the City into the future. The
key priorities are; strengthening the economy, improving public safety and combating gun violence, ensuring
that Boston Public Schools enable every child to succeed, increasing accessibility and transparency in city
government, and serving all of Boston’s neighborhoods and residents.
The City budgets and maintains its books and records on a statutory basis of accounting prescribed by
the Massachusetts Division of Local Services, Bureau of Accounts. This basis of accounting differs from
GAAP. The accounts of the City are organized on a fund basis. Each fund is considered to be a separate
accounting entity. The operations of each fund are accounted for by providing a separate set of self-balancing
accounts, which comprise each fund’s assets, liabilities, fund balance, revenues, and expenses.
The General Fund is the only fund for which a budget is legally adopted. The budgets for all departments
included in the General Fund of the City, except the School Department, are prepared under the direction
of the Mayor and City Council. Departmental budgets are established at the account level and so voted by
the City Council. The School Department budget is prepared under the direction of the School Committee.
Original and supplemental appropriations are submitted by the Mayor, approved by the City Council, and
lapse at year end unless encumbered. The legal level of control over appropriations is at the department
level. Amendments to the original budget must be approved by the City Council, except for a reallocation
of appropriations of up to $3.0 million, which the Mayor may approve. Further, the City Auditor, with the
approval of the Mayor, may make transfers from any appropriation to any other appropriation for purposes
of eliminating deficits before closing the books for the fiscal year.
Included in the basic financial statements, which are prepared on the GAAP basis of accounting, are
governmental activities, each major fund, the aggregate discretely presented component units, and
iv • City of Boston Comprehensive Annual Financial Report
aggregate remaining fund information. Discretely presented component units are reported in a separate
column to emphasize their operational and/or financial relationship with the City. The Boston Retirement
System (BRS) has been presented as a blended component unit because it provides services almost
exclusively to the primary government. The Dudley Square Realty Corporation (DSRC) and the Ferdinand
Building Development Corporation (FBDC) are also presented as blended component units for the same
reason. The Notes to the Financial Statements further discuss the City’s financial reporting entity.
Local Economy
As the economic hub of both the Commonwealth of Massachusetts and the New England region,
Boston is a center for professional, financial, higher educational and medical services, and the focus of
tourist and convention travel in New England.
In 2015, Boston had a population of 669,469 as reported by the U.S. Census Bureau, and 718,500 jobs,
as stated by the 2014 U.S. Bureau of Economic Analysis and the Massachusetts Executive Office of Labor
and Workforce Development The ratio of jobs to population indicates that the City provides a direct source
of employment and income for an area that extends well beyond its borders. The City accounts for
approximately 16.2% of the all jobs in the Commonwealth of Massachusetts.
As a government center, the City is the capital of the Commonwealth and is host to several other
governmental agencies. According to the Boston Planning & Development Agency (formerly known as the
Boston Redevelopment Authority), there were an estimated 76,602 federal, state, and local government
workers in the City in 2014. Certain large state government offices, federal regional offices, U.S. Postal
Service facilities, state-chartered authorities and commissions (such as the Massachusetts Port Authority
and the Boston Water and Sewer Commission), and the City’s local government agencies and departments
are all located within the City.
Boston’s medical and educational institutions are an important component of its economy, providing
employment opportunities for residents of the City and Metropolitan Boston. Expenditures by these
institutions as well as their employees, patients, students, and visitors are important to the City’s trade and
service sectors. Twenty-one inpatient hospitals are located within the City, including Massachusetts General
Hospital, Brigham and Women’s Hospital, Beth Israel Deaconess Medical Center, Boston Children’s Hospital,
Tufts New England Medical Center, and Boston Medical Center. The City is also the home of the medical
and dental schools of Harvard, Tufts, and Boston Universities. In 2014, there were an estimated 133,700
jobs, or one in five of all Boston jobs, employed in health services in the City. Thirty-five colleges and
universities reside in Boston, accounting for over 137,000 students, according to the City's University
Accountability Ordinance and Department of Neighborhood Development.
Boston's economy, on average, outperformed both Massachusetts and the nation in terms of job
growth from 2005 through 2014. During that period Boston's annual job growth was 1.4%. Following the
start of the Great Recession in December 2007, the national economy began to experience rising
unemployment and deteriorating economic conditions. In late 2008, Boston's economy began to show signs
of a weakening labor market, and economic conditions worsened from late 2008 until February 2010, when
positive job growth returned. Payroll jobs grew in Boston at an average annual rate of 1.8% from 2010
through 2014, exceeding the national recovery. Boston's unemployment rate for 2015 was 4.4%, which was
almost half a percentage point less than the national rate.
Introductory Section • v
Financial markets have continued to express confidence in Boston’s fiscal health during the past year.
In March 2016, the rating service bureaus Moody’s Investors Service and Standard and Poor’s reaffirmed
the City’s bond ratings at Aaa and AAA respectively. The credit reports from both agencies highlighted
Boston’s strong management throughout economic cycles as well as having historically strong reserves
while exhibiting positive financial performance.
Financial Overview
In fiscal year 2016, the GAAP General Fund equity increased to $949.0 million, thus allowing the City
to preserve its policy of maintaining a GAAP unassigned fund balance in the General Fund that is 15% or
higher than the current fiscal year’s GAAP General Fund operating expenditures. The GAAP unassigned
fund balance at the end of fiscal year 2016 was $682.8 million and $266.2 million was assigned. The
unassigned fund balance represents approximately 23.0% of GAAP General Fund operating expenditures.
The City is required to have a balanced budget in accordance with Massachusetts General Laws (M.G.L.),
Chapter 59, Section 23. As part of the State Department of Revenue’s tax rate certification process, the City
must balance all appropriations, fixed costs, and prior year deficits with the approved property tax levy,
estimated local revenues, and available prior year surpluses in order to obtain authorization to issue
property tax bills. Over two-thirds of the City’s revenues come from the property tax levy; however, the
increase in the levy from year to year is limited by state law.
The City’s second largest source of revenue, state aid, increased by $8.2 million in fiscal year 2016. In
fiscal year 2017, net state aid is expected to decrease by 2.2%. Grant awards from the federal government
and those passed through the Commonwealth continue to support personnel retention in Boston Public
Schools. And in fiscal year 2016, the City received funding to support 75 firefighter positions. Please see
the Management’s Discussion and Analysis Section for additional information on financial trends.
Boston’s health, dental and life insurance costs and Medicare taxes have increased 155% since fiscal
year 2001, compared to a 66% increase for all other City costs. Steep cost increases averaged 15% per year
from fiscal year 2001 through fiscal year 2008. A significant lowering of the City's baseline costs then
occurred between fiscal year 2009 through fiscal year 2015 due to multiple factors including state health
care reform legislation, specific efforts by the City and its unions to improve costs and effectiveness of City
health plan management, and lower health cost trends. In fiscal years 2016 and 2017 health insurance costs
are increasing at a rate higher than other City costs due to pharmaceutical cost drivers consistent with
trends in the broader Massachusetts market. In fiscal year 2016 Other Employee Benefits and Retirement
Costs represented 15.1% of the General Fund budget as compared to 14.8% in fiscal year 2015. Boston
Public Schools’ employees are funded for healthcare in the Schools’ budget and Boston Public Schools’
teachers’ pension is funded by the state, therefore these expenses are not included in budgetary Other
Employee Benefits and Contributions to Retirement Funds. The Walsh Administration has continued the
City's record of achieving health care cost containment reforms through the 2014 Public Employee
Committee (PEC) agreement which projected to save $45.0 million over five years . As part of the agreement
City employees are paying a higher share of total health care costs. As a result, the City’s cost share for its
most popular non-Medicare health plan has decreased.
In fiscal year 2016, in order to partially fund the annual required contribution associated with the other
postemployment benefits (OPEB) liability, the City appropriated $40.0 million from the General Fund into
vi • City of Boston Comprehensive Annual Financial Report
the OPEB Liability Trust Fund. The City’s OPEB financing plan balances the duty to deliver valuable public
services while acknowledging the cost of providing health benefits for our employees, both now and when
they retire. More details and information on the OPEB liability can be found in note 12 to the Financial
Statements.
Nearly all of the City’s workforce is represented by one of 40 different unions. Collectively, these
unions represent approximately 18,000 employees. All forty of these unions have reached an agreement
on a six year contract that began in 2010 and 2011 and will expire in 2016 and 2017. These settled contracts
cover 100% of the City’s unionized employees. Each agreement is six years in duration and the civilian
unions contain the same general wage pattern, roughly 12% over the six years. The contract between the
City and The Boston Police Patrolmen Association, which expires in 2016, included an arbitration award
and increased salaries by 25.4% over six years. The contract between the City and the International
Association of Fire Fighters, which expires in 2017, increased salaries by 18.8%, over six years. The City also
subsequently reached voluntary agreements with Police Superior D etectives. In December 2015, the City
received an arbitration award for the Boston Police Detective Benevolent Society which included an increase
estimated at 28.7% over six years through June 2016.
In the fiscal year 2017 budget, Mayor Walsh presented a balanced budget that maintains high levels
of support in critical areas such as education and public safety, makes limited strategic investments,
continues the City's commitment to addressing its long-term liabilities, and builds on the Administration's
record of strong fiscal management. This is made possible by the Administration's achievement of
efficiencies and savings. In fiscal year 2017, the Walsh Administration will make government work better
for those who live and work here by implementing reforms to improve service and reduce costs, continuing
fiscally sustainable practices that have been key to the City's economic success, and taking steps to meet
the population's changing needs. This approach is critical to Boston's success in growing as a thriving, healthy
and innovative city.
Long Term Financial Planning
Imagine Boston 2030, the City's first comprehensive planning process in fifty years, is underway.
Boston’s five-year $1.8 billion capital plan, “Building a Better Boston,” is an investment program for the
City’s future. Four goals have emerged that will help guide Boston's growth: (1) provide quality of life in
accessible neighborhoods, (2) drive inclusive economic growth (3) invest in infrastructure, open space and
culture, and (4) promote a healthy environment and adapt to climate changes. The City's capital plan is an
important tool in realizing the goals and vision of Boston 2030. As an investment program for the future,
"Building A Better Boston" will enable the City to identify, prioritize, and implement capital projects aligned
with Boston's goals. The fiscal year 2017-2021 capital plan initiates early action items from completed plans,
reserves funding capacity for future projects that will emerge from ongoing planning processes such as
Build BPS - the 10-year facilities master plan for Boston Public Schools, and embraces a new model for
implementing and financing energy efficiency projects. The new capital plan makes new investments in the
City's parks, libraries, streets, and other infrastructure. The plan includes 327 projects that will keep Boston
healthy, thriving, and innovative through investments in education, public safety, parks, transportation, and
community spaces. All projects in the capital plan are categorized as Upkeep, New/Major Renovation,
Upgrade, and Planning or Matching Funds. The Capital Budgeting Program of the Office of Budget
Management (OBM) tracks the overall distribution of these categories to maintain a balance between the
Introductory Section • vii
upkeep of existing assets and the expansion or introduction of new ones. The distribution of allocations for
fiscal year 2017 are 24.0% for New/Major Renovations, 40.0% for Upgrades, 32.0% for Upkeep, and 4.0%
for Planning or Matching fund requirements.
Financing for the fiscal year 2017-2021 capital plan comes from General Obligation (G.O.) bonds, state and
federal funds, trust funds, and other funds. G.O. bonds represent 67.1% of all project funding. The capital
plan assumes $775.0 million in new G.O. borrowings over the next five years to support ongoing capital
needs. Effective debt management ensures that the City can meet its capital infrastructure and facility
needs. The Treasury Department manages all borrowings according to the City’s debt management policies.
These policies address issues such as debt affordability and limitations on the level of variable rate debt
the City will use. The City’s goal is to rapidly repay debt, maintain a conservative level of outstanding debt,
and ensure the City’s continued positive financial standing with the bond market. More details and
information on the Long-Term Obligations can be found in note 10 to the Financial Statements.
State and federal funds in the five-year capital plan are currently estimated at $214.4 million and
$304.7 million, respectively. One specific federal program is the the Connect Historic Boston Project. Two
specific state financing programs include the School Building Assistance (SBA) program and the
Massachusetts Department of Transportation's Highway Division’s Chapter 90 funds. The SBA, which is
administered by the Massachusetts School Building Authority (MSBA), provides an important revenue
source for school renovation and construction. Annually, the MSBA accepts new project requests from
cities, towns, and school districts, and if a project is ultimately approved, the MSBA will pay 40% to 80% of
eligible project costs. For the fiscal year 2017-2021 period, total payments from the MSBA are estimated
at $21.0 million to offset debt service costs for projects previously approved by the MSBA. Additionally, in
March 2016, the Executive Director of the MSBA was authorized to enter into a Project Funding Agreement
with the City for window and door replacement projects at seven schools. The MSBA will provide a maximum
grant totaling nearly $16.4 million. Chapter 90 allocates funds by formula through state bond authorizations
and through the state budget to all cities and towns in the Commonwealth. Based on recent allocations,
the City expects an estimated $14.0 million in Chapter 90 funds to be provided in fiscal year 2017.
The City continues to aggressively pursue grant funds, maximize the use of Chapter 90 funds for road
and sidewalk projects, and actively manage its projects to ensure that spending does not exceed projections
and that priority projects move forward. Together, these strategies will enable the City to maintain a
reasonable level of capital spending and borrowing and prudently manage its outstanding debt.
Awards
The Government Finance Officers Association of the United States and Canada (GFOA) awarded a
Certificate of Achievement for Excellence in Financial Reporting to the City of Boston for its CAFR for the
fiscal year ended June 30, 2015. In order to be awarded a Certificate of Achievement, a governmental unit
must publish an easily readable and efficiently organized CAFR. This report must satisfy both GAAP and
applicable state and local legal requirements. A Certificate of Achievement is valid for a period of only one
year. We believe that our current report meets the Certificate of Achievement program requirements, and
we are submitting it to the GFOA to determine its eligibility for a certificate.
viii • City of Boston Comprehensive Annual Financial Report
In addition, the City also received the GFOA’s Award for Distinguished Budget Presentation for its
Annual Budget document for the fiscal year beginning July 1, 2015. The City’s budget document was judged
to be proficient in several categories including policy documentation and financial planning.
Acknowledgements
We would like to express our appreciation to the staff of the Accounting Program and all the members
of the Auditing Department whose professionalism and dedication made the timely preparation of the
CAFR possible. We also wish to thank the professional staff of KPMG LLP for their counsel, technical
assistance, and continued support in the preparation of this CAFR. Several other City departments and
agencies provided additional information and assisted in the CAFR preparation. We gratefully acknowledge
their efforts and contributions to this report. Finally, we wish to thank you for your continued interest in
the financial operations of the City.
The CAFR for fiscal year 2003 through fiscal year 2016 are featured on the City’s web page
www.cityofboston.gov/auditing.
Respectfully submitted,
Sally D. Glora David Sweeney
City Auditor Chief Financial Officer & Collector Treasurer
Introductory Section • ix
x • City of Boston Comprehensive Annual Financial Report
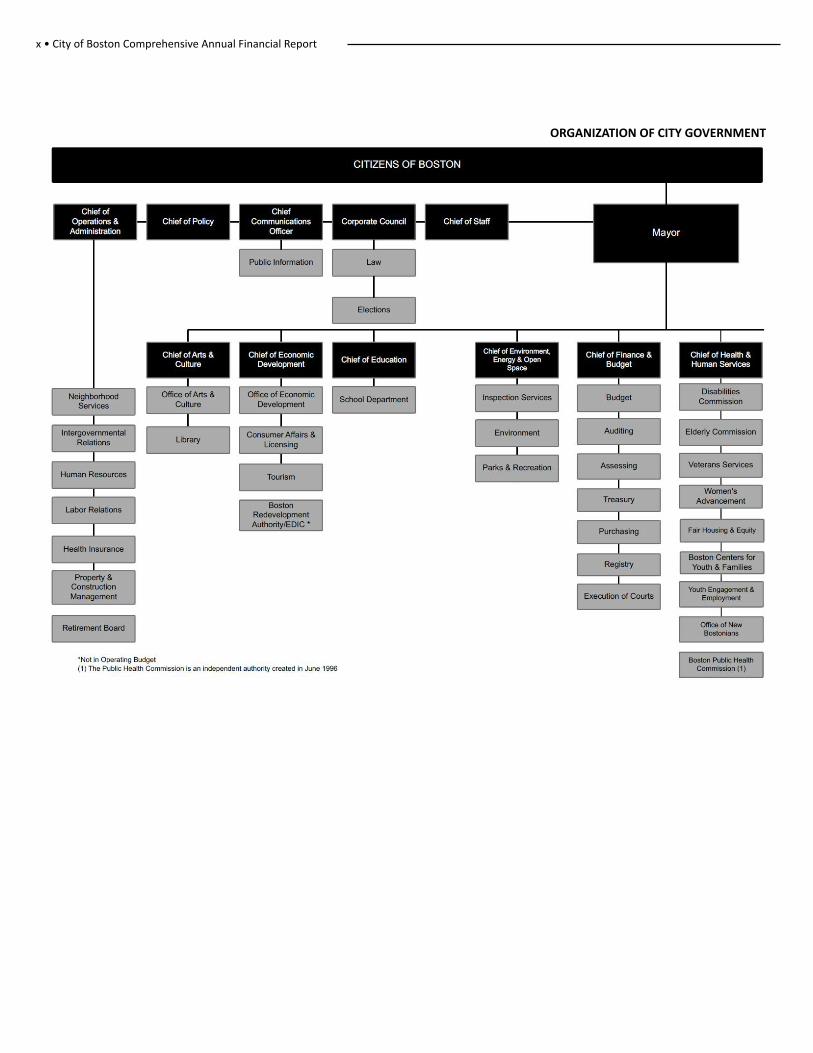
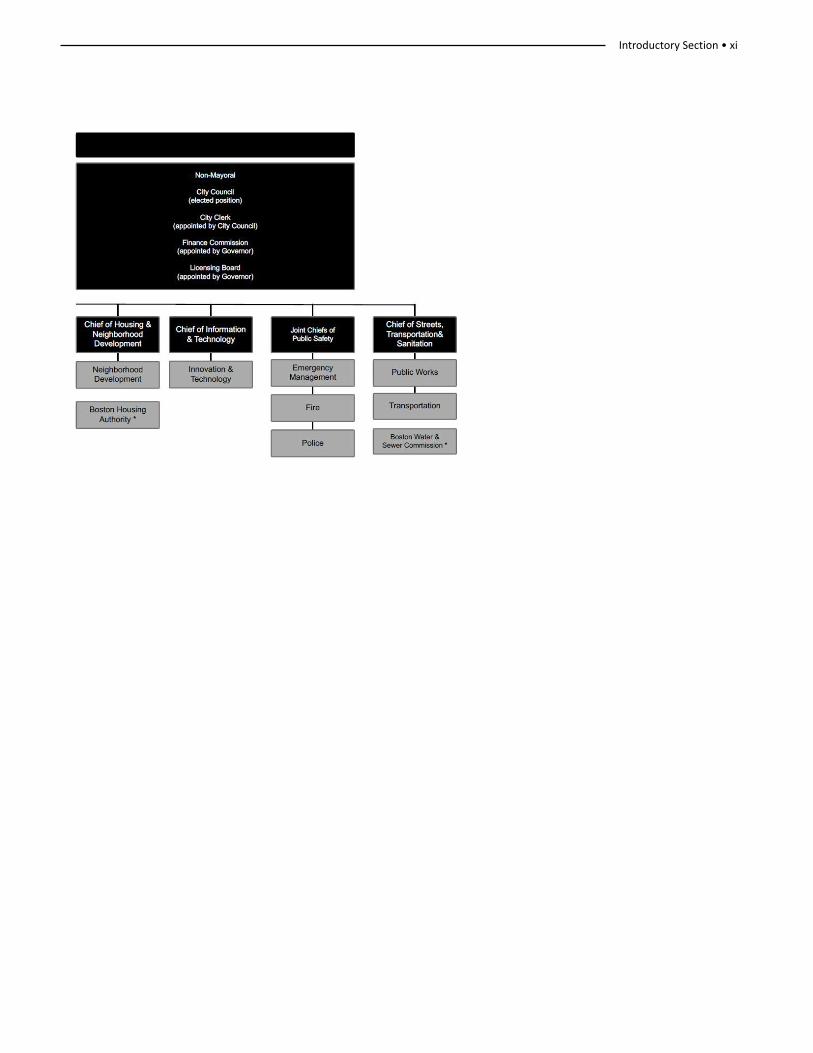
ORGANIZATION OF CITY GOVERNMENT
Introductory Section • xi
xii • City of Boston Comprehensive Annual Financial Report
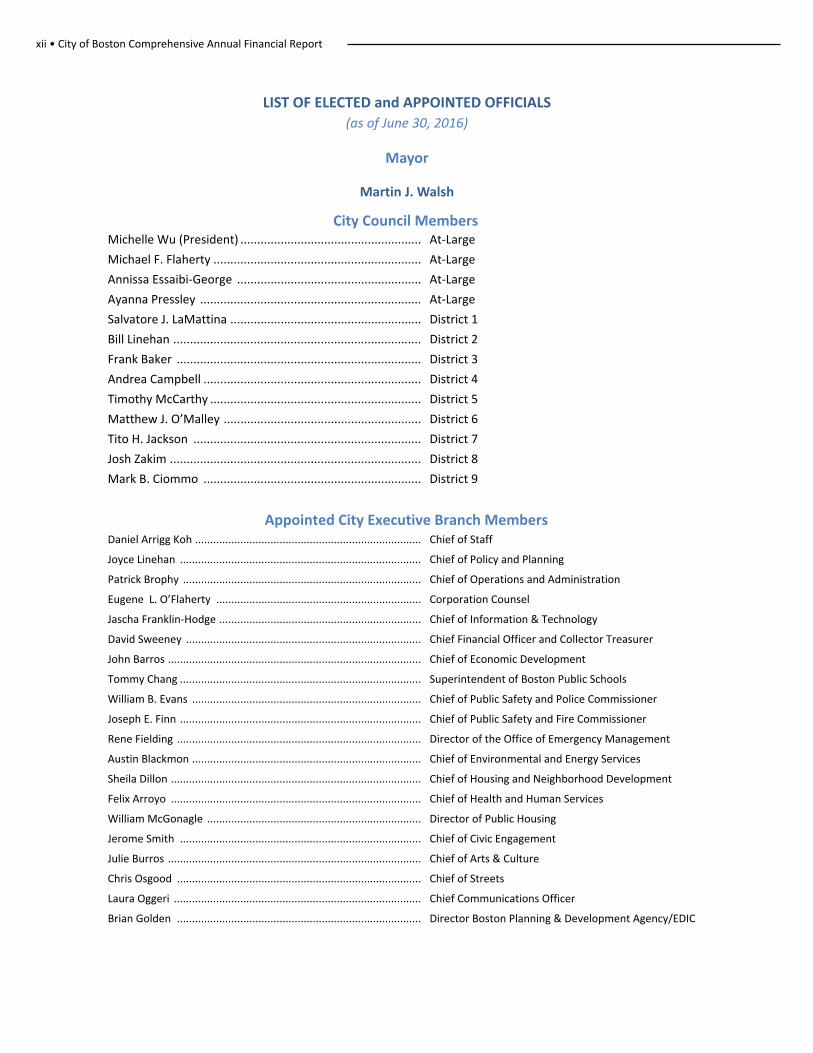
LIST OF ELECTED and APPOINTED OFFICIALS(as of June 30, 2016)
Mayor
Martin J. Walsh
City Council MembersMichelle Wu (President) ...................................................... At-Large
Michael F. Flaherty .............................................................. At-Large
Annissa Essaibi-George ....................................................... At-Large
Ayanna Pressley .................................................................. At-Large
Salvatore J. LaMattina ......................................................... District 1
Bill Linehan .......................................................................... District 2
Frank Baker ......................................................................... District 3
Andrea Campbell ................................................................. District 4
Timothy McCarthy ............................................................... District 5
Matthew J. O’Malley ........................................................... District 6
Tito H. Jackson .................................................................... District 7
Josh Zakim ........................................................................... District 8
Mark B. Ciommo ................................................................. District 9
Appointed City Executive Branch MembersDaniel Arrigg Koh ........................................................................... Chief of Staff
Joyce Linehan ................................................................................ Chief of Policy and Planning
Patrick Brophy ............................................................................... Chief of Operations and Administration
Eugene L. O’Flaherty .................................................................... Corporation Counsel
Jascha Franklin-Hodge ................................................................... Chief of Information & Technology
David Sweeney .............................................................................. Chief Financial Officer and Collector Treasurer
John Barros .................................................................................... Chief of Economic Development
Tommy Chang ................................................................................ Superintendent of Boston Public Schools
William B. Evans ............................................................................ Chief of Public Safety and Police Commissioner
Joseph E. Finn ................................................................................ Chief of Public Safety and Fire Commissioner
Rene Fielding ................................................................................. Director of the Office of Emergency Management
Austin Blackmon ............................................................................ Chief of Environmental and Energy Services
Sheila Dillon ................................................................................... Chief of Housing and Neighborhood Development
Felix Arroyo ................................................................................... Chief of Health and Human Services
William McGonagle ....................................................................... Director of Public Housing
Jerome Smith ................................................................................ Chief of Civic Engagement
Julie Burros .................................................................................... Chief of Arts & Culture
Chris Osgood ................................................................................. Chief of Streets
Laura Oggeri .................................................................................. Chief Communications Officer
Brian Golden ................................................................................. Director Boston Planning & Development Agency/EDIC
Introductory Section • xiii
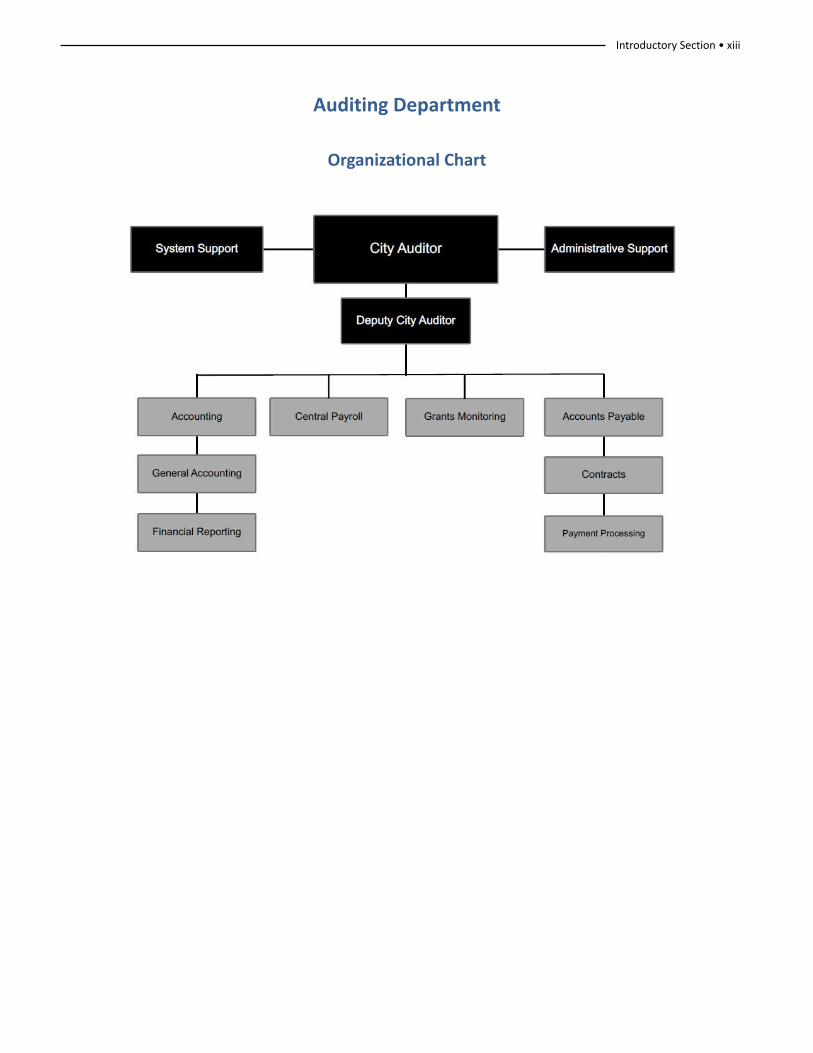
Auditing Department
Organizational Chart

xiv • City of Boston Comprehensive Annual Financial Report
Auditing Department Personnel
Sally D. Glora, City Auditor
Prema Andrew Hazel McAfee
Natoya Castillo Colleen McElwee
Michelle E. Castillo-Reid Timothy Oates
Mattie Crouse Chivy Ok
Margaret Cummings Michael O’Keefe
Patricia Downs Robert Powers
Scott Finn Magnolia Rojas
Christina Gendrolius Raoul Romain
Allen Hurley Lisa Stone
Sinthia Johnson Ming C. Su
James Kelley Julie A. Tippett
Kelli Lazar Robert Todd
Traci Lee Ashley Torregrosa
Licia Lima-Pires Stanley J. Wallace
Nelida Lopez Paul F. Waple
Nelly Lopez Teki Way
Medina Lucien Nadia Williams
Mary Ann Mason
Independent Auditors' Report • 1
KPMG LLPTwo Financial Center60 South StreetBoston, MA 02111
Independent Auditors’ Report
To the Honorable Mayor and City Council City of Boston, Massachusetts:
Report on the Financial Statements
We have audited the accompanying financial statements of the governmental activities, the aggregate discretely presented component units, each major fund, and the aggregate remaining fund information of the City of Boston, Massachusetts (the City), as of and for the year ended June 30, 2016, and the related notes to the financial statements, which collectively comprise the City’s basic financial statements as listed in the table of contents.
Management’s Responsibility for the Financial Statements
Management is responsible for the preparation and fair presentation of these financial statements in accordance with U.S. generally accepted accounting principles; this includes the design, implementation, and maintenance of internal control relevant to the preparation and fair presentation of financial statements that are free from material misstatement, whether due to fraud or error.
Auditors’ Responsibility
Our responsibility is to express opinions on these financial statements based on our audit. We did not audit the financial statements of the Dudley Square Realty Corporation, the Ferdinand Building Development Corporation, and the Permanent Funds, which represent 5.4% and 0.2% of the assets and revenues, respectively, of the governmental activities, and 1.3% and 0.7% of the assets and revenues, respectively, of the aggregate remaining fund information. We also did not audit the financial statements of the Boston Retirement System, the OPEB Trust Fund and the Private-Purpose Trust Funds, which represent 97.3% and 66.4% of the assets and revenues, respectively, of the aggregate remaining fund information. Further, we did not audit the financial statements of the Boston Public Health Commission, Trustees of the Public Library of the City of Boston and the Economic Development and Industrial Corporation of Boston, which represent 57.3% and 90.1% of the assets and revenues, respectively, of the aggregate discretely presented component units. Those financial statements were audited by other auditors whose reports have been furnished to us, and our opinions, insofar as they relate to the amounts included for those entities, is based solely on the reports of the other auditors. We conducted our audit in accordance with auditing standards generally accepted in the United States of America and the standards applicable to financial audits contained in Government Auditing Standards, issued by the Comptroller General of the United States. Those standards require that we plan and perform the audit to obtain reasonable assurance about whether the financial statements are free from material misstatement.
An audit involves performing procedures to obtain audit evidence about the amounts and disclosures in the financial statements. The procedures selected depend on the auditors’ judgment, including the assessment of the risks of material misstatement of the financial statements, whether due to fraud or error. In making those risk assessments, the auditor considers internal control relevant to the entity’s preparation and fair presentation of the financial statements in order to design audit procedures that are appropriate in the circumstances, but not for the purpose of expressing an opinion on the effectiveness of the entity’s internal control. Accordingly, we express no such opinion. An audit also includes evaluating the appropriateness of accounting policies used and the reasonableness of significant accounting estimates made by management, as well as evaluating the overall presentation of the financial statements.
2 • City of Boston Comprehensive Annual Financial Report
We believe that the audit evidence we have obtained is sufficient and appropriate to provide a basis for our audit opinions.
Opinions
In our opinion, based on our audit and the reports of the other auditors, the financial statements referred to above present fairly, in all material respects, the respective financial position of the governmental activities, the aggregate discretely presented component units, each major fund, and the aggregate remaining fund information of the City, as of June 30, 2016, and the respective changes in financial position, and where applicable, cash flows thereof and the budgetary comparison for the City’s General Fund for the year then ended in accordance with U.S. generally accepted accounting principles.
Emphasis of Matters
Adoption of New Accounting Pronouncement
As discussed in Note 2n to the financial statements, in 2016, the City adopted Governmental Accounting Standards Board (GASB) Statement No. 72, Fair Value Measurement and Application. Our opinions are not modified with respect to this matter.
Other Matters
Prior-Year Comparative Information
The financial statements include partial prior-year comparative information related to the budgetary comparison for the City’s General Fund. Such information does not include all of the information required for a presentation in conformity with U.S. generally accepted accounting principles. Accordingly, such information should be read in conjunction with the City’s financial statements for the year ended June 30, 2015, from which such partial information was derived.
Required Supplementary Information
U.S. generally accepted accounting principles require that the management’s discussion and analysis and the schedules listed under Required Supplementary Information in the table of contents, be presented to supplement the basic financial statements. Such information, although not a part of the basic financial statements, is required by the GASB who considers it to be an essential part of financial reporting for placing the basic financial statements in an appropriate operational, economic, or historical context. We and the other auditors have applied certain limited procedures to the required supplementary information in accordance with auditing standards generally accepted in the United States of America, which consisted of inquiries of management about the methods of preparing the information and comparing the information for consistency with management’s responses to our inquiries, the basic financial statements, and other knowledge we obtained during our audit of the basic financial statements. We do not express an opinion or provide any assurance on the information because the limited procedures do not provide us with sufficient evidence to express an opinion or provide any assurance.
Other Information
Our audit was conducted for the purpose of forming opinions on the financial statements that collectively comprise the City’s basic financial statements. The introductory section, combining, individual fund statements and schedules, and statistical section are presented for purposes of additional analysis and are not a required part of the basic financial statements.
The combining, individual fund statements and schedules are the responsibility of management and were derived from and relate directly to the underlying accounting and other records used to prepare the basic financial statements. Such information has been subjected to the auditing procedures applied in the audit of the basic financial statements and certain additional procedures, including comparing and reconciling such information directly to the underlying accounting and other records used to prepare the basic financial statements or to the basic financial statements themselves, and other additional procedures in accordance with auditing standards generally accepted in the United States of America by us and other auditors. In our
Independent Auditors' Report • 3
opinion, based on our audit, the procedures performed as described above, and the reports of the other auditors, the combining, individual fund statements and schedules are fairly stated in all material respects in relation to the basic financial statements as a whole.
We also previously audited, in accordance with auditing standards generally accepted in the United States of America and Government Auditing Standards, the City’s basic financial statements as of and for the year ended June 30, 2015 (not presented herein), and have issued our report thereon dated December 29, 2015, which contained unmodified opinions on the respective financial statements of the governmental activities, the aggregate discretely presented component units, each major fund, and the aggregate remaining fund information, based on our audit and the reports of other auditors. The 2015 combining, individual fund statements and schedules are presented for purposes of additional analysis and are not a required part of the basic financial statements. Such information is the responsibility of management and was derived from and relates directly to the underlying accounting and other records used to prepare the 2015 financial statements. The 2015 combining, individual fund statements and schedules have been subjected to the auditing procedures applied in the audit of the 2015 basic financial statements and certain additional procedures, including comparing and reconciling such information directly to the underlying accounting and other records used to prepare those financial statements or to those financial statements themselves, and other additional procedures in accordance with auditing standards generally accepted in the United States of America. In our opinion, based on our audit and the reports of other auditors, the 2015 combining, individual fund statements and schedules are fairly stated in all material respects in relation to the basic financial statements as a whole for the year ended June 30, 2015.
The introductory and statistical sections have not been subjected to the auditing procedures applied in the audit of the basic financial statements, and accordingly, we do not express an opinion or provide any assurance on them.
Other Reporting Required by Government Auditing Standards
In accordance with Government Auditing Standards, we have also issued our report dated December 29, 2016 on our consideration of the City’s internal control over financial reporting and on our tests of its compliance with certain provisions of laws, regulations, contracts, and grant agreements and other matters. The purpose of that report is to describe the scope of our testing of internal control over financial reporting and compliance and the results of that testing, and not to provide an opinion on internal control over financial reporting or on compliance. That report is an integral part of an audit performed in accordance with Government Auditing Standards in considering the City’s internal control over financial reporting and compliance.
December 29, 2016
4 • City of Boston Comprehensive Annual Financial Report
MANAGEMENT’S DISCUSSION AND ANALYSIS(Unaudited)
The City of Boston (the City) provides this Management’s Discussion and Analysis to present additional information to the
readers of the City’s basic financial statements. This narrative overview and analysis of the financial activities of the City is
for the fiscal year ended June 30, 2016. Readers are encouraged to consider this information in conjunction with the
additional information that is furnished in the City’s Comprehensive Annual Financial Report (CAFR).
OVERVIEW OF THE FINANCIAL STATEMENTS
This discussion and analysis is intended to serve as an introduction to the City’s financial statements. The City’s basic financial
statements include three components: 1) Government-wide Financial Statements, 2) Fund Financial Statements, and 3)
Notes to the Financial Statements. This report also contains required supplementary information regarding historical pension
information and other postemployment benefit (OPEB) plan information. The components of the financial statements are
described in the following sections.
Basic Financial Statements
The basic financial statements include two types of financial statements that present different views of the City – the
Government-wide Financial Statements and the Fund Financial Statements. The Notes to the Basic Financial Statements
supplement the financial statement information and clarify line items that are part of the financial statements.
Government-wide Financial Statements
The Government-wide Financial Statements provide a broad view of the City’s operations in a manner similar to a private
sector business. The statements provide both short-term and long-term information about the City’s financial position,
which assists in assessing the City’s economic condition at the end of the fiscal year. These are prepared using the economic
resources measurement focus and the accrual basis of accounting. This basically means they follow methods that are similar
to those used by most businesses. They take into account all revenues and expenses connected with the fiscal year even if
cash involved has not been received or paid. The Government-wide Financial Statements include two statements:
The Statement of Net Position presents all of the government’s assets and deferred outflows of resources and liabilities
and deferred inflows of resources, with the difference between them reported as net position. Over time, increases or
decreases in the City’s net position may serve as a useful indicator of whether the financial position of the City is improving
or deteriorating.
The Statement of Activities presents information showing how the government’s net position changed during the most
recent fiscal year. All changes in net position are reported as soon as the underlying event giving rise to the change occurs,
regardless of the timing of related cash flows. Thus, revenues and expenses are reported in this statement for some items
that will not result in cash flows until future fiscal periods (such as uncollected taxes and earned but unused vacation leave).
This statement also presents a comparison between direct expenses and program revenues for each function of the City.
Both the above financial statements present two separate sections as described below.
Governmental Activities – The activities in this section are mostly supported by taxes and intergovernmental revenues
(federal and state grants). Most services normally associated with city government fall into this category, including general
government, human services, public safety, public works, property and development, parks and recreation, library, schools,
public health programs, state and district assessments, and debt service.
Management's Discussion & Analysis • 5
Discretely Presented Component Units – These are legally separate entities for which the City has financial accountability
but function independent of the City. For the most part, these entities operate similar to private sector businesses. The
City’s four discretely presented component units are the Boston Public Health Commission, the Boston Development &
Planning Agency, the Economic Development Industrial Corporation, and the Trustees of the Boston Public Library.
Complete financial statements of the individual component units can be obtained from their respective administrative
offices. Additional information about the City’s component units is presented in the Notes to the Financial Statements.
The Government-wide Financial Statements can be found immediately following this discussion and analysis.
Fund Financial Statements
A fund is a grouping of related accounts that is used to maintain control over resources that have been segregated for
specific activities or objectives. The City, like other local governments, uses fund accounting to ensure and demonstrate
compliance with finance-related legal requirements.
The Fund Financial Statements focus on individual parts of the City government, reporting the City’s operations in more
detail than the Government-wide Financial Statements. All of the funds of the City can be divided into three categories. It
is important to note that these fund categories use different accounting approaches and should be interpreted differently.
The three categories of funds are:
Governmental Funds – Most of the basic services provided by the City are financed through governmental funds.
Governmental funds are used to account for essentially the same functions reported as governmental activities in the
Government-wide Financial Statements. However, unlike the Government-wide Financial Statements, the Governmental
Fund Financial Statements focus on near term inflows and outflows of spendable resources. They also focus on the balances
of spendable resources available at the end of the fiscal year. Such information may be useful in evaluating the government’s
near term financing requirements. This approach is known as using the flow of current financial resources measurement
focus and the modified accrual basis of accounting. Under this approach, revenues are recorded when cash is received or
when susceptible to accrual (i.e., measurable and available to liquidate liabilities of the current period). Expenditures are
generally recorded when liabilities are incurred, except for those related to long-term liabilities, which are recorded when
due and payable. These statements provide a detailed short term view of the City’s finances to assist in determining whether
there will be adequate financial resources available to meet the current needs of the City.
Because the focus of governmental funds is narrower than that of the Government-wide Financial Statements, it is useful
to compare the information presented for governmental funds with similar information presented for governmental
activities in the Government-wide Financial Statements. By doing so, readers may better understand the long term impact
of the government’s near term financing decisions. Both the governmental fund balance sheet and the governmental fund
statement of revenues, expenditures, and changes in fund balances provide a reconciliation to facilitate this comparison
between governmental funds and the governmental activities. These reconciliations are presented on the page immediately
following each governmental fund financial statement.
The City presents four columns in the governmental fund balance sheet and in the governmental fund statement of revenues,
expenditures, and changes in fund balances. The City’s three major governmental funds are the General Fund, the Special
Revenue Fund, and the Capital Projects Fund. All non-major governmental funds are combined in the “Other Governmental
Funds” column on these statements. The Governmental Fund Financial Statements can be found immediately following the
Government-wide Financial Statements.
6 • City of Boston Comprehensive Annual Financial Report
Of the City’s governmental funds, the General Fund is the only fund for which a budget is legally adopted. The Statement
of Revenues and Expenditures – Budgetary Basis is presented after the governmental fund financial statements. This
statement provides a comparison of the General Fund original and final budget and the actual expenditures for the current
and prior year on a budgetary basis.
In accordance with state law and regulations, the City’s legally adopted General Fund budget is prepared on a “budgetary”
basis instead of U.S. generally accepted accounting principles (GAAP). Among the key differences between these two sets
of accounting principles are that “budgetary” records property tax as it is levied, while GAAP records it as it becomes
susceptible to accrual, “budgetary” records certain activities and transactions in the General Fund that GAAP records in
separate funds, and “budgetary” records any amount raised to cover a prior year deficit as an expenditure and any available
funds raised from prior year surpluses as a revenue, while GAAP ignores these impacts from prior years. The difference in
accounting principles inevitably leads to varying results in excess or deficiency of revenues over expenditures. Additional
information and a reconciliation of “budgetary” to GAAP statements is provided in note 4 to the Financial Statements.
Proprietary Funds – These funds are used to show activities that operate more like those of commercial enterprises. Like
the Government-wide Financial Statements, Proprietary Fund Financial Statements use the economic resources
measurement focus and accrual basis of accounting. There are two types of proprietary funds – enterprise funds and internal
service funds. Enterprise funds charge fees for services provided to outside customers including local governments.
Enterprise Funds provide the same type of information as the business-type activities of the Government-wide Financial
Statements within governmental activities, only in more detail. Currently, the City does not have any enterprise funds. The
Internal Service Fund provides health insurance services predominantly to other funds, departments or agencies of the
City. Therefore, its activities are included in the Government-wide financial statements within governmental activities.
The Proprietary Funds Financial Statements can be found immediately following the Governmental Fund Financial
Statements.
Fiduciary Funds – These funds are used to account for resources held for the benefit of parties outside the City government.
Fiduciary funds are not reflected in the Government-wide Financial Statements because the resources of these funds are
not available to support the City’s own programs. The accounting used for fiduciary funds is much like that used for
proprietary funds. They use the economic resources measurement focus and accrual basis of accounting.
The City’s fiduciary funds are the Employee Retirement Fund (the Boston Retirement System), which accounts for the
transactions, assets, liabilities, and net position of the City employees’ pension plan; the OPEB Trust Fund, which is an
irrevocable trust established for the accumulation of assets to reduce the unfunded actuarial liability associated with the
City’s obligation for other postemployment benefits; and the Private Purpose Trust and Agency Funds, which include money
held and administered by the City on behalf of third parties.
The Fiduciary Funds Financial Statements can be found immediately following the Proprietary Fund Financial Statements.
Notes to the Financial Statements
The notes provide additional information that is essential to a full understanding of the data provided in the Government-
wide and the Fund Financial Statements. The Notes to the Financial Statements can be found immediately following the
Fiduciary Funds Financial Statements.
Required Supplementary Information
The basic financial statements are followed by a section of required supplementary information, which includes a schedule
of funding progress and a schedule of employer contributions for the OPEB Trust Fund, a schedule of the City’s proportionate
Management's Discussion & Analysis • 7
share of the net pension liability of the Boston Retirement System, and a schedule of the City’s contributions to the Boston
Retirement System.
CURRENT YEAR FINANCIAL IMPACTS
The City of Boston’s OPEB obligation significantly impacts the Government-wide financial results. Each year, the
City is required to recognize an additional portion of its unfunded actuarial accrued liability. The most recent
valuation of the City’s OPEB obligations as of June 30, 2015, estimated that the total OPEB unfunded actuarial
accrued liability of the City increased by $111.8 million to $2.16 billion. This increase was largely as a result of
changes to the discount rate applied in the actuarial valuation.
In fiscal year 2016, the City’s contribution to the OPEB Trust Fund ($150.3 million) for retiree health benefits includes
$40.0 million in advance funding toward reducing the unfunded actuarial accrued liability. The ARC was not met in
2016 resulting in an increase in the net OPEB obligation. In fiscal year 2017, the City has also appropriated $40.0
million in advance funding toward reducing the unfunded actuarial accrued liability.
The City of Boston’s net pension liability significantly impacts the Government-wide financial results. With the
implementation of GASB Statement No. 68 in fiscal year 2015, the City is required to report its proportionate share
of the Boston Retirement System's collective net pension liability, deferred outflows of resources, deferred inflows
of resources, and pension expense. Based on the measurement of the Boston Retirement System's net pension
liability as of December 31, 2015, the City's proportionate share of that net pension liability increased by $205.0
million to $1.62 billion.
GOVERNMENT-WIDE FINANCIAL ANALYSIS
This analysis is based on the Statement of Net Position and the Statement of Activities found directly after Management’s
Discussion and Analysis.
Government-wide Highlights
Net Position – Primary Government – The total liabilities and deferred inflows of resources of the City exceeded its assets
and deferred outflows of resources at fiscal year ended June 30, 2016 by $(549.0) million (presented as net position). At
year end, the City had a deficit in governmental activities unrestricted net position in the amount of $(1.16) billion.
Changes in Net Position – Primary Government – The City’s total net position increased by $81.6 million from the amount
reported in fiscal year 2015.
Net Position
As noted earlier, net position may serve over time as a useful indicator of a government’s financial position. The City’s net
deficit totaled $(549.0) million at the end of 2016, compared to a net deficit of $(630.6) million reported at the end of the
previous year.
The components of net position comprise the following: the investment in capital assets such as land, buildings, equipment,
and infrastructure (road, bridges, and other immovable assets), less any related debt used to acquire those assets that are
still outstanding – this amount is $557.1 million indicating that the net book value of the City’s capital assets exceeds the
amount of related capital debt outstanding. The City uses these capital assets to provide services to citizens; consequentially,
these assets are not available for future spending. Although the City’s investment in its capital assets is reported net of

8 • City of Boston Comprehensive Annual Financial Report
related debt, it should be noted that the resources needed to repay this debt must be provided from other sources, since
the capital assets themselves cannot be used to liquidate these liabilities.
A portion of the City’s governmental activities net position, $53.2 million, represents restricted net position, or resources
that are subject to external restrictions on how they may be used. Internally imposed designations of resources are not
presented as restricted net assets. Unrestricted net position increased $25.7 million from 2015.
Management's Discussion & Analysis • 9
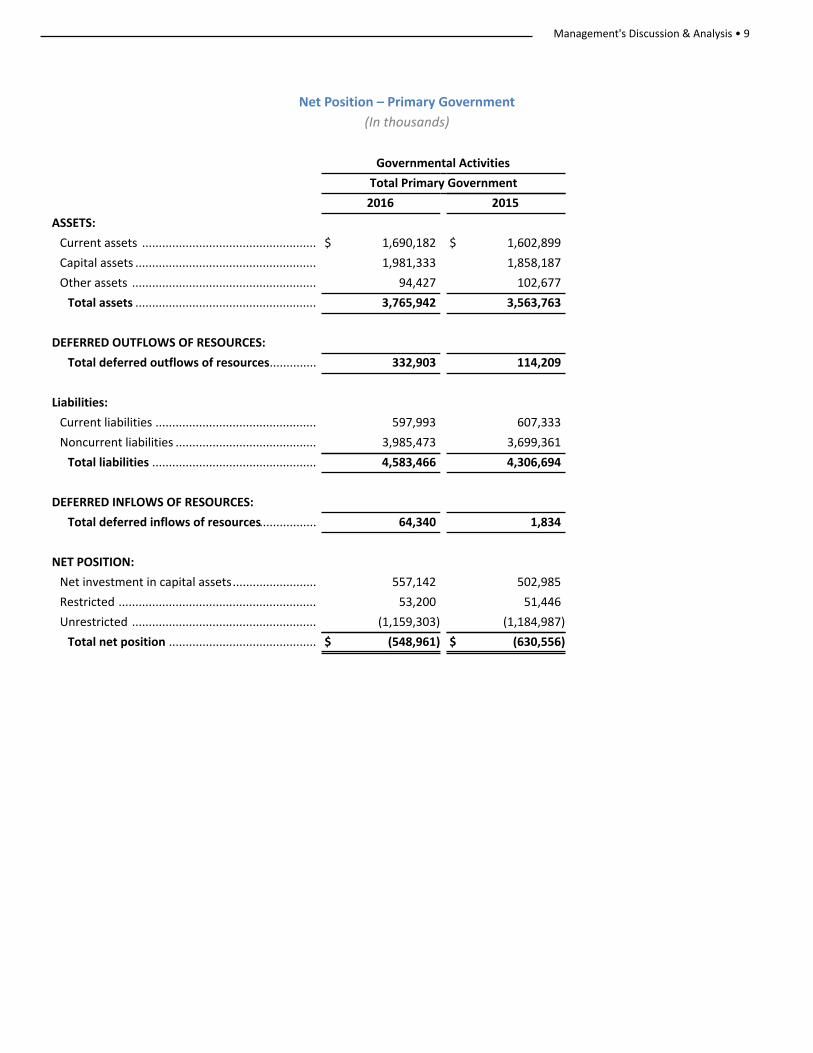
Net Position – Primary Government
(In thousands)
Governmental Activities
Total Primary Government
2016 2015
ASSETS:
Current assets .................................................... $ 1,690,182 $ 1,602,899
Capital assets ...................................................... 1,981,333 1,858,187
Other assets ....................................................... 94,427 102,677
Total assets ...................................................... 3,765,942 3,563,763
DEFERRED OUTFLOWS OF RESOURCES:
Total deferred outflows of resources.............. 332,903 114,209
Liabilities:
Current liabilities ................................................ 597,993 607,333
Noncurrent liabilities .......................................... 3,985,473 3,699,361
Total liabilities ................................................. 4,583,466 4,306,694
DEFERRED INFLOWS OF RESOURCES:
Total deferred inflows of resources................. 64,340 1,834
NET POSITION:
Net investment in capital assets......................... 557,142 502,985
Restricted ........................................................... 53,200 51,446
Unrestricted ....................................................... (1,159,303) (1,184,987)
Total net position ............................................ $ (548,961) $ (630,556)
10 • City of Boston Comprehensive Annual Financial Report
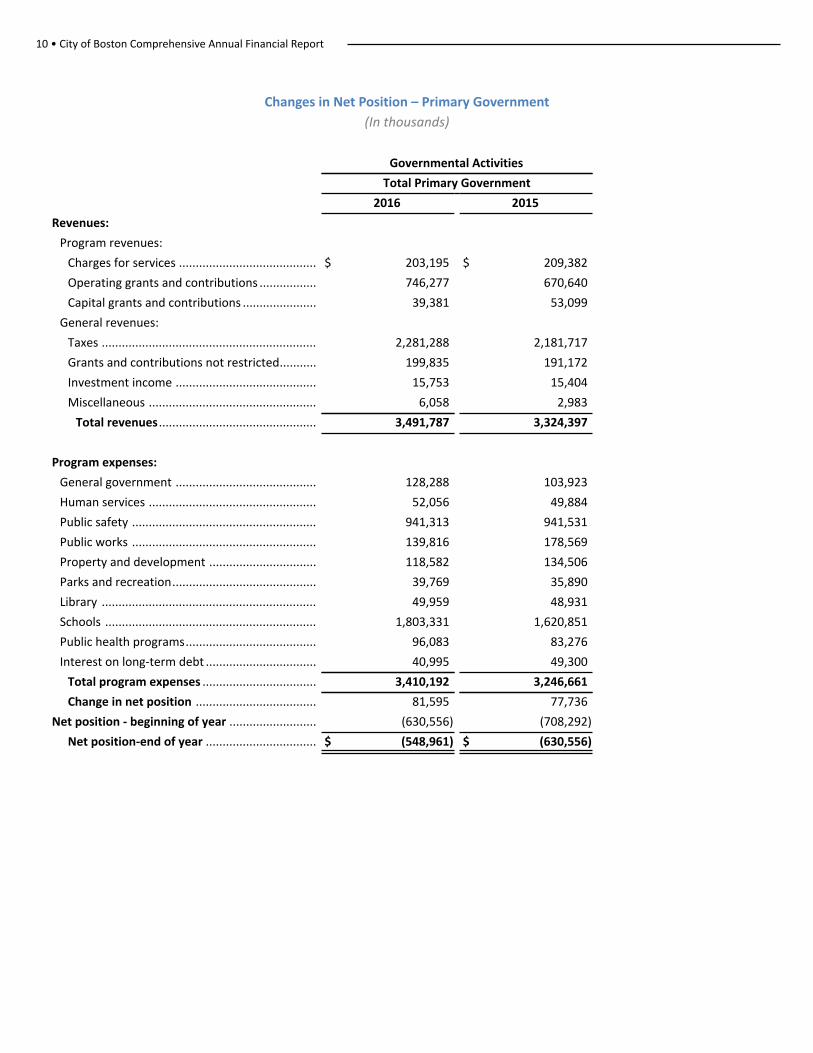
Changes in Net Position – Primary Government
(In thousands)
Governmental Activities
Total Primary Government
2016 2015
Revenues:
Program revenues:
Charges for services ......................................... $ 203,195 $ 209,382
Operating grants and contributions ................. 746,277 670,640
Capital grants and contributions ...................... 39,381 53,099
General revenues:
Taxes ................................................................ 2,281,288 2,181,717
Grants and contributions not restricted........... 199,835 191,172
Investment income .......................................... 15,753 15,404
Miscellaneous .................................................. 6,058 2,983
Total revenues ............................................... 3,491,787 3,324,397
Program expenses:
General government .......................................... 128,288 103,923
Human services .................................................. 52,056 49,884
Public safety ....................................................... 941,313 941,531
Public works ....................................................... 139,816 178,569
Property and development ................................ 118,582 134,506
Parks and recreation........................................... 39,769 35,890
Library ................................................................ 49,959 48,931
Schools ............................................................... 1,803,331 1,620,851
Public health programs....................................... 96,083 83,276
Interest on long-term debt ................................. 40,995 49,300
Total program expenses .................................. 3,410,192 3,246,661
Change in net position .................................... 81,595 77,736
Net position - beginning of year .......................... (630,556) (708,292)
Net position-end of year ................................. $ (548,961) $ (630,556)
Management's Discussion & Analysis • 11
12 • City of Boston Comprehensive Annual Financial Report
Governmental Activities
The City’s governmental activities net position increased by $81.6 million over the prior fiscal year. The following net changes
occurred during the course of operations in fiscal year 2016. In the assets accounts, cash and investments increased by
$80.2 million , receivables decreased by $1.9 million, and capital assets increased by $123.1 million. In the liability accounts,
there was a decrease in warrants and accounts payable of $14.9 million and a decrease in accrued liabilities of $966 thousand.
Additionally, an increase of $27.8 million was recorded relative to the City’s other postemployment benefit obligation and
an increase of $205.0 million was recorded relative to the City's net pension liability in 2016.
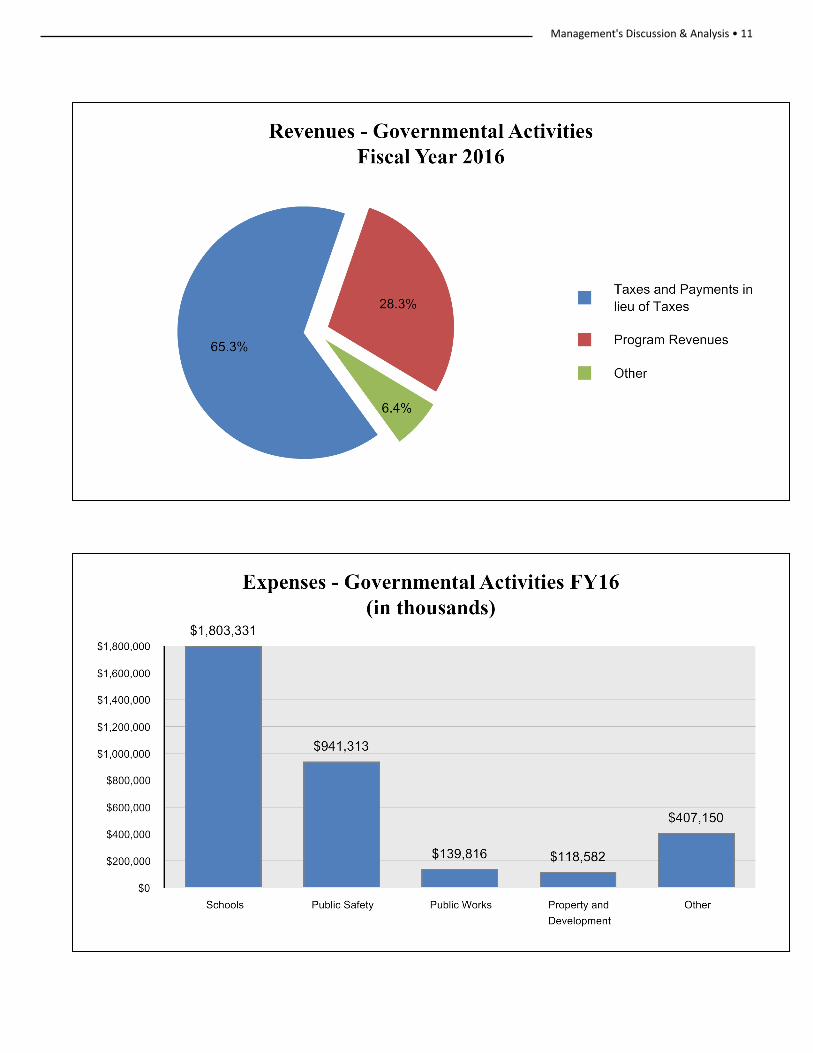
During fiscal year 2016, the City’s revenues increased by 5.0%. The City’s largest sources of revenues were property taxes,
excise taxes, and payment in lieu of taxes of $2.28 billion (65.3% of total revenues) and $988.9 million of program revenues
(28.3% of total revenues). Taxes increased by $99.6 million from the previous year. Program revenues increased by $55.7
million for fiscal year 2016. This is largely due to increases in operating grants and contributions. The City’s expenses cover
a range of services. The largest expenses were for schools ($1.80 billion), public safety ($941.3 million), public works ($139.8
million), property and development ($118.6 million), general government ($128.3 million), public health programs ($96.1
million), and human services ($52.1 million). In 2016, governmental activities expenses exceeded program revenues (i.e.,
user charges, operating grants, and capital grants) by $2.42 billion. This shortfall was covered primarily through taxes ($2.28
billion) and unrestricted grants and contributions ($199.8 million).
Comparative data on these revenues and expenses is itemized in the reporting of the Changes in Net Position – Primary
Government earlier in this Management Discussion and Analysis.
FINANCIAL ANALYSIS OF THE CITY’S FUND STATEMENTS
This analysis is based on the Governmental and Proprietary Fund Financial Statements. As noted earlier, the City uses fund
accounting to ensure and demonstrate compliance with finance related legal requirements.
Fund Highlights
Governmental Funds – Fund Balances – as of the close of fiscal year 2016, the City’s governmental funds reported a combined
ending fund balance of $1.36 billion, an increase of $139.0 million from the prior year. Of this total amount, $682.8 million
represents the unassigned fund balance. The increase in fund balance is largely due to an increase in property and excise
taxes.
Governmental Funds
The focus of the City’s governmental funds is to provide information on near term inflows, outflows, and balances of
spendable resources. Such information is useful in assessing the City’s financial requirements. In particular, unassigned fund
balance may serve as a useful measure of a government’s financial position at the end of the fiscal year.
General Fund – Fund Balance – The General Fund is the chief operating fund of the City. The City’s General Fund – Fund
Balance Policy states in part to maintain a GAAP unassigned fund balance in the General Fund that is 15%, or higher, of
GAAP General Fund operating expenditures for the fiscal year. The GAAP unassigned fund balance at the end of fiscal year
2016 was $682.8 million, which represents approximately 23.0% of GAAP General Fund operating expenditures.
However, because the City is required to follow the statutory basis of accounting rather than GAAP for determining the
amount of unassigned fund balance that can be appropriated, it is the statutory (not the GAAP) fund balance that is used
to calculate “free cash.” Free cash is the amount of statutory fund balance in the General Fund, as certified by the
Commonwealth of Massachusetts’ Department of Revenue, which is available for appropriation and is generated when
actual revenues, on a cash basis, exceed budgeted amounts and encumbrances are less than appropriations, or both.
Management's Discussion & Analysis • 13
The City has established the General Fund-Fund Balance Policy to ensure that the City maintains adequate levels of fund
balance to mitigate current and future risks (i.e., revenue shortfalls and unanticipated expenditures). The policy in full states
that the City shall maintain a GAAP Unassigned Fund Balance in the General Fund that is 15% or higher than the current
fiscal year’s GAAP General Fund Operating Expenditures. The City shall only consider the certification of Free Cash (as
defined by the Commonwealth of Massachusetts’ Department of Revenue) in years where the appropriation of Free Cash
shall not cause the fiscal year’s GAAP Unassigned Fund Balance to go below 15% of the fiscal year’s GAAP General Fund
Operating Expenditures, while maintaining a Budgetary Unassigned Fund Balance at 10% or higher of Budgetary Operating
Expenditures. The City shall only consider the appropriation of Certified Free Cash to offset: (1) certain fixed costs such as
pension contributions and related post-retirement health benefits; and/or (2) to fund extraordinary and non-recurring
events as determined and certified by the City Auditor.
Special Revenue Fund – Fund Balance – The Special Revenue Fund accounts for the proceeds of specific revenue sources
that are restricted or committed to expenditures for predefined purposes. The fiscal year 2016 Special Revenue Fund balance
is reported at $246.7 million, a $38.0 million increase from fiscal year 2015.
Capital Projects Fund – Fund Balance – The Capital Projects Fund accounts for financial resources to be used for the
acquisition or construction of major capital facilities, other than those financed by proprietary funds and trust funds. The
fiscal year 2016 Capital Projects Fund balance is $79.0 million, a $14.3 million increase from fiscal year 2015.
Other Governmental Funds – Fund Balance – Other Governmental Funds account for assets held by the City in permanent
trust funds, as well as the activities related to DSRC and FBDC. The fiscal year 2016 Other Governmental Funds fund balance
is $87.2 million, a $0.2 million decrease from fiscal year 2015.
Internal Service Fund
The City’s Internal Service Fund accounts for the City’s self-insurance program for health benefits provided by Blue Cross
Blue Shield and Harvard Pilgrim Health Care for City employees, their dependents, and retirees. The Internal Service Fund
is included as part of the governmental activities in the government-wide financial statements.
Budgetary Highlights
General Fund budgetary highlights include ending fiscal year 2016 with a $1.9 million surplus. There were no material
variances between the original budget and final budget amounts. Significant unfavorable variances from the final budget
to actual results were in the areas of public safety and judgments. Public safety saw an unfavorable variance of $19.5 million
due to a continued high use of overtime in the Police Department and the Fire Department. Also, judgment and claims saw
an unfavorable variance of $7.0 million in court judgments.
Favorable results were reported for General Fund revenue sources, including $29.9 million in excises predominantly in motor
vehicle and room occupancy excise taxes, $22.2 million in payments in lieu of taxes, $22.1 million in licenses and permits,
$12.2 million in departmental and other revenue. Other available funds shows a revenue deficit of $61.5 million, however,
this is a result of not transferring $950 thousand of cemetery funds, $20.5 million of parking meter funds and $40.0 million
of free cash from the general fund.
14 • City of Boston Comprehensive Annual Financial Report
CAPITAL ASSETS AND LONG-TERM OBLIGATIONS
Capital Assets
The City’s investment in capital assets for its governmental activities, as of June 30, 2016, has a net book value of $1.98
billion, made up of costs totaling $3.83 billion less accumulated depreciation of $1.85 billion. This investment in capital
assets includes land, buildings, improvements, equipment, infrastructure, and construction in progress. Infrastructure assets
are items that are normally immovable and have value only to the City, such as roads, bridges, streets, sidewalks, drainage
systems, lighting systems, and similar items.
The total increase in the City’s investment in capital assets for the current fiscal year was approximately $123.1 million in
terms of net book value. However, actual expenditures to purchase or construct capital assets and contributions of capital
assets were $238.4 million for the fiscal year. Most of this amount was used for the purpose of constructing or reconstructing
buildings and building improvements and infrastructure. Depreciation charges for the year totaled $115.4 million. Additional
information on the City’s capital assets can be found in note 8 to the Financial Statements.
Long Term Obligations
Debt Administration – The authority of the City to incur debt is governed by federal and state laws that restrict the amounts
and purposes for which a municipality can incur debt. At year end, the City had $1.25 billion in General Obligations Bonds
principal outstanding – an increase of $29.1 million over last year.
There was one bond issuance that took place in fiscal year 2016. The March 24, 2016 $140.0 million Series A general
obligation bond issuance used to finance various capital projects in the City, along with $8.1 million Series B that were issued
for the purpose of advance refunding prior debt in March 2016. In conjunction with the City’s annual bond offering, the
rating service bureau Moody’s Investors Service reaffirmed the City’s bond ratings at Aaa and the rating service bureau
Standard & Poor’s increased the bond rating to AAA. General Obligation Bonds are backed by the full faith and credit of the
City, including the City’s power to levy additional taxes to ensure repayment of debt. Accordingly, all general obligation debt
currently outstanding has been approved by a vote of the City Council.
Notes and Leases Payable and Other Long Term Obligations – The City’s general long term notes and leases and other long
term obligations increased $265.3 million, or 10.14%, during the current fiscal year. Key factors for this increase are an
increase in the net pension liability of $205.0 million, an increase in the workers’ compensation liability of $9.7 million, and
the increase in the net OPEB obligation of $27.8 million.
Additional information on the City’s long term debt obligations can be found in note 10 to the Financial Statements.
NEW ACCOUNTING STANDARDS
The GASB has issued Statement No. 72, "Fair Value Measurement and Application." The objective of this Statement is to
address accounting and financial reporting issues related to fair value measurements. This Statement provides guidance
for determining a fair value measurement for financial reporting purposes. This Statement also provides guidance for
applying fair value to certain investments and disclosures related to all fair value measurements. The requirements of this
Statement are effective for financial statements for periods beginning after June 15, 2015.
The GASB has issued Statement No. 76, “The Hierarchy of Generally Accepted Accounting Principles for State and Local
Governments,” The objective of this Statement is to identify—in the context of the current governmental financial reporting
environment—the hierarchy of generally accepted accounting principles (GAAP). The requirements in this Statement
improve financial reporting by (1) raising the category of GASB Implementation Guides in the GAAP hierarchy, thus providing
the opportunity for broader public input on implementation guidance; (2) emphasizing the importance of analogies to
Management's Discussion & Analysis • 15
authoritative literature when the accounting treatment for an event is not specified in authoritative GAAP; and (3) requiring
the consideration of consistency with the GASB Concepts Statements when evaluating accounting treatments specified in
non-authoritative literature. The requirements of this Statement are effective for reporting periods beginning after June
15, 2015.
The GASB has issued GASB Statement No. 79, "Certain External Investment Pools and Pool Participants." The obejctive of
this Statement is to address accounting and financial reporting for certain external investment pools and pool participants.
Specifically, it establishes criteria for an external investment pool to qualify for making the election to measure all of its
investments at amortized cost for financial reporting purposes. An external investment pool qualifies for that reporting if
it meets all of the applicable criteria established in this Statement. The specific criteria address (1) how the external
investment pool transacts with participants; (2) requirements for portfolio maturity, quality, diversification, and liquidity;
and (3) calculation and requirements of a shadow price. The requirements of this Statement are effective for reporting
periods beginning after June 15, 2015, except for certain provisions on portfolio quality, custodial credit risk, and shadow
pricing. Those provisions are effective for reporting periods beginning after December 15, 2015.
The GASB has issued GASB Statement No. 82, "Pension Issues—an amendment of GASB Statements No. 67, No. 68, and No.
73." The objective of this Statement is to address certain issues that have been raised with respect to Statements No.
67, "Financial Reporting for Pension Plans", No. 68, "Accounting and Financial Reporting for Pensions", and No.
73, "Accounting and Financial Reporting for Pensions and Related Assets That Are Not within the Scope of GASB Statement
68, and Amendments to Certain Provisions of GASB Statements 67 and 68". Specifically, this Statement addresses issues
regarding (1) the presentation of payroll-related measures in required supplementary information, (2) the selection of
assumptions and the treatment of deviations from the guidance in an Actuarial Standard of Practice for financial reporting
purposes, and (3) the classification of payments made by employers to satisfy employee (plan member) contribution
requirements.
FUTURE PRONOUNCEMENTS
The GASB has issued Statement No. 73, "Accounting and Financial Reporting for Pensions and Related Assets That Are Not
within the Scope of GASB Statement 68, and Amendments to Certain Provisions of GASB Statements 67 and 68." The objective
of this Statement is to improve the usefulness of information about pensions included in the general purpose external
financial reports of state and local governments for making decisions and assessing accountability. This Statement establishes
requirements for defined benefit pensions that are not within the scope of Statement No. 68, "Accounting and Financial
Reporting for Pensions," as well as for the assets accumulated for purposes of providing those pensions. It also makes
amendments to certain provisions of Statements No. 67 and No. 68. The requirements of this Statement for pension plans
that are within the scope of Statement No. 67 or for pensions that are within the scope of Statement No. 68 are effective
for fiscal years beginning after June 15, 2015. The requirements for defined benefit pensions not within the scope of
Statement No. 68 are effective for fiscal years beginning after June 15, 2016. Earlier application is encouraged.
The GASB has issued Statement No. 74, "Financial Reporting for Postemployment Benefit Plans Other Than Pension Plans."
The objective of this Statement is to improve the usefulness of information about postemployment benefits other than
pensions (other postemployment benefits or OPEB) included in the general purpose external financial reports of state and
local governmental OPEB plans for making decisions and assessing accountability. This Statement is effective for financial
statements for fiscal years beginning after June 15, 2016.
The GASB has issued Statement No. 75, "Accounting and Financial Reporting for Postemployment Benefits Other Than
Pensions.” The primary objective of this Statement is to improve accounting and financial reporting by state and local
16 • City of Boston Comprehensive Annual Financial Report
governments for OPEB. It also improves information provided by state and local governmental employers about financial
support for OPEB that is provided by other entities. This Statement replaces the requirements of Statements No. 45,
"Accounting and Financial Reporting by Employers for Postemployment Benefits Other Than Pensions, as amended, " and
No. 57, "OPEB Measurements by Agent Employers and Agent Multiple-Employer Plans, for OPEB." This Statement is effective
for fiscal years beginning after June 15, 2017.
The GASB has issued Statement No. 77, “Tax Abatement Disclosures.” The objective of this Statement is to improve financial
reporting by giving users of financial statements essential information that is not consistently or comprehensively reported
to the public at present related to tax abatements. Disclosure of information about the nature and magnitude of tax
abatements will make these transactions more transparent to financial statement users. As a result, users will be better
equipped to understand (1) how tax abatements affect a government’s future ability to raise resources and meet its financial
obligations and (2) the impact those abatements have on a government’s financial position and economic condition. The
requirements of this Statement are effective for financial statements for periods beginning after December 15, 2015.
REQUESTS FOR INFORMATION
This financial report is designed to provide a general overview of the City’s finances for all of the City’s citizens, taxpayers,
customers, investors, and creditors. Questions concerning any of the information provided in this report or requests for
additional information should be addressed to: City of Boston, Auditing Department, Boston City Hall, Room M 4, Boston,
MA 02201. Alternatively, these requests may also be made through email, by contacting the Auditing Department at
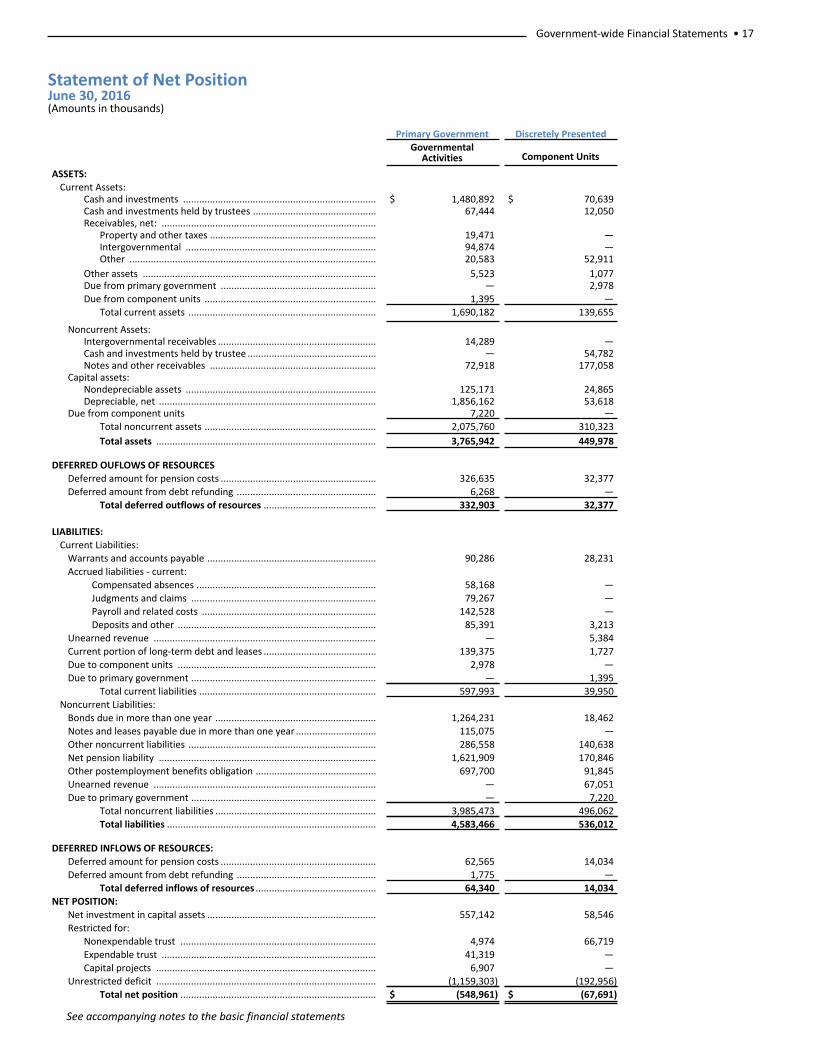
Government-wide Financial Statements • 17
See accompanying notes to the basic financial statements
Statement of Net PositionJune 30, 2016 (Amounts in thousands)
Primary Government Discretely PresentedGovernmental
Activities Component Units
ASSETS:Current Assets:
Cash and investments ........................................................................ $ 1,480,892 $ 70,639Cash and investments held by trustees .............................................. 67,444 12,050Receivables, net: ................................................................................
Property and other taxes .............................................................. 19,471 —Intergovernmental ....................................................................... 94,874 —Other ............................................................................................ 20,583 52,911
Other assets ....................................................................................... 5,523 1,077Due from primary government .......................................................... — 2,978Due from component units ................................................................ 1,395 —
Total current assets ...................................................................... 1,690,182 139,655
Noncurrent Assets:Intergovernmental receivables ........................................................... 14,289 —Cash and investments held by trustee ................................................ — 54,782Notes and other receivables .............................................................. 72,918 177,058
Capital assets:Nondepreciable assets ....................................................................... 125,171 24,865Depreciable, net ................................................................................. 1,856,162 53,618
Due from component units 7,220 —Total noncurrent assets ................................................................ 2,075,760 310,323
Total assets .................................................................................. 3,765,942 449,978
DEFERRED OUFLOWS OF RESOURCESDeferred amount for pension costs .......................................................... 326,635 32,377Deferred amount from debt refunding .................................................... 6,268 —
Total deferred outflows of resources .......................................... 332,903 32,377
LIABILITIES:Current Liabilities:
Warrants and accounts payable ............................................................... 90,286 28,231Accrued liabilities - current:
Compensated absences ................................................................... 58,168 —Judgments and claims ..................................................................... 79,267 —Payroll and related costs ................................................................. 142,528 —Deposits and other .......................................................................... 85,391 3,213
Unearned revenue ................................................................................... — 5,384Current portion of long-term debt and leases .......................................... 139,375 1,727Due to component units .......................................................................... 2,978 —Due to primary government ..................................................................... — 1,395
Total current liabilities .................................................................. 597,993 39,950Noncurrent Liabilities:
Bonds due in more than one year ............................................................ 1,264,231 18,462Notes and leases payable due in more than one year .............................. 115,075 —Other noncurrent liabilities ...................................................................... 286,558 140,638Net pension liability ................................................................................. 1,621,909 170,846Other postemployment benefits obligation ............................................. 697,700 91,845Unearned revenue ................................................................................... — 67,051Due to primary government ..................................................................... — 7,220
Total noncurrent liabilities ............................................................ 3,985,473 496,062Total liabilities .............................................................................. 4,583,466 536,012
DEFERRED INFLOWS OF RESOURCES:Deferred amount for pension costs .......................................................... 62,565 14,034Deferred amount from debt refunding .................................................... 1,775 —
Total deferred inflows of resources ............................................. 64,340 14,034NET POSITION:
Net investment in capital assets ............................................................... 557,142 58,546Restricted for:
Nonexpendable trust ......................................................................... 4,974 66,719Expendable trust ................................................................................ 41,319 —Capital projects .................................................................................. 6,907 —
Unrestricted deficit .................................................................................. (1,159,303) (192,956)Total net position ......................................................................... $ (548,961) $ (67,691)
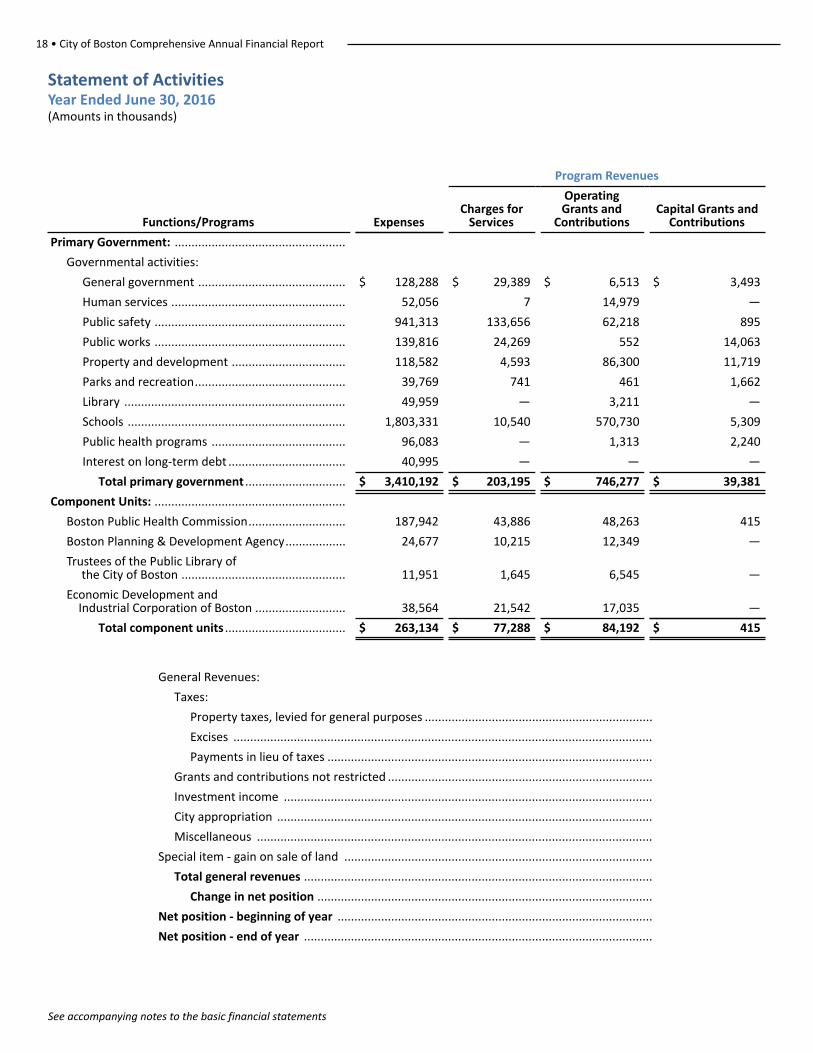
18 • City of Boston Comprehensive Annual Financial Report
See accompanying notes to the basic financial statements
Statement of ActivitiesYear Ended June 30, 2016 (Amounts in thousands)
Program Revenues
Functions/Programs ExpensesCharges for
Services
OperatingGrants and
ContributionsCapital Grants and
Contributions
Primary Government: ...................................................
Governmental activities:
General government ............................................ $ 128,288 $ 29,389 $ 6,513 $ 3,493
Human services .................................................... 52,056 7 14,979 —
Public safety ......................................................... 941,313 133,656 62,218 895
Public works ......................................................... 139,816 24,269 552 14,063
Property and development .................................. 118,582 4,593 86,300 11,719
Parks and recreation............................................. 39,769 741 461 1,662
Library .................................................................. 49,959 — 3,211 —
Schools ................................................................. 1,803,331 10,540 570,730 5,309
Public health programs ........................................ 96,083 — 1,313 2,240
Interest on long-term debt ................................... 40,995 — — —
Total primary government .............................. $ 3,410,192 $ 203,195 $ 746,277 $ 39,381
Component Units: .........................................................
Boston Public Health Commission............................. 187,942 43,886 48,263 415
Boston Planning & Development Agency.................. 24,677 10,215 12,349 —
Trustees of the Public Library of the City of Boston ................................................. 11,951 1,645 6,545 —
Economic Development and Industrial Corporation of Boston ........................... 38,564 21,542 17,035 —
Total component units .................................... $ 263,134 $ 77,288 $ 84,192 $ 415
General Revenues:
Taxes:
Property taxes, levied for general purposes ....................................................................
Excises .............................................................................................................................
Payments in lieu of taxes .................................................................................................
Grants and contributions not restricted ...............................................................................
Investment income ..............................................................................................................
City appropriation ................................................................................................................
Miscellaneous ......................................................................................................................
Special item - gain on sale of land ............................................................................................
Total general revenues ........................................................................................................
Change in net position ....................................................................................................
Net position - beginning of year ..............................................................................................
Net position - end of year ........................................................................................................
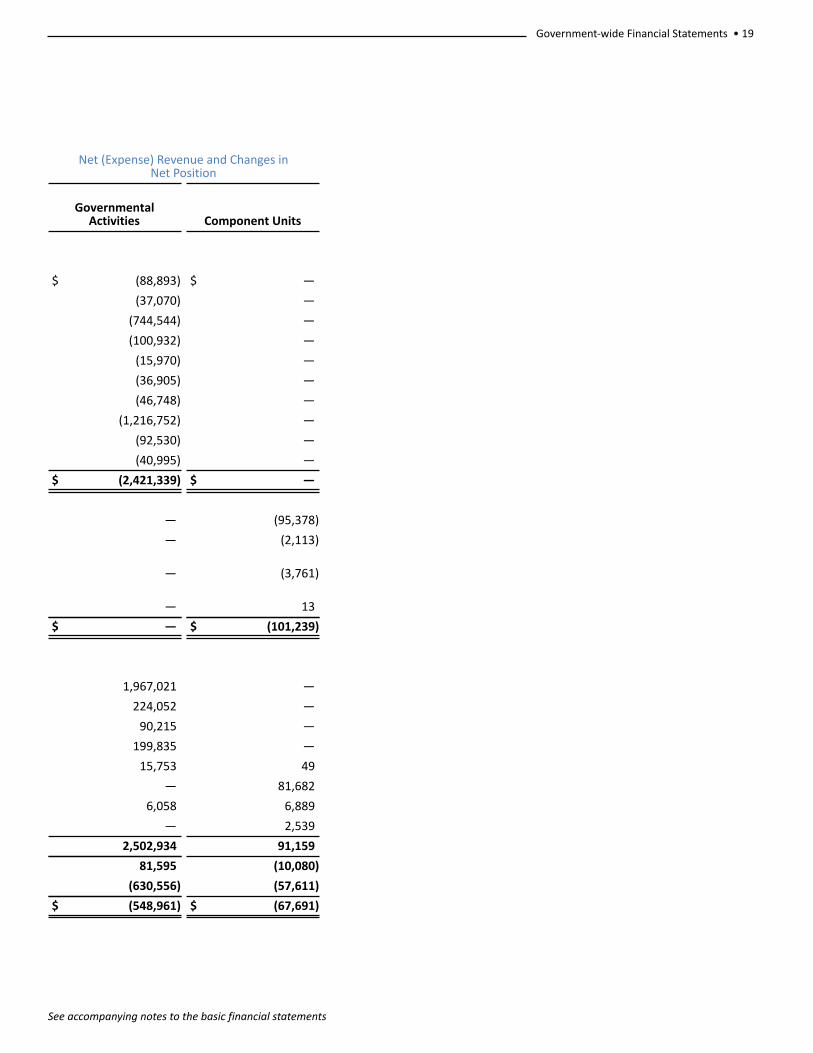
Government-wide Financial Statements • 19
See accompanying notes to the basic financial statements
Net (Expense) Revenue and Changes in Net Position
GovernmentalActivities Component Units
$ (88,893) $ —
(37,070) —
(744,544) —
(100,932) —
(15,970) —
(36,905) —
(46,748) —
(1,216,752) —
(92,530) —
(40,995) —
$ (2,421,339) $ —
— (95,378)
— (2,113)
— (3,761)
— 13
$ — $ (101,239)
1,967,021 —
224,052 —
90,215 —
199,835 —
15,753 49
— 81,682
6,058 6,889
— 2,539
2,502,934 91,159
81,595 (10,080)
(630,556) (57,611)
$ (548,961) $ (67,691)
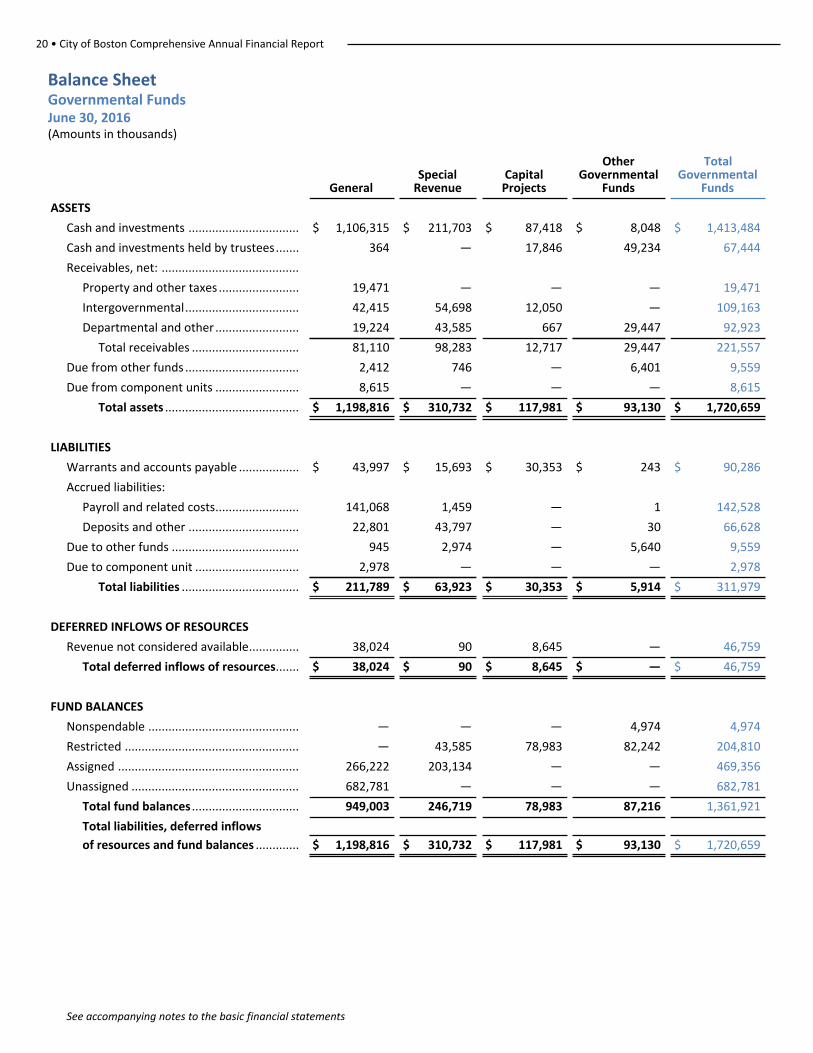
20 • City of Boston Comprehensive Annual Financial Report
See accompanying notes to the basic financial statements
Balance SheetGovernmental FundsJune 30, 2016 (Amounts in thousands)
GeneralSpecial
RevenueCapitalProjects
OtherGovernmental
Funds
TotalGovernmental
Funds
ASSETS
Cash and investments ................................. $ 1,106,315 $ 211,703 $ 87,418 $ 8,048 $ 1,413,484
Cash and investments held by trustees....... 364 — 17,846 49,234 67,444
Receivables, net: .........................................
Property and other taxes ........................ 19,471 — — — 19,471
Intergovernmental.................................. 42,415 54,698 12,050 — 109,163
Departmental and other ......................... 19,224 43,585 667 29,447 92,923
Total receivables ................................ 81,110 98,283 12,717 29,447 221,557
Due from other funds .................................. 2,412 746 — 6,401 9,559
Due from component units ......................... 8,615 — — — 8,615
Total assets ........................................ $ 1,198,816 $ 310,732 $ 117,981 $ 93,130 $ 1,720,659
LIABILITIES
Warrants and accounts payable .................. $ 43,997 $ 15,693 $ 30,353 $ 243 $ 90,286
Accrued liabilities:
Payroll and related costs......................... 141,068 1,459 — 1 142,528
Deposits and other ................................. 22,801 43,797 — 30 66,628
Due to other funds ...................................... 945 2,974 — 5,640 9,559
Due to component unit ............................... 2,978 — — — 2,978
Total liabilities ................................... $ 211,789 $ 63,923 $ 30,353 $ 5,914 $ 311,979
DEFERRED INFLOWS OF RESOURCES
Revenue not considered available............... 38,024 90 8,645 — 46,759
Total deferred inflows of resources....... $ 38,024 $ 90 $ 8,645 $ — $ 46,759
FUND BALANCES
Nonspendable ............................................. — — — 4,974 4,974
Restricted .................................................... — 43,585 78,983 82,242 204,810
Assigned ...................................................... 266,222 203,134 — — 469,356
Unassigned .................................................. 682,781 — — — 682,781
Total fund balances ................................ 949,003 246,719 78,983 87,216 1,361,921
Total liabilities, deferred inflows
of resources and fund balances ............. $ 1,198,816 $ 310,732 $ 117,981 $ 93,130 $ 1,720,659
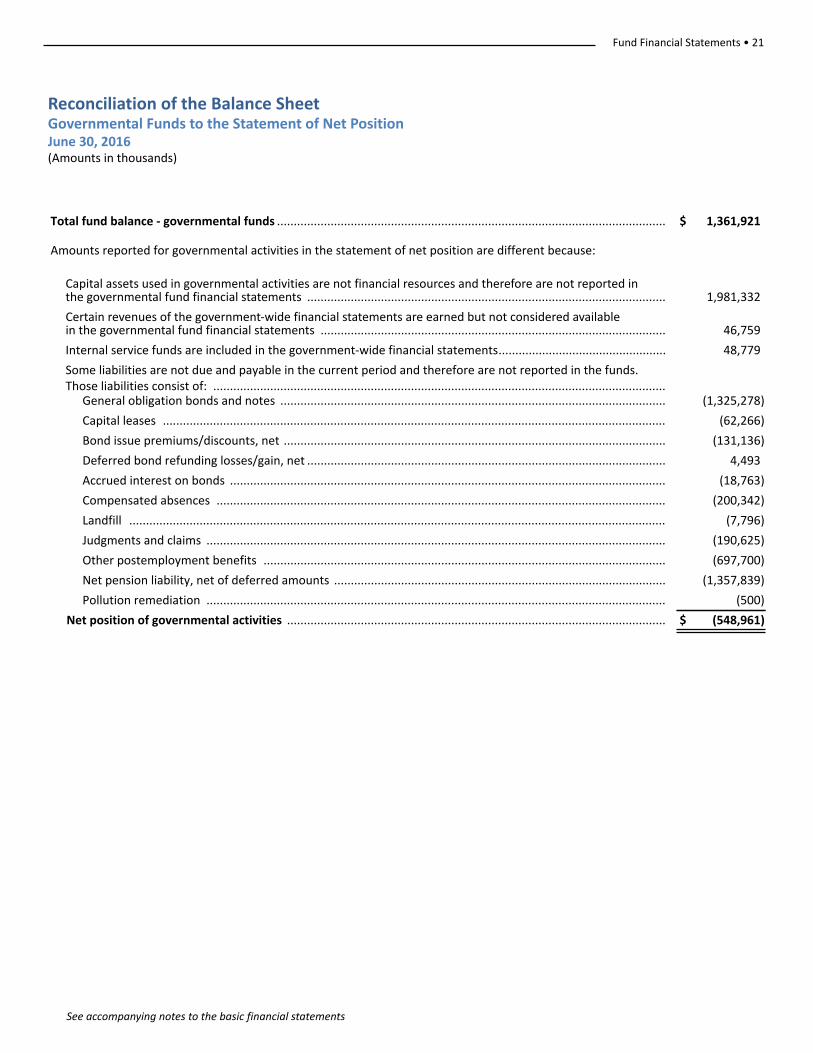
Fund Financial Statements • 21
See accompanying notes to the basic financial statements
Reconciliation of the Balance SheetGovernmental Funds to the Statement of Net PositionJune 30, 2016 (Amounts in thousands)
Total fund balance - governmental funds .................................................................................................................... $ 1,361,921
Amounts reported for governmental activities in the statement of net position are different because:
Capital assets used in governmental activities are not financial resources and therefore are not reported in the governmental fund financial statements ........................................................................................................... 1,981,332
Certain revenues of the government-wide financial statements are earned but not considered available in the governmental fund financial statements ....................................................................................................... 46,759
Internal service funds are included in the government-wide financial statements.................................................. 48,779
Some liabilities are not due and payable in the current period and therefore are not reported in the funds. Those liabilities consist of: .......................................................................................................................................
General obligation bonds and notes ................................................................................................................... (1,325,278)
Capital leases ...................................................................................................................................................... (62,266)
Bond issue premiums/discounts, net .................................................................................................................. (131,136)
Deferred bond refunding losses/gain, net ........................................................................................................... 4,493
Accrued interest on bonds .................................................................................................................................. (18,763)
Compensated absences ...................................................................................................................................... (200,342)
Landfill ................................................................................................................................................................ (7,796)
Judgments and claims ......................................................................................................................................... (190,625)
Other postemployment benefits ........................................................................................................................ (697,700)
Net pension liability, net of deferred amounts ................................................................................................... (1,357,839)
Pollution remediation ......................................................................................................................................... (500)
Net position of governmental activities ................................................................................................................. $ (548,961)
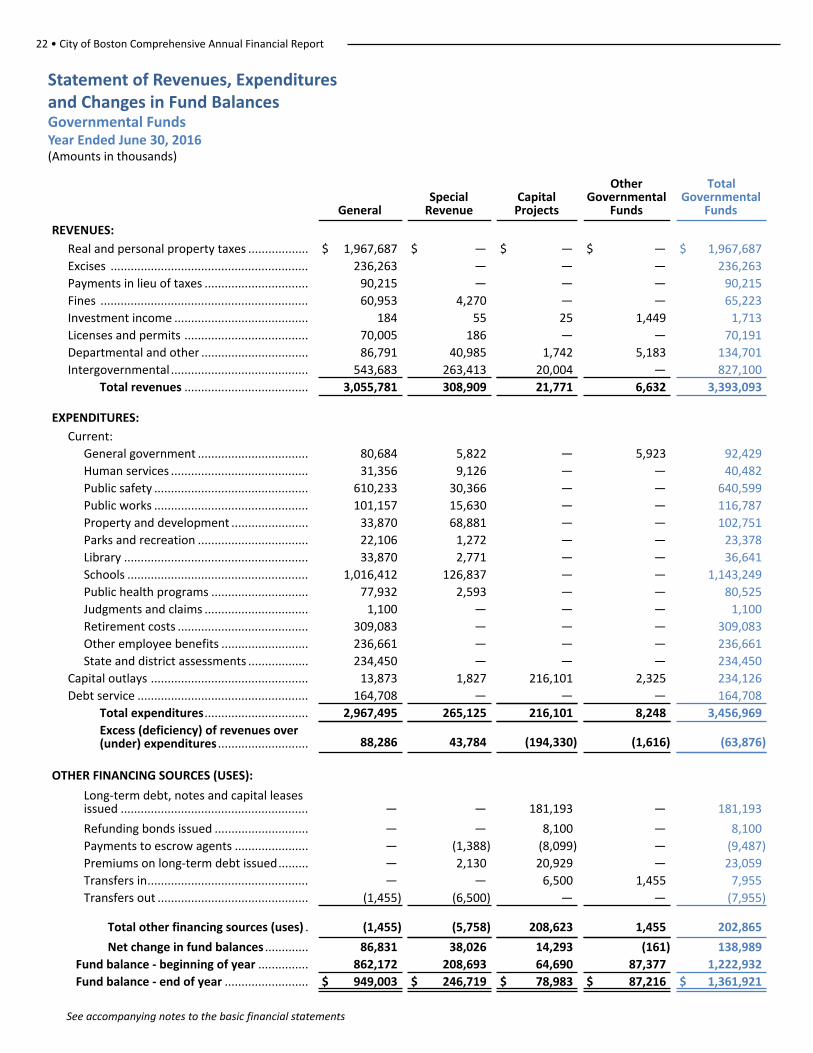
22 • City of Boston Comprehensive Annual Financial Report
See accompanying notes to the basic financial statements
Statement of Revenues, Expendituresand Changes in Fund BalancesGovernmental FundsYear Ended June 30, 2016 (Amounts in thousands)
GeneralSpecial
RevenueCapitalProjects
OtherGovernmental
Funds
TotalGovernmental
Funds
REVENUES:
Real and personal property taxes .................. $ 1,967,687 $ — $ — $ — $ 1,967,687
Excises ........................................................... 236,263 — — — 236,263
Payments in lieu of taxes ............................... 90,215 — — — 90,215
Fines .............................................................. 60,953 4,270 — — 65,223
Investment income ........................................ 184 55 25 1,449 1,713
Licenses and permits ..................................... 70,005 186 — — 70,191
Departmental and other ................................ 86,791 40,985 1,742 5,183 134,701
Intergovernmental ......................................... 543,683 263,413 20,004 — 827,100
Total revenues ..................................... 3,055,781 308,909 21,771 6,632 3,393,093
EXPENDITURES:
Current:
General government ................................. 80,684 5,822 — 5,923 92,429
Human services ......................................... 31,356 9,126 — — 40,482
Public safety .............................................. 610,233 30,366 — — 640,599
Public works .............................................. 101,157 15,630 — — 116,787
Property and development ....................... 33,870 68,881 — — 102,751
Parks and recreation ................................. 22,106 1,272 — — 23,378
Library ....................................................... 33,870 2,771 — — 36,641
Schools ...................................................... 1,016,412 126,837 — — 1,143,249
Public health programs ............................. 77,932 2,593 — — 80,525
Judgments and claims ............................... 1,100 — — — 1,100
Retirement costs ....................................... 309,083 — — — 309,083
Other employee benefits .......................... 236,661 — — — 236,661
State and district assessments .................. 234,450 — — — 234,450
Capital outlays ............................................... 13,873 1,827 216,101 2,325 234,126
Debt service ................................................... 164,708 — — — 164,708
Total expenditures............................... 2,967,495 265,125 216,101 8,248 3,456,969Excess (deficiency) of revenues over(under) expenditures ........................... 88,286 43,784 (194,330) (1,616) (63,876)
OTHER FINANCING SOURCES (USES):
Long-term debt, notes and capital leasesissued ........................................................ — — 181,193 — 181,193
Refunding bonds issued ............................ — — 8,100 — 8,100
Payments to escrow agents ...................... — (1,388) (8,099) — (9,487)
Premiums on long-term debt issued......... — 2,130 20,929 — 23,059
Transfers in................................................ — — 6,500 1,455 7,955
Transfers out ............................................. (1,455) (6,500) — — (7,955)
Total other financing sources (uses) . (1,455) (5,758) 208,623 1,455 202,865
Net change in fund balances ............. 86,831 38,026 14,293 (161) 138,989Fund balance - beginning of year ............... 862,172 208,693 64,690 87,377 1,222,932Fund balance - end of year ......................... $ 949,003 $ 246,719 $ 78,983 $ 87,216 $ 1,361,921
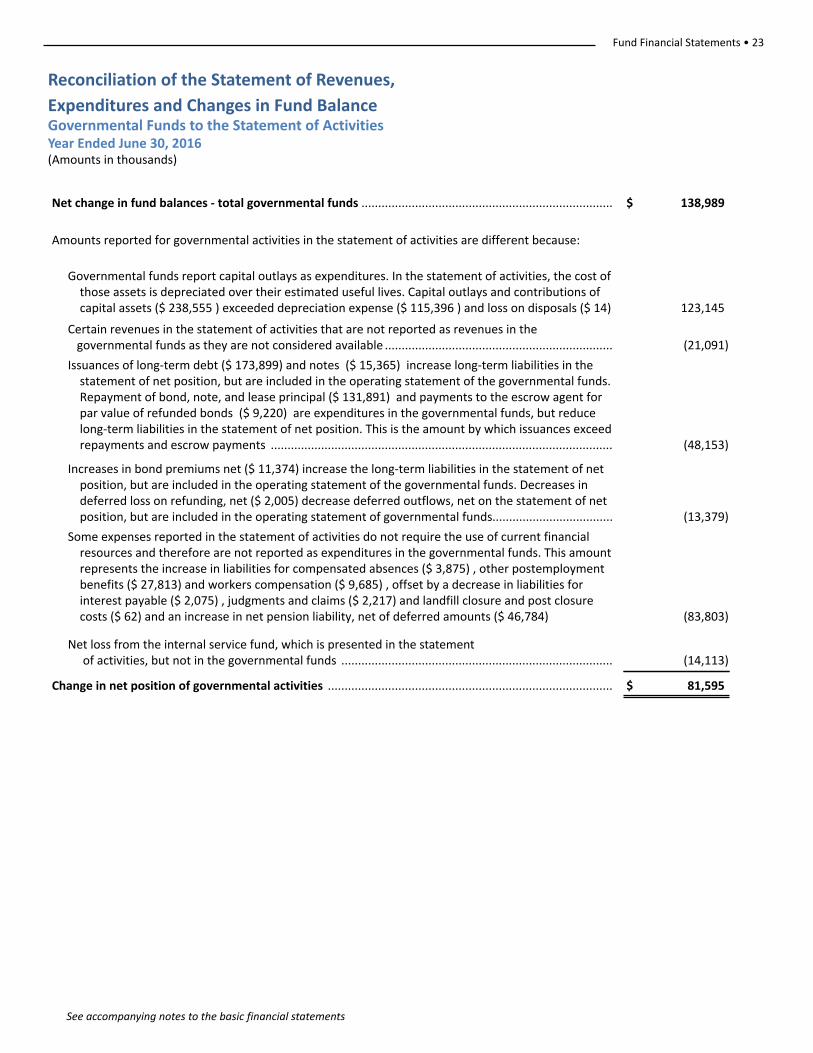
Fund Financial Statements • 23
See accompanying notes to the basic financial statements
Reconciliation of the Statement of Revenues,
Expenditures and Changes in Fund Balance Governmental Funds to the Statement of ActivitiesYear Ended June 30, 2016 (Amounts in thousands)
Net change in fund balances - total governmental funds ........................................................................... $ 138,989
Amounts reported for governmental activities in the statement of activities are different because:
Governmental funds report capital outlays as expenditures. In the statement of activities, the cost ofthose assets is depreciated over their estimated useful lives. Capital outlays and contributions ofcapital assets ($ 238,555 ) exceeded depreciation expense ($ 115,396 ) and loss on disposals ($ 14) 123,145
Certain revenues in the statement of activities that are not reported as revenues in the governmental funds as they are not considered available .................................................................... (21,091)
Issuances of long-term debt ($ 173,899) and notes ($ 15,365) increase long-term liabilities in thestatement of net position, but are included in the operating statement of the governmental funds.Repayment of bond, note, and lease principal ($ 131,891) and payments to the escrow agent forpar value of refunded bonds ($ 9,220) are expenditures in the governmental funds, but reducelong-term liabilities in the statement of net position. This is the amount by which issuances exceedrepayments and escrow payments ...................................................................................................... (48,153)
Increases in bond premiums net ($ 11,374) increase the long-term liabilities in the statement of netposition, but are included in the operating statement of the governmental funds. Decreases indeferred loss on refunding, net ($ 2,005) decrease deferred outflows, net on the statement of netposition, but are included in the operating statement of governmental funds.................................... (13,379)
Some expenses reported in the statement of activities do not require the use of current financialresources and therefore are not reported as expenditures in the governmental funds. This amountrepresents the increase in liabilities for compensated absences ($ 3,875) , other postemploymentbenefits ($ 27,813) and workers compensation ($ 9,685) , offset by a decrease in liabilities forinterest payable ($ 2,075) , judgments and claims ($ 2,217) and landfill closure and post closurecosts ($ 62) and an increase in net pension liability, net of deferred amounts ($ 46,784) (83,803)
Net loss from the internal service fund, which is presented in the statement of activities, but not in the governmental funds ................................................................................. (14,113)
Change in net position of governmental activities ..................................................................................... $ 81,595
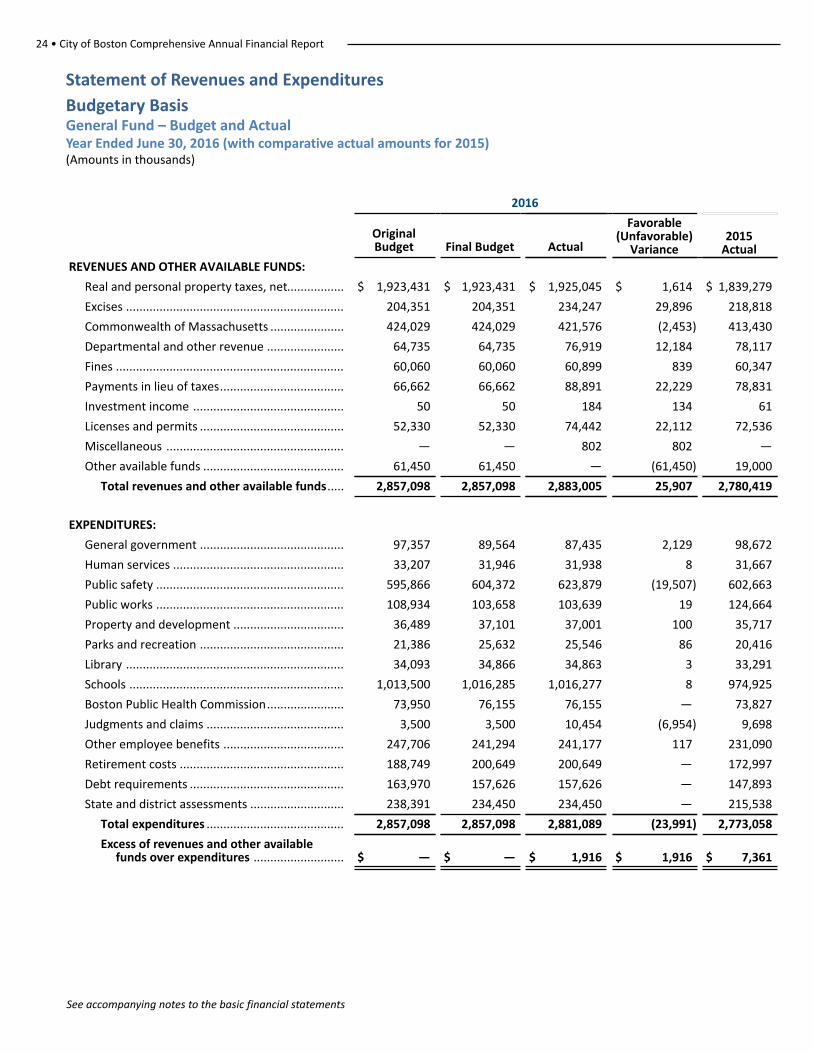
24 • City of Boston Comprehensive Annual Financial Report
See accompanying notes to the basic financial statements
Statement of Revenues and Expenditures
Budgetary BasisGeneral Fund – Budget and ActualYear Ended June 30, 2016 (with comparative actual amounts for 2015)(Amounts in thousands)
2016
OriginalBudget Final Budget Actual
Favorable(Unfavorable)
Variance2015
ActualREVENUES AND OTHER AVAILABLE FUNDS:
Real and personal property taxes, net................. $ 1,923,431 $ 1,923,431 $ 1,925,045 $ 1,614 $ 1,839,279
Excises ................................................................. 204,351 204,351 234,247 29,896 218,818
Commonwealth of Massachusetts ...................... 424,029 424,029 421,576 (2,453) 413,430
Departmental and other revenue ....................... 64,735 64,735 76,919 12,184 78,117
Fines .................................................................... 60,060 60,060 60,899 839 60,347
Payments in lieu of taxes..................................... 66,662 66,662 88,891 22,229 78,831
Investment income ............................................. 50 50 184 134 61
Licenses and permits ........................................... 52,330 52,330 74,442 22,112 72,536
Miscellaneous ..................................................... — — 802 802 —
Other available funds .......................................... 61,450 61,450 — (61,450) 19,000
Total revenues and other available funds..... 2,857,098 2,857,098 2,883,005 25,907 2,780,419
EXPENDITURES:
General government ........................................... 97,357 89,564 87,435 2,129 98,672
Human services ................................................... 33,207 31,946 31,938 8 31,667
Public safety ........................................................ 595,866 604,372 623,879 (19,507) 602,663
Public works ........................................................ 108,934 103,658 103,639 19 124,664
Property and development ................................. 36,489 37,101 37,001 100 35,717
Parks and recreation ........................................... 21,386 25,632 25,546 86 20,416
Library ................................................................. 34,093 34,866 34,863 3 33,291
Schools ................................................................ 1,013,500 1,016,285 1,016,277 8 974,925
Boston Public Health Commission....................... 73,950 76,155 76,155 — 73,827
Judgments and claims ......................................... 3,500 3,500 10,454 (6,954) 9,698
Other employee benefits .................................... 247,706 241,294 241,177 117 231,090
Retirement costs ................................................. 188,749 200,649 200,649 — 172,997
Debt requirements .............................................. 163,970 157,626 157,626 — 147,893
State and district assessments ............................ 238,391 234,450 234,450 — 215,538
Total expenditures ......................................... 2,857,098 2,857,098 2,881,089 (23,991) 2,773,058
Excess of revenues and other available funds over expenditures ........................... $ — $ — $ 1,916 $ 1,916 $ 7,361
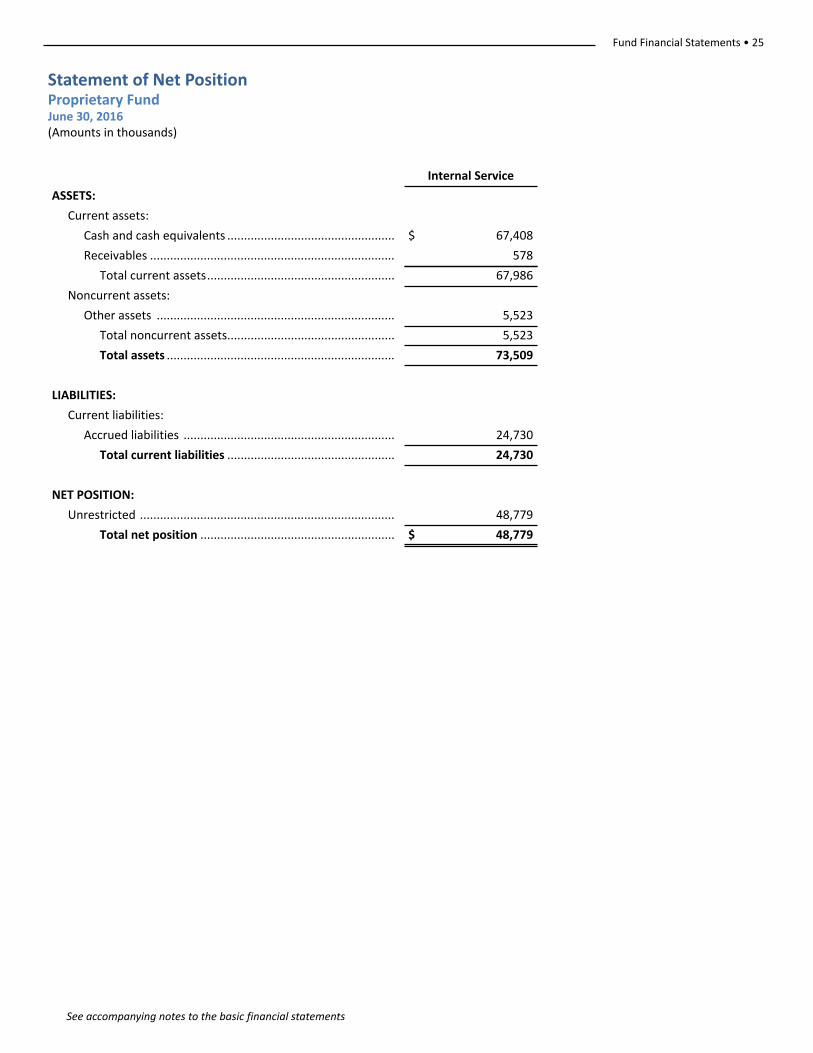
Fund Financial Statements • 25
See accompanying notes to the basic financial statements
Statement of Net Position Proprietary FundJune 30, 2016 (Amounts in thousands)
Internal Service
ASSETS:
Current assets:
Cash and cash equivalents .................................................. $ 67,408
Receivables ......................................................................... 578
Total current assets........................................................ 67,986
Noncurrent assets:
Other assets ....................................................................... 5,523
Total noncurrent assets.................................................. 5,523
Total assets .................................................................... 73,509
LIABILITIES:
Current liabilities:
Accrued liabilities ............................................................... 24,730
Total current liabilities .................................................. 24,730
NET POSITION:
Unrestricted ............................................................................ 48,779
Total net position .......................................................... $ 48,779
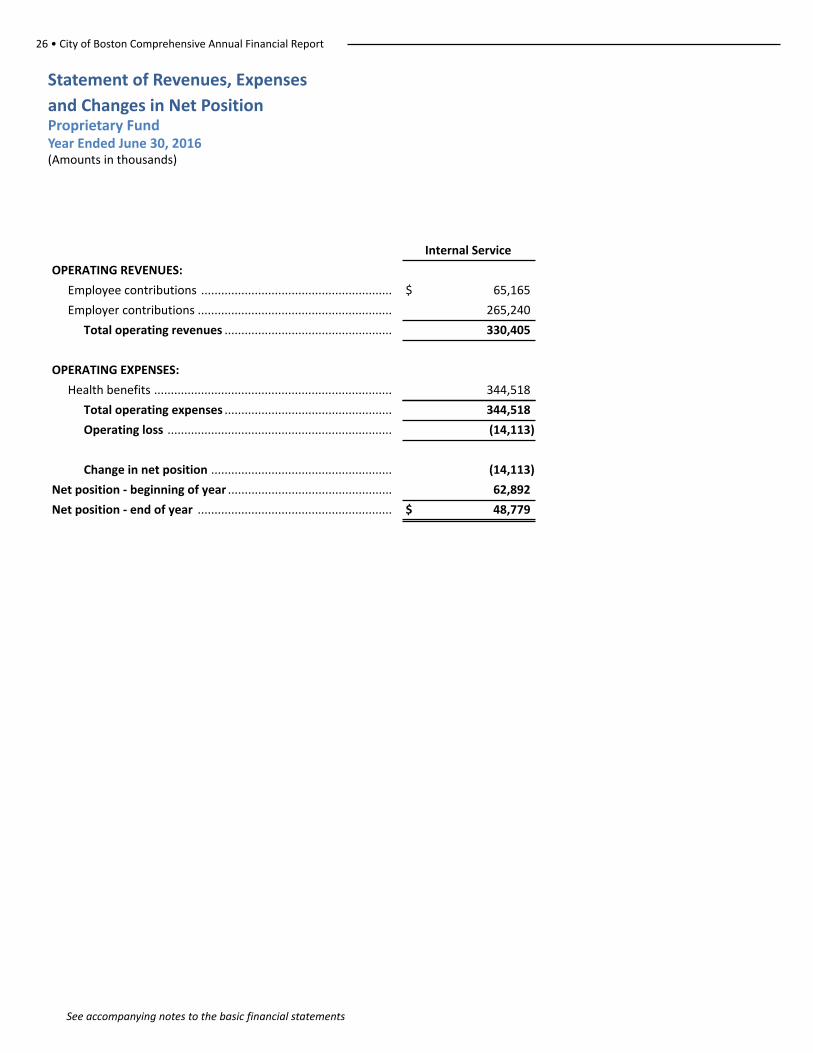
26 • City of Boston Comprehensive Annual Financial Report
See accompanying notes to the basic financial statements
Statement of Revenues, Expenses
and Changes in Net PositionProprietary FundYear Ended June 30, 2016 (Amounts in thousands)
Internal Service
OPERATING REVENUES:
Employee contributions ......................................................... $ 65,165
Employer contributions .......................................................... 265,240
Total operating revenues .................................................. 330,405
OPERATING EXPENSES:
Health benefits ....................................................................... 344,518
Total operating expenses .................................................. 344,518
Operating loss ................................................................... (14,113)
Change in net position ...................................................... (14,113)
Net position - beginning of year ................................................. 62,892
Net position - end of year .......................................................... $ 48,779
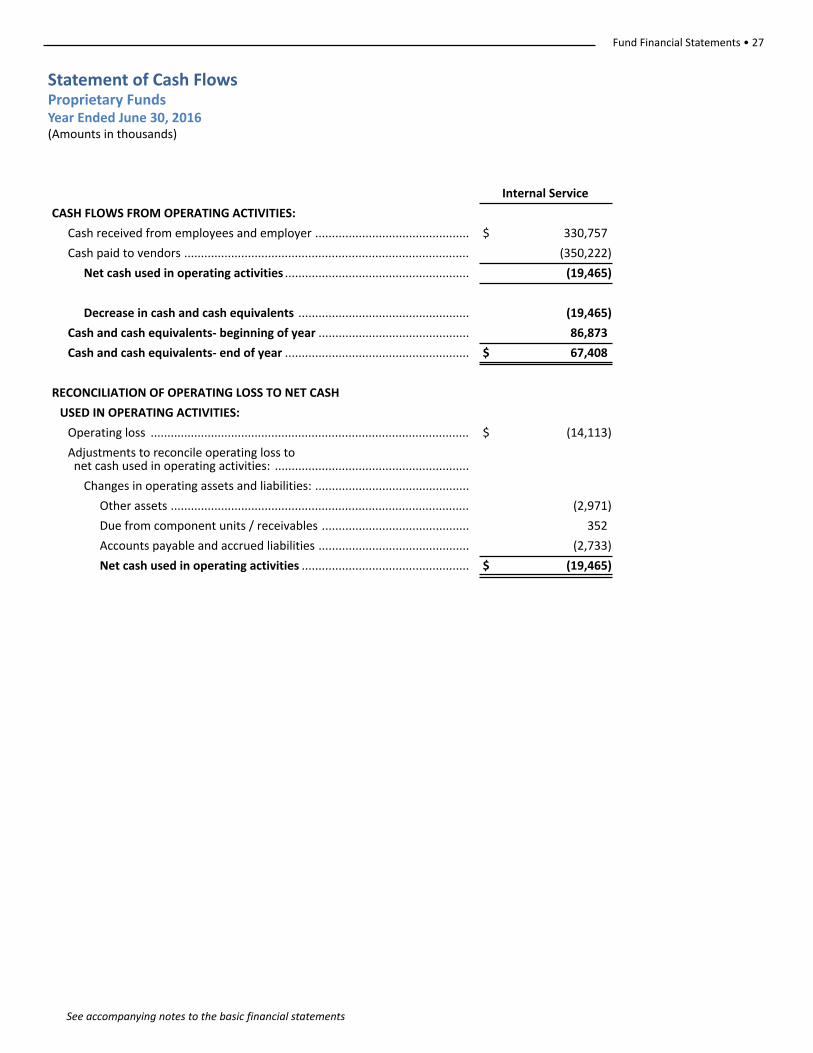
Fund Financial Statements • 27
See accompanying notes to the basic financial statements
Statement of Cash Flows Proprietary FundsYear Ended June 30, 2016 (Amounts in thousands)
Internal Service
CASH FLOWS FROM OPERATING ACTIVITIES:
Cash received from employees and employer .............................................. $ 330,757
Cash paid to vendors ..................................................................................... (350,222)
Net cash used in operating activities ....................................................... (19,465)
Decrease in cash and cash equivalents ................................................... (19,465)
Cash and cash equivalents- beginning of year ............................................. 86,873
Cash and cash equivalents- end of year ....................................................... $ 67,408
RECONCILIATION OF OPERATING LOSS TO NET CASH
USED IN OPERATING ACTIVITIES:
Operating loss ............................................................................................... $ (14,113)
Adjustments to reconcile operating loss to net cash used in operating activities: ..........................................................
Changes in operating assets and liabilities: ..............................................
Other assets ......................................................................................... (2,971)
Due from component units / receivables ............................................ 352
Accounts payable and accrued liabilities ............................................. (2,733)
Net cash used in operating activities .................................................. $ (19,465)
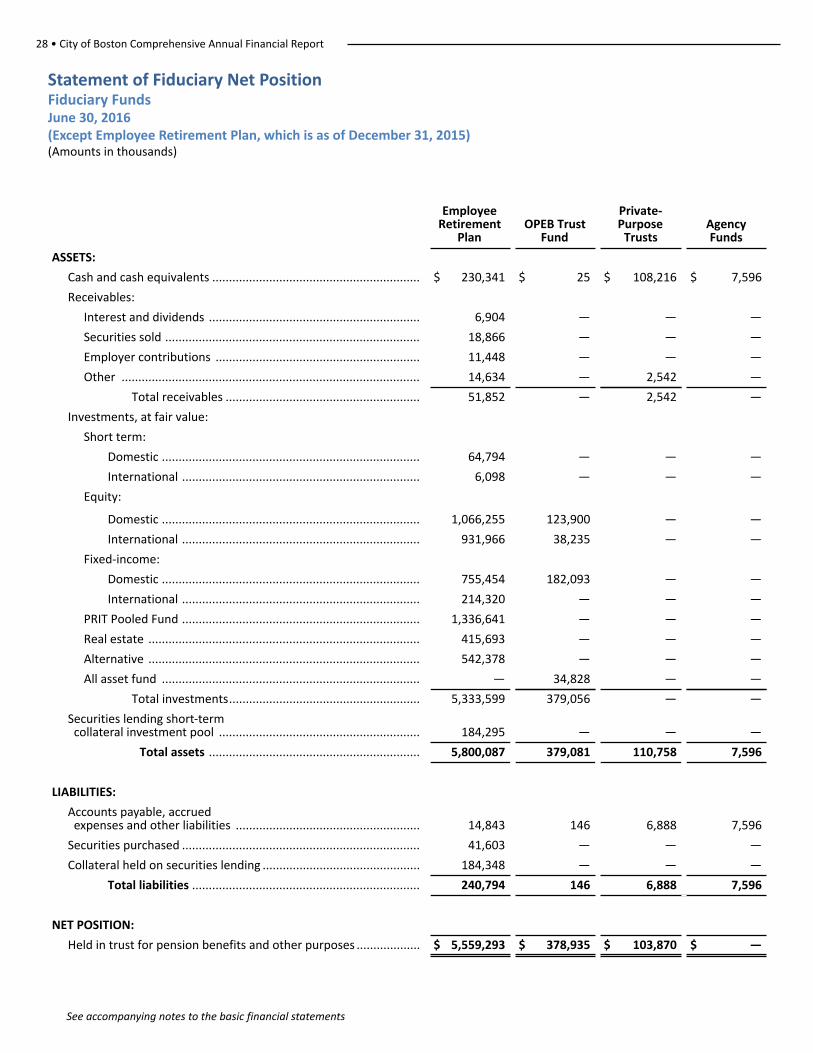
28 • City of Boston Comprehensive Annual Financial Report
See accompanying notes to the basic financial statements
Statement of Fiduciary Net PositionFiduciary FundsJune 30, 2016 (Except Employee Retirement Plan, which is as of December 31, 2015)(Amounts in thousands)
EmployeeRetirement
PlanOPEB Trust
Fund
Private-Purpose
TrustsAgencyFunds
ASSETS:
Cash and cash equivalents .............................................................. $ 230,341 $ 25 $ 108,216 $ 7,596
Receivables:
Interest and dividends ............................................................... 6,904 — — —
Securities sold ............................................................................ 18,866 — — —
Employer contributions ............................................................. 11,448 — — —
Other ......................................................................................... 14,634 — 2,542 —
Total receivables .......................................................... 51,852 — 2,542 —
Investments, at fair value:
Short term:
Domestic ............................................................................. 64,794 — — —
International ....................................................................... 6,098 — — —
Equity:
Domestic ............................................................................. 1,066,255 123,900 — —
International ....................................................................... 931,966 38,235 — —
Fixed-income:
Domestic ............................................................................. 755,454 182,093 — —
International ....................................................................... 214,320 — — —
PRIT Pooled Fund ....................................................................... 1,336,641 — — —
Real estate ................................................................................. 415,693 — — —
Alternative ................................................................................. 542,378 — — —
All asset fund ............................................................................. — 34,828 — —
Total investments......................................................... 5,333,599 379,056 — —
Securities lending short-term collateral investment pool ............................................................ 184,295 — — —
Total assets ............................................................... 5,800,087 379,081 110,758 7,596
LIABILITIES:
Accounts payable, accrued expenses and other liabilities ....................................................... 14,843 146 6,888 7,596
Securities purchased ....................................................................... 41,603 — — —
Collateral held on securities lending ............................................... 184,348 — — —
Total liabilities .................................................................... 240,794 146 6,888 7,596
NET POSITION:
Held in trust for pension benefits and other purposes ................... $ 5,559,293 $ 378,935 $ 103,870 $ —
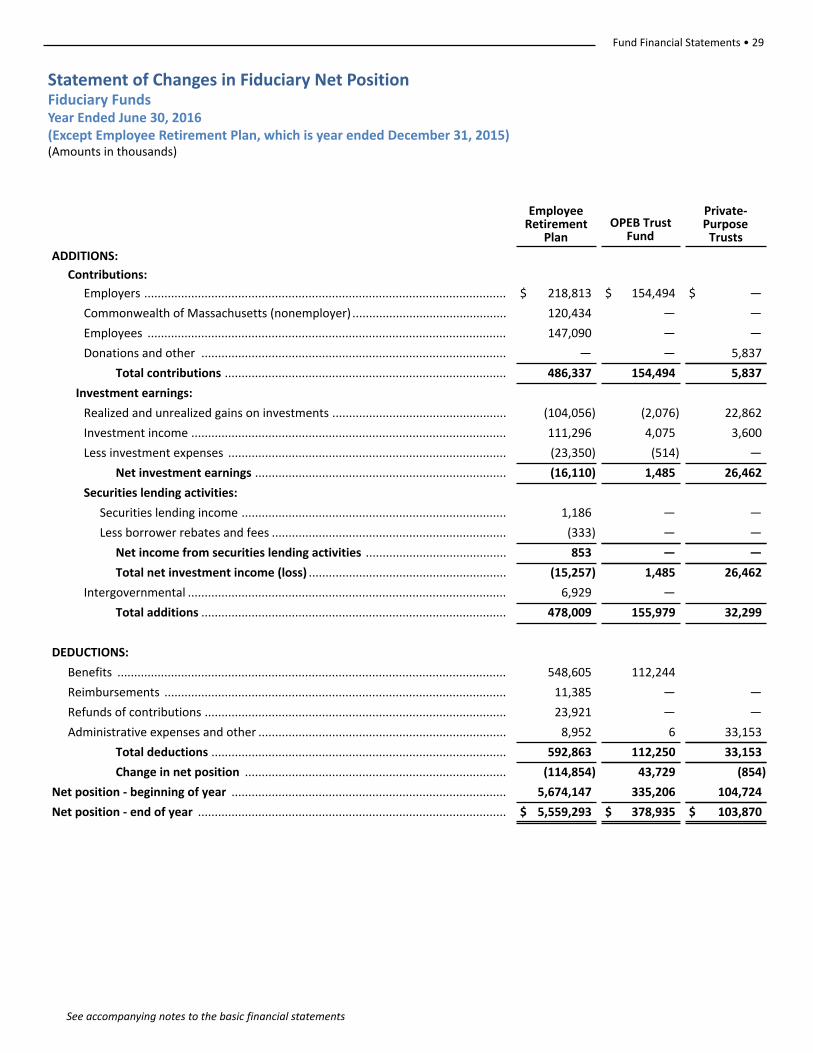
Fund Financial Statements • 29
See accompanying notes to the basic financial statements
Statement of Changes in Fiduciary Net PositionFiduciary FundsYear Ended June 30, 2016 (Except Employee Retirement Plan, which is year ended December 31, 2015)(Amounts in thousands)
EmployeeRetirement
PlanOPEB Trust
Fund
Private-Purpose
Trusts
ADDITIONS:
Contributions:
Employers ............................................................................................................ $ 218,813 $ 154,494 $ —
Commonwealth of Massachusetts (nonemployer) .............................................. 120,434 — —
Employees ........................................................................................................... 147,090 — —
Donations and other ........................................................................................... — — 5,837
Total contributions .................................................................................... 486,337 154,494 5,837
Investment earnings:
Realized and unrealized gains on investments .................................................... (104,056) (2,076) 22,862
Investment income .............................................................................................. 111,296 4,075 3,600
Less investment expenses ................................................................................... (23,350) (514) —
Net investment earnings ........................................................................... (16,110) 1,485 26,462
Securities lending activities:
Securities lending income ............................................................................... 1,186 — —
Less borrower rebates and fees ...................................................................... (333) — —
Net income from securities lending activities .......................................... 853 — —
Total net investment income (loss) ........................................................... (15,257) 1,485 26,462
Intergovernmental ............................................................................................... 6,929 —
Total additions ........................................................................................... 478,009 155,979 32,299
DEDUCTIONS:
Benefits .................................................................................................................... 548,605 112,244
Reimbursements ...................................................................................................... 11,385 — —
Refunds of contributions .......................................................................................... 23,921 — —
Administrative expenses and other .......................................................................... 8,952 6 33,153
Total deductions ........................................................................................ 592,863 112,250 33,153
Change in net position .............................................................................. (114,854) 43,729 (854)
Net position - beginning of year .................................................................................. 5,674,147 335,206 104,724
Net position - end of year ............................................................................................ $ 5,559,293 $ 378,935 $ 103,870
30 • City of Boston Comprehensive Annual Financial Report
NOTES TO THE BASIC FINANCIAL STATEMENTS
June 30, 2016
1. The Financial Reporting Entity
a. Primary Government The City of Boston (the City), incorporated as a town in 1630 and as a city in 1822, now exists under Chapter 486 of the Act of 1909 and Chapter 452 of the Acts of 1948 of the Commonwealth of Massachusetts (the Commonwealth), which, as amended, constitute the City’s Charter. The Mayor is elected to a f ear term and serves as chief executive officer of the City. The Mayor has general supervision of and control over the City’s boards, commissions, officers, and departments. The legislative body of the City is the City Council, which consists of 13 elected members serving tw ear terms.
The accompanying basic financial statements present the City and its component units. The component units discussed below are included in the City’s reporting entity because of the significance of their operational or financial relationships with the City.
b. Blended Component Units Disclosurei. Boston Retirement System (BRS) is a defined benefit contributory retirement system created under
state statute. It is administered by a Retirement Board comprising five members: the City Auditor, who serves ex officio; two individuals elected by participants in the system; a fourth member appointed by the Mayor; and a fifth member chosen by the other members. BRS provides pension benefits to retired City, Boston Planning & Development Agency, Boston Housing Authority, Boston Water and Sewer Commission, and Boston Public Health Commission employees. Although legally separate, BRS provides services entirely, or almost entirely, to the City and thus has been reported as a blended component unit among the City’s fiduciary funds. The financial statements of BRS are included for its fiscal year end which is December 31, 2015.
ii. Dudley Square Realty Corporation (DSRC) and Ferdinand Building Development Corporation (FBDC) – The DSRC is a Qualified Active Low-Income Community Business, and is the owner and developer of the Dudley Municipal Center property. FBDC is the leverage lender of the Dudley Municipal Center property. FBDC leases the property from DSRC and the City subleases the property from FBDC. The DSRC and FBDC are non-profit organizations qualified as tax-exempt entities under Section 501(c)(3) of the Internal Revenue Code. Both entities are instrumentalities of the City, as the Mayor has full control of appointments to their boards of directors. Although legally separate, both DSRC and FBDC provide services entirely, or almost entirely, to the City and thus have been reported as blended component units. These funds are presented as non-major funds within the other governmental funds as of their fiscal year end, which is June 30, 2016.
Notes to Basic Financial Statements • 31
c. Discretely Presented Component Units Disclosure These component units are reported in a separate column to emphasize that they are legally separate from the City but are included because the City is financially accountable for the organizations, meaning it appoints, at a minimum, a voting majority of the board of directors of the organization and is able to impose its will on the organizations or has a financial benefit or burden relationship with the organizations. Unless otherwise indicated, the Notes to the Financial Statements pertain only to the primary government because certain disclosures of the component units are not significant relative to the total component units and to the primary government. A description of the component units, criteria for inclusion, and their relationship with the City are as follows:
i. Boston Planning & Development Agency (BPDA) – The BPDA is legally separate from the City and a body politic and corporate constituting the City’s redevelopment authority and exercising the powers of a planning board for the City. The BPDA is governed by a five-member board, four of whom are appointed by the Mayor and confirmed by the City Council, and one of whom is appointed by the Governor of Massachusetts (same board members as the EDIC). The BPDA receives a significant amount of intergovernmental revenue, which is used solely for capital projects that are under the oversight of the BPDA. In accordance with GASB Statement No. 61, the BPDA is presented as a discrete component unit of the City.
ii. Economic Development and Industrial Corporation of Boston (EDIC) – The EDIC is legally separate from the City and a body politic and corporate and an instrumentality of the Commonwealth. The EDIC is governed by a five-member board, four of whom are appointed by the Mayor and confirmed by the City Council, and one of whom is appointed by the Governor of Massachusetts (same board members as the BPDA). The EDIC receives a significant amount of intergovernmental revenue, including grants and contracts with the City for jobs and community service activities. In accordance with GASB Statement No. 61, the EDIC is presented as a discrete component unit of the City.
iii. Boston Public Health Commission (BPHC) – The BPHC is legally separate from the City and a body politic and corporate and an instrumentality of the Commonwealth. The BPHC is governed by a seven-member board, six of whom are appointed by the Mayor and confirmed by the City Council, and one of whom is the chief executive officer of the Boston Medical Center. The BPHC receives the majority of its funding from a City appropriation, EMS and other third party billings, and federal and state grants. The BPHC expects that the City will continue to provide support for the public health programs of the BPHC. In accordance with GASB Statement No. 61, the BPHC is presented as a discrete component unit of the City.
iv. Trustees of the Public Library of the City of Boston (TPL) – The TPL is legally separate from the City of Boston and is a non-profit organization qualified as a tax-exempt entity under Section 501(c)(3) of the Internal Revenue Code. The trustees of the TPL are appointed by the Mayor and the TPL places substantial reliance upon the City to fund its daily operations. In addition, the Library receives significant support through state and federal government appropriations and private sources. In accordance with GASB Statement No. 61, the TPL is presented as a discrete component unit of the City.
The financial statements of the discretely presented component units are included for their respective fiscal year ends, which is June 30, 2016.
32 • City of Boston Comprehensive Annual Financial Report
Complete financial statements of these discretely presented component units can be obtained through the City Auditor’s office, R City Hall Plaza, Boston, Massachusetts 02201. In addition, condensed financial statements for the discretely presented component units are included in note 20.
d. Related Organizations The Mayor is also responsible for appointing members of the governing bodies of the Boston Housing Authority, Boston Industrial Development Finance Authority, and Boston Water and Sewer Commission; however, the City’s accountability for these organizations does not extend beyond making these appointments.
2. Summary of Significant Accounting Policies
The accounting policies of the City conform to U.S. generally accepted accounting principles as applicable to governmental units as prescribed by the Governmental Accounting Standards Board (GASB). The following is a summary of the more significant policies followed by the City:
a. Government-wide and Fund Financial Statements The Government-wide Financial Statements (i.e., the Statement of Net Position and the Statement of Activities) report information on all of the nonfiduciary activities of the primary government and its component units. For the most part, the effect of interfund activity has been removed from these statements. Governmental activities, which normally are supported by taxes and intergovernmental revenues, are reported separately from any activities, which rely to a significant extent on fees and charges for support. The City currently reports no business-type activities. Likewise, the primary government is reported separately from certain legally separate component units for which the primary government is financially accountable.
The Statement of Activities demonstrates the degree to which the direct expenses of a given function or segment is offset by program revenues. Direct expenses are those that are clearly identifiable with a specific function or segment. Program revenues include 1) charges to customers or applicants who purchase, use, or directly benefit from goods, services, or privileges provided by a given function or segment and 2) grants and contributions that are restricted to meeting the operational or capital requirements of a particular function or segment. Taxes and other items not properly included among program revenues are reported instead as general revenues.
Separate financial statements are provided for Governmental Funds, Proprietary Funds, and Fiduciary Funds, even though the latter are excluded from the Government-wide Financial Statements. Major individual Governmental Funds are reported as separate columns in the Fund Financial Statements.
b. Measurement Focus, Basis of Accounting, and Financial Statement Presentationi. Government-wide Financial Statements
The Government-wide Financial Statements are reported using the economic resources measurement focus and the accrual basis of accounting, as are the Proprietary Fund and Fiduciary Fund Financial Statements. The Agency Fund within the Fiduciary Fund Financial Statements has no measurement of results. Revenues are recorded when earned and expenses are recorded when a liability is incurred, regardless of the timing of related cash flows. Property taxes are recognized as revenues in the year for which they are levied. Grants and similar items are recognized as revenue as soon as all eligibility requirements for recognition have been met.
Notes to Basic Financial Statements • 33
ii. Governmental Fund Financial Statements Governmental Fund Financial Statements are reported using the current financial resources measurement focus and the modified accrual basis of accounting. Revenues are recognized as soon as they are “susceptible to accrual” (i.e., both measurable and available). Revenues not considered to be available are recorded as deferred inflows of resources.
The City applies the susceptible to accrual criteria to property and other taxes and intergovernmental revenues. In applying the susceptible to accrual concept to intergovernmental revenues, there are essentially two types of revenues. In one, resources must be expended on the specific purpose or project before any amounts will be reimbursed to the City; therefore, revenues are recognized based upon the amount of expenditures incurred subject to availability requirements. In the other, resources are virtually unrestricted and are usually revocable by the grantor only for failure to comply with prescribed compliance requirements. These resources are reflected as revenues at the time of receipt or earlier if the susceptible to accrual criteria are met. Property and other taxes are recognized as revenue in the year for which taxes have been levied or earned, provided they are collected within 60 days after year-end. Generally, intergovernmental revenues are recognized as revenue provided they are earned during the year and collected within one year after year-end, except for Massachusetts School Building Authority (MSBA) and Chapter 90 receivables which are considered available when received.
Expenditures generally are recorded when a liability is incurred. However, debt service expenditures, as well as expenditures related to long-term liabilities including compensated absences, other postemployment benefits, workers’ compensation and judgments and claims, are recorded only when payment is mature and due.
iii. Proprietary Fund Financial Statements Proprietary funds distinguish operating revenues and expenses from nonoperating items. Operating revenues and expenses generally result from the provision of services. The principal operating revenues of the City’s Internal Service Funds are receipts from employer and employees for health insurance premiums. Operating expenses for the Internal Service Fund include administrative expenses, vendor payments, and health benefits. Any revenues and expenses not meeting this definition are reported as nonoperating revenues and expenses.
iv. Description of Major Funds Governmental funds – The City reports the following major governmental funds:
1. The General Fund is the City’s primary operating fund. It accounts for all financial resources of the general government, except those required to be accounted for in another fund.
2. The Special Revenue Fund accounts for the proceeds of specific revenue sources (other than trusts for individuals, private organizations, or other governments, or for major capital projects) that are legally restricted or assigned to expenditures for various general governmental functions.
3. The Capital Projects Fund accounts for bond proceeds and grant revenues used for the acquisition or construction of the City’s capital facilities.
Proprietary fund –The City reports the following proprietary fund:4. The City uses an internal service fund to account for its ed health costs.
Although the fund is presented in a separate column in the accompanying proprietary fund financial statements, it is not considered a major fund.
34 • City of Boston Comprehensive Annual Financial Report
Fiduciary Funds – The City reports the following fiduciary fund types:5. The Private Purpose Trust Funds are used to account for resources legally held in trust
for the benefit of individuals, private organizations, or other governments. The City operates four pools used for the improvement of the City’s parks and cemeteries, educational scholarships and sporting equipment, creation of public utility and beauty, and co-mingled nontestamentary trusts.
6. The Pension Trust Fund accounts principally for the activities of the Boston Retirement System, a blended component unit, which accumulates resources for pension benefit payments to retired employees of the City and other entities.
7. The OPEB Trust Fund is an irrevocable trust fund established for other postemployment benefits. The assets are appropriated from the General Fund and accumulate to reduce the unfunded actuarial liability for health care and other postemployment benefits. The assets of the trust are currently not used for direct payments of benefits.
8. The Agency Funds are used to report funds held by the City in a purely custodial capacity. The City currently operates a drug evidence account for proceeds of property seized from illegal drug-related activities. These funds are then used to offset the costs of technical equipment or expertise and investigations.
c. Cash Equivalents For purposes of the statement of cash flows, investments with original maturities of three months or less when purchased are considered to be cash equivalents.
d. Basis of Investment Valuation Investments generally are presented in the accompanying basic financial statements at fair value. Where applicable, fair values are based on quotations from national securities exchanges, except for certain investments of BRS, which are described in notes 5 and 11. Further, income from investments is recognized in the same fund as the related investments.
The City invests in the Massachusetts Municipal Depository Trust (MMDT) Cash Portfolio, which is an external investment pool and is not SEC-registered. The fund is state-regulated and is valued at amortized cost.
e. Interfund Receivables and Payables Activity between funds that are representative of lending/borrowing arrangements outstanding at the end of the fiscal year are referred to as either “due to/from other funds” (i.e., the current portion of interfund loans) or “advances to/from other funds” (i.e., the noncurrent portion of interfund loans). All other outstanding balances between funds are reported as “due to/from other funds.”
f. Uncollectible Tax and Other Receivables All receivables are shown net of an allowance for uncollectibles. Amounts considered to be uncollectible are based on the type and age of the related receivable.
g. Capital Assets Capital assets include property, plant, equipment, and infrastructure assets (e.g., roads, bridges, sidewalks, and similar items), and intangible assets such as easements, land use rights, computer software, trademarks and patents. Capital assets are reported in the governmental activities column in the Government-wide Financial Statements. Capital assets are defined by the City as assets with an initial, individual cost of more than $25,000 and an estimated useful life in excess of one year. Such assets are recorded at historical cost or estimated historical cost if purchased or constructed. Donated capital assets are recorded at acquisition value at the date of donation. Any significant construction commitments are encumbered at y in the City’s Capital Projects Fund.
Notes to Basic Financial Statements • 35
The costs of normal maintenance and repairs that do not add to the capacity or efficiency of the asset or materially extend assets’ useful lives are not capitalized.
Capital assets of the primary government are depreciated using the straigh method over the following estimated useful lives:
Assets Years
Buildings 30
Building improvements 30
Infrastructure 30
Land improvements - major 30
Land improvements - playgrounds 15
Computer upgrades 10
Equipment and machinery 10
Intangible assets, computer software and licenses 5
Computers and related equipment 3
Furniture and fixtures 3
Motor vehicles 3
h. Compensated Absences Employees are granted sick and vacation leave in varying amounts. Upon retirement, termination, or death, certain employees are compensated for unused sick and vacation leave (subject to certain limitations) at their then current rates of pay. Public Safety employees are compensated for unused personal leave in addition to sick and vacation leave. The portion of the liability related to unused sick and vacation time that has matured or is due as of June 30, 2016 is recorded in the Governmental Fund Financial Statements. The entire amount of the liability is reported in governmental activities in the Government-wide Financial Statements. The liability for vacation leave is based on the amount earned but not used; for sick leave, it is based on the amount accumulated at the balance sheet date that would be paid upon termination (vesting method). The liability for both amounts is calculated based on the pay or salary rates in effect at the balance sheet date.
i. erm Obligations and Related Costs Long-term debt and other erm obligations are reported as liabilities in the Government-wide Statement of Net Position. Bond premiums and discounts are capitalized and amortized over the life of the bonds using the straight line method, which approximates the effective interest method. The unamortized portion is presented in the Government-wide Statement of Net Position as a component of bonds payable. Bond issuance costs are reported as expenses when incurred.
The Governmental Fund Financial Statements recognize bond premiums and discounts, as well as bond issuance costs, during the period incurred. The face amount of debt issued is reported as other financing sources. Premiums received on debt issuances are reported as other financing sources while discounts on debt issuances are reported as other financing uses. Issuance costs, whether or not withheld from the actual debt proceeds received, are reported as debt service expenditures.
36 • City of Boston Comprehensive Annual Financial Report
j. Net Position and Fund Balance In the Government-wide and Proprietary Fund Financial Statements, net position is reported in the following categories:
Net investment in capital assets: Capital assets, net of accumulated depreciation, and outstanding
principal balances of debt attributable to the acquisition, construction, or improvement of those
assets.
Restricted: Net position the use of which is subject to constraints imposed by external parties,
including creditors, grantors, and laws and regulations of other governments, or imposed by City
Charter or enabling legislation. Nonexpendable amounts are required to remain intact under such
constraints.
Unrestricted: Remaining net position not considered net investment in capital assets or restricted.
For purposes of net position classification, when both restricted and unrestricted resources are available for use, it is the City’s policy to use restricted resources first, then unrestricted resources as they are needed.
In the Governmental Fund Financial Statements, fund balance is reported in the following categories:
Nonspendable: Amounts that cannot be spent because they are either not in spendable form or
they are legally or contractually required to remain intact.
Restricted: Amounts the use of which is subject to constraints imposed by external parties, including
creditors, grantors, and laws and regulations of other governments, or imposed by City Charter or
enabling legislation.
Committed: Amounts that can only be used for specific purposes pursuant to constraints imposed
by formal action of the government’s highest level of decision-making authority. For the City, this
formal action takes the form of statutes which are passed by the City Council and approved by the
Mayor.
Assigned: Amounts that are constrained by the City’s intent for use for specific purposes, but are
considered neither restricted or committed. Under M.G.L. Chapter 190, Acts of 1982, the City Auditor
has the authority to assign amounts to be used for specific purposes on behalf of the City.
Unassigned: Amounts in the general fund that are not otherwise constrained for a specific purpose
more narrow than the general operations of the City. The City maintains a formal policy that
unassigned fund balance in the General Fund be at least 15 percent of the current year’s General
Fund GAAP basis operating expenditures.
For purposes of fund balance classification, when both restricted and unrestricted resources are available for use, it is the City’s policy to use restricted resources first, then unrestricted resources as they are needed. When unrestricted resources are used, committed resources are used first, followed by assigned and unassigned resources, respectively.
k. Tax Abatement RefundsMatured tax abatement refunds that are due and payable at June 30 have been recorded as a liability in the General Fund. A liability for estimated future tax abatement refunds has been recorded in the Government-wide Statement of Net Position.
Notes to Basic Financial Statements • 37
l. Landfill Closure and Postclosure Care Costs State and federal regulations require the City to place a final cover on its Gardner Street landfill site when it stops accepting waste and to perform certain maintenance and monitoring functions at the site for 30 years after closure. At June 30, 2016, 100% of the Gardner Street landfill site had been used and has not accepted solid waste for several years. While most of the landfill closure construction was completed in prior years, there still remains 12 acres of the landfill to be capped as of June 30, 2016.
The total current cost of landfill closure and postclosure care is an estimate, subject to changes resulting from inflation, deflation, technology, or other changes in applicable laws or regulations. Such costs are recognized as expenditures in the General Fund to the extent that they are due or matured and are expected to be paid with expendable available financial resources. The total liability is reported in the Government-wide Statement of Net Position. Expenditures related to the Gardner Street landfill site postclosure care in fiscal year 2016 were $62 thousand.
m. Use of Estimates The preparation of the accompanying basic financial statements in conformity with U.S. generally accepted accounting principles requires management to make estimates and assumptions that affect the reported amounts of assets and liabilities and disclosure of contingent assets and liabilities at the date of the financial statements and the reported amounts of revenues and expenses during the reporting period. Actual results could differ from those estimates.
n. Adoption of Accounting PronouncementsThe City adopted Governmental Accounting Standards Board (GASB) Statement No. 72, "Fair Value Measurement and Application." The scope of this statement is to improve financial reporting by clarifying the definition of fair value for financial reporting purposes, establishing general principals for measuring fair value, providing additional fair value application guidance, and enhancing disclosures about fair value measurements. The City has incorporated the required disclosures about fair value measurements, but adoption of the statement did not impact financial statement amounts.
3. erm Debt
During fiscal year 2016, the City had no erm debt issued or outstanding.
4. Budgetary Data
The General Fund is the only fund for which a budget is legally adopted. The budgets for all departments included in the General Fund of the City, except the School Department, are prepared under the direction of the Mayor and City Council. The School Department budget is prepared under the direction of the School Committee.
Original and supplemental appropriations are submitted by the Mayor, approved by the City Council, and lapse at y unless encumbered. The legal level of control over appropriations is at the department level. Amendments to the original budget must be approved by the City Council, except for a reallocation of appropriations of up to $3.0 million, which the Mayor may approve. Further, the City Auditor, with the approval of the Mayor, may make transfers from any appropriation to any other appropriation for purposes of eliminating deficits before closing the books for the fiscal year. After the close of the fiscal year, the City Auditor may, with the approval of the Mayor, apply any income, taxes, and funds not disposed of and make transfers from any appropriation to any other appropriation for the purpose of closing the accounts for the fiscal year.
The City must establish its property tax rate each year so that the resulting property tax levy will comply with the limits required by Proposition (note 6). The tax levy must equal the sum of (a) the aggregate of all
38 • City of Boston Comprehensive Annual Financial Report
annual appropriations for expenditures; plus (b) the reserve accounts described in the following paragraph; plus (c) provision for the prior fiscal years’ deficits, if any; less (d) the aggregate of all non-property tax revenues projected to be received by the City, including available funds, in amounts certified or approved by the Commonwealth for tax rate purposes.
In accordance with the 1986 amendments to the Funding Loan Act of 1982, the City has established two reserve funds. The first is a budget reserve fund, which is required to be funded in stages to a final level of of the prior year’s overall departmental appropriations, except the School Department, by the beginning of fiscal year 1990. It is available to be applied to extraordinary and unforeseen expenditures. The second is a separate reserve fund of 1% to 2-1/2% of the current year appropriation of the School Department to be applied to over-expenditures in that department.
The City’s General Fund budget is prepared on a basis other than accounting principles generally accepted in the United States of America (GAAP). The “actual” results column in the Statement of Revenues and Expenditures – Budgetary Basis – General Fund is presented on a “budgetary basis” to provide a meaningful comparison of actual results with the budget. The major differences between the budget and GAAP basis, where applicable, are that:
i. Revenues are recorded when cash is received, except for real estate and personal property taxes, which are recorded as revenue when levied (budget), as opposed to when susceptible to accrual (GAAP).
ii. Encumbrances and continuing appropriations are recorded as the equivalent of expenditures (budget) but have no effect on GAAP expenditures.
iii. Certain activities and transactions are presented in separate funds (GAAP), rather than as components of the General Fund (budget).
iv. Amounts raised for the prior years’ deficits and available funds from prior years’ surpluses are recorded as revenue items (budget), but have no effect on GAAP revenues.
In addition, there are certain differences in classifications between revenues, expenditures, and transfers. The following reconciliation summarizes the differences between budgetary and GAAP basis accounting principles for the year ended June 30, 2016 (in thousands):
Revenue Expenditures
Other financing uses, net
Excess of revenue and
other financing sources
As reported on a budgetary basis $ 2,883,005 2,881,089 — 1,916
Adjustments:
Revenues to modified accrual basis 52,342 — 52,342
Expenditures, encumbrances, and accruals, net — (32,573) — 32,573
On-behalf contribution for teachers pension 120,434 120,434 — —
Reclassifications:
Other transfers (1,455) 1,455 —
As reported on a GAAP basis $ 3,055,781 $ 2,967,495 $ 1,455 $ 86,831
Notes to Basic Financial Statements • 39
5. Deposits and Investments
State and local statutes place certain limitations on the nature of deposits and investments available to the City. Deposits, including demand deposits, money markets, and certificates of deposit in any one financial institution, may not exceed 60% of the capital and surplus of such institution unless collateralized by the financial institution involved. Investments from operating cash in the general fund may be made in unconditionally guaranteed U.S. government obligations having maturities of a year or less from the date of purchase, or through repurchase agreements with maturities of no greater than 90 days in which the underlying securities consist of such obligations. Other allowable investments include authorized bonds of all states, bankers’ acceptances, commercial paper rated within the three highest classifications established by rating agencies, and units in the MMDT. MMDT, which is an external investment pool that is overseen by the Treasurer of the Commonwealth of Massachusetts, meets the criteria established by GASB 79 to report its investments at amortized cost; therefore the City reports its investments in MMDT at amortized cost which approximates the net asset value of $1.00 per share. MMDT has a maturity of less than 1 year and is not rated. The three highest commercial paper classifications for Moody’s and Standard & Poor’s (S&P) are as follows:
Commercial Paper Credit RatingsMoody's S&P
Superior P1 A1+ or A1Satisfactory P2 A2Adequate P3 A3
Primary Government (except the pension trust fund)
a. Custodial Credit Risk
Custodial credit risk is the risk that in the event of bank failure, the City’s deposits or investments may not
be returned. The City carries deposits that are fully insured by FDIC insurance or collateralized in the City’s
name. All of the City’s investments are held by third parties in the City’s name. As of June 30, 2016, the City
of Boston Trust Funds had uninsured and uncollateralized deposits of $14.6 million and uninsured and
uncollateralized investments of $1.5 million.
b. Investment Policy
The City’s primary concern in connection with its investment activities is a concern shared by all municipal
governments: the preservation of capital. The City’s investment policy establishes a discipline in which all
of the City’s investment activities may be safely conducted while it strives to use its capital resources as
efficiently as possible. The foundation of that discipline is fixed by Massachusetts General Laws (M.G.L.)
c. 44, sec. 55, which prohibits Massachusetts communities from investing in certain categories of
investments; limits the amount of the City’s bank deposits in any one financial institution; and establishes
qualifying criteria for banking institutions. Further, all investments held by third parties are to be held in
the City’s name.
c. Interest Rate Risk
Interest rate risk is the risk that changes in interest rates will adversely affect the fair value of an investment.
It is the City of Boston Trust Funds’ policy to limit the average duration of an actively managed fixed income
portfolio to no more than seven years. The following is a listing of the City’s fixed income investments (in
thousands) and related maturity schedule (in years) as of June 30, 2016:
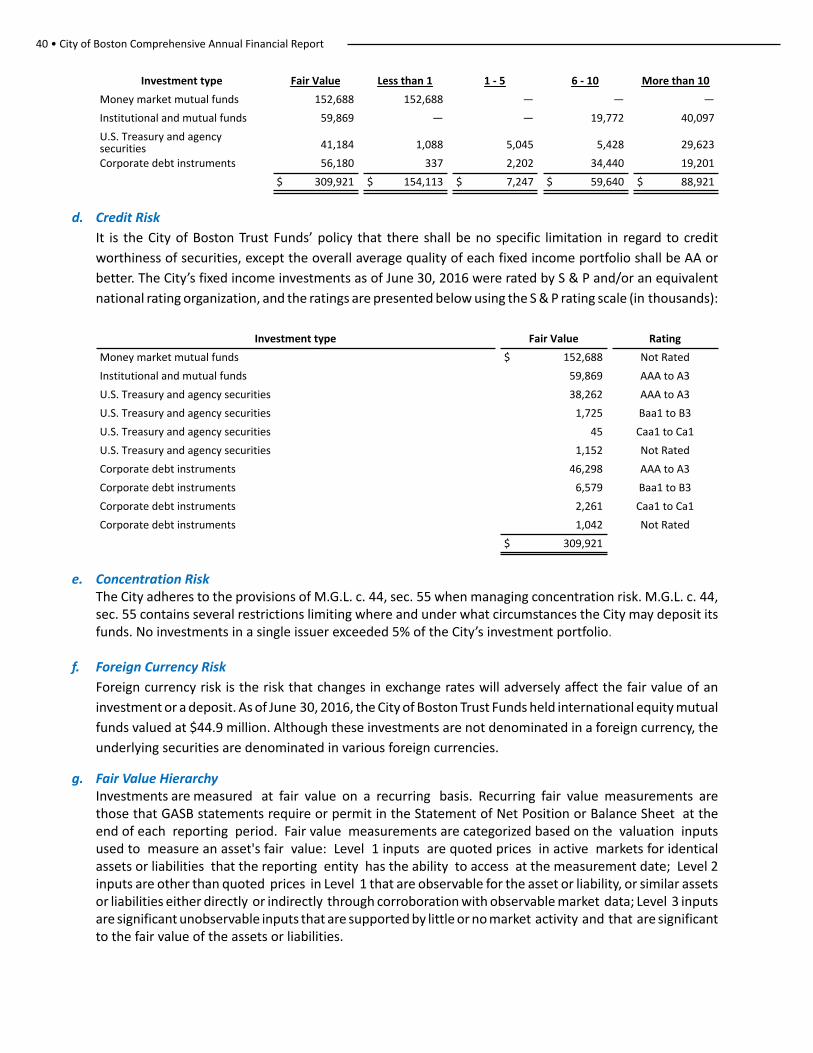
40 • City of Boston Comprehensive Annual Financial Report
Investment type Fair Value Less than 1 1 - 5 6 - 10 More than 10
Money market mutual funds 152,688 152,688 — — —
Institutional and mutual funds 59,869 — — 19,772 40,097
U.S. Treasury and agencysecurities 41,184 1,088 5,045 5,428 29,623
Corporate debt instruments 56,180 337 2,202 34,440 19,201
$ 309,921 $ 154,113 $ 7,247 $ 59,640 $ 88,921
d. Credit Risk
It is the City of Boston Trust Funds’ policy that there shall be no specific limitation in regard to credit
worthiness of securities, except the overall average quality of each fixed income portfolio shall be AA or
better. The City’s fixed income investments as of June 30, 2016 were rated by S & P and/or an equivalent
national rating organization, and the ratings are presented below using the S & P rating scale (in thousands):
Investment type Fair Value Rating
Money market mutual funds $ 152,688 Not Rated
Institutional and mutual funds 59,869 AAA to A3
U.S. Treasury and agency securities 38,262 AAA to A3
U.S. Treasury and agency securities 1,725 Baa1 to B3
U.S. Treasury and agency securities 45 Caa1 to Ca1
U.S. Treasury and agency securities 1,152 Not Rated
Corporate debt instruments 46,298 AAA to A3
Corporate debt instruments 6,579 Baa1 to B3
Corporate debt instruments 2,261 Caa1 to Ca1
Corporate debt instruments 1,042 Not Rated
$ 309,921
e. Concentration RiskThe City adheres to the provisions of M.G.L. c. 44, sec. 55 when managing concentration risk. M.G.L. c. 44, sec. 55 contains several restrictions limiting where and under what circumstances the City may deposit its funds. No investments in a single issuer exceeded 5% of the City’s investment portfolio.
f. Foreign Currency Risk
Foreign currency risk is the risk that changes in exchange rates will adversely affect the fair value of an
investment or a deposit. As of June 30, 2016, the City of Boston Trust Funds held international equity mutual
funds valued at $44.9 million. Although these investments are not denominated in a foreign currency, the
underlying securities are denominated in various foreign currencies.
g. Fair Value HierarchyInvestments are measured at fair value on a recurring basis. Recurring fair value measurements are those that GASB statements require or permit in the Statement of Net Position or Balance Sheet at the end of each reporting period. Fair value measurements are categorized based on the valuation inputs used to measure an asset's fair value: Level 1 inputs are quoted prices in active markets for identical assets or liabilities that the reporting entity has the ability to access at the measurement date; Level 2 inputs are other than quoted prices in Level 1 that are observable for the asset or liability, or similar assets or liabilities either directly or indirectly through corroboration with observable market data; Level 3 inputs are significant unobservable inputs that are supported by little or no market activity and that are significant to the fair value of the assets or liabilities.
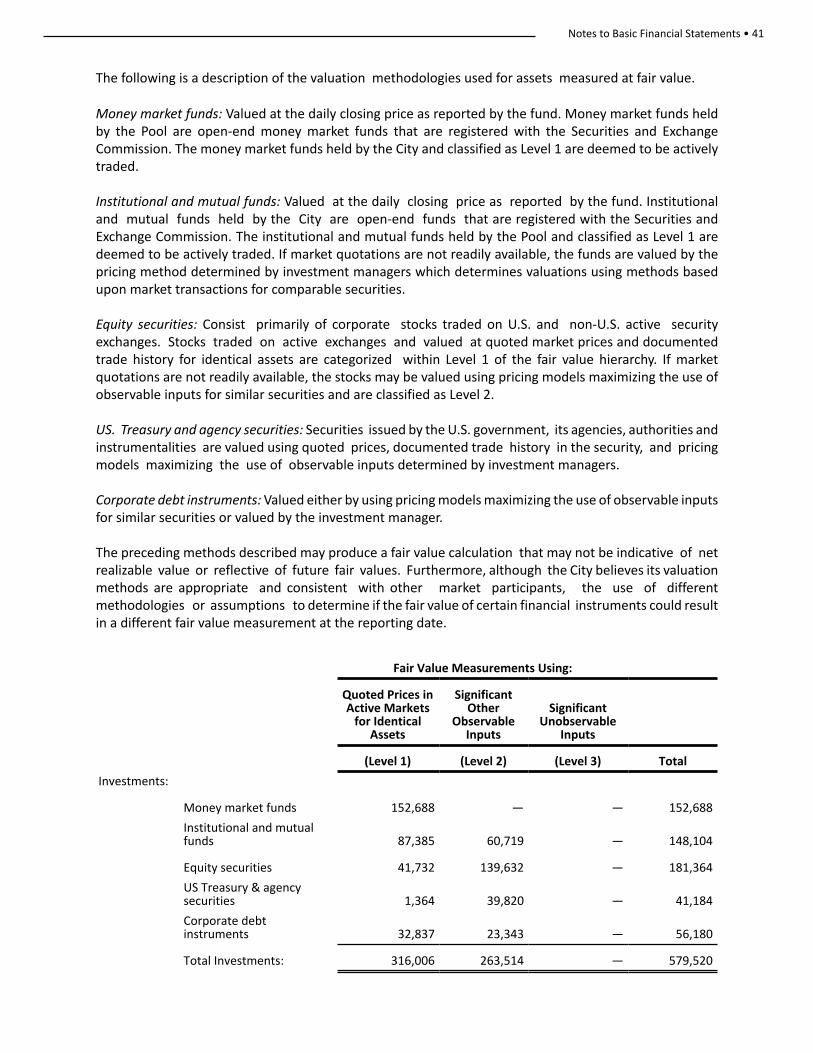
Notes to Basic Financial Statements • 41
The following is a description of the valuation methodologies used for assets measured at fair value.
Money market funds: Valued at the daily closing price as reported by the fund. Money market funds held by the Pool are open-end money market funds that are registered with the Securities and Exchange Commission. The money market funds held by the City and classified as Level 1 are deemed to be actively traded.
Institutional and mutual funds: Valued at the daily closing price as reported by the fund. Institutional and mutual funds held by the City are open-end funds that are registered with the Securities and Exchange Commission. The institutional and mutual funds held by the Pool and classified as Level 1 are deemed to be actively traded. If market quotations are not readily available, the funds are valued by the pricing method determined by investment managers which determines valuations using methods based upon market transactions for comparable securities.
Equity securities: Consist primarily of corporate stocks traded on U.S. and non-U.S. active security exchanges. Stocks traded on active exchanges and valued at quoted market prices and documented trade history for identical assets are categorized within Level 1 of the fair value hierarchy. If market quotations are not readily available, the stocks may be valued using pricing models maximizing the use of observable inputs for similar securities and are classified as Level 2.
US. Treasury and agency securities: Securities issued by the U.S. government, its agencies, authorities and instrumentalities are valued using quoted prices, documented trade history in the security, and pricing models maximizing the use of observable inputs determined by investment managers.
Corporate debt instruments: Valued either by using pricing models maximizing the use of observable inputs for similar securities or valued by the investment manager.
The preceding methods described may produce a fair value calculation that may not be indicative of net realizable value or reflective of future fair values. Furthermore, although the City believes its valuation methods are appropriate and consistent with other market participants, the use of different methodologies or assumptions to determine if the fair value of certain financial instruments could result in a different fair value measurement at the reporting date.
Fair Value Measurements Using:
Quoted Prices inActive Markets
for IdenticalAssets
SignificantOther
ObservableInputs
SignificantUnobservable
Inputs
(Level 1) (Level 2) (Level 3) Total
Investments:
Money market funds 152,688 — — 152,688
Institutional and mutualfunds 87,385 60,719 — 148,104
Equity securities 41,732 139,632 — 181,364
US Treasury & agencysecurities 1,364 39,820 — 41,184
Corporate debtinstruments 32,837 23,343 — 56,180
Total Investments: 316,006 263,514 — 579,520
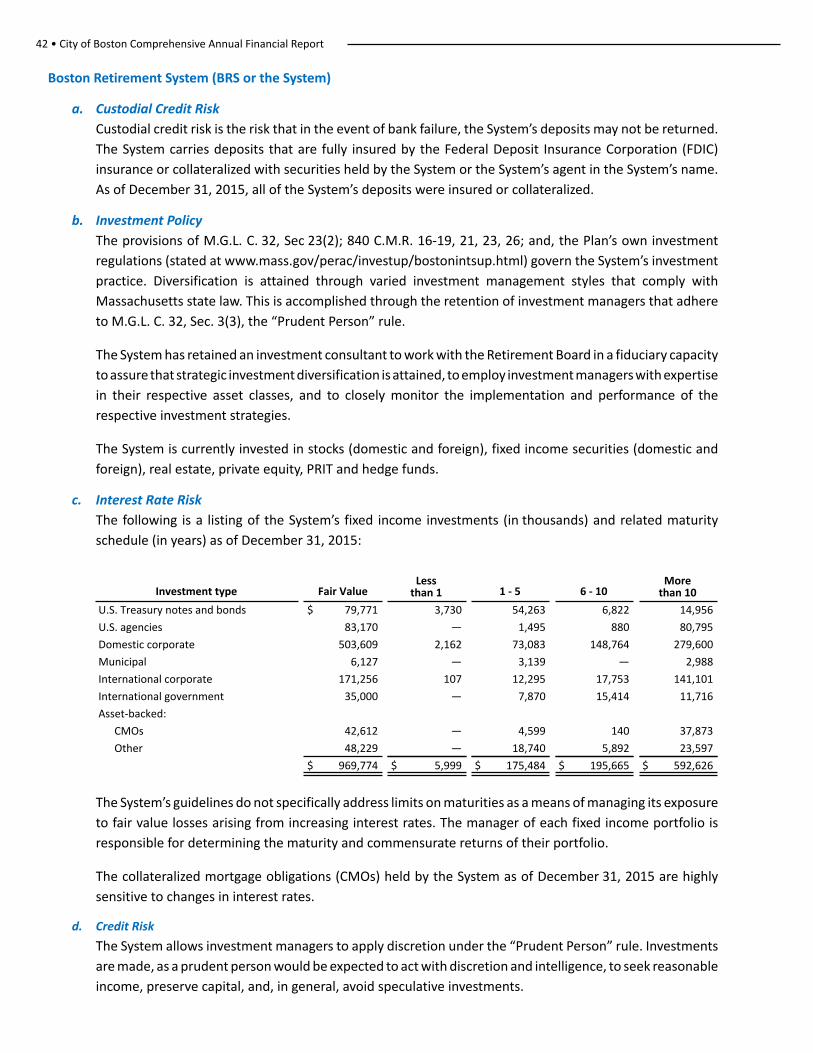
42 • City of Boston Comprehensive Annual Financial Report
Boston Retirement System (BRS or the System)
a. Custodial Credit Risk
Custodial credit risk is the risk that in the event of bank failure, the System’s deposits may not be returned.
The System carries deposits that are fully insured by the Federal Deposit Insurance Corporation (FDIC)
insurance or collateralized with securities held by the System or the System’s agent in the System’s name.
As of December 31, 2015, all of the System’s deposits were insured or collateralized.
b. Investment Policy
The provisions of M.G.L. C. 32, Sec 23(2); 840 C.M.R. 16-19, 21, 23, 26; and, the Plan’s own investment
regulations (stated at www.mass.gov/perac/investup/bostonintsup.html) govern the System’s investment
practice. Diversification is attained through varied investment management styles that comply with
Massachusetts state law. This is accomplished through the retention of investment managers that adhere
to M.G.L. C. 32, Sec. 3(3), the “Prudent Person” rule.
The System has retained an investment consultant to work with the Retirement Board in a fiduciary capacity
to assure that strategic investment diversification is attained, to employ investment managers with expertise
in their respective asset classes, and to closely monitor the implementation and performance of the
respective investment strategies.
The System is currently invested in stocks (domestic and foreign), fixed income securities (domestic and
foreign), real estate, private equity, PRIT and hedge funds.
c. Interest Rate Risk
The following is a listing of the System’s fixed income investments (in thousands) and related maturity
schedule (in years) as of December 31, 2015:
Investment type Fair ValueLess
than 1 1 - 5 6 - 10More
than 10
U.S. Treasury notes and bonds $ 79,771 3,730 54,263 6,822 14,956
U.S. agencies 83,170 — 1,495 880 80,795
Domestic corporate 503,609 2,162 73,083 148,764 279,600
Municipal 6,127 — 3,139 — 2,988
International corporate 171,256 107 12,295 17,753 141,101
International government 35,000 — 7,870 15,414 11,716
Asset-backed:
CMOs 42,612 — 4,599 140 37,873
Other 48,229 — 18,740 5,892 23,597
$ 969,774 $ 5,999 $ 175,484 $ 195,665 $ 592,626
The System’s guidelines do not specifically address limits on maturities as a means of managing its exposure
to fair value losses arising from increasing interest rates. The manager of each fixed income portfolio is
responsible for determining the maturity and commensurate returns of their portfolio.
The collateralized mortgage obligations (CMOs) held by the System as of December 31, 2015 are highly
sensitive to changes in interest rates.
d. Credit Risk
The System allows investment managers to apply discretion under the “Prudent Person” rule. Investments
are made, as a prudent person would be expected to act with discretion and intelligence, to seek reasonable
income, preserve capital, and, in general, avoid speculative investments.
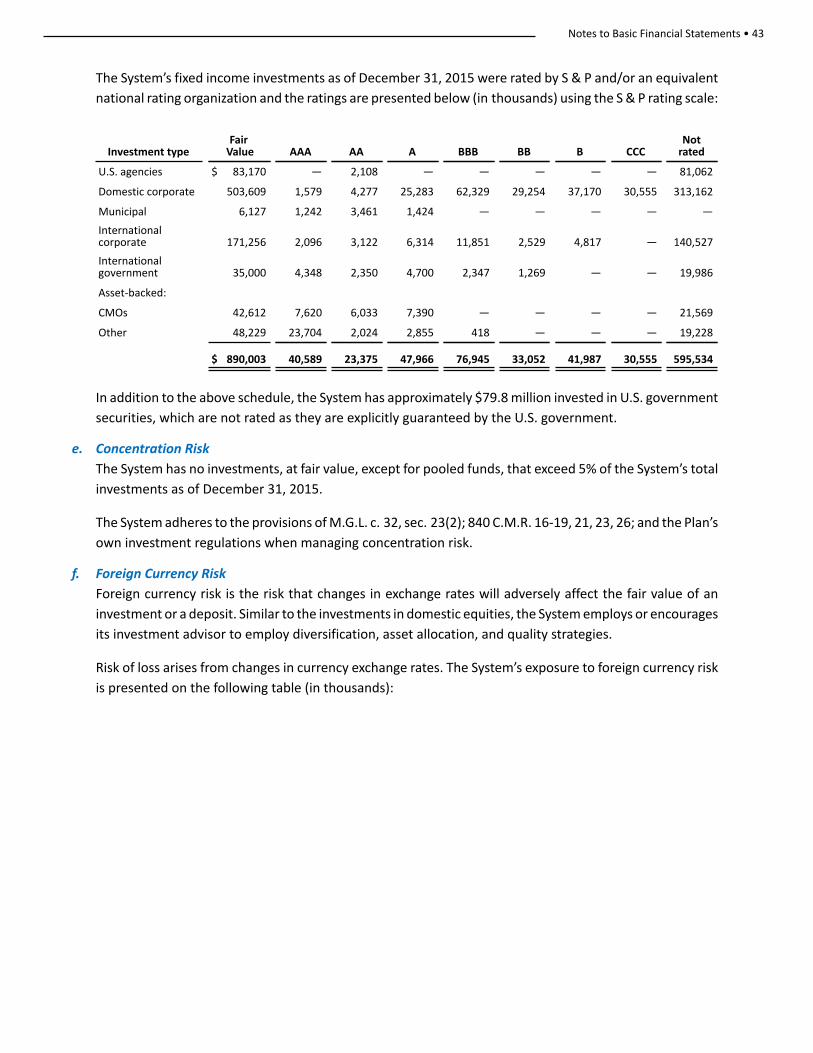
Notes to Basic Financial Statements • 43
The System’s fixed income investments as of December 31, 2015 were rated by S & P and/or an equivalent
national rating organization and the ratings are presented below (in thousands) using the S & P rating scale:
Investment typeFair
Value AAA AA A BBB BB B CCCNot
rated
U.S. agencies $ 83,170 — 2,108 — — — — — 81,062
Domestic corporate 503,609 1,579 4,277 25,283 62,329 29,254 37,170 30,555 313,162
Municipal 6,127 1,242 3,461 1,424 — — — — —
Internationalcorporate 171,256 2,096 3,122 6,314 11,851 2,529 4,817 — 140,527
Internationalgovernment 35,000 4,348 2,350 4,700 2,347 1,269 — — 19,986
Asset-backed:
CMOs 42,612 7,620 6,033 7,390 — — — — 21,569
Other 48,229 23,704 2,024 2,855 418 — — — 19,228
$ 890,003 40,589 23,375 47,966 76,945 33,052 41,987 30,555 595,534
In addition to the above schedule, the System has approximately $79.8 million invested in U.S. government
securities, which are not rated as they are explicitly guaranteed by the U.S. government.
e. Concentration Risk
The System has no investments, at fair value, except for pooled funds, that exceed 5% of the System’s total
investments as of December 31, 2015.
The System adheres to the provisions of M.G.L. c. 32, sec. 23(2); 840 C.M.R. 16-19, 21, 23, 26; and the Plan’s
own investment regulations when managing concentration risk.
f. Foreign Currency Risk
Foreign currency risk is the risk that changes in exchange rates will adversely affect the fair value of an
investment or a deposit. Similar to the investments in domestic equities, the System employs or encourages
its investment advisor to employ diversification, asset allocation, and quality strategies.
Risk of loss arises from changes in currency exchange rates. The System’s exposure to foreign currency risk
is presented on the following table (in thousands):
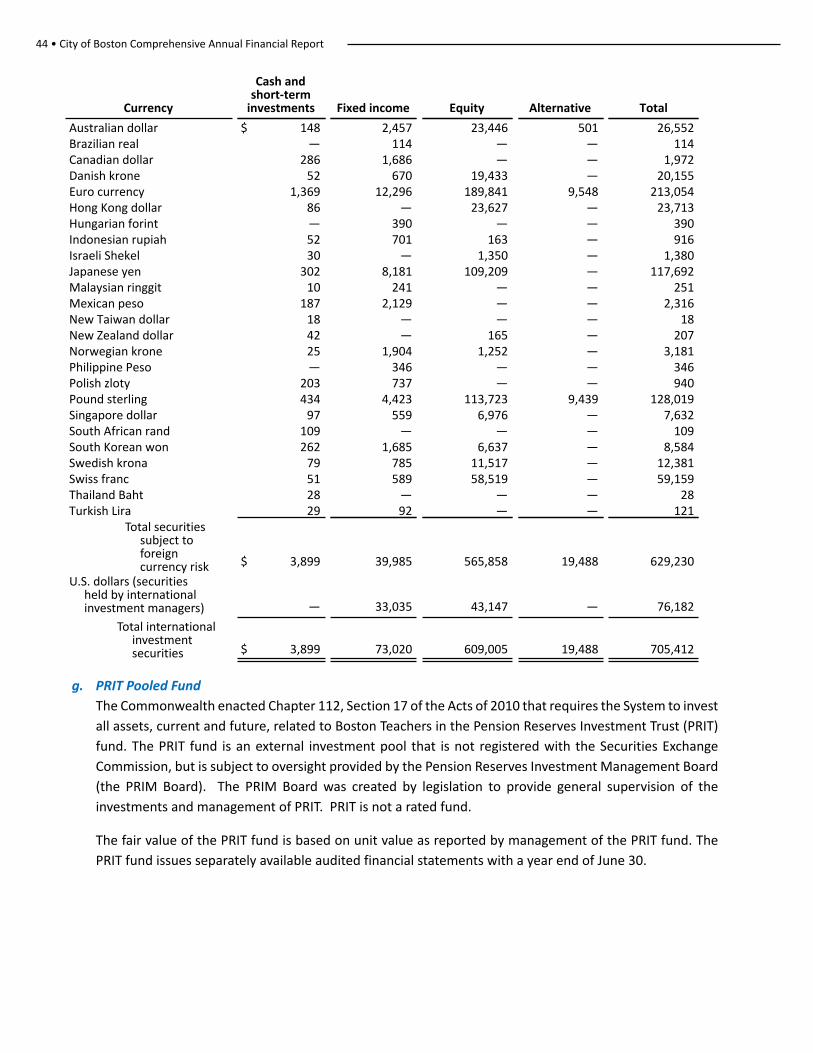
44 • City of Boston Comprehensive Annual Financial Report
Currency
Cash andshort-term
investments Fixed income Equity Alternative Total
Australian dollar $ 148 2,457 23,446 501 26,552Brazilian real — 114 — — 114Canadian dollar 286 1,686 — — 1,972Danish krone 52 670 19,433 — 20,155Euro currency 1,369 12,296 189,841 9,548 213,054Hong Kong dollar 86 — 23,627 — 23,713Hungarian forint — 390 — — 390Indonesian rupiah 52 701 163 — 916Israeli Shekel 30 — 1,350 — 1,380Japanese yen 302 8,181 109,209 — 117,692Malaysian ringgit 10 241 — — 251Mexican peso 187 2,129 — — 2,316New Taiwan dollar 18 — — — 18New Zealand dollar 42 — 165 — 207Norwegian krone 25 1,904 1,252 — 3,181Philippine Peso — 346 — — 346Polish zloty 203 737 — — 940Pound sterling 434 4,423 113,723 9,439 128,019Singapore dollar 97 559 6,976 — 7,632South African rand 109 — — — 109South Korean won 262 1,685 6,637 — 8,584Swedish krona 79 785 11,517 — 12,381Swiss franc 51 589 58,519 — 59,159Thailand Baht 28 — — — 28Turkish Lira 29 92 — — 121
Total securities subject to foreign currency risk $ 3,899 39,985 565,858 19,488 629,230
U.S. dollars (securities held by international investment managers) — 33,035 43,147 — 76,182
Total international investment securities $ 3,899 73,020 609,005 19,488 705,412
g. PRIT Pooled Fund
The Commonwealth enacted Chapter 112, Section 17 of the Acts of 2010 that requires the System to invest
all assets, current and future, related to Boston Teachers in the Pension Reserves Investment Trust (PRIT)
fund. The PRIT fund is an external investment pool that is not registered with the Securities Exchange
Commission, but is subject to oversight provided by the Pension Reserves Investment Management Board
(the PRIM Board). The PRIM Board was created by legislation to provide general supervision of the
investments and management of PRIT. PRIT is not a rated fund.
The fair value of the PRIT fund is based on unit value as reported by management of the PRIT fund. The
PRIT fund issues separately available audited financial statements with a year end of June 30.
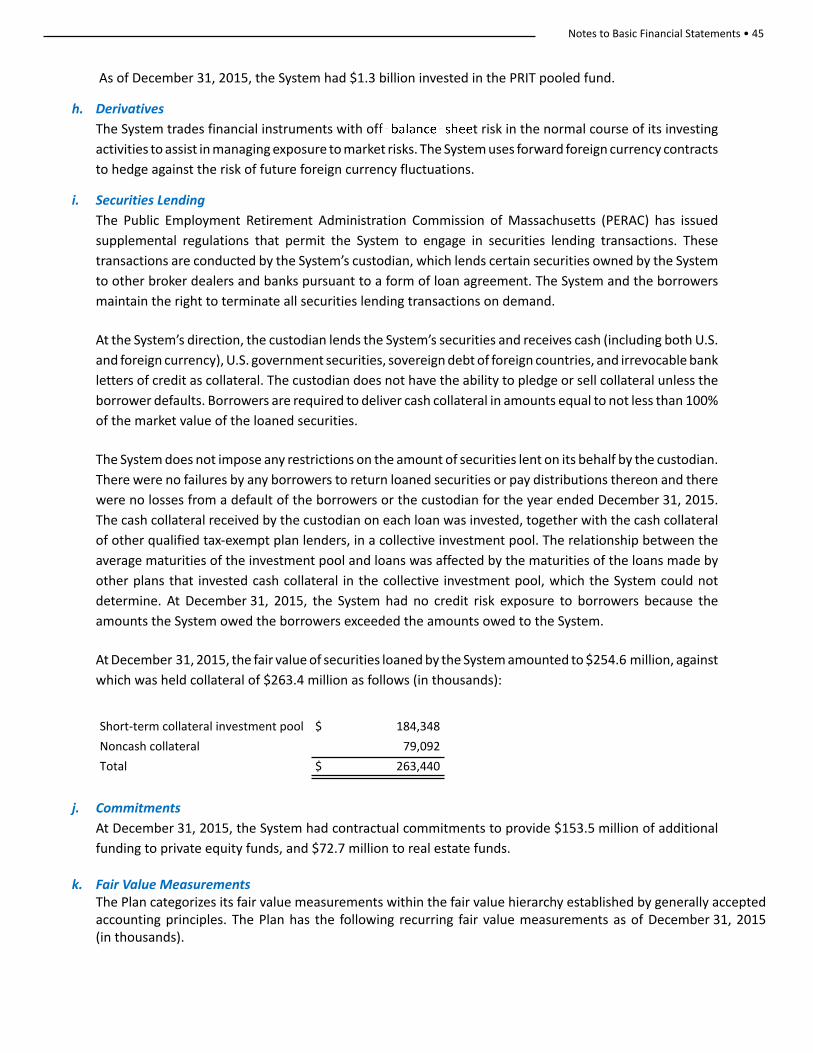
Notes to Basic Financial Statements • 45
As of December 31, 2015, the System had $1.3 billion invested in the PRIT pooled fund.
h. Derivatives
The System trades financial instruments with of t risk in the normal course of its investing
activities to assist in managing exposure to market risks. The System uses forward foreign currency contracts
to hedge against the risk of future foreign currency fluctuations.
i. Securities Lending
The Public Employment Retirement Administration Commission of Massachusetts (PERAC) has issued
supplemental regulations that permit the System to engage in securities lending transactions. These
transactions are conducted by the System’s custodian, which lends certain securities owned by the System
to other broker dealers and banks pursuant to a form of loan agreement. The System and the borrowers
maintain the right to terminate all securities lending transactions on demand.
At the System’s direction, the custodian lends the System’s securities and receives cash (including both U.S.
and foreign currency), U.S. government securities, sovereign debt of foreign countries, and irrevocable bank
letters of credit as collateral. The custodian does not have the ability to pledge or sell collateral unless the
borrower defaults. Borrowers are required to deliver cash collateral in amounts equal to not less than 100%
of the market value of the loaned securities.
The System does not impose any restrictions on the amount of securities lent on its behalf by the custodian.
There were no failures by any borrowers to return loaned securities or pay distributions thereon and there
were no losses from a default of the borrowers or the custodian for the year ended December 31, 2015.
The cash collateral received by the custodian on each loan was invested, together with the cash collateral
of other qualified tax-exempt plan lenders, in a collective investment pool. The relationship between the
average maturities of the investment pool and loans was affected by the maturities of the loans made by
other plans that invested cash collateral in the collective investment pool, which the System could not
determine. At December 31, 2015, the System had no credit risk exposure to borrowers because the
amounts the System owed the borrowers exceeded the amounts owed to the System.
At December 31, 2015, the fair value of securities loaned by the System amounted to $254.6 million, against
which was held collateral of $263.4 million as follows (in thousands):
Short-term collateral investment pool $ 184,348
Noncash collateral 79,092
Total $ 263,440
j. Commitments
At December 31, 2015, the System had contractual commitments to provide $153.5 million of additional
funding to private equity funds, and $72.7 million to real estate funds.
k. Fair Value MeasurementsThe Plan categorizes its fair value measurements within the fair value hierarchy established by generally accepted accounting principles. The Plan has the following recurring fair value measurements as of December 31, 2015 (in thousands).
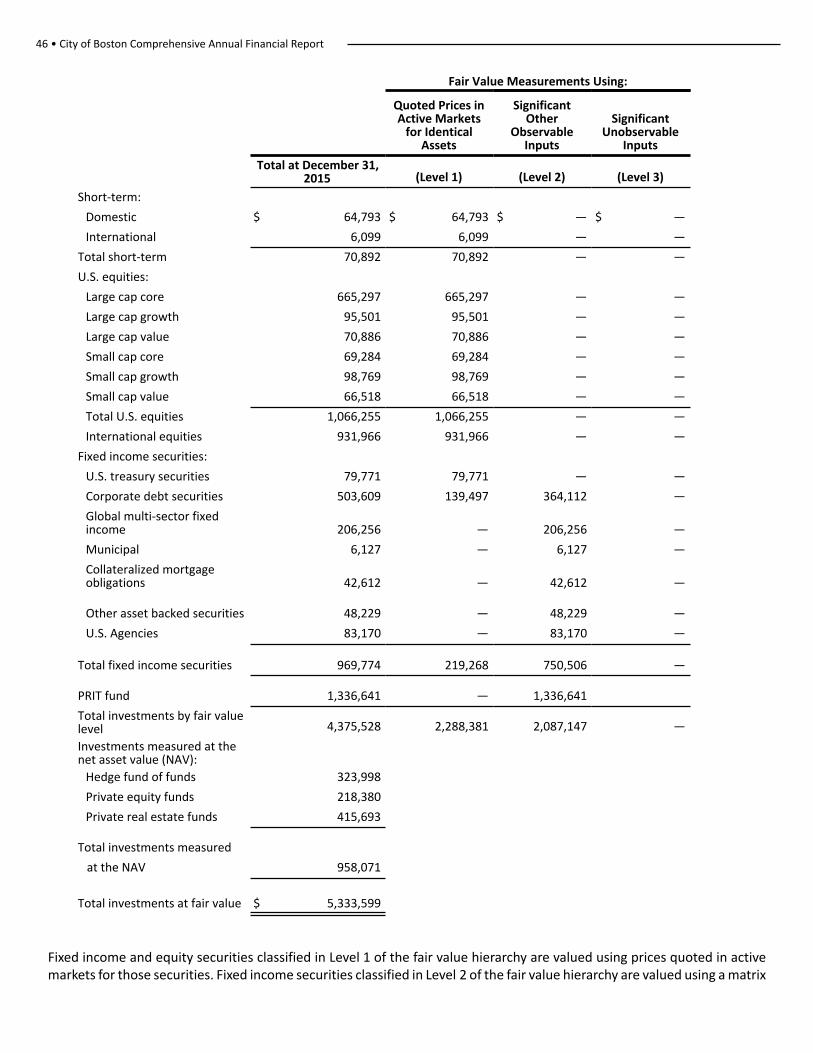
46 • City of Boston Comprehensive Annual Financial Report
Fair Value Measurements Using:
Quoted Prices inActive Markets
for IdenticalAssets
SignificantOther
ObservableInputs
SignificantUnobservable
Inputs
Total at December 31,2015 (Level 1) (Level 2) (Level 3)
Short-term:
Domestic $ 64,793 $ 64,793 $ — $ —
International 6,099 6,099 — —
Total short-term 70,892 70,892 — —
U.S. equities:
Large cap core 665,297 665,297 — —
Large cap growth 95,501 95,501 — —
Large cap value 70,886 70,886 — —
Small cap core 69,284 69,284 — —
Small cap growth 98,769 98,769 — —
Small cap value 66,518 66,518 — —
Total U.S. equities 1,066,255 1,066,255 — —
International equities 931,966 931,966 — —
Fixed income securities:
U.S. treasury securities 79,771 79,771 — —
Corporate debt securities 503,609 139,497 364,112 —
Global multi-sector fixedincome 206,256 — 206,256 —
Municipal 6,127 — 6,127 —
Collateralized mortgageobligations 42,612 — 42,612 —
Other asset backed securities 48,229 — 48,229 —
U.S. Agencies 83,170 — 83,170 —
Total fixed income securities 969,774 219,268 750,506 —
PRIT fund 1,336,641 — 1,336,641
Total investments by fair valuelevel 4,375,528 2,288,381 2,087,147 —
Investments measured at thenet asset value (NAV):
Hedge fund of funds 323,998
Private equity funds 218,380
Private real estate funds 415,693
Total investments measured
at the NAV 958,071
Total investments at fair value $ 5,333,599
Fixed income and equity securities classified in Level 1 of the fair value hierarchy are valued using prices quoted in active markets for those securities. Fixed income securities classified in Level 2 of the fair value hierarchy are valued using a matrix
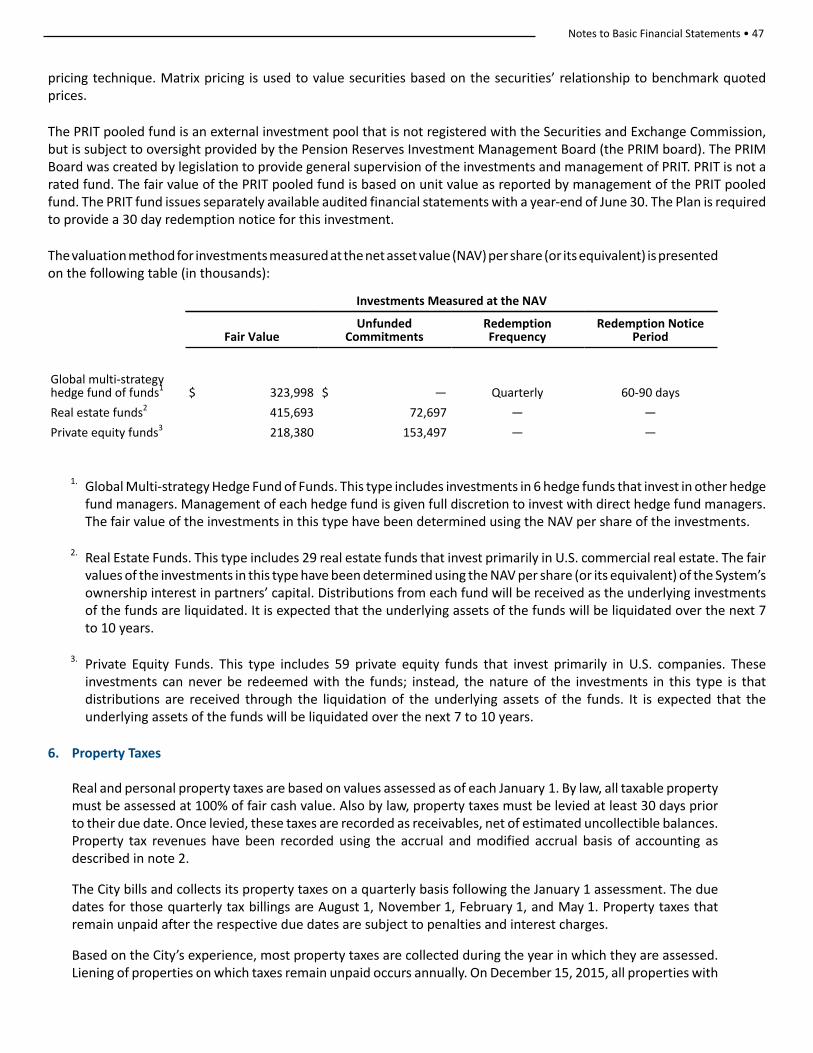
Notes to Basic Financial Statements • 47
pricing technique. Matrix pricing is used to value securities based on the securities’ relationship to benchmark quoted prices.
The PRIT pooled fund is an external investment pool that is not registered with the Securities and Exchange Commission, but is subject to oversight provided by the Pension Reserves Investment Management Board (the PRIM board). The PRIM Board was created by legislation to provide general supervision of the investments and management of PRIT. PRIT is not a rated fund. The fair value of the PRIT pooled fund is based on unit value as reported by management of the PRIT pooled fund. The PRIT fund issues separately available audited financial statements with a year-end of June 30. The Plan is required to provide a 30 day redemption notice for this investment.
The valuation method for investments measured at the net asset value (NAV) per share (or its equivalent) is presented on the following table (in thousands):
Investments Measured at the NAV
Fair ValueUnfunded
CommitmentsRedemptionFrequency
Redemption NoticePeriod
Global multi-strategy hedge fund of funds1 $ 323,998 $ — Quarterly 60-90 days
Real estate funds2 415,693 72,697 — —
Private equity funds3 218,380 153,497 — —
1. Global Multi-strategy Hedge Fund of Funds. This type includes investments in 6 hedge funds that invest in other hedge fund managers. Management of each hedge fund is given full discretion to invest with direct hedge fund managers. The fair value of the investments in this type have been determined using the NAV per share of the investments.
2. Real Estate Funds. This type includes 29 real estate funds that invest primarily in U.S. commercial real estate. The fair values of the investments in this type have been determined using the NAV per share (or its equivalent) of the System’s ownership interest in partners’ capital. Distributions from each fund will be received as the underlying investments of the funds are liquidated. It is expected that the underlying assets of the funds will be liquidated over the next 7 to 10 years.
3. Private Equity Funds. This type includes 59 private equity funds that invest primarily in U.S. companies. These investments can never be redeemed with the funds; instead, the nature of the investments in this type is that distributions are received through the liquidation of the underlying assets of the funds. It is expected that the underlying assets of the funds will be liquidated over the next 7 to 10 years.
6. Property Taxes
Real and personal property taxes are based on values assessed as of each January 1. By law, all taxable property must be assessed at 100% of fair cash value. Also by law, property taxes must be levied at least 30 days prior to their due date. Once levied, these taxes are recorded as receivables, net of estimated uncollectible balances. Property tax revenues have been recorded using the accrual and modified accrual basis of accounting as described in note 2.
The City bills and collects its property taxes on a quarterly basis following the January 1 assessment. The due dates for those quarterly tax billings are August 1, November 1, February 1, and May 1. Property taxes that remain unpaid after the respective due dates are subject to penalties and interest charges.
Based on the City’s experience, most property taxes are collected during the year in which they are assessed. Liening of properties on which taxes remain unpaid occurs annually. On December 15, 2015, all properties with
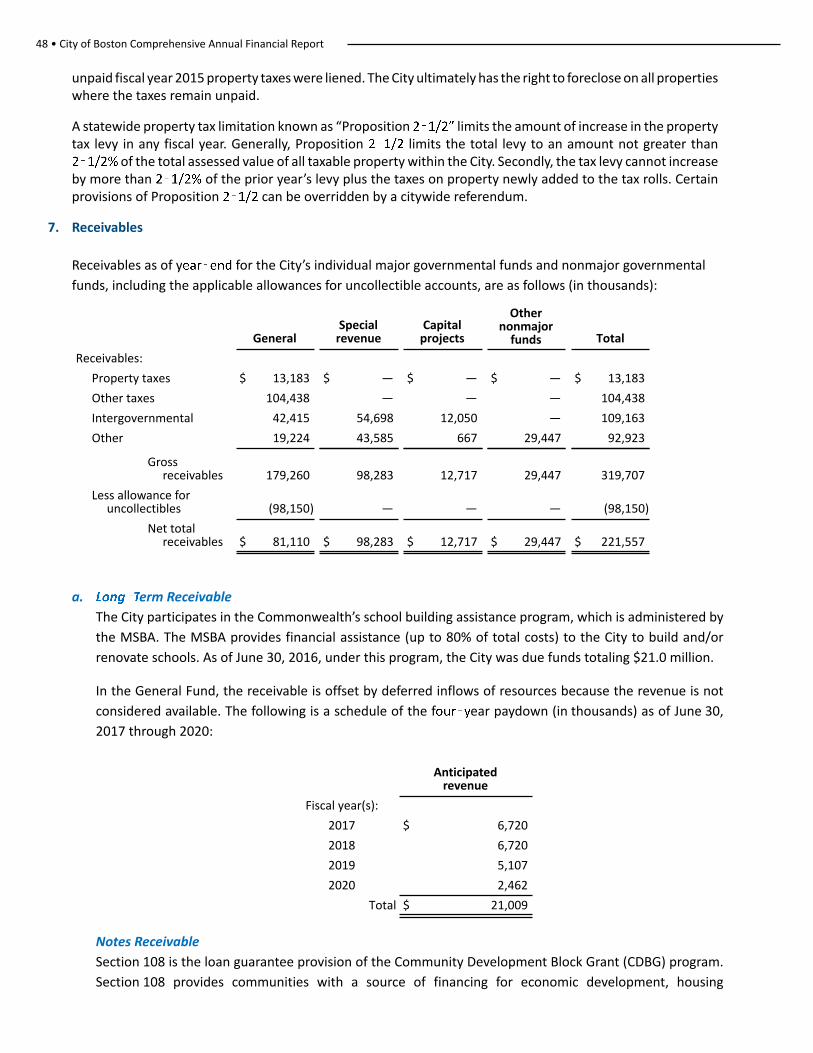
48 • City of Boston Comprehensive Annual Financial Report
unpaid fiscal year 2015 property taxes were liened. The City ultimately has the right to foreclose on all properties where the taxes remain unpaid.
A statewide property tax limitation known as “Proposition limits the amount of increase in the property tax levy in any fiscal year. Generally, Proposition limits the total levy to an amount not greater than
of the total assessed value of all taxable property within the City. Secondly, the tax levy cannot increase by more than of the prior year’s levy plus the taxes on property newly added to the tax rolls. Certain provisions of Proposition can be overridden by a citywide referendum.
7. Receivables
Receivables as of y for the City’s individual major governmental funds and nonmajor governmental
funds, including the applicable allowances for uncollectible accounts, are as follows (in thousands):
GeneralSpecial
revenueCapital
projects
Othernonmajor
funds Total
Receivables:
Property taxes $ 13,183 $ — $ — $ — $ 13,183
Other taxes 104,438 — — — 104,438
Intergovernmental 42,415 54,698 12,050 — 109,163
Other 19,224 43,585 667 29,447 92,923
Gross receivables 179,260 98,283 12,717 29,447 319,707
Less allowance for uncollectibles (98,150) — — — (98,150)
Net total receivables $ 81,110 $ 98,283 $ 12,717 $ 29,447 $ 221,557
a. erm Receivable
The City participates in the Commonwealth’s school building assistance program, which is administered by
the MSBA. The MSBA provides financial assistance (up to 80% of total costs) to the City to build and/or
renovate schools. As of June 30, 2016, under this program, the City was due funds totaling $21.0 million.
In the General Fund, the receivable is offset by deferred inflows of resources because the revenue is not
considered available. The following is a schedule of the f ear paydown (in thousands) as of June 30,
2017 through 2020:
Anticipatedrevenue
Fiscal year(s):
2017 $ 6,720
2018 6,720
2019 5,107
2020 2,462
Total $ 21,009
Notes Receivable
Section 108 is the loan guarantee provision of the Community Development Block Grant (CDBG) program.
Section 108 provides communities with a source of financing for economic development, housing
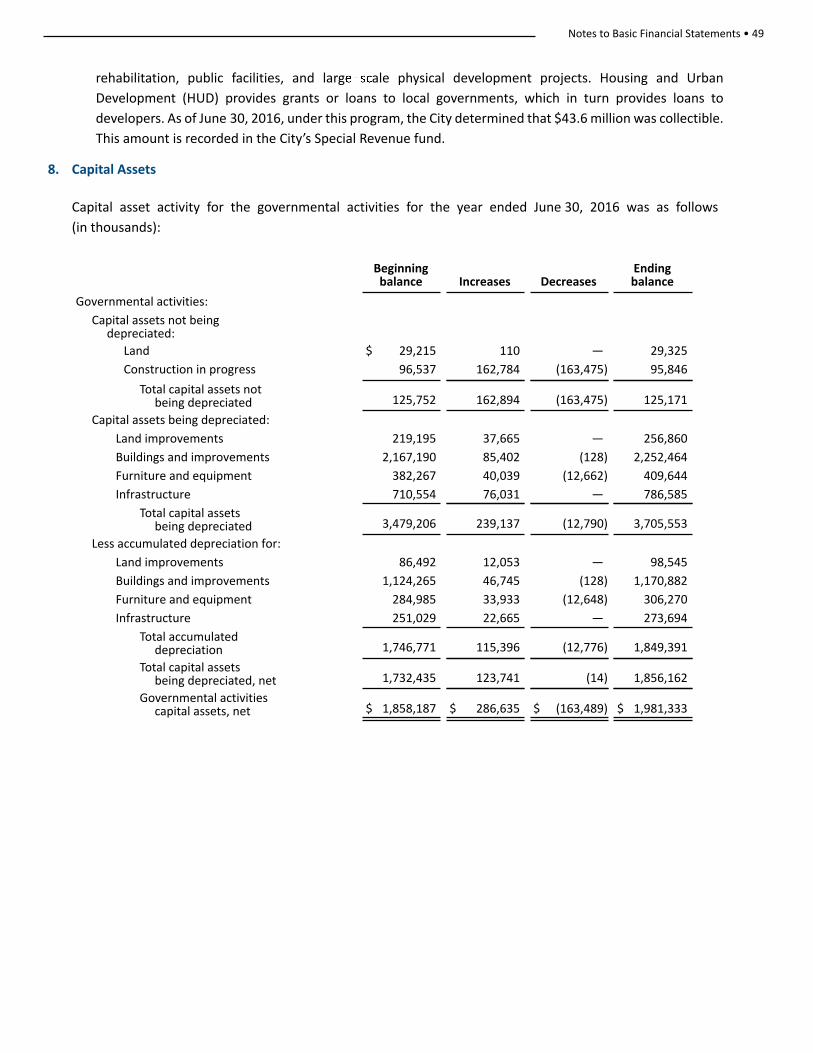
Notes to Basic Financial Statements • 49
rehabilitation, public facilities, and larg ale physical development projects. Housing and Urban
Development (HUD) provides grants or loans to local governments, which in turn provides loans to
developers. As of June 30, 2016, under this program, the City determined that $43.6 million was collectible.
This amount is recorded in the City’s Special Revenue fund.
8. Capital Assets
Capital asset activity for the governmental activities for the year ended June 30, 2016 was as follows
(in thousands):
Beginningbalance Increases Decreases
Endingbalance
Governmental activities:
Capital assets not being depreciated:
Land $ 29,215 110 — 29,325
Construction in progress 96,537 162,784 (163,475) 95,846
Total capital assets not being depreciated 125,752 162,894 (163,475) 125,171
Capital assets being depreciated:
Land improvements 219,195 37,665 — 256,860
Buildings and improvements 2,167,190 85,402 (128) 2,252,464
Furniture and equipment 382,267 40,039 (12,662) 409,644
Infrastructure 710,554 76,031 — 786,585
Total capital assets being depreciated 3,479,206 239,137 (12,790) 3,705,553
Less accumulated depreciation for:
Land improvements 86,492 12,053 — 98,545
Buildings and improvements 1,124,265 46,745 (128) 1,170,882
Furniture and equipment 284,985 33,933 (12,648) 306,270
Infrastructure 251,029 22,665 — 273,694
Total accumulated depreciation 1,746,771 115,396 (12,776) 1,849,391
Total capital assets being depreciated, net 1,732,435 123,741 (14) 1,856,162
Governmental activities capital assets, net $ 1,858,187 $ 286,635 $ (163,489) $ 1,981,333
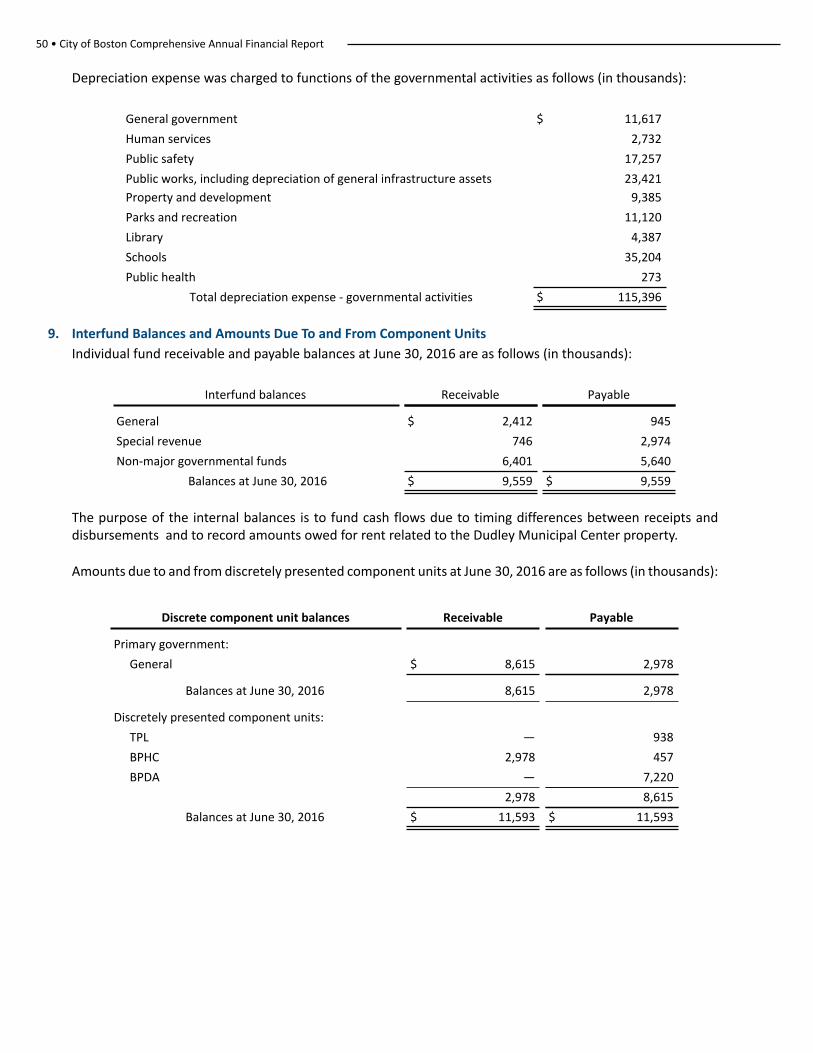
50 • City of Boston Comprehensive Annual Financial Report
Depreciation expense was charged to functions of the governmental activities as follows (in thousands):
General government $ 11,617
Human services 2,732
Public safety 17,257
Public works, including depreciation of general infrastructure assets 23,421
Property and development 9,385
Parks and recreation 11,120
Library 4,387
Schools 35,204
Public health 273
Total depreciation expense - governmental activities $ 115,396
9. Interfund Balances and Amounts Due To and From Component Units
Individual fund receivable and payable balances at June 30, 2016 are as follows (in thousands):
Interfund balances Receivable Payable
General $ 2,412 945
Special revenue 746 2,974
Non-major governmental funds 6,401 5,640
Balances at June 30, 2016 $ 9,559 $ 9,559
The purpose of the internal balances is to fund cash flows due to timing differences between receipts and disbursements and to record amounts owed for rent related to the Dudley Municipal Center property.
Amounts due to and from discretely presented component units at June 30, 2016 are as follows (in thousands):
Discrete component unit balances Receivable Payable
Primary government:
General $ 8,615 2,978
Balances at June 30, 2016 8,615 2,978
Discretely presented component units:
TPL — 938
BPHC 2,978 457
BPDA — 7,220
2,978 8,615
Balances at June 30, 2016 $ 11,593 $ 11,593
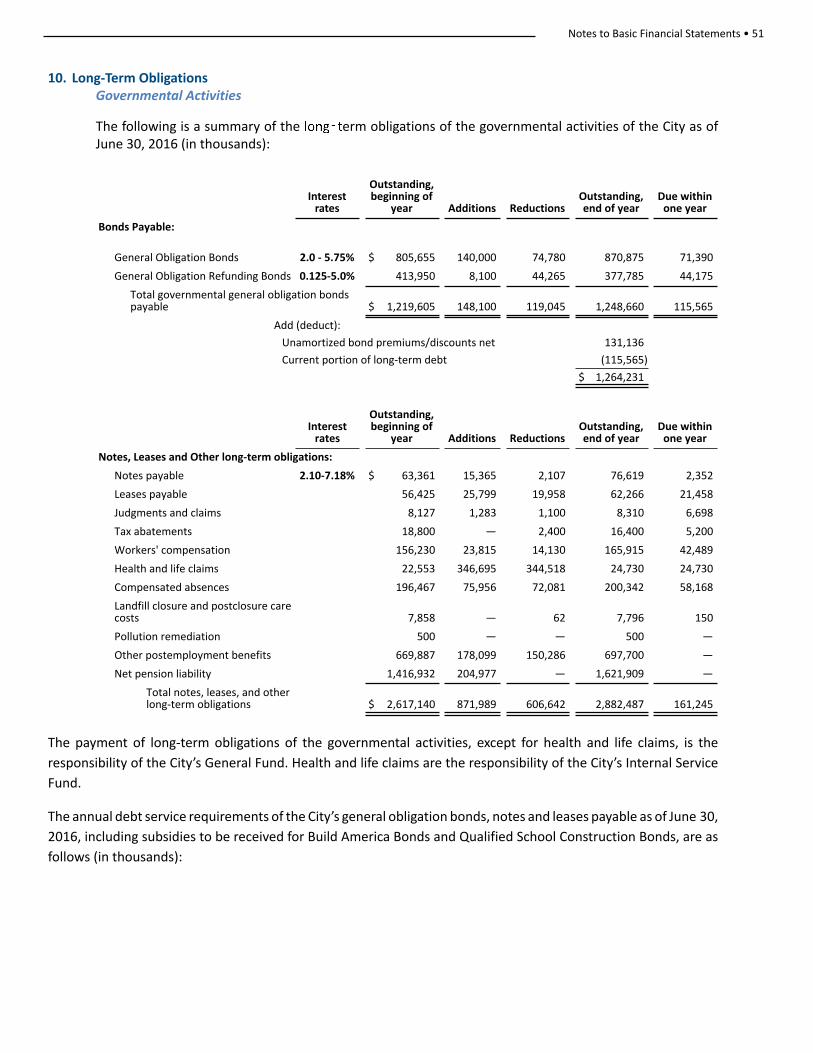
Notes to Basic Financial Statements • 51
10. Long-Term ObligationsGovernmental Activities
The following is a summary of the erm obligations of the governmental activities of the City as of June 30, 2016 (in thousands):
Interest rates
Outstanding,beginning of
year Additions ReductionsOutstanding,end of year
Due withinone year
Bonds Payable:
General Obligation Bonds 2.0 - 5.75% $ 805,655 140,000 74,780 870,875 71,390
General Obligation Refunding Bonds 0.125-5.0% 413,950 8,100 44,265 377,785 44,175
Total governmental general obligation bondspayable $ 1,219,605 148,100 119,045 1,248,660 115,565
Add (deduct):
Unamortized bond premiums/discounts net 131,136
Current portion of long-term debt (115,565)
$ 1,264,231
Interestrates
Outstanding,beginning of
year Additions ReductionsOutstanding,end of year
Due withinone year
Notes, Leases and Other long-term obligations:
Notes payable 2.10-7.18% $ 63,361 15,365 2,107 76,619 2,352
Leases payable 56,425 25,799 19,958 62,266 21,458
Judgments and claims 8,127 1,283 1,100 8,310 6,698
Tax abatements 18,800 — 2,400 16,400 5,200
Workers' compensation 156,230 23,815 14,130 165,915 42,489
Health and life claims 22,553 346,695 344,518 24,730 24,730
Compensated absences 196,467 75,956 72,081 200,342 58,168
Landfill closure and postclosure carecosts 7,858 — 62 7,796 150
Pollution remediation 500 — — 500 —
Other postemployment benefits 669,887 178,099 150,286 697,700 —
Net pension liability 1,416,932 204,977 — 1,621,909 —
Total notes, leases, and otherlong-term obligations $ 2,617,140 871,989 606,642 2,882,487 161,245
The payment of long-term obligations of the governmental activities, except for health and life claims, is the
responsibility of the City’s General Fund. Health and life claims are the responsibility of the City’s Internal Service
Fund.
The annual debt service requirements of the City’s general obligation bonds, notes and leases payable as of June 30,
2016, including subsidies to be received for Build America Bonds and Qualified School Construction Bonds, are as
follows (in thousands):
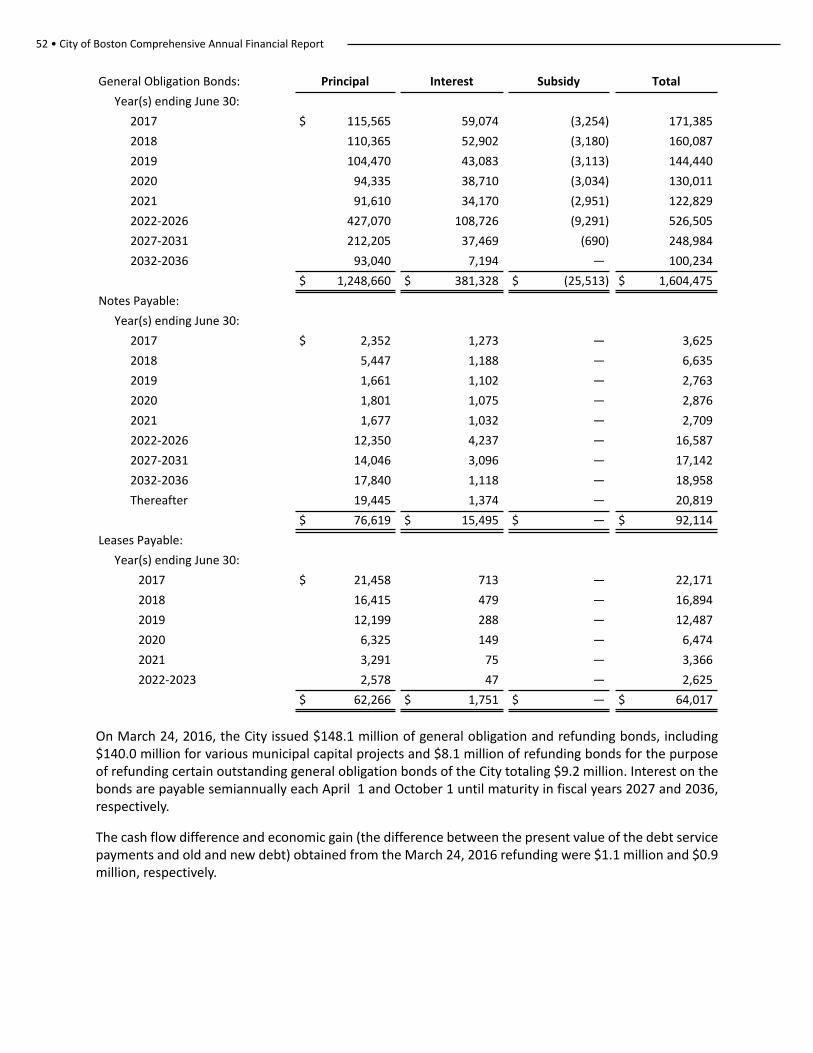
52 • City of Boston Comprehensive Annual Financial Report
General Obligation Bonds: Principal Interest Subsidy Total
Year(s) ending June 30:
2017 $ 115,565 59,074 (3,254) 171,385
2018 110,365 52,902 (3,180) 160,087
2019 104,470 43,083 (3,113) 144,440
2020 94,335 38,710 (3,034) 130,011
2021 91,610 34,170 (2,951) 122,829
2022-2026 427,070 108,726 (9,291) 526,505
2027-2031 212,205 37,469 (690) 248,984
2032-2036 93,040 7,194 — 100,234
$ 1,248,660 $ 381,328 $ (25,513) $ 1,604,475
Notes Payable:
Year(s) ending June 30:
2017 $ 2,352 1,273 — 3,625
2018 5,447 1,188 — 6,635
2019 1,661 1,102 — 2,763
2020 1,801 1,075 — 2,876
2021 1,677 1,032 — 2,709
2022-2026 12,350 4,237 — 16,587
2027-2031 14,046 3,096 — 17,142
2032-2036 17,840 1,118 — 18,958
Thereafter 19,445 1,374 — 20,819
$ 76,619 $ 15,495 $ — $ 92,114
Leases Payable:
Year(s) ending June 30:
2017 $ 21,458 713 — 22,171
2018 16,415 479 — 16,894
2019 12,199 288 — 12,487
2020 6,325 149 — 6,474
2021 3,291 75 — 3,366
2022-2023 2,578 47 — 2,625
$ 62,266 $ 1,751 $ — $ 64,017
On March 24, 2016, the City issued $148.1 million of general obligation and refunding bonds, including $140.0 million for various municipal capital projects and $8.1 million of refunding bonds for the purpose of refunding certain outstanding general obligation bonds of the City totaling $9.2 million. Interest on the bonds are payable semiannually each April 1 and October 1 until maturity in fiscal years 2027 and 2036, respectively.
The cash flow difference and economic gain (the difference between the present value of the debt service payments and old and new debt) obtained from the March 24, 2016 refunding were $1.1 million and $0.9 million, respectively.
Notes to Basic Financial Statements • 53
The City has entered into various capital lease agreements for equipment acquisition. Payments under these agreements are subject to annual appropriation and, by statute, are not included in the City’s debt limit calculations. The gross amount of assets acquired under the equipment lease agreements totals $62.3 million as of June 30, 2016. The City’s operating lease with DSRC is described in note 19.
No Obligation Debt
The City has outstanding industrial, commercial, and housing development bonds payable solely from revenues of the respective enterprises that do not constitute an indebtedness of the City and are not charged against its general credit. This aggregate amount is immaterial to the financial statements.
Defeased Debt
The principal amount of debt refunded through stance defeasance transactions for governmental activities and still outstanding at June 30, 2016 was approximately $144.2 million.
Debt Capacity
The City is subject to a dual general debt limit: the normal debt limit and the double debt limit. Such limits are equal to 5% and 10%, respectively, of the valuation of taxable property in the City as last equalized by the Massachusetts Department of Revenue. Debt may be authorized up to the normal debt limit without state approval. Authorizations under the double debt limit, however, require the approval of the Commonwealth’s Secretary of Administration and Finance. Additionally, there are many categories of general obligation debt, which are exempt from the debt limit but are subject to other limitations.
As of June 30, 2016, the City may issue $3.73 billion of additional general obligation debt under the debt limit. General obligation debt of $680.8 million, subject to the debt limit, and $75.7 million, exempt from the debt limit, are authorized but unissued as of June 30, 2016.
11. Retirement Plans
a. Plan Description
The City contributes to the BRS, a cost-sharing, multiple-employer qualified defined benefit governmental
pension plan. The System provides retirement, disability, and death benefits to plan members and
beneficiaries of the following government units:
(1) City of Boston
(2) Boston Planning & Development Agency
(3) Boston Housing Authority
(4) Boston Water and Sewer Commission
(5) Boston Public Health Commission
(6) Sheriff of Suffolk County (Retirees as of December 31, 2009, funded by the City)
The Commonwealth of Massachusetts also is an other contributing entity and makes contributions to BRS
related to City of Boston teachers.
The System is administered by a five person Board of Retirement consisting of the City Auditor, who serves
as a member ex officio, two members who are elected by the participants, in or retired from the service of
the System, a fourth member appointed by the Mayor, and a fifth member chosen by the other members.
A complete set of financial statements for BRS for the fiscal year ended December 31, 2015 can be obtained
through the BRS, Boston City Hall, Room 816, Boston, MA 02201 or by accessing the website
www.cityofboston.gov/retirement/investment.asp.
54 • City of Boston Comprehensive Annual Financial Report
Participation in the System is mandatory for all permanent, full time, and certain part-time employees
immediately upon the commencement of employment. Participants who resign from employment, or are
receiving workers’ compensation benefits, and who are not eligible to receive a retirement allowance are
entitled to request a refund of their accumulated total deductions. In addition, those participants who
resign voluntarily with less than ten years of service are entitled to receive 3% per year interest; all others
receive interest which has accrued on their cumulative deductions at the regular interest rate (0.1% at
December 31, 2015).
Employees with ten or more years of service having attained age 55 are entitled to pension benefits; an
earlier retirement is allowed upon completion of 20 years of service. The System provides for retirement
allowance benefits up to a maximum of 80% of a participant’s highest consecutive three-year average annual
rate of regular compensation (highest consecutive five-year average for those members who join the System
on or after April 2, 2013). Benefit payments are based upon a participant’s age, length of creditable service,
regular compensation, and group classification. Participants become vested after ten years of creditable
service. Effective July 1, 1998 Chapter 32 of the M.G.L. assigned the authority to establish and amend
benefit provisions and grant cost-of-living increases for the plan to the Boston Retirement Board.
If a member in service dies due to causes unrelated to his or her job, the surviving spouse and/or surviving
dependent children may receive benefits, either in a lump sum or in the form of an annuity based on the
length of service, contributions and age. In the event there are no spouse and/or dependent children named,
other beneficiaries may be entitled to a lump-sum distribution. Participants who become permanently and
totally disabled from further duty may be eligible to receive accidental or ordinary disability retirement
benefits.
Accidental disability is provided to members with incapacitation resulting from a work-related injury or
hazard. Generally, annual pension benefits are provided based on 72% of the annual rate of regular
compensation a member earned while an active employee on date of injury or average annual rate of
regular compensation. Ordinary disability is available to any member whose permanent incapacitation is
not work-related and has attained ten years of creditable service. Such benefits are provided as if the
member had attained the age of 55 (or actual age if over 55) based on the amount of creditable service
actually earned. Limits are placed on how much a disability employee can earn from other sources while
collecting a disability retirement pension.
The City is legally responsible for funding the employer portion of all pensions associated with certain
retirees from the Suffolk County Sheriff’s Department (SCSD), which became part of the Commonwealth
of Massachusetts in 2010, pursuant to a cooperation agreement (the Agreement) dated June 28, 2011.
According to the Agreement, all employees of the SCSD, or its predecessor department, who retired prior
to January 1, 2010 remained retirees of the BRS. In addition, members of AFSCME Local 419 who retired
between January 1, 2010 and October 31, 2010, remained retirees of the BRS. Employer contributions
related to these retirees are the responsibility of the City under the Agreement.
Special Funding Situations
The City is party to a special funding situation with the Commonwealth of Massachusetts with respect to
City of Boston Teachers. The Commonwealth is responsible for funding the employer portion of all teacher
pensions in the Commonwealth. All teachers in the Commonwealth are members of the Massachusetts
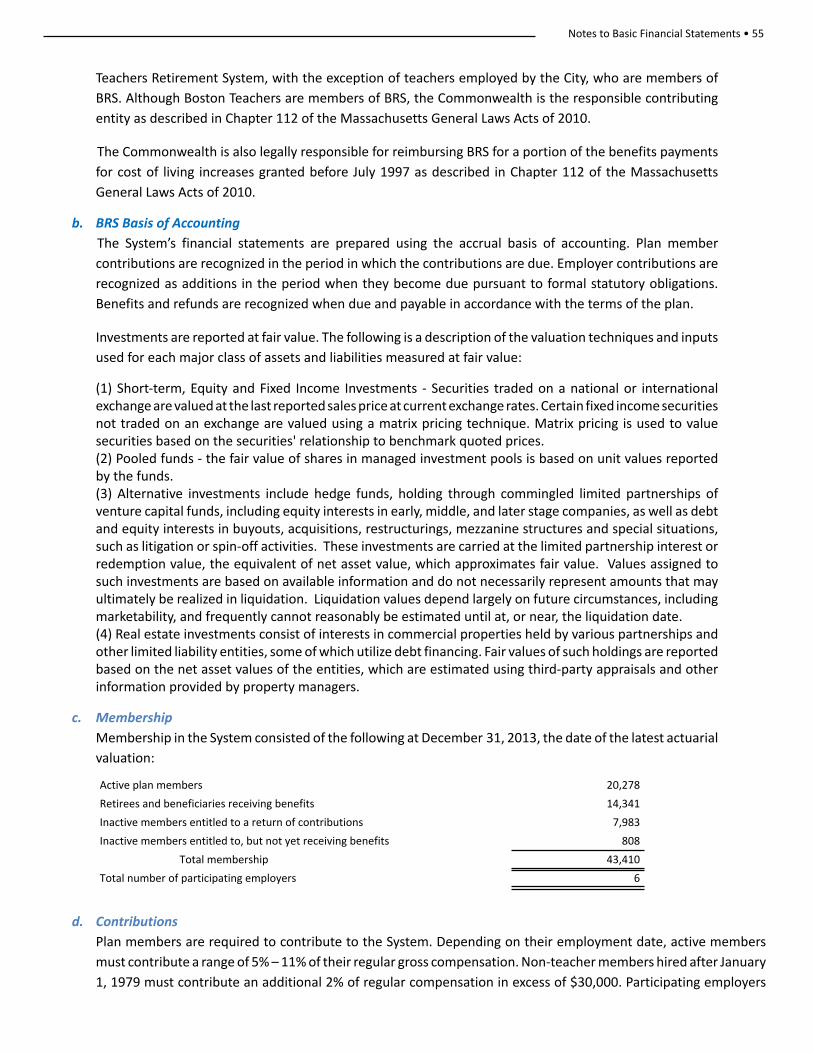
Notes to Basic Financial Statements • 55
Teachers Retirement System, with the exception of teachers employed by the City, who are members of
BRS. Although Boston Teachers are members of BRS, the Commonwealth is the responsible contributing
entity as described in Chapter 112 of the Massachusetts General Laws Acts of 2010.
The Commonwealth is also legally responsible for reimbursing BRS for a portion of the benefits payments
for cost of living increases granted before July 1997 as described in Chapter 112 of the Massachusetts
General Laws Acts of 2010.
b. BRS Basis of Accounting
The System’s financial statements are prepared using the accrual basis of accounting. Plan member
contributions are recognized in the period in which the contributions are due. Employer contributions are
recognized as additions in the period when they become due pursuant to formal statutory obligations.
Benefits and refunds are recognized when due and payable in accordance with the terms of the plan.
Investments are reported at fair value. The following is a description of the valuation techniques and inputs
used for each major class of assets and liabilities measured at fair value:
(1) Short-term, Equity and Fixed Income Investments - Securities traded on a national or international exchange are valued at the last reported sales price at current exchange rates. Certain fixed income securities not traded on an exchange are valued using a matrix pricing technique. Matrix pricing is used to value securities based on the securities' relationship to benchmark quoted prices.(2) Pooled funds - the fair value of shares in managed investment pools is based on unit values reported by the funds.(3) Alternative investments include hedge funds, holding through commingled limited partnerships of venture capital funds, including equity interests in early, middle, and later stage companies, as well as debt and equity interests in buyouts, acquisitions, restructurings, mezzanine structures and special situations, such as litigation or spin-off activities. These investments are carried at the limited partnership interest or redemption value, the equivalent of net asset value, which approximates fair value. Values assigned to such investments are based on available information and do not necessarily represent amounts that may ultimately be realized in liquidation. Liquidation values depend largely on future circumstances, including marketability, and frequently cannot reasonably be estimated until at, or near, the liquidation date.(4) Real estate investments consist of interests in commercial properties held by various partnerships and other limited liability entities, some of which utilize debt financing. Fair values of such holdings are reported based on the net asset values of the entities, which are estimated using third-party appraisals and other information provided by property managers.
c. Membership
Membership in the System consisted of the following at December 31, 2013, the date of the latest actuarial
valuation:
Active plan members 20,278
Retirees and beneficiaries receiving benefits 14,341
Inactive members entitled to a return of contributions 7,983
Inactive members entitled to, but not yet receiving benefits 808
Total membership 43,410
Total number of participating employers 6
d. Contributions
Plan members are required to contribute to the System. Depending on their employment date, active members
must contribute a range of 5% – 11% of their regular gross compensation. Non-teacher members hired after January
1, 1979 must contribute an additional 2% of regular compensation in excess of $30,000. Participating employers
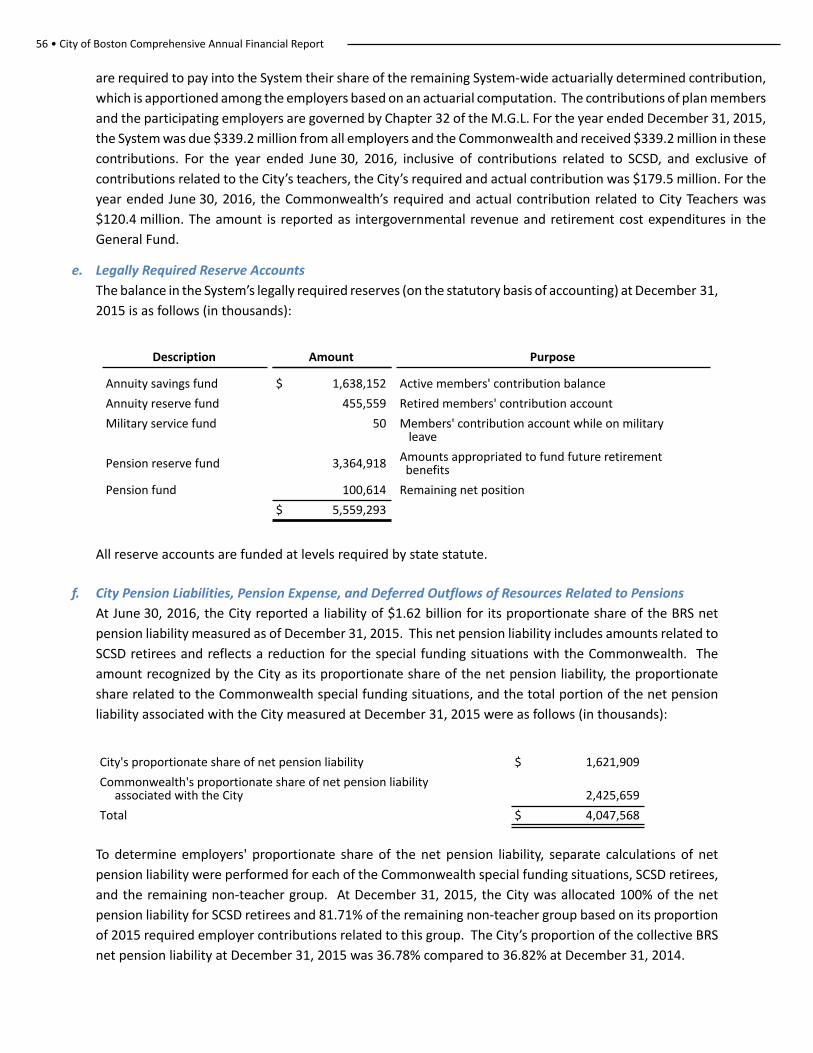
56 • City of Boston Comprehensive Annual Financial Report
are required to pay into the System their share of the remaining System-wide actuarially determined contribution,
which is apportioned among the employers based on an actuarial computation. The contributions of plan members
and the participating employers are governed by Chapter 32 of the M.G.L. For the year ended December 31, 2015,
the System was due $339.2 million from all employers and the Commonwealth and received $339.2 million in these
contributions. For the year ended June 30, 2016, inclusive of contributions related to SCSD, and exclusive of
contributions related to the City’s teachers, the City’s required and actual contribution was $179.5 million. For the
year ended June 30, 2016, the Commonwealth’s required and actual contribution related to City Teachers was
$120.4 million. The amount is reported as intergovernmental revenue and retirement cost expenditures in the
General Fund.
e. Legally Required Reserve Accounts
The balance in the System’s legally required reserves (on the statutory basis of accounting) at December 31,
2015 is as follows (in thousands):
Description Amount Purpose
Annuity savings fund $ 1,638,152 Active members' contribution balance
Annuity reserve fund 455,559 Retired members' contribution account
Military service fund 50 Members' contribution account while on military leave
Pension reserve fund 3,364,918 Amounts appropriated to fund future retirement benefits
Pension fund 100,614 Remaining net position
$ 5,559,293
All reserve accounts are funded at levels required by state statute.
f. City Pension Liabilities, Pension Expense, and Deferred Outflows of Resources Related to Pensions
At June 30, 2016, the City reported a liability of $1.62 billion for its proportionate share of the BRS net
pension liability measured as of December 31, 2015. This net pension liability includes amounts related to
SCSD retirees and reflects a reduction for the special funding situations with the Commonwealth. The
amount recognized by the City as its proportionate share of the net pension liability, the proportionate
share related to the Commonwealth special funding situations, and the total portion of the net pension
liability associated with the City measured at December 31, 2015 were as follows (in thousands):
City's proportionate share of net pension liability $ 1,621,909
Commonwealth's proportionate share of net pension liability associated with the City 2,425,659
Total $ 4,047,568
To determine employers' proportionate share of the net pension liability, separate calculations of net
pension liability were performed for each of the Commonwealth special funding situations, SCSD retirees,
and the remaining non-teacher group. At December 31, 2015, the City was allocated 100% of the net
pension liability for SCSD retirees and 81.71% of the remaining non-teacher group based on its proportion
of 2015 required employer contributions related to this group. The City’s proportion of the collective BRS
net pension liability at December 31, 2015 was 36.78% compared to 36.82% at December 31, 2014.
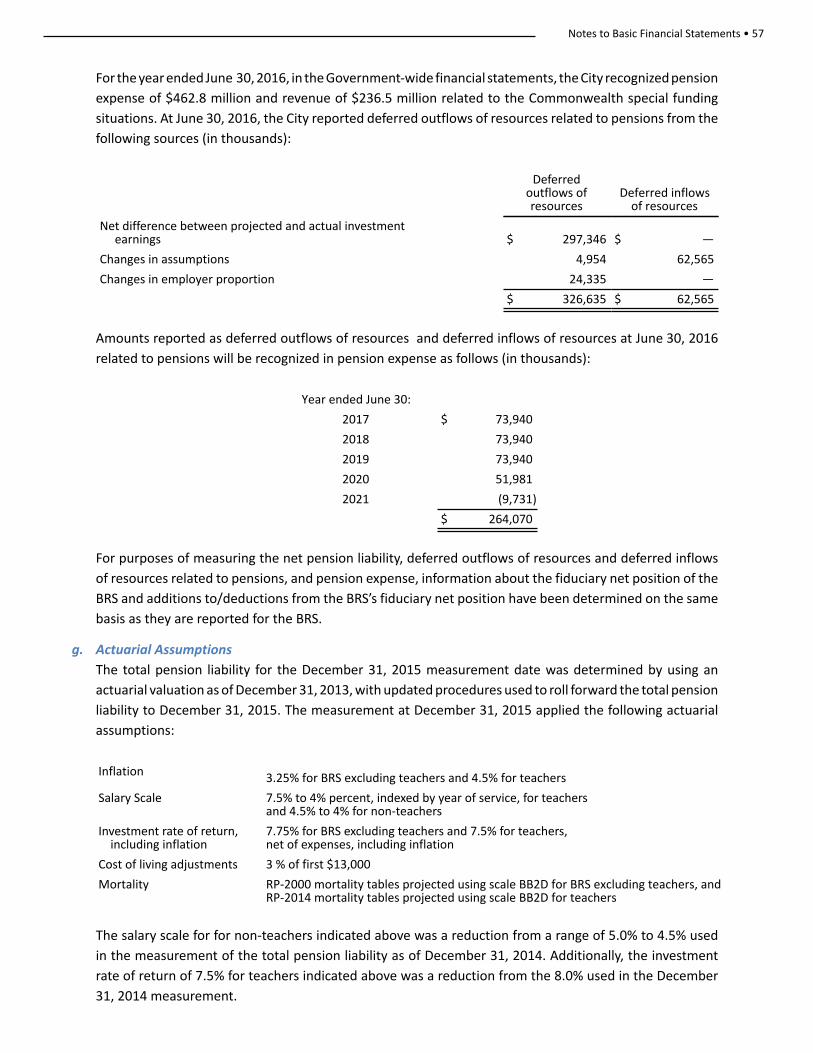
Notes to Basic Financial Statements • 57
For the year ended June 30, 2016, in the Government-wide financial statements, the City recognized pension
expense of $462.8 million and revenue of $236.5 million related to the Commonwealth special funding
situations. At June 30, 2016, the City reported deferred outflows of resources related to pensions from the
following sources (in thousands):
Deferred outflows of resources
Deferred inflowsof resources
Net difference between projected and actual investment earnings $ 297,346 $ —
Changes in assumptions 4,954 62,565
Changes in employer proportion 24,335 —
$ 326,635 $ 62,565
Amounts reported as deferred outflows of resources and deferred inflows of resources at June 30, 2016
related to pensions will be recognized in pension expense as follows (in thousands):
Year ended June 30:
2017 $ 73,940
2018 73,940
2019 73,940
2020 51,981
2021 (9,731)
$ 264,070
For purposes of measuring the net pension liability, deferred outflows of resources and deferred inflows
of resources related to pensions, and pension expense, information about the fiduciary net position of the
BRS and additions to/deductions from the BRS’s fiduciary net position have been determined on the same
basis as they are reported for the BRS.
g. Actuarial Assumptions
The total pension liability for the December 31, 2015 measurement date was determined by using an
actuarial valuation as of December 31, 2013, with updated procedures used to roll forward the total pension
liability to December 31, 2015. The measurement at December 31, 2015 applied the following actuarial
assumptions:
Inflation 3.25% for BRS excluding teachers and 4.5% for teachers
Salary Scale 7.5% to 4% percent, indexed by year of service, for teachersand 4.5% to 4% for non-teachers
Investment rate of return, including inflation
7.75% for BRS excluding teachers and 7.5% for teachers, net of expenses, including inflation
Cost of living adjustments 3 % of first $13,000
Mortality RP-2000 mortality tables projected using scale BB2D for BRS excluding teachers, andRP-2014 mortality tables projected using scale BB2D for teachers
The salary scale for for non-teachers indicated above was a reduction from a range of 5.0% to 4.5% used
in the measurement of the total pension liability as of December 31, 2014. Additionally, the investment
rate of return of 7.5% for teachers indicated above was a reduction from the 8.0% used in the December
31, 2014 measurement.
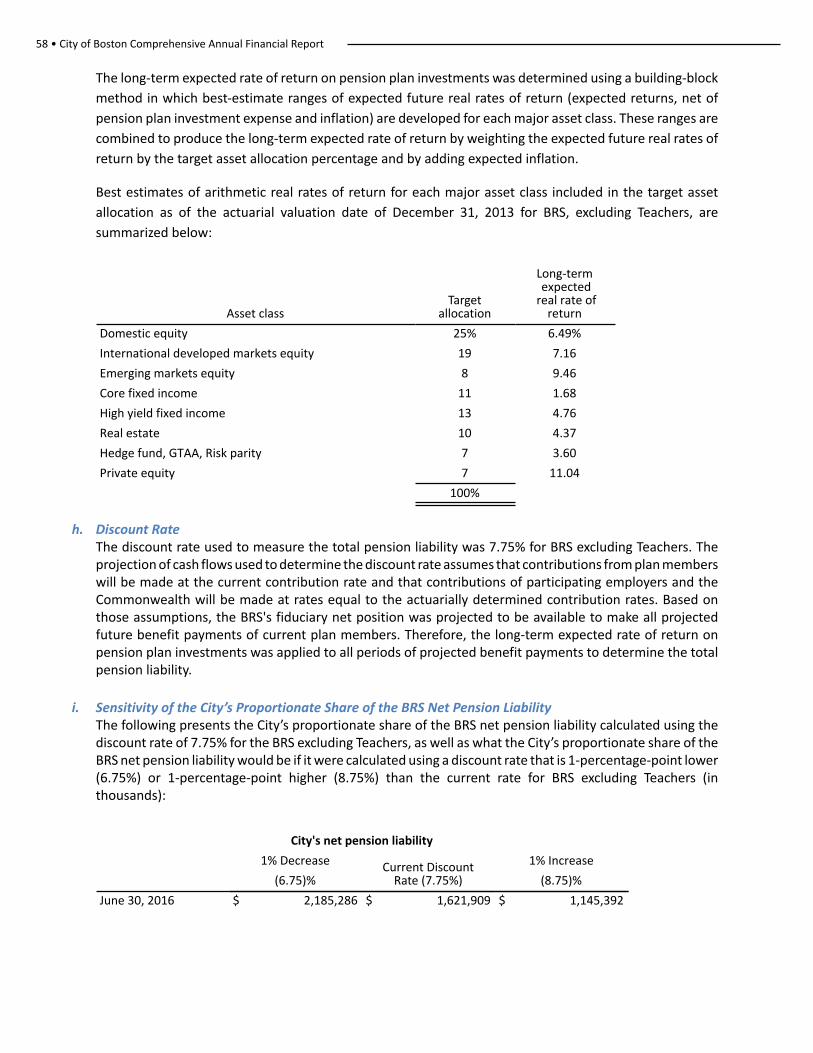
58 • City of Boston Comprehensive Annual Financial Report
The long-term expected rate of return on pension plan investments was determined using a building-block
method in which best-estimate ranges of expected future real rates of return (expected returns, net of
pension plan investment expense and inflation) are developed for each major asset class. These ranges are
combined to produce the long-term expected rate of return by weighting the expected future real rates of
return by the target asset allocation percentage and by adding expected inflation.
Best estimates of arithmetic real rates of return for each major asset class included in the target asset
allocation as of the actuarial valuation date of December 31, 2013 for BRS, excluding Teachers, are
summarized below:
Asset classTarget
allocation
Long-term expected
real rate ofreturn
Domestic equity 25% 6.49%
International developed markets equity 19 7.16
Emerging markets equity 8 9.46
Core fixed income 11 1.68
High yield fixed income 13 4.76
Real estate 10 4.37
Hedge fund, GTAA, Risk parity 7 3.60
Private equity 7 11.04
100%
h. Discount RateThe discount rate used to measure the total pension liability was 7.75% for BRS excluding Teachers. The projection of cash flows used to determine the discount rate assumes that contributions from plan members will be made at the current contribution rate and that contributions of participating employers and the Commonwealth will be made at rates equal to the actuarially determined contribution rates. Based on those assumptions, the BRS's fiduciary net position was projected to be available to make all projected future benefit payments of current plan members. Therefore, the long-term expected rate of return on pension plan investments was applied to all periods of projected benefit payments to determine the total pension liability.
i. Sensitivity of the City’s Proportionate Share of the BRS Net Pension LiabilityThe following presents the City’s proportionate share of the BRS net pension liability calculated using the discount rate of 7.75% for the BRS excluding Teachers, as well as what the City’s proportionate share of the BRS net pension liability would be if it were calculated using a discount rate that is 1-percentage-point lower (6.75%) or 1-percentage-point higher (8.75%) than the current rate for BRS excluding Teachers (in thousands):
City's net pension liability
1% Decrease Current DiscountRate (7.75%)
1% Increase
(6.75)% (8.75)%
June 30, 2016 $ 2,185,286 $ 1,621,909 $ 1,145,392
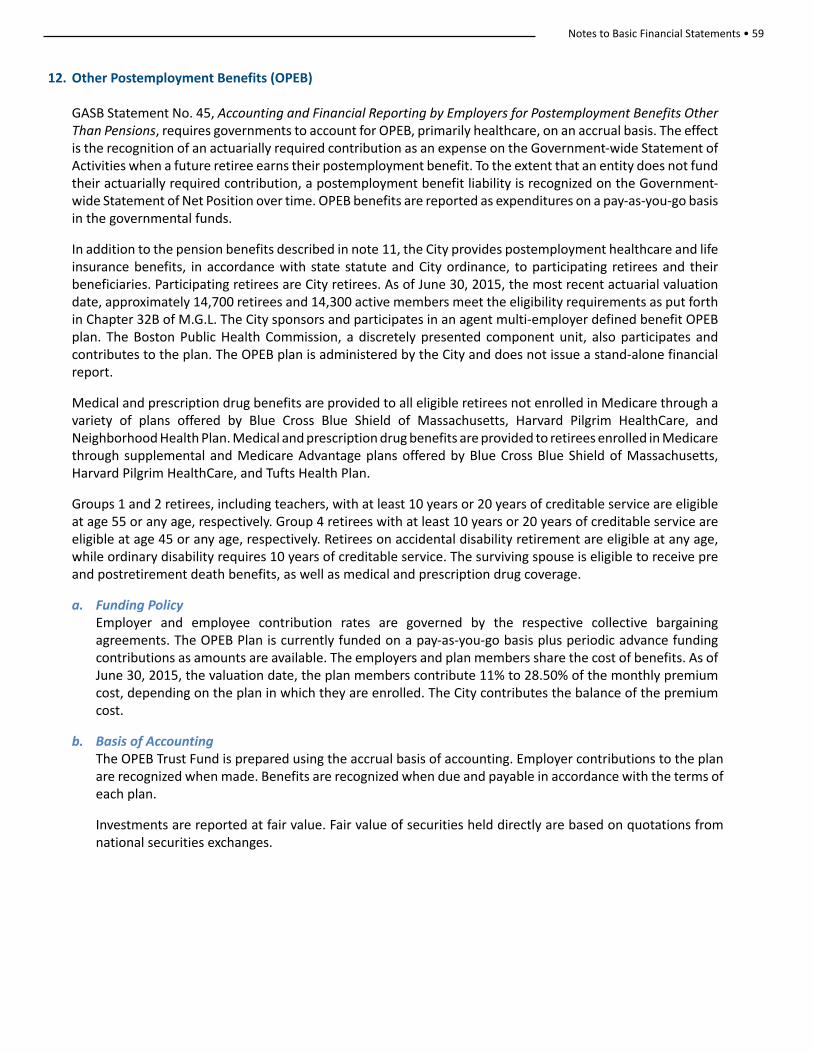
Notes to Basic Financial Statements • 59
12. Other Postemployment Benefits (OPEB)
GASB Statement No. 45, Accounting and Financial Reporting by Employers for Postemployment Benefits Other Than Pensions, requires governments to account for OPEB, primarily healthcare, on an accrual basis. The effect is the recognition of an actuarially required contribution as an expense on the Government-wide Statement of Activities when a future retiree earns their postemployment benefit. To the extent that an entity does not fund their actuarially required contribution, a postemployment benefit liability is recognized on the Government-wide Statement of Net Position over time. OPEB benefits are reported as expenditures on a pay-as-you-go basis in the governmental funds.
In addition to the pension benefits described in note 11, the City provides postemployment healthcare and life insurance benefits, in accordance with state statute and City ordinance, to participating retirees and their beneficiaries. Participating retirees are City retirees. As of June 30, 2015, the most recent actuarial valuation date, approximately 14,700 retirees and 14,300 active members meet the eligibility requirements as put forth in Chapter 32B of M.G.L. The City sponsors and participates in an agent multi-employer defined benefit OPEB plan. The Boston Public Health Commission, a discretely presented component unit, also participates and contributes to the plan. The OPEB plan is administered by the City and does not issue a stand-alone financial report.
Medical and prescription drug benefits are provided to all eligible retirees not enrolled in Medicare through a variety of plans offered by Blue Cross Blue Shield of Massachusetts, Harvard Pilgrim HealthCare, and Neighborhood Health Plan. Medical and prescription drug benefits are provided to retirees enrolled in Medicare through supplemental and Medicare Advantage plans offered by Blue Cross Blue Shield of Massachusetts, Harvard Pilgrim HealthCare, and Tufts Health Plan.
Groups 1 and 2 retirees, including teachers, with at least 10 years or 20 years of creditable service are eligible at age 55 or any age, respectively. Group 4 retirees with at least 10 years or 20 years of creditable service are eligible at age 45 or any age, respectively. Retirees on accidental disability retirement are eligible at any age, while ordinary disability requires 10 years of creditable service. The surviving spouse is eligible to receive pre and postretirement death benefits, as well as medical and prescription drug coverage.
a. Funding Policy Employer and employee contribution rates are governed by the respective collective bargaining agreements. The OPEB Plan is currently funded on a pay-as-you-go basis plus periodic advance funding contributions as amounts are available. The employers and plan members share the cost of benefits. As of June 30, 2015, the valuation date, the plan members contribute 11% to 28.50% of the monthly premium cost, depending on the plan in which they are enrolled. The City contributes the balance of the premium cost.
b. Basis of Accounting The OPEB Trust Fund is prepared using the accrual basis of accounting. Employer contributions to the plan are recognized when made. Benefits are recognized when due and payable in accordance with the terms of each plan.
Investments are reported at fair value. Fair value of securities held directly are based on quotations from national securities exchanges.
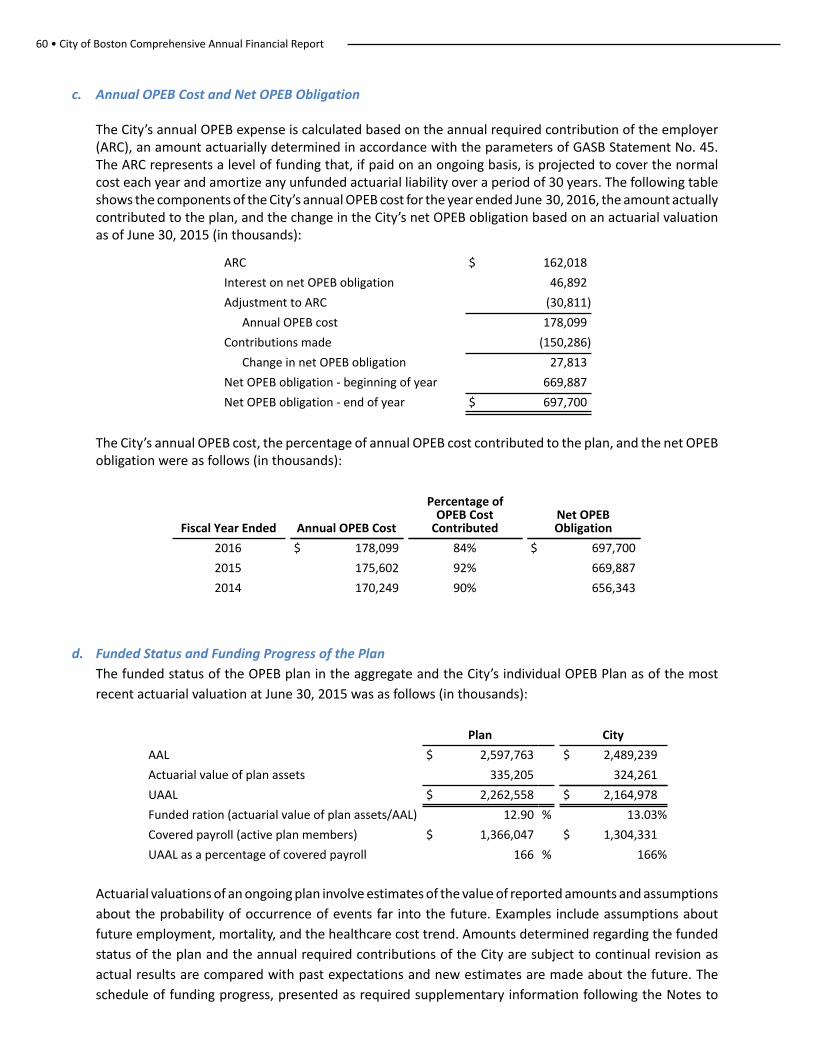
60 • City of Boston Comprehensive Annual Financial Report
c. Annual OPEB Cost and Net OPEB Obligation
The City’s annual OPEB expense is calculated based on the annual required contribution of the employer (ARC), an amount actuarially determined in accordance with the parameters of GASB Statement No. 45. The ARC represents a level of funding that, if paid on an ongoing basis, is projected to cover the normal cost each year and amortize any unfunded actuarial liability over a period of 30 years. The following table shows the components of the City’s annual OPEB cost for the year ended June 30, 2016, the amount actually contributed to the plan, and the change in the City’s net OPEB obligation based on an actuarial valuation as of June 30, 2015 (in thousands):
ARC $ 162,018
Interest on net OPEB obligation 46,892
Adjustment to ARC (30,811)
Annual OPEB cost 178,099
Contributions made (150,286)
Change in net OPEB obligation 27,813
Net OPEB obligation - beginning of year 669,887
Net OPEB obligation - end of year $ 697,700
The City’s annual OPEB cost, the percentage of annual OPEB cost contributed to the plan, and the net OPEB obligation were as follows (in thousands):
Fiscal Year Ended Annual OPEB Cost
Percentage ofOPEB Cost
ContributedNet OPEBObligation
2016 $ 178,099 84% $ 697,700
2015 175,602 92% 669,887
2014 170,249 90% 656,343
d. Funded Status and Funding Progress of the Plan
The funded status of the OPEB plan in the aggregate and the City’s individual OPEB Plan as of the most
recent actuarial valuation at June 30, 2015 was as follows (in thousands):
Plan City
AAL $ 2,597,763 $ 2,489,239
Actuarial value of plan assets 335,205 324,261
UAAL $ 2,262,558 $ 2,164,978
Funded ration (actuarial value of plan assets/AAL) 12.90 % 13.03%
Covered payroll (active plan members) $ 1,366,047 $ 1,304,331
UAAL as a percentage of covered payroll 166 % 166%
Actuarial valuations of an ongoing plan involve estimates of the value of reported amounts and assumptions
about the probability of occurrence of events far into the future. Examples include assumptions about
future employment, mortality, and the healthcare cost trend. Amounts determined regarding the funded
status of the plan and the annual required contributions of the City are subject to continual revision as
actual results are compared with past expectations and new estimates are made about the future. The
schedule of funding progress, presented as required supplementary information following the Notes to
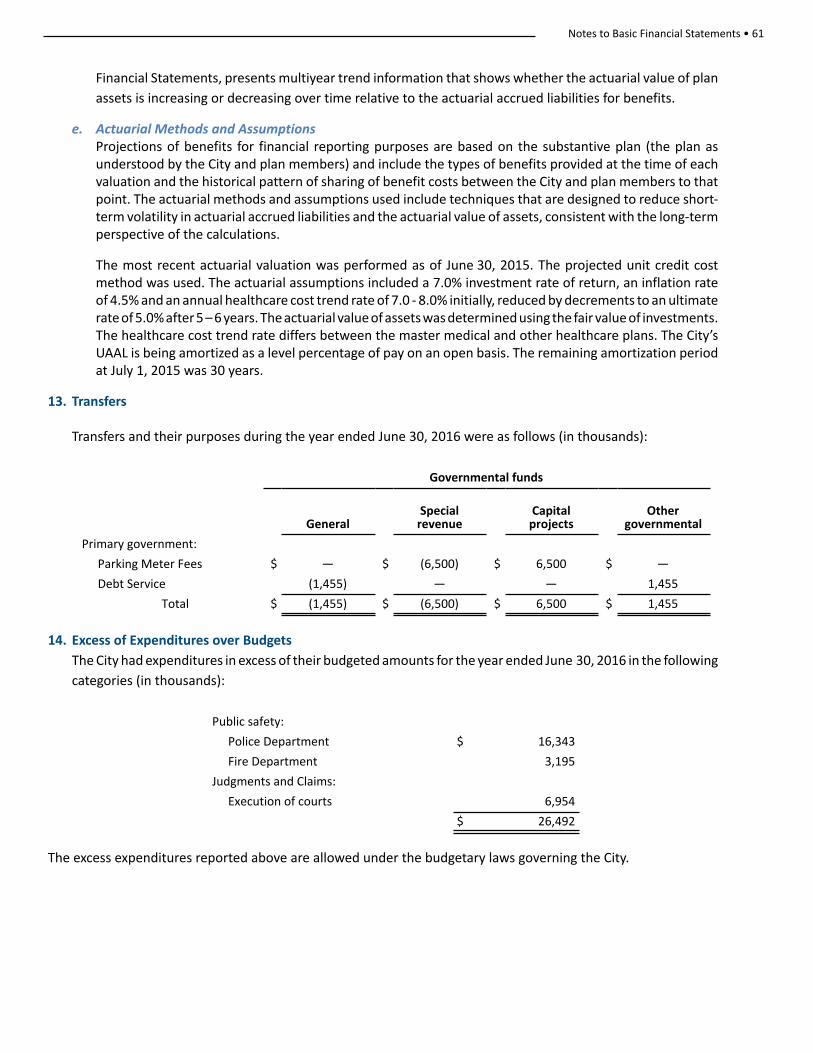
Notes to Basic Financial Statements • 61
Financial Statements, presents multiyear trend information that shows whether the actuarial value of plan
assets is increasing or decreasing over time relative to the actuarial accrued liabilities for benefits.
e. Actuarial Methods and AssumptionsProjections of benefits for financial reporting purposes are based on the substantive plan (the plan as understood by the City and plan members) and include the types of benefits provided at the time of each valuation and the historical pattern of sharing of benefit costs between the City and plan members to that point. The actuarial methods and assumptions used include techniques that are designed to reduce short-term volatility in actuarial accrued liabilities and the actuarial value of assets, consistent with the long-term perspective of the calculations.
The most recent actuarial valuation was performed as of June 30, 2015. The projected unit credit cost method was used. The actuarial assumptions included a 7.0% investment rate of return, an inflation rate of 4.5% and an annual healthcare cost trend rate of 7.0 - 8.0% initially, reduced by decrements to an ultimate rate of 5.0% after 5 – 6 years. The actuarial value of assets was determined using the fair value of investments. The healthcare cost trend rate differs between the master medical and other healthcare plans. The City’s UAAL is being amortized as a level percentage of pay on an open basis. The remaining amortization period at July 1, 2015 was 30 years.
13. Transfers
Transfers and their purposes during the year ended June 30, 2016 were as follows (in thousands):
Governmental funds
GeneralSpecial
revenueCapital
projectsOther
governmental
Primary government:
Parking Meter Fees $ — $ (6,500) $ 6,500 $ —
Debt Service (1,455) — — 1,455
Total $ (1,455) $ (6,500) $ 6,500 $ 1,455
14. Excess of Expenditures over Budgets
The City had expenditures in excess of their budgeted amounts for the year ended June 30, 2016 in the following
categories (in thousands):
Public safety:
Police Department $ 16,343
Fire Department 3,195
Judgments and Claims:
Execution of courts 6,954
$ 26,492
The excess expenditures reported above are allowed under the budgetary laws governing the City.
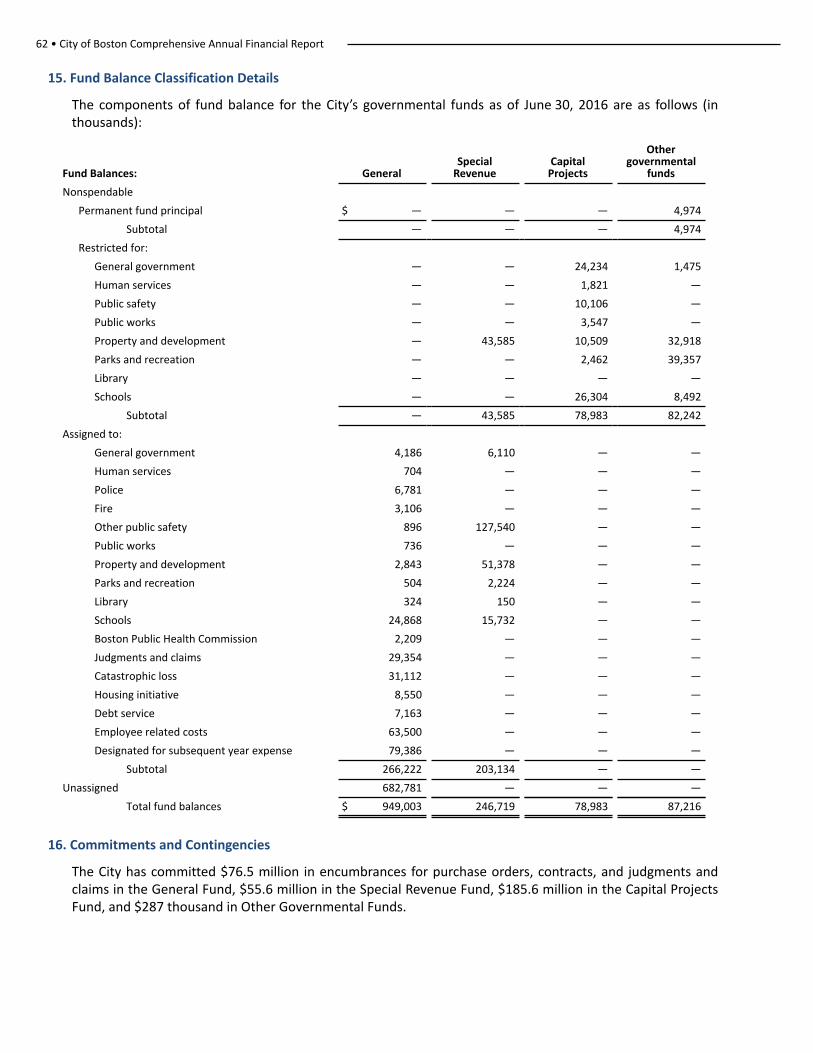
62 • City of Boston Comprehensive Annual Financial Report
15. Fund Balance Classification Details
The components of fund balance for the City’s governmental funds as of June 30, 2016 are as follows (in thousands):
Fund Balances: GeneralSpecial
RevenueCapital
Projects
Othergovernmental
funds
Nonspendable
Permanent fund principal $ — — — 4,974
Subtotal — — — 4,974
Restricted for:
General government — — 24,234 1,475
Human services — — 1,821 —
Public safety — — 10,106 —
Public works — — 3,547 —
Property and development — 43,585 10,509 32,918
Parks and recreation — — 2,462 39,357
Library — — — —
Schools — — 26,304 8,492
Subtotal — 43,585 78,983 82,242
Assigned to:
General government 4,186 6,110 — —
Human services 704 — — —
Police 6,781 — — —
Fire 3,106 — — —
Other public safety 896 127,540 — —
Public works 736 — — —
Property and development 2,843 51,378 — —
Parks and recreation 504 2,224 — —
Library 324 150 — —
Schools 24,868 15,732 — —
Boston Public Health Commission 2,209 — — —
Judgments and claims 29,354 — — —
Catastrophic loss 31,112 — — —
Housing initiative 8,550 — — —
Debt service 7,163 — — —
Employee related costs 63,500 — — —
Designated for subsequent year expense 79,386 — — —
Subtotal 266,222 203,134 — —
Unassigned 682,781 — — —
Total fund balances $ 949,003 246,719 78,983 87,216
16. Commitments and Contingencies
The City has committed $76.5 million in encumbrances for purchase orders, contracts, and judgments and claims in the General Fund, $55.6 million in the Special Revenue Fund, $185.6 million in the Capital Projects Fund, and $287 thousand in Other Governmental Funds.
Notes to Basic Financial Statements • 63
Infrastructure Investment Incentive Transactions
Infrastructure Investment Incentive transactions (I-Cubed) are governed by Chapter 293 of the Acts of 2006
(the Act). Under the Act, the funding for the projects associated with these transactions is provided through
proceeds of bonds issued by the Massachusetts Development Finance Agency (MDFA) and is to be used for
approved public infrastructure improvements undertaken by the developer. The debt service on these bonds
will be paid by the Commonwealth through State Infrastructure Development Assistance to the extent that
New State Tax Revenues generated once the project is operational offset the amounts paid to MDFA to cover
the debt service. When this is not the case, the participating municipality or developer generally will be
responsible for the shortfall depending on the transaction agreement. The Act provides for the establishment
of a Municipal Liquidity Reserve (MLR) from which the participating municipality can draw to offset any required
payments made to the Commonwealth. The MLR is generally funded by the developer either through cash or
a direct pay letter of credit.
During fiscal year 2015 , the City executed two Infrastructure Development Assistance Agreements (IDAA) for
I-Cubed transactions. Under the first IDAA, $32.4 million in bonds were issued by MDFA in September 2015.
Also, an MLR of $1.2 million was established at the time of the issuance of the bonds. This reserve is equal to
twice the maximum annual debt service payable in any fiscal year on the bonds issued under the indenture.
The City is obligated for any shortfalls between debt service on the bonds and New State Tax Revenues. However,
it has the right to assess the developer or draw from the MLR for any payments on such obligations. The City
had no obligation for any shortfalls at June 30, 2016. The City also recorded $11.2 million in donated capital
assets in fiscal year 2016 for improvements to City-owned infrastructure made by the developer. These assets
have been recorded at acquisition value which has been defined as "the price that would be paid to acquire an
asset with equivalent service potential in an orderly market transaction at the acquisition date."
Under the second IDAA, $10.0 million in bonds were issued by MDFA in fiscal year 2016. The City is obligated
for any shortfalls between debt service on the bonds and New State Tax Revenues. However, it has the right
to assess the developer or draw from the MLR for one-third of any payments on such obligations. The City had
no obligation for any shortfalls at June 30, 2016.
In connection with this second I-Cubed transaction, the City has a leasehold interest in a portion of the parking
garage, which represents the public infrastructure improvements under the transaction, created under a master
lease and its assignments and a sublease. With the execution of the master lease and sublease agreements,
along with the assignment agreements transferring the interests of the owner of the parking garage to the City
through the BPDA, the City essentially becomes the lessee on the master lease and the sub-landlord on the
sublease. This results in the City having no responsibility for the operation of the parking garage and having
the right to collect from the sub-lessee Section 121A PILOT payments from 2015 through 2036 and then base
rent from 2036 through 2055, both of which are largely based on a percentage of gross revenues of the parking
garage. The City has no obligation for any payments as lessee under the master lease.
17. Public Health System
Effective July 1, 1996, the City’s Department of Health and Hospitals and Trustees of Health and Hospitals were
abolished. Substantially all their assets and liabilities, including title to the City’s two hospitals, BCH and Boston
Specialty and Rehabilitation Hospital (BSRH), were transferred to and assumed by BPHC.
Also effective July 1, 1996, the operations of BCH and BSRH were consolidated with the operations of the Boston
University Medical Center under the licensure and control of the BMC.
64 • City of Boston Comprehensive Annual Financial Report
The BPHC receives the majority of its funding from federal and state grants, and a City appropriation. During
fiscal year 2016, the City appropriated $76.2 million to the PHC. As described below, the BPHC uses the
appropriation to pay debt service on certain general obligation bonds, for administrative purposes and to
support the various public health programs run by the PHC. The City has budgeted $77.3 million for the BPHC
for fiscal year 2017.
Due from BPHC/BMC
General obligation bonds issued by the City between December 1967 and October 1995, for which BPHC was
responsible for repayment, have been fully repaid as of June 30, 2016. These bonds pertained to the property
and operations of the BCH Campus, South Block Campus, BSRH Campus, Emergency Medical Services
Operations, and the Long Island Campus.
In addition, the BPHC is also responsible for reimbursing the City for health insurance, equipment lease payments, workers’ compensation, and other miscellaneous expenses paid for by the City.
18. Risk Management
The Risk Management Program focuses on a planned strategy of self-insurance, supported by strong prevention and cost reduction efforts, financial reserves and catastrophic insurance. The City is self-insured in most areas of risk including general liability, property and casualty, workers’ compensation, certain employee health care costs and unemployment compensation.
The City’s legal liabilities are capped per M.G.L. Chapter 258, and Corporation Counsel defends the City in any lawsuits that arise from the normal course of operations. For workers’ compensation, the City is exempt from state insurance requirements per M.G.L. Chapter 152 Section 25B. The City’s Workers’ Compensation Division, as well as the Police and Fire Departments, manage employee injury claims internally. The City budgets for and funds legal claims and employee injury costs through the General Fund, charging specific departments for their share of costs in order to promote awareness and prevention efforts.
The City provides health insurance coverage for employees and retirees through a variety of insured and self-insured plans. The City budgets for and funds the premium costs for all plans through the General Fund. Self-insured plans are financially managed through the Internal Service Fund established in compliance with M.G.L. Chapter 32B, Section 3A. In fiscal year 2013, a guiding policy for the more prudent management of the City of Boston Health Claims Trust Fund was established. This policy states that accounting for the fund will be in accordance with generally accepted accounting principles, and will ensure that all contributions and actual costs are shared between employers and their subscribers according to predetermined ratios.
For unexpected large losses, the City maintains a catastrophic risk reserve, which has an available balance of $31.1 million at the end of fiscal 2016. To further protect the City’s assets and finances from adverse loss, commercial insurance is purchased strategically for certain exposures. A catastrophic property insurance policy provides $100.0 million for all risk protection after a $10.0 million deductible. Boiler and machinery losses are insured up to $25.0 million per incident, after a $50 thousand deductible.
The City has established a liability based on historical trends of previous years and attorneys’ estimates of pending matters and lawsuits in which the City is involved. Changes in the self-insurance liability for the fiscal years ended June 30, 2016 and 2015 are as follows (in thousands):
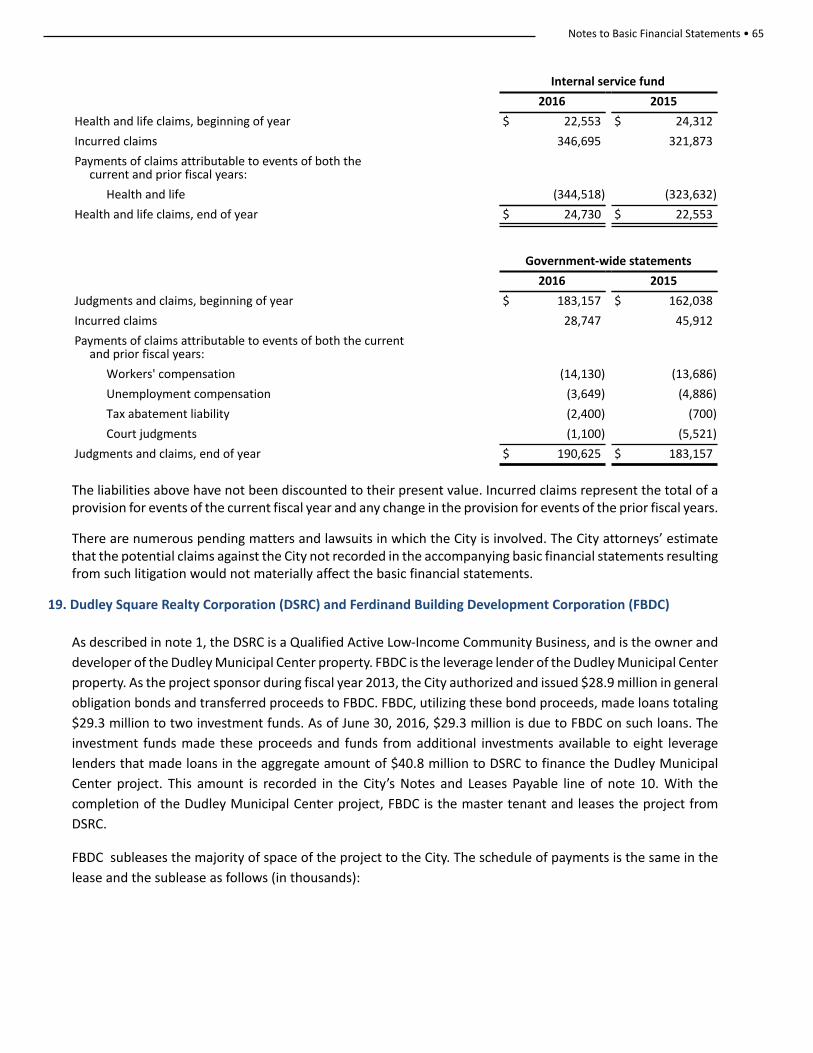
Notes to Basic Financial Statements • 65
Internal service fund
2016 2015
Health and life claims, beginning of year $ 22,553 $ 24,312
Incurred claims 346,695 321,873
Payments of claims attributable to events of both the current and prior fiscal years:
Health and life (344,518) (323,632)
Health and life claims, end of year $ 24,730 $ 22,553
Government-wide statements
2016 2015
Judgments and claims, beginning of year $ 183,157 $ 162,038
Incurred claims 28,747 45,912
Payments of claims attributable to events of both the current and prior fiscal years:
Workers' compensation (14,130) (13,686)
Unemployment compensation (3,649) (4,886)
Tax abatement liability (2,400) (700)
Court judgments (1,100) (5,521)
Judgments and claims, end of year $ 190,625 $ 183,157
The liabilities above have not been discounted to their present value. Incurred claims represent the total of a provision for events of the current fiscal year and any change in the provision for events of the prior fiscal years.
There are numerous pending matters and lawsuits in which the City is involved. The City attorneys’ estimate that the potential claims against the City not recorded in the accompanying basic financial statements resulting from such litigation would not materially affect the basic financial statements.
19. Dudley Square Realty Corporation (DSRC) and Ferdinand Building Development Corporation (FBDC)
As described in note 1, the DSRC is a Qualified Active Low-Income Community Business, and is the owner and
developer of the Dudley Municipal Center property. FBDC is the leverage lender of the Dudley Municipal Center
property. As the project sponsor during fiscal year 2013, the City authorized and issued $28.9 million in general
obligation bonds and transferred proceeds to FBDC. FBDC, utilizing these bond proceeds, made loans totaling
$29.3 million to two investment funds. As of June 30, 2016, $29.3 million is due to FBDC on such loans. The
investment funds made these proceeds and funds from additional investments available to eight leverage
lenders that made loans in the aggregate amount of $40.8 million to DSRC to finance the Dudley Municipal
Center project. This amount is recorded in the City’s Notes and Leases Payable line of note 10. With the
completion of the Dudley Municipal Center project, FBDC is the master tenant and leases the project from
DSRC.
FBDC subleases the majority of space of the project to the City. The schedule of payments is the same in the
lease and the sublease as follows (in thousands):
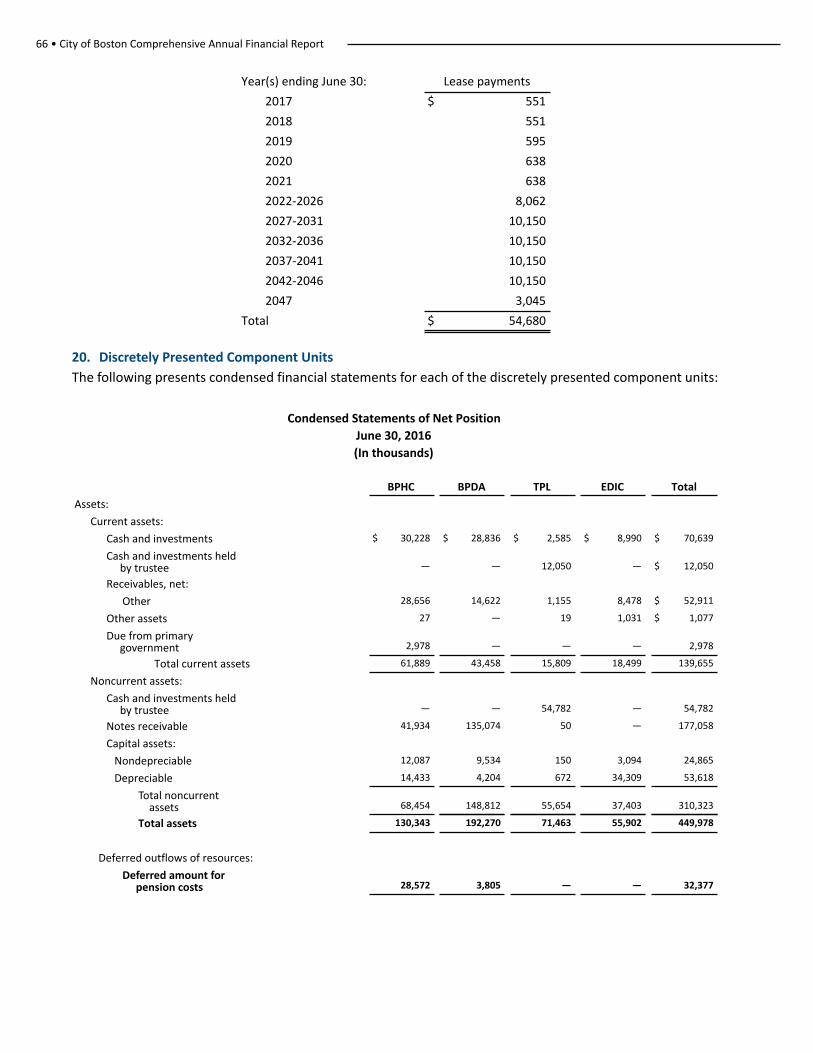
66 • City of Boston Comprehensive Annual Financial Report
Year(s) ending June 30: Lease payments
2017 $ 551
2018 551
2019 595
2020 638
2021 638
2022-2026 8,062
2027-2031 10,150
2032-2036 10,150
2037-2041 10,150
2042-2046 10,150
2047 3,045
Total $ 54,680
20. Discretely Presented Component Units
The following presents condensed financial statements for each of the discretely presented component units:
Condensed Statements of Net PositionJune 30, 2016(In thousands)
BPHC BPDA TPL EDIC Total
Assets:
Current assets:
Cash and investments $ 30,228 $ 28,836 $ 2,585 $ 8,990 $ 70,639
Cash and investments held by trustee — — 12,050 — $ 12,050
Receivables, net:
Other 28,656 14,622 1,155 8,478 $ 52,911
Other assets 27 — 19 1,031 $ 1,077
Due from primary government 2,978 — — — 2,978
Total current assets 61,889 43,458 15,809 18,499 139,655
Noncurrent assets:
Cash and investments held by trustee — — 54,782 — 54,782
Notes receivable 41,934 135,074 50 — 177,058
Capital assets:
Nondepreciable 12,087 9,534 150 3,094 24,865
Depreciable 14,433 4,204 672 34,309 53,618
Total noncurrent assets 68,454 148,812 55,654 37,403 310,323
Total assets 130,343 192,270 71,463 55,902 449,978
Deferred outflows of resources:
Deferred amount for pension costs 28,572 3,805 — — 32,377
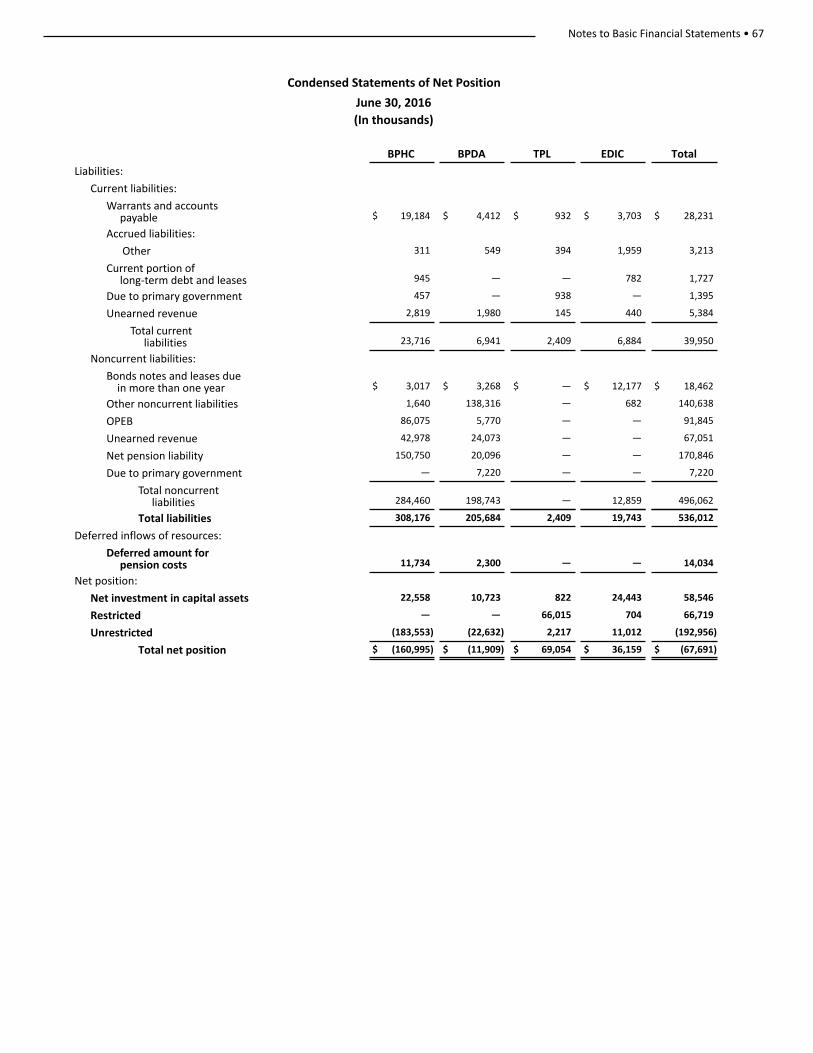
Notes to Basic Financial Statements • 67
Condensed Statements of Net Position
June 30, 2016(In thousands)
BPHC BPDA TPL EDIC Total
Liabilities:
Current liabilities:
Warrants and accounts payable $ 19,184 $ 4,412 $ 932 $ 3,703 $ 28,231
Accrued liabilities:
Other 311 549 394 1,959 3,213
Current portion of long-term debt and leases 945 — — 782 1,727
Due to primary government 457 — 938 — 1,395
Unearned revenue 2,819 1,980 145 440 5,384
Total current liabilities 23,716 6,941 2,409 6,884 39,950
Noncurrent liabilities:
Bonds notes and leases due in more than one year $ 3,017 $ 3,268 $ — $ 12,177 $ 18,462
Other noncurrent liabilities 1,640 138,316 — 682 140,638
OPEB 86,075 5,770 — — 91,845
Unearned revenue 42,978 24,073 — — 67,051
Net pension liability 150,750 20,096 — — 170,846
Due to primary government — 7,220 — — 7,220
Total noncurrent liabilities 284,460 198,743 — 12,859 496,062
Total liabilities 308,176 205,684 2,409 19,743 536,012
Deferred inflows of resources:
Deferred amount for pension costs 11,734 2,300 — — 14,034
Net position:
Net investment in capital assets 22,558 10,723 822 24,443 58,546
Restricted — — 66,015 704 66,719
Unrestricted (183,553) (22,632) 2,217 11,012 (192,956)
Total net position $ (160,995) $ (11,909) $ 69,054 $ 36,159 $ (67,691)
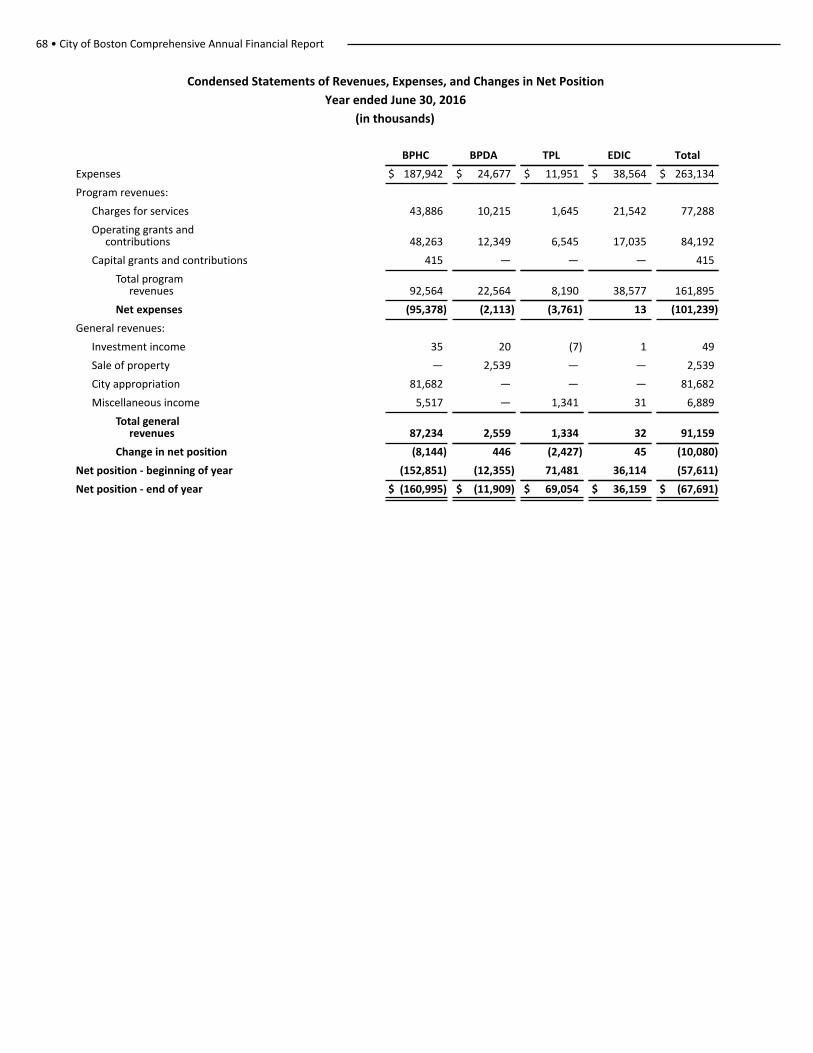
68 • City of Boston Comprehensive Annual Financial Report
Condensed Statements of Revenues, Expenses, and Changes in Net Position
Year ended June 30, 2016
(in thousands)
BPHC BPDA TPL EDIC Total
Expenses $ 187,942 $ 24,677 $ 11,951 $ 38,564 $ 263,134
Program revenues:
Charges for services 43,886 10,215 1,645 21,542 77,288
Operating grants and contributions 48,263 12,349 6,545 17,035 84,192
Capital grants and contributions 415 — — — 415
Total program revenues 92,564 22,564 8,190 38,577 161,895
Net expenses (95,378) (2,113) (3,761) 13 (101,239)
General revenues:
Investment income 35 20 (7) 1 49
Sale of property — 2,539 — — 2,539
City appropriation 81,682 — — — 81,682
Miscellaneous income 5,517 — 1,341 31 6,889
Total general revenues 87,234 2,559 1,334 32 91,159
Change in net position (8,144) 446 (2,427) 45 (10,080)
Net position - beginning of year (152,851) (12,355) 71,481 36,114 (57,611)
Net position - end of year $ (160,995) $ (11,909) $ 69,054 $ 36,159 $ (67,691)
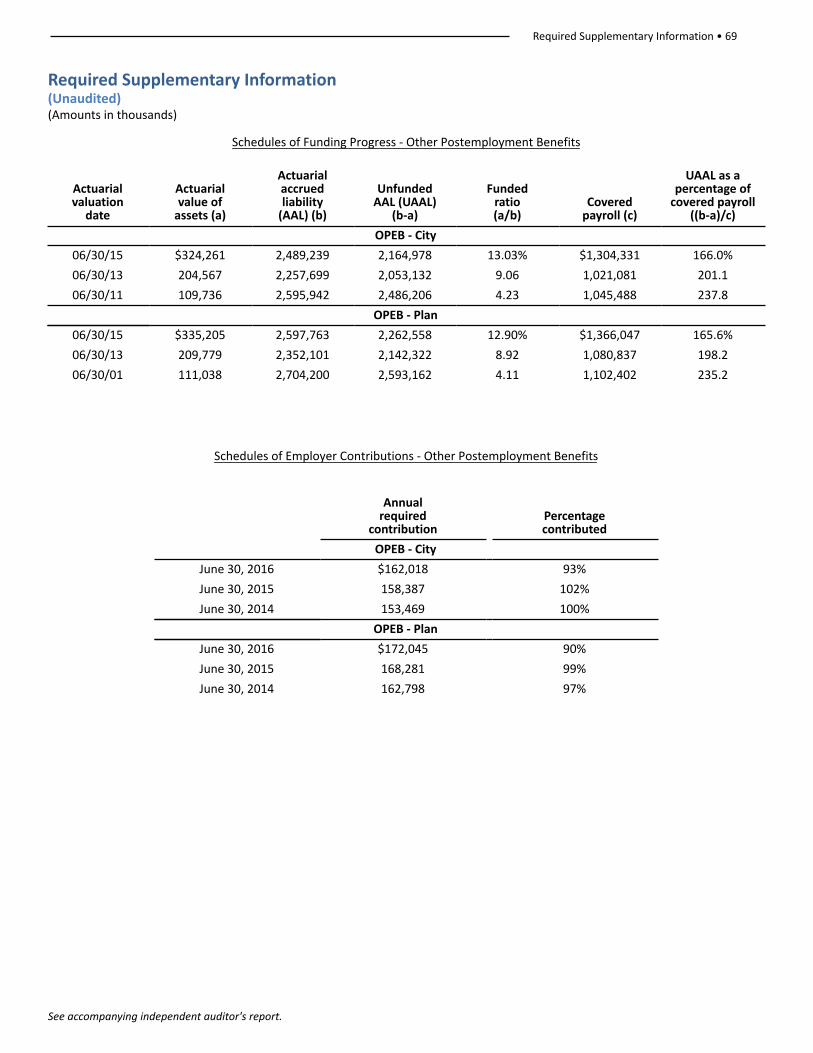
Required Supplementary Information • 69
See accompanying independent auditor's report.
Required Supplementary Information(Unaudited)(Amounts in thousands)
Schedules of Funding Progress - Other Postemployment Benefits
Actuarialvaluation
date
Actuarialvalue of
assets (a)
Actuarialaccruedliability
(AAL) (b)
UnfundedAAL (UAAL)
(b-a)
Funded ratio(a/b)
Covered payroll (c)
UAAL as apercentage of
covered payroll((b-a)/c)
OPEB - City
06/30/15 $324,261 2,489,239 2,164,978 13.03% $1,304,331 166.0%
06/30/13 204,567 2,257,699 2,053,132 9.06 1,021,081 201.1
06/30/11 109,736 2,595,942 2,486,206 4.23 1,045,488 237.8
OPEB - Plan
06/30/15 $335,205 2,597,763 2,262,558 12.90% $1,366,047 165.6%
06/30/13 209,779 2,352,101 2,142,322 8.92 1,080,837 198.2
06/30/01 111,038 2,704,200 2,593,162 4.11 1,102,402 235.2
Schedules of Employer Contributions - Other Postemployment Benefits
Annualrequired
contributionPercentage contributed
OPEB - City
June 30, 2016 $162,018 93%
June 30, 2015 158,387 102%
June 30, 2014 153,469 100%
OPEB - Plan
June 30, 2016 $172,045 90%
June 30, 2015 168,281 99%
June 30, 2014 162,798 97%
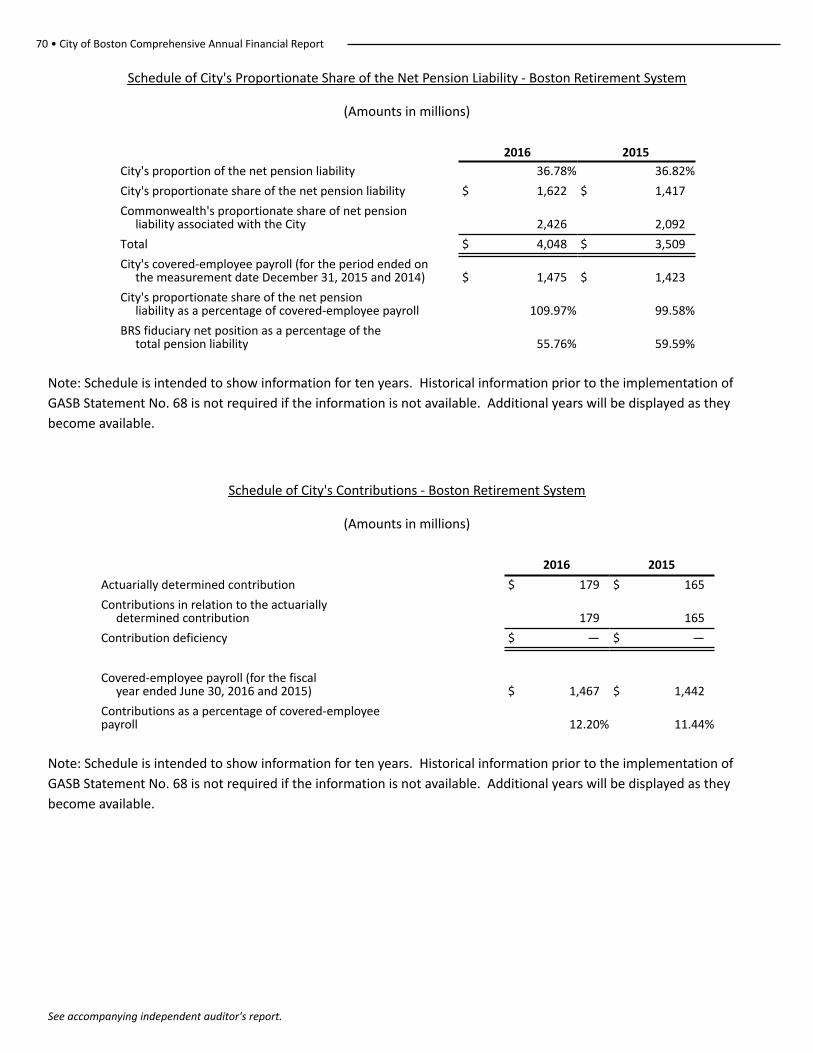
70 • City of Boston Comprehensive Annual Financial Report
See accompanying independent auditor's report.
Schedule of City's Proportionate Share of the Net Pension Liability - Boston Retirement System
(Amounts in millions)
2016 2015
City's proportion of the net pension liability 36.78% 36.82%
City's proportionate share of the net pension liability $ 1,622 $ 1,417
Commonwealth's proportionate share of net pension liability associated with the City 2,426 2,092
Total $ 4,048 $ 3,509
City's covered-employee payroll (for the period ended on the measurement date December 31, 2015 and 2014) $ 1,475 $ 1,423
City's proportionate share of the net pension liability as a percentage of covered-employee payroll 109.97% 99.58%
BRS fiduciary net position as a percentage of the total pension liability 55.76% 59.59%
Note: Schedule is intended to show information for ten years. Historical information prior to the implementation of
GASB Statement No. 68 is not required if the information is not available. Additional years will be displayed as they
become available.
Schedule of City's Contributions - Boston Retirement System
(Amounts in millions)
2016 2015
Actuarially determined contribution $ 179 $ 165
Contributions in relation to the actuarially determined contribution 179 165
Contribution deficiency $ — $ —
Covered-employee payroll (for the fiscal year ended June 30, 2016 and 2015) $ 1,467 $ 1,442
Contributions as a percentage of covered-employee payroll 12.20% 11.44%
Note: Schedule is intended to show information for ten years. Historical information prior to the implementation of
GASB Statement No. 68 is not required if the information is not available. Additional years will be displayed as they
become available.

Required Supplementary Information • 71
(This page intentionally left blank)
72 • City of Boston Comprehensive Annual Financial Report
General Fund
“Make Way for Ducklings” – Boston Public Garden
The General Fund is the operating fund of the City. It is used to account for all revenues,expenditures and other financial resources except those required to be accounted for in other funds.

City of Boston Comprehensive Annual Financial Report • 73
(This page intentionally left blank)
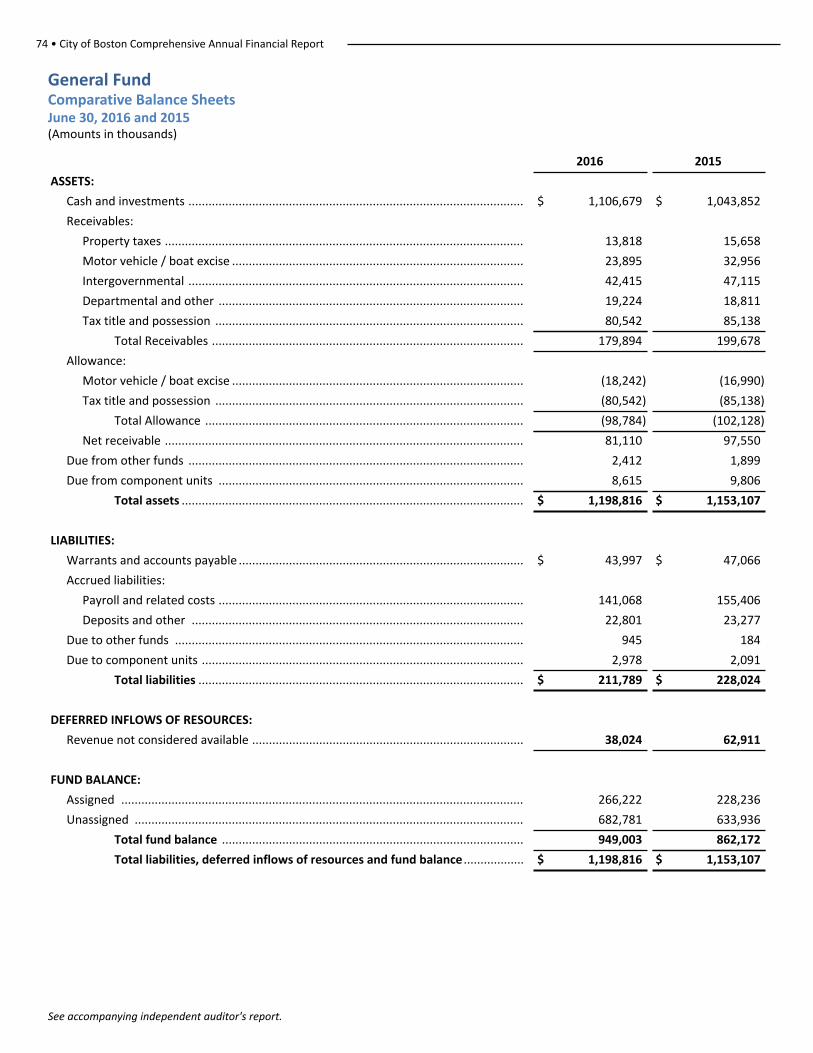
74 • City of Boston Comprehensive Annual Financial Report
See accompanying independent auditor's report.
General Fund Comparative Balance SheetsJune 30, 2016 and 2015 (Amounts in thousands)
2016 2015
ASSETS:
Cash and investments .................................................................................................... $ 1,106,679 $ 1,043,852
Receivables:
Property taxes ........................................................................................................... 13,818 15,658
Motor vehicle / boat excise ....................................................................................... 23,895 32,956
Intergovernmental .................................................................................................... 42,415 47,115
Departmental and other ........................................................................................... 19,224 18,811
Tax title and possession ............................................................................................ 80,542 85,138
Total Receivables ............................................................................................. 179,894 199,678
Allowance:
Motor vehicle / boat excise ....................................................................................... (18,242) (16,990)
Tax title and possession ............................................................................................ (80,542) (85,138)
Total Allowance ............................................................................................... (98,784) (102,128)
Net receivable ........................................................................................................... 81,110 97,550
Due from other funds .................................................................................................... 2,412 1,899
Due from component units ........................................................................................... 8,615 9,806
Total assets ...................................................................................................... $ 1,198,816 $ 1,153,107
LIABILITIES:
Warrants and accounts payable ..................................................................................... $ 43,997 $ 47,066
Accrued liabilities:
Payroll and related costs ........................................................................................... 141,068 155,406
Deposits and other ................................................................................................... 22,801 23,277
Due to other funds ........................................................................................................ 945 184
Due to component units ................................................................................................ 2,978 2,091
Total liabilities ................................................................................................. $ 211,789 $ 228,024
DEFERRED INFLOWS OF RESOURCES:
Revenue not considered available ................................................................................. 38,024 62,911
FUND BALANCE:
Assigned ........................................................................................................................ 266,222 228,236
Unassigned .................................................................................................................... 682,781 633,936
Total fund balance .......................................................................................... 949,003 862,172
Total liabilities, deferred inflows of resources and fund balance .................. $ 1,198,816 $ 1,153,107
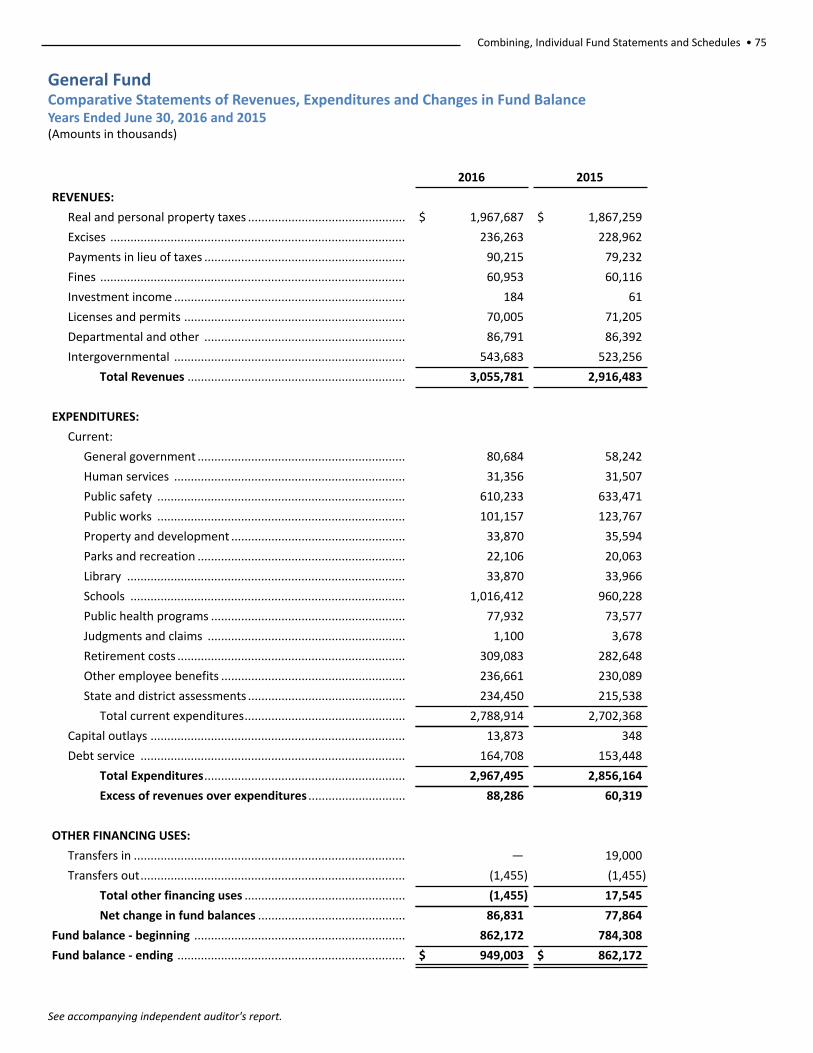
Combining, Individual Fund Statements and Schedules • 75
See accompanying independent auditor's report.
General Fund Comparative Statements of Revenues, Expenditures and Changes in Fund BalanceYears Ended June 30, 2016 and 2015 (Amounts in thousands)
2016 2015
REVENUES:
Real and personal property taxes ............................................... $ 1,967,687 $ 1,867,259
Excises ........................................................................................ 236,263 228,962
Payments in lieu of taxes ............................................................ 90,215 79,232
Fines ........................................................................................... 60,953 60,116
Investment income ..................................................................... 184 61
Licenses and permits .................................................................. 70,005 71,205
Departmental and other ............................................................ 86,791 86,392
Intergovernmental ..................................................................... 543,683 523,256
Total Revenues ................................................................. 3,055,781 2,916,483
EXPENDITURES:
Current:
General government .............................................................. 80,684 58,242
Human services ..................................................................... 31,356 31,507
Public safety .......................................................................... 610,233 633,471
Public works .......................................................................... 101,157 123,767
Property and development .................................................... 33,870 35,594
Parks and recreation .............................................................. 22,106 20,063
Library ................................................................................... 33,870 33,966
Schools .................................................................................. 1,016,412 960,228
Public health programs .......................................................... 77,932 73,577
Judgments and claims ........................................................... 1,100 3,678
Retirement costs .................................................................... 309,083 282,648
Other employee benefits ....................................................... 236,661 230,089
State and district assessments ............................................... 234,450 215,538
Total current expenditures................................................ 2,788,914 2,702,368
Capital outlays ............................................................................ 13,873 348
Debt service ............................................................................... 164,708 153,448
Total Expenditures............................................................ 2,967,495 2,856,164
Excess of revenues over expenditures ............................. 88,286 60,319
OTHER FINANCING USES:
Transfers in ................................................................................. — 19,000
Transfers out............................................................................... (1,455) (1,455)
Total other financing uses ................................................ (1,455) 17,545
Net change in fund balances ............................................ 86,831 77,864
Fund balance - beginning ............................................................... 862,172 784,308
Fund balance - ending .................................................................... $ 949,003 $ 862,172
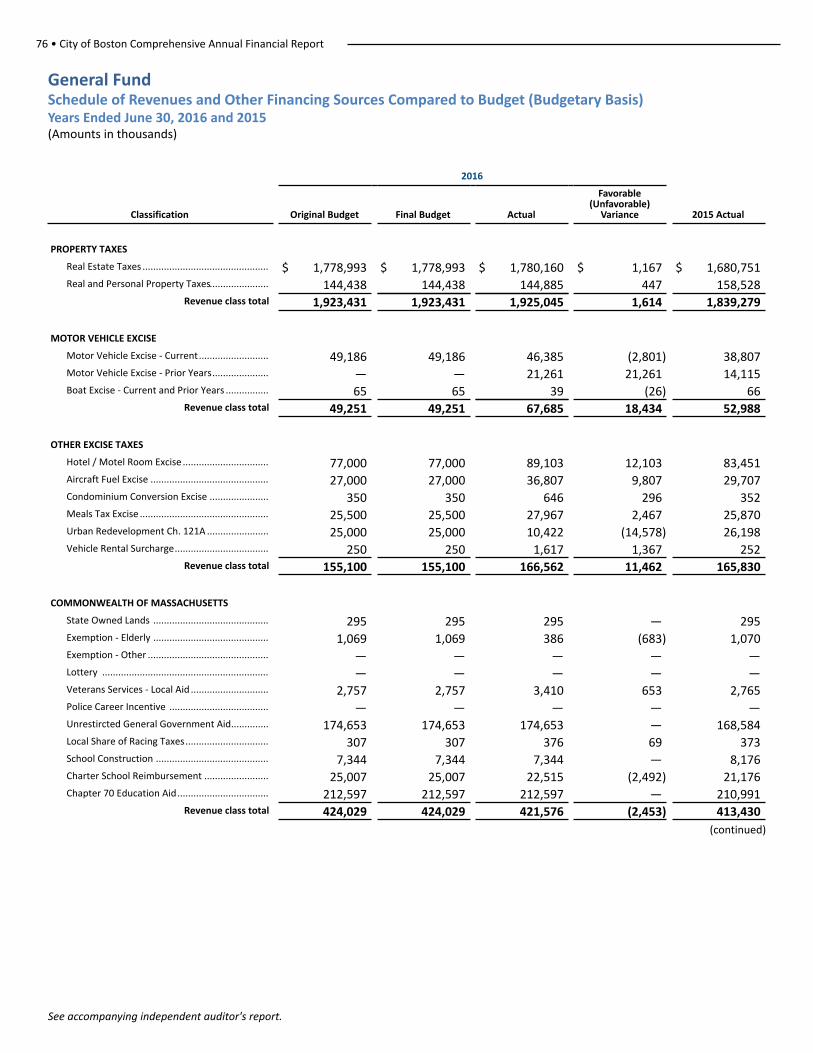
76 • City of Boston Comprehensive Annual Financial Report
See accompanying independent auditor's report.
General Fund Schedule of Revenues and Other Financing Sources Compared to Budget (Budgetary Basis)Years Ended June 30, 2016 and 2015 (Amounts in thousands)
2016
Classification Original Budget Final Budget Actual
Favorable (Unfavorable)
Variance 2015 Actual
PROPERTY TAXES
Real Estate Taxes ............................................... $ 1,778,993 $ 1,778,993 $ 1,780,160 $ 1,167 $ 1,680,751Real and Personal Property Taxes...................... 144,438 144,438 144,885 447 158,528
Revenue class total 1,923,431 1,923,431 1,925,045 1,614 1,839,279
MOTOR VEHICLE EXCISE
Motor Vehicle Excise - Current.......................... 49,186 49,186 46,385 (2,801) 38,807Motor Vehicle Excise - Prior Years..................... — — 21,261 21,261 14,115Boat Excise - Current and Prior Years ................ 65 65 39 (26) 66
Revenue class total 49,251 49,251 67,685 18,434 52,988
OTHER EXCISE TAXES
Hotel / Motel Room Excise ................................ 77,000 77,000 89,103 12,103 83,451Aircraft Fuel Excise ............................................ 27,000 27,000 36,807 9,807 29,707Condominium Conversion Excise ...................... 350 350 646 296 352Meals Tax Excise ................................................ 25,500 25,500 27,967 2,467 25,870Urban Redevelopment Ch. 121A ....................... 25,000 25,000 10,422 (14,578) 26,198Vehicle Rental Surcharge................................... 250 250 1,617 1,367 252
Revenue class total 155,100 155,100 166,562 11,462 165,830
COMMONWEALTH OF MASSACHUSETTS
State Owned Lands ........................................... 295 295 295 — 295Exemption - Elderly ........................................... 1,069 1,069 386 (683) 1,070Exemption - Other ............................................. — — — — —Lottery .............................................................. — — — — —Veterans Services - Local Aid ............................. 2,757 2,757 3,410 653 2,765Police Career Incentive ..................................... — — — — —Unrestircted General Government Aid.............. 174,653 174,653 174,653 — 168,584Local Share of Racing Taxes............................... 307 307 376 69 373School Construction .......................................... 7,344 7,344 7,344 — 8,176Charter School Reimbursement ........................ 25,007 25,007 22,515 (2,492) 21,176Chapter 70 Education Aid.................................. 212,597 212,597 212,597 — 210,991
Revenue class total 424,029 424,029 421,576 (2,453) 413,430
(continued)
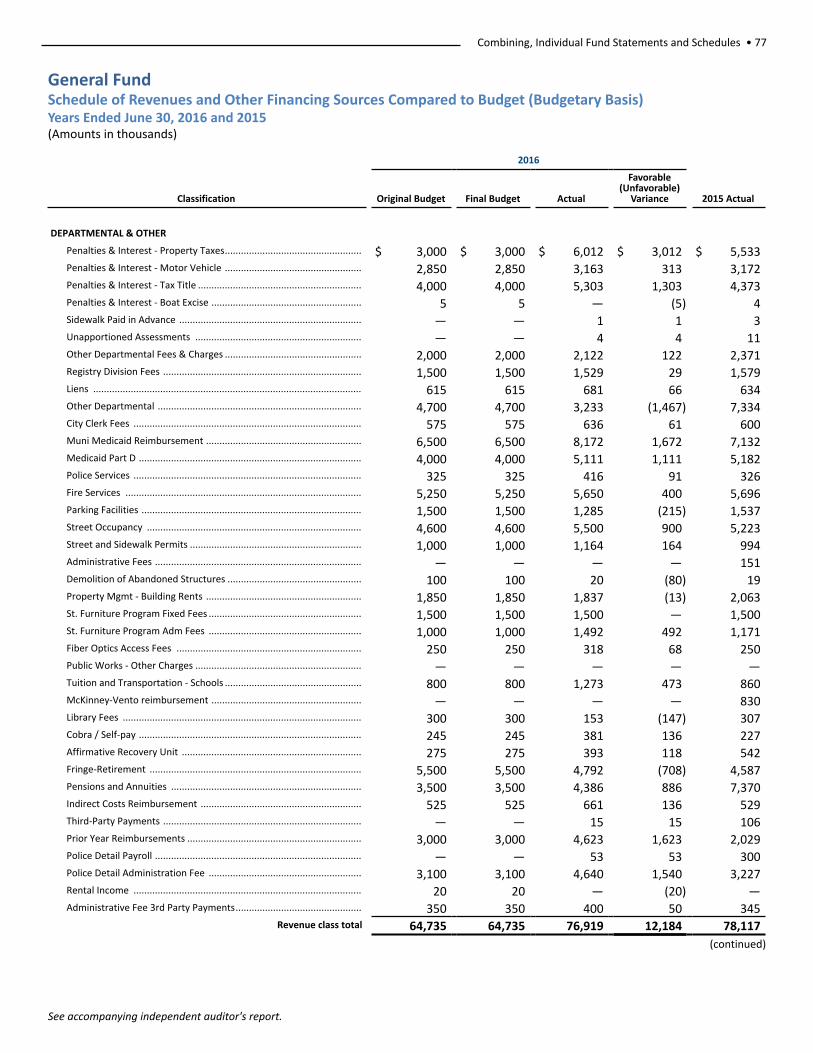
Combining, Individual Fund Statements and Schedules • 77
See accompanying independent auditor's report.
General Fund Schedule of Revenues and Other Financing Sources Compared to Budget (Budgetary Basis)Years Ended June 30, 2016 and 2015 (Amounts in thousands)
2016
Classification Original Budget Final Budget Actual
Favorable (Unfavorable)
Variance 2015 Actual
DEPARTMENTAL & OTHER
Penalties & Interest - Property Taxes................................................... $ 3,000 $ 3,000 $ 6,012 $ 3,012 $ 5,533Penalties & Interest - Motor Vehicle ................................................... 2,850 2,850 3,163 313 3,172Penalties & Interest - Tax Title ............................................................. 4,000 4,000 5,303 1,303 4,373Penalties & Interest - Boat Excise ........................................................ 5 5 — (5) 4Sidewalk Paid in Advance .................................................................... — — 1 1 3Unapportioned Assessments .............................................................. — — 4 4 11Other Departmental Fees & Charges ................................................... 2,000 2,000 2,122 122 2,371Registry Division Fees .......................................................................... 1,500 1,500 1,529 29 1,579Liens .................................................................................................... 615 615 681 66 634Other Departmental ............................................................................ 4,700 4,700 3,233 (1,467) 7,334City Clerk Fees ..................................................................................... 575 575 636 61 600Muni Medicaid Reimbursement .......................................................... 6,500 6,500 8,172 1,672 7,132Medicaid Part D ................................................................................... 4,000 4,000 5,111 1,111 5,182Police Services ..................................................................................... 325 325 416 91 326Fire Services ........................................................................................ 5,250 5,250 5,650 400 5,696Parking Facilities .................................................................................. 1,500 1,500 1,285 (215) 1,537Street Occupancy ................................................................................ 4,600 4,600 5,500 900 5,223Street and Sidewalk Permits ................................................................ 1,000 1,000 1,164 164 994Administrative Fees ............................................................................. — — — — 151Demolition of Abandoned Structures .................................................. 100 100 20 (80) 19Property Mgmt - Building Rents .......................................................... 1,850 1,850 1,837 (13) 2,063St. Furniture Program Fixed Fees ......................................................... 1,500 1,500 1,500 — 1,500St. Furniture Program Adm Fees ......................................................... 1,000 1,000 1,492 492 1,171Fiber Optics Access Fees ..................................................................... 250 250 318 68 250Public Works - Other Charges .............................................................. — — — — —Tuition and Transportation - Schools ................................................... 800 800 1,273 473 860McKinney-Vento reimbursement ........................................................ — — — — 830Library Fees ......................................................................................... 300 300 153 (147) 307Cobra / Self-pay ................................................................................... 245 245 381 136 227Affirmative Recovery Unit ................................................................... 275 275 393 118 542Fringe-Retirement ............................................................................... 5,500 5,500 4,792 (708) 4,587Pensions and Annuities ....................................................................... 3,500 3,500 4,386 886 7,370Indirect Costs Reimbursement ............................................................ 525 525 661 136 529Third-Party Payments .......................................................................... — — 15 15 106Prior Year Reimbursements ................................................................. 3,000 3,000 4,623 1,623 2,029Police Detail Payroll ............................................................................. — — 53 53 300Police Detail Administration Fee ......................................................... 3,100 3,100 4,640 1,540 3,227Rental Income ..................................................................................... 20 20 — (20) —Administrative Fee 3rd Party Payments............................................... 350 350 400 50 345
Revenue class total 64,735 64,735 76,919 12,184 78,117
(continued)
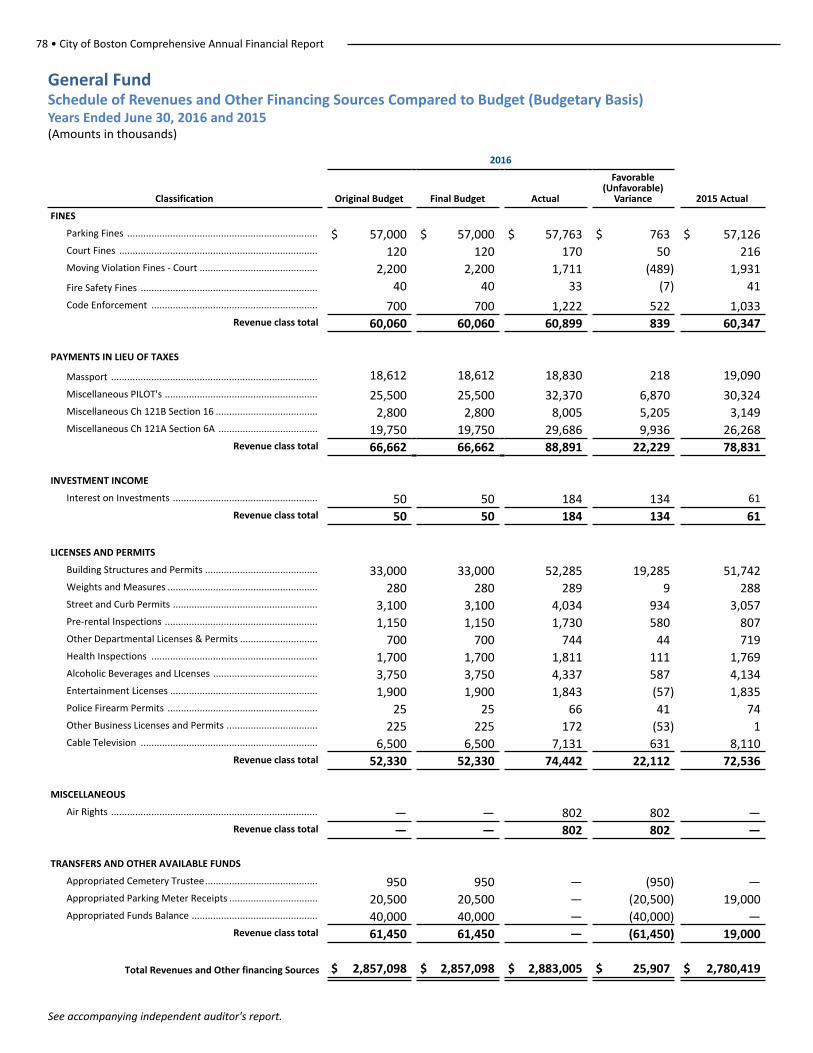
78 • City of Boston Comprehensive Annual Financial Report
See accompanying independent auditor's report.
General Fund Schedule of Revenues and Other Financing Sources Compared to Budget (Budgetary Basis)Years Ended June 30, 2016 and 2015 (Amounts in thousands)
2016
Classification Original Budget Final Budget Actual
Favorable (Unfavorable)
Variance 2015 Actual
FINES
Parking Fines ....................................................................... $ 57,000 $ 57,000 $ 57,763 $ 763 $ 57,126Court Fines .......................................................................... 120 120 170 50 216Moving Violation Fines - Court ............................................ 2,200 2,200 1,711 (489) 1,931
Fire Safety Fines .................................................................. 40 40 33 (7) 41
Code Enforcement .............................................................. 700 700 1,222 522 1,033Revenue class total 60,060 60,060 60,899 839 60,347
PAYMENTS IN LIEU OF TAXES
Massport ............................................................................. 18,612 18,612 18,830 218 19,090
Miscellaneous PILOT's ......................................................... 25,500 25,500 32,370 6,870 30,324Miscellaneous Ch 121B Section 16 ...................................... 2,800 2,800 8,005 5,205 3,149Miscellaneous Ch 121A Section 6A ..................................... 19,750 19,750 29,686 9,936 26,268
Revenue class total 66,662 66,662 88,891 22,229 78,831
INVESTMENT INCOME
Interest on Investments ...................................................... 50 50 184 134 61
Revenue class total 50 50 184 134 61
LICENSES AND PERMITS
Building Structures and Permits .......................................... 33,000 33,000 52,285 19,285 51,742Weights and Measures ........................................................ 280 280 289 9 288Street and Curb Permits ...................................................... 3,100 3,100 4,034 934 3,057Pre-rental Inspections ......................................................... 1,150 1,150 1,730 580 807Other Departmental Licenses & Permits ............................. 700 700 744 44 719Health Inspections .............................................................. 1,700 1,700 1,811 111 1,769Alcoholic Beverages and LIcenses ....................................... 3,750 3,750 4,337 587 4,134Entertainment Licenses ....................................................... 1,900 1,900 1,843 (57) 1,835Police Firearm Permits ........................................................ 25 25 66 41 74Other Business Licenses and Permits .................................. 225 225 172 (53) 1Cable Television .................................................................. 6,500 6,500 7,131 631 8,110
Revenue class total 52,330 52,330 74,442 22,112 72,536
MISCELLANEOUS
Air Rights ............................................................................. — — 802 802 —Revenue class total — — 802 802 —
TRANSFERS AND OTHER AVAILABLE FUNDS
Appropriated Cemetery Trustee.......................................... 950 950 — (950) —Appropriated Parking Meter Receipts ................................. 20,500 20,500 — (20,500) 19,000Appropriated Funds Balance ............................................... 40,000 40,000 — (40,000) —
Revenue class total 61,450 61,450 — (61,450) 19,000
Total Revenues and Other financing Sources $ 2,857,098 $ 2,857,098 $ 2,883,005 $ 25,907 $ 2,780,419
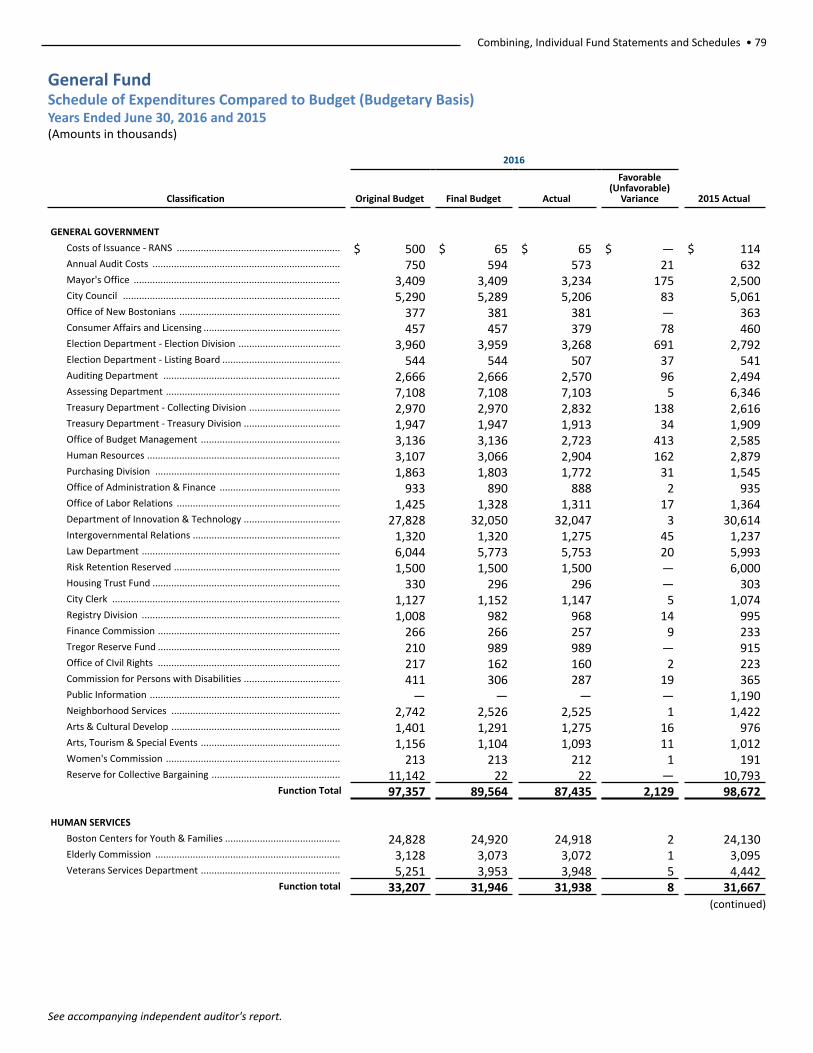
Combining, Individual Fund Statements and Schedules • 79
See accompanying independent auditor's report.
General Fund Schedule of Expenditures Compared to Budget (Budgetary Basis)Years Ended June 30, 2016 and 2015 (Amounts in thousands)
2016
Classification Original Budget Final Budget Actual
Favorable (Unfavorable)
Variance 2015 Actual
GENERAL GOVERNMENT
Costs of Issuance - RANS ............................................................. $ 500 $ 65 $ 65 $ — $ 114Annual Audit Costs ...................................................................... 750 594 573 21 632Mayor's Office ............................................................................. 3,409 3,409 3,234 175 2,500City Council ................................................................................. 5,290 5,289 5,206 83 5,061Office of New Bostonians ............................................................ 377 381 381 — 363Consumer Affairs and Licensing ................................................... 457 457 379 78 460Election Department - Election Division ...................................... 3,960 3,959 3,268 691 2,792Election Department - Listing Board ............................................ 544 544 507 37 541Auditing Department .................................................................. 2,666 2,666 2,570 96 2,494Assessing Department ................................................................. 7,108 7,108 7,103 5 6,346Treasury Department - Collecting Division .................................. 2,970 2,970 2,832 138 2,616Treasury Department - Treasury Division .................................... 1,947 1,947 1,913 34 1,909Office of Budget Management .................................................... 3,136 3,136 2,723 413 2,585Human Resources ........................................................................ 3,107 3,066 2,904 162 2,879Purchasing Division ..................................................................... 1,863 1,803 1,772 31 1,545Office of Administration & Finance ............................................. 933 890 888 2 935Office of Labor Relations ............................................................. 1,425 1,328 1,311 17 1,364Department of Innovation & Technology .................................... 27,828 32,050 32,047 3 30,614Intergovernmental Relations ....................................................... 1,320 1,320 1,275 45 1,237Law Department .......................................................................... 6,044 5,773 5,753 20 5,993Risk Retention Reserved .............................................................. 1,500 1,500 1,500 — 6,000Housing Trust Fund ...................................................................... 330 296 296 — 303City Clerk ..................................................................................... 1,127 1,152 1,147 5 1,074Registry Division .......................................................................... 1,008 982 968 14 995Finance Commission .................................................................... 266 266 257 9 233Tregor Reserve Fund .................................................................... 210 989 989 — 915Office of CIvil Rights .................................................................... 217 162 160 2 223Commission for Persons with Disabilities .................................... 411 306 287 19 365Public Information ....................................................................... — — — — 1,190Neighborhood Services ............................................................... 2,742 2,526 2,525 1 1,422Arts & Cultural Develop ............................................................... 1,401 1,291 1,275 16 976Arts, Tourism & Special Events .................................................... 1,156 1,104 1,093 11 1,012Women's Commission ................................................................. 213 213 212 1 191Reserve for Collective Bargaining ................................................ 11,142 22 22 — 10,793
Function Total 97,357 89,564 87,435 2,129 98,672
HUMAN SERVICES
Boston Centers for Youth & Families ........................................... 24,828 24,920 24,918 2 24,130Elderly Commission ..................................................................... 3,128 3,073 3,072 1 3,095Veterans Services Department .................................................... 5,251 3,953 3,948 5 4,442
Function total 33,207 31,946 31,938 8 31,667(continued)
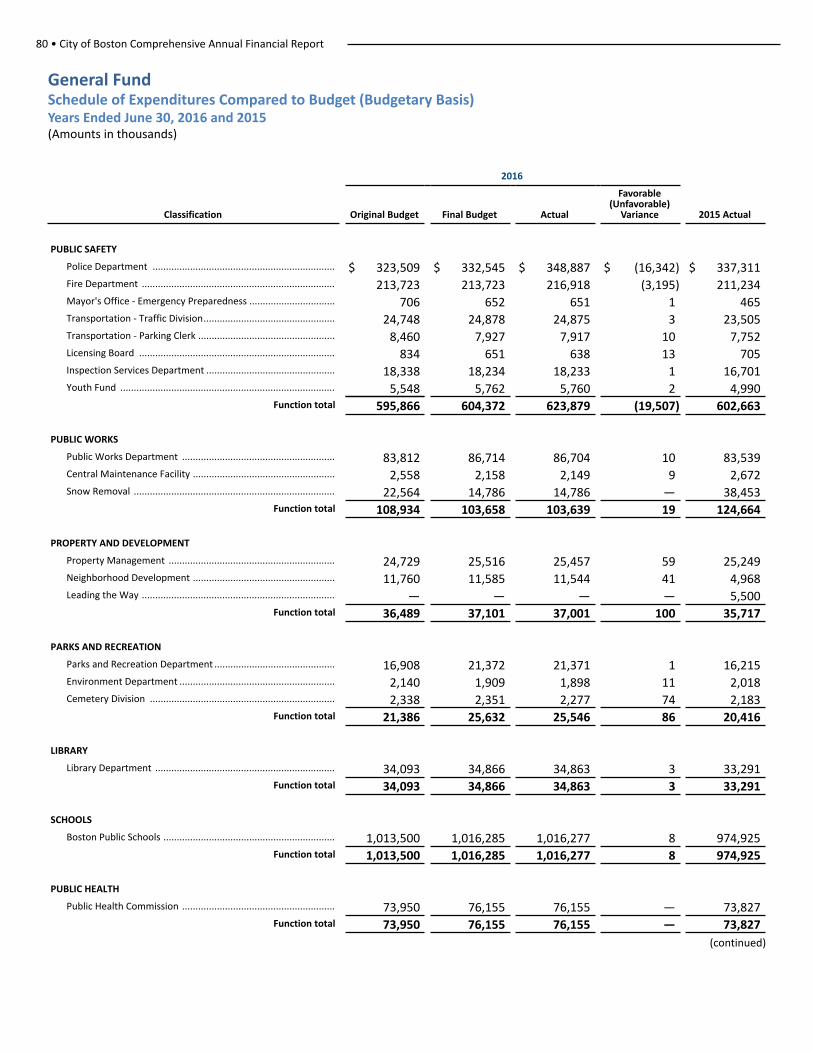
80 • City of Boston Comprehensive Annual Financial Report
General Fund Schedule of Expenditures Compared to Budget (Budgetary Basis)Years Ended June 30, 2016 and 2015 (Amounts in thousands)
2016
Classification Original Budget Final Budget Actual
Favorable (Unfavorable)
Variance 2015 Actual
PUBLIC SAFETY
Police Department .................................................................... $ 323,509 $ 332,545 $ 348,887 $ (16,342) $ 337,311Fire Department ........................................................................ 213,723 213,723 216,918 (3,195) 211,234Mayor's Office - Emergency Preparedness ................................ 706 652 651 1 465Transportation - Traffic Division................................................. 24,748 24,878 24,875 3 23,505Transportation - Parking Clerk ................................................... 8,460 7,927 7,917 10 7,752Licensing Board ......................................................................... 834 651 638 13 705Inspection Services Department ................................................ 18,338 18,234 18,233 1 16,701Youth Fund ................................................................................ 5,548 5,762 5,760 2 4,990
Function total 595,866 604,372 623,879 (19,507) 602,663
PUBLIC WORKS
Public Works Department ......................................................... 83,812 86,714 86,704 10 83,539Central Maintenance Facility ..................................................... 2,558 2,158 2,149 9 2,672Snow Removal ........................................................................... 22,564 14,786 14,786 — 38,453
Function total 108,934 103,658 103,639 19 124,664
PROPERTY AND DEVELOPMENT
Property Management .............................................................. 24,729 25,516 25,457 59 25,249Neighborhood Development ..................................................... 11,760 11,585 11,544 41 4,968Leading the Way ........................................................................ — — — — 5,500
Function total 36,489 37,101 37,001 100 35,717
PARKS AND RECREATION
Parks and Recreation Department ............................................. 16,908 21,372 21,371 1 16,215Environment Department .......................................................... 2,140 1,909 1,898 11 2,018Cemetery Division ..................................................................... 2,338 2,351 2,277 74 2,183
Function total 21,386 25,632 25,546 86 20,416
LIBRARY
Library Department ................................................................... 34,093 34,866 34,863 3 33,291Function total 34,093 34,866 34,863 3 33,291
SCHOOLS
Boston Public Schools ................................................................ 1,013,500 1,016,285 1,016,277 8 974,925Function total 1,013,500 1,016,285 1,016,277 8 974,925
PUBLIC HEALTH
Public Health Commission ......................................................... 73,950 76,155 76,155 — 73,827Function total 73,950 76,155 76,155 — 73,827
(continued)
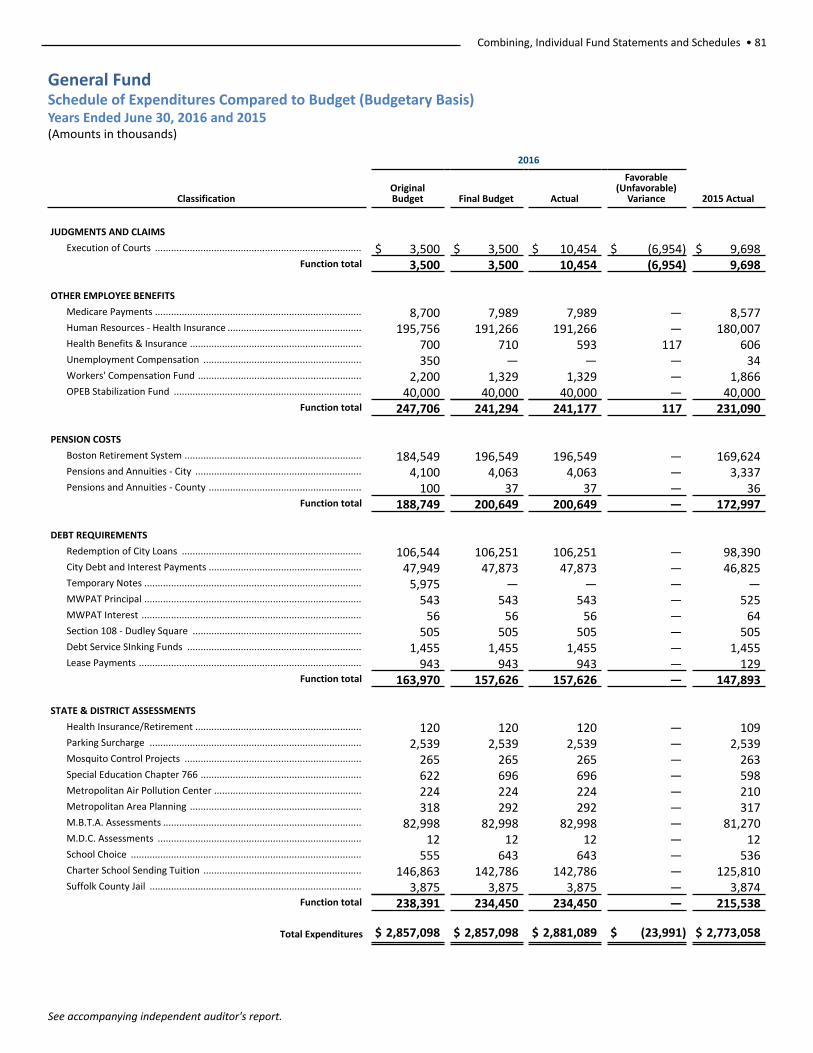
Combining, Individual Fund Statements and Schedules • 81
See accompanying independent auditor's report.
General Fund Schedule of Expenditures Compared to Budget (Budgetary Basis)Years Ended June 30, 2016 and 2015 (Amounts in thousands)
2016
ClassificationOriginalBudget Final Budget Actual
Favorable (Unfavorable)
Variance 2015 Actual
JUDGMENTS AND CLAIMS
Execution of Courts ............................................................................. $ 3,500 $ 3,500 $ 10,454 $ (6,954) $ 9,698Function total 3,500 3,500 10,454 (6,954) 9,698
OTHER EMPLOYEE BENEFITS
Medicare Payments ............................................................................. 8,700 7,989 7,989 — 8,577Human Resources - Health Insurance .................................................. 195,756 191,266 191,266 — 180,007Health Benefits & Insurance ................................................................ 700 710 593 117 606Unemployment Compensation ........................................................... 350 — — — 34Workers' Compensation Fund ............................................................. 2,200 1,329 1,329 — 1,866OPEB Stabilization Fund ...................................................................... 40,000 40,000 40,000 — 40,000
Function total 247,706 241,294 241,177 117 231,090
PENSION COSTS
Boston Retirement System .................................................................. 184,549 196,549 196,549 — 169,624Pensions and Annuities - City .............................................................. 4,100 4,063 4,063 — 3,337Pensions and Annuities - County ......................................................... 100 37 37 — 36
Function total 188,749 200,649 200,649 — 172,997
DEBT REQUIREMENTS
Redemption of City Loans ................................................................... 106,544 106,251 106,251 — 98,390City Debt and Interest Payments ......................................................... 47,949 47,873 47,873 — 46,825Temporary Notes ................................................................................. 5,975 — — — —MWPAT Principal ................................................................................. 543 543 543 — 525MWPAT Interest .................................................................................. 56 56 56 — 64Section 108 - Dudley Square ............................................................... 505 505 505 — 505Debt Service SInking Funds ................................................................. 1,455 1,455 1,455 — 1,455Lease Payments ................................................................................... 943 943 943 — 129
Function total 163,970 157,626 157,626 — 147,893
STATE & DISTRICT ASSESSMENTS
Health Insurance/Retirement .............................................................. 120 120 120 — 109Parking Surcharge ............................................................................... 2,539 2,539 2,539 — 2,539Mosquito Control Projects .................................................................. 265 265 265 — 263Special Education Chapter 766 ............................................................ 622 696 696 — 598Metropolitan Air Pollution Center ....................................................... 224 224 224 — 210Metropolitan Area Planning ................................................................ 318 292 292 — 317M.B.T.A. Assessments .......................................................................... 82,998 82,998 82,998 — 81,270M.D.C. Assessments ............................................................................ 12 12 12 — 12School Choice ...................................................................................... 555 643 643 — 536Charter School Sending Tuition ........................................................... 146,863 142,786 142,786 — 125,810Suffolk County Jail ............................................................................... 3,875 3,875 3,875 — 3,874
Function total 238,391 234,450 234,450 — 215,538
Total Expenditures $ 2,857,098 $ 2,857,098 $ 2,881,089 $ (23,991) $ 2,773,058
82 • City of Boston Comprehensive Annual Financial Report
Special Revenue Fund
Commonwealth Avenue
The Special Revenue Fund is used to account for the proceeds of specific revenue sources, other than debt service, trust funds or capital projects that are legally restricted or committed for specific purposes.
This fund accounts for a number of federal and state grants administered by the City’s individual departments.

Combining, Individual Fund Statements and Schedules • 83
(This page intentionally left blank)
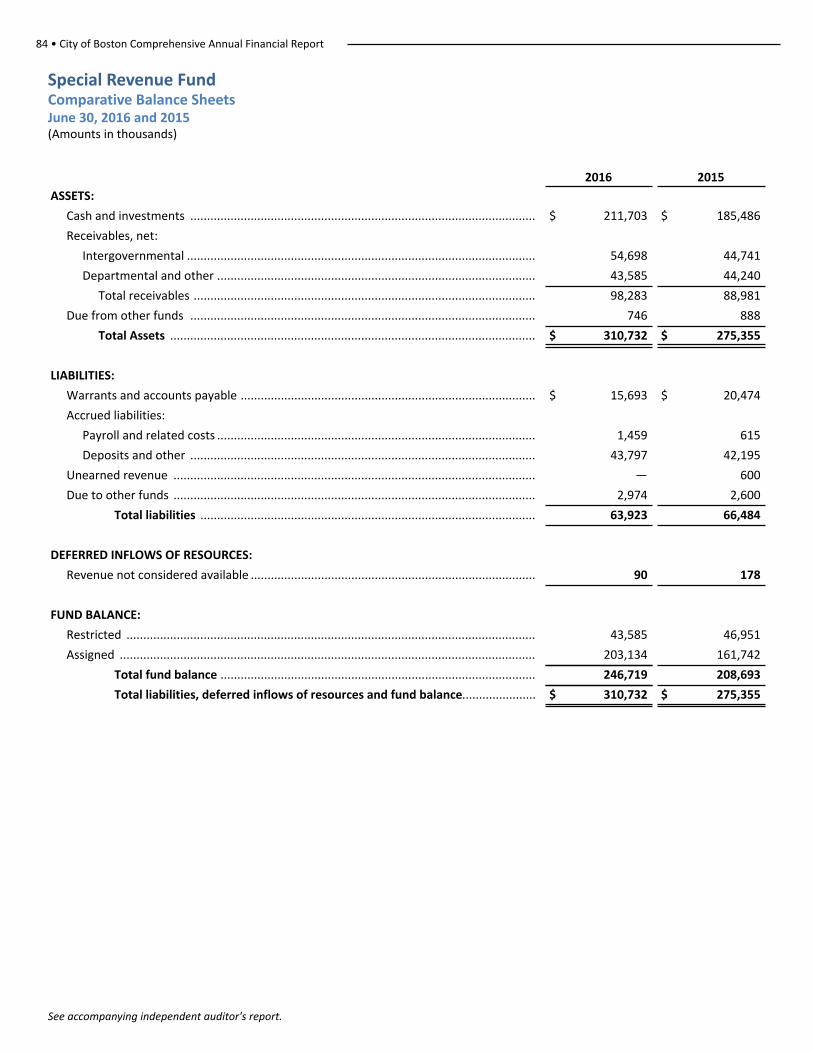
84 • City of Boston Comprehensive Annual Financial Report
See accompanying independent auditor's report.
Special Revenue Fund Comparative Balance SheetsJune 30, 2016 and 2015 (Amounts in thousands)
2016 2015
ASSETS:
Cash and investments ....................................................................................................... $ 211,703 $ 185,486
Receivables, net:
Intergovernmental ........................................................................................................ 54,698 44,741
Departmental and other ............................................................................................... 43,585 44,240
Total receivables ...................................................................................................... 98,283 88,981
Due from other funds ....................................................................................................... 746 888
Total Assets ............................................................................................................. $ 310,732 $ 275,355
LIABILITIES:
Warrants and accounts payable ........................................................................................ $ 15,693 $ 20,474
Accrued liabilities:
Payroll and related costs ............................................................................................... 1,459 615
Deposits and other ....................................................................................................... 43,797 42,195
Unearned revenue ............................................................................................................ — 600
Due to other funds ............................................................................................................ 2,974 2,600
Total liabilities .................................................................................................... 63,923 66,484
DEFERRED INFLOWS OF RESOURCES:
Revenue not considered available ..................................................................................... 90 178
FUND BALANCE:
Restricted .......................................................................................................................... 43,585 46,951
Assigned ............................................................................................................................ 203,134 161,742
Total fund balance .............................................................................................. 246,719 208,693
Total liabilities, deferred inflows of resources and fund balance...................... $ 310,732 $ 275,355
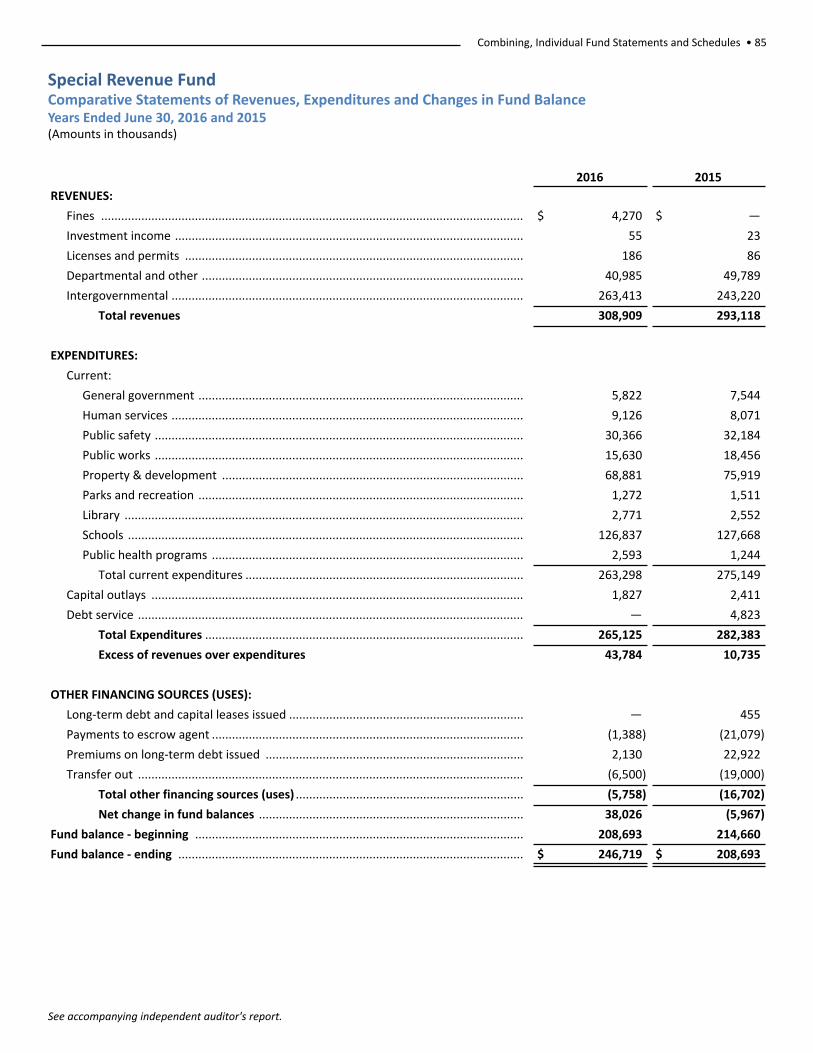
Combining, Individual Fund Statements and Schedules • 85
See accompanying independent auditor's report.
Special Revenue Fund Comparative Statements of Revenues, Expenditures and Changes in Fund BalanceYears Ended June 30, 2016 and 2015 (Amounts in thousands)
2016 2015
REVENUES:
Fines .............................................................................................................................. $ 4,270 $ —
Investment income ........................................................................................................ 55 23
Licenses and permits ..................................................................................................... 186 86
Departmental and other ................................................................................................ 40,985 49,789
Intergovernmental ......................................................................................................... 263,413 243,220
Total revenues 308,909 293,118
EXPENDITURES:
Current:
General government ................................................................................................. 5,822 7,544
Human services ......................................................................................................... 9,126 8,071
Public safety .............................................................................................................. 30,366 32,184
Public works .............................................................................................................. 15,630 18,456
Property & development .......................................................................................... 68,881 75,919
Parks and recreation ................................................................................................. 1,272 1,511
Library ....................................................................................................................... 2,771 2,552
Schools ...................................................................................................................... 126,837 127,668
Public health programs ............................................................................................. 2,593 1,244
Total current expenditures ................................................................................... 263,298 275,149
Capital outlays ............................................................................................................... 1,827 2,411
Debt service ................................................................................................................... — 4,823
Total Expenditures ............................................................................................... 265,125 282,383
Excess of revenues over expenditures 43,784 10,735
OTHER FINANCING SOURCES (USES):
Long-term debt and capital leases issued ...................................................................... — 455
Payments to escrow agent ............................................................................................. (1,388) (21,079)
Premiums on long-term debt issued ............................................................................. 2,130 22,922
Transfer out ................................................................................................................... (6,500) (19,000)
Total other financing sources (uses) .................................................................... (5,758) (16,702)
Net change in fund balances ............................................................................... 38,026 (5,967)
Fund balance - beginning .................................................................................................. 208,693 214,660
Fund balance - ending ....................................................................................................... $ 246,719 $ 208,693
86 • City of Boston Comprehensive Annual Financial Report
Capital Projects Fund
Boston skyline from Boston Harbor
The Capital Projects Fund is used to account for financial resources to be used for the acquisition or
construction of major capital facilities. Such resources are derived principally from proceeds of general
obligation bonds and from federal and state grants.

Combining, Individual Fund Statements and Schedules • 87
(This page intentionally left blank)
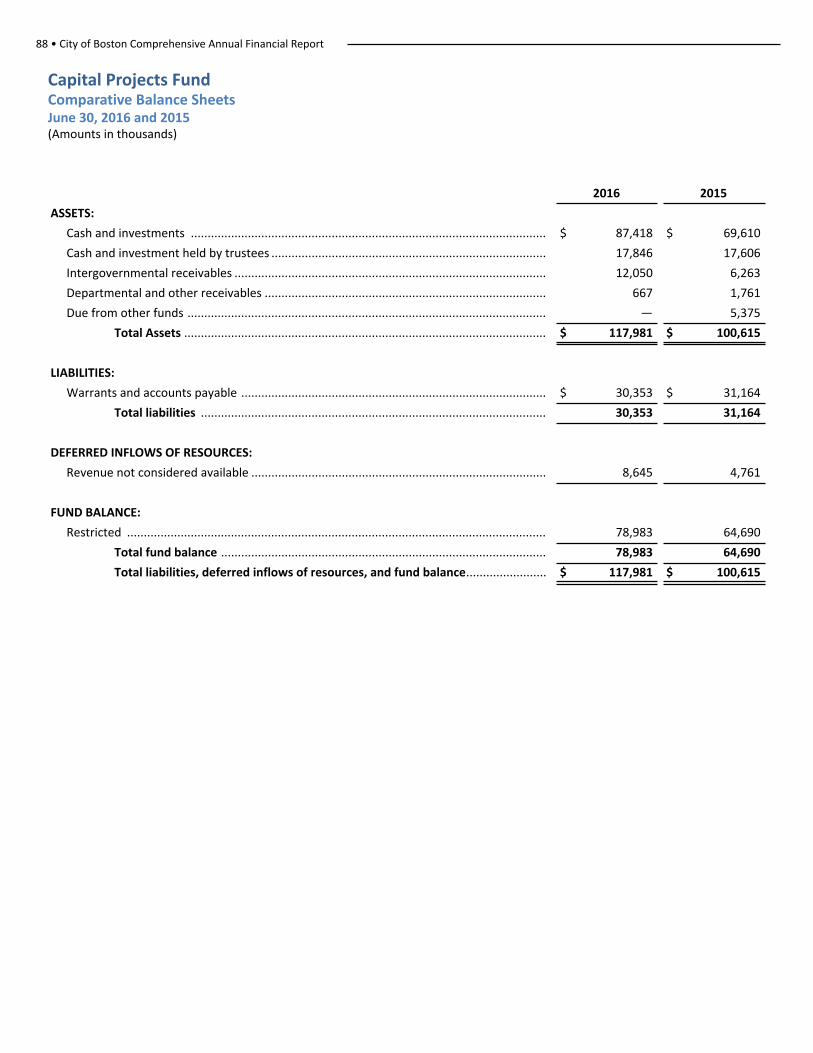
88 • City of Boston Comprehensive Annual Financial Report
Capital Projects Fund Comparative Balance SheetsJune 30, 2016 and 2015 (Amounts in thousands)
2016 2015
ASSETS:
Cash and investments .......................................................................................................... $ 87,418 $ 69,610
Cash and investment held by trustees .................................................................................. 17,846 17,606
Intergovernmental receivables ............................................................................................. 12,050 6,263
Departmental and other receivables .................................................................................... 667 1,761
Due from other funds ........................................................................................................... — 5,375
Total Assets ............................................................................................................ $ 117,981 $ 100,615
LIABILITIES:
Warrants and accounts payable ........................................................................................... $ 30,353 $ 31,164
Total liabilities ....................................................................................................... 30,353 31,164
DEFERRED INFLOWS OF RESOURCES:
Revenue not considered available ........................................................................................ 8,645 4,761
FUND BALANCE:
Restricted ............................................................................................................................. 78,983 64,690
Total fund balance ................................................................................................. 78,983 64,690
Total liabilities, deferred inflows of resources, and fund balance........................ $ 117,981 $ 100,615
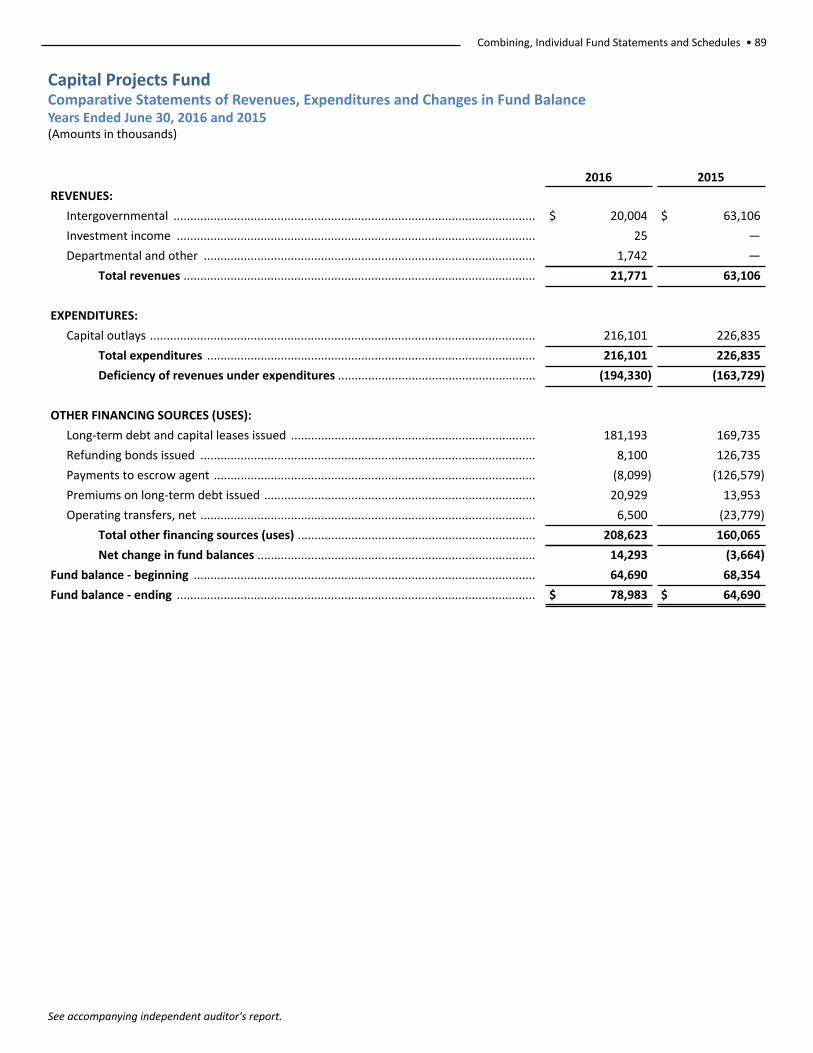
Combining, Individual Fund Statements and Schedules • 89
See accompanying independent auditor's report.
Capital Projects Fund Comparative Statements of Revenues, Expenditures and Changes in Fund BalanceYears Ended June 30, 2016 and 2015 (Amounts in thousands)
2016 2015
REVENUES:
Intergovernmental ............................................................................................................ $ 20,004 $ 63,106
Investment income ........................................................................................................... 25 —
Departmental and other ................................................................................................... 1,742 —
Total revenues ......................................................................................................... 21,771 63,106
EXPENDITURES:
Capital outlays ................................................................................................................... 216,101 226,835
Total expenditures .................................................................................................. 216,101 226,835
Deficiency of revenues under expenditures ........................................................... (194,330) (163,729)
OTHER FINANCING SOURCES (USES):
Long-term debt and capital leases issued ......................................................................... 181,193 169,735
Refunding bonds issued .................................................................................................... 8,100 126,735
Payments to escrow agent ................................................................................................ (8,099) (126,579)
Premiums on long-term debt issued ................................................................................. 20,929 13,953
Operating transfers, net .................................................................................................... 6,500 (23,779)
Total other financing sources (uses) ....................................................................... 208,623 160,065
Net change in fund balances ................................................................................... 14,293 (3,664)
Fund balance - beginning ...................................................................................................... 64,690 68,354
Fund balance - ending ........................................................................................................... $ 78,983 $ 64,690
90 • City of Boston Comprehensive Annual Financial Report
Other Governmental Funds
Prudential Center
Other Governmental Funds are those funds that are not defined as major funds.
Permanent Fund, established by GASB Statement No. 34, is used to report resources that are legally restricted to the extent that only earnings, and not principal, may be used for purposes that support the reporting government’s programs, that is, for the benefit of the government or its citizenry. The permanent fund is composed of the following pools:
Pool#1 is used for the maintenance and improvement of the City’s parks and cemeteries and the erection and maintenance of statues and monuments for the use and enjoyment of City residents.
Pool#2 is used for scholarship awards, the purchase of educational equipment, and the aid of needy students.
Pool#7 is a co-mingled investment fund of various non-testamentary trust funds of the City of Boston. The non-expendable portion of the fund is composed of donations/contributions from either individuals or organizations. Donations/contributions are to be expended in conformity with their respective trust instruments.
Debt Service Fund is used to account for resources accumulating for principal and interest for the 2009 Qualified Construction School Bond.
Dudley Square Realty Corporation (DSRC) and Ferdinand Building Development Corporation (FBDC)– The DSRC and FBDC are non-profit organizations qualified as tax-exempt entities under Section 501(c)(3) of the Internal Revenue Code. Although legally separate, both DSRC and FBDC provide services entirely, or almost entirely, to the City and thus have been reported as blended component units. DSRC and FBDC are used to account for the construction and financing of the Dudley Municipal Center.

Combining, Individual Fund Statements and Schedules • 91
(This page intentionally left blank)
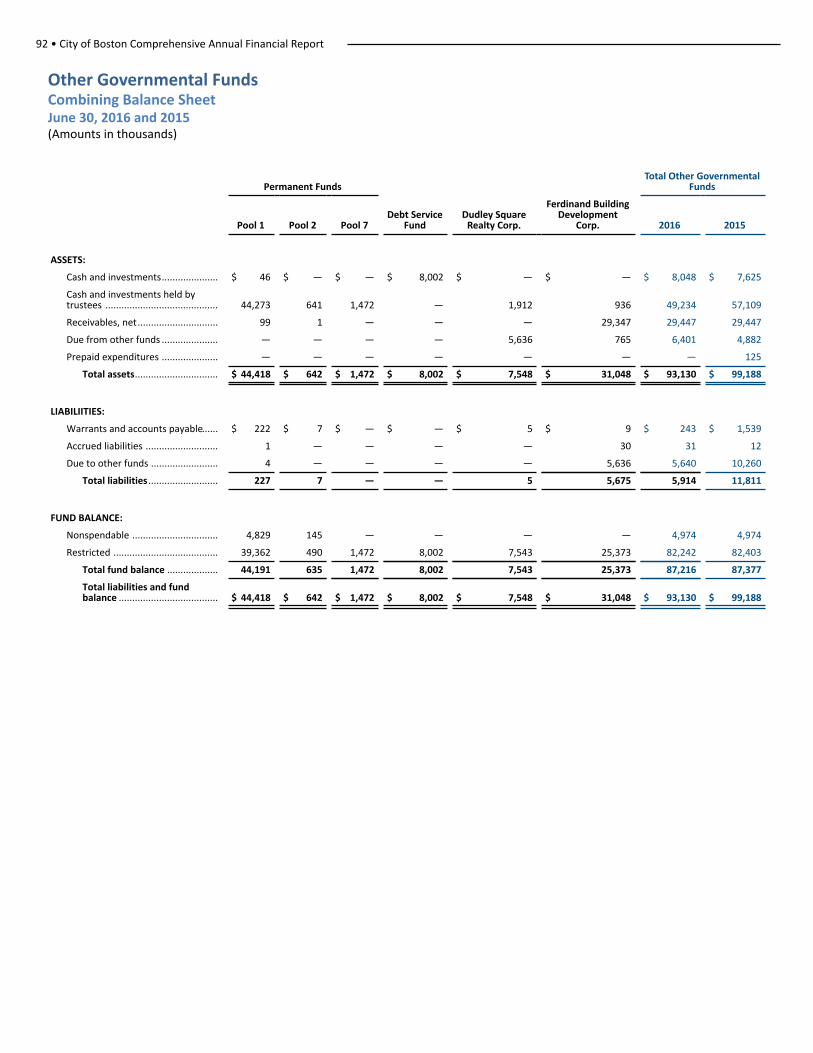
92 • City of Boston Comprehensive Annual Financial Report
Other Governmental Funds Combining Balance SheetJune 30, 2016 and 2015 (Amounts in thousands)
Permanent FundsTotal Other Governmental
Funds
Pool 1 Pool 2 Pool 7Debt Service
FundDudley Square
Realty Corp.
Ferdinand BuildingDevelopment
Corp. 2016 2015
ASSETS:
Cash and investments..................... $ 46 $ — $ — $ 8,002 $ — $ — $ 8,048 $ 7,625
Cash and investments held bytrustees .......................................... 44,273 641 1,472 — 1,912 936 49,234 57,109
Receivables, net.............................. 99 1 — — — 29,347 29,447 29,447
Due from other funds ..................... — — — — 5,636 765 6,401 4,882
Prepaid expenditures ..................... — — — — — — — 125
Total assets............................... $ 44,418 $ 642 $ 1,472 $ 8,002 $ 7,548 $ 31,048 $ 93,130 $ 99,188
LIABILIITIES:
Warrants and accounts payable...... $ 222 $ 7 $ — $ — $ 5 $ 9 $ 243 $ 1,539
Accrued liabilities ........................... 1 — — — — 30 31 12
Due to other funds ......................... 4 — — — — 5,636 5,640 10,260
Total liabilities .......................... 227 7 — — 5 5,675 5,914 11,811
FUND BALANCE:
Nonspendable ................................ 4,829 145 — — — — 4,974 4,974
Restricted ....................................... 39,362 490 1,472 8,002 7,543 25,373 82,242 82,403
Total fund balance ................... 44,191 635 1,472 8,002 7,543 25,373 87,216 87,377
Total liabilities and fundbalance ..................................... $ 44,418 $ 642 $ 1,472 $ 8,002 $ 7,548 $ 31,048 $ 93,130 $ 99,188
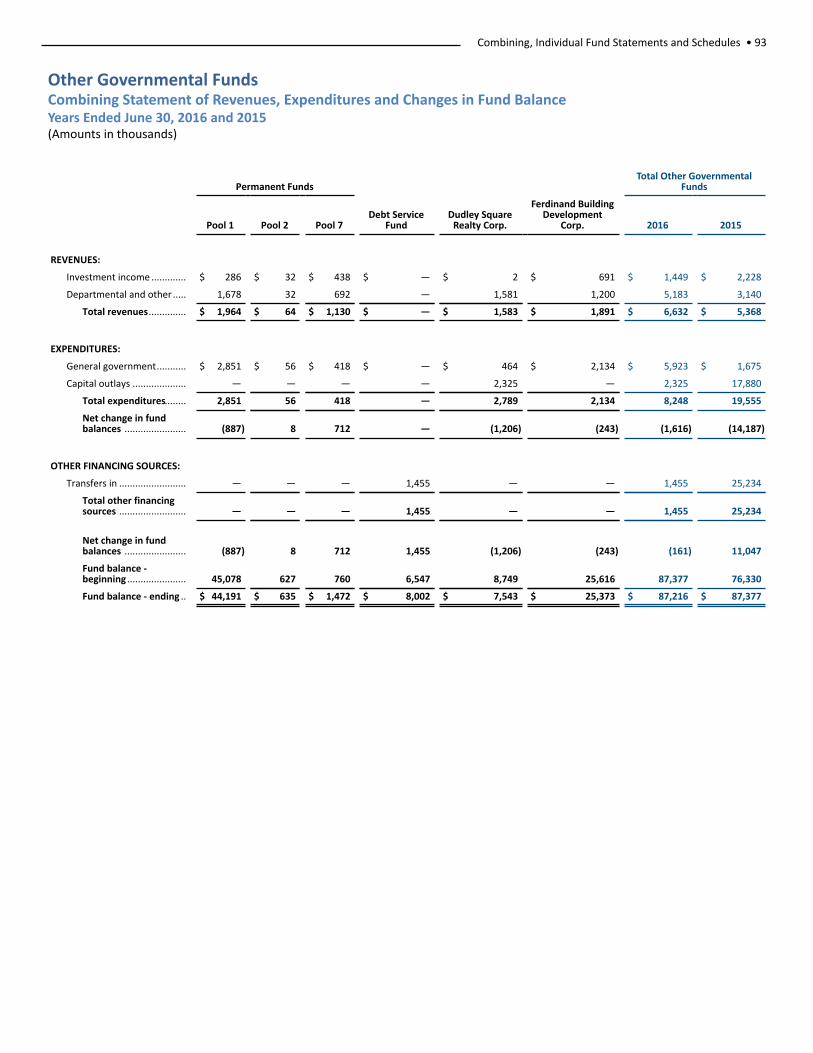
Combining, Individual Fund Statements and Schedules • 93
Other Governmental Funds Combining Statement of Revenues, Expenditures and Changes in Fund BalanceYears Ended June 30, 2016 and 2015 (Amounts in thousands)
Permanent FundsTotal Other Governmental
Funds
Pool 1 Pool 2 Pool 7Debt Service
FundDudley Square
Realty Corp.
Ferdinand BuildingDevelopment
Corp. 2016 2015
REVENUES:
Investment income ............. $ 286 $ 32 $ 438 $ — $ 2 $ 691 $ 1,449 $ 2,228
Departmental and other ..... 1,678 32 692 — 1,581 1,200 5,183 3,140
Total revenues.............. $ 1,964 $ 64 $ 1,130 $ — $ 1,583 $ 1,891 $ 6,632 $ 5,368
EXPENDITURES:
General government........... $ 2,851 $ 56 $ 418 $ — $ 464 $ 2,134 $ 5,923 $ 1,675
Capital outlays .................... — — — — 2,325 — 2,325 17,880
Total expenditures........ 2,851 56 418 — 2,789 2,134 8,248 19,555
Net change in fundbalances ....................... (887) 8 712 — (1,206) (243) (1,616) (14,187)
OTHER FINANCING SOURCES:
Transfers in ......................... — — — 1,455 — — 1,455 25,234
Total other financingsources ......................... — — — 1,455 — — 1,455 25,234
Net change in fundbalances ....................... (887) 8 712 1,455 (1,206) (243) (161) 11,047
Fund balance -beginning ...................... 45,078 627 760 6,547 8,749 25,616 87,377 76,330
Fund balance - ending .. $ 44,191 $ 635 $ 1,472 $ 8,002 $ 7,543 $ 25,373 $ 87,216 $ 87,377
94 • City of Boston Comprehensive Annual Financial Report
Internal Service Fund
Boston Public Library – Copley Square
Internal Service Fund accounts for the City’s self-insurance for health benefits provided by Blue Cross Blue Shield of Massachusetts and Harvard Pilgrim Healthcare for City employees, their dependents and retirees. The Internal Service Fund is included in the governmental activities column in the government-wide financial statements.

Combining, Individual Fund Statements and Schedules • 95
(This page intentionally left blank)
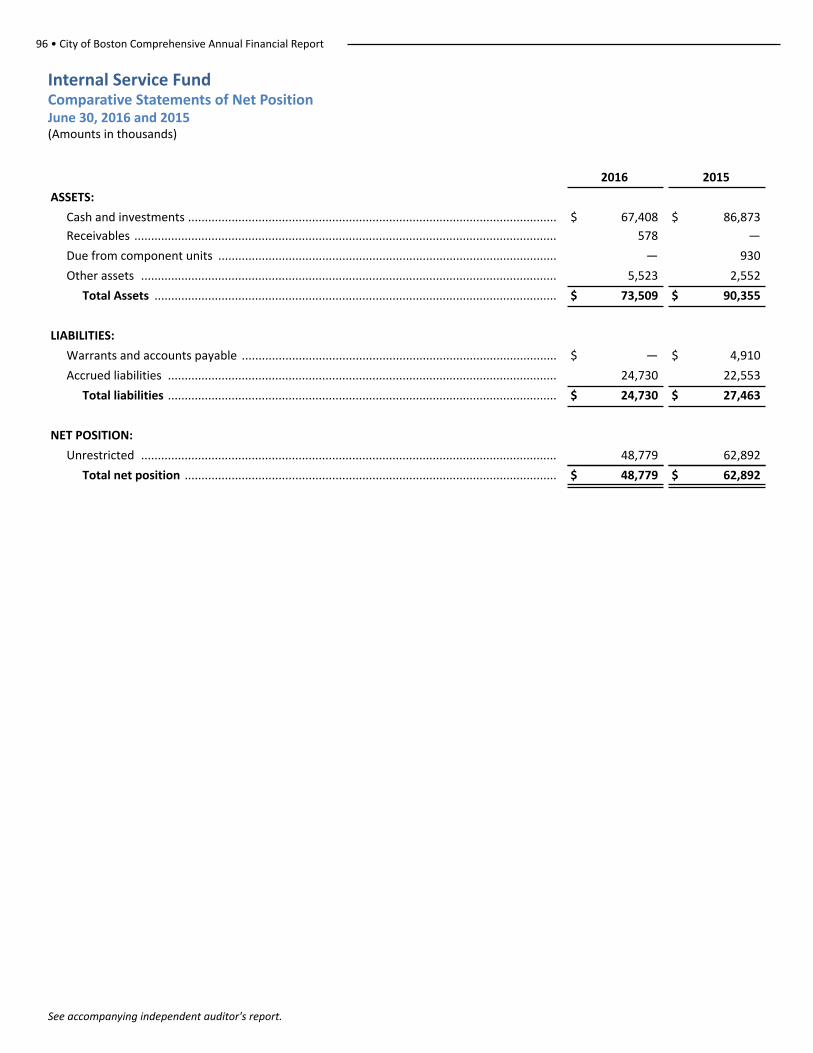
96 • City of Boston Comprehensive Annual Financial Report
See accompanying independent auditor's report.
Internal Service Fund Comparative Statements of Net PositionJune 30, 2016 and 2015 (Amounts in thousands)
2016 2015
ASSETS:
Cash and investments .............................................................................................................. $ 67,408 $ 86,873
Receivables .............................................................................................................................. 578 —
Due from component units ..................................................................................................... — 930
Other assets ............................................................................................................................ 5,523 2,552
Total Assets ........................................................................................................................ $ 73,509 $ 90,355
LIABILITIES:
Warrants and accounts payable .............................................................................................. $ — $ 4,910
Accrued liabilities .................................................................................................................... 24,730 22,553
Total liabilities .................................................................................................................... $ 24,730 $ 27,463
NET POSITION:
Unrestricted ............................................................................................................................ 48,779 62,892
Total net position ............................................................................................................... $ 48,779 $ 62,892
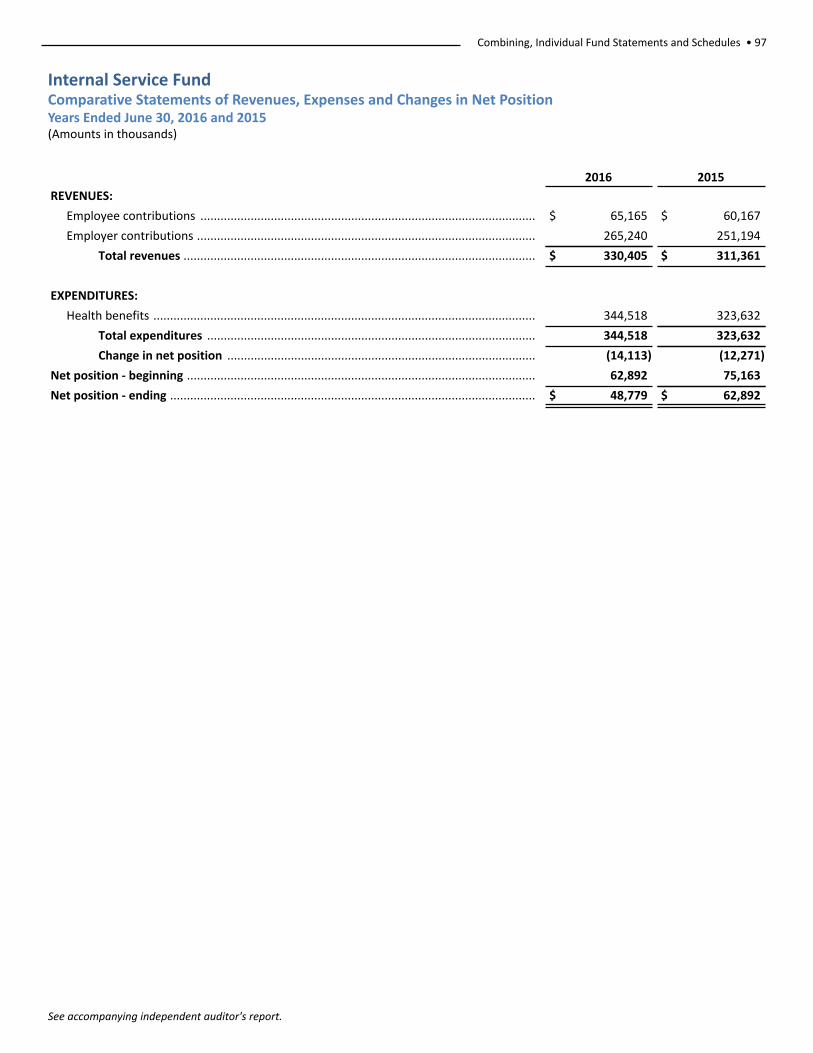
Combining, Individual Fund Statements and Schedules • 97
See accompanying independent auditor's report.
Internal Service Fund Comparative Statements of Revenues, Expenses and Changes in Net PositionYears Ended June 30, 2016 and 2015 (Amounts in thousands)
2016 2015
REVENUES:
Employee contributions .................................................................................................... $ 65,165 $ 60,167
Employer contributions ..................................................................................................... 265,240 251,194
Total revenues ......................................................................................................... $ 330,405 $ 311,361
EXPENDITURES:
Health benefits .................................................................................................................. 344,518 323,632
Total expenditures .................................................................................................. 344,518 323,632
Change in net position ............................................................................................ (14,113) (12,271)
Net position - beginning ........................................................................................................ 62,892 75,163
Net position - ending ............................................................................................................. $ 48,779 $ 62,892
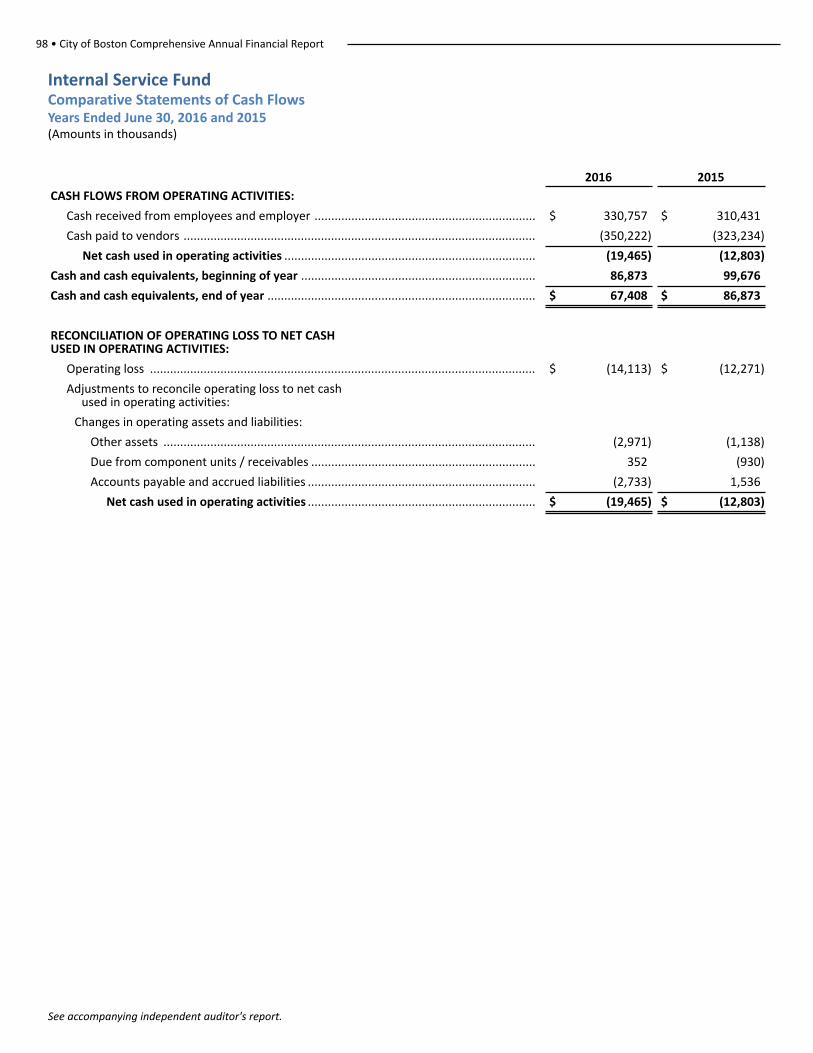
98 • City of Boston Comprehensive Annual Financial Report
See accompanying independent auditor's report.
Internal Service Fund Comparative Statements of Cash FlowsYears Ended June 30, 2016 and 2015(Amounts in thousands)
2016 2015
CASH FLOWS FROM OPERATING ACTIVITIES:
Cash received from employees and employer .................................................................. $ 330,757 $ 310,431
Cash paid to vendors ......................................................................................................... (350,222) (323,234)
Net cash used in operating activities ........................................................................... (19,465) (12,803)
Cash and cash equivalents, beginning of year ...................................................................... 86,873 99,676
Cash and cash equivalents, end of year ................................................................................ $ 67,408 $ 86,873
RECONCILIATION OF OPERATING LOSS TO NET CASH USED IN OPERATING ACTIVITIES:
Operating loss ................................................................................................................... $ (14,113) $ (12,271)
Adjustments to reconcile operating loss to net cash used in operating activities:
Changes in operating assets and liabilities:
Other assets ............................................................................................................... (2,971) (1,138)
Due from component units / receivables ................................................................... 352 (930)
Accounts payable and accrued liabilities .................................................................... (2,733) 1,536
Net cash used in operating activities .................................................................... $ (19,465) $ (12,803)

Combining, Individual Fund Statements and Schedules • 99
(This page intentionally left blank)
100 • City of Boston Comprehensive Annual Financial Report
Fiduciary Funds
Leonard P. Zakim Bridge
EMPLOYEE RETIREMENT PLAN
Boston Retirement System is a defined benefit contributory retirement plan covering employees of the City of Boston, Boston Public Health Commission, Boston Housing Authority, Boston Redevelopment Authority, and the Boston Water and Sewer Commission. The System is subject to benefit provisions and financing requirements set forth primarily in Chapter 32 of the Massachusetts General Laws.
OPEB TRUST FUND
The OPEB Trust Fund is an irrevocable trust fund established for other postemployment benefits. The assets are appropriated from the General Fund and accumulate to reduce the unfunded actuarial liability for health care and other postemployment benefits.
PRIVATE PURPOSE TRUST FUNDS
Private purpose trust funds are used to report any trust arrangement not otherwise classified as pension or benefit trusts, or an investment trust fund, “under which principal and income benefit individuals, private organizations, or other governments.”
Pool#1 is a co-mingled investment fund of various trust funds of the City. A number of the Pool#1 trust funds are for the maintenance and improvement of the City’s parks and cemeteries for the use and enjoyment of City residents. The other portion of Pool#1 trust funds lack a general government purpose and are therefore classified here as private purpose trust funds.
Pool#2 is used for scholarship awards, the purchase of educational equipment, and the aid of needy students.
Pool#5 is formed by the will of George R. White dated May 21, 1920. The will requires that the fund’s income be used for the creation of public utility and beauty for the use and enjoyment of the inhabitants of the City.
Pool#7 is a co-mingled investment fund of various non-testamentary trust funds of the City of Boston. The nonexpendable portion of the fund is composed of donations/contributions from either individuals or organizations. Donations/contributions are to be expended in conformity with their respective trust instruments.
AGENCY FUNDLaw Enforcement Trust Fund accounts for proceeds from property seized from illegal drug-related activities. Funds can be used to defray the costs of protracted investigations, to provide technical equipment or expertise, and to provide matching funds for federal grants.

Combining, Individual Fund Statements and Schedules • 101
(This page intentionally left blank)
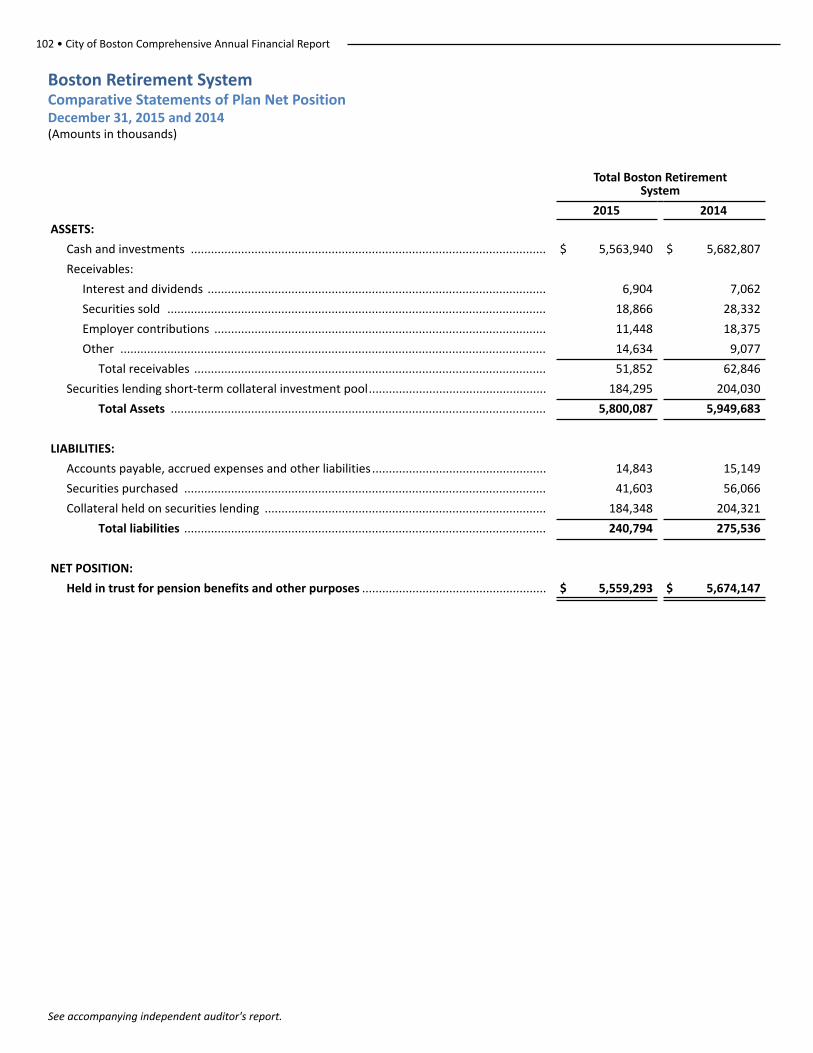
102 • City of Boston Comprehensive Annual Financial Report
See accompanying independent auditor's report.
Boston Retirement SystemComparative Statements of Plan Net PositionDecember 31, 2015 and 2014 (Amounts in thousands)
Total Boston RetirementSystem
2015 2014
ASSETS:
Cash and investments .......................................................................................................... $ 5,563,940 $ 5,682,807
Receivables:
Interest and dividends ..................................................................................................... 6,904 7,062
Securities sold ................................................................................................................. 18,866 28,332
Employer contributions ................................................................................................... 11,448 18,375
Other ............................................................................................................................... 14,634 9,077
Total receivables ......................................................................................................... 51,852 62,846
Securities lending short-term collateral investment pool..................................................... 184,295 204,030
Total Assets ................................................................................................................ 5,800,087 5,949,683
LIABILITIES:
Accounts payable, accrued expenses and other liabilities .................................................... 14,843 15,149
Securities purchased ............................................................................................................ 41,603 56,066
Collateral held on securities lending .................................................................................... 184,348 204,321
Total liabilities ............................................................................................................ 240,794 275,536
NET POSITION:
Held in trust for pension benefits and other purposes ....................................................... $ 5,559,293 $ 5,674,147
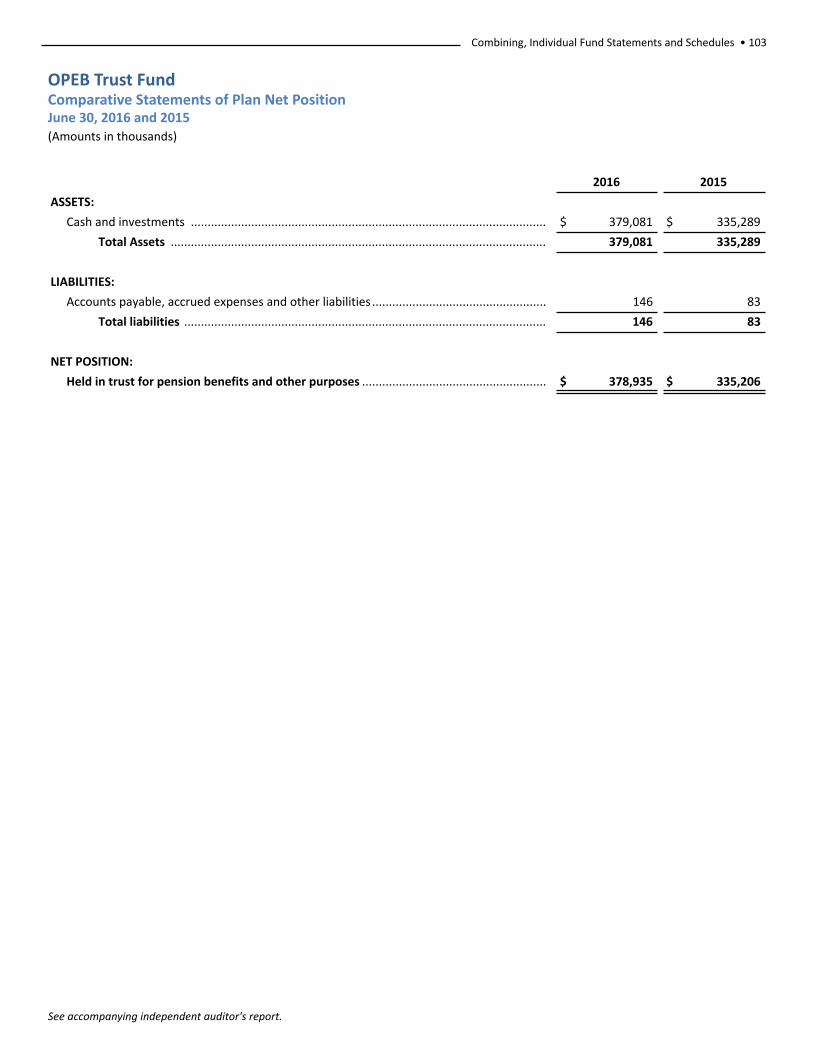
Combining, Individual Fund Statements and Schedules • 103
See accompanying independent auditor's report.
OPEB Trust FundComparative Statements of Plan Net PositionJune 30, 2016 and 2015 (Amounts in thousands)
2016 2015
ASSETS:
Cash and investments .......................................................................................................... $ 379,081 $ 335,289
Total Assets ................................................................................................................ 379,081 335,289
LIABILITIES:
Accounts payable, accrued expenses and other liabilities .................................................... 146 83
Total liabilities ............................................................................................................ 146 83
NET POSITION:
Held in trust for pension benefits and other purposes ....................................................... $ 378,935 $ 335,206
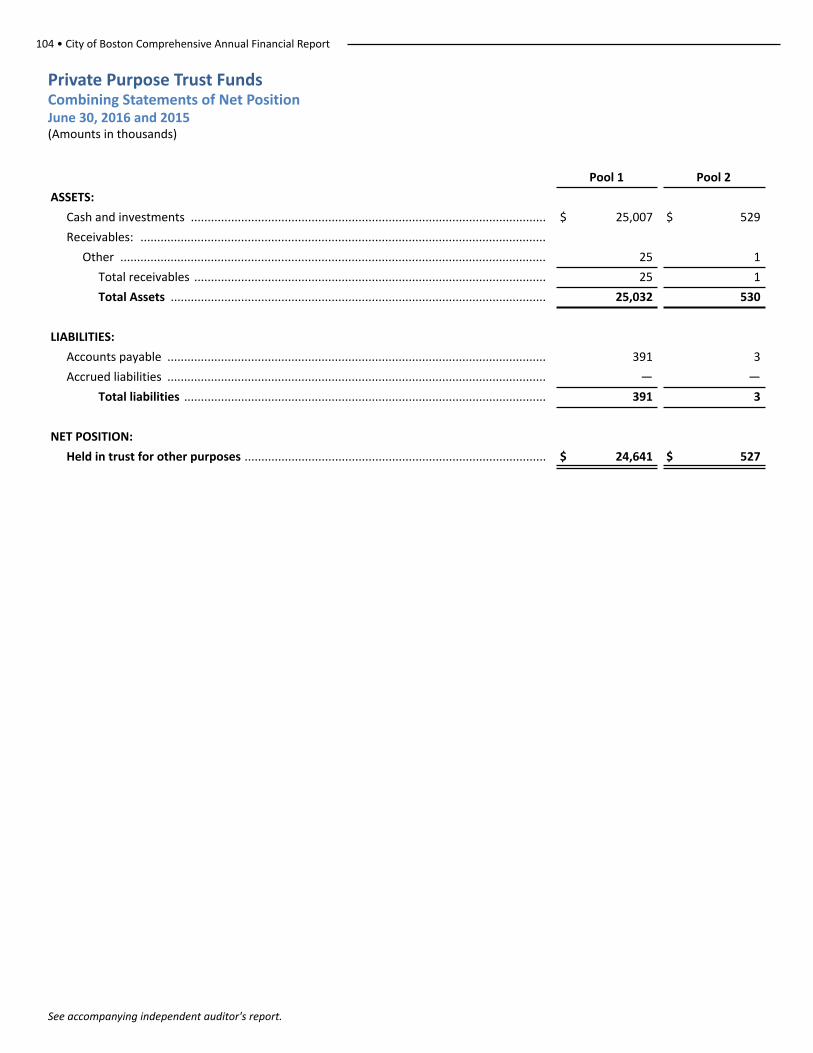
104 • City of Boston Comprehensive Annual Financial Report
See accompanying independent auditor's report.
Private Purpose Trust Funds Combining Statements of Net PositionJune 30, 2016 and 2015 (Amounts in thousands)
Pool 1 Pool 2
ASSETS:
Cash and investments .......................................................................................................... $ 25,007 $ 529
Receivables: .........................................................................................................................
Other ............................................................................................................................... 25 1
Total receivables ......................................................................................................... 25 1
Total Assets ................................................................................................................ 25,032 530
LIABILITIES:
Accounts payable ................................................................................................................. 391 3
Accrued liabilities ................................................................................................................. — —
Total liabilities ............................................................................................................ 391 3
NET POSITION:
Held in trust for other purposes .......................................................................................... $ 24,641 $ 527
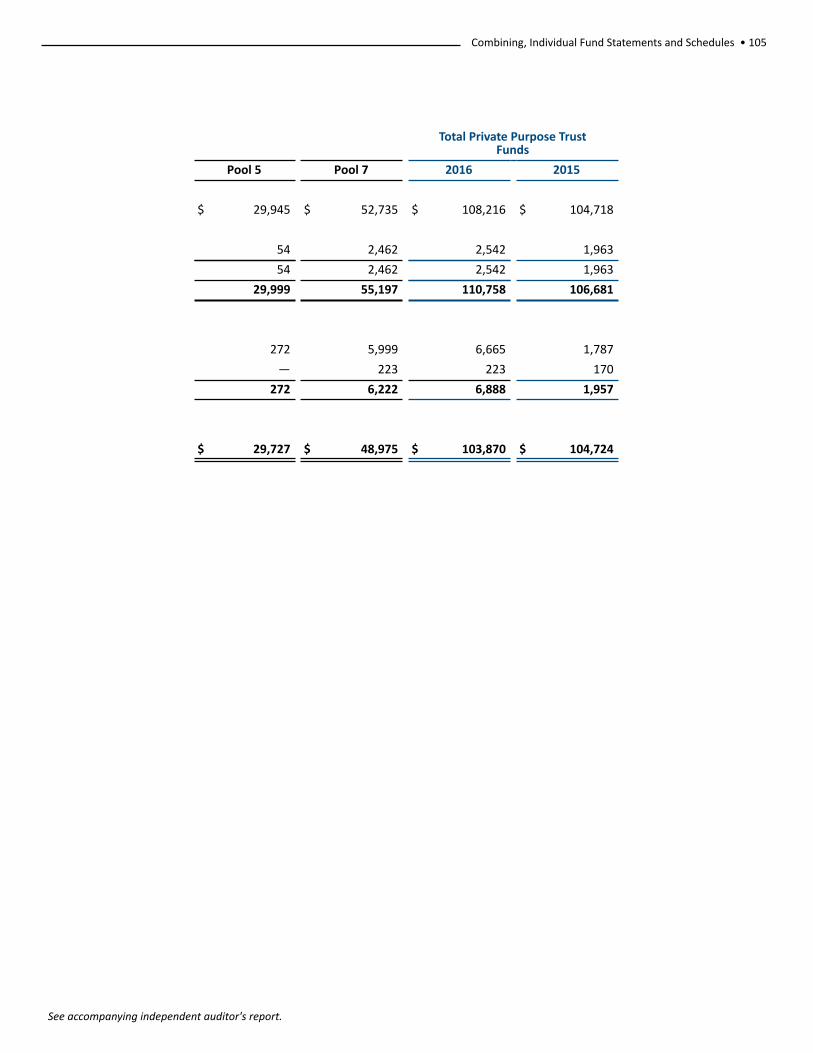
Combining, Individual Fund Statements and Schedules • 105
See accompanying independent auditor's report.
Total Private Purpose TrustFunds
Pool 5 Pool 7 2016 2015
$ 29,945 $ 52,735 $ 108,216 $ 104,718
54 2,462 2,542 1,963
54 2,462 2,542 1,963
29,999 55,197 110,758 106,681
272 5,999 6,665 1,787
— 223 223 170
272 6,222 6,888 1,957
$ 29,727 $ 48,975 $ 103,870 $ 104,724
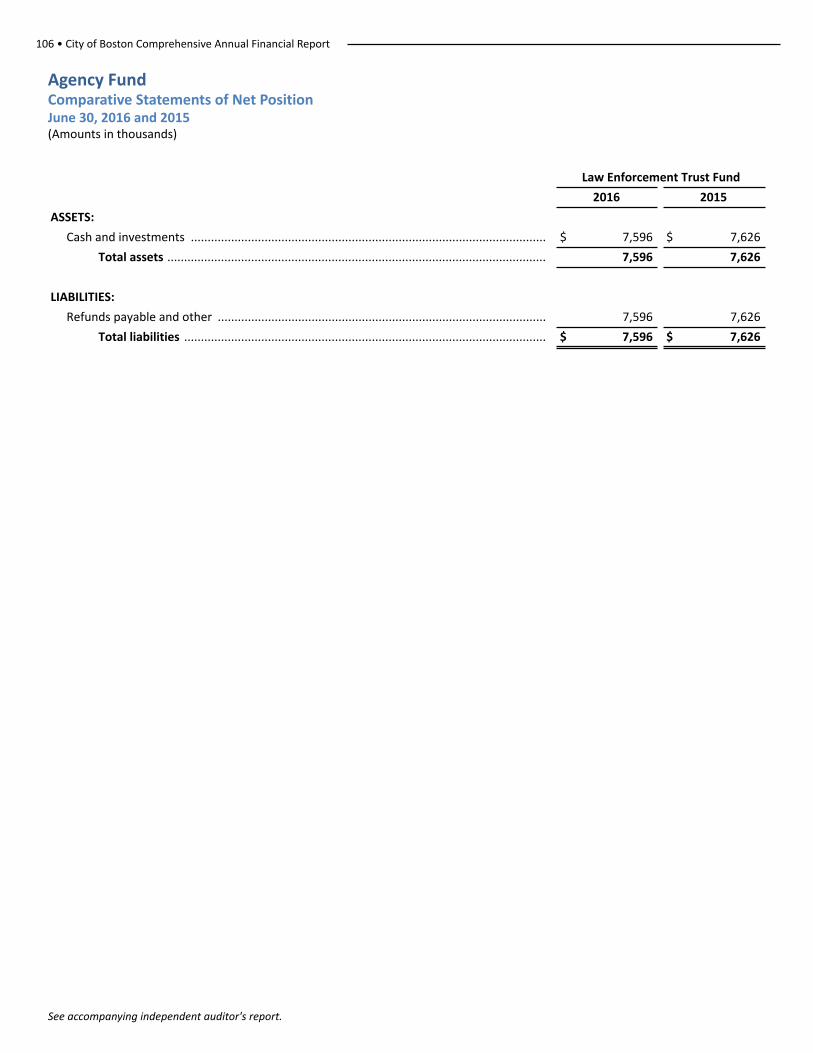
106 • City of Boston Comprehensive Annual Financial Report
See accompanying independent auditor's report.
Agency FundComparative Statements of Net PositionJune 30, 2016 and 2015 (Amounts in thousands)
Law Enforcement Trust Fund
2016 2015
ASSETS:
Cash and investments .......................................................................................................... $ 7,596 $ 7,626
Total assets ................................................................................................................. 7,596 7,626
LIABILITIES:
Refunds payable and other .................................................................................................. 7,596 7,626
Total liabilities ............................................................................................................ $ 7,596 $ 7,626
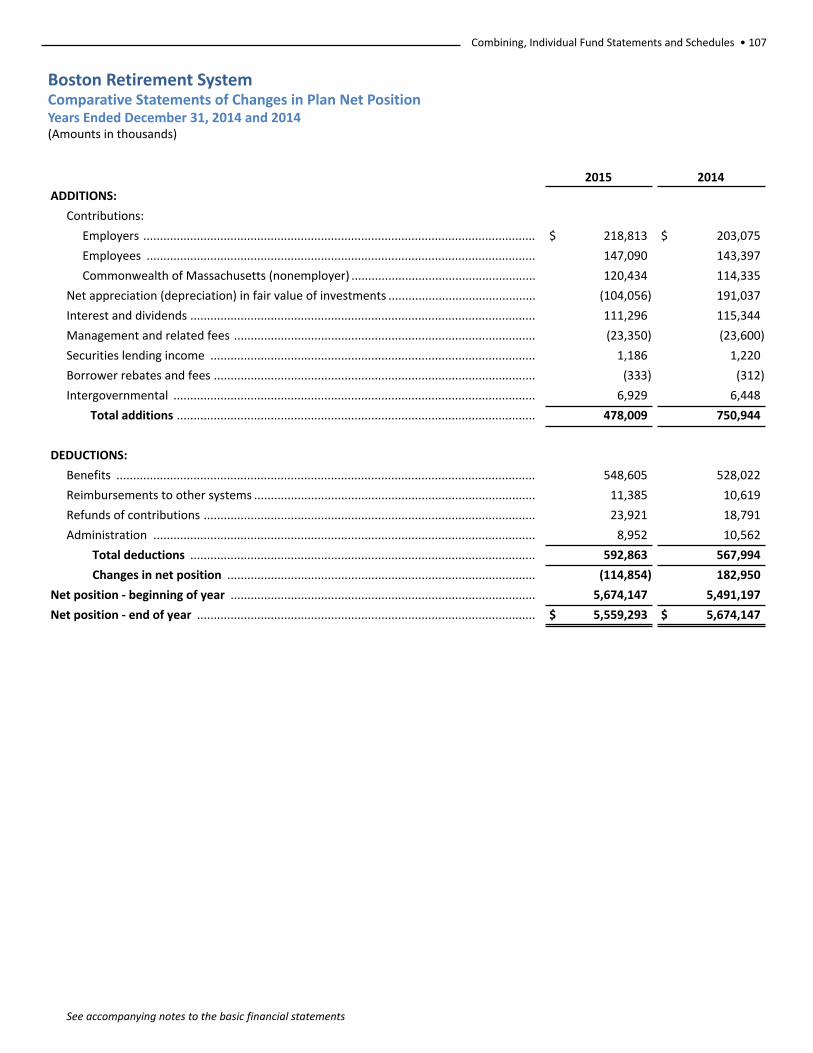
Combining, Individual Fund Statements and Schedules • 107
See accompanying notes to the basic financial statements
Boston Retirement SystemComparative Statements of Changes in Plan Net PositionYears Ended December 31, 2014 and 2014 (Amounts in thousands)
2015 2014
ADDITIONS:
Contributions:
Employers ..................................................................................................................... $ 218,813 $ 203,075
Employees .................................................................................................................... 147,090 143,397
Commonwealth of Massachusetts (nonemployer) ....................................................... 120,434 114,335
Net appreciation (depreciation) in fair value of investments ............................................ (104,056) 191,037
Interest and dividends ....................................................................................................... 111,296 115,344
Management and related fees .......................................................................................... (23,350) (23,600)
Securities lending income ................................................................................................. 1,186 1,220
Borrower rebates and fees ................................................................................................ (333) (312)
Intergovernmental ............................................................................................................ 6,929 6,448
Total additions ........................................................................................................... 478,009 750,944
DEDUCTIONS:
Benefits ............................................................................................................................. 548,605 528,022
Reimbursements to other systems .................................................................................... 11,385 10,619
Refunds of contributions ................................................................................................... 23,921 18,791
Administration .................................................................................................................. 8,952 10,562
Total deductions ....................................................................................................... 592,863 567,994
Changes in net position ............................................................................................ (114,854) 182,950
Net position - beginning of year ........................................................................................... 5,674,147 5,491,197
Net position - end of year ..................................................................................................... $ 5,559,293 $ 5,674,147
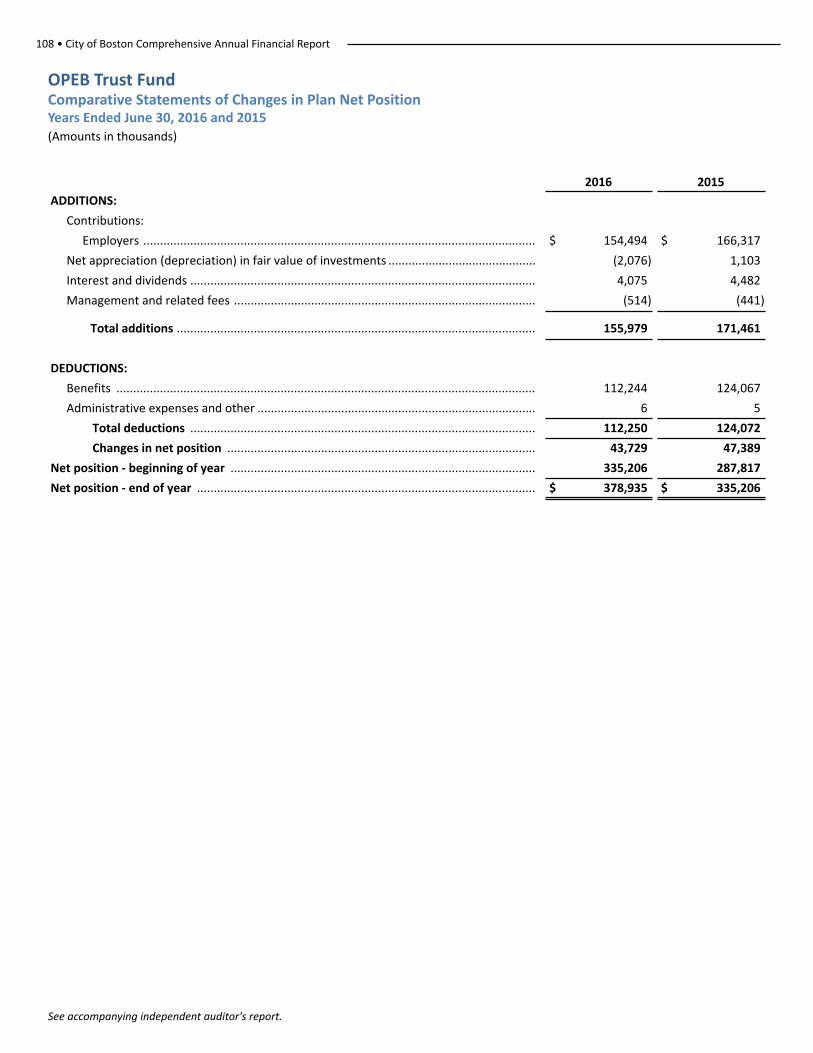
108 • City of Boston Comprehensive Annual Financial Report
See accompanying independent auditor's report.
OPEB Trust FundComparative Statements of Changes in Plan Net PositionYears Ended June 30, 2016 and 2015 (Amounts in thousands)
2016 2015
ADDITIONS:
Contributions:
Employers ..................................................................................................................... $ 154,494 $ 166,317
Net appreciation (depreciation) in fair value of investments ............................................ (2,076) 1,103
Interest and dividends ....................................................................................................... 4,075 4,482
Management and related fees .......................................................................................... (514) (441)
Total additions ........................................................................................................... 155,979 171,461
DEDUCTIONS:
Benefits ............................................................................................................................. 112,244 124,067
Administrative expenses and other ................................................................................... 6 5
Total deductions ....................................................................................................... 112,250 124,072
Changes in net position ............................................................................................ 43,729 47,389
Net position - beginning of year ........................................................................................... 335,206 287,817
Net position - end of year ..................................................................................................... $ 378,935 $ 335,206

Combining, Individual Fund Statements and Schedules • 109
(This page intentionally left blank)
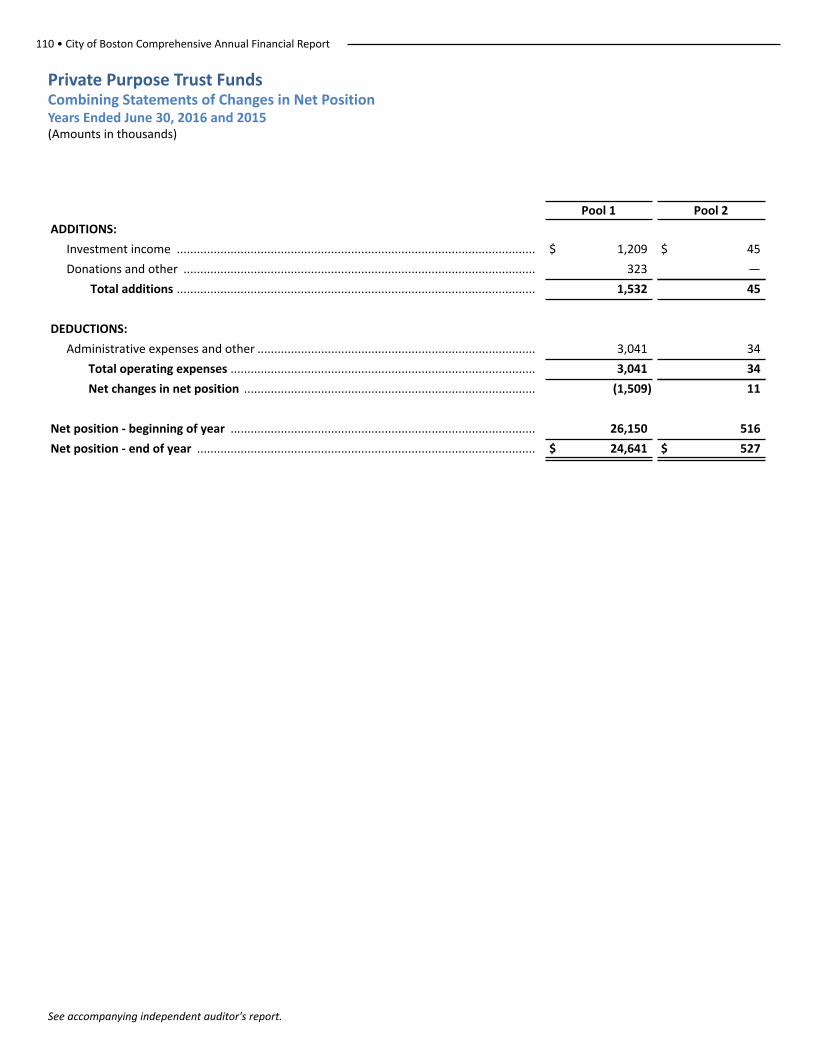
110 • City of Boston Comprehensive Annual Financial Report
See accompanying independent auditor's report.
Private Purpose Trust Funds Combining Statements of Changes in Net PositionYears Ended June 30, 2016 and 2015(Amounts in thousands)
Pool 1 Pool 2
ADDITIONS:
Investment income ........................................................................................................... $ 1,209 $ 45
Donations and other ......................................................................................................... 323 —
Total additions ........................................................................................................... 1,532 45
DEDUCTIONS:
Administrative expenses and other ................................................................................... 3,041 34
Total operating expenses ........................................................................................... 3,041 34
Net changes in net position ....................................................................................... (1,509) 11
Net position - beginning of year ........................................................................................... 26,150 516
Net position - end of year ..................................................................................................... $ 24,641 $ 527
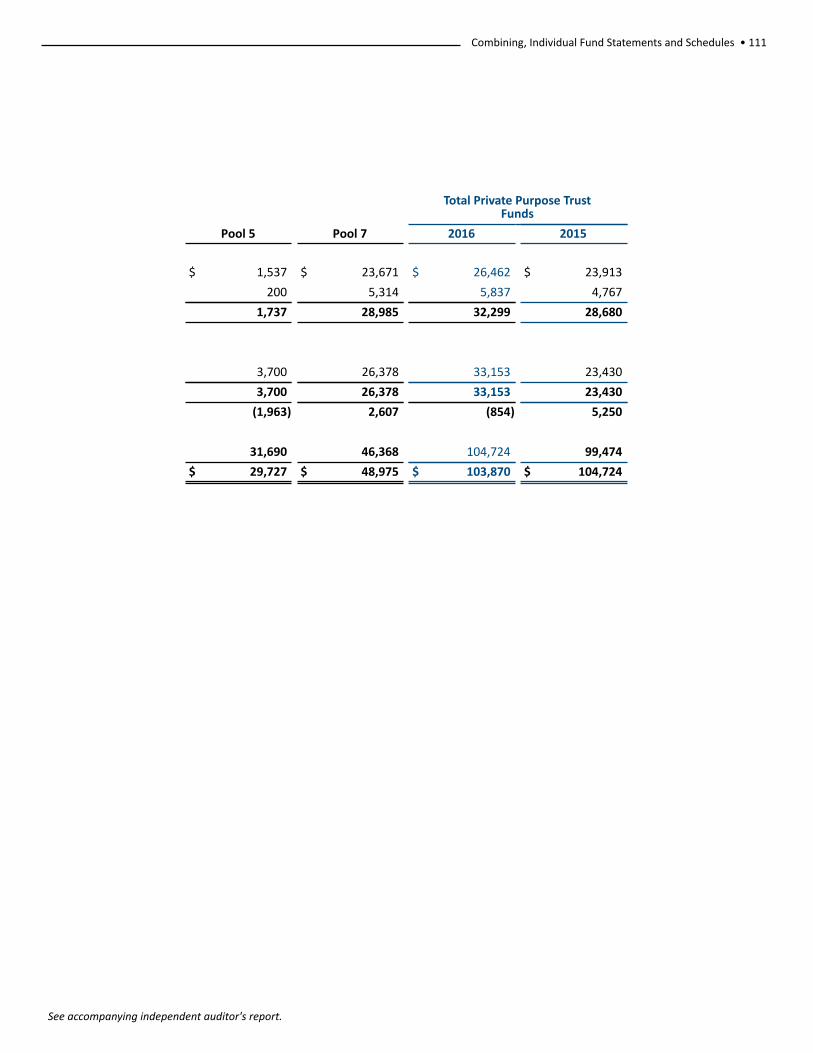
Combining, Individual Fund Statements and Schedules • 111
See accompanying independent auditor's report.
Total Private Purpose TrustFunds
Pool 5 Pool 7 2016 2015
$ 1,537 $ 23,671 $ 26,462 $ 23,913
200 5,314 5,837 4,767
1,737 28,985 32,299 28,680
3,700 26,378 33,153 23,430
3,700 26,378 33,153 23,430
(1,963) 2,607 (854) 5,250
31,690 46,368 104,724 99,474
$ 29,727 $ 48,975 $ 103,870 $ 104,724
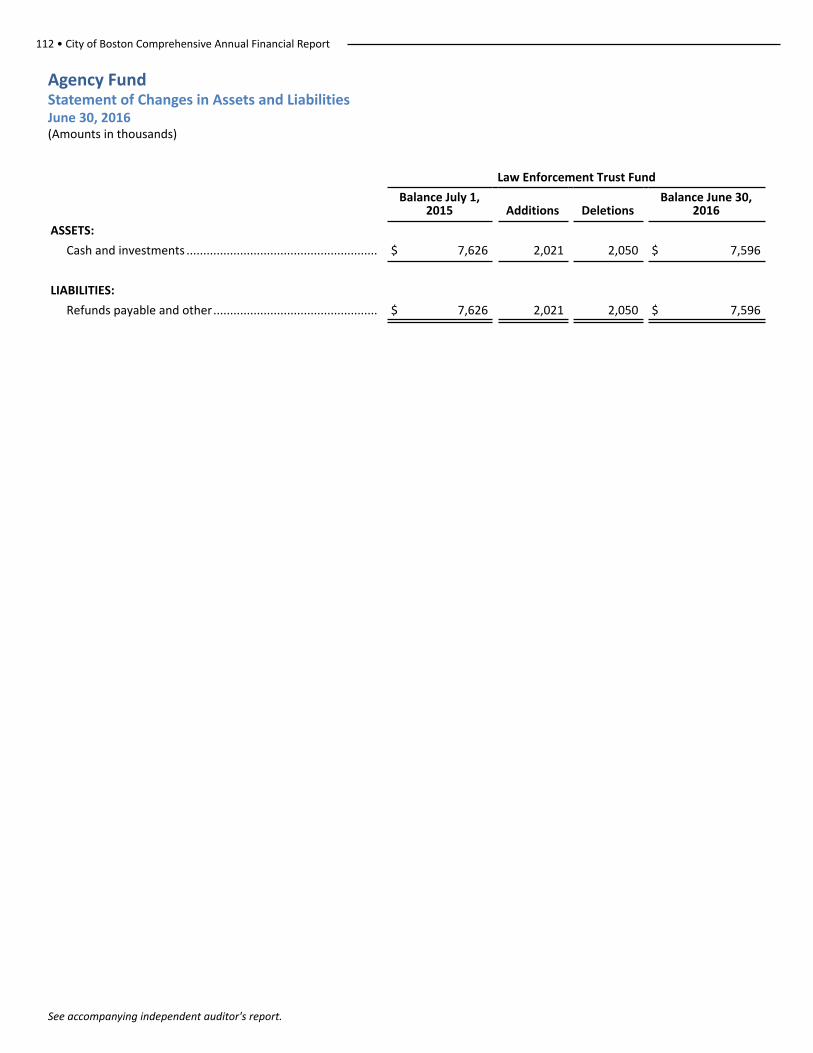
112 • City of Boston Comprehensive Annual Financial Report
See accompanying independent auditor's report.
Agency FundStatement of Changes in Assets and LiabilitiesJune 30, 2016 (Amounts in thousands)
Law Enforcement Trust Fund
Balance July 1,2015 Additions Deletions
Balance June 30,2016
ASSETS:
Cash and investments ......................................................... $ 7,626 2,021 2,050 $ 7,596
LIABILITIES:
Refunds payable and other................................................. $ 7,626 2,021 2,050 $ 7,596

Combining, Individual Fund Statements and Schedules • 113
(This page intentionally left blank)
114 • City of Boston Comprehensive Annual Financial Report
See accompanying independent auditor's report.
Discretely Presented Component Units
Boston skyline
Discretely presented component units are legally separate from the City but are included because the City is financially accountable for the organizations.

Combining, Individual Fund Statements and Schedules • 115
(This page intentionally left blank)
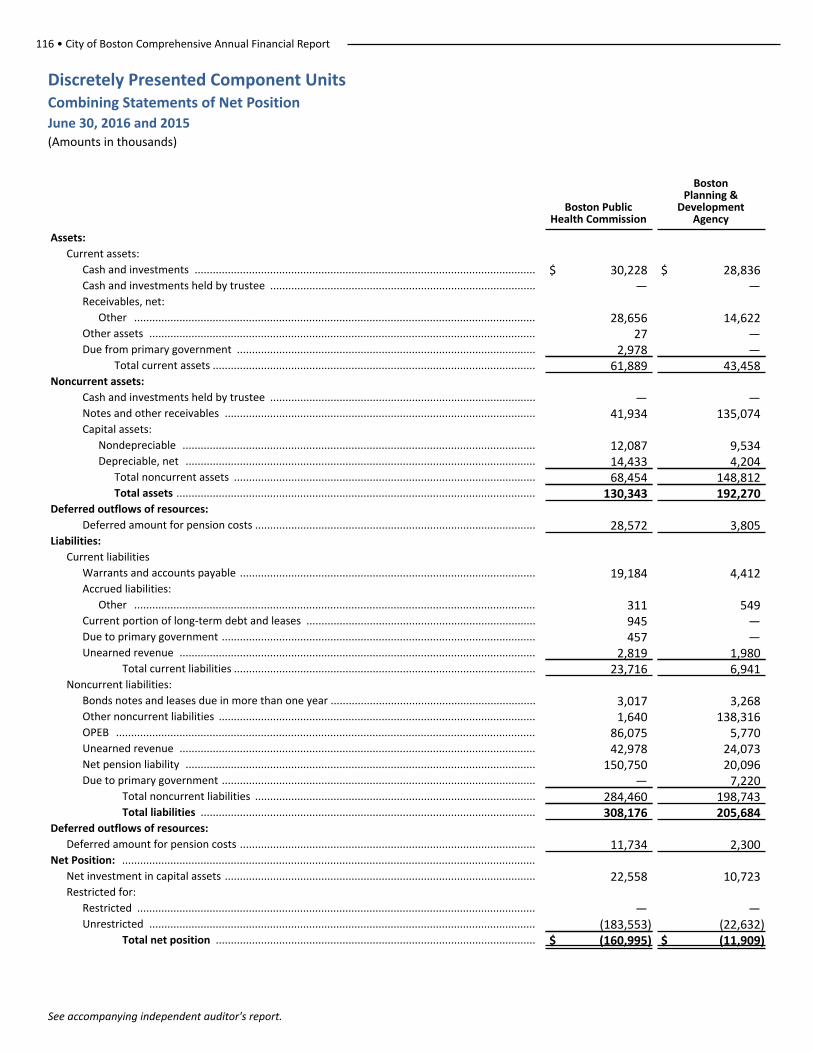
116 • City of Boston Comprehensive Annual Financial Report
See accompanying independent auditor's report.
Discretely Presented Component UnitsCombining Statements of Net PositionJune 30, 2016 and 2015 (Amounts in thousands)
Boston PublicHealth Commission
BostonPlanning &
Development Agency
Assets:
Current assets:
Cash and investments ................................................................................................................. $ 30,228 $ 28,836Cash and investments held by trustee ........................................................................................ — —Receivables, net:
Other ..................................................................................................................................... 28,656 14,622Other assets ................................................................................................................................ 27 —Due from primary government ................................................................................................... 2,978 —
Total current assets ........................................................................................................... 61,889 43,458Noncurrent assets:
Cash and investments held by trustee ........................................................................................ — —Notes and other receivables ....................................................................................................... 41,934 135,074Capital assets:
Nondepreciable ..................................................................................................................... 12,087 9,534Depreciable, net .................................................................................................................... 14,433 4,204
Total noncurrent assets .................................................................................................... 68,454 148,812Total assets ....................................................................................................................... 130,343 192,270
Deferred outflows of resources:
Deferred amount for pension costs ............................................................................................. 28,572 3,805Liabilities:
Current liabilities
Warrants and accounts payable .................................................................................................. 19,184 4,412Accrued liabilities:
Other ..................................................................................................................................... 311 549Current portion of long-term debt and leases ............................................................................ 945 —Due to primary government ........................................................................................................ 457 —Unearned revenue ...................................................................................................................... 2,819 1,980
Total current liabilities .................................................................................................... 23,716 6,941Noncurrent liabilities:
Bonds notes and leases due in more than one year .................................................................... 3,017 3,268Other noncurrent liabilities ......................................................................................................... 1,640 138,316OPEB ........................................................................................................................................... 86,075 5,770Unearned revenue ...................................................................................................................... 42,978 24,073Net pension liability .................................................................................................................... 150,750 20,096Due to primary government ........................................................................................................ — 7,220
Total noncurrent liabilities ............................................................................................. 284,460 198,743Total liabilities ............................................................................................................... 308,176 205,684
Deferred outflows of resources:
Deferred amount for pension costs .................................................................................................. 11,734 2,300Net Position: .........................................................................................................................................
Net investment in capital assets ....................................................................................................... 22,558 10,723Restricted for:
Restricted .................................................................................................................................... — —Unrestricted ................................................................................................................................ (183,553) (22,632)
Total net position .......................................................................................................... $ (160,995) $ (11,909)
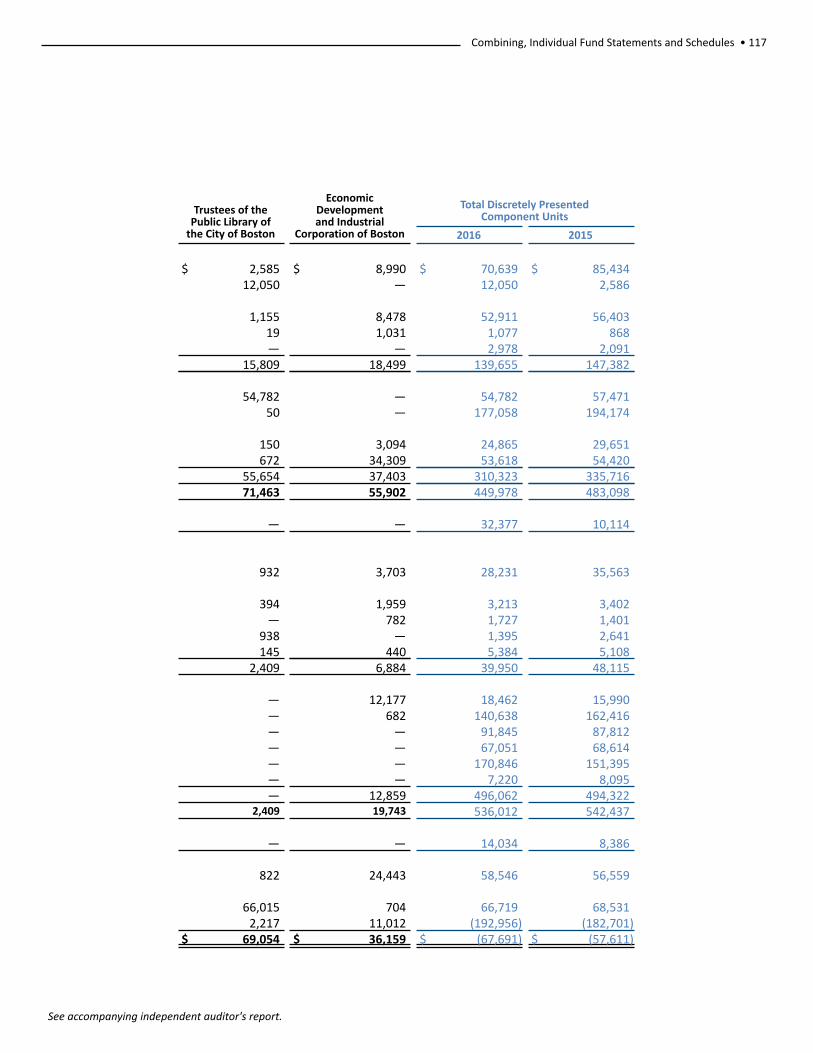
Combining, Individual Fund Statements and Schedules • 117
See accompanying independent auditor's report.
Trustees of thePublic Library of
the City of Boston
Economic Developmentand Industrial
Corporation of Boston
Total Discretely PresentedComponent Units
2016 2015
$ 2,585 $ 8,990 $ 70,639 $ 85,43412,050 — 12,050 2,586
1,155 8,478 52,911 56,40319 1,031 1,077 868— — 2,978 2,091
15,809 18,499 139,655 147,382
54,782 — 54,782 57,47150 — 177,058 194,174
150 3,094 24,865 29,651672 34,309 53,618 54,420
55,654 37,403 310,323 335,71671,463 55,902 449,978 483,098
— — 32,377 10,114
932 3,703 28,231 35,563
394 1,959 3,213 3,402— 782 1,727 1,401
938 — 1,395 2,641145 440 5,384 5,108
2,409 6,884 39,950 48,115
— 12,177 18,462 15,990— 682 140,638 162,416— — 91,845 87,812— — 67,051 68,614— — 170,846 151,395— — 7,220 8,095— 12,859 496,062 494,322
2,409 19,743 536,012 542,437
— — 14,034 8,386
822 24,443 58,546 56,559
66,015 704 66,719 68,5312,217 11,012 (192,956) (182,701)
$ 69,054 $ 36,159 $ (67,691) $ (57,611)
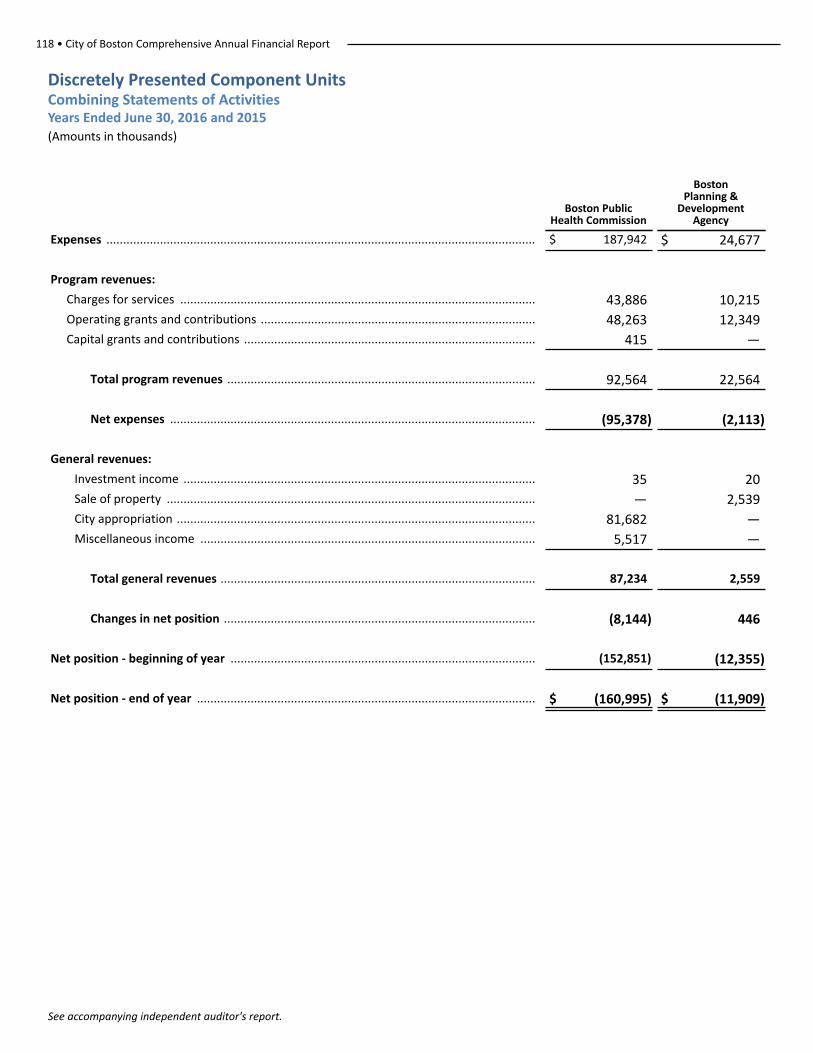
118 • City of Boston Comprehensive Annual Financial Report
See accompanying independent auditor's report.
Discretely Presented Component UnitsCombining Statements of ActivitiesYears Ended June 30, 2016 and 2015 (Amounts in thousands)
Boston PublicHealth Commission
BostonPlanning &
Development Agency
Expenses ................................................................................................................................ $ 187,942 $ 24,677
Program revenues:
Charges for services .......................................................................................................... 43,886 10,215Operating grants and contributions .................................................................................. 48,263 12,349Capital grants and contributions ....................................................................................... 415 —
Total program revenues ............................................................................................ 92,564 22,564
Net expenses ............................................................................................................. (95,378) (2,113)
General revenues:
Investment income ......................................................................................................... 35 20Sale of property .............................................................................................................. — 2,539City appropriation ........................................................................................................... 81,682 —Miscellaneous income .................................................................................................... 5,517 —
Total general revenues .............................................................................................. 87,234 2,559
Changes in net position ............................................................................................. (8,144) 446
Net position - beginning of year ........................................................................................... (152,851) (12,355)
Net position - end of year ..................................................................................................... $ (160,995) $ (11,909)
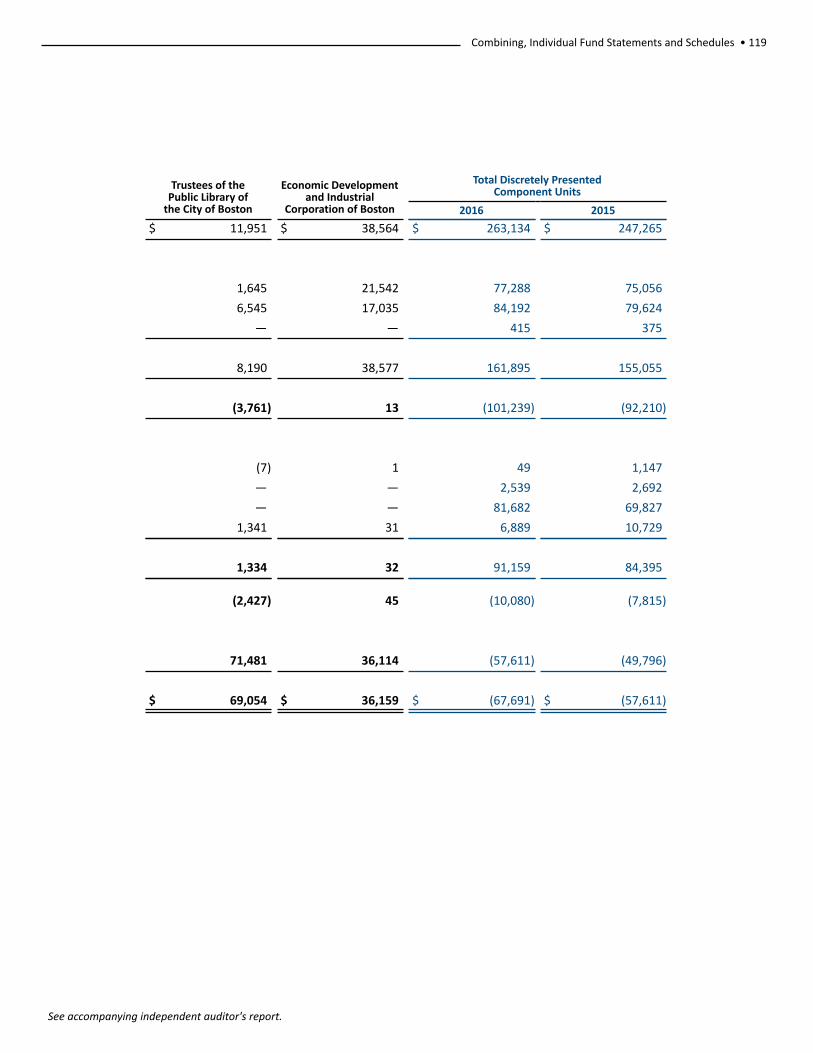
Combining, Individual Fund Statements and Schedules • 119
See accompanying independent auditor's report.
Trustees of thePublic Library of
the City of Boston
Economic Developmentand Industrial
Corporation of Boston
Total Discretely PresentedComponent Units
2016 2015
$ 11,951 $ 38,564 $ 263,134 $ 247,265
1,645 21,542 77,288 75,056
6,545 17,035 84,192 79,624
— — 415 375
8,190 38,577 161,895 155,055
(3,761) 13 (101,239) (92,210)
(7) 1 49 1,147
— — 2,539 2,692
— — 81,682 69,827
1,341 31 6,889 10,729
1,334 32 91,159 84,395
(2,427) 45 (10,080) (7,815)
71,481 36,114 (57,611) (49,796)
$ 69,054 $ 36,159 $ (67,691) $ (57,611)
120 • City of Boston Comprehensive Annual Financial Report
See accompanying independent auditor's report.
STATISTICAL SECTION (Unaudited)
This part of the City of Boston’s comprehensive annual financial report presents detailed information as a context for understanding what the information in the financial statements, note disclosures, and required supplementary information says about the government’s overall financial health.
Contents PageFinancial Trends 122
These schedules contain trend information to help the reader understand how the government’s financial performance and well-being have changed over time (See accompanying Management’s Discussion and Analysis, Statement of Net Position, and Statement of Activities):
General Government Expenditures by Function (GAAP Basis) – Last Ten Fiscal Years
General Government Revenues by Source (GAAP Basis) – Last Ten Fiscal Years
Net Position by Component – Last Ten Fiscal Years
Changes in Net Position – Last Ten Fiscal Years
Fund Balances of Governmental Funds – Last Ten Fiscal Years
Changes in Fund Balances of Governmental Funds – Last Ten Fiscal Years
Revenue Capacity 136
These schedules contain information to help the reader assess the government’s most significant revenue source, the property tax:
Assessed and Estimated Actual Value of All Taxable Property – Last Ten Fiscal Years
Property Tax Rates – Direct and Overlapping Governments – Last Ten Fiscal Years
Largest Principal Taxpayers – Current Year and Nine Years Ago
Property Tax Levies and Collections – Last Ten Fiscal Years
Debt Capacity 140
These schedules present information to help the reader assess the affordability of the government’s currentlevels of outstanding debt and the government’s ability to issue additional debt in the future (Seeaccompanying note 10 of the basic financial statements):
Ratios of Outstanding Debt by Type – Last Ten Fiscal Years
Ratio of Net General Obligation Bonded Debt to Assessed Value and Net Bonded Debt Per Capita – Last Ten Fiscal Years
Legal Debt Margin Information – Last Ten Fiscal Years
Demographic and Economic Information 144
These schedules offer demographic and economic indicators to help the reader understand the environmentwithin which the government’s financial activities take place:
Demographic and Economic Statistics – Last Ten Fiscal YearsPrincipal Employers – Current Year and Nine Years Ago
Operating Information 148
These schedules contain service and infrastructure data to help the reader understand how the informationin the government’s financial report relates to the services the government provides and the activities itperforms:
Full-time Equivalent City Government Employees by Department – Last Ten Fiscal YearsOperating Indicators by Function – Last Ten Fiscal Years
Capital Asset Statistics by Department – Last Ten Fiscal YearsSources: Unless otherwise noted, the prior year information in these schedules is derived from thecomprehensive annual financial reports for the relevant year.

Statistical Section • 121
(This page intentionally left blank)
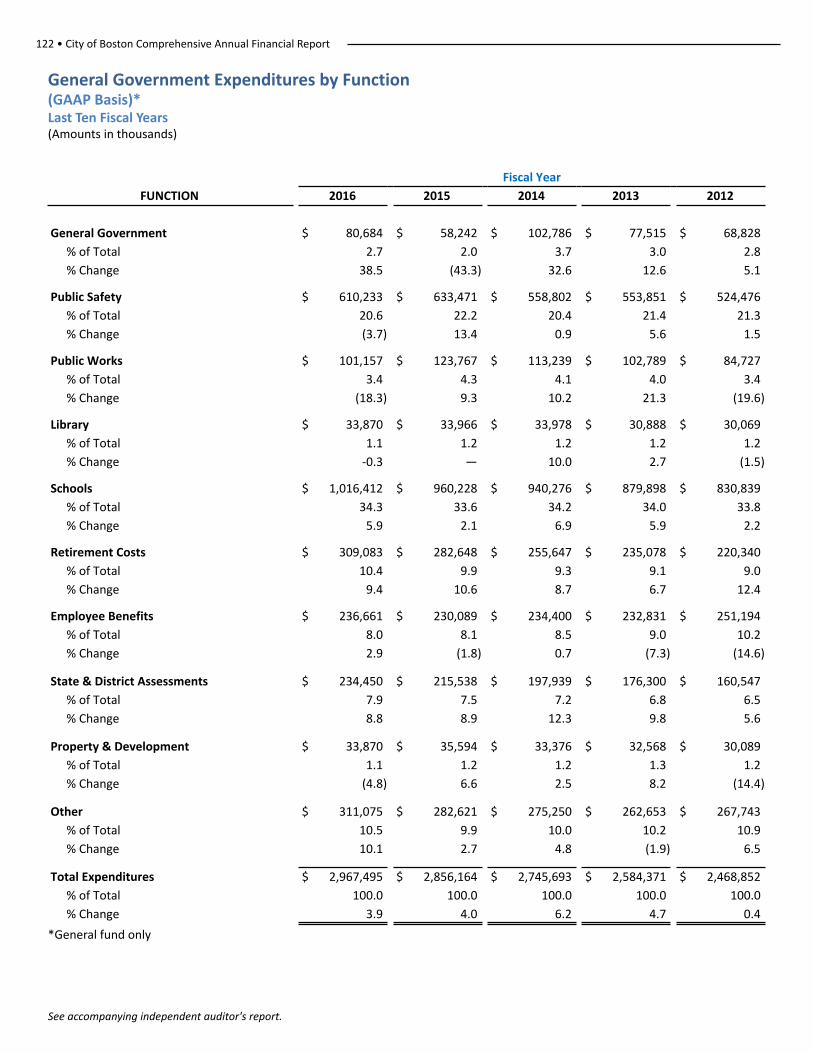
122 • City of Boston Comprehensive Annual Financial Report
See accompanying independent auditor's report.
General Government Expenditures by Function (GAAP Basis)*Last Ten Fiscal Years(Amounts in thousands)
Fiscal Year
FUNCTION 2016 2015 2014 2013 2012
General Government $ 80,684 $ 58,242 $ 102,786 $ 77,515 $ 68,828
% of Total 2.7 2.0 3.7 3.0 2.8
% Change 38.5 (43.3) 32.6 12.6 5.1
Public Safety $ 610,233 $ 633,471 $ 558,802 $ 553,851 $ 524,476
% of Total 20.6 22.2 20.4 21.4 21.3
% Change (3.7) 13.4 0.9 5.6 1.5
Public Works $ 101,157 $ 123,767 $ 113,239 $ 102,789 $ 84,727
% of Total 3.4 4.3 4.1 4.0 3.4
% Change (18.3) 9.3 10.2 21.3 (19.6)
Library $ 33,870 $ 33,966 $ 33,978 $ 30,888 $ 30,069
% of Total 1.1 1.2 1.2 1.2 1.2
% Change -0.3 — 10.0 2.7 (1.5)
Schools $ 1,016,412 $ 960,228 $ 940,276 $ 879,898 $ 830,839
% of Total 34.3 33.6 34.2 34.0 33.8
% Change 5.9 2.1 6.9 5.9 2.2
Retirement Costs $ 309,083 $ 282,648 $ 255,647 $ 235,078 $ 220,340
% of Total 10.4 9.9 9.3 9.1 9.0
% Change 9.4 10.6 8.7 6.7 12.4
Employee Benefits $ 236,661 $ 230,089 $ 234,400 $ 232,831 $ 251,194
% of Total 8.0 8.1 8.5 9.0 10.2
% Change 2.9 (1.8) 0.7 (7.3) (14.6)
State & District Assessments $ 234,450 $ 215,538 $ 197,939 $ 176,300 $ 160,547
% of Total 7.9 7.5 7.2 6.8 6.5
% Change 8.8 8.9 12.3 9.8 5.6
Property & Development $ 33,870 $ 35,594 $ 33,376 $ 32,568 $ 30,089
% of Total 1.1 1.2 1.2 1.3 1.2
% Change (4.8) 6.6 2.5 8.2 (14.4)
Other $ 311,075 $ 282,621 $ 275,250 $ 262,653 $ 267,743
% of Total 10.5 9.9 10.0 10.2 10.9
% Change 10.1 2.7 4.8 (1.9) 6.5
Total Expenditures $ 2,967,495 $ 2,856,164 $ 2,745,693 $ 2,584,371 $ 2,468,852
% of Total 100.0 100.0 100.0 100.0 100.0
% Change 3.9 4.0 6.2 4.7 0.4
*General fund only
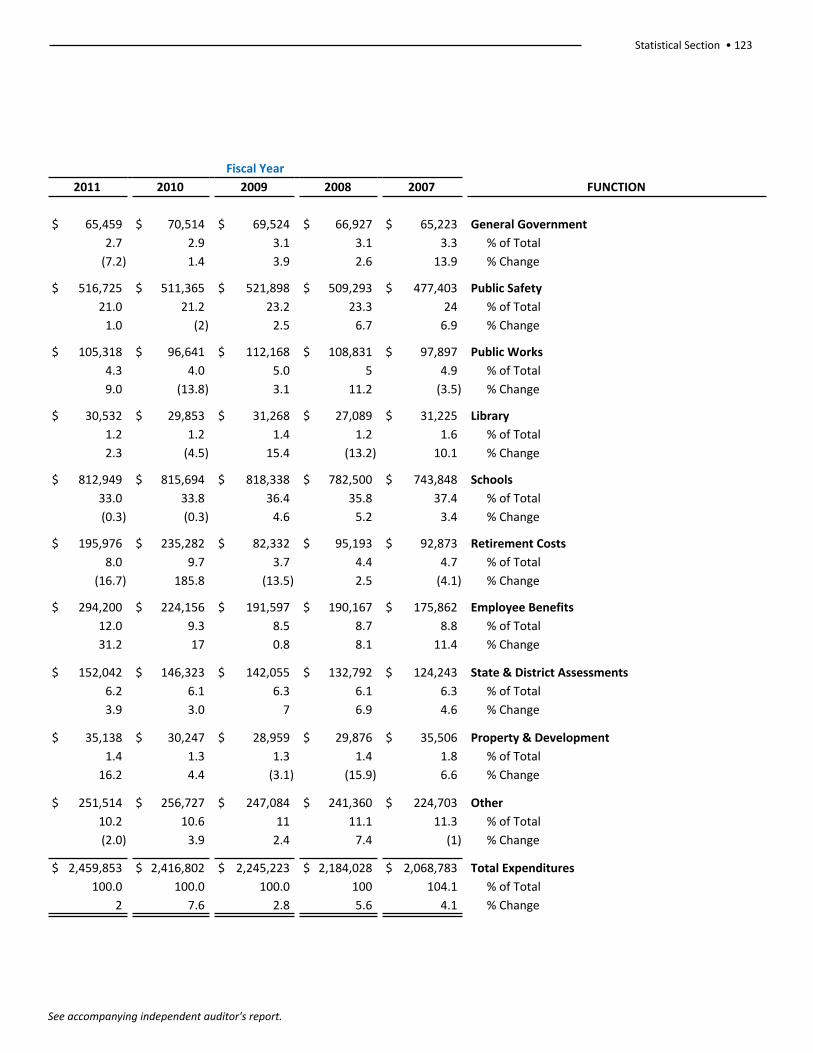
Statistical Section • 123
See accompanying independent auditor's report.
Fiscal Year
2011 2010 2009 2008 2007 FUNCTION
$ 65,459 $ 70,514 $ 69,524 $ 66,927 $ 65,223 General Government
2.7 2.9 3.1 3.1 3.3 % of Total
(7.2) 1.4 3.9 2.6 13.9 % Change
$ 516,725 $ 511,365 $ 521,898 $ 509,293 $ 477,403 Public Safety
21.0 21.2 23.2 23.3 24 % of Total
1.0 (2) 2.5 6.7 6.9 % Change
$ 105,318 $ 96,641 $ 112,168 $ 108,831 $ 97,897 Public Works
4.3 4.0 5.0 5 4.9 % of Total
9.0 (13.8) 3.1 11.2 (3.5) % Change
$ 30,532 $ 29,853 $ 31,268 $ 27,089 $ 31,225 Library
1.2 1.2 1.4 1.2 1.6 % of Total
2.3 (4.5) 15.4 (13.2) 10.1 % Change
$ 812,949 $ 815,694 $ 818,338 $ 782,500 $ 743,848 Schools
33.0 33.8 36.4 35.8 37.4 % of Total
(0.3) (0.3) 4.6 5.2 3.4 % Change
$ 195,976 $ 235,282 $ 82,332 $ 95,193 $ 92,873 Retirement Costs
8.0 9.7 3.7 4.4 4.7 % of Total
(16.7) 185.8 (13.5) 2.5 (4.1) % Change
$ 294,200 $ 224,156 $ 191,597 $ 190,167 $ 175,862 Employee Benefits
12.0 9.3 8.5 8.7 8.8 % of Total
31.2 17 0.8 8.1 11.4 % Change
$ 152,042 $ 146,323 $ 142,055 $ 132,792 $ 124,243 State & District Assessments
6.2 6.1 6.3 6.1 6.3 % of Total
3.9 3.0 7 6.9 4.6 % Change
$ 35,138 $ 30,247 $ 28,959 $ 29,876 $ 35,506 Property & Development
1.4 1.3 1.3 1.4 1.8 % of Total
16.2 4.4 (3.1) (15.9) 6.6 % Change
$ 251,514 $ 256,727 $ 247,084 $ 241,360 $ 224,703 Other
10.2 10.6 11 11.1 11.3 % of Total
(2.0) 3.9 2.4 7.4 (1) % Change
$ 2,459,853 $ 2,416,802 $ 2,245,223 $ 2,184,028 $ 2,068,783 Total Expenditures
100.0 100.0 100.0 100 104.1 % of Total
2 7.6 2.8 5.6 4.1 % Change
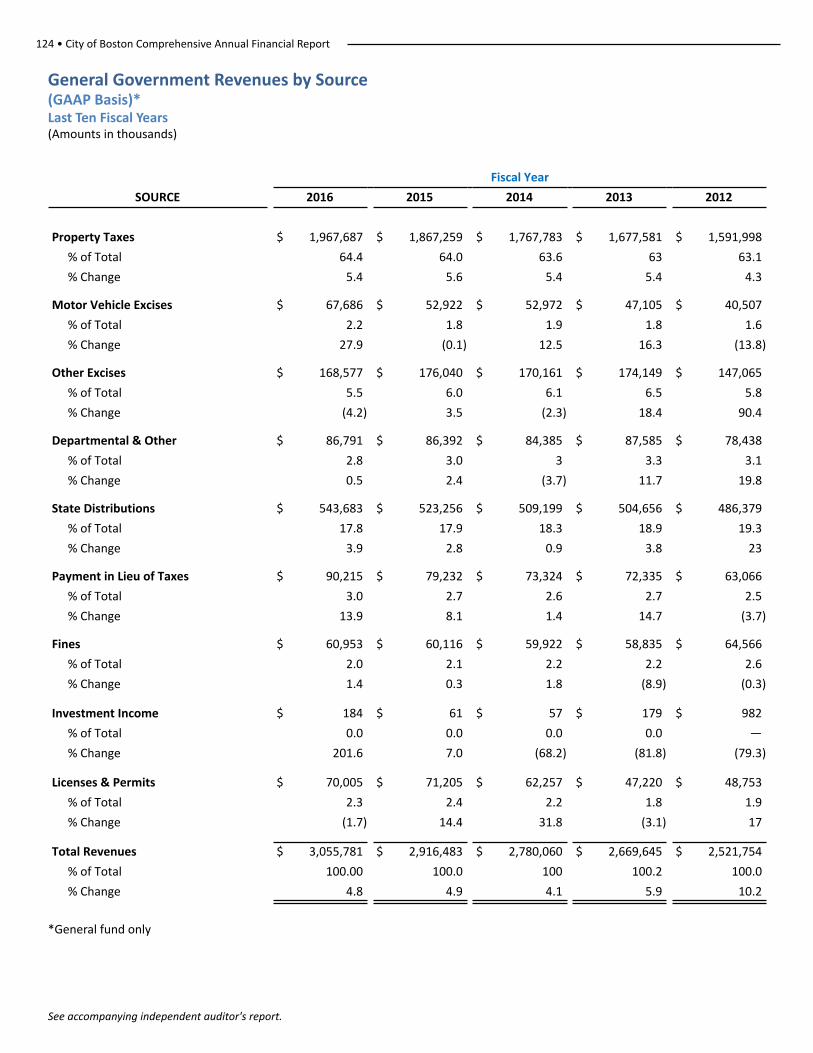
124 • City of Boston Comprehensive Annual Financial Report
See accompanying independent auditor's report.
General Government Revenues by Source (GAAP Basis)*Last Ten Fiscal Years(Amounts in thousands)
Fiscal Year
SOURCE 2016 2015 2014 2013 2012
Property Taxes $ 1,967,687 $ 1,867,259 $ 1,767,783 $ 1,677,581 $ 1,591,998
% of Total 64.4 64.0 63.6 63 63.1
% Change 5.4 5.6 5.4 5.4 4.3
Motor Vehicle Excises $ 67,686 $ 52,922 $ 52,972 $ 47,105 $ 40,507
% of Total 2.2 1.8 1.9 1.8 1.6
% Change 27.9 (0.1) 12.5 16.3 (13.8)
Other Excises $ 168,577 $ 176,040 $ 170,161 $ 174,149 $ 147,065
% of Total 5.5 6.0 6.1 6.5 5.8
% Change (4.2) 3.5 (2.3) 18.4 90.4
Departmental & Other $ 86,791 $ 86,392 $ 84,385 $ 87,585 $ 78,438
% of Total 2.8 3.0 3 3.3 3.1
% Change 0.5 2.4 (3.7) 11.7 19.8
State Distributions $ 543,683 $ 523,256 $ 509,199 $ 504,656 $ 486,379
% of Total 17.8 17.9 18.3 18.9 19.3
% Change 3.9 2.8 0.9 3.8 23
Payment in Lieu of Taxes $ 90,215 $ 79,232 $ 73,324 $ 72,335 $ 63,066
% of Total 3.0 2.7 2.6 2.7 2.5
% Change 13.9 8.1 1.4 14.7 (3.7)
Fines $ 60,953 $ 60,116 $ 59,922 $ 58,835 $ 64,566
% of Total 2.0 2.1 2.2 2.2 2.6
% Change 1.4 0.3 1.8 (8.9) (0.3)
Investment Income $ 184 $ 61 $ 57 $ 179 $ 982
% of Total 0.0 0.0 0.0 0.0 —
% Change 201.6 7.0 (68.2) (81.8) (79.3)
Licenses & Permits $ 70,005 $ 71,205 $ 62,257 $ 47,220 $ 48,753
% of Total 2.3 2.4 2.2 1.8 1.9
% Change (1.7) 14.4 31.8 (3.1) 17
Total Revenues $ 3,055,781 $ 2,916,483 $ 2,780,060 $ 2,669,645 $ 2,521,754
% of Total 100.00 100.0 100 100.2 100.0
% Change 4.8 4.9 4.1 5.9 10.2
*General fund only
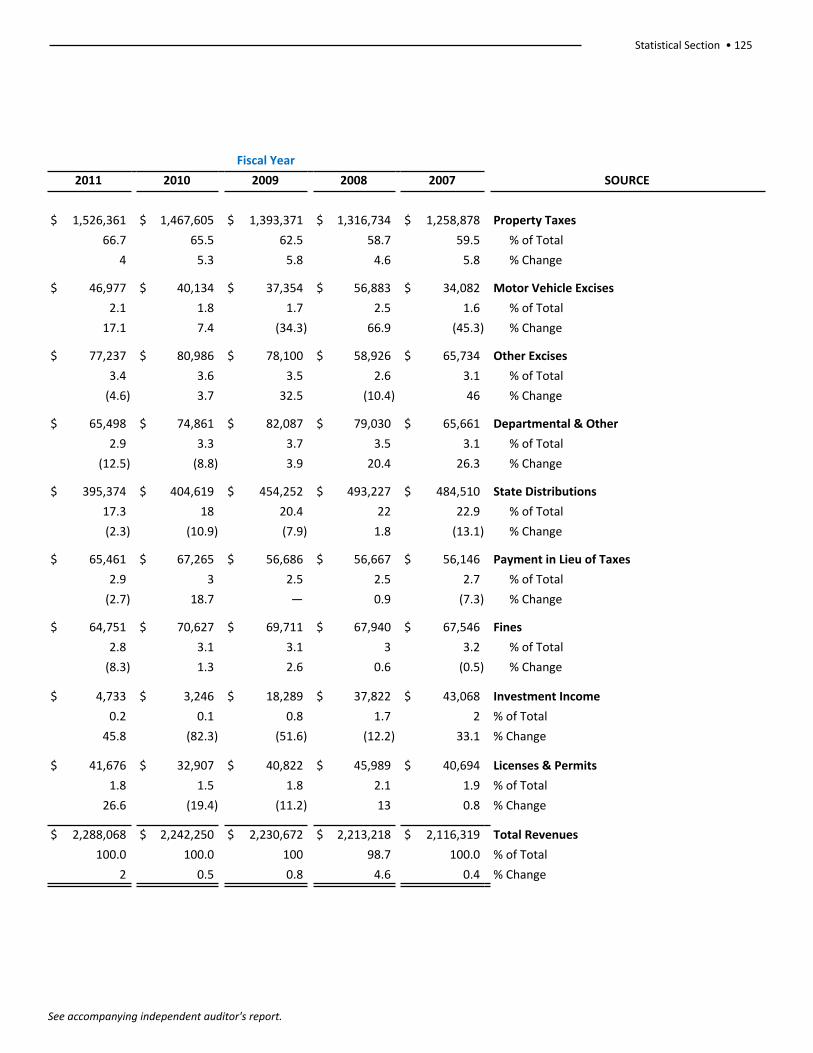
Statistical Section • 125
See accompanying independent auditor's report.
Fiscal Year
2011 2010 2009 2008 2007 SOURCE
$ 1,526,361 $ 1,467,605 $ 1,393,371 $ 1,316,734 $ 1,258,878 Property Taxes
66.7 65.5 62.5 58.7 59.5 % of Total
4 5.3 5.8 4.6 5.8 % Change
$ 46,977 $ 40,134 $ 37,354 $ 56,883 $ 34,082 Motor Vehicle Excises
2.1 1.8 1.7 2.5 1.6 % of Total
17.1 7.4 (34.3) 66.9 (45.3) % Change
$ 77,237 $ 80,986 $ 78,100 $ 58,926 $ 65,734 Other Excises
3.4 3.6 3.5 2.6 3.1 % of Total
(4.6) 3.7 32.5 (10.4) 46 % Change
$ 65,498 $ 74,861 $ 82,087 $ 79,030 $ 65,661 Departmental & Other
2.9 3.3 3.7 3.5 3.1 % of Total
(12.5) (8.8) 3.9 20.4 26.3 % Change
$ 395,374 $ 404,619 $ 454,252 $ 493,227 $ 484,510 State Distributions
17.3 18 20.4 22 22.9 % of Total
(2.3) (10.9) (7.9) 1.8 (13.1) % Change
$ 65,461 $ 67,265 $ 56,686 $ 56,667 $ 56,146 Payment in Lieu of Taxes
2.9 3 2.5 2.5 2.7 % of Total
(2.7) 18.7 — 0.9 (7.3) % Change
$ 64,751 $ 70,627 $ 69,711 $ 67,940 $ 67,546 Fines
2.8 3.1 3.1 3 3.2 % of Total
(8.3) 1.3 2.6 0.6 (0.5) % Change
$ 4,733 $ 3,246 $ 18,289 $ 37,822 $ 43,068 Investment Income
0.2 0.1 0.8 1.7 2 % of Total
45.8 (82.3) (51.6) (12.2) 33.1 % Change
$ 41,676 $ 32,907 $ 40,822 $ 45,989 $ 40,694 Licenses & Permits
1.8 1.5 1.8 2.1 1.9 % of Total
26.6 (19.4) (11.2) 13 0.8 % Change
$ 2,288,068 $ 2,242,250 $ 2,230,672 $ 2,213,218 $ 2,116,319 Total Revenues
100.0 100.0 100 98.7 100.0 % of Total
2 0.5 0.8 4.6 0.4 % Change
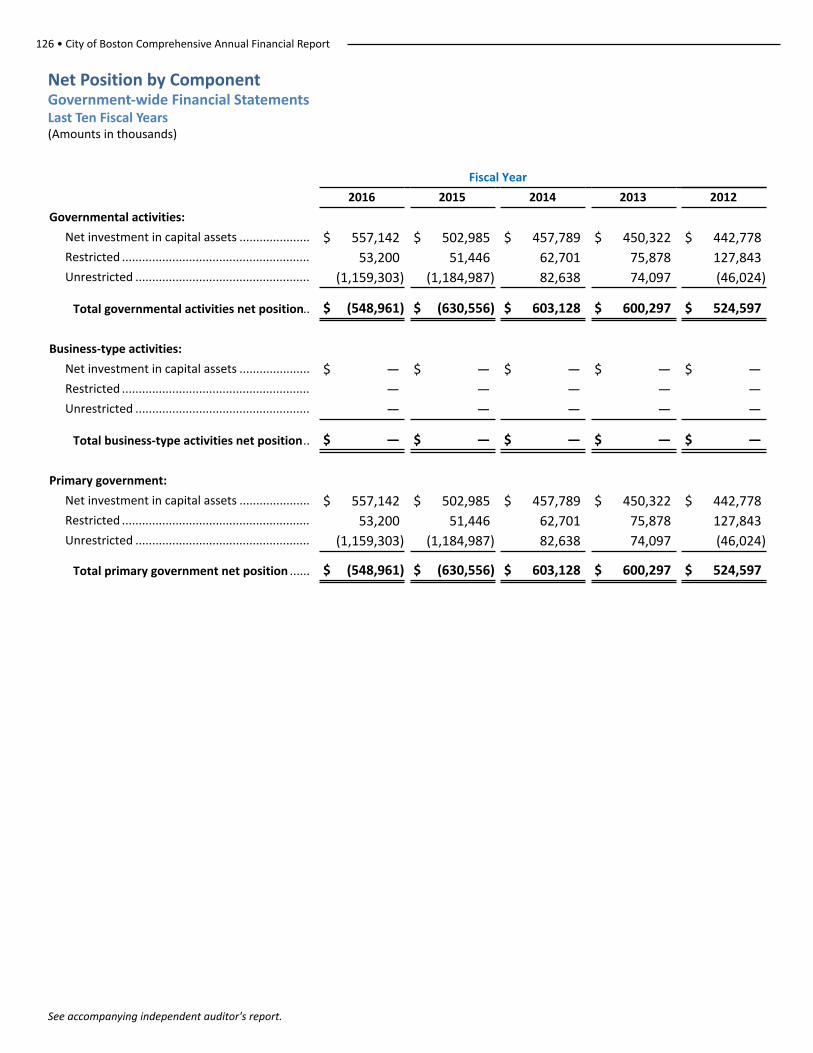
126 • City of Boston Comprehensive Annual Financial Report
See accompanying independent auditor's report.
Net Position by Component Government-wide Financial StatementsLast Ten Fiscal Years(Amounts in thousands)
Fiscal Year
2016 2015 2014 2013 2012
Governmental activities:
Net investment in capital assets ..................... $ 557,142 $ 502,985 $ 457,789 $ 450,322 $ 442,778Restricted ........................................................ 53,200 51,446 62,701 75,878 127,843Unrestricted .................................................... (1,159,303) (1,184,987) 82,638 74,097 (46,024)
Total governmental activities net position.. $ (548,961) $ (630,556) $ 603,128 $ 600,297 $ 524,597
Business-type activities:
Net investment in capital assets ..................... $ — $ — $ — $ — $ —Restricted ........................................................ — — — — —Unrestricted .................................................... — — — — —
Total business-type activities net position.. $ — $ — $ — $ — $ —
Primary government:
Net investment in capital assets ..................... $ 557,142 $ 502,985 $ 457,789 $ 450,322 $ 442,778Restricted ........................................................ 53,200 51,446 62,701 75,878 127,843Unrestricted .................................................... (1,159,303) (1,184,987) 82,638 74,097 (46,024)
Total primary government net position ...... $ (548,961) $ (630,556) $ 603,128 $ 600,297 $ 524,597
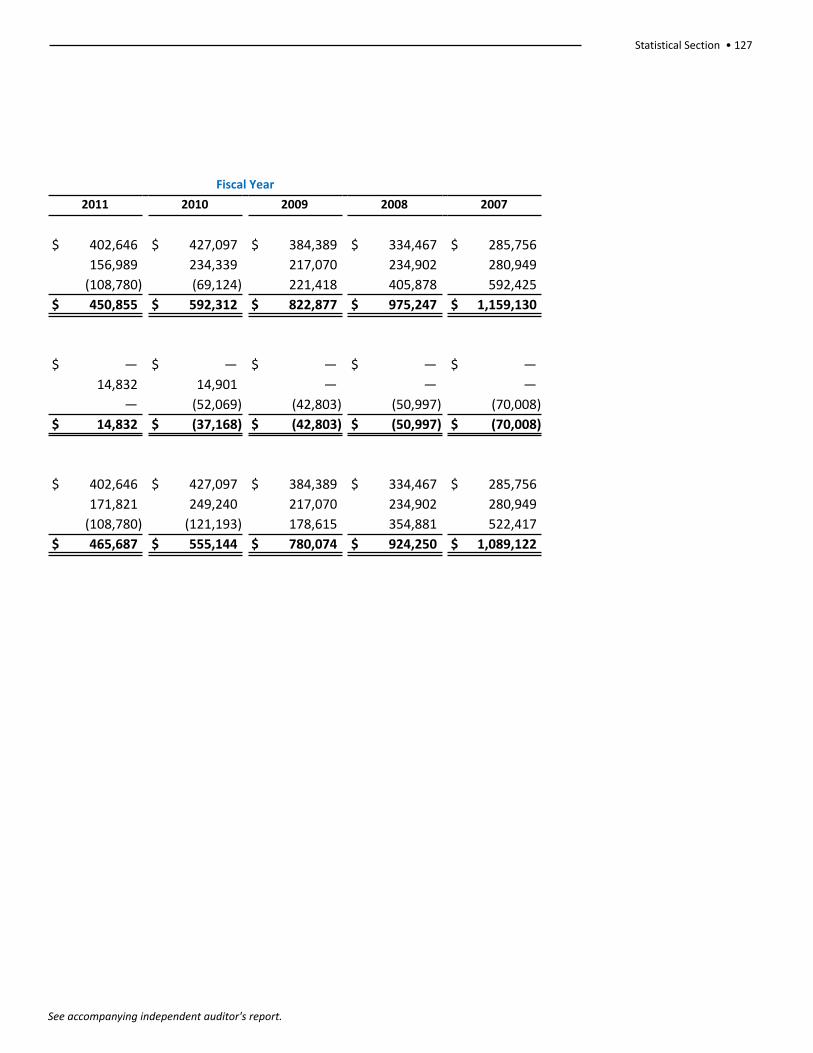
Statistical Section • 127
See accompanying independent auditor's report.
Fiscal Year
2011 2010 2009 2008 2007
$ 402,646 $ 427,097 $ 384,389 $ 334,467 $ 285,756
156,989 234,339 217,070 234,902 280,949
(108,780) (69,124) 221,418 405,878 592,425
$ 450,855 $ 592,312 $ 822,877 $ 975,247 $ 1,159,130
$ — $ — $ — $ — $ —
14,832 14,901 — — —
— (52,069) (42,803) (50,997) (70,008)
$ 14,832 $ (37,168) $ (42,803) $ (50,997) $ (70,008)
$ 402,646 $ 427,097 $ 384,389 $ 334,467 $ 285,756
171,821 249,240 217,070 234,902 280,949
(108,780) (121,193) 178,615 354,881 522,417
$ 465,687 $ 555,144 $ 780,074 $ 924,250 $ 1,089,122
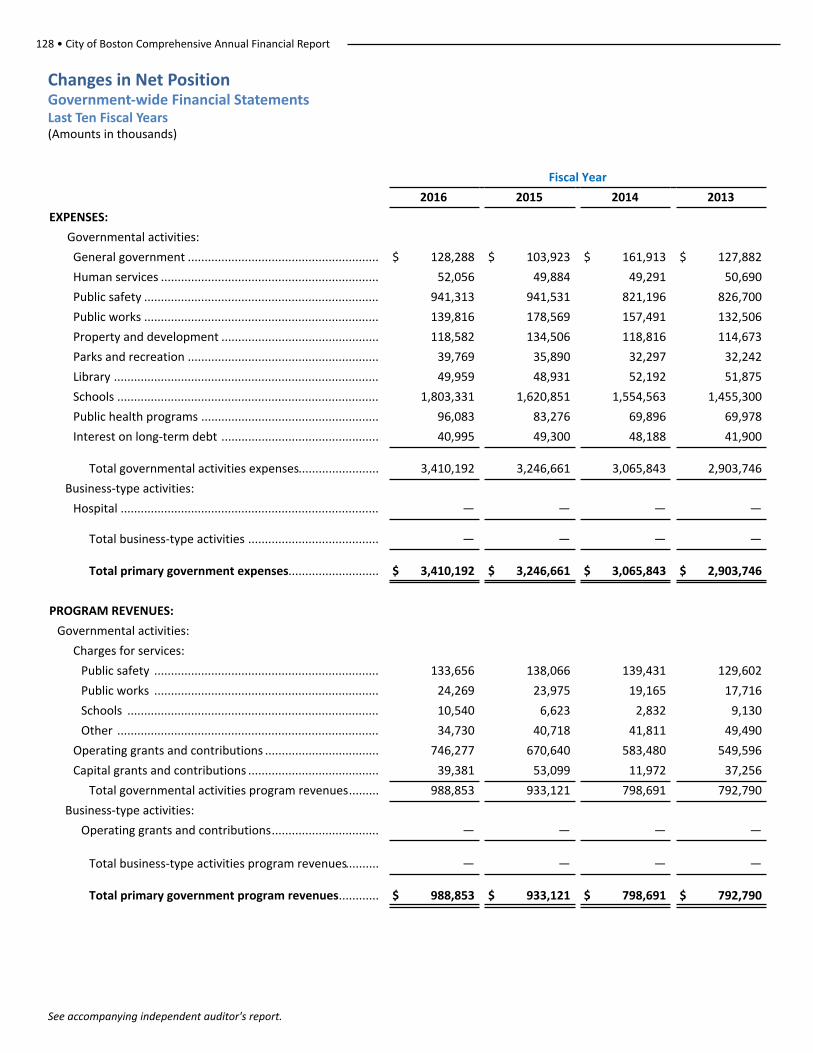
128 • City of Boston Comprehensive Annual Financial Report
See accompanying independent auditor's report.
Changes in Net Position Government-wide Financial StatementsLast Ten Fiscal Years(Amounts in thousands)
Fiscal Year
2016 2015 2014 2013
EXPENSES:
Governmental activities:
General government ......................................................... $ 128,288 $ 103,923 $ 161,913 $ 127,882
Human services ................................................................. 52,056 49,884 49,291 50,690
Public safety ...................................................................... 941,313 941,531 821,196 826,700
Public works ...................................................................... 139,816 178,569 157,491 132,506
Property and development ............................................... 118,582 134,506 118,816 114,673
Parks and recreation ......................................................... 39,769 35,890 32,297 32,242
Library ............................................................................... 49,959 48,931 52,192 51,875
Schools .............................................................................. 1,803,331 1,620,851 1,554,563 1,455,300
Public health programs ..................................................... 96,083 83,276 69,896 69,978
Interest on long-term debt ............................................... 40,995 49,300 48,188 41,900
Total governmental activities expenses........................ 3,410,192 3,246,661 3,065,843 2,903,746
Business-type activities:
Hospital ............................................................................. — — — —
Total business-type activities ....................................... — — — —
Total primary government expenses........................... $ 3,410,192 $ 3,246,661 $ 3,065,843 $ 2,903,746
PROGRAM REVENUES:
Governmental activities:
Charges for services:
Public safety ................................................................... 133,656 138,066 139,431 129,602
Public works ................................................................... 24,269 23,975 19,165 17,716
Schools ........................................................................... 10,540 6,623 2,832 9,130
Other .............................................................................. 34,730 40,718 41,811 49,490
Operating grants and contributions .................................. 746,277 670,640 583,480 549,596
Capital grants and contributions ....................................... 39,381 53,099 11,972 37,256
Total governmental activities program revenues......... 988,853 933,121 798,691 792,790
Business-type activities:
Operating grants and contributions................................ — — — —
Total business-type activities program revenues.......... — — — —
Total primary government program revenues............ $ 988,853 $ 933,121 $ 798,691 $ 792,790
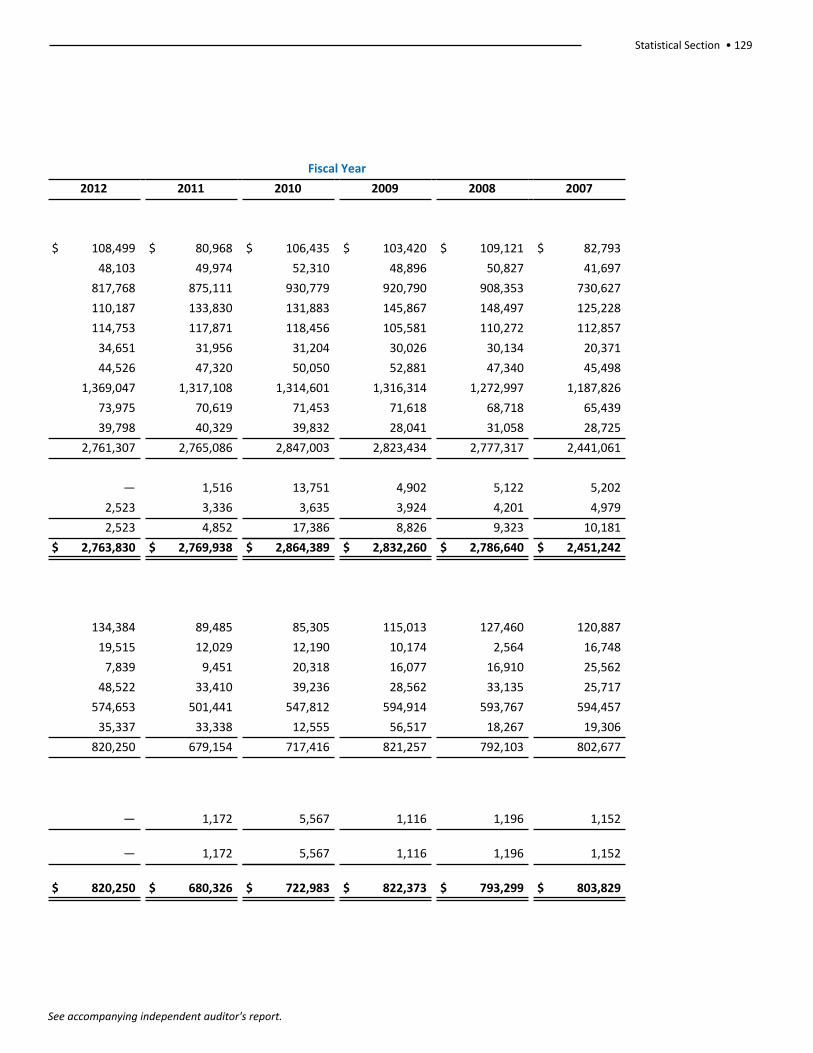
Statistical Section • 129
See accompanying independent auditor's report.
Fiscal Year
2012 2011 2010 2009 2008 2007
$ 108,499 $ 80,968 $ 106,435 $ 103,420 $ 109,121 $ 82,793
48,103 49,974 52,310 48,896 50,827 41,697
817,768 875,111 930,779 920,790 908,353 730,627
110,187 133,830 131,883 145,867 148,497 125,228
114,753 117,871 118,456 105,581 110,272 112,857
34,651 31,956 31,204 30,026 30,134 20,371
44,526 47,320 50,050 52,881 47,340 45,498
1,369,047 1,317,108 1,314,601 1,316,314 1,272,997 1,187,826
73,975 70,619 71,453 71,618 68,718 65,439
39,798 40,329 39,832 28,041 31,058 28,725
2,761,307 2,765,086 2,847,003 2,823,434 2,777,317 2,441,061
— 1,516 13,751 4,902 5,122 5,202
2,523 3,336 3,635 3,924 4,201 4,979
2,523 4,852 17,386 8,826 9,323 10,181
$ 2,763,830 $ 2,769,938 $ 2,864,389 $ 2,832,260 $ 2,786,640 $ 2,451,242
134,384 89,485 85,305 115,013 127,460 120,887
19,515 12,029 12,190 10,174 2,564 16,748
7,839 9,451 20,318 16,077 16,910 25,562
48,522 33,410 39,236 28,562 33,135 25,717
574,653 501,441 547,812 594,914 593,767 594,457
35,337 33,338 12,555 56,517 18,267 19,306
820,250 679,154 717,416 821,257 792,103 802,677
— 1,172 5,567 1,116 1,196 1,152
— 1,172 5,567 1,116 1,196 1,152
$ 820,250 $ 680,326 $ 722,983 $ 822,373 $ 793,299 $ 803,829
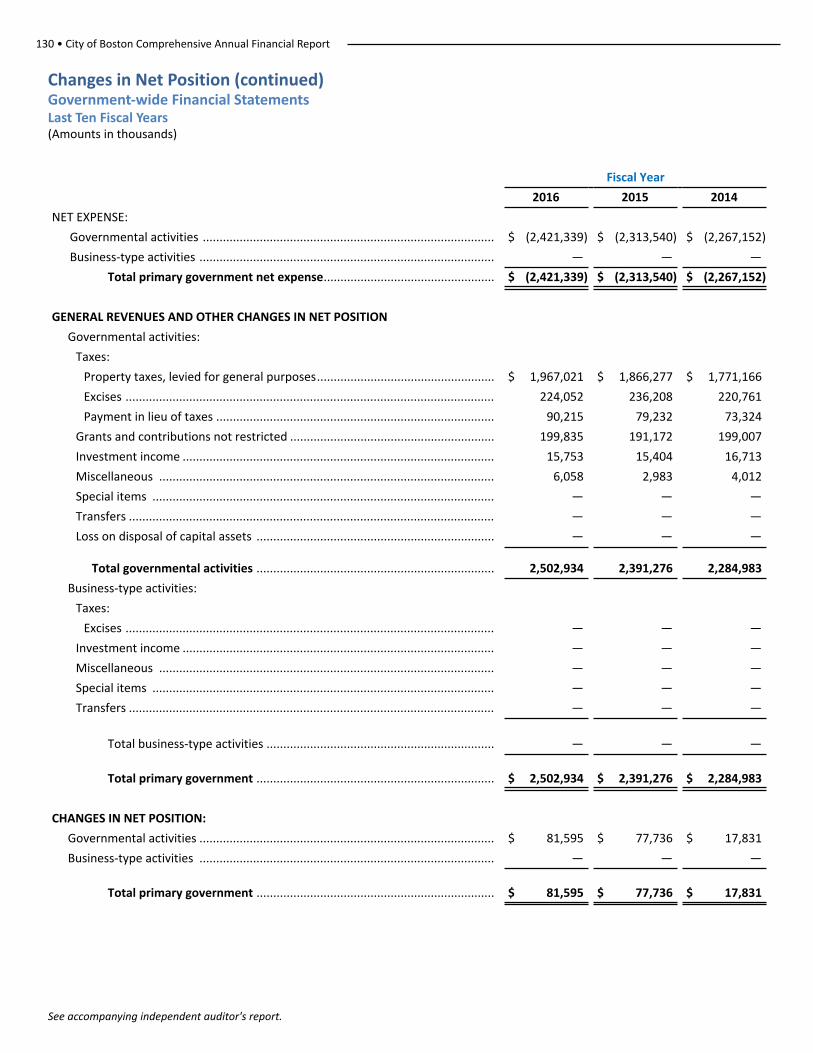
130 • City of Boston Comprehensive Annual Financial Report
See accompanying independent auditor's report.
Changes in Net Position (continued)Government-wide Financial StatementsLast Ten Fiscal Years(Amounts in thousands)
Fiscal Year
2016 2015 2014
NET EXPENSE:
Governmental activities ....................................................................................... $ (2,421,339) $ (2,313,540) $ (2,267,152)
Business-type activities ........................................................................................ — — —
Total primary government net expense................................................... $ (2,421,339) $ (2,313,540) $ (2,267,152)
GENERAL REVENUES AND OTHER CHANGES IN NET POSITION
Governmental activities:
Taxes:
Property taxes, levied for general purposes..................................................... $ 1,967,021 $ 1,866,277 $ 1,771,166
Excises .............................................................................................................. 224,052 236,208 220,761
Payment in lieu of taxes ................................................................................... 90,215 79,232 73,324
Grants and contributions not restricted ............................................................. 199,835 191,172 199,007
Investment income ............................................................................................. 15,753 15,404 16,713
Miscellaneous .................................................................................................... 6,058 2,983 4,012
Special items ...................................................................................................... — — —
Transfers ............................................................................................................. — — —
Loss on disposal of capital assets ....................................................................... — — —
Total governmental activities ....................................................................... 2,502,934 2,391,276 2,284,983
Business-type activities:
Taxes:
Excises .............................................................................................................. — — —
Investment income ............................................................................................. — — —
Miscellaneous .................................................................................................... — — —
Special items ...................................................................................................... — — —
Transfers ............................................................................................................. — — —
Total business-type activities .................................................................... — — —
Total primary government ....................................................................... $ 2,502,934 $ 2,391,276 $ 2,284,983
CHANGES IN NET POSITION:
Governmental activities ........................................................................................ $ 81,595 $ 77,736 $ 17,831
Business-type activities ........................................................................................ — — —
Total primary government ....................................................................... $ 81,595 $ 77,736 $ 17,831
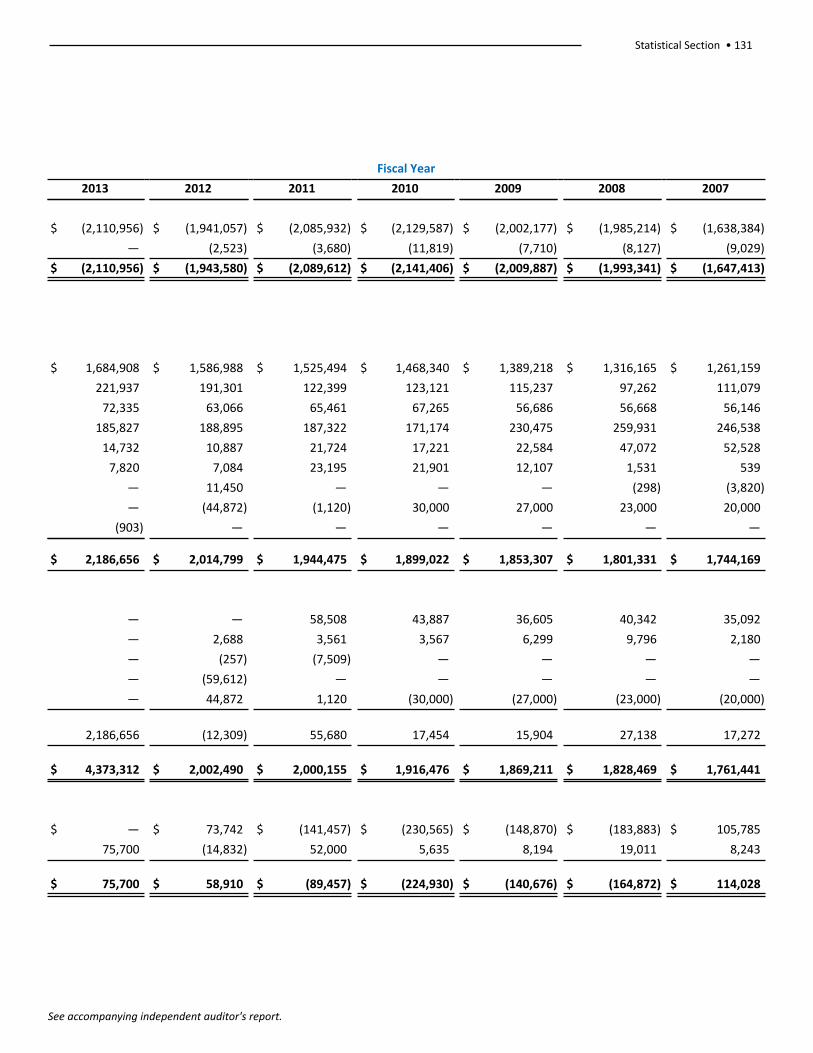
Statistical Section • 131
See accompanying independent auditor's report.
Fiscal Year
2013 2012 2011 2010 2009 2008 2007
$ (2,110,956) $ (1,941,057) $ (2,085,932) $ (2,129,587) $ (2,002,177) $ (1,985,214) $ (1,638,384)
— (2,523) (3,680) (11,819) (7,710) (8,127) (9,029)
$ (2,110,956) $ (1,943,580) $ (2,089,612) $ (2,141,406) $ (2,009,887) $ (1,993,341) $ (1,647,413)
$ 1,684,908 $ 1,586,988 $ 1,525,494 $ 1,468,340 $ 1,389,218 $ 1,316,165 $ 1,261,159
221,937 191,301 122,399 123,121 115,237 97,262 111,079
72,335 63,066 65,461 67,265 56,686 56,668 56,146
185,827 188,895 187,322 171,174 230,475 259,931 246,538
14,732 10,887 21,724 17,221 22,584 47,072 52,528
7,820 7,084 23,195 21,901 12,107 1,531 539
— 11,450 — — — (298) (3,820)
— (44,872) (1,120) 30,000 27,000 23,000 20,000
(903) — — — — — —
$ 2,186,656 $ 2,014,799 $ 1,944,475 $ 1,899,022 $ 1,853,307 $ 1,801,331 $ 1,744,169
— — 58,508 43,887 36,605 40,342 35,092
— 2,688 3,561 3,567 6,299 9,796 2,180
— (257) (7,509) — — — —
— (59,612) — — — — —
— 44,872 1,120 (30,000) (27,000) (23,000) (20,000)
2,186,656 (12,309) 55,680 17,454 15,904 27,138 17,272
$ 4,373,312 $ 2,002,490 $ 2,000,155 $ 1,916,476 $ 1,869,211 $ 1,828,469 $ 1,761,441
$ — $ 73,742 $ (141,457) $ (230,565) $ (148,870) $ (183,883) $ 105,785
75,700 (14,832) 52,000 5,635 8,194 19,011 8,243
$ 75,700 $ 58,910 $ (89,457) $ (224,930) $ (140,676) $ (164,872) $ 114,028
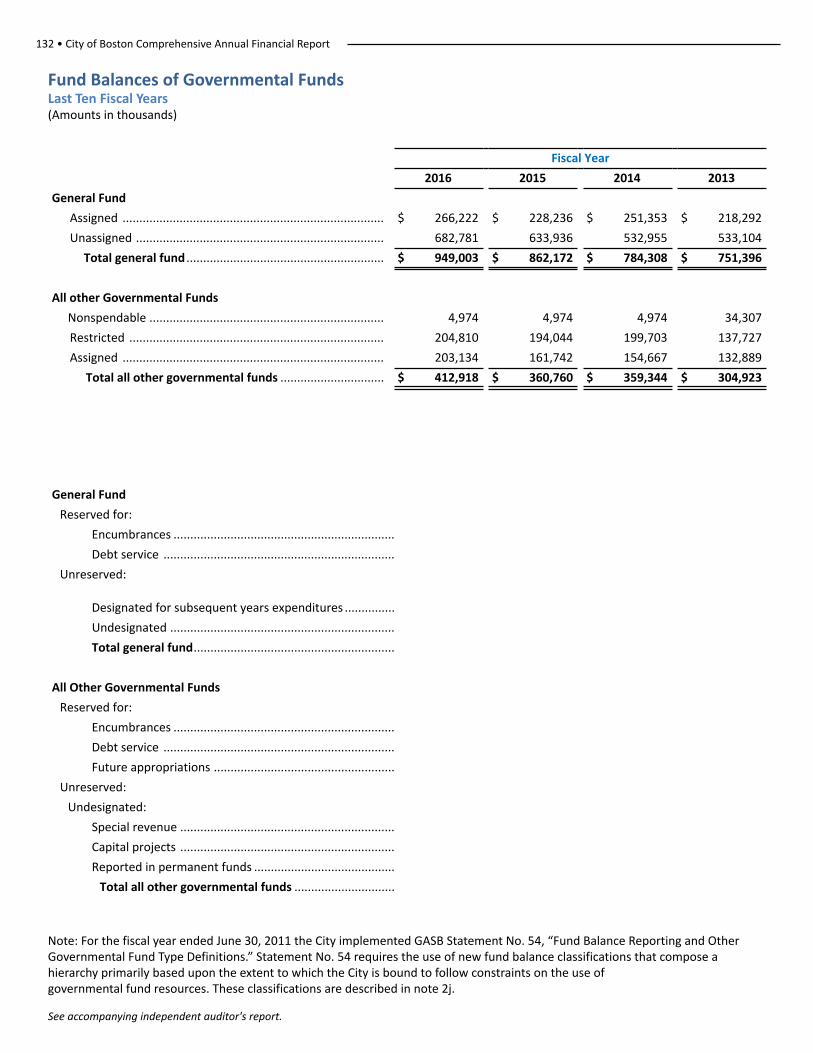
132 • City of Boston Comprehensive Annual Financial Report
See accompanying independent auditor's report.
Fund Balances of Governmental FundsLast Ten Fiscal Years(Amounts in thousands)
Fiscal Year
2016 2015 2014 2013
General Fund
Assigned .............................................................................. $ 266,222 $ 228,236 $ 251,353 $ 218,292
Unassigned .......................................................................... 682,781 633,936 532,955 533,104
Total general fund ........................................................... $ 949,003 $ 862,172 $ 784,308 $ 751,396
All other Governmental Funds
Nonspendable ...................................................................... 4,974 4,974 4,974 34,307
Restricted ............................................................................ 204,810 194,044 199,703 137,727
Assigned .............................................................................. 203,134 161,742 154,667 132,889
Total all other governmental funds ............................... $ 412,918 $ 360,760 $ 359,344 $ 304,923
General Fund
Reserved for:
Encumbrances ..................................................................
Debt service .....................................................................
Unreserved:
Designated for subsequent years expenditures ...............
Undesignated ...................................................................
Total general fund............................................................
All Other Governmental Funds
Reserved for:
Encumbrances ..................................................................
Debt service .....................................................................
Future appropriations ......................................................
Unreserved:
Undesignated:
Special revenue ................................................................
Capital projects ................................................................
Reported in permanent funds ..........................................
Total all other governmental funds ..............................
Note: For the fiscal year ended June 30, 2011 the City implemented GASB Statement No. 54, “Fund Balance Reporting and Other Governmental Fund Type Definitions.” Statement No. 54 requires the use of new fund balance classifications that compose a hierarchy primarily based upon the extent to which the City is bound to follow constraints on the use ofgovernmental fund resources. These classifications are described in note 2j.
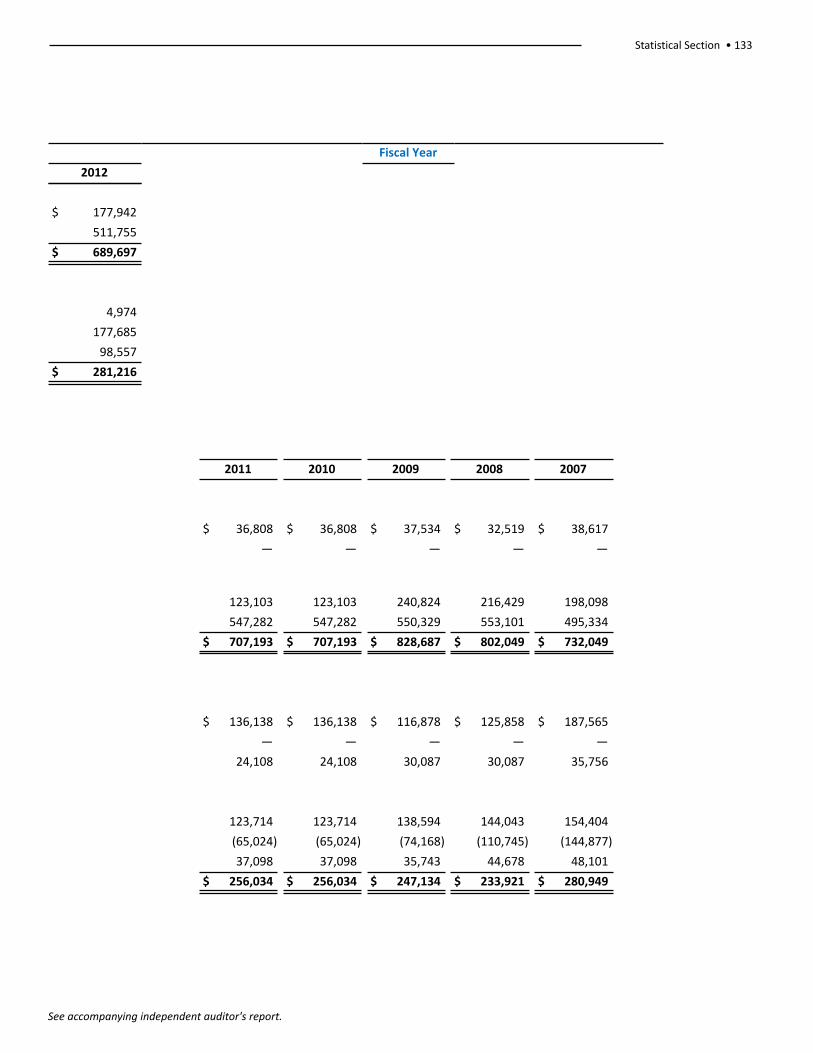
Statistical Section • 133
See accompanying independent auditor's report.
Fiscal Year
2012
$ 177,942
511,755
$ 689,697
4,974
177,685
98,557
$ 281,216
2011 2010 2009 2008 2007
$ 36,808 $ 36,808 $ 37,534 $ 32,519 $ 38,617
— — — — —
123,103 123,103 240,824 216,429 198,098
547,282 547,282 550,329 553,101 495,334
$ 707,193 $ 707,193 $ 828,687 $ 802,049 $ 732,049
$ 136,138 $ 136,138 $ 116,878 $ 125,858 $ 187,565
— — — — —
24,108 24,108 30,087 30,087 35,756
123,714 123,714 138,594 144,043 154,404
(65,024) (65,024) (74,168) (110,745) (144,877)
37,098 37,098 35,743 44,678 48,101
$ 256,034 $ 256,034 $ 247,134 $ 233,921 $ 280,949
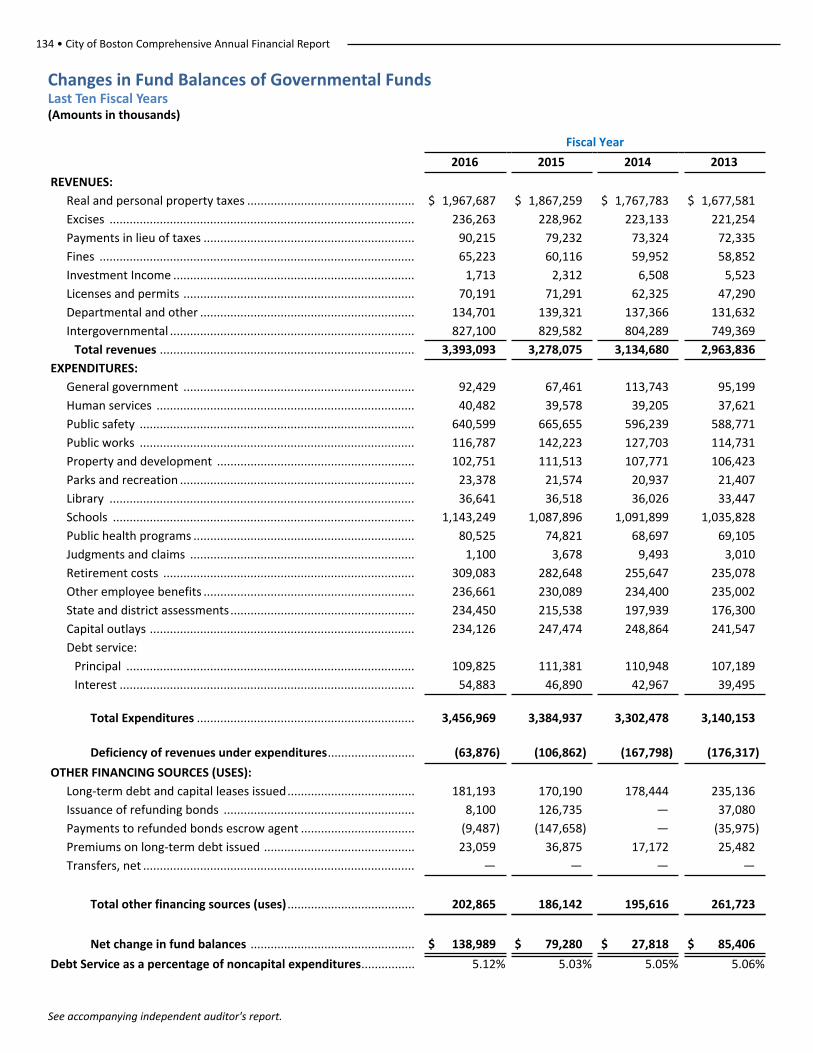
134 • City of Boston Comprehensive Annual Financial Report
See accompanying independent auditor's report.
Changes in Fund Balances of Governmental Funds Last Ten Fiscal Years(Amounts in thousands)
Fiscal Year
2016 2015 2014 2013
REVENUES:
Real and personal property taxes .................................................. $ 1,967,687 $ 1,867,259 $ 1,767,783 $ 1,677,581
Excises ........................................................................................... 236,263 228,962 223,133 221,254
Payments in lieu of taxes ............................................................... 90,215 79,232 73,324 72,335
Fines .............................................................................................. 65,223 60,116 59,952 58,852
Investment Income ........................................................................ 1,713 2,312 6,508 5,523
Licenses and permits ..................................................................... 70,191 71,291 62,325 47,290
Departmental and other ................................................................ 134,701 139,321 137,366 131,632
Intergovernmental ......................................................................... 827,100 829,582 804,289 749,369
Total revenues ............................................................................ 3,393,093 3,278,075 3,134,680 2,963,836
EXPENDITURES:
General government ..................................................................... 92,429 67,461 113,743 95,199
Human services ............................................................................. 40,482 39,578 39,205 37,621
Public safety .................................................................................. 640,599 665,655 596,239 588,771
Public works .................................................................................. 116,787 142,223 127,703 114,731
Property and development ........................................................... 102,751 111,513 107,771 106,423
Parks and recreation ...................................................................... 23,378 21,574 20,937 21,407
Library ........................................................................................... 36,641 36,518 36,026 33,447
Schools .......................................................................................... 1,143,249 1,087,896 1,091,899 1,035,828
Public health programs .................................................................. 80,525 74,821 68,697 69,105
Judgments and claims ................................................................... 1,100 3,678 9,493 3,010
Retirement costs ........................................................................... 309,083 282,648 255,647 235,078
Other employee benefits ............................................................... 236,661 230,089 234,400 235,002
State and district assessments....................................................... 234,450 215,538 197,939 176,300
Capital outlays ............................................................................... 234,126 247,474 248,864 241,547
Debt service:
Principal ...................................................................................... 109,825 111,381 110,948 107,189
Interest ........................................................................................ 54,883 46,890 42,967 39,495
Total Expenditures ................................................................. 3,456,969 3,384,937 3,302,478 3,140,153
Deficiency of revenues under expenditures.......................... (63,876) (106,862) (167,798) (176,317)
OTHER FINANCING SOURCES (USES):
Long-term debt and capital leases issued...................................... 181,193 170,190 178,444 235,136
Issuance of refunding bonds ......................................................... 8,100 126,735 — 37,080
Payments to refunded bonds escrow agent .................................. (9,487) (147,658) — (35,975)
Premiums on long-term debt issued ............................................. 23,059 36,875 17,172 25,482
Transfers, net ................................................................................. — — — —
Total other financing sources (uses) ...................................... 202,865 186,142 195,616 261,723
Net change in fund balances ................................................. $ 138,989 $ 79,280 $ 27,818 $ 85,406
Debt Service as a percentage of noncapital expenditures................ 5.12% 5.03% 5.05% 5.06%
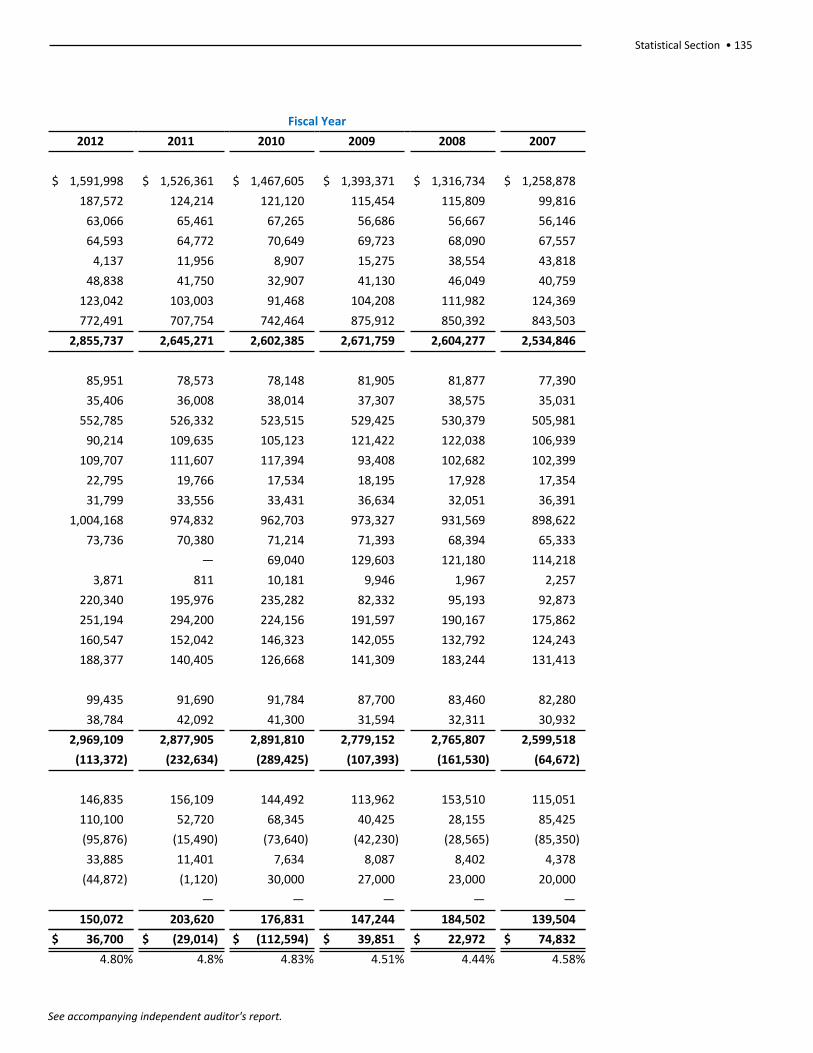
Statistical Section • 135
See accompanying independent auditor's report.
Fiscal Year
2012 2011 2010 2009 2008 2007
$ 1,591,998 $ 1,526,361 $ 1,467,605 $ 1,393,371 $ 1,316,734 $ 1,258,878
187,572 124,214 121,120 115,454 115,809 99,816
63,066 65,461 67,265 56,686 56,667 56,146
64,593 64,772 70,649 69,723 68,090 67,557
4,137 11,956 8,907 15,275 38,554 43,818
48,838 41,750 32,907 41,130 46,049 40,759
123,042 103,003 91,468 104,208 111,982 124,369
772,491 707,754 742,464 875,912 850,392 843,503
2,855,737 2,645,271 2,602,385 2,671,759 2,604,277 2,534,846
85,951 78,573 78,148 81,905 81,877 77,390
35,406 36,008 38,014 37,307 38,575 35,031
552,785 526,332 523,515 529,425 530,379 505,981
90,214 109,635 105,123 121,422 122,038 106,939
109,707 111,607 117,394 93,408 102,682 102,399
22,795 19,766 17,534 18,195 17,928 17,354
31,799 33,556 33,431 36,634 32,051 36,391
1,004,168 974,832 962,703 973,327 931,569 898,622
73,736 70,380 71,214 71,393 68,394 65,333
— 69,040 129,603 121,180 114,218
3,871 811 10,181 9,946 1,967 2,257
220,340 195,976 235,282 82,332 95,193 92,873
251,194 294,200 224,156 191,597 190,167 175,862
160,547 152,042 146,323 142,055 132,792 124,243
188,377 140,405 126,668 141,309 183,244 131,413
99,435 91,690 91,784 87,700 83,460 82,280
38,784 42,092 41,300 31,594 32,311 30,932
2,969,109 2,877,905 2,891,810 2,779,152 2,765,807 2,599,518
(113,372) (232,634) (289,425) (107,393) (161,530) (64,672)
146,835 156,109 144,492 113,962 153,510 115,051
110,100 52,720 68,345 40,425 28,155 85,425
(95,876) (15,490) (73,640) (42,230) (28,565) (85,350)
33,885 11,401 7,634 8,087 8,402 4,378
(44,872) (1,120) 30,000 27,000 23,000 20,000
— — — — —
150,072 203,620 176,831 147,244 184,502 139,504
$ 36,700 $ (29,014) $ (112,594) $ 39,851 $ 22,972 $ 74,832
4.80% 4.8% 4.83% 4.51% 4.44% 4.58%
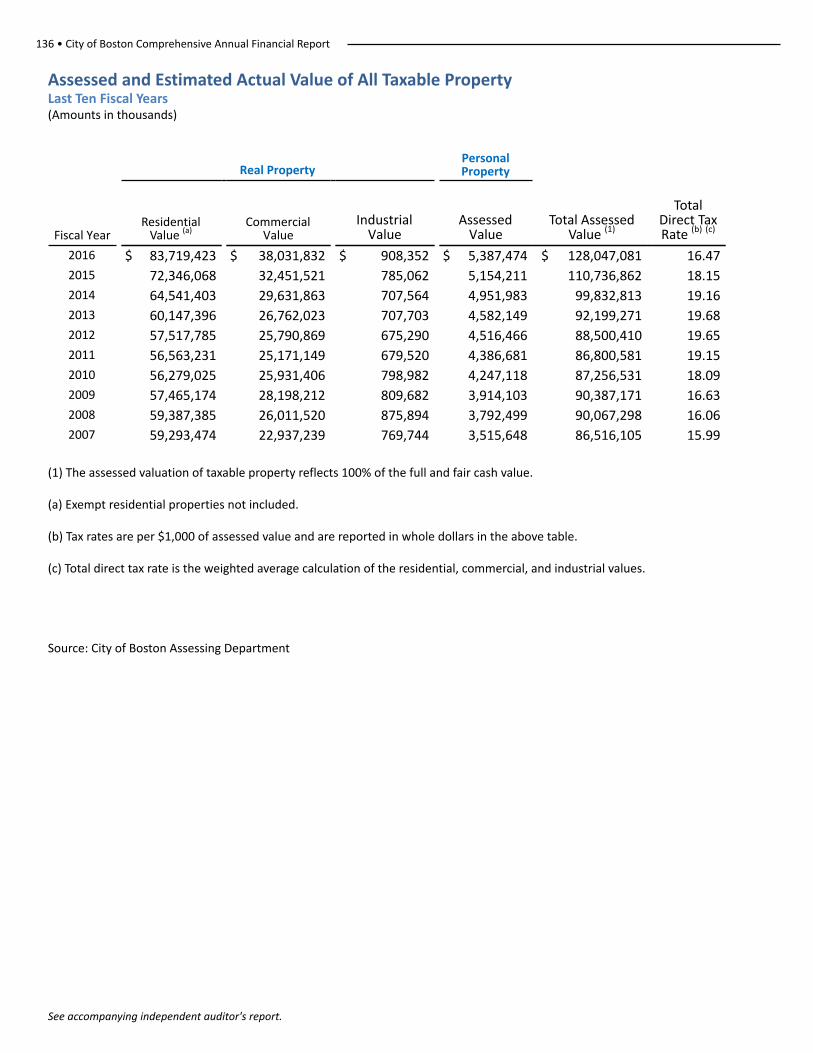
136 • City of Boston Comprehensive Annual Financial Report
See accompanying independent auditor's report.
Assessed and Estimated Actual Value of All Taxable PropertyLast Ten Fiscal Years(Amounts in thousands)
Real PropertyPersonalProperty
Fiscal YearResidential
Value (a)Commercial
ValueIndustrial
ValueAssessed
ValueTotal Assessed
Value (1)
Total Direct Tax Rate (b) (c)
2016 $ 83,719,423 $ 38,031,832 $ 908,352 $ 5,387,474 $ 128,047,081 16.472015 72,346,068 32,451,521 785,062 5,154,211 110,736,862 18.152014 64,541,403 29,631,863 707,564 4,951,983 99,832,813 19.162013 60,147,396 26,762,023 707,703 4,582,149 92,199,271 19.682012 57,517,785 25,790,869 675,290 4,516,466 88,500,410 19.652011 56,563,231 25,171,149 679,520 4,386,681 86,800,581 19.152010 56,279,025 25,931,406 798,982 4,247,118 87,256,531 18.092009 57,465,174 28,198,212 809,682 3,914,103 90,387,171 16.632008 59,387,385 26,011,520 875,894 3,792,499 90,067,298 16.062007 59,293,474 22,937,239 769,744 3,515,648 86,516,105 15.99
(1) The assessed valuation of taxable property reflects 100% of the full and fair cash value.
(a) Exempt residential properties not included.
(b) Tax rates are per $1,000 of assessed value and are reported in whole dollars in the above table.
(c) Total direct tax rate is the weighted average calculation of the residential, commercial, and industrial values.
Source: City of Boston Assessing Department
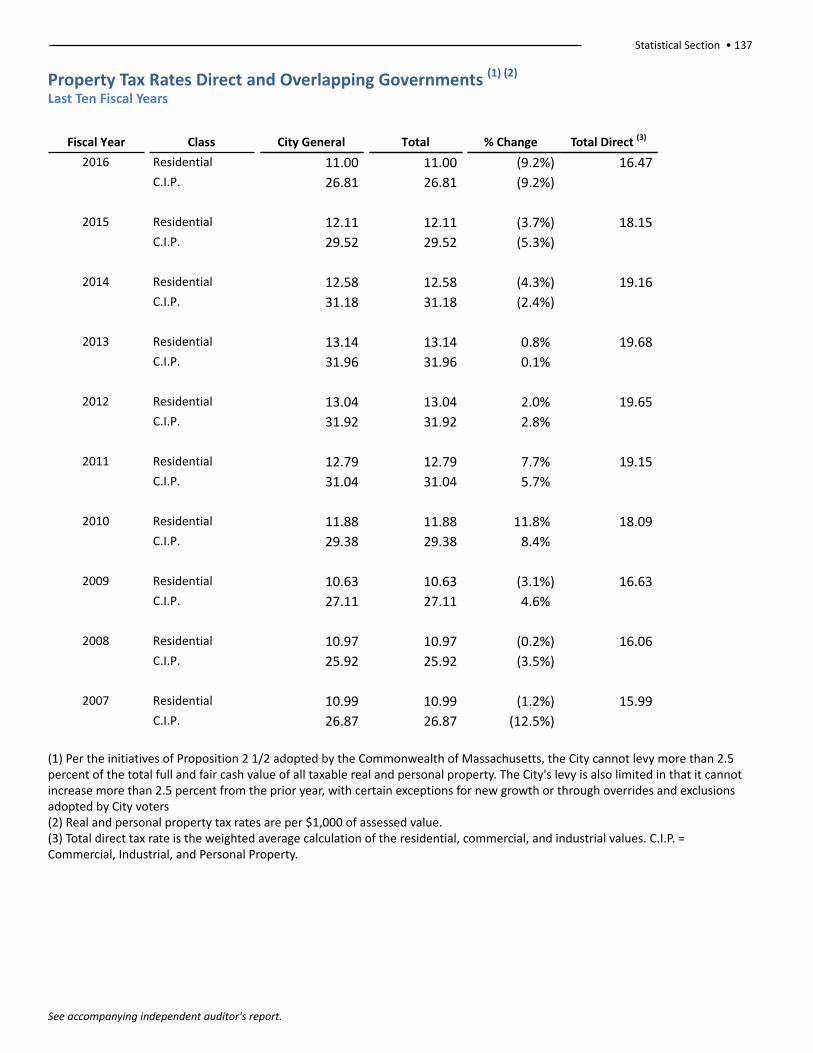
Statistical Section • 137
See accompanying independent auditor's report.
Property Tax Rates Direct and Overlapping Governments (1) (2)
Last Ten Fiscal Years
Fiscal Year Class City General Total % Change Total Direct (3)
2016 Residential 11.00 11.00 (9.2%) 16.47C.I.P. 26.81 26.81 (9.2%)
2015 Residential 12.11 12.11 (3.7%) 18.15C.I.P. 29.52 29.52 (5.3%)
2014 Residential 12.58 12.58 (4.3%) 19.16C.I.P. 31.18 31.18 (2.4%)
2013 Residential 13.14 13.14 0.8% 19.68C.I.P. 31.96 31.96 0.1%
2012 Residential 13.04 13.04 2.0% 19.65C.I.P. 31.92 31.92 2.8%
2011 Residential 12.79 12.79 7.7% 19.15C.I.P. 31.04 31.04 5.7%
2010 Residential 11.88 11.88 11.8% 18.09C.I.P. 29.38 29.38 8.4%
2009 Residential 10.63 10.63 (3.1%) 16.63C.I.P. 27.11 27.11 4.6%
2008 Residential 10.97 10.97 (0.2%) 16.06C.I.P. 25.92 25.92 (3.5%)
2007 Residential 10.99 10.99 (1.2%) 15.99C.I.P. 26.87 26.87 (12.5%)
(1) Per the initiatives of Proposition 2 1/2 adopted by the Commonwealth of Massachusetts, the City cannot levy more than 2.5 percent of the total full and fair cash value of all taxable real and personal property. The City's levy is also limited in that it cannot increase more than 2.5 percent from the prior year, with certain exceptions for new growth or through overrides and exclusions adopted by City voters(2) Real and personal property tax rates are per $1,000 of assessed value.(3) Total direct tax rate is the weighted average calculation of the residential, commercial, and industrial values. C.I.P. =Commercial, Industrial, and Personal Property.
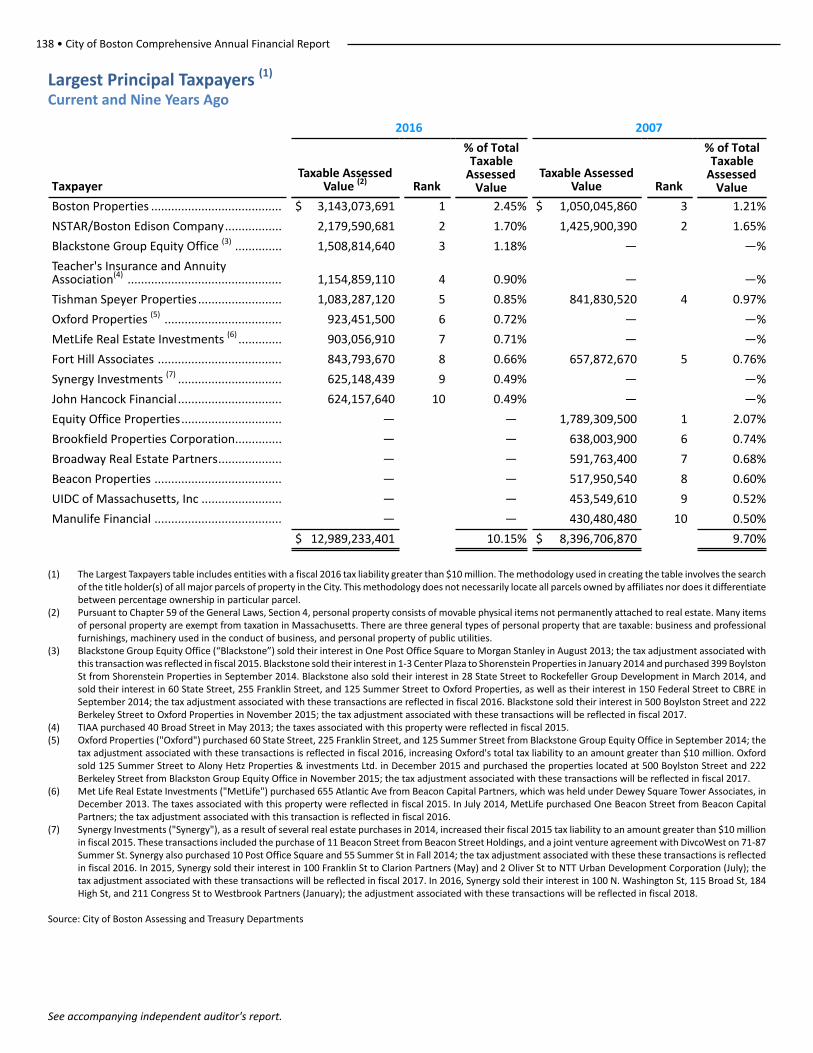
138 • City of Boston Comprehensive Annual Financial Report
See accompanying independent auditor's report.
Largest Principal Taxpayers (1)
Current and Nine Years Ago
2016 2007
TaxpayerTaxable Assessed
Value (2) Rank
% of TotalTaxable
AssessedValue
Taxable AssessedValue Rank
% of TotalTaxable
AssessedValue
Boston Properties ....................................... $ 3,143,073,691 1 2.45% $ 1,050,045,860 3 1.21%
NSTAR/Boston Edison Company................. 2,179,590,681 2 1.70% 1,425,900,390 2 1.65%
Blackstone Group Equity Office (3) .............. 1,508,814,640 3 1.18% — —%
Teacher's Insurance and Annuity Association(4) .............................................. 1,154,859,110 4 0.90% — —%
Tishman Speyer Properties ......................... 1,083,287,120 5 0.85% 841,830,520 4 0.97%
Oxford Properties (5) ................................... 923,451,500 6 0.72% — —%
MetLife Real Estate Investments (6) ............. 903,056,910 7 0.71% — —%
Fort Hill Associates ..................................... 843,793,670 8 0.66% 657,872,670 5 0.76%
Synergy Investments (7) ............................... 625,148,439 9 0.49% — —%
John Hancock Financial ............................... 624,157,640 10 0.49% — —%
Equity Office Properties.............................. — — 1,789,309,500 1 2.07%
Brookfield Properties Corporation.............. — — 638,003,900 6 0.74%
Broadway Real Estate Partners................... — — 591,763,400 7 0.68%
Beacon Properties ...................................... — — 517,950,540 8 0.60%
UIDC of Massachusetts, Inc ........................ — — 453,549,610 9 0.52%
Manulife Financial ...................................... — — 430,480,480 10 0.50%
$ 12,989,233,401 10.15% $ 8,396,706,870 9.70%
(1) The Largest Taxpayers table includes entities with a fiscal 2016 tax liability greater than $10 million. The methodology used in creating the table involves the search of the title holder(s) of all major parcels of property in the City. This methodology does not necessarily locate all parcels owned by affiliates nor does it differentiate between percentage ownership in particular parcel.
(2) Pursuant to Chapter 59 of the General Laws, Section 4, personal property consists of movable physical items not permanently attached to real estate. Many items of personal property are exempt from taxation in Massachusetts. There are three general types of personal property that are taxable: business and professional furnishings, machinery used in the conduct of business, and personal property of public utilities.
(3) Blackstone Group Equity Office (“Blackstone”) sold their interest in One Post Office Square to Morgan Stanley in August 2013; the tax adjustment associated with this transaction was reflected in fiscal 2015. Blackstone sold their interest in 1-3 Center Plaza to Shorenstein Properties in January 2014 and purchased 399 Boylston St from Shorenstein Properties in September 2014. Blackstone also sold their interest in 28 State Street to Rockefeller Group Development in March 2014, and sold their interest in 60 State Street, 255 Franklin Street, and 125 Summer Street to Oxford Properties, as well as their interest in 150 Federal Street to CBRE in September 2014; the tax adjustment associated with these transactions are reflected in fiscal 2016. Blackstone sold their interest in 500 Boylston Street and 222 Berkeley Street to Oxford Properties in November 2015; the tax adjustment associated with these transactions will be reflected in fiscal 2017.
(4) TIAA purchased 40 Broad Street in May 2013; the taxes associated with this property were reflected in fiscal 2015.(5) Oxford Properties ("Oxford") purchased 60 State Street, 225 Franklin Street, and 125 Summer Street from Blackstone Group Equity Office in September 2014; the
tax adjustment associated with these transactions is reflected in fiscal 2016, increasing Oxford's total tax liability to an amount greater than $10 million. Oxford sold 125 Summer Street to Alony Hetz Properties & investments Ltd. in December 2015 and purchased the properties located at 500 Boylston Street and 222 Berkeley Street from Blackston Group Equity Office in November 2015; the tax adjustment associated with these transactions will be reflected in fiscal 2017.
(6) Met Life Real Estate Investments ("MetLife") purchased 655 Atlantic Ave from Beacon Capital Partners, which was held under Dewey Square Tower Associates, in December 2013. The taxes associated with this property were reflected in fiscal 2015. In July 2014, MetLife purchased One Beacon Street from Beacon Capital Partners; the tax adjustment associated with this transaction is reflected in fiscal 2016.
(7) Synergy Investments ("Synergy"), as a result of several real estate purchases in 2014, increased their fiscal 2015 tax liability to an amount greater than $10 million in fiscal 2015. These transactions included the purchase of 11 Beacon Street from Beacon Street Holdings, and a joint venture agreement with DivcoWest on 71-87 Summer St. Synergy also purchased 10 Post Office Square and 55 Summer St in Fall 2014; the tax adjustment associated with these these transactions is reflected in fiscal 2016. In 2015, Synergy sold their interest in 100 Franklin St to Clarion Partners (May) and 2 Oliver St to NTT Urban Development Corporation (July); the tax adjustment associated with these transactions will be reflected in fiscal 2017. In 2016, Synergy sold their interest in 100 N. Washington St, 115 Broad St, 184 High St, and 211 Congress St to Westbrook Partners (January); the adjustment associated with these transactions will be reflected in fiscal 2018.
Source: City of Boston Assessing and Treasury Departments
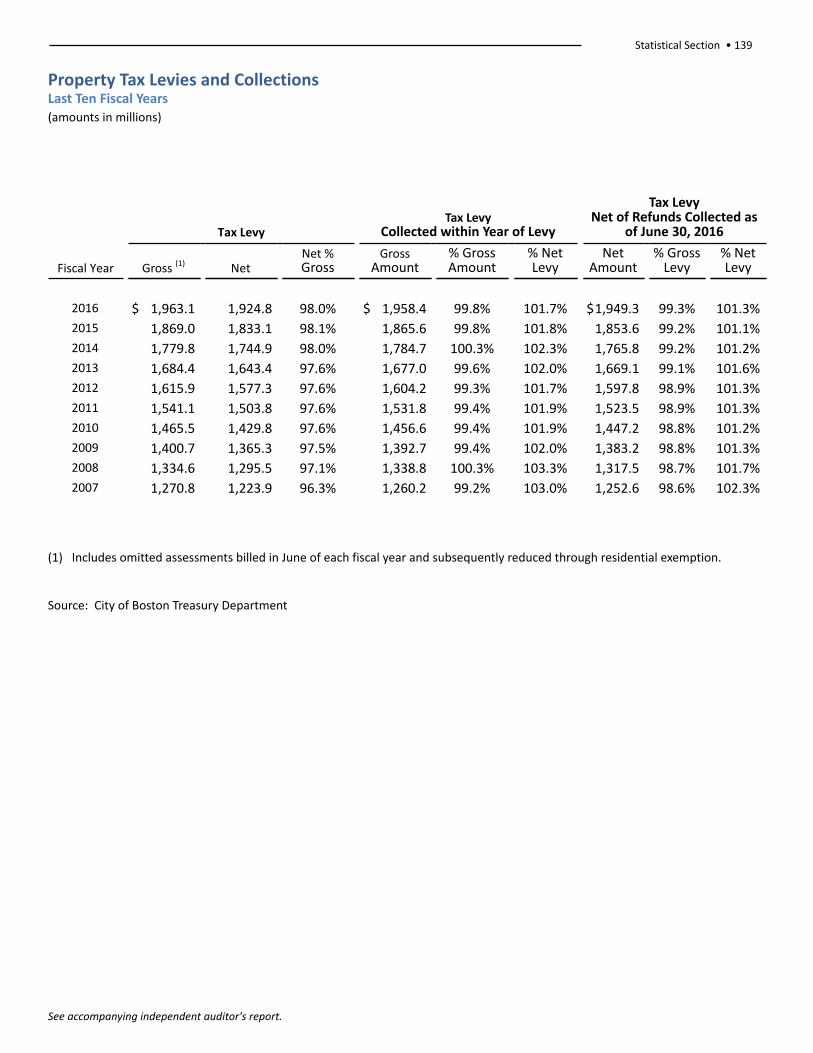
Statistical Section • 139
See accompanying independent auditor's report.
Property Tax Levies and CollectionsLast Ten Fiscal Years(amounts in millions)
Tax LevyTax Levy
Collected within Year of Levy
Tax Levy Net of Refunds Collected as
of June 30, 2016
Fiscal Year Gross (1) NetNet % Gross
Gross Amount
% GrossAmount
% NetLevy
NetAmount
% GrossLevy
% NetLevy
2016 $ 1,963.1 1,924.8 98.0% $ 1,958.4 99.8% 101.7% $1,949.3 99.3% 101.3%2015 1,869.0 1,833.1 98.1% 1,865.6 99.8% 101.8% 1,853.6 99.2% 101.1%2014 1,779.8 1,744.9 98.0% 1,784.7 100.3% 102.3% 1,765.8 99.2% 101.2%2013 1,684.4 1,643.4 97.6% 1,677.0 99.6% 102.0% 1,669.1 99.1% 101.6%2012 1,615.9 1,577.3 97.6% 1,604.2 99.3% 101.7% 1,597.8 98.9% 101.3%2011 1,541.1 1,503.8 97.6% 1,531.8 99.4% 101.9% 1,523.5 98.9% 101.3%2010 1,465.5 1,429.8 97.6% 1,456.6 99.4% 101.9% 1,447.2 98.8% 101.2%2009 1,400.7 1,365.3 97.5% 1,392.7 99.4% 102.0% 1,383.2 98.8% 101.3%2008 1,334.6 1,295.5 97.1% 1,338.8 100.3% 103.3% 1,317.5 98.7% 101.7%2007 1,270.8 1,223.9 96.3% 1,260.2 99.2% 103.0% 1,252.6 98.6% 102.3%
(1) Includes omitted assessments billed in June of each fiscal year and subsequently reduced through residential exemption.
Source: City of Boston Treasury Department
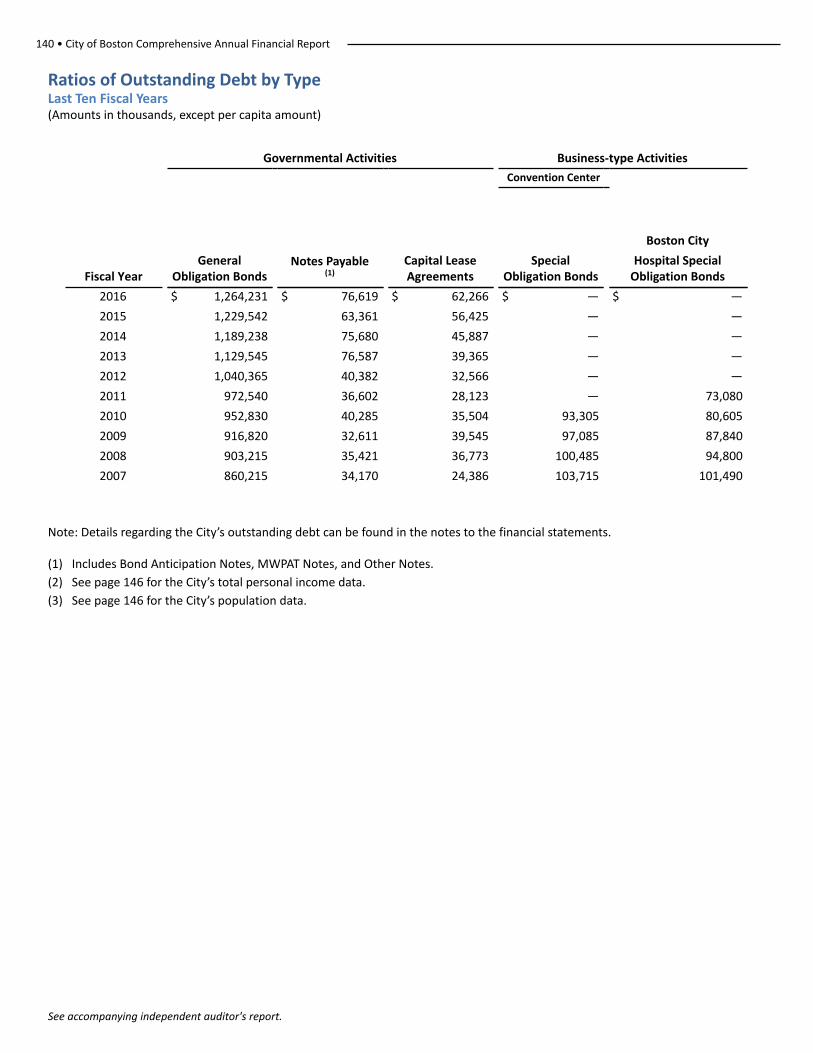
140 • City of Boston Comprehensive Annual Financial Report
See accompanying independent auditor's report.
Ratios of Outstanding Debt by TypeLast Ten Fiscal Years(Amounts in thousands, except per capita amount)
Governmental Activities Business-type Activities
Convention Center
Fiscal YearGeneral
Obligation BondsNotes Payable
(1)Capital LeaseAgreements
SpecialObligation Bonds
Boston City
Hospital Special Obligation Bonds
2016 $ 1,264,231 $ 76,619 $ 62,266 $ — $ —
2015 1,229,542 63,361 56,425 — —
2014 1,189,238 75,680 45,887 — —
2013 1,129,545 76,587 39,365 — —
2012 1,040,365 40,382 32,566 — —
2011 972,540 36,602 28,123 — 73,080
2010 952,830 40,285 35,504 93,305 80,605
2009 916,820 32,611 39,545 97,085 87,840
2008 903,215 35,421 36,773 100,485 94,800
2007 860,215 34,170 24,386 103,715 101,490
Note: Details regarding the City’s outstanding debt can be found in the notes to the financial statements.
(1) Includes Bond Anticipation Notes, MWPAT Notes, and Other Notes.
(2) See page 146 for the City’s total personal income data.
(3) See page 146 for the City’s population data.
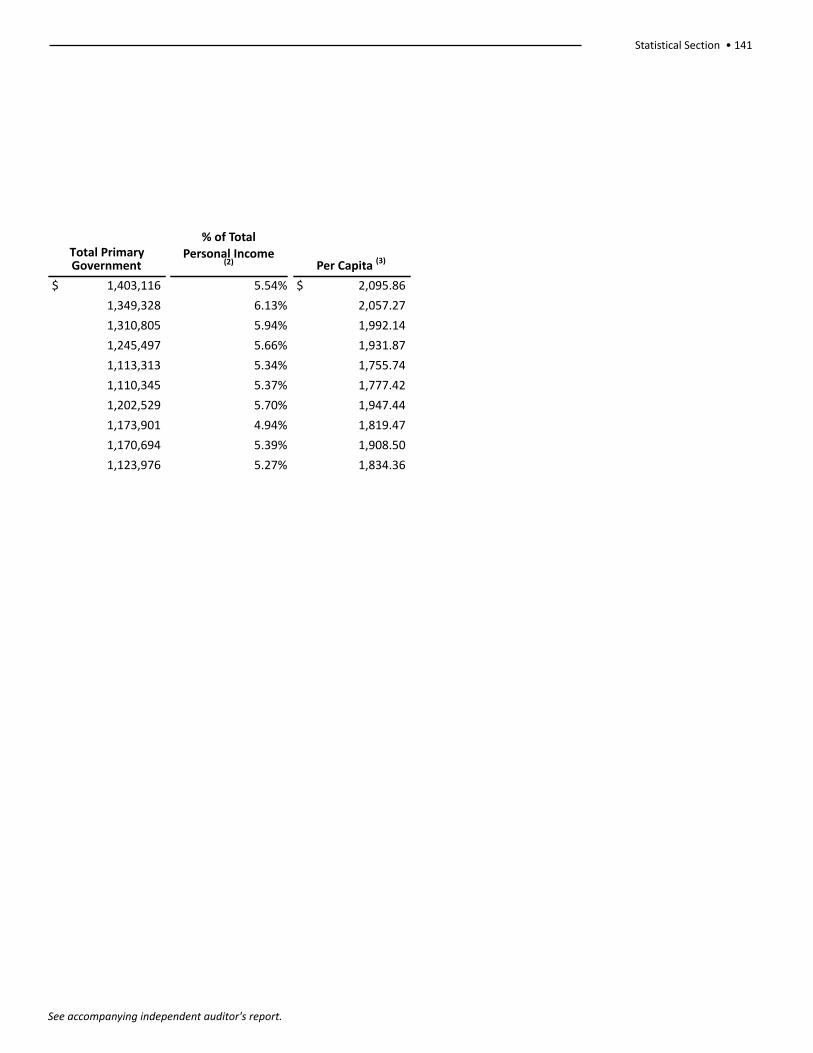
Statistical Section • 141
See accompanying independent auditor's report.
Total PrimaryGovernment
% of TotalPersonal Income
(2) Per Capita (3)
$ 1,403,116 5.54% $ 2,095.86
1,349,328 6.13% 2,057.27
1,310,805 5.94% 1,992.14
1,245,497 5.66% 1,931.87
1,113,313 5.34% 1,755.74
1,110,345 5.37% 1,777.42
1,202,529 5.70% 1,947.44
1,173,901 4.94% 1,819.47
1,170,694 5.39% 1,908.50
1,123,976 5.27% 1,834.36
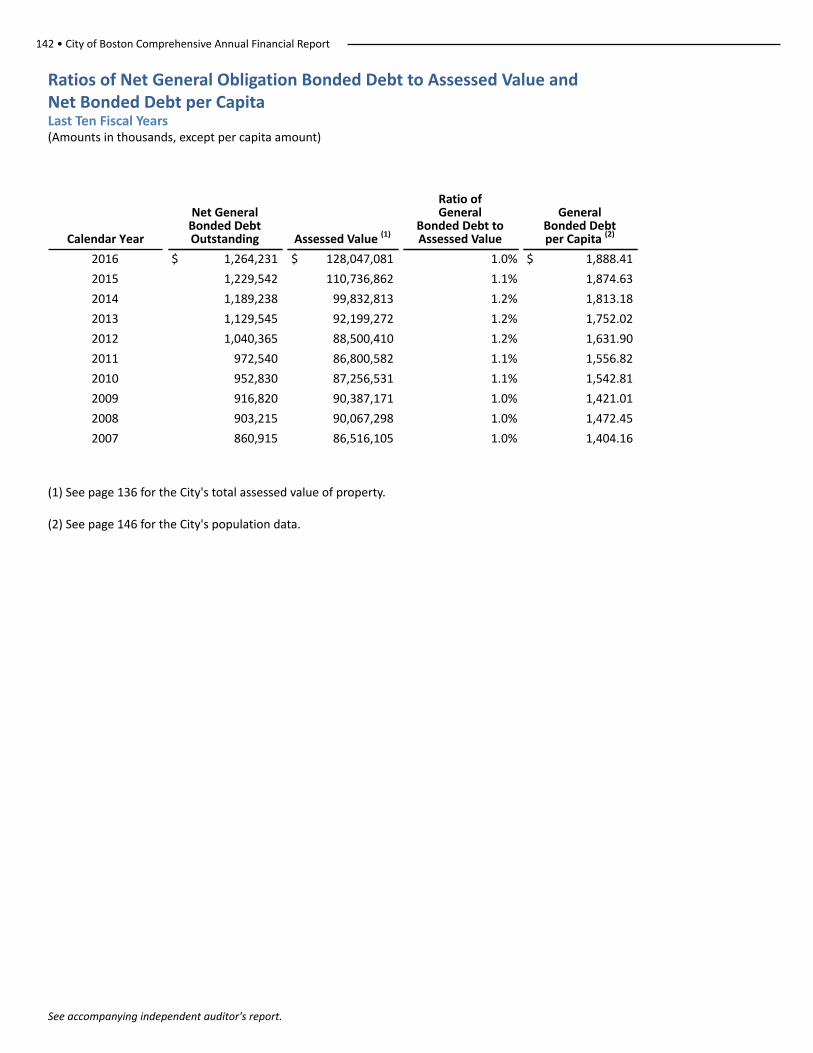
142 • City of Boston Comprehensive Annual Financial Report
See accompanying independent auditor's report.
Ratios of Net General Obligation Bonded Debt to Assessed Value andNet Bonded Debt per CapitaLast Ten Fiscal Years(Amounts in thousands, except per capita amount)
Calendar Year
Net GeneralBonded DebtOutstanding Assessed Value (1)
Ratio ofGeneral
Bonded Debt to Assessed Value
GeneralBonded Debt per Capita (2)
2016 $ 1,264,231 $ 128,047,081 1.0% $ 1,888.41
2015 1,229,542 110,736,862 1.1% 1,874.63
2014 1,189,238 99,832,813 1.2% 1,813.18
2013 1,129,545 92,199,272 1.2% 1,752.02
2012 1,040,365 88,500,410 1.2% 1,631.90
2011 972,540 86,800,582 1.1% 1,556.82
2010 952,830 87,256,531 1.1% 1,542.81
2009 916,820 90,387,171 1.0% 1,421.01
2008 903,215 90,067,298 1.0% 1,472.45
2007 860,915 86,516,105 1.0% 1,404.16
(1) See page 136 for the City's total assessed value of property.
(2) See page 146 for the City's population data.

Statistical Section • 143
(This page intentionally left blank)
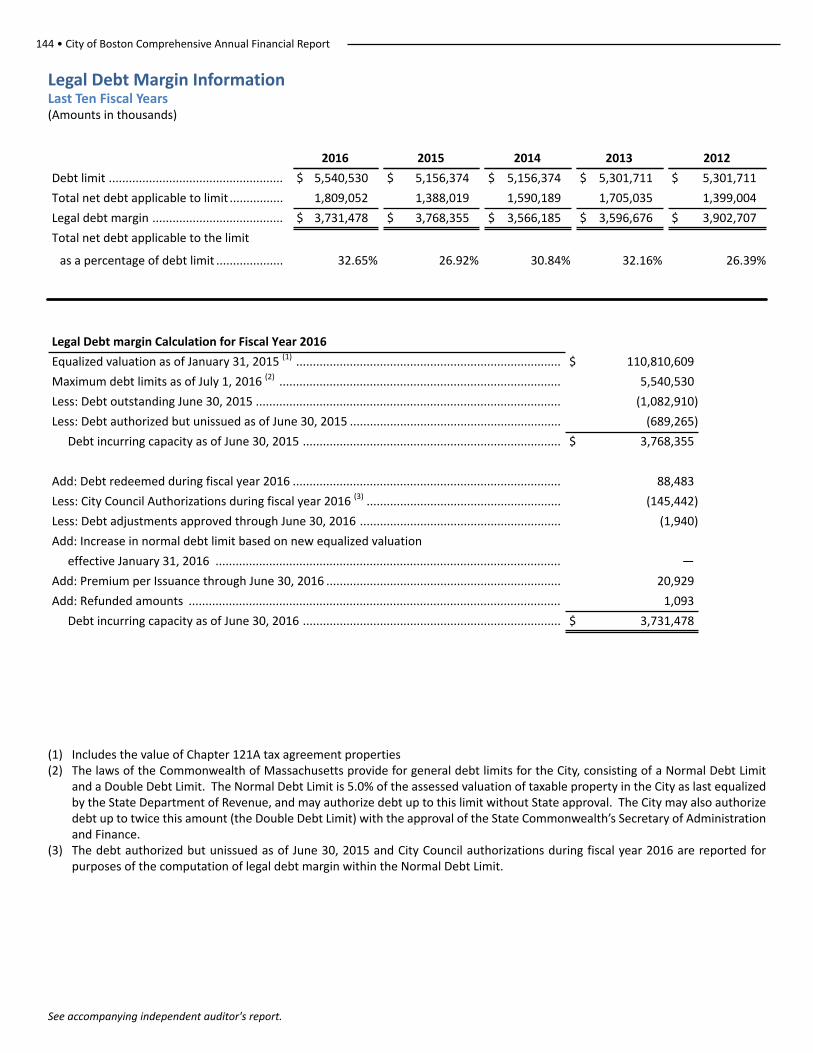
144 • City of Boston Comprehensive Annual Financial Report
See accompanying independent auditor's report.
Legal Debt Margin InformationLast Ten Fiscal Years(Amounts in thousands)
2016 2015 2014 2013 2012
Debt limit .................................................... $ 5,540,530 $ 5,156,374 $ 5,156,374 $ 5,301,711 $ 5,301,711
Total net debt applicable to limit ................ 1,809,052 1,388,019 1,590,189 1,705,035 1,399,004
Legal debt margin ....................................... $ 3,731,478 $ 3,768,355 $ 3,566,185 $ 3,596,676 $ 3,902,707
Total net debt applicable to the limit
as a percentage of debt limit .................... 32.65% 26.92% 30.84% 32.16% 26.39%
Legal Debt margin Calculation for Fiscal Year 2016
Equalized valuation as of January 31, 2015 (1) ............................................................................... $ 110,810,609
Maximum debt limits as of July 1, 2016 (2) .................................................................................... 5,540,530
Less: Debt outstanding June 30, 2015 ........................................................................................... (1,082,910)
Less: Debt authorized but unissued as of June 30, 2015 ............................................................... (689,265)
Debt incurring capacity as of June 30, 2015 ............................................................................. $ 3,768,355
Add: Debt redeemed during fiscal year 2016 ................................................................................ 88,483
Less: City Council Authorizations during fiscal year 2016 (3) .......................................................... (145,442)
Less: Debt adjustments approved through June 30, 2016 ............................................................ (1,940)
Add: Increase in normal debt limit based on new equalized valuation
effective January 31, 2016 ....................................................................................................... —
Add: Premium per Issuance through June 30, 2016 ...................................................................... 20,929
Add: Refunded amounts ............................................................................................................... 1,093
Debt incurring capacity as of June 30, 2016 ............................................................................. $ 3,731,478
(1) Includes the value of Chapter 121A tax agreement properties(2) The laws of the Commonwealth of Massachusetts provide for general debt limits for the City, consisting of a Normal Debt Limit
and a Double Debt Limit. The Normal Debt Limit is 5.0% of the assessed valuation of taxable property in the City as last equalized by the State Department of Revenue, and may authorize debt up to this limit without State approval. The City may also authorize debt up to twice this amount (the Double Debt Limit) with the approval of the State Commonwealth’s Secretary of Administration and Finance.
(3) The debt authorized but unissued as of June 30, 2015 and City Council authorizations during fiscal year 2016 are reported for purposes of the computation of legal debt margin within the Normal Debt Limit.
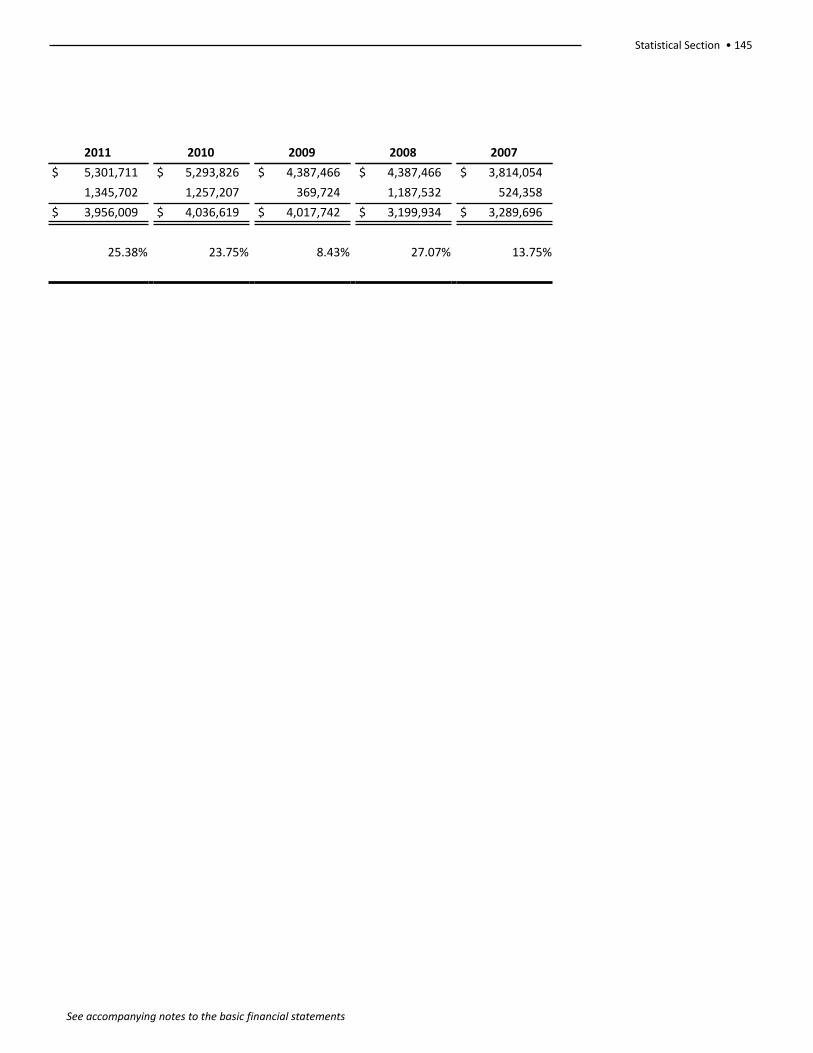
Statistical Section • 145
See accompanying notes to the basic financial statements
2011 2010 2009 2008 2007
$ 5,301,711 $ 5,293,826 $ 4,387,466 $ 4,387,466 $ 3,814,054
1,345,702 1,257,207 369,724 1,187,532 524,358
$ 3,956,009 $ 4,036,619 $ 4,017,742 $ 3,199,934 $ 3,289,696
25.38% 23.75% 8.43% 27.07% 13.75%
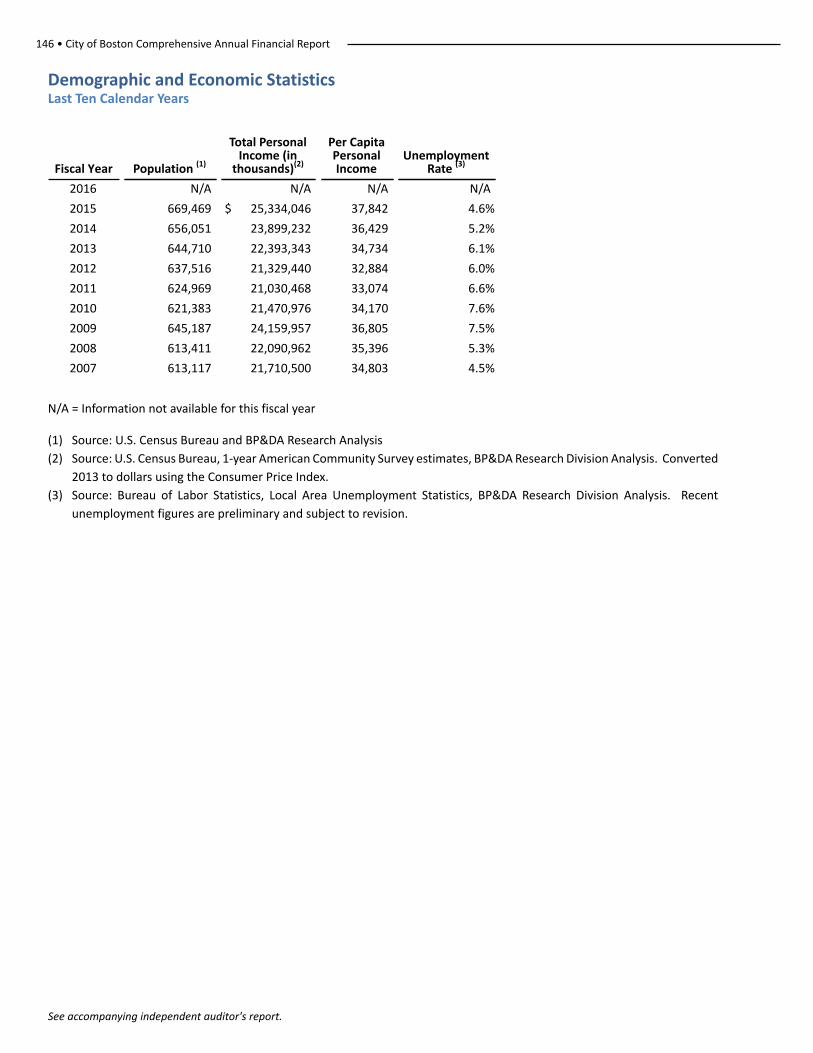
146 • City of Boston Comprehensive Annual Financial Report
See accompanying independent auditor's report.
Demographic and Economic StatisticsLast Ten Calendar Years
Fiscal Year Population (1)
Total Personal Income (in
thousands)(2)
Per CapitaPersonalIncome
Unemployment Rate (3)
2016 N/A N/A N/A N/A
2015 669,469 $ 25,334,046 37,842 4.6%
2014 656,051 23,899,232 36,429 5.2%
2013 644,710 22,393,343 34,734 6.1%
2012 637,516 21,329,440 32,884 6.0%
2011 624,969 21,030,468 33,074 6.6%
2010 621,383 21,470,976 34,170 7.6%
2009 645,187 24,159,957 36,805 7.5%
2008 613,411 22,090,962 35,396 5.3%
2007 613,117 21,710,500 34,803 4.5%
N/A = Information not available for this fiscal year
(1) Source: U.S. Census Bureau and BP&DA Research Analysis
(2) Source: U.S. Census Bureau, 1-year American Community Survey estimates, BP&DA Research Division Analysis. Converted
2013 to dollars using the Consumer Price Index.
(3) Source: Bureau of Labor Statistics, Local Area Unemployment Statistics, BP&DA Research Division Analysis. Recent
unemployment figures are preliminary and subject to revision.
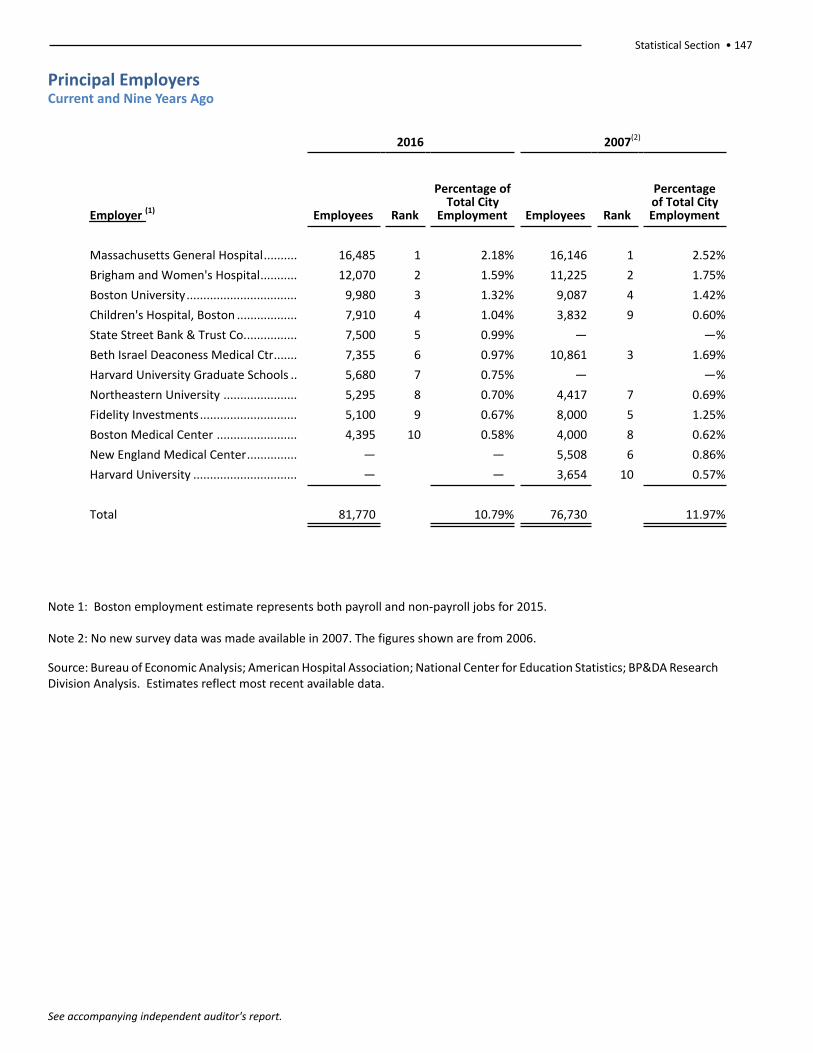
Statistical Section • 147
See accompanying independent auditor's report.
Principal EmployersCurrent and Nine Years Ago
2016 2007(2)
Employer (1) Employees Rank
Percentage ofTotal City
Employment Employees Rank
Percentageof Total CityEmployment
Massachusetts General Hospital.......... 16,485 1 2.18% 16,146 1 2.52%
Brigham and Women's Hospital........... 12,070 2 1.59% 11,225 2 1.75%
Boston University................................. 9,980 3 1.32% 9,087 4 1.42%
Children's Hospital, Boston .................. 7,910 4 1.04% 3,832 9 0.60%
State Street Bank & Trust Co................ 7,500 5 0.99% — —%
Beth Israel Deaconess Medical Ctr....... 7,355 6 0.97% 10,861 3 1.69%
Harvard University Graduate Schools .. 5,680 7 0.75% — —%
Northeastern University ...................... 5,295 8 0.70% 4,417 7 0.69%
Fidelity Investments............................. 5,100 9 0.67% 8,000 5 1.25%
Boston Medical Center ........................ 4,395 10 0.58% 4,000 8 0.62%
New England Medical Center............... — — 5,508 6 0.86%
Harvard University ............................... — — 3,654 10 0.57%
Total 81,770 10.79% 76,730 11.97%
Note 1: Boston employment estimate represents both payroll and non-payroll jobs for 2015.
Note 2: No new survey data was made available in 2007. The figures shown are from 2006.
Source: Bureau of Economic Analysis; American Hospital Association; National Center for Education Statistics; BP&DA Research Division Analysis. Estimates reflect most recent available data.
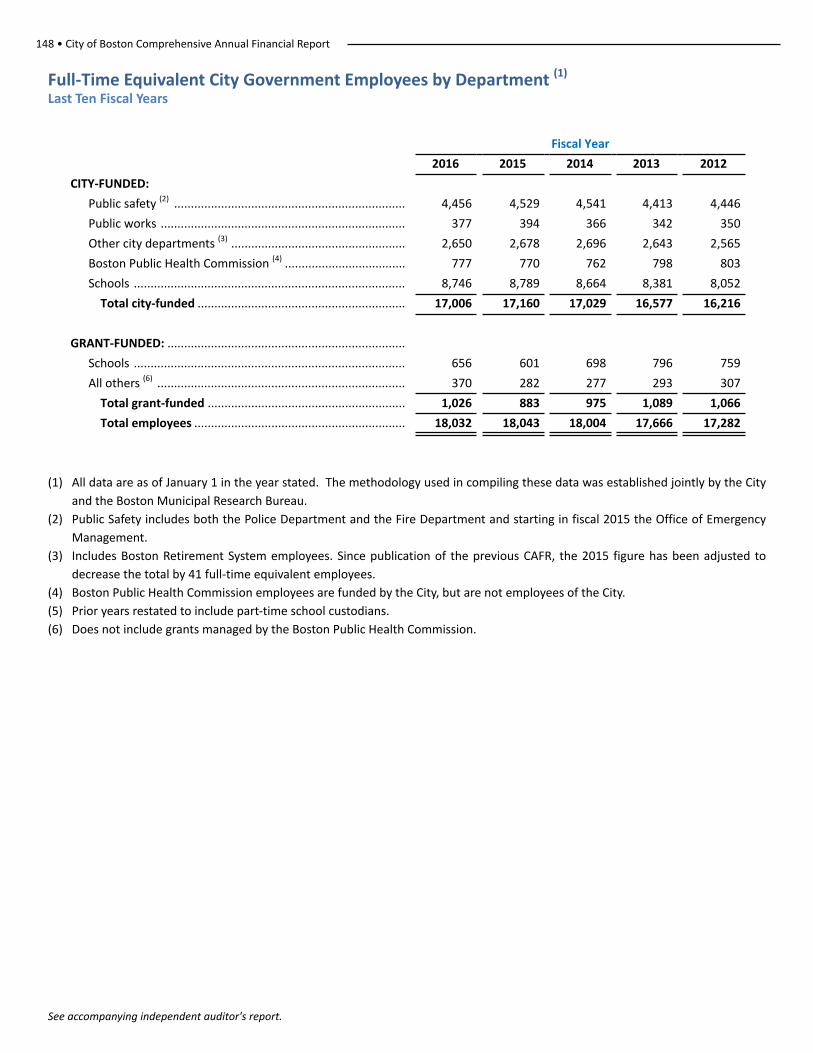
148 • City of Boston Comprehensive Annual Financial Report
See accompanying independent auditor's report.
Full-Time Equivalent City Government Employees by Department (1)
Last Ten Fiscal Years
Fiscal Year
2016 2015 2014 2013 2012
CITY-FUNDED:
Public safety (2) ..................................................................... 4,456 4,529 4,541 4,413 4,446
Public works ......................................................................... 377 394 366 342 350
Other city departments (3) .................................................... 2,650 2,678 2,696 2,643 2,565
Boston Public Health Commission (4) .................................... 777 770 762 798 803
Schools ................................................................................. 8,746 8,789 8,664 8,381 8,052
Total city-funded .............................................................. 17,006 17,160 17,029 16,577 16,216
GRANT-FUNDED: .......................................................................
Schools ................................................................................. 656 601 698 796 759
All others (6) .......................................................................... 370 282 277 293 307
Total grant-funded ........................................................... 1,026 883 975 1,089 1,066
Total employees ............................................................... 18,032 18,043 18,004 17,666 17,282
(1) All data are as of January 1 in the year stated. The methodology used in compiling these data was established jointly by the City
and the Boston Municipal Research Bureau.
(2) Public Safety includes both the Police Department and the Fire Department and starting in fiscal 2015 the Office of Emergency
Management.
(3) Includes Boston Retirement System employees. Since publication of the previous CAFR, the 2015 figure has been adjusted to
decrease the total by 41 full-time equivalent employees.
(4) Boston Public Health Commission employees are funded by the City, but are not employees of the City.
(5) Prior years restated to include part-time school custodians.
(6) Does not include grants managed by the Boston Public Health Commission.
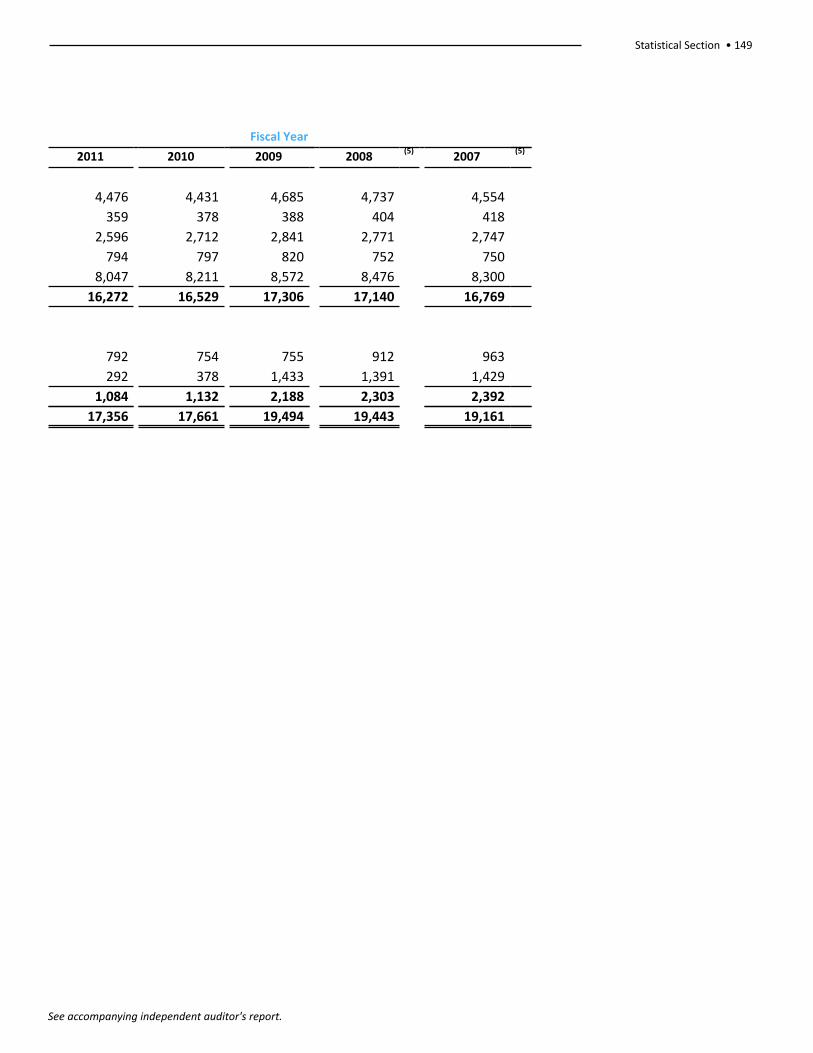
Statistical Section • 149
See accompanying independent auditor's report.
Fiscal Year
2011 2010 2009 2008(5)
2007(5)
4,476 4,431 4,685 4,737 4,554
359 378 388 404 418
2,596 2,712 2,841 2,771 2,747
794 797 820 752 750
8,047 8,211 8,572 8,476 8,300
16,272 16,529 17,306 17,140 16,769
792 754 755 912 963
292 378 1,433 1,391 1,429
1,084 1,132 2,188 2,303 2,392
17,356 17,661 19,494 19,443 19,161
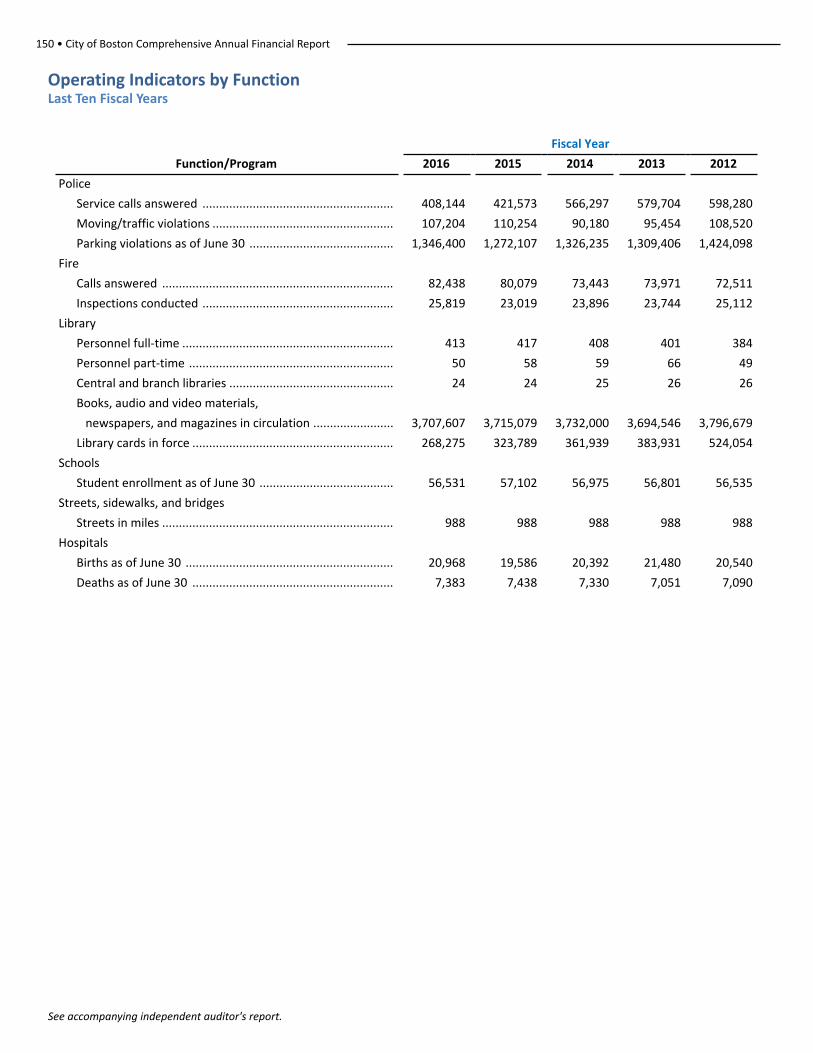
150 • City of Boston Comprehensive Annual Financial Report
See accompanying independent auditor's report.
Operating Indicators by FunctionLast Ten Fiscal Years
Fiscal Year
Function/Program 2016 2015 2014 2013 2012
Police
Service calls answered ......................................................... 408,144 421,573 566,297 579,704 598,280
Moving/traffic violations ...................................................... 107,204 110,254 90,180 95,454 108,520
Parking violations as of June 30 ........................................... 1,346,400 1,272,107 1,326,235 1,309,406 1,424,098
Fire
Calls answered ..................................................................... 82,438 80,079 73,443 73,971 72,511
Inspections conducted ......................................................... 25,819 23,019 23,896 23,744 25,112
Library
Personnel full-time ............................................................... 413 417 408 401 384
Personnel part-time ............................................................. 50 58 59 66 49
Central and branch libraries ................................................. 24 24 25 26 26
Books, audio and video materials,
newspapers, and magazines in circulation ........................ 3,707,607 3,715,079 3,732,000 3,694,546 3,796,679
Library cards in force ............................................................ 268,275 323,789 361,939 383,931 524,054
Schools
Student enrollment as of June 30 ........................................ 56,531 57,102 56,975 56,801 56,535
Streets, sidewalks, and bridges
Streets in miles ..................................................................... 988 988 988 988 988
Hospitals
Births as of June 30 .............................................................. 20,968 19,586 20,392 21,480 20,540
Deaths as of June 30 ............................................................ 7,383 7,438 7,330 7,051 7,090
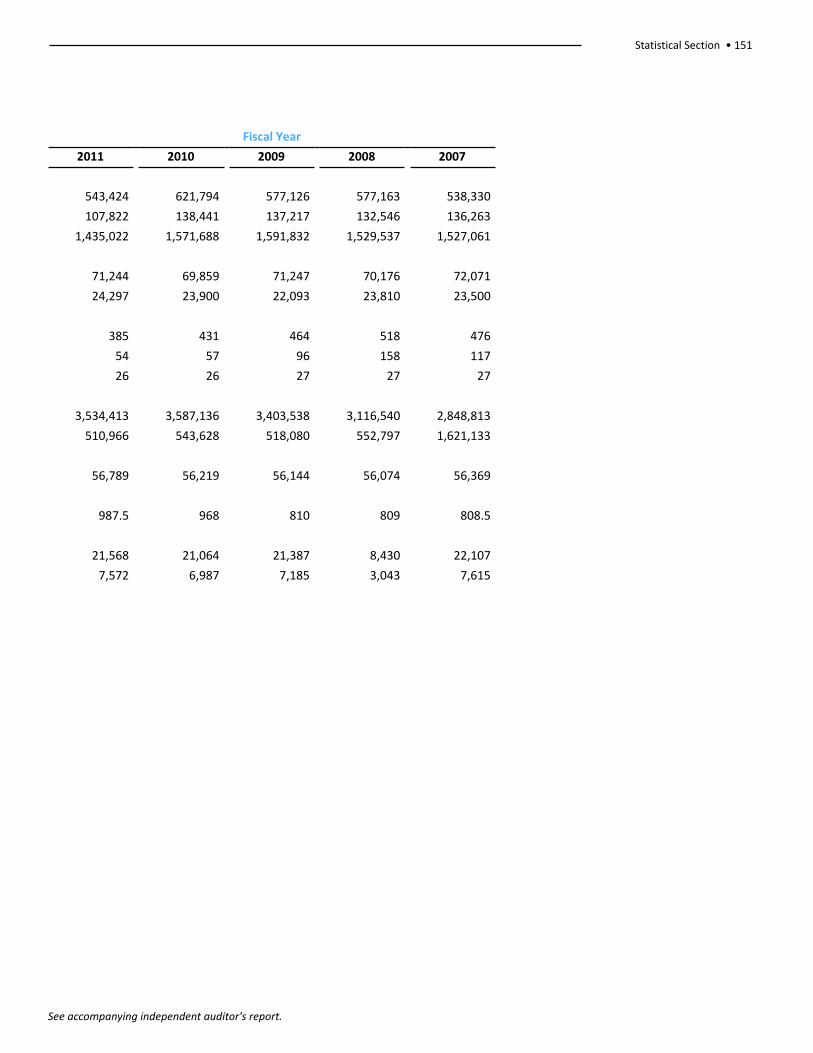
Statistical Section • 151
See accompanying independent auditor's report.
Fiscal Year
2011 2010 2009 2008 2007
543,424 621,794 577,126 577,163 538,330
107,822 138,441 137,217 132,546 136,263
1,435,022 1,571,688 1,591,832 1,529,537 1,527,061
71,244 69,859 71,247 70,176 72,071
24,297 23,900 22,093 23,810 23,500
385 431 464 518 476
54 57 96 158 117
26 26 27 27 27
3,534,413 3,587,136 3,403,538 3,116,540 2,848,813
510,966 543,628 518,080 552,797 1,621,133
56,789 56,219 56,144 56,074 56,369
987.5 968 810 809 808.5
21,568 21,064 21,387 8,430 22,107
7,572 6,987 7,185 3,043 7,615
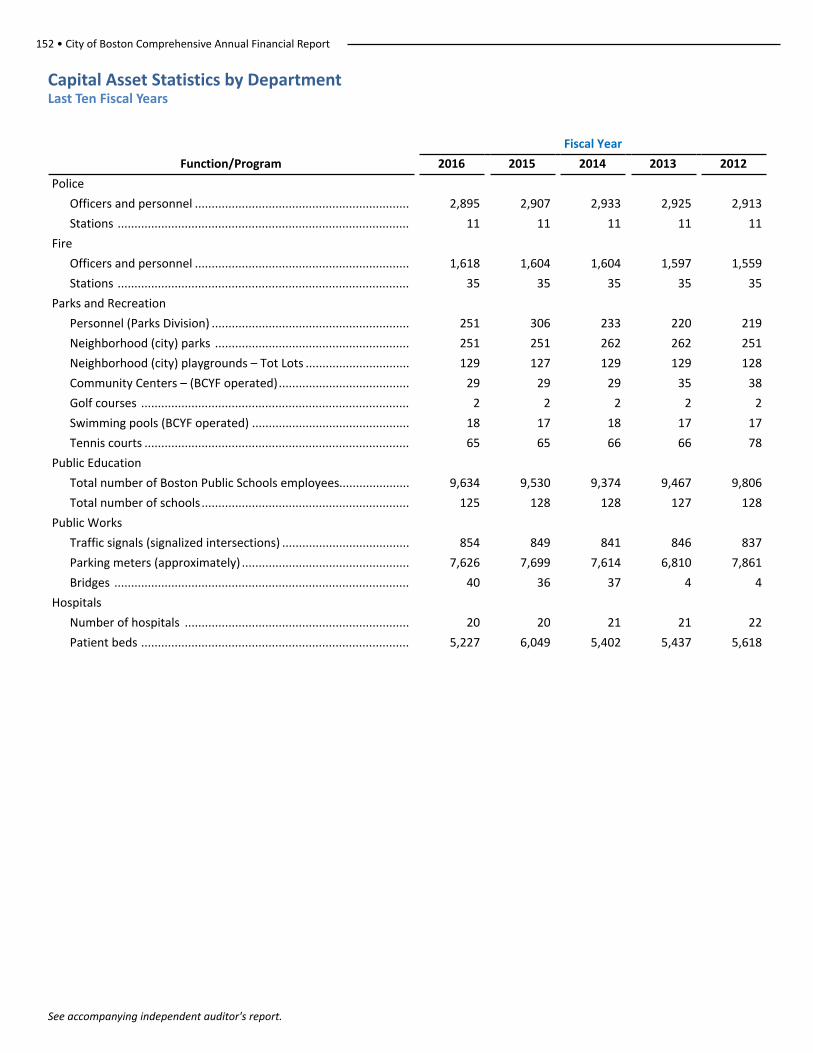
152 • City of Boston Comprehensive Annual Financial Report
See accompanying independent auditor's report.
Capital Asset Statistics by DepartmentLast Ten Fiscal Years
Fiscal Year
Function/Program 2016 2015 2014 2013 2012
Police
Officers and personnel ................................................................ 2,895 2,907 2,933 2,925 2,913
Stations ....................................................................................... 11 11 11 11 11
Fire
Officers and personnel ................................................................ 1,618 1,604 1,604 1,597 1,559
Stations ....................................................................................... 35 35 35 35 35
Parks and Recreation
Personnel (Parks Division) ........................................................... 251 306 233 220 219
Neighborhood (city) parks .......................................................... 251 251 262 262 251
Neighborhood (city) playgrounds – Tot Lots ............................... 129 127 129 129 128
Community Centers – (BCYF operated)....................................... 29 29 29 35 38
Golf courses ................................................................................ 2 2 2 2 2
Swimming pools (BCYF operated) ............................................... 18 17 18 17 17
Tennis courts ............................................................................... 65 65 66 66 78
Public Education
Total number of Boston Public Schools employees..................... 9,634 9,530 9,374 9,467 9,806
Total number of schools.............................................................. 125 128 128 127 128
Public Works
Traffic signals (signalized intersections) ...................................... 854 849 841 846 837
Parking meters (approximately) .................................................. 7,626 7,699 7,614 6,810 7,861
Bridges ........................................................................................ 40 36 37 4 4
Hospitals
Number of hospitals ................................................................... 20 20 21 21 22
Patient beds ................................................................................ 5,227 6,049 5,402 5,437 5,618
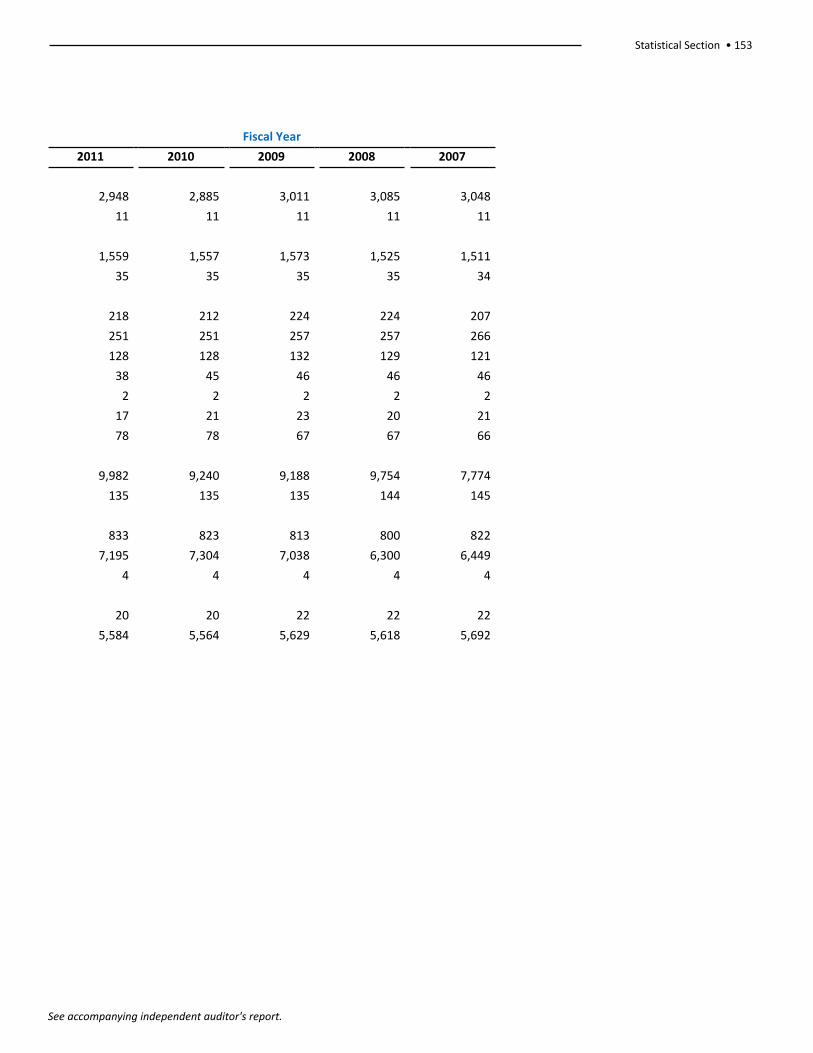
Statistical Section • 153
See accompanying independent auditor's report.
Fiscal Year
2011 2010 2009 2008 2007
2,948 2,885 3,011 3,085 3,048
11 11 11 11 11
1,559 1,557 1,573 1,525 1,511
35 35 35 35 34
218 212 224 224 207
251 251 257 257 266
128 128 132 129 121
38 45 46 46 46
2 2 2 2 2
17 21 23 20 21
78 78 67 67 66
9,982 9,240 9,188 9,754 7,774
135 135 135 144 145
833 823 813 800 822
7,195 7,304 7,038 6,300 6,449
4 4 4 4 4
20 20 22 22 22
5,584 5,564 5,629 5,618 5,692