Embed Size (px)
Citation preview

1
Note: This is presentation material only
Cage and hydrographic survey requirements
Cage and hydrographic survey Cage and hydrographic survey requirementsrequirements
Jon Chamberlain

2
OverviewOverviewOverview• NOT part of the modelling process – WRONG!!
• Before you proceed with modelling, you will need to be satisfied that all the data collected is fit for purpose.
• Absolutely no point in starting the modelling process if you feel that the quality of the data is not up to the standard required by SEPA

3
Present situationPresent situationPresent situation• A large proportion of time is spent checking the data
supplied with each application• Quality of data that has been supplied has been
mixed and varied• Some of the errors are fundamental – others are
technical
• Overall result is delays in the processing of applications and issuing of DINs
4
The FutureThe FutureThe Future• Modelling will be done by yourselves• Quality of the data MUST be checked by YOU• In addition to modelling reports – application to
include:• Site and hydrographic survey
• A useful way for you to check the data

5
Site SurveySite SurveySite Survey• Position Fixing• Depth Soundings• Data Reporting
• Site Layout Map
6
Position FixingPosition FixingPosition Fixing• Location of cage corners and current meter• Electronic Satellite Navigation System
• GPS• DGPS• GLONASS• Galileo……..
• Quality of positional information improved with number of satellites and time in position

7
Position Fixing 2Position Fixing 2Position Fixing 2• Position system datum
• WGS84/ETRS89
• Convert to Ordnance Survey Grid references
• Methods available as freeware on the internet
8
Depth SoundingDepth SoundingDepth Sounding• Depths at cage corners• Time of sampling (corrected to GMT)
• Correct depths to chart datum (CD) from Admiralty Tide Tables
• In areas where the charts are of poor resolution –extra depth measurements should be taken.• Minimum of 4 additional depth soundings at 150m
in cardinal directions.

9
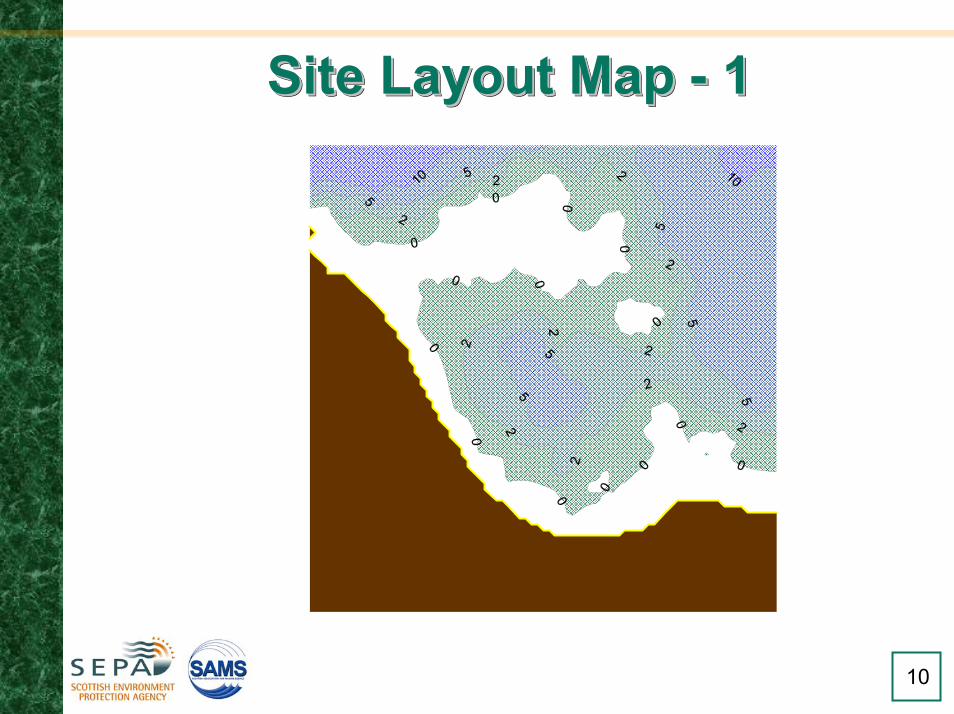
Data ReportingData ReportingData Reporting• Very similar to data for Grid generation module within
DEPOMOD.• 1 km square map of the area with farm site close to
the centre
10
Site Layout Map - 1Site Layout Map Site Layout Map -- 11

11
Data ReportingData ReportingData Reporting• Very similar to data for Grid generation module within
DEPOMOD.• 1 km square map of the area with farm site close to
the centre• Overlain with OS-National Grid co-ordinate graticules

12
Site Layout Map - 2Site Layout Map Site Layout Map -- 22
351200 351400 351600 351800 352000
1010600
1010700
1010800
1010900
1011000
1011100
1011200
1011300
1011400
1011500

13
Data ReportingData ReportingData Reporting• Very similar to data for Grid generation module within
DEPOMOD.• 1 km square map of the area with farm site close to
the centre• Overlain with OS-National Grid co-ordinate graticules• Location of the cage, current meter and met station

14
Site Layout Map - 3Site Layout Map Site Layout Map -- 33
351200 351400 351600 351800 352000
1010600
1010700
1010800
1010900
1011000
1011100
1011200
1011300
1011400
1011500

15
Site Layout Map – 4Site Layout Map Site Layout Map –– 44
351200 351400 351600 351800 352000
1010600
1010700
1010800
1010900
1011000
1011100
1011200
1011300
1011400
1011500

16
Data ReportingData ReportingData Reporting• Very similar to data for Grid generation module within
DEPOMOD.• 1 km square map of the area with farm site close to
the centre• Overlain with OS-National Grid co-ordinate graticules• Location of the cage, HG meter and met station• Positions and depths of corners (and extra points)
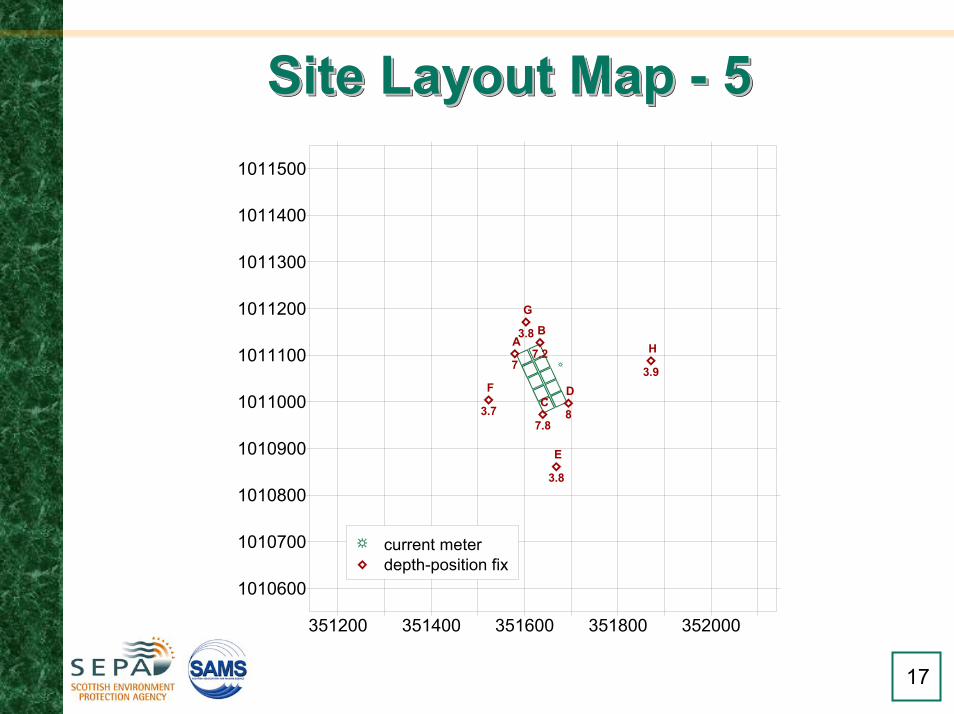
17
Site Layout Map - 5Site Layout Map Site Layout Map -- 55
351200 351400 351600 351800 352000
1010600
1010700
1010800
1010900
1011000
1011100
1011200
1011300
1011400
1011500
A B
C D
E
F
G
H7
7.2
7.88
3.8
3.7
3.8
3.9
depth-position fixcurrent meter
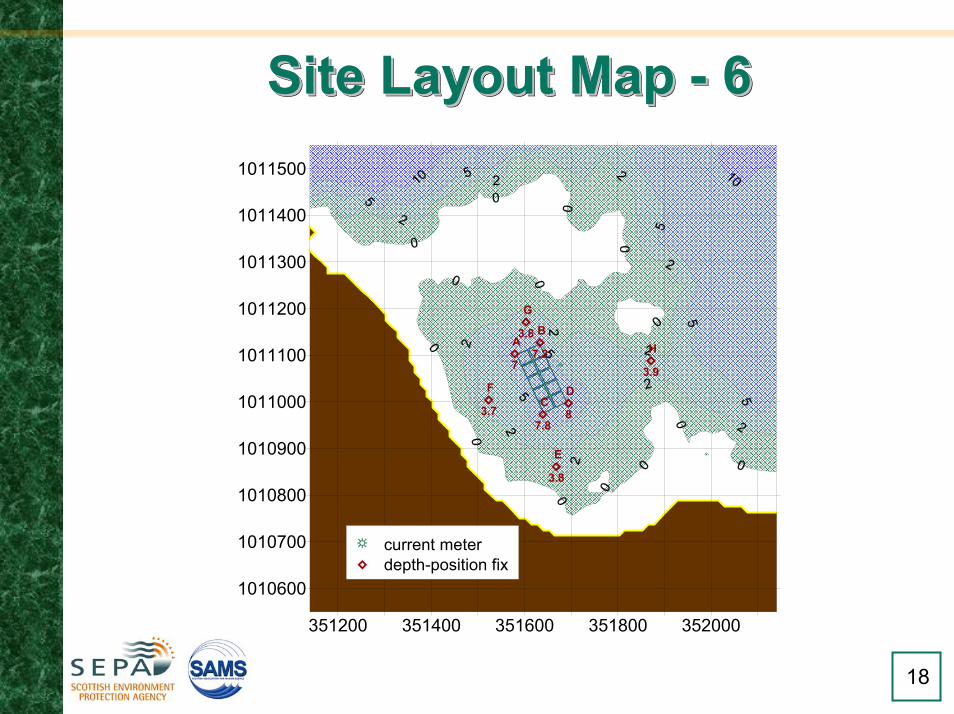
18
Site Layout Map - 6Site Layout Map Site Layout Map -- 66
351200 351400 351600 351800 352000
1010600
1010700
1010800
1010900
1011000
1011100
1011200
1011300
1011400
1011500
A B
C D
E
F
G
H7
7.2
7.88
3.8
3.7
3.8
3.9
depth-position fixcurrent meter
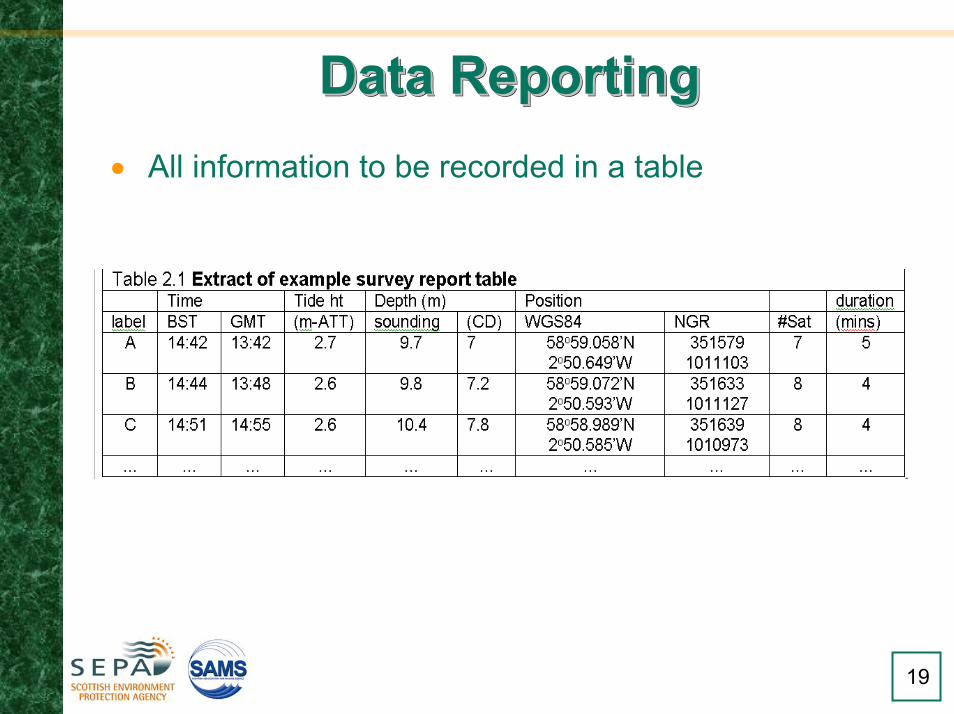
19
Data ReportingData ReportingData Reporting• All information to be recorded in a table

20
Hydrographic SurveyHydrographic SurveyHydrographic Survey• Minimum requirements
• 15 day (spring-neap/half lunar cycle)• Longer deployments may allow clearer determination
of tidal components• Lowest acceptable temporal resolution – 20 mins

21
Equipment and MooringsEquipment and MooringsEquipment and Moorings
• Pressure Gauges• Current Meters• Deployment Position• Meteorological Data

22
Pressure GaugePressure GaugePressure Gauge• Allows corroboration of
• Deployment depth• Timing• Duration
• Allows comparison of tidal movement with current velocity and flow
• Integral with near-bed current meter or separate bed-mounted tide gauge
23
Current MetersCurrent MetersCurrent Meters• Generally either:
• Discrete measuring device
or
• Profiling Instruments

24
Discrete Measuring DevicesDiscrete Measuring DevicesDiscrete Measuring Devices• Mechanical Meters
• Electromagnetic Meters
• Acoustic Meters

25
Profiling InstrumentsProfiling InstrumentsProfiling Instruments• ADP/ADCPs
• Require careful configuration
• Must be set up with respect to• Averaging interval• Number of “pings”• Cell Size• Deployment Depth

26
Profiling InstrumentsProfiling InstrumentsProfiling Instruments
• Estimated Standard Deviation not exceed 1 cm/s• Height of transducer, blanking distance and cell size
must still meet near bottom depth criterion• Near bottom depth or cell size should not exceed 3m• Tilt/Roll within device limits• Acoustic frequency should be selected to return
reliable flow estimates through the full deployment depth

27
Current MetersCurrent MetersCurrent Meters• All instruments should meet the following criteria:
• Note definitions of Accuracy, Precision and Resolution
28
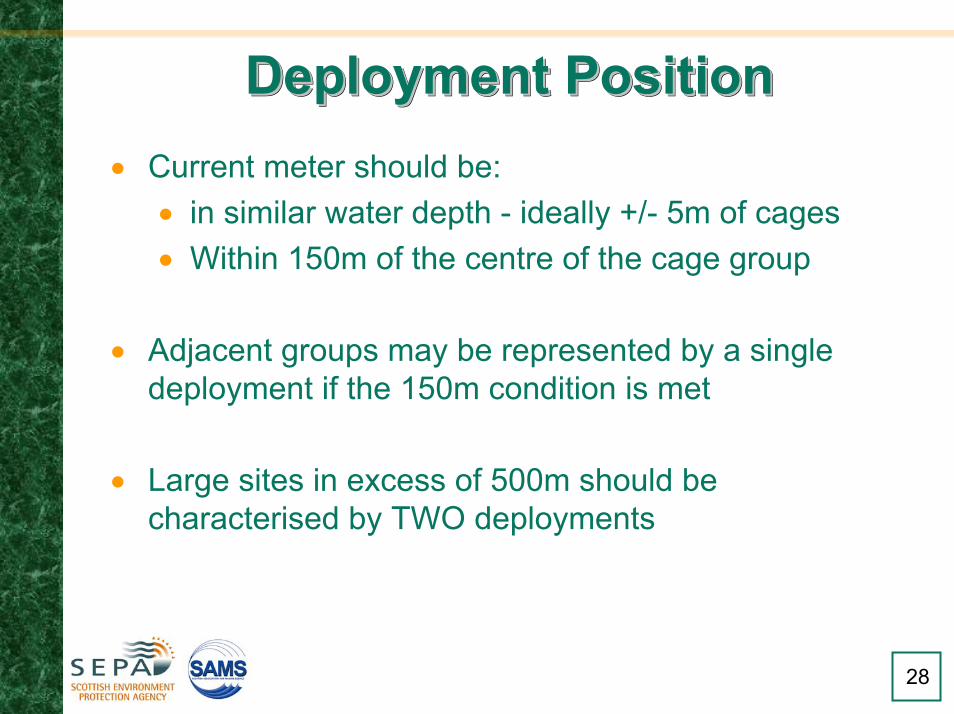
Deployment PositionDeployment PositionDeployment Position• Current meter should be:
• in similar water depth - ideally +/- 5m of cages• Within 150m of the centre of the cage group
• Adjacent groups may be represented by a single deployment if the 150m condition is met
• Large sites in excess of 500m should be characterised by TWO deployments

29
Depth of Data RetrievalDepth of Data RetrievalDepth of Data Retrieval• At sites in excess of 15m – data should be collected
at THREE depths

30
Hydrographic DataHydrographic DataHydrographic Data
>15 m>15 m

31
Depth of Data RetrievalDepth of Data RetrievalDepth of Data Retrieval• At sites in excess of 15m – data should be collected
at THREE depths
• Near bottom – as close to the bed as practicable• Sub-surface – 5m below the lowest predicted spring• Cage bottom – corresponding to the bottom of cages

32
Depth of Data RetrievalDepth of Data RetrievalDepth of Data Retrieval• At sites in less than 15m – data MAY be collected at
TWO depths
• Near bottom – as close to the bed as practicable• Sub-surface – 5m below the lowest predicted spring
33
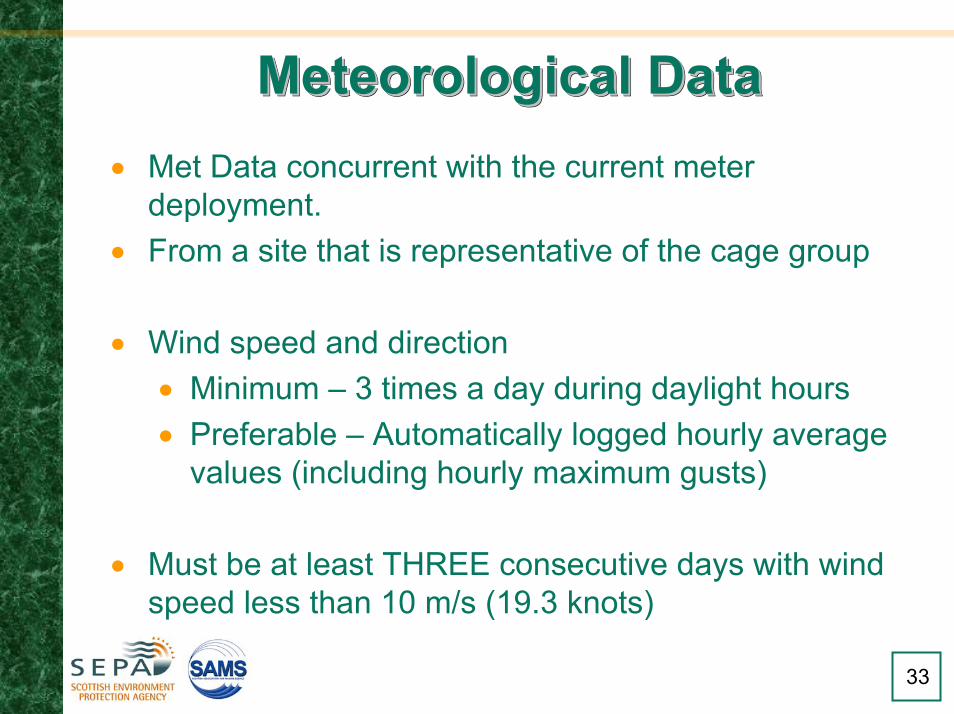
Meteorological DataMeteorological DataMeteorological Data• Met Data concurrent with the current meter
deployment.• From a site that is representative of the cage group
• Wind speed and direction• Minimum – 3 times a day during daylight hours• Preferable – Automatically logged hourly average
values (including hourly maximum gusts)
• Must be at least THREE consecutive days with wind speed less than 10 m/s (19.3 knots)
34
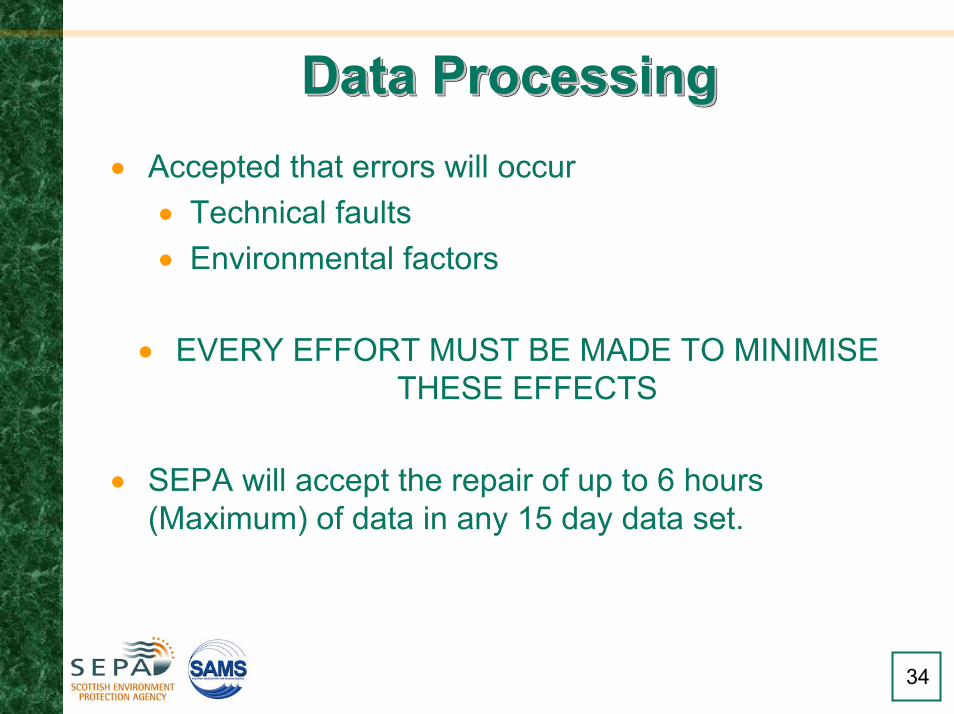
Data ProcessingData ProcessingData Processing• Accepted that errors will occur
• Technical faults• Environmental factors
• EVERY EFFORT MUST BE MADE TO MINIMISE THESE EFFECTS
• SEPA will accept the repair of up to 6 hours (Maximum) of data in any 15 day data set.
35
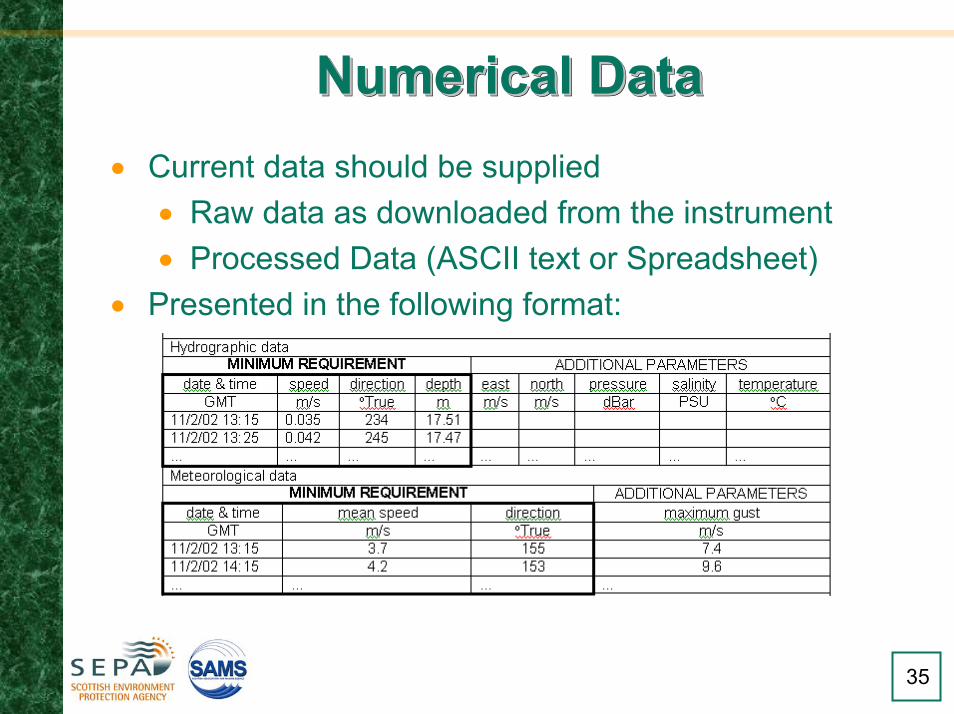
Numerical DataNumerical DataNumerical Data• Current data should be supplied
• Raw data as downloaded from the instrument• Processed Data (ASCII text or Spreadsheet)
• Presented in the following format:

36
Data AnalysisData AnalysisData Analysis• Key Statistical Values for each depth
• This should be carried out on the ‘fixed’ data• Mean Speed• Ranked Percentage of mean speed• 3 cm/s as a ranked percentage

37
Graphical PresentationGraphical PresentationGraphical Presentation• For each depth the following graphical formats should
be presented• Time series of speed and water depth• Time series of unprocessed speed and water depth• Time series of direction and water depth• Time series of unprocessed direction and water depth• Scatter plots• Cumulative vector plots• Bar charts of direction frequency analysis• Current speed against percentile

38
Report StructureReport StructureReport Structure• Site Description• Survey Programme• Methods (Sampling, data processing)• Cage Survey Plot• Cage Survey Summary Table• HG data QA statement• HG data summary statistics• HG data plots• Equipment List – specs and set-up parameters• Survey Log sheet• Calibration Reports