Embed Size (px)
Citation preview
CAGP Toolkit (SENSE 2018) C AGP I nst i tu te #6
Ensuring Equity Through Guided Pathways Institution Name: Riverside City College
Center for Community College Student Engagement, The University of Texas at Austin CAGP Toolkit (SENSE 2018) © 2019 Permission for unlimited copying granted with appropriate citation Page 1 of 28
Objective: The Guided Pathways Model is composed of essential integrated practices that help students along their journey to success. As colleges undertake the
necessary redesign and implementation of structured student pathways, this CAGP Toolkit (SENSE 2018) can be used to facilitate important conversations on
how the Guided Pathways Model pillars intersect with student engagement data.
Instructions: Complete this document to prepare for CAGP Institute #6.
Step 1: From the Standard Reports page, retrieve your college’s 2018 SENSE “Standard Report” (Frequencies) and the “Special-Focus Module - Guided Pathways” frequency report. A video tutorial on how to navigate to these reports is linked in the Tutorial on Accessing SENSE Reports document.
Step 2: Upon reviewing the data, select data results that catch the team’s attention. Enter those results into the “Standard Report: ALL Students” column of the tables that are in the next pages of this document.
Step 3: To drill into the data, the college team will select the breakout variables Race/Ethnicity and Traditional/Non-Traditional-Age by which to disaggregate and include those data in the “Custom Report: Disaggregated Data” columns that are in the next pages of this document. Instructions on how to create and view Custom Reports (look at Frequencies only) are also linked in the Tutorial on Accessing SENSE Reports document. Other reports can be generated with the following breakout variables:
Part-time & Full-Time
Developmental & Non-Developmental
First-Generation & Not First-Generation Students
Male & Female Students Step 4: Enter any relevant notes/observations when comparing the data between the two columns—“Standard Report: ALL Students” and “Custom
Report: Disaggregated Data.”
Due Date: Submit to Coral Noonan-Terry at [email protected] by Friday, August 16, 2019.
CAGP Toolkit (SENSE 2018) C AGP I nst i tu te #6
Ensuring Equity Through Guided Pathways Institution Name: Riverside City College
Center for Community College Student Engagement, The University of Texas at Austin CAGP Toolkit (SENSE 2018) © 2019 Permission for unlimited copying granted with appropriate citation Page 2 of 28
CAGP Toolkit (SENSE 2018) C AGP I nst i tu te #6
Ensuring Equity Through Guided Pathways Institution Name: Riverside City College
Center for Community College Student Engagement, The University of Texas at Austin CAGP Toolkit (SENSE 2018) © 2019 Permission for unlimited copying granted with appropriate citation Page 3 of 28
SENSE 2018 Main Survey
Response Options
Standard Report: ALL Students
(Enter selected response option(s) and data results)
Custom Report: Disaggregated Data
(Note breakout variable and data results. Use the same response option(s) as the
“Standard Report: ALL Students” column to the left.)
Notes / Observations
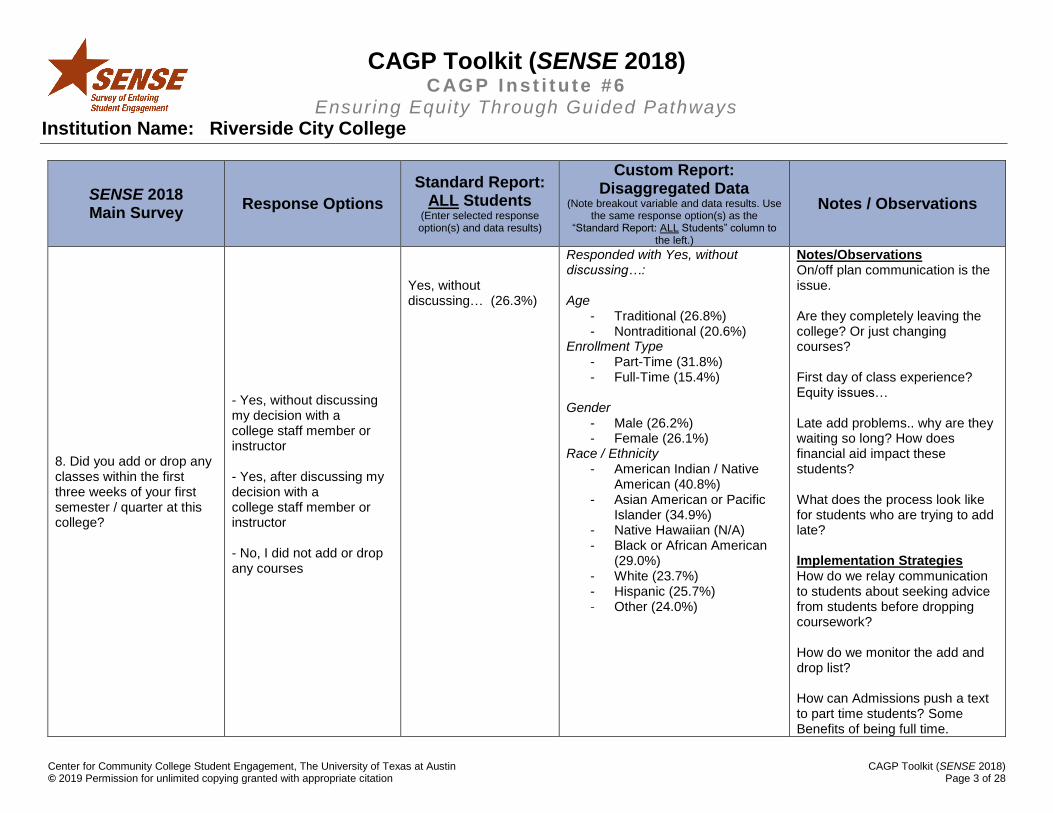
8. Did you add or drop any classes within the first three weeks of your first semester / quarter at this college?
- Yes, without discussing my decision with a college staff member or instructor - Yes, after discussing my decision with a college staff member or instructor - No, I did not add or drop any courses
Yes, without discussing… (26.3%)
Responded with Yes, without discussing…: Age
- Traditional (26.8%) - Nontraditional (20.6%)
Enrollment Type - Part-Time (31.8%) - Full-Time (15.4%)
Gender
- Male (26.2%) - Female (26.1%)
Race / Ethnicity - American Indian / Native
American (40.8%) - Asian American or Pacific
Islander (34.9%) - Native Hawaiian (N/A) - Black or African American
(29.0%) - White (23.7%) - Hispanic (25.7%) - Other (24.0%)
Notes/Observations On/off plan communication is the issue. Are they completely leaving the college? Or just changing courses? First day of class experience? Equity issues… Late add problems.. why are they waiting so long? How does financial aid impact these students? What does the process look like for students who are trying to add late? Implementation Strategies How do we relay communication to students about seeking advice from students before dropping coursework? How do we monitor the add and drop list? How can Admissions push a text to part time students? Some Benefits of being full time.
CAGP Toolkit (SENSE 2018) C AGP I nst i tu te #6
Ensuring Equity Through Guided Pathways Institution Name: Riverside City College
Center for Community College Student Engagement, The University of Texas at Austin CAGP Toolkit (SENSE 2018) © 2019 Permission for unlimited copying granted with appropriate citation Page 4 of 28
SENSE 2018 Main Survey
Response Options
Standard Report: ALL Students
(Enter selected response option(s) and data results)
Custom Report: Disaggregated Data
(Note breakout variable and data results. Use the same response option(s) as the
“Standard Report: ALL Students” column to the left.)
Notes / Observations
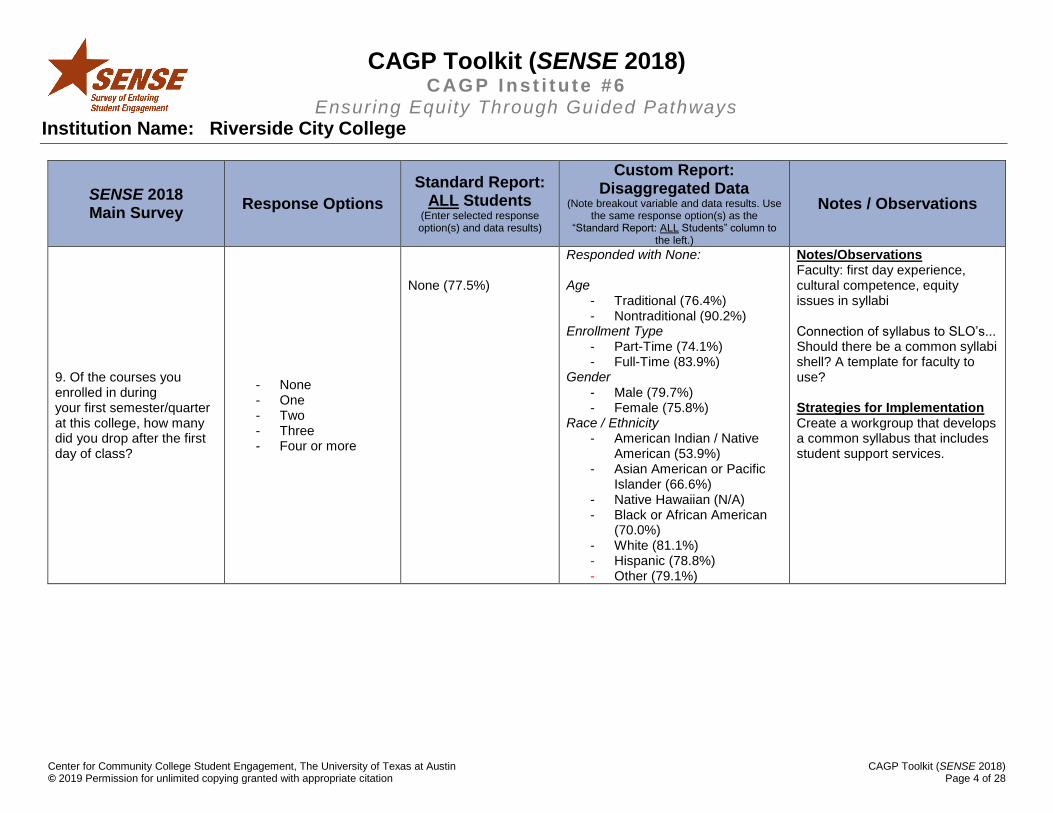
9. Of the courses you enrolled in during your first semester/quarter at this college, how many did you drop after the first day of class?
- None - One - Two - Three - Four or more
None (77.5%)
Responded with None: Age
- Traditional (76.4%) - Nontraditional (90.2%)
Enrollment Type - Part-Time (74.1%) - Full-Time (83.9%)
Gender - Male (79.7%) - Female (75.8%)
Race / Ethnicity - American Indian / Native
American (53.9%) - Asian American or Pacific
Islander (66.6%) - Native Hawaiian (N/A) - Black or African American
(70.0%) - White (81.1%) - Hispanic (78.8%) - Other (79.1%)
Notes/Observations Faculty: first day experience, cultural competence, equity issues in syllabi Connection of syllabus to SLO’s... Should there be a common syllabi shell? A template for faculty to use? Strategies for Implementation Create a workgroup that develops a common syllabus that includes student support services.
CAGP Toolkit (SENSE 2018) C AGP I nst i tu te #6
Ensuring Equity Through Guided Pathways Institution Name: Riverside City College
Center for Community College Student Engagement, The University of Texas at Austin CAGP Toolkit (SENSE 2018) © 2019 Permission for unlimited copying granted with appropriate citation Page 5 of 28
SENSE 2018 Main Survey
Response Options
Standard Report:
ALL Students (Enter selected
response option(s) and data results)
Custom Report: Disaggregated Data
(Note breakout variable and data results. Use the same response option(s) as the “Standard Report: ALL
Students” column to the left.) Notes / Observations
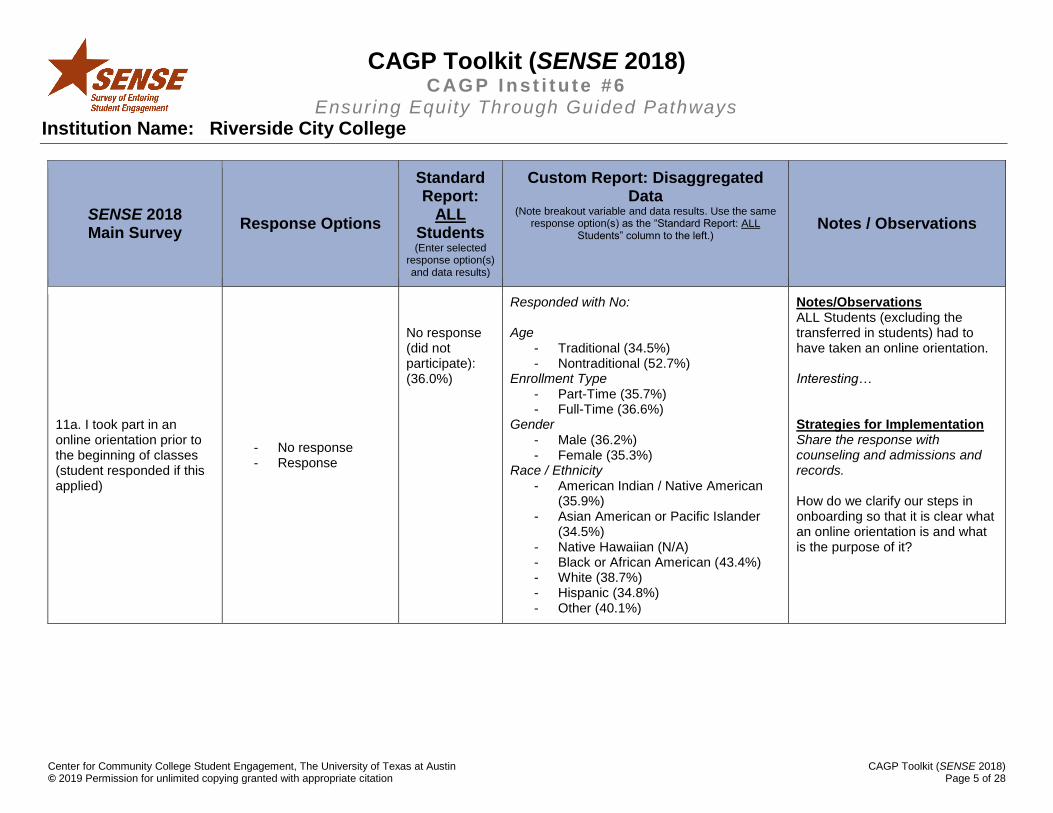
11a. I took part in an online orientation prior to the beginning of classes (student responded if this applied)
- No response - Response
No response (did not participate): (36.0%)
Responded with No: Age
- Traditional (34.5%) - Nontraditional (52.7%)
Enrollment Type - Part-Time (35.7%) - Full-Time (36.6%)
Gender
- Male (36.2%) - Female (35.3%)
Race / Ethnicity - American Indian / Native American
(35.9%) - Asian American or Pacific Islander
(34.5%) - Native Hawaiian (N/A) - Black or African American (43.4%) - White (38.7%) - Hispanic (34.8%) - Other (40.1%)
Notes/Observations ALL Students (excluding the transferred in students) had to have taken an online orientation. Interesting… Strategies for Implementation Share the response with counseling and admissions and records. How do we clarify our steps in onboarding so that it is clear what an online orientation is and what is the purpose of it?
CAGP Toolkit (SENSE 2018) C AGP I nst i tu te #6
Ensuring Equity Through Guided Pathways Institution Name: Riverside City College
Center for Community College Student Engagement, The University of Texas at Austin CAGP Toolkit (SENSE 2018) © 2019 Permission for unlimited copying granted with appropriate citation Page 6 of 28
SENSE 2018 Main Survey
Response Options
Standard Report:
ALL Students (Enter selected
response option(s) and data results)
Custom Report: Disaggregated Data
(Note breakout variable and data results. Use the same response option(s) as the “Standard Report: ALL
Students” column to the left.) Notes / Observations
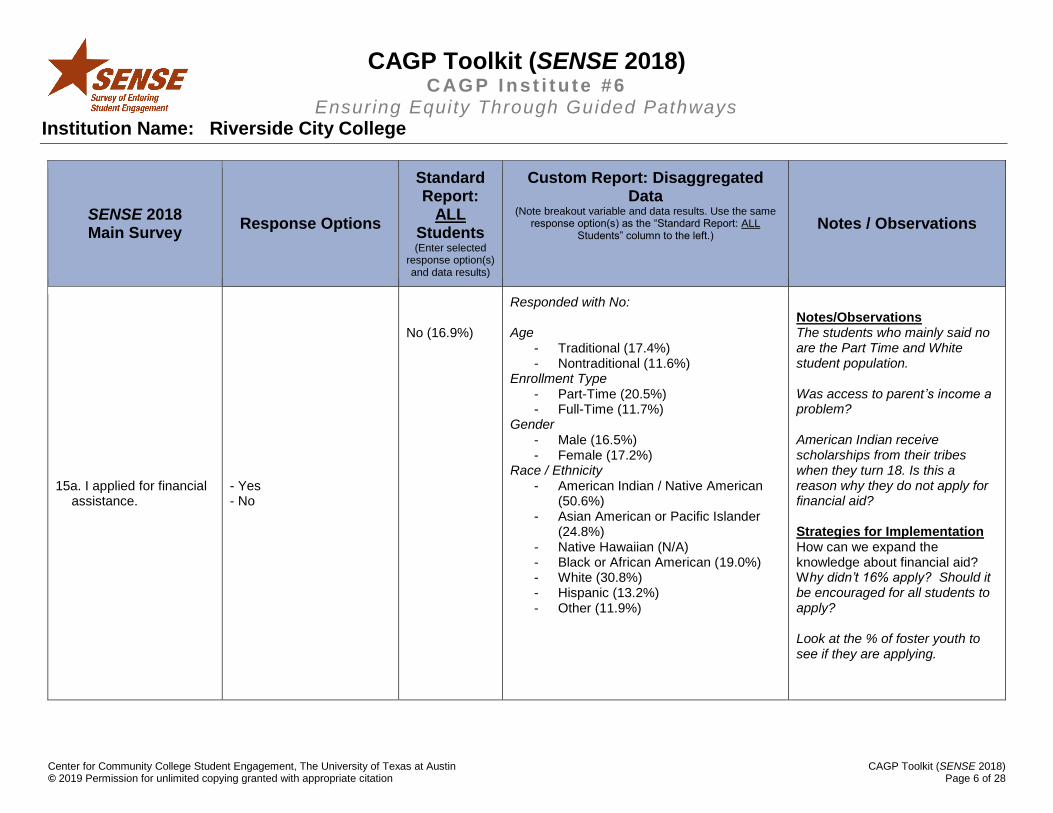
15a. I applied for financial assistance.
- Yes - No
No (16.9%)
Responded with No: Age
- Traditional (17.4%) - Nontraditional (11.6%)
Enrollment Type - Part-Time (20.5%) - Full-Time (11.7%)
Gender
- Male (16.5%) - Female (17.2%)
Race / Ethnicity - American Indian / Native American
(50.6%) - Asian American or Pacific Islander
(24.8%) - Native Hawaiian (N/A) - Black or African American (19.0%) - White (30.8%) - Hispanic (13.2%) - Other (11.9%)
Notes/Observations The students who mainly said no are the Part Time and White student population. Was access to parent’s income a problem? American Indian receive scholarships from their tribes when they turn 18. Is this a reason why they do not apply for financial aid? Strategies for Implementation How can we expand the knowledge about financial aid? Why didn’t 16% apply? Should it be encouraged for all students to apply? Look at the % of foster youth to see if they are applying.

CAGP Toolkit (SENSE 2018) C AGP I nst i tu te #6
Ensuring Equity Through Guided Pathways Institution Name: Riverside City College
Center for Community College Student Engagement, The University of Texas at Austin CAGP Toolkit (SENSE 2018) © 2019 Permission for unlimited copying granted with appropriate citation Page 7 of 28
SENSE 2018 Main Survey
Response Options
Standard Report:
ALL Students (Enter selected
response option(s) and data results)
Custom Report: Disaggregated Data
(Note breakout variable and data results. Use the same response option(s) as the “Standard Report: ALL
Students” column to the left.) Notes / Observations
18c. All the courses I needed to take during my first semester/quarter were available at times convenient for me.
- Strongly disagree - Disagree - Neutral - Agree - Strongly agree
Strongly disagree (11.6%) Disagree (14.9%)
Responded with Strongly disagree OR Disagree: Age
- Traditional (25.0%) - Nontraditional (42.9%)
Enrollment Type - Part-Time (57.3%) - Full-Time (41.4%)
Gender - Male (50.8%) - Female (53.0%)
Race / Ethnicity - American Indian / Native American
(64.1%) - Asian American or Pacific Islander
(35.6%) - Native Hawaiian (N/A) - Black or African American (59.8%) - White (53.1%) - Hispanic (52.4%) - Other (44.7%)
Notes/Observations Non traditional students disagree that the courses were available and convenient. Is it the course or the section? What courses are they trying to take? If it is the section, is it offered at the right times? Are there any specific Instructor issues? ALL the courses needed? Or some of the courses needed? Strategies for Implementation We need more context for this question… It’s hard to pinpoint solutions if we are unsure as to what is needed from students.
CAGP Toolkit (SENSE 2018) C AGP I nst i tu te #6
Ensuring Equity Through Guided Pathways Institution Name: Riverside City College
Center for Community College Student Engagement, The University of Texas at Austin CAGP Toolkit (SENSE 2018) © 2019 Permission for unlimited copying granted with appropriate citation Page 8 of 28
SENSE 2018 Main Survey
Response Options
Standard Report:
ALL Students (Enter selected
response option(s) and data results)
Custom Report: Disaggregated Data
(Note breakout variable and data results. Use the same response option(s) as the “Standard Report: ALL
Students” column to the left.) Notes / Observations
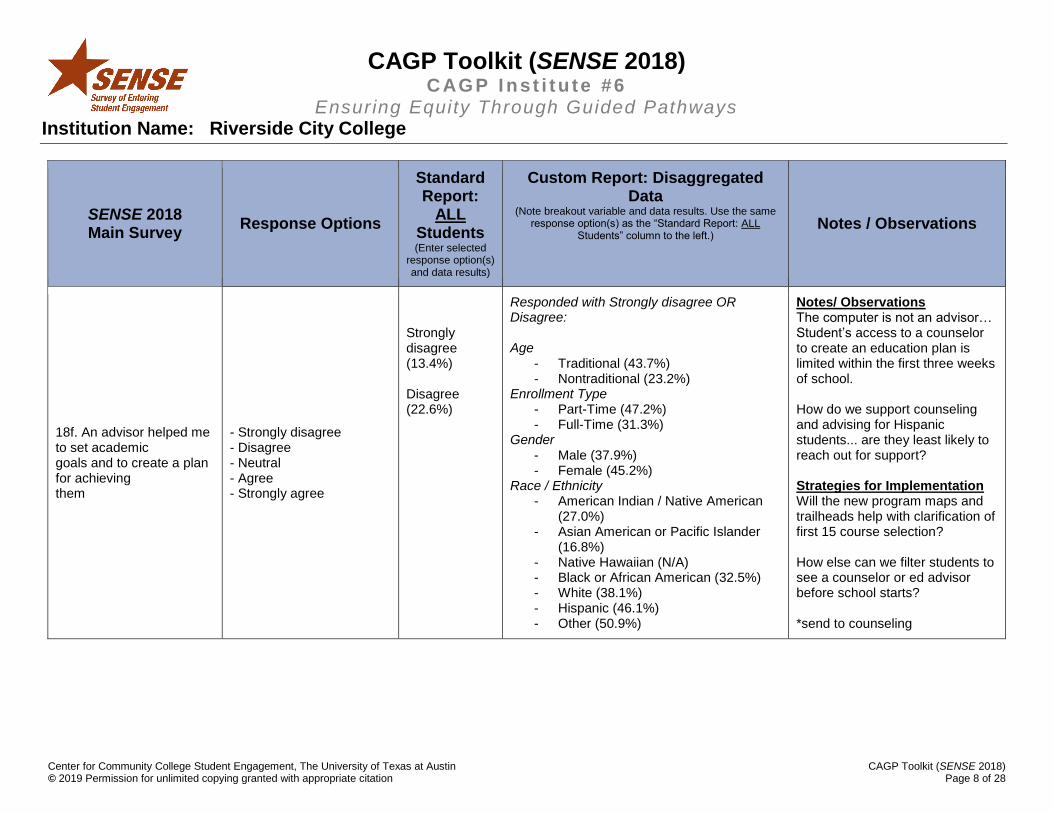
18f. An advisor helped me to set academic goals and to create a plan for achieving them
- Strongly disagree - Disagree - Neutral - Agree - Strongly agree
Strongly disagree (13.4%) Disagree (22.6%)
Responded with Strongly disagree OR Disagree: Age
- Traditional (43.7%) - Nontraditional (23.2%)
Enrollment Type - Part-Time (47.2%) - Full-Time (31.3%)
Gender - Male (37.9%) - Female (45.2%)
Race / Ethnicity - American Indian / Native American
(27.0%) - Asian American or Pacific Islander
(16.8%) - Native Hawaiian (N/A) - Black or African American (32.5%) - White (38.1%) - Hispanic (46.1%) - Other (50.9%)
Notes/ Observations The computer is not an advisor… Student’s access to a counselor to create an education plan is limited within the first three weeks of school. How do we support counseling and advising for Hispanic students... are they least likely to reach out for support? Strategies for Implementation Will the new program maps and trailheads help with clarification of first 15 course selection? How else can we filter students to see a counselor or ed advisor before school starts? *send to counseling
CAGP Toolkit (SENSE 2018) C AGP I nst i tu te #6
Ensuring Equity Through Guided Pathways Institution Name: Riverside City College
Center for Community College Student Engagement, The University of Texas at Austin CAGP Toolkit (SENSE 2018) © 2019 Permission for unlimited copying granted with appropriate citation Page 9 of 28
SENSE 2018 Main Survey
Response Options Standard Report: ALL Students
(Enter selected response option(s) and data results)
Custom Report: Disaggregated Data
(Note breakout variable and data results. Use the same response option(s) as the
“Standard Report: ALL Students” column to the left.)
Notes / Observations
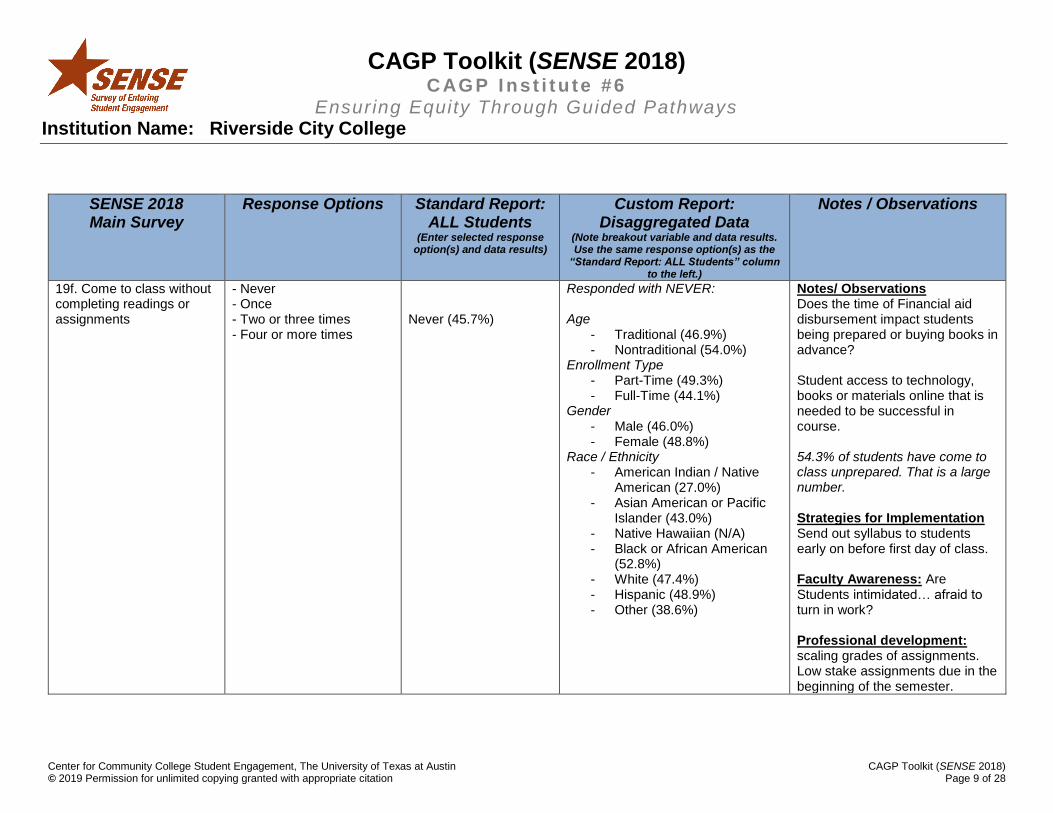
19f. Come to class without completing readings or assignments
- Never - Once - Two or three times - Four or more times
Never (45.7%)
Responded with NEVER: Age
- Traditional (46.9%) - Nontraditional (54.0%)
Enrollment Type - Part-Time (49.3%) - Full-Time (44.1%)
Gender - Male (46.0%) - Female (48.8%)
Race / Ethnicity - American Indian / Native
American (27.0%) - Asian American or Pacific
Islander (43.0%) - Native Hawaiian (N/A) - Black or African American
(52.8%) - White (47.4%) - Hispanic (48.9%) - Other (38.6%)
Notes/ Observations Does the time of Financial aid disbursement impact students being prepared or buying books in advance? Student access to technology, books or materials online that is needed to be successful in course. 54.3% of students have come to class unprepared. That is a large number. Strategies for Implementation Send out syllabus to students early on before first day of class. Faculty Awareness: Are Students intimidated… afraid to turn in work? Professional development: scaling grades of assignments. Low stake assignments due in the beginning of the semester.
CAGP Toolkit (SENSE 2018) C AGP I nst i tu te #6
Ensuring Equity Through Guided Pathways Institution Name: Riverside City College
Center for Community College Student Engagement, The University of Texas at Austin CAGP Toolkit (SENSE 2018) © 2019 Permission for unlimited copying granted with appropriate citation Page 10 of 28
SENSE 2018 Main Survey
Response Options Standard Report: ALL Students
(Enter selected response option(s) and data results)
Custom Report: Disaggregated Data
(Note breakout variable and data results. Use the same response option(s) as the
“Standard Report: ALL Students” column to the left.)
Notes / Observations
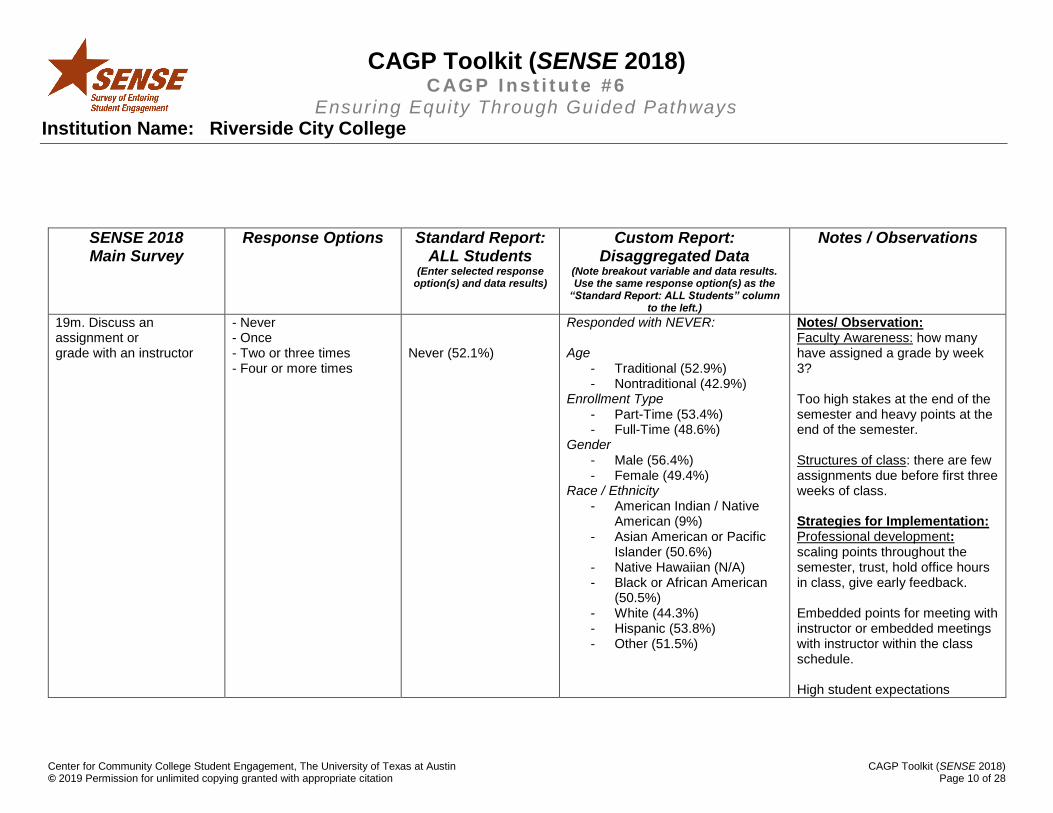
19m. Discuss an assignment or grade with an instructor
- Never - Once - Two or three times - Four or more times
Never (52.1%)
Responded with NEVER: Age
- Traditional (52.9%) - Nontraditional (42.9%)
Enrollment Type - Part-Time (53.4%) - Full-Time (48.6%)
Gender - Male (56.4%) - Female (49.4%)
Race / Ethnicity - American Indian / Native
American (9%) - Asian American or Pacific
Islander (50.6%) - Native Hawaiian (N/A) - Black or African American
(50.5%) - White (44.3%) - Hispanic (53.8%) - Other (51.5%)
Notes/ Observation: Faculty Awareness: how many have assigned a grade by week 3? Too high stakes at the end of the semester and heavy points at the end of the semester. Structures of class: there are few assignments due before first three weeks of class. Strategies for Implementation: Professional development: scaling points throughout the semester, trust, hold office hours in class, give early feedback. Embedded points for meeting with instructor or embedded meetings with instructor within the class schedule. High student expectations
CAGP Toolkit (SENSE 2018) C AGP I nst i tu te #6
Ensuring Equity Through Guided Pathways Institution Name: Riverside City College
Center for Community College Student Engagement, The University of Texas at Austin CAGP Toolkit (SENSE 2018) © 2019 Permission for unlimited copying granted with appropriate citation Page 11 of 28
SENSE 2018 Main Survey
Response Options Standard Report: ALL Students
(Enter selected response option(s) and data results)
Custom Report: Disaggregated Data
(Note breakout variable and data results. Use the same response option(s) as the
“Standard Report: ALL Students” column to the left.)
Notes / Observations
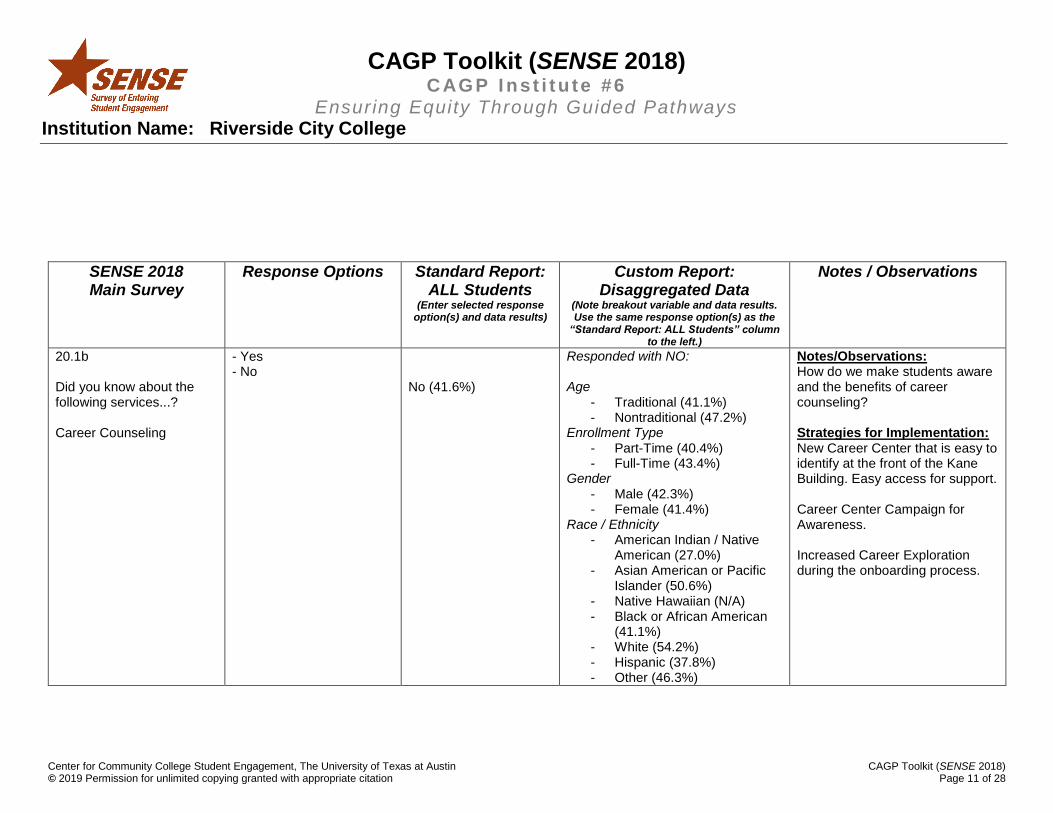
20.1b Did you know about the following services...? Career Counseling
- Yes - No
No (41.6%)
Responded with NO: Age
- Traditional (41.1%) - Nontraditional (47.2%)
Enrollment Type
- Part-Time (40.4%) - Full-Time (43.4%)
Gender - Male (42.3%) - Female (41.4%)
Race / Ethnicity - American Indian / Native
American (27.0%) - Asian American or Pacific
Islander (50.6%) - Native Hawaiian (N/A) - Black or African American
(41.1%) - White (54.2%) - Hispanic (37.8%) - Other (46.3%)
Notes/Observations: How do we make students aware and the benefits of career counseling? Strategies for Implementation: New Career Center that is easy to identify at the front of the Kane Building. Easy access for support. Career Center Campaign for Awareness. Increased Career Exploration during the onboarding process.
CAGP Toolkit (SENSE 2018) C AGP I nst i tu te #6
Ensuring Equity Through Guided Pathways Institution Name: Riverside City College
Center for Community College Student Engagement, The University of Texas at Austin CAGP Toolkit (SENSE 2018) © 2019 Permission for unlimited copying granted with appropriate citation Page 12 of 28
SENSE 2018 Main Survey
Response Options Standard Report: ALL Students
(Enter selected response option(s) and data results)
Custom Report: Disaggregated Data
(Note breakout variable and data results. Use the same response option(s) as the
“Standard Report: ALL Students” column to the left.)
Notes / Observations
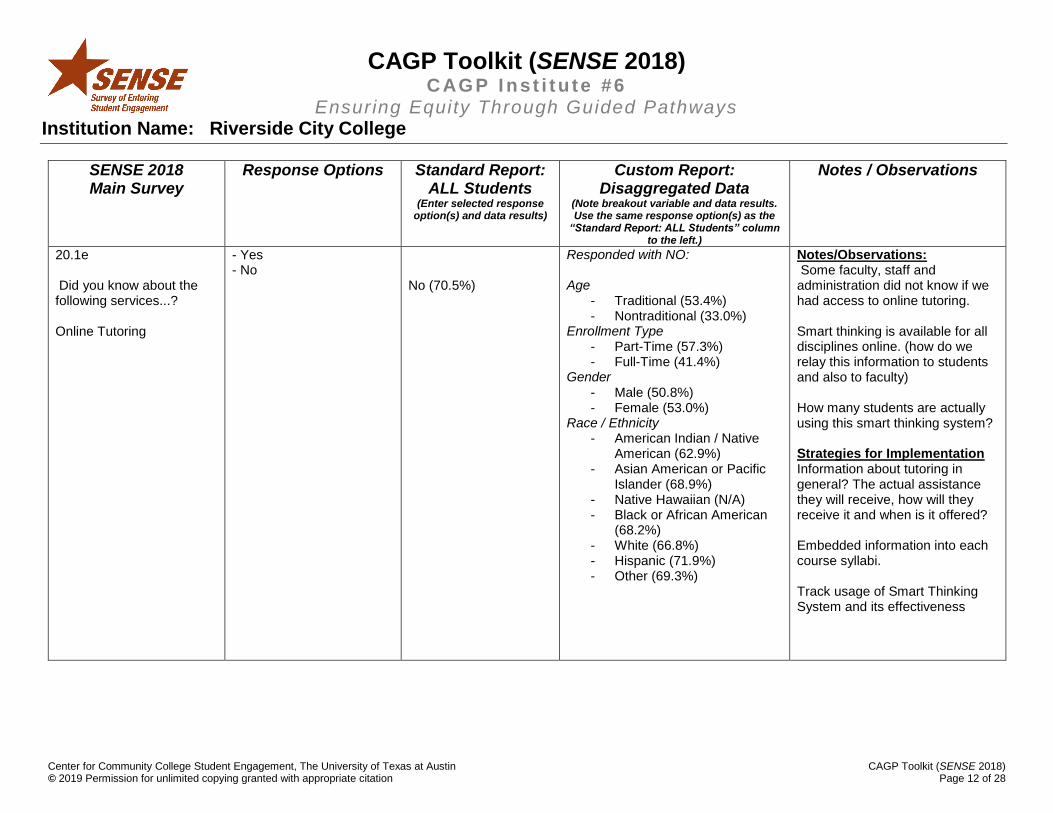
20.1e Did you know about the following services...? Online Tutoring
- Yes - No
No (70.5%)
Responded with NO: Age
- Traditional (53.4%) - Nontraditional (33.0%)
Enrollment Type - Part-Time (57.3%) - Full-Time (41.4%)
Gender - Male (50.8%) - Female (53.0%)
Race / Ethnicity - American Indian / Native
American (62.9%) - Asian American or Pacific
Islander (68.9%) - Native Hawaiian (N/A) - Black or African American
(68.2%) - White (66.8%) - Hispanic (71.9%) - Other (69.3%)
Notes/Observations: Some faculty, staff and administration did not know if we had access to online tutoring. Smart thinking is available for all disciplines online. (how do we relay this information to students and also to faculty) How many students are actually using this smart thinking system? Strategies for Implementation Information about tutoring in general? The actual assistance they will receive, how will they receive it and when is it offered? Embedded information into each course syllabi. Track usage of Smart Thinking System and its effectiveness
CAGP Toolkit (SENSE 2018) C AGP I nst i tu te #6
Ensuring Equity Through Guided Pathways Institution Name: Riverside City College
Center for Community College Student Engagement, The University of Texas at Austin CAGP Toolkit (SENSE 2018) © 2019 Permission for unlimited copying granted with appropriate citation Page 13 of 28
SENSE 2018 Main Survey
Response Options
Standard Report: ALL
Students (Enter selected
response option(s) and data results)
Custom Report: Disaggregated Data (Note breakout variable and data results. Use the same response
option(s) as the “Standard Report: ALL Students” column to the left.)
Notes / Observations
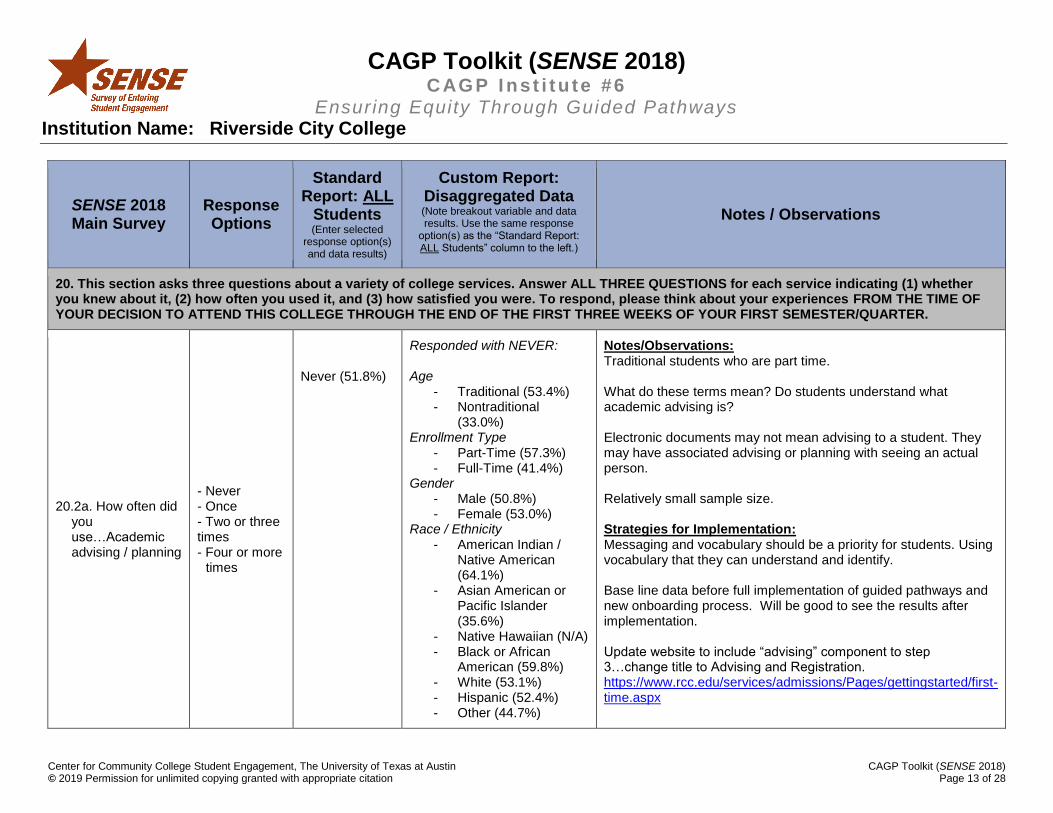
20. This section asks three questions about a variety of college services. Answer ALL THREE QUESTIONS for each service indicating (1) whether you knew about it, (2) how often you used it, and (3) how satisfied you were. To respond, please think about your experiences FROM THE TIME OF YOUR DECISION TO ATTEND THIS COLLEGE THROUGH THE END OF THE FIRST THREE WEEKS OF YOUR FIRST SEMESTER/QUARTER.
20.2a. How often did you use…Academic advising / planning
- Never - Once - Two or three times - Four or more
times
Never (51.8%)
Responded with NEVER: Age
- Traditional (53.4%) - Nontraditional
(33.0%) Enrollment Type
- Part-Time (57.3%) - Full-Time (41.4%)
Gender - Male (50.8%) - Female (53.0%)
Race / Ethnicity - American Indian /
Native American (64.1%)
- Asian American or Pacific Islander (35.6%)
- Native Hawaiian (N/A) - Black or African
American (59.8%) - White (53.1%) - Hispanic (52.4%) - Other (44.7%)
Notes/Observations: Traditional students who are part time. What do these terms mean? Do students understand what academic advising is? Electronic documents may not mean advising to a student. They may have associated advising or planning with seeing an actual person. Relatively small sample size. Strategies for Implementation: Messaging and vocabulary should be a priority for students. Using vocabulary that they can understand and identify. Base line data before full implementation of guided pathways and new onboarding process. Will be good to see the results after implementation. Update website to include “advising” component to step 3…change title to Advising and Registration. https://www.rcc.edu/services/admissions/Pages/gettingstarted/first-time.aspx
CAGP Toolkit (SENSE 2018) C AGP I nst i tu te #6
Ensuring Equity Through Guided Pathways Institution Name: Riverside City College
Center for Community College Student Engagement, The University of Texas at Austin CAGP Toolkit (SENSE 2018) © 2019 Permission for unlimited copying granted with appropriate citation Page 14 of 28
SENSE 2018 Main Survey
Response Options
Standard Report:
ALL Students (Enter selected
response option(s) and data results)
Custom Report: Disaggregated Data
(Note breakout variable and data results. Use the same response option(s) as the “Standard Report: ALL
Students” column to the left.) Notes / Observations

CAGP Toolkit (SENSE 2018) C AGP I nst i tu te #6
Ensuring Equity Through Guided Pathways Institution Name: Riverside City College
Center for Community College Student Engagement, The University of Texas at Austin CAGP Toolkit (SENSE 2018) © 2019 Permission for unlimited copying granted with appropriate citation Page 15 of 28
20.2b. How often did you use…Career counseling
- Never - Once - Two or three times - Four or more times
Never (78.4%)
Responded with NEVER: Age
- Traditional (78.4%) - Nontraditional (78.5%)
Enrollment Type
- Part-Time (80.2%) - Full-Time (76.0%)
Gender
- Male (79.7%) - Female (77.6%)
Race / Ethnicity - American Indian / Native American
(49.4%) - Asian American or Pacific Islander
(70.8%) - Native Hawaiian (N/A) - Black or African American (86.0%) - White (87.3%) - Hispanic (76.7%) - Other (86.6%)
New career exploration embedded in the steps to apply in the onboarding process. Website says “career exploration”. Counselors support efforts in assisting students through career development process, but what happens after they decide on a career? Internships? Networking? Job Search? Resume/ Cover Letter assistance, etc… Strategies for Implementation: Career Center awareness across the campus is needed. How does an office of 2 support a whole campus? Alignment of careers to program of study. Discussion planned with Career Coordinator about onboarding and what career exploration strategies. Career workshops planned for Fall/Spring 2019-20 Explore options to include career exploration at the feeder HS before application. Bridge HS career efforts to college. Explore opportunities for a communication plan on career readiness and exploration.
CAGP Toolkit (SENSE 2018) C AGP I nst i tu te #6
Ensuring Equity Through Guided Pathways Institution Name: Riverside City College
Center for Community College Student Engagement, The University of Texas at Austin CAGP Toolkit (SENSE 2018) © 2019 Permission for unlimited copying granted with appropriate citation Page 16 of 28
SENSE 2018 Main Survey
Response Options Standard Report: ALL Students
(Enter selected response option(s) and data results)
Custom Report: Disaggregated Data
(Note breakout variable and data results. Use the same response option(s) as the
“Standard Report: ALL Students” column to the left.)
Notes / Observations
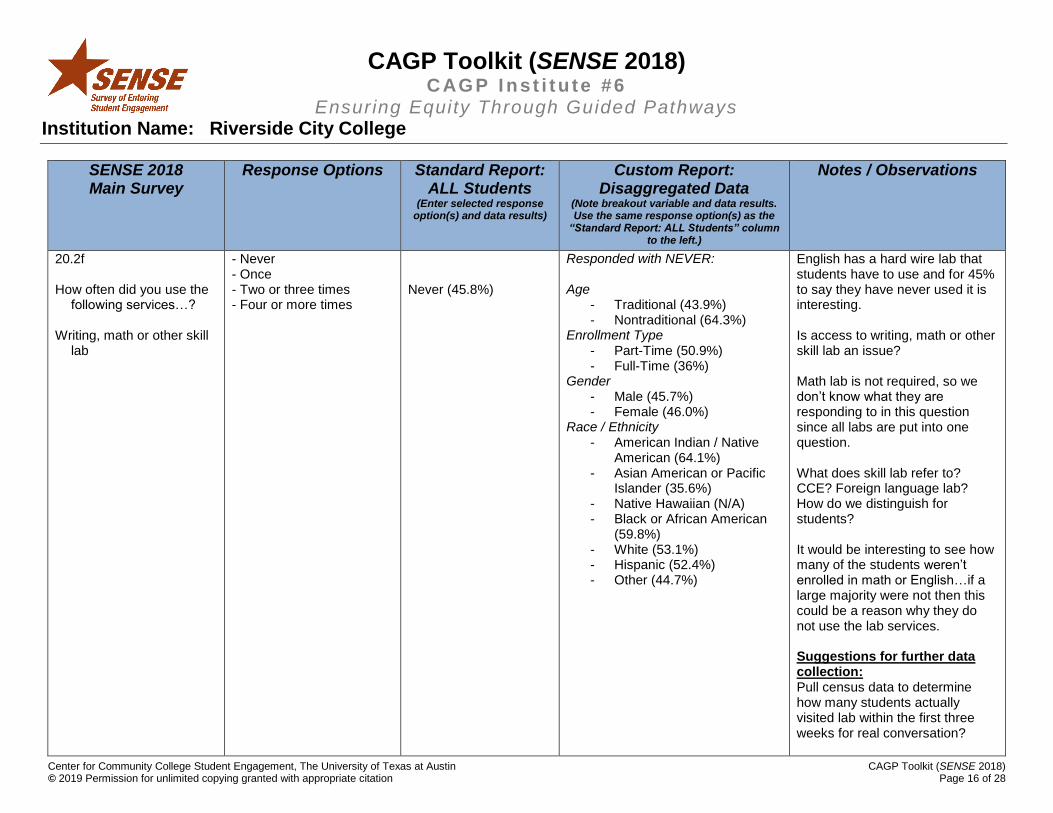
20.2f How often did you use the
following services…? Writing, math or other skill
lab
- Never - Once - Two or three times - Four or more times
Never (45.8%)
Responded with NEVER: Age
- Traditional (43.9%) - Nontraditional (64.3%)
Enrollment Type - Part-Time (50.9%) - Full-Time (36%)
Gender - Male (45.7%) - Female (46.0%)
Race / Ethnicity
- American Indian / Native American (64.1%)
- Asian American or Pacific Islander (35.6%)
- Native Hawaiian (N/A) - Black or African American
(59.8%) - White (53.1%) - Hispanic (52.4%) - Other (44.7%)
English has a hard wire lab that students have to use and for 45% to say they have never used it is interesting. Is access to writing, math or other skill lab an issue? Math lab is not required, so we don’t know what they are responding to in this question since all labs are put into one question. What does skill lab refer to? CCE? Foreign language lab? How do we distinguish for students? It would be interesting to see how many of the students weren’t enrolled in math or English…if a large majority were not then this could be a reason why they do not use the lab services. Suggestions for further data collection: Pull census data to determine how many students actually visited lab within the first three weeks for real conversation?
CAGP Toolkit (SENSE 2018) C AGP I nst i tu te #6
Ensuring Equity Through Guided Pathways Institution Name: Riverside City College
Center for Community College Student Engagement, The University of Texas at Austin CAGP Toolkit (SENSE 2018) © 2019 Permission for unlimited copying granted with appropriate citation Page 17 of 28
SENSE 2018 Main Survey
Response Options Standard Report: ALL Students
(Enter selected response option(s) and data results)
Custom Report: Disaggregated Data
(Note breakout variable and data results. Use the same response option(s) as the
“Standard Report: ALL Students” column to the left.)
Notes / Observations
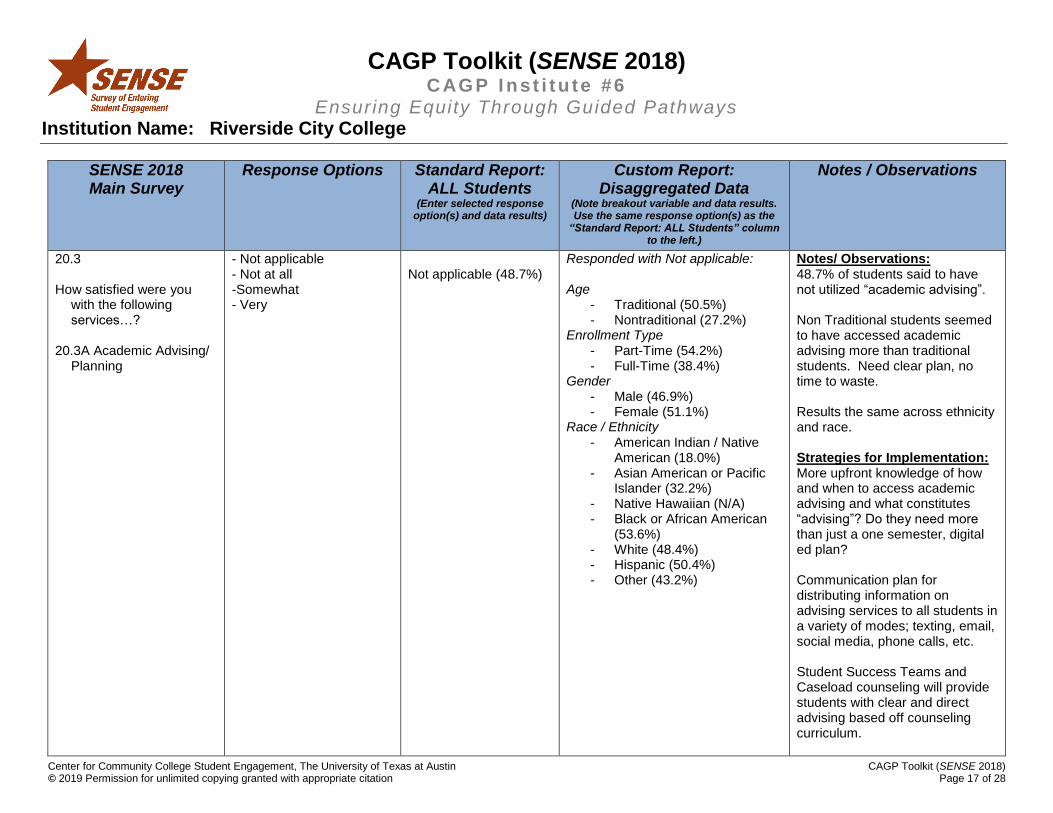
20.3 How satisfied were you
with the following services…?
20.3A Academic Advising/
Planning
- Not applicable - Not at all -Somewhat - Very
Not applicable (48.7%)
Responded with Not applicable: Age
- Traditional (50.5%) - Nontraditional (27.2%)
Enrollment Type - Part-Time (54.2%) - Full-Time (38.4%)
Gender - Male (46.9%) - Female (51.1%)
Race / Ethnicity
- American Indian / Native American (18.0%)
- Asian American or Pacific Islander (32.2%)
- Native Hawaiian (N/A) - Black or African American
(53.6%) - White (48.4%) - Hispanic (50.4%) - Other (43.2%)
Notes/ Observations: 48.7% of students said to have not utilized “academic advising”. Non Traditional students seemed to have accessed academic advising more than traditional students. Need clear plan, no time to waste. Results the same across ethnicity and race. Strategies for Implementation: More upfront knowledge of how and when to access academic advising and what constitutes “advising”? Do they need more than just a one semester, digital ed plan? Communication plan for distributing information on advising services to all students in a variety of modes; texting, email, social media, phone calls, etc. Student Success Teams and Caseload counseling will provide students with clear and direct advising based off counseling curriculum.
CAGP Toolkit (SENSE 2018) C AGP I nst i tu te #6
Ensuring Equity Through Guided Pathways Institution Name: Riverside City College
Center for Community College Student Engagement, The University of Texas at Austin CAGP Toolkit (SENSE 2018) © 2019 Permission for unlimited copying granted with appropriate citation Page 18 of 28
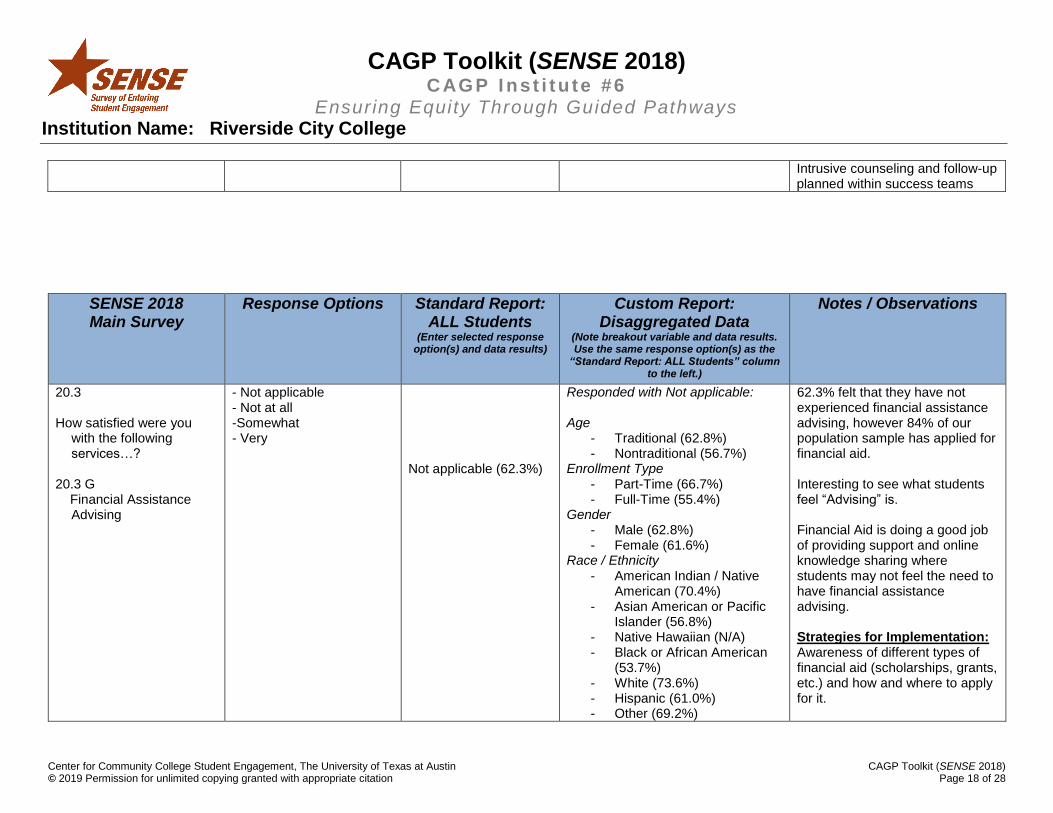
Intrusive counseling and follow-up planned within success teams
SENSE 2018 Main Survey
Response Options Standard Report: ALL Students
(Enter selected response option(s) and data results)
Custom Report: Disaggregated Data
(Note breakout variable and data results. Use the same response option(s) as the
“Standard Report: ALL Students” column to the left.)
Notes / Observations
20.3 How satisfied were you
with the following services…?
20.3 G Financial Assistance
Advising
- Not applicable - Not at all -Somewhat - Very
Not applicable (62.3%)
Responded with Not applicable: Age
- Traditional (62.8%) - Nontraditional (56.7%)
Enrollment Type - Part-Time (66.7%) - Full-Time (55.4%)
Gender - Male (62.8%) - Female (61.6%)
Race / Ethnicity - American Indian / Native
American (70.4%) - Asian American or Pacific
Islander (56.8%) - Native Hawaiian (N/A) - Black or African American
(53.7%) - White (73.6%) - Hispanic (61.0%) - Other (69.2%)
62.3% felt that they have not experienced financial assistance advising, however 84% of our population sample has applied for financial aid. Interesting to see what students feel “Advising” is. Financial Aid is doing a good job of providing support and online knowledge sharing where students may not feel the need to have financial assistance advising. Strategies for Implementation: Awareness of different types of financial aid (scholarships, grants, etc.) and how and where to apply for it.
CAGP Toolkit (SENSE 2018) C AGP I nst i tu te #6
Ensuring Equity Through Guided Pathways Institution Name: Riverside City College
Center for Community College Student Engagement, The University of Texas at Austin CAGP Toolkit (SENSE 2018) © 2019 Permission for unlimited copying granted with appropriate citation Page 19 of 28
SENSE 2018 Main Survey
Response Options Standard Report: ALL Students
(Enter selected response option(s) and data results)
Custom Report: Disaggregated Data
(Note breakout variable and data results. Use the same response option(s) as the
“Standard Report: ALL Students” column to the left.)
Notes / Observations
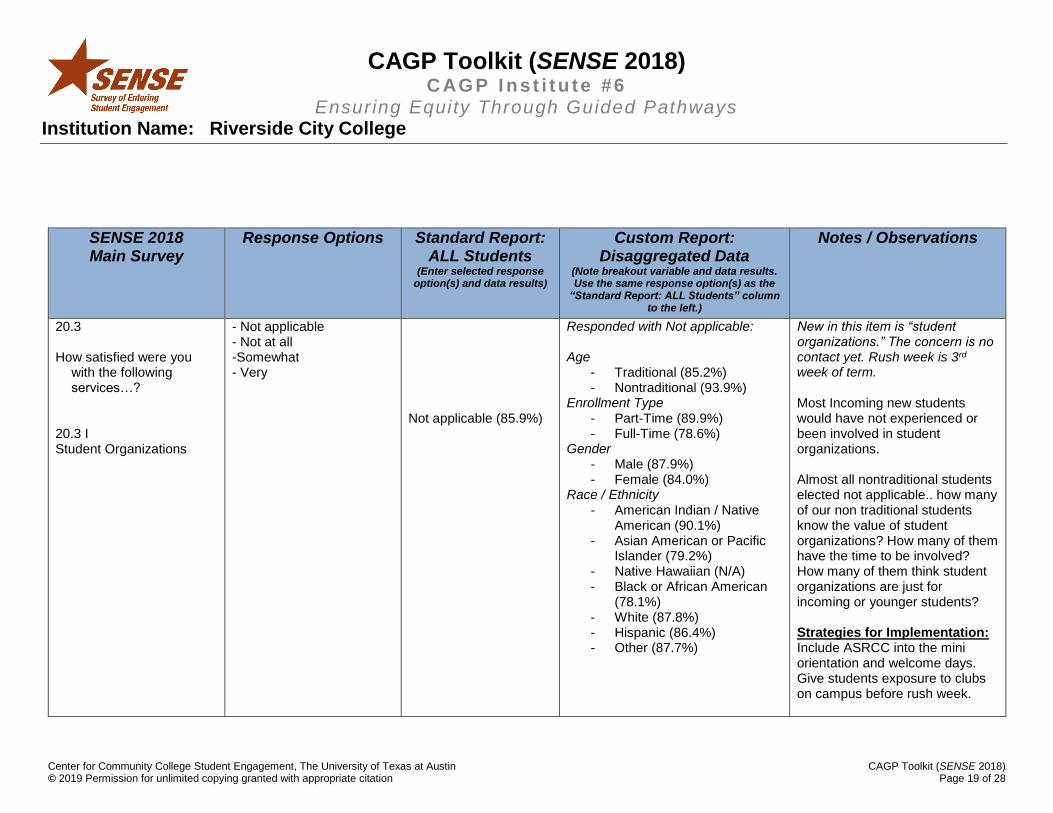
20.3 How satisfied were you
with the following services…?
20.3 I Student Organizations
- Not applicable - Not at all -Somewhat - Very
Not applicable (85.9%)
Responded with Not applicable: Age
- Traditional (85.2%) - Nontraditional (93.9%)
Enrollment Type - Part-Time (89.9%) - Full-Time (78.6%)
Gender - Male (87.9%) - Female (84.0%)
Race / Ethnicity - American Indian / Native
American (90.1%) - Asian American or Pacific
Islander (79.2%) - Native Hawaiian (N/A) - Black or African American
(78.1%) - White (87.8%) - Hispanic (86.4%) - Other (87.7%)
New in this item is “student organizations.” The concern is no contact yet. Rush week is 3rd week of term. Most Incoming new students would have not experienced or been involved in student organizations. Almost all nontraditional students elected not applicable.. how many of our non traditional students know the value of student organizations? How many of them have the time to be involved? How many of them think student organizations are just for incoming or younger students? Strategies for Implementation: Include ASRCC into the mini orientation and welcome days. Give students exposure to clubs on campus before rush week.
CAGP Toolkit (SENSE 2018) C AGP I nst i tu te #6
Ensuring Equity Through Guided Pathways Institution Name: Riverside City College
Center for Community College Student Engagement, The University of Texas at Austin CAGP Toolkit (SENSE 2018) © 2019 Permission for unlimited copying granted with appropriate citation Page 20 of 28
SENSE 2018 Main Survey
Response Options Standard Report: ALL Students
(Enter selected response option(s) and data results)
Custom Report: Disaggregated Data
(Note breakout variable and data results. Use the same response option(s) as the
“Standard Report: ALL Students” column to the left.)
Notes / Observations
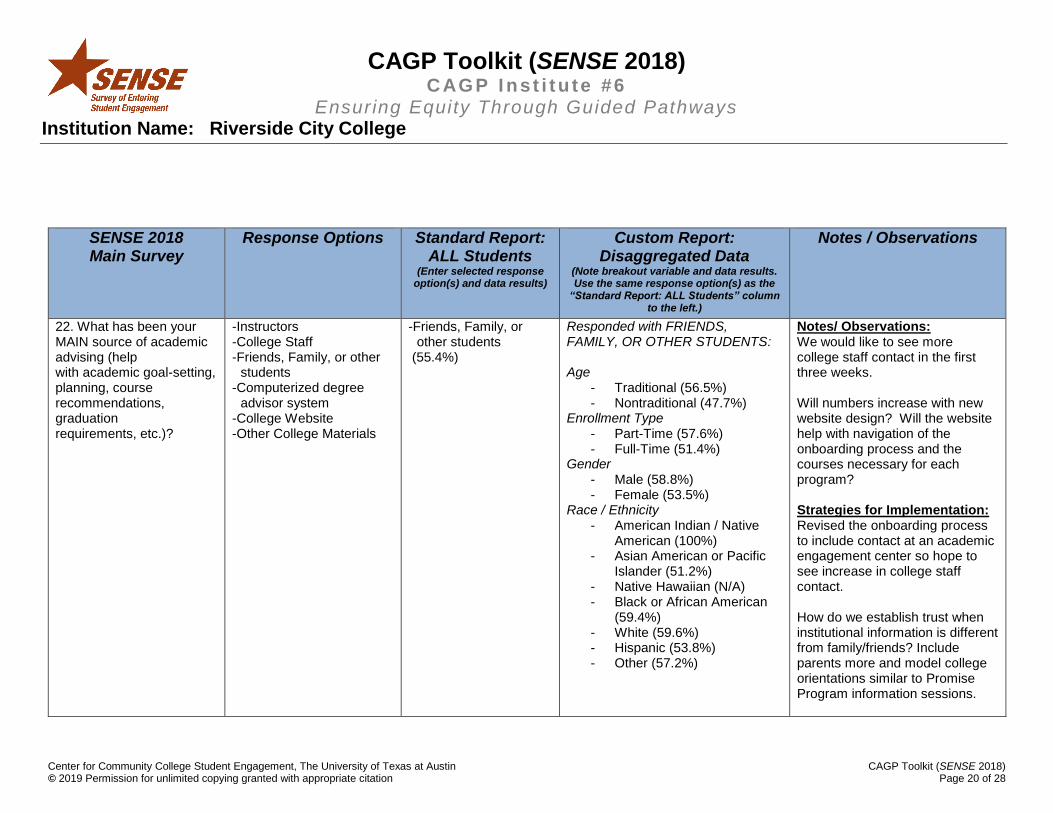
22. What has been your MAIN source of academic advising (help with academic goal-setting, planning, course recommendations, graduation requirements, etc.)?
-Instructors -College Staff -Friends, Family, or other
students -Computerized degree
advisor system -College Website -Other College Materials
-Friends, Family, or other students
(55.4%)
Responded with FRIENDS, FAMILY, OR OTHER STUDENTS: Age
- Traditional (56.5%) - Nontraditional (47.7%)
Enrollment Type - Part-Time (57.6%) - Full-Time (51.4%)
Gender - Male (58.8%) - Female (53.5%)
Race / Ethnicity - American Indian / Native
American (100%) - Asian American or Pacific
Islander (51.2%) - Native Hawaiian (N/A) - Black or African American
(59.4%) - White (59.6%) - Hispanic (53.8%) - Other (57.2%)
Notes/ Observations: We would like to see more college staff contact in the first three weeks. Will numbers increase with new website design? Will the website help with navigation of the onboarding process and the courses necessary for each program? Strategies for Implementation: Revised the onboarding process to include contact at an academic engagement center so hope to see increase in college staff contact. How do we establish trust when institutional information is different from family/friends? Include parents more and model college orientations similar to Promise Program information sessions.
CAGP Toolkit (SENSE 2018) C AGP I nst i tu te #6
Ensuring Equity Through Guided Pathways Institution Name: Riverside City College
Center for Community College Student Engagement, The University of Texas at Austin CAGP Toolkit (SENSE 2018) © 2019 Permission for unlimited copying granted with appropriate citation Page 21 of 28
Parents may also attend counseling sessions with student’s permission. Communication Plan and campaign to make entire community aware of advising at the CC. Partner with local HS to disseminate important advising information Discuss and develop plan at counselor to counselor conference for seamless transition from HS to college and clear understanding of advising resources
SENSE 2018 Main Survey
Response Options Standard Report: ALL Students
(Enter selected response option(s) and data results)
Custom Report: Disaggregated Data
(Note breakout variable and data results. Use the same response option(s) as the
“Standard Report: ALL Students” column to the left.)
Notes / Observations
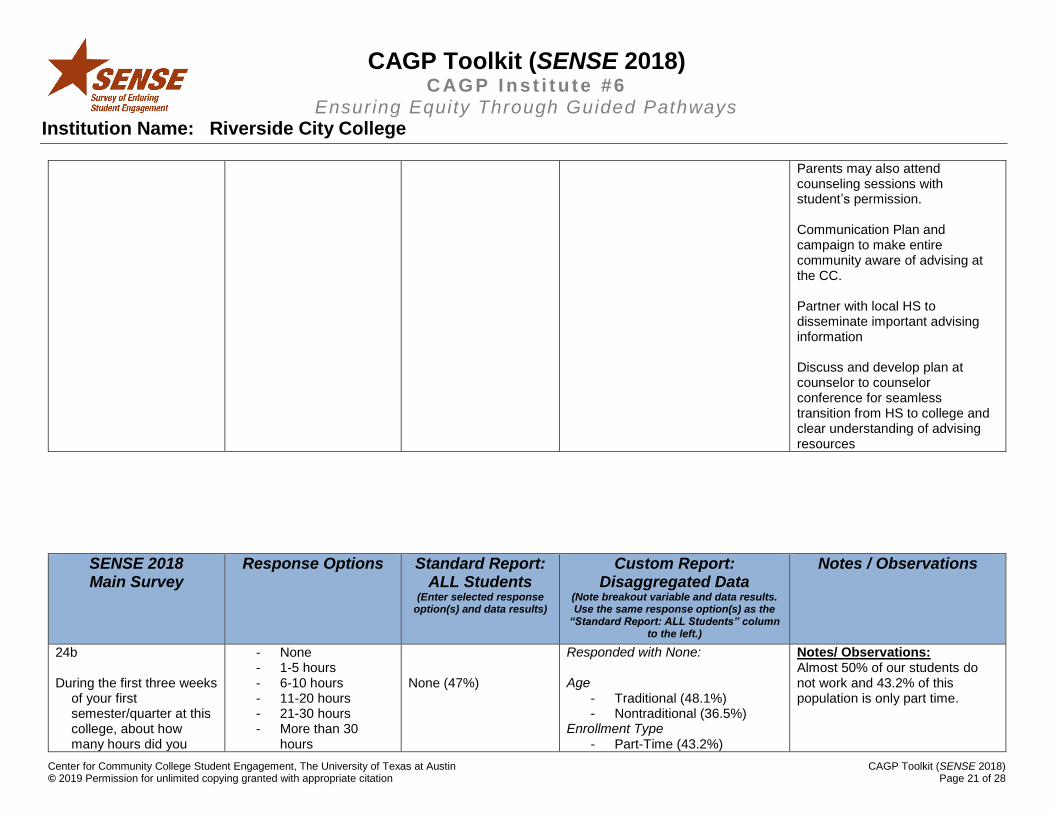
24b During the first three weeks
of your first semester/quarter at this college, about how many hours did you
- None - 1-5 hours - 6-10 hours - 11-20 hours - 21-30 hours - More than 30
hours
None (47%)
Responded with None: Age
- Traditional (48.1%) - Nontraditional (36.5%)
Enrollment Type - Part-Time (43.2%)
Notes/ Observations: Almost 50% of our students do not work and 43.2% of this population is only part time.
CAGP Toolkit (SENSE 2018) C AGP I nst i tu te #6
Ensuring Equity Through Guided Pathways Institution Name: Riverside City College
Center for Community College Student Engagement, The University of Texas at Austin CAGP Toolkit (SENSE 2018) © 2019 Permission for unlimited copying granted with appropriate citation Page 22 of 28
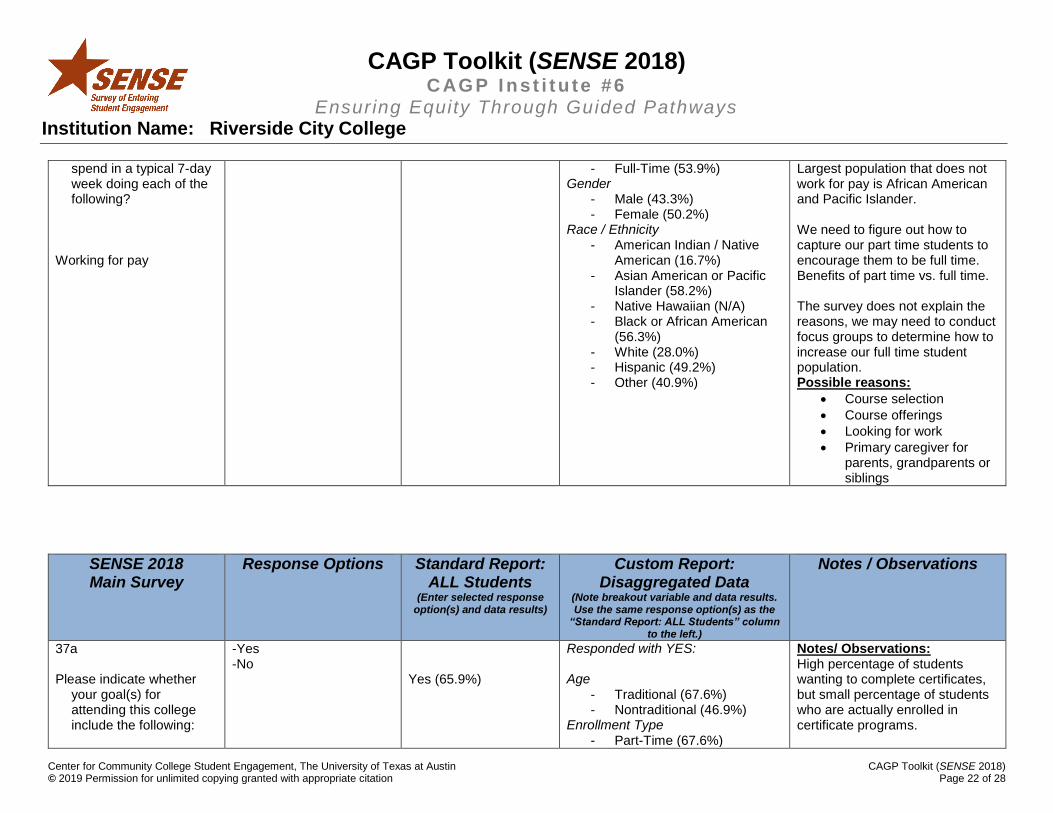
spend in a typical 7-day week doing each of the following?
Working for pay
- Full-Time (53.9%) Gender
- Male (43.3%) - Female (50.2%)
Race / Ethnicity - American Indian / Native
American (16.7%) - Asian American or Pacific
Islander (58.2%) - Native Hawaiian (N/A) - Black or African American
(56.3%) - White (28.0%) - Hispanic (49.2%) - Other (40.9%)
Largest population that does not work for pay is African American and Pacific Islander. We need to figure out how to capture our part time students to encourage them to be full time. Benefits of part time vs. full time. The survey does not explain the reasons, we may need to conduct focus groups to determine how to increase our full time student population. Possible reasons:
Course selection
Course offerings
Looking for work
Primary caregiver for parents, grandparents or siblings
SENSE 2018 Main Survey
Response Options Standard Report: ALL Students
(Enter selected response option(s) and data results)
Custom Report: Disaggregated Data
(Note breakout variable and data results. Use the same response option(s) as the
“Standard Report: ALL Students” column to the left.)
Notes / Observations
37a Please indicate whether
your goal(s) for attending this college include the following:
-Yes -No
Yes (65.9%)
Responded with YES: Age
- Traditional (67.6%) - Nontraditional (46.9%)
Enrollment Type - Part-Time (67.6%)
Notes/ Observations: High percentage of students wanting to complete certificates, but small percentage of students who are actually enrolled in certificate programs.
CAGP Toolkit (SENSE 2018) C AGP I nst i tu te #6
Ensuring Equity Through Guided Pathways Institution Name: Riverside City College
Center for Community College Student Engagement, The University of Texas at Austin CAGP Toolkit (SENSE 2018) © 2019 Permission for unlimited copying granted with appropriate citation Page 23 of 28
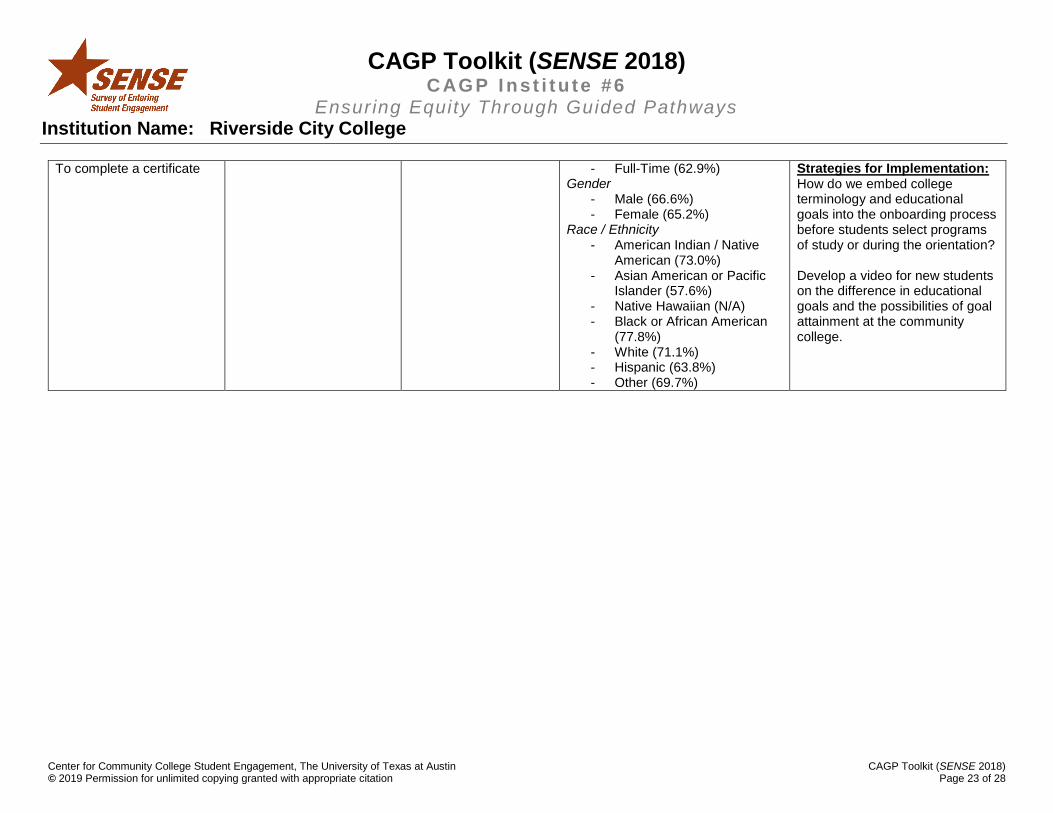
To complete a certificate - Full-Time (62.9%) Gender
- Male (66.6%) - Female (65.2%)
Race / Ethnicity - American Indian / Native
American (73.0%) - Asian American or Pacific
Islander (57.6%) - Native Hawaiian (N/A) - Black or African American
(77.8%) - White (71.1%) - Hispanic (63.8%) - Other (69.7%)
Strategies for Implementation: How do we embed college terminology and educational goals into the onboarding process before students select programs of study or during the orientation? Develop a video for new students on the difference in educational goals and the possibilities of goal attainment at the community college.
CAGP Toolkit (SENSE 2018) C AGP I nst i tu te #6
Ensuring Equity Through Guided Pathways Institution Name: Riverside City College
Center for Community College Student Engagement, The University of Texas at Austin CAGP Toolkit (SENSE 2018) © 2019 Permission for unlimited copying granted with appropriate citation Page 24 of 28
SENSE 2018 Guided Pathways
Special-Focus Module Items
Response Options
Standard Report: ALL Students
(Enter selected response option(s) and data results)
Custom Report: Disaggregated Data
(Note breakout variable and data results. Use the same response option(s) as the
“Standard Report: ALL Students” column to the left.)
Notes / Observations
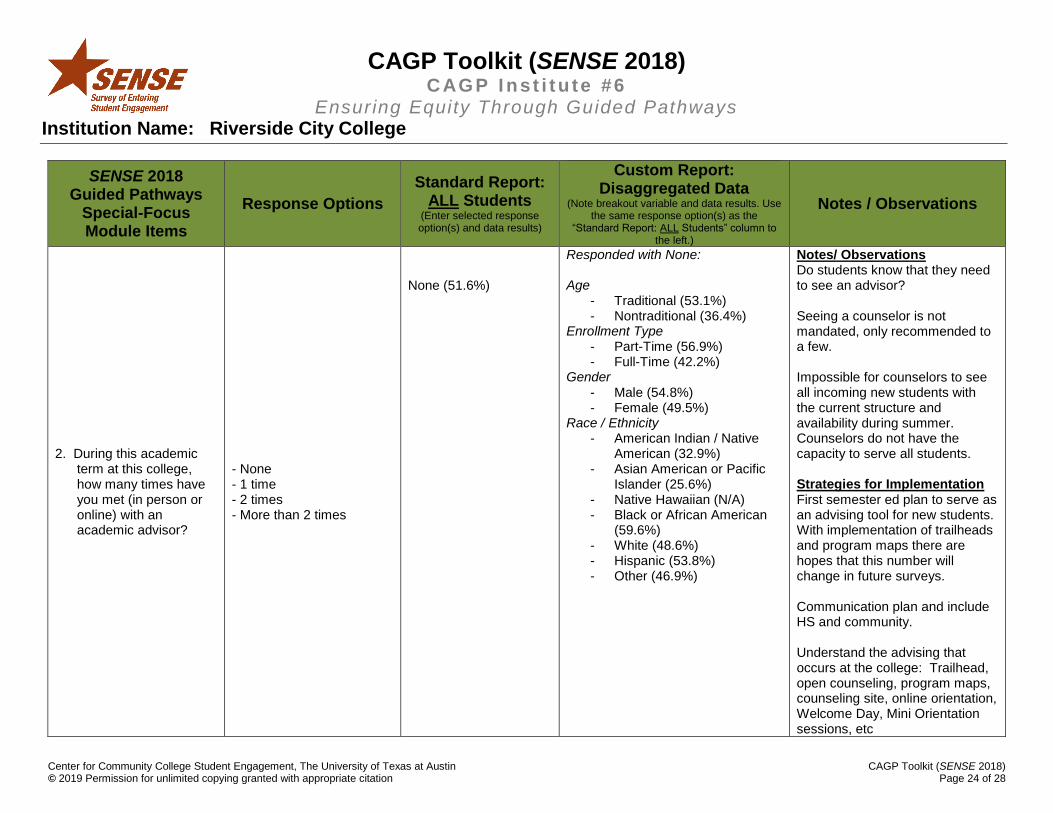
2. During this academic term at this college, how many times have you met (in person or online) with an academic advisor?
- None - 1 time - 2 times - More than 2 times
None (51.6%)
Responded with None: Age
- Traditional (53.1%) - Nontraditional (36.4%)
Enrollment Type - Part-Time (56.9%) - Full-Time (42.2%)
Gender - Male (54.8%) - Female (49.5%)
Race / Ethnicity - American Indian / Native
American (32.9%) - Asian American or Pacific
Islander (25.6%) - Native Hawaiian (N/A) - Black or African American
(59.6%) - White (48.6%) - Hispanic (53.8%) - Other (46.9%)
Notes/ Observations Do students know that they need to see an advisor? Seeing a counselor is not mandated, only recommended to a few. Impossible for counselors to see all incoming new students with the current structure and availability during summer. Counselors do not have the capacity to serve all students. Strategies for Implementation First semester ed plan to serve as an advising tool for new students. With implementation of trailheads and program maps there are hopes that this number will change in future surveys. Communication plan and include HS and community. Understand the advising that occurs at the college: Trailhead, open counseling, program maps, counseling site, online orientation, Welcome Day, Mini Orientation sessions, etc
CAGP Toolkit (SENSE 2018) C AGP I nst i tu te #6
Ensuring Equity Through Guided Pathways Institution Name: Riverside City College
Center for Community College Student Engagement, The University of Texas at Austin CAGP Toolkit (SENSE 2018) © 2019 Permission for unlimited copying granted with appropriate citation Page 25 of 28
SENSE 2018 Guided Pathways
Special-Focus Module Items
Response Options
Standard Report: ALL Students
(Enter selected response option(s) and data results)
Custom Report: Disaggregated Data
(Note breakout variable and data results. Use the same response option(s) as the
“Standard Report: ALL Students” column to the left.)
Notes / Observations
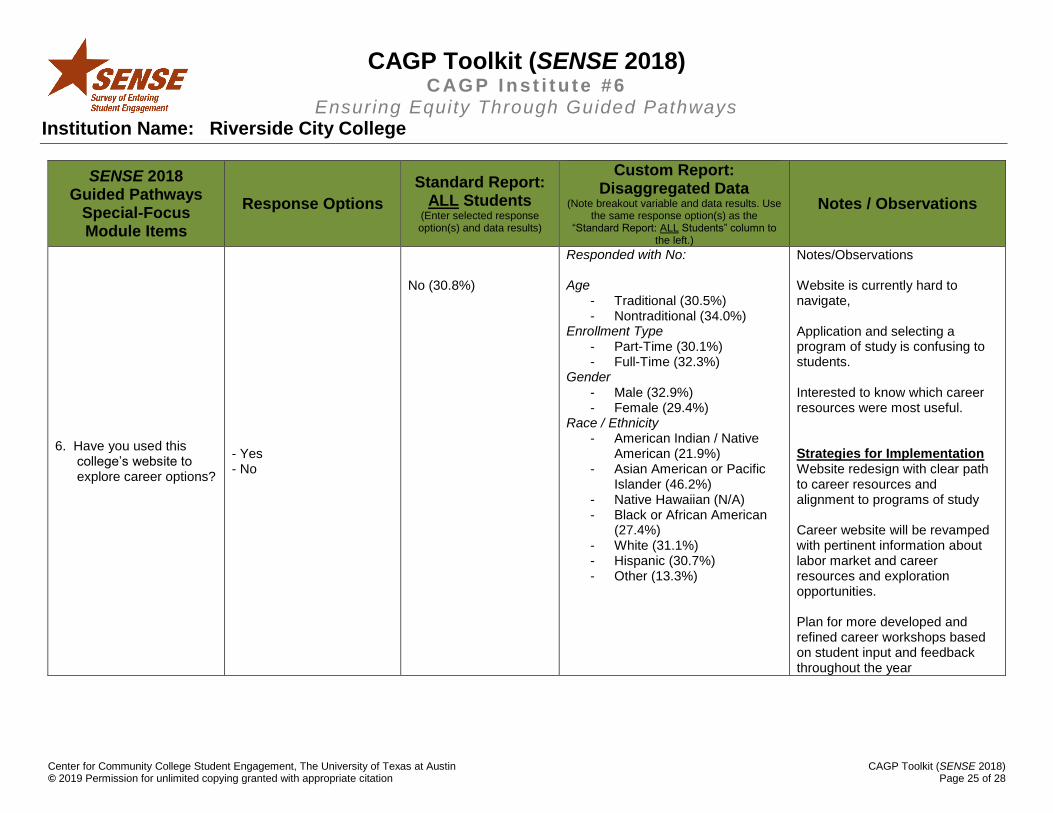
6. Have you used this college’s website to explore career options?
- Yes - No
No (30.8%)
Responded with No: Age
- Traditional (30.5%) - Nontraditional (34.0%)
Enrollment Type - Part-Time (30.1%) - Full-Time (32.3%)
Gender - Male (32.9%) - Female (29.4%)
Race / Ethnicity - American Indian / Native
American (21.9%) - Asian American or Pacific
Islander (46.2%) - Native Hawaiian (N/A) - Black or African American
(27.4%) - White (31.1%) - Hispanic (30.7%) - Other (13.3%)
Notes/Observations Website is currently hard to navigate, Application and selecting a program of study is confusing to students. Interested to know which career resources were most useful. Strategies for Implementation Website redesign with clear path to career resources and alignment to programs of study Career website will be revamped with pertinent information about labor market and career resources and exploration opportunities. Plan for more developed and refined career workshops based on student input and feedback throughout the year
CAGP Toolkit (SENSE 2018) C AGP I nst i tu te #6
Ensuring Equity Through Guided Pathways Institution Name: Riverside City College
Center for Community College Student Engagement, The University of Texas at Austin CAGP Toolkit (SENSE 2018) © 2019 Permission for unlimited copying granted with appropriate citation Page 26 of 28
SENSE 2018 Guided Pathways
Special-Focus Module Items
Response Options
Standard Report: ALL Students
(Enter selected response option(s) and data results)
Custom Report: Disaggregated Data
(Note breakout variable and data results. Use the same response option(s) as the
“Standard Report: ALL Students” column to the left.)
Notes / Observations
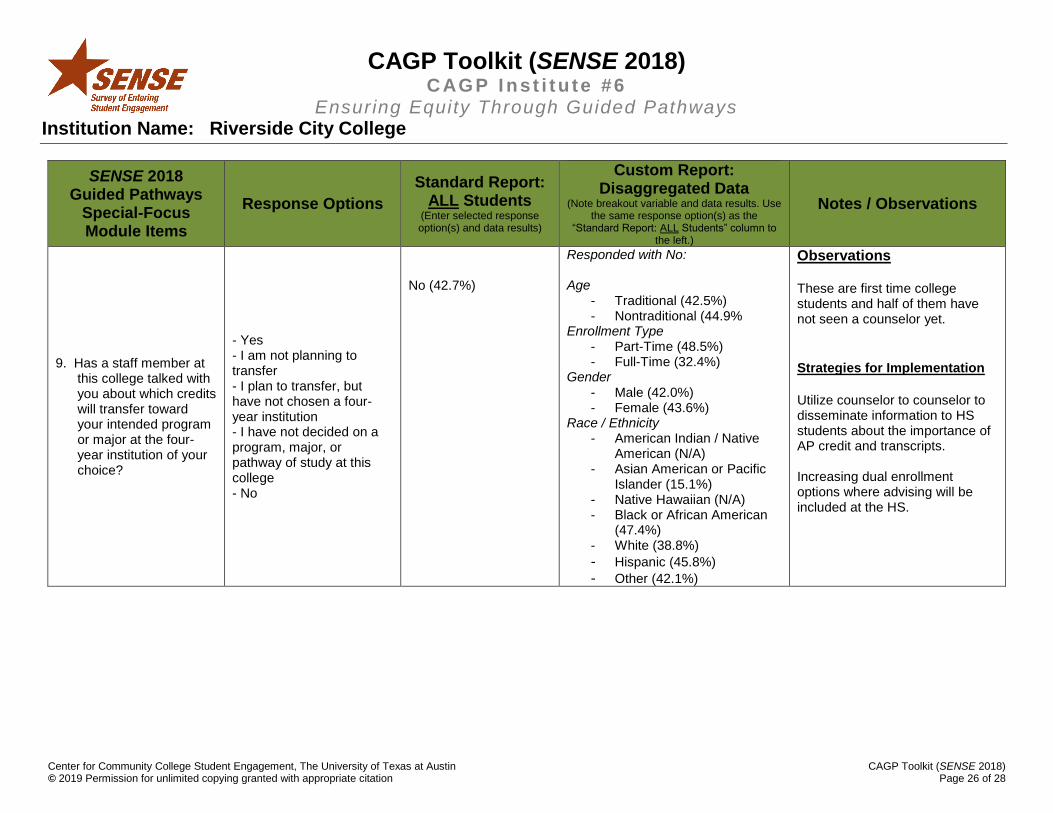
9. Has a staff member at this college talked with you about which credits will transfer toward your intended program or major at the four-year institution of your choice?
- Yes - I am not planning to transfer - I plan to transfer, but have not chosen a four-year institution - I have not decided on a program, major, or pathway of study at this college - No
No (42.7%)
Responded with No: Age
- Traditional (42.5%) - Nontraditional (44.9%
Enrollment Type - Part-Time (48.5%) - Full-Time (32.4%)
Gender - Male (42.0%) - Female (43.6%)
Race / Ethnicity - American Indian / Native
American (N/A) - Asian American or Pacific
Islander (15.1%) - Native Hawaiian (N/A) - Black or African American
(47.4%) - White (38.8%)
- Hispanic (45.8%) - Other (42.1%)
Observations These are first time college students and half of them have not seen a counselor yet.
Strategies for Implementation
Utilize counselor to counselor to disseminate information to HS students about the importance of AP credit and transcripts. Increasing dual enrollment options where advising will be included at the HS.
CAGP Toolkit (SENSE 2018) C AGP I nst i tu te #6
Ensuring Equity Through Guided Pathways Institution Name: Riverside City College
Center for Community College Student Engagement, The University of Texas at Austin CAGP Toolkit (SENSE 2018) © 2019 Permission for unlimited copying granted with appropriate citation Page 27 of 28
SENSE 2018 Guided Pathways
Special-Focus Module Items
Response Options
Standard Report: ALL Students
(Enter selected response option(s) and data results)
Custom Report: Disaggregated Data
(Note breakout variable and data results. Use the same response option(s) as the
“Standard Report: ALL Students” column to the left.)
Notes / Observations
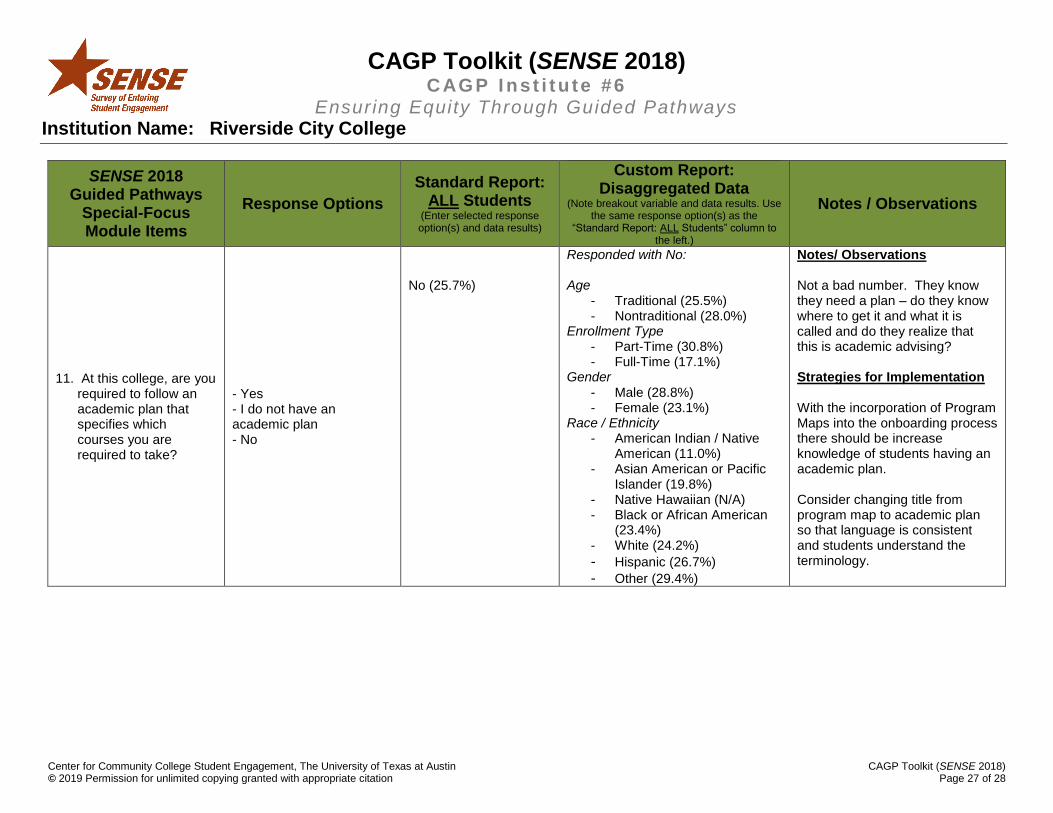
11. At this college, are you required to follow an academic plan that specifies which courses you are required to take?
- Yes - I do not have an academic plan - No
No (25.7%)
Responded with No: Age
- Traditional (25.5%) - Nontraditional (28.0%)
Enrollment Type - Part-Time (30.8%) - Full-Time (17.1%)
Gender - Male (28.8%) - Female (23.1%)
Race / Ethnicity - American Indian / Native
American (11.0%) - Asian American or Pacific
Islander (19.8%) - Native Hawaiian (N/A) - Black or African American
(23.4%) - White (24.2%)
- Hispanic (26.7%) - Other (29.4%)
Notes/ Observations Not a bad number. They know they need a plan – do they know where to get it and what it is called and do they realize that this is academic advising? Strategies for Implementation With the incorporation of Program Maps into the onboarding process there should be increase knowledge of students having an academic plan. Consider changing title from program map to academic plan so that language is consistent and students understand the terminology.
CAGP Toolkit (SENSE 2018) C AGP I nst i tu te #6
Ensuring Equity Through Guided Pathways Institution Name: Riverside City College
Center for Community College Student Engagement, The University of Texas at Austin CAGP Toolkit (SENSE 2018) © 2019 Permission for unlimited copying granted with appropriate citation Page 28 of 28
SENSE 2018 Guided Pathways
Special-Focus Module Items
Response Options
Standard Report: ALL Students
(Enter selected response option(s) and data results)
Custom Report: Disaggregated Data
(Note breakout variable and data results. Use the same response option(s) as the
“Standard Report: ALL Students” column to the left.)
Notes / Observations
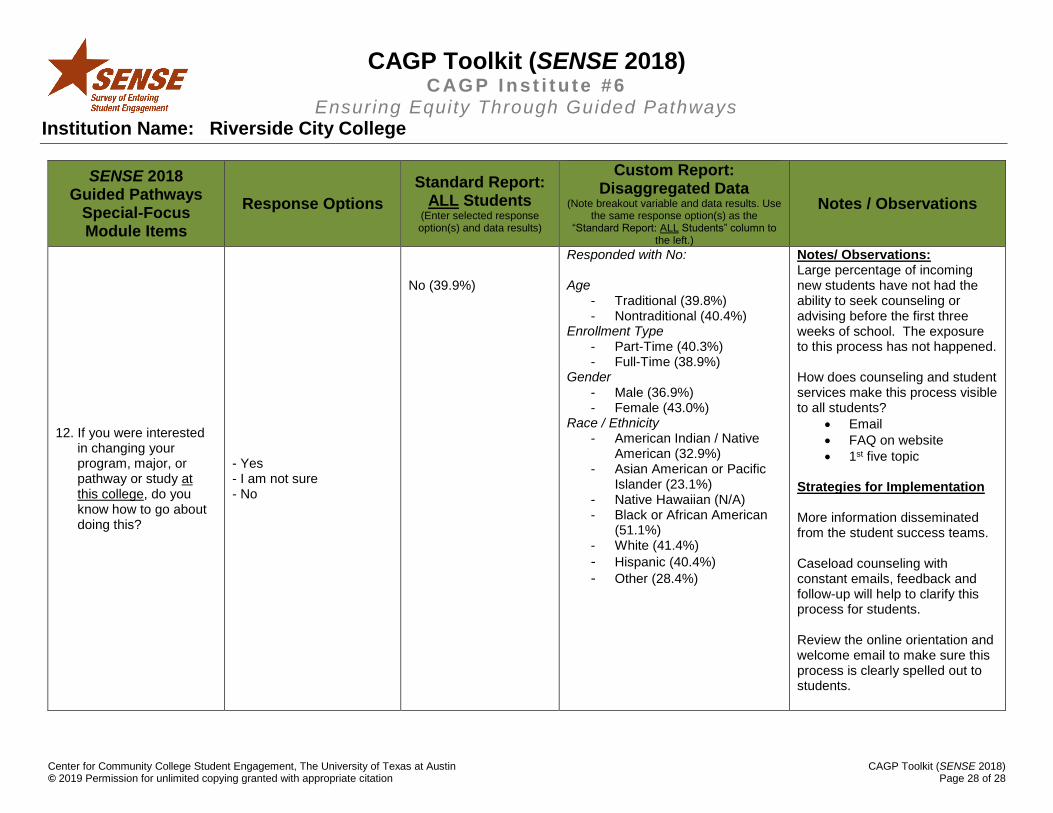
12. If you were interested in changing your program, major, or pathway or study at this college, do you know how to go about doing this?
- Yes - I am not sure - No
No (39.9%)
Responded with No: Age
- Traditional (39.8%) - Nontraditional (40.4%)
Enrollment Type - Part-Time (40.3%) - Full-Time (38.9%)
Gender - Male (36.9%) - Female (43.0%)
Race / Ethnicity - American Indian / Native
American (32.9%) - Asian American or Pacific
Islander (23.1%) - Native Hawaiian (N/A) - Black or African American
(51.1%) - White (41.4%)
- Hispanic (40.4%) - Other (28.4%)
Notes/ Observations: Large percentage of incoming new students have not had the ability to seek counseling or advising before the first three weeks of school. The exposure to this process has not happened. How does counseling and student services make this process visible to all students?
FAQ on website
1st five topic Strategies for Implementation More information disseminated from the student success teams. Caseload counseling with constant emails, feedback and follow-up will help to clarify this process for students. Review the online orientation and welcome email to make sure this process is clearly spelled out to students.