Embed Size (px)
Citation preview

Cal-Comp Electronics (Thailand) Public Company Limited
and its subsidiaries
Report and consolidated financial statements
31 December 2020

Independent Auditor's Report
To the Shareholders of Cal-Comp Electronics (Thailand) Public Company Limited
Opinion
I have audited the accompanying consolidated financial statements of Cal-Comp Electronics
(Thailand) Public Company Limited and its subsidiaries (“the Group”), which comprise the
consolidated statement of financial position as at 31 December 2020, and the related consolidated
statements of income, comprehensive income, changes in shareholders’ equity and cash flows
for the year then ended, which are presented in US Dollar and Thai Baht, and notes to the
consolidated financial statements, including a summary of significant accounting policies, and
have also audited the separate financial statements of Cal-Comp Electronics (Thailand) Public
Company Limited for the same period.
In my opinion, the financial statements referred to above present fairly, in all material respects,
the financial position of Cal-Comp Electronics (Thailand) Public Company Limited and its
subsidiaries and of Cal-Comp Electronics (Thailand) Public Company Limited as at 31 December
2020, their financial performance and cash flows for the year then ended, which are presented in
US Dollar and Thai Baht, in accordance with Thai Financial Reporting Standards.
Basis for Opinion
I conducted my audit in accordance with Thai Standards on Auditing. My responsibilities
under those standards are further described in the Auditor’s Responsibilities for the Audit of
the Financial Statements section of my report. I am independent of the Group in accordance with
the Code of Ethics for Professional Accountants as issued by the Federation of Accounting
Professions as relevant to my audit of the financial statements, and I have fulfilled my other
ethical responsibilities in accordance with the Code. I believe that the audit evidence I have
obtained is sufficient and appropriate to provide a basis for my opinion.

2
Emphasis of Matter
I draw attention to Note 9 to the consolidated financial statements regarding the Company having
substantial product sale and raw material purchase transactions with its subsidiaries and related
companies. My opinion is not modified in respect of this matter.
Key Audit Matters
Key audit matters are those matters that, in my professional judgement, were of most significance
in my audit of the financial statements of the current period. These matters were addressed in
the context of my audit of the financial statements as a whole, and in forming my opinion thereon,
and I do not provide a separate opinion on these matters.
I have fulfilled the responsibilities described in the Auditor’s Responsibilities for the Audit of
the Financial Statements section of my report, including in relation to these matters.
Accordingly, my audit included the performance of procedures designed to respond to my
assessment of the risks of material misstatement of the financial statements. The results of
my audit procedures, including the procedures performed to address the matters below,
provide the basis for my audit opinion on the accompanying financial statements as a whole.
Key audit matters and how audit procedures respond for each matter are described below.
Revenue recognition
Since the revenue from sales is the most significant amount in the statement of income and is
also the key indicator of business performance on which the users of financial statement focus.
In addition, the Group has sales with a number of customers and there are a variety of
commercial terms. I have therefore considered the revenue recognition from sales as key audit
matter and focused on the audit of occurrence and timing of revenue recognition from sales.
The following significant audit procedures were performed to examine recognition of revenue
from sales.
Assessing and testing the Company’s IT system and its internal controls with respect to
the revenue cycle by making enquiry of responsible executives, gaining an understanding
of the controls and selecting representative samples to test the operation of the designed
controls.
Applying a sampling method to select sales documents to assess whether revenue
recognition was consistent with the conditions of the sales, and whether it was in
compliance with the Company’s policy.
On a sampling basis, examining supporting documents for sales transactions occurring
during the year and near the end of the accounting period.

3
Reviewing credit notes that the Company issued to its customers after the period end.
Performing analytical procedures on disaggregated data to detect possible irregularities
in sales transactions throughout the period.
Allowance for diminution in value of inventories
Estimating the net realisable value of inventories, as disclosed in Note 11 to the consolidated
financial statements, is an area of significant management judgement, particularly with regard to
the estimation of provision for diminution in the value of obsolete inventory. This requires detailed
analysis of the product life cycle and the competitive environment. Therefore, there is a risk with
respect to the recognition of allowance for diminution in value of inventories will be inadequate.
The following significant audit procedures were performed to examine recognition of allowance for
diminution in value of inventories.
Assessing and testing the internal controls of the Company relevant to the determination
of allowance for diminution in value of inventories by making enquiry of responsible
executives, gaining an understanding of the controls and selecting representative samples
to test the operation of the designed controls.
Gaining an understanding of the basis applied in determining the allowance for diminution
in value of inventories and reviewing the consistency of the application of that basis,
and the rationale for the recording of specific allowance.
Comparing the inventory holding periods and inventory movements to identify product
lines with indicators of lower than normal inventory turnover.
Comparing proceeds from sales transactions occurring after the date of the financial
statements with the cost of inventory for each product line.
Other Information
Management is responsible for the other information. The other information comprise the
information included in annual report of the Group, but does not include the financial statements
and my auditor’s report thereon. The annual report of the Group is expected to be made available
to me after the date of this auditor’s report.
My opinion on the financial statements does not cover the other information and I do not express
any form of assurance conclusion thereon.
In connection with my audit of the financial statements, my responsibility is to read the other
information and, in doing so, consider whether the other information is materially inconsistent with
the financial statements or my knowledge obtained in the audit or otherwise appears to be
materially misstated.

4
When I read the annual report of the Group, if I conclude that there is a material misstatement
therein, I am required to communicate the matter to those charged with governance for correction
of the misstatement.
Responsibilities of Management and Those Charged with Governance for the Financial
Statements
Management is responsible for the preparation and fair presentation of the financial statements in
accordance with Thai Financial Reporting Standards, and for such internal control as management
determines is necessary to enable the preparation of financial statements that are free from
material misstatement, whether due to fraud or error.
In preparing the financial statements, management is responsible for assessing the Group’s
ability to continue as a going concern, disclosing, as applicable, matters related to going concern
and using the going concern basis of accounting unless management either intends to liquidate
the Group or to cease operations, or has no realistic alternative but to do so.
Those charged with governance are responsible for overseeing the Group’s financial reporting
process.
Auditor’s Responsibilities for the Audit of the Financial Statements
My objectives are to obtain reasonable assurance about whether the financial statements as
a whole are free from material misstatement, whether due to fraud or error, and to issue
an auditor’s report that includes my opinion. Reasonable assurance is a high level of assurance,
but is not a guarantee that an audit conducted in accordance with Thai Standards on Auditing will
always detect a material misstatement when it exists. Misstatements can arise from fraud or error
and are considered material if, individually or in the aggregate, they could reasonably be expected
to influence the economic decisions of users taken on the basis of these financial statements.
As part of an audit in accordance with Thai Standards on Auditing, I exercise professional
judgement and maintain professional skepticism throughout the audit. I also:
Identify and assess the risks of material misstatement of the financial statements, whether
due to fraud or error, design and perform audit procedures responsive to those risks, and
obtain audit evidence that is sufficient and appropriate to provide a basis for my opinion.
The risk of not detecting a material misstatement resulting from fraud is higher than for
one resulting from error, as fraud may involve collusion, forgery, intentional omissions,
misrepresentations, or the override of internal control.

5
Obtain an understanding of internal control relevant to the audit in order to design
audit procedures that are appropriate in the circumstances, but not for the purpose of
expressing an opinion on the effectiveness of the Group’s internal control.
Evaluate the appropriateness of accounting policies used and the reasonableness of
accounting estimates and related disclosures made by management.
Conclude on the appropriateness of management’s use of the going concern basis of
accounting and, based on the audit evidence obtained, whether a material uncertainty
exists related to events or conditions that may cast significant doubt on the Group’s ability
to continue as a going concern. If I conclude that a material uncertainty exists, I am
required to draw attention in my auditor’s report to the related disclosures in the financial
statements or, if such disclosures are inadequate, to modify my opinion. My conclusions
are based on the audit evidence obtained up to the date of my auditor’s report. However,
future events or conditions may cause the Group to cease to continue as a going concern.
Evaluate the overall presentation, structure and content of the financial statements,
including the disclosures, and whether the financial statements represent the underlying
transactions and events in a manner that achieves fair presentation.
Obtain sufficient appropriate audit evidence regarding the financial information of the
entities or business activities within the Group to express an opinion on the consolidated
financial statements. I am responsible for the direction, supervision and performance of
the group audit. I remain solely responsible for my audit opinion.
I communicate with those charged with governance regarding, among other matters, the planned
scope and timing of the audit and significant audit findings, including any significant deficiencies in
internal control that I identify during my audit.
I also provide those charged with governance with a statement that I have complied with relevant
ethical requirements regarding independence, and to communicate with them all relationships and
other matters that may reasonably be thought to bear on my independence, and where applicable,
related safeguards.

6
From the matters communicated with those charged with governance, I determine those matters
that were of most significance in the audit of the financial statements of the current period and are
therefore the key audit matters. I describe these matters in my auditor’s report unless law or
regulation precludes public disclosure about the matter or when, in extremely rare circumstances,
I determine that a matter should not be communicated in my report because the adverse
consequences of doing so would reasonably be expected to outweigh the public interest benefits
of such communication.
I am responsible for the audit resulting in this independent auditor’s report.
Rungnapa Lertsuwankul
Certified Public Accountant (Thailand) No. 3516
EY Office Limited
Bangkok: 26 February 2021

Cal-Comp Electronics (Thailand) Public Company Limited and its subsidiaries
Statements of financial position
As at 31 December 2020
(Unit: US Dollar) (Unit: Baht)
Note 2020 2019 2020 2019
Assets
Current assets
Cash and cash equivalents 7 166,595,793 138,221,053 5,004,054,494 4,167,917,632
Current investments 8 - 9,666,249 - 291,476,072
Trade and other receivables 9, 10 736,873,807 605,314,905 22,133,552,228 18,252,665,645
Inventories 11 513,882,921 438,275,894 15,435,552,686 13,215,771,308
Advances payment for raw materials and molds 6,638,687 2,136,723 199,406,905 64,430,745
Other current financial assets 8 6,177,143 - 185,543,462 -
Other current assets 12 101,396,395 44,210,226 3,045,653,656 1,333,115,155
Assets held for sale 13 13,336,302 - 400,583,851 -
Total current assets 1,544,901,048 1,237,825,050 46,404,347,282 37,325,376,557
Non-current assets
Restricted bank deposits 363,494 501,246 10,918,306 15,114,572
Other non-current financial assets 14 6,784,260 - 203,779,496 -
Investments in associates 15 46,742,247 40,586,778 1,404,001,547 1,223,853,704
Other long-term investments 14 - 16,689,893 - 503,267,034
Long-term loans to related parties 9 6,896,657 6,450,503 207,155,576 194,508,467
Property, plant and equipment 17 469,716,068 473,476,422 14,108,908,506 14,277,208,029
Right-of-use assets 18.1 20,019,380 - 601,324,119 -
Goodwill 1,511,448 1,511,448 45,399,515 45,576,203
Intangible assets 19 19,118,144 10,401,111 574,253,603 313,635,101
Deferred tax assets 31 4,227,077 3,645,541 126,969,135 109,927,643
Plan assets for long-term employee benefits 25 2,063,121 1,333,463 61,970,172 40,209,243
Other non-current assets
Land occupancy rights 20 - 1,913,679 - 57,705,077
Others 10,726,117 11,784,795 322,181,438 355,358,709
Total non-current assets 588,168,013 568,294,879 17,666,861,413 17,136,363,782
Total assets 2,133,069,061 1,806,119,929 64,071,208,695 54,461,740,339
The accompanying notes are an integral part of the financial statements.
7
Consolidated financial statements Consolidated financial statements

Cal-Comp Electronics (Thailand) Public Company Limited and its subsidiaries
Statements of financial position (continued)
As at 31 December 2020
(Unit: US Dollar) (Unit: Baht)
Note 2020 2019 2020 2019
Liabilities and shareholders' equity
Current liabilities
Short-term loans from financial institutions 21 471,887,490 356,909,221 14,174,131,726 10,762,240,650
Trade and other payables 9, 22 868,047,563 649,287,179 26,073,631,454 19,578,605,596
Current portion of long-term loans 24 86,400,000 43,200,000 2,595,205,440 1,302,652,800
Current portion of lease liabilities 18.2 5,558,620 - 166,964,825 -
Income tax payable 4,704,353 1,059,762 141,305,121 31,956,063
Other current financial liabilities 1,833,292 - 55,066,775 -
Other current liabilities 23 24,023,200 14,179,086 721,587,261 427,556,159
Total current liabilities 1,462,454,518 1,064,635,248 43,927,892,602 32,103,011,268
Non-current liabilities
Long-term loans, net of current portion 24 86,400,000 177,800,000 2,595,205,440 5,361,381,200
Lease liabilities, net of current portion 18.2 13,761,471 - 413,354,681 -
Provision for long-term employee benefits 25 12,528,820 12,208,699 376,329,419 368,141,110
Deferred tax liabilities 31 581,613 351,627 17,469,968 10,602,961
Other non-current liabilities 5,153,199 5,182,327 154,787,154 156,267,888
Provision for transaction under equity method
of investments in associates 15 17,287,794 11,050,613 519,275,197 333,220,184
Total non-current liabilities 135,712,897 206,593,266 4,076,421,859 6,229,613,343
Total liabilities 1,598,167,415 1,271,228,514 48,004,314,461 38,332,624,611
Shareholders' equity
Share capital
Registered share capital
4,979,068,075 ordinary shares of Baht 1 each 153,439,099 153,439,099 4,979,068,075 4,979,068,075
Issued and fully paid-up share capital
4,554,643,575 ordinary shares of Baht 1 each 140,359,681 140,359,681 4,554,643,575 4,554,643,575
Share premium 104,358,133 104,358,133 3,386,400,546 3,386,400,546
Capital reserve for share-based payment transactions 26 7,109,733 5,569,161 227,818,755 179,537,619
Capital surplus from change in shareholding
in the subsidiaries 2,431,391 2,431,391 78,898,143 78,898,143
Retained earnings
Appropriated - statutory reserve 27 15,750,839 15,750,839 511,111,587 511,111,587
Unappropriated 319,684,165 320,240,784 10,378,843,871 10,399,613,247
Other components of shareholders' equity (61,743,574) (55,885,327) (3,279,618,538) (3,043,409,859)
Equity attributable to owners of the Company 527,950,368 532,824,662 15,858,097,939 16,066,794,858
Non-controlling interests of the subsidiaries 6,951,278 2,066,753 208,796,295 62,320,870
Total shareholders' equity 534,901,646 534,891,415 16,066,894,234 16,129,115,728
Total liabilities and shareholders' equity 2,133,069,061 1,806,119,929 64,071,208,695 54,461,740,339
- - - -
The accompanying notes are an integral part of the financial statements.
Directors
8
Consolidated financial statements Consolidated financial statements

Cal-Comp Electronics (Thailand) Public Company Limited and its subsidiaries
Statements of financial position
As at 31 December 2020
(Unit: US Dollar) (Unit: Baht)
Note 2020 2019 2020 2019
Assets
Current assets
Cash and cash equivalents 7 10,735,188 8,729,189 322,453,915 263,219,965
Trade and other receivables 9, 10 616,277,915 473,785,814 18,511,201,361 14,286,537,435
Inventories 11 322,769,948 278,549,184 9,695,073,205 8,399,372,094
Advances payment for raw materials and molds 1,325,109 2,007,571 39,802,432 60,536,296
Other current assets 12 18,845,791 18,124,886 566,072,909 546,537,813
Total current assets 969,953,951 781,196,644 29,134,603,822 23,556,203,603
Non-current assets
Other non-current financial assets 14 5,799,148 - 174,189,588 -
Investments in associates 15 44,430,707 38,298,585 1,334,569,589 1,154,855,532
Investments in subsidiaries 16 447,048,825 407,327,094 13,428,050,261 12,282,541,192
Other long-term investments 14 - 12,756,537 - 384,660,617
Other long-term receivables 9 18,387,825 23,488,659 552,316,938 708,277,024
Long-term loans to related parties 9 7,461,864 27,360,169 224,132,755 825,018,536
Property, plant and equipment 17 279,981,831 270,795,897 8,409,842,256 8,165,579,478
Right-of-use assets 18.1 144,883 - 4,351,865 -
Deferred tax assets 31 619,488 286,614 18,607,623 8,642,559
Other non-current assets 3,942,001 40,373 118,406,219 1,217,407
Total non-current assets 807,816,572 780,353,928 24,264,467,094 23,530,792,345
Total assets 1,777,770,523 1,561,550,572 53,399,070,916 47,086,995,948
The accompanying notes are an integral part of the financial statements.
9
Separate financial statements Separate financial statements

Cal-Comp Electronics (Thailand) Public Company Limited and its subsidiaries
Statements of financial position (continued)
As at 31 December 2020
(Unit: US Dollar) (Unit: Baht)
Note 2020 2019 2020 2019
Liabilities and shareholders' equity
Current liabilities
Short-term loans from financial institutions 21 322,512,208 296,839,745 9,687,331,443 8,950,905,671
Trade and other payables 9, 22 519,386,146 391,316,362 15,600,853,606 11,799,753,580
Current portion of lease liabilities 18.2 93,134 - 2,797,475 -
Income tax payable 131,305 91,849 3,944,021 2,769,615
Other current liabilities 23 1,741,912 2,898,459 52,321,985 87,400,132
Total current liabilities 843,864,705 691,146,415 25,347,248,530 20,840,828,998
Non-current liabilities
Lease liabilities, net of current portion 18.2 56,422 - 1,694,753 -
Provision for long-term employee benefits 25 10,473,803 10,616,786 314,602,668 320,138,565
Provision for transaction under equity method
of investments in associates 15 17,287,794 11,050,613 519,275,197 333,220,184
Provision for transaction under equity method
of investments in subsidiaries 16 378,137,431 315,912,096 11,358,151,829 9,526,013,343
Total non-current liabilities 405,955,450 337,579,495 12,193,724,447 10,179,372,092
Total liabilities 1,249,820,155 1,028,725,910 37,540,972,977 31,020,201,090
Shareholders' equity
Share capital
Registered share capital
4,979,068,075 ordinary shares of Baht 1 each 153,439,099 153,439,099 4,979,068,075 4,979,068,075
Issued and fully paid-up share capital
4,554,643,575 ordinary shares of Baht 1 each 140,359,681 140,359,681 4,554,643,575 4,554,643,575
Share premium 104,358,133 104,358,133 3,386,400,546 3,386,400,546
Capital reserve for share-based payment transactions 26 7,109,733 5,569,161 227,818,755 179,537,619
Capital surplus from change in shareholding
in the subsidiaries 2,431,391 2,431,391 78,898,143 78,898,143
Retained earnings
Appropriated - statutory reserve 27 15,750,839 15,750,839 511,111,587 511,111,587
Unappropriated 319,684,165 320,240,784 10,378,843,871 10,399,613,247
Other components of shareholders' equity (61,743,574) (55,885,327) (3,279,618,538) (3,043,409,859)
Total shareholders' equity 527,950,368 532,824,662 15,858,097,939 16,066,794,858
Total liabilities and shareholders' equity 1,777,770,523 1,561,550,572 53,399,070,916 47,086,995,948
- - - -
The accompanying notes are an integral part of the financial statements.
Directors
10
Separate financial statements Separate financial statements

Cal-Comp Electronics (Thailand) Public Company Limited and its subsidiaries
Income statement
For the year ended 31 December 2020
(Unit: US Dollar) (Unit: Baht)
Consolidated financial statements Consolidated financial statements
Note 2020 2019 2020 2019
Revenues
Sales 9 3,336,675,067 3,309,022,745 104,307,299,854 102,493,848,246
Service income 4,370,976 4,033,687 138,480,865 124,981,759
Gain on financial derivatives 19,864,781 8,111,100 633,912,953 250,882,762
Other income 9 11,734,690 8,494,699 374,680,964 265,080,891
Total revenues 3,372,645,514 3,329,662,231 105,454,374,636 103,134,793,658
Expenses
Cost of sales 9 3,177,090,755 3,132,952,448 99,320,469,296 97,040,462,896
Cost of service 1,629,240 1,330,309 50,873,425 40,530,999
Selling and distribution expenses 13,418,637 13,670,050 420,843,749 422,875,633
Administrative expenses 9 130,496,587 129,857,613 4,087,966,343 4,018,207,334
Exchange losses 14,482,720 7,039,975 462,153,255 216,252,804
Total expenses 3,337,117,939 3,284,850,395 104,342,306,068 101,738,329,666
Profit from operating activities 35,527,575 44,811,836 1,112,068,568 1,396,463,992
Share of loss from investments in associates 15.2 (919,353) (615,780) (28,848,586) (17,872,185)
Finance income 1,912,467 - 60,193,085 -
Finance cost 29 (20,509,371) (29,266,457) (643,348,616) (907,191,170)
Profit before income tax expenses 16,011,318 14,929,599 500,064,451 471,400,637
Income tax expenses 31 (8,754,900) (3,960,932) (271,427,628) (123,874,948)
Profit for the year 7,256,418 10,968,667 228,636,823 347,525,689
Profit attributable to:
Equity holders of the Company 6,621,164 12,432,578 209,606,760 392,798,927
Non-controlling interests of the subsidiaries 635,254 (1,463,911) 19,030,063 (45,273,238)
7,256,418 10,968,667 228,636,823 347,525,689
Earnings per share 33
Basic earnings per share
Profit attributable to equity holders of the Company 0.0015 0.0027 0.05 0.09
Diluted earnings per share
Profit attributable to equity holders of the Company 0.0015 0.0027 0.05 0.09
The accompanying notes are an integral part of the financial statements.
11

Cal-Comp Electronics (Thailand) Public Company Limited and its subsidiaries
Statement of comprehensive income
For the year ended 31 December 2020
(Unit: US Dollar) (Unit: Baht)
Consolidated financial statements Consolidated financial statements
Note 2020 2019 2020 2019
Profit for the year 7,256,418 10,968,667 228,636,823 347,525,689
Other comprehensive income:
Other comprehensive income to be reclassified
to profit or loss in subsequent periods
Exchange differences on translation of
financial statements in foreign currency (3,752,579) (6,973,215) (144,639,336) (215,593,278)
Share of other comprehensive income from
investments in associates 15.2 (235,588) (839,250) (7,303,118) (25,680,443)
Gain on change in value of available-for-sale investments - 16,025 - 529,601
Less: Income tax effect 31 - (3,205) - (55,539)
Other comprehensive income to be reclassified
to profit or loss in subsequent periods - net of income tax (3,988,167) (7,799,645) (151,942,454) (240,799,659)
Other comprehensive income not to be reclassified
to profit or loss in subsequent periods
Exchange differences on translation of functional
currency to presentation currency financial statements - - (32,137,199) (1,249,080,862)
Loss on changes in value of investments in equity designated
at fair value through other comprehensive income (4,002,880) - (126,751,132) -
Actuarial gain (loss) 25 2,241,047 (857,834) 68,363,347 (25,896,042)
Less: Income tax effect 31 (135,697) 125,070 (4,101,136) 3,738,833
Other comprehensive income not to be reclassified
to profit or loss in subsequent periods - net of income tax (1,897,530) (732,764) (94,626,120) (1,271,238,071)
Other comprehensive income for the year (5,885,697) (8,532,409) (246,568,574) (1,512,037,730)
Total comprehensive income for the year 1,370,721 2,436,258 (17,931,751) (1,164,512,041)
Total comprehensive income attributable to:
Equity holders of the Company 735,467 3,900,169 (29,245,876) (1,112,397,415)
Non-controlling interests of the subsidiaries 635,254 (1,463,911) 11,314,125 (52,114,626)
1,370,721 2,436,258 (17,931,751) (1,164,512,041)
The accompanying notes are an integral part of the financial statements.
12

Cal-Comp Electronics (Thailand) Public Company Limited and its subsidiaries
Income statement
For the year ended 31 December 2020
(Unit: US Dollar) (Unit: Baht)
Separate financial statements Separate financial statements
Note 2020 2019 2020 2019
Revenues
Sales 9 2,279,187,214 2,504,698,770 71,288,863,167 77,557,740,768
Gain on financial derivatives 32,185 1,727,253 1,023,744 54,474,232
Other income 9 10,916,988 6,304,348 344,422,941 195,206,828
Total revenues 2,290,136,387 2,512,730,371 71,634,309,852 77,807,421,828
Expenses
Cost of sales 9 2,230,165,453 2,440,874,445 69,754,666,105 75,580,442,543
Selling and distribution expenses 2,416,194 2,230,854 75,706,966 69,025,829
Administrative expenses 9 21,792,577 13,680,826 681,926,626 422,306,923
Exchange losses 225,519 6,859,036 4,857,936 213,409,943
Total expenses 2,254,599,743 2,463,645,161 70,517,157,633 76,285,185,238
Profit from operating activities 35,536,644 49,085,210 1,117,152,219 1,522,236,590
Share of loss from investments in associates 15.2 (925,463) (743,441) (29,007,494) (21,792,243)
Share of loss from investments in subsidiaries 16.2 (18,712,447) (22,882,213) (586,858,314) (703,522,482)
Finance income 474,008 - 14,897,586 -
Finance cost 29 (8,834,744) (12,426,626) (277,111,631) (385,330,752)
Profit before income tax expenses 7,537,998 13,032,930 239,072,366 411,591,113
Income tax expenses 31 (916,834) (600,352) (29,465,606) (18,792,186)
Profit for the year 6,621,164 12,432,578 209,606,760 392,798,927
Earnings per share 33
Basic earnings per share
Profit attributable to equity holders of the Company 0.0015 0.0027 0.05 0.09
Diluted earnings per share
Profit attributable to equity holders of the Company 0.0015 0.0027 0.05 0.09
The accompanying notes are an integral part of the financial statements.
13

Cal-Comp Electronics (Thailand) Public Company Limited and its subsidiaries
Statement of comprehensive income
For the year ended 31 December 2020
(Unit: US Dollar) (Unit: Baht)
Separate financial statements Separate financial statements
Note 2020 2019 2020 2019
Profit for the year 6,621,164 12,432,578 209,606,760 392,798,927
Other comprehensive income:
Other comprehensive income to be reclassified
to profit or loss in subsequent periods
Share of other comprehensive income from
investments in associates 15.2 (252,824) (142,922) (7,810,646) (4,279,774)
Share of other comprehensive income from
investments in subsidiaries 16.2 (3,735,342) (7,669,543) (144,131,808) (236,993,947)
Gain on change in value of available-for-sale investments - 16,025 - 529,601
Less: Income tax effect 31 - (3,205) - (55,539)
Other comprehensive income to be reclassified
to profit or loss in subsequent periods - net of income tax (3,988,166) (7,799,645) (151,942,454) (240,799,659)
Other comprehensive income not to be reclassified
to profit or loss in subsequent periods
Exchange differences on translation of functional
currency to presentation currency financial statements - - (24,421,261) (1,242,239,474)
Share of other comprehensive income from
investments in subsidiaries 16.2 (1,489,420) 1,119,753 (48,040,907) 33,802,761
Loss on changes in value of investments in equity designated
at fair value through other comprehensive income (2,002,880) - (63,134,932) -
Actuarial gain (loss) 25 1,730,466 (1,977,587) 52,788,054 (59,698,803)
Less: Income tax effect 31 (135,697) 125,070 (4,101,136) 3,738,833
Other comprehensive income not to be reclassified
to profit or loss in subsequent periods - net of income tax (1,897,531) (732,764) (86,910,182) (1,264,396,683)
Other comprehensive income for the year (5,885,697) (8,532,409) (238,852,636) (1,505,196,342)
Total comprehensive income for the year 735,467 3,900,169 (29,245,876) (1,112,397,415)
The accompanying notes are an integral part of the financial statements.
14

Cal-Comp Electronics (Thailand) Public Company Limited and its subsidiaries
Statement of changes in shareholders' equity
For the year ended 31 December 2020
(Unit: US Dollar)
Exchange Share of other Deficit Loss on changes
Capital surplus differences on comprehensive on changes in value of investments Total other Total equity Equity attributable
Issued and from change in translation of income from in value of in equity designated at components of attributable to to non-controlling Total
fully paid-up shareholding Appropriated - financial investments in available-for-sale fair value through other shareholders' owners of interests of shareholders'
Note share capital Share premium transactions in the subsidiaries statutory reserve Unappropriated statements associates investments comprehensive income equity the Company the subsidiaries equity
Balance as at 1 January 2019 140,359,681 104,358,133 4,864,337 2,431,391 15,750,839 321,693,491 (47,985,885) 114,952 (214,749) - (48,085,682) 541,372,190 3,472,355 544,844,545
Profit for the year - - - - - 12,432,578 - - - - - 12,432,578 (1,463,911) 10,968,667
Other comprehensive income for the year - - - - - (732,764) (6,973,215) (839,250) 12,820 - (7,799,645) (8,532,409) - (8,532,409)
Total comprehensive income for the year - - - - - 11,699,814 (6,973,215) (839,250) 12,820 - (7,799,645) 3,900,169 (1,463,911) 2,436,258
Dividend paid 36 - - - - - (13,152,521) - - - - - (13,152,521) - (13,152,521)
Share-based payment transactions 26 - - 713,984 - - - - - - - - 713,984 - 713,984
Increase in share capital of the subsidiary
due to convert warrants to shares - - (9,160) - - - - - - - - (9,160) 58,309 49,149
Balance as at 31 December 2019 140,359,681 104,358,133 5,569,161 2,431,391 15,750,839 320,240,784 (54,959,100) (724,298) (201,929) - (55,885,327) 532,824,662 2,066,753 534,891,415
Balance as at 1 January 2020 140,359,681 104,358,133 5,569,161 2,431,391 15,750,839 320,240,784 (54,959,100) (724,298) (201,929) - (55,885,327) 532,824,662 2,066,753 534,891,415
Cumulative effect of changes in
accounting policies 4 - - - - - - - - 201,929 (201,929) - - - -
Balance as at 1 January 2020 - as restated 140,359,681 104,358,133 5,569,161 2,431,391 15,750,839 320,240,784 (54,959,100) (724,298) - (201,929) (55,885,327) 532,824,662 2,066,753 534,891,415
Profit for the year - - - - - 6,621,164 - - - - - 6,621,164 635,254 7,256,418
Other comprehensive income for the year - - - - - 2,137,828 (3,752,579) (235,588) - (4,035,358) (8,023,525) (5,885,697) - (5,885,697)
Total comprehensive income for the year - - - - - 8,758,992 (3,752,579) (235,588) - (4,035,358) (8,023,525) 735,467 635,254 1,370,721
Dividend paid 36 - - - - - (7,150,333) - - - - - (7,150,333) - (7,150,333)
Share-based payment transactions 26 - - 1,540,572 - - - - - - - - 1,540,572 - 1,540,572
Transfer of fair value reserve of investments
in equity designated at fair value through
other comprehensive income due to
disposal of investments 14 - - - - - (2,165,278) - - - 2,165,278 2,165,278 - - -
Increase in equity attributable to non-controlling
interests of the subsidiaries from disposal
of investment in subsidiary - - - - - - - - - - - - 4,249,271 4,249,271
Balance as at 31 December 2020 140,359,681 104,358,133 7,109,733 2,431,391 15,750,839 319,684,165 (58,711,679) (959,886) - (2,072,009) (61,743,574) 527,950,368 6,951,278 534,901,646
The accompanying notes are an integral part of the financial statements.
15
share-based payment
Consolidated financial statements
Equity attributable to owners of the Company
Other components of shareholders' equity
Other comprehensive income
Capital reserve for Retained earnings

Cal-Comp Electronics (Thailand) Public Company Limited and its subsidiaries
Statement of changes in shareholders' equity
For the year ended 31 December 2020
(Unit: Baht)
Exchange Share of other Deficit Loss on changes
Capital surplus differences on comprehensive on changes in value of investments Total other Total equity Equity attributable
Issued and from change in translation of income from in value of in equity designated components of attributable to to non-controlling Total
fully paid-up shareholding Appropriated - financial investments in available-for-sale at fair value through shareholders' owners of interests of shareholders'
Note share capital Share premium transactions in the subsidiaries statutory reserve Unappropriated statements associates investments other comprehensive income equity the Company the subsidiaries equity
Balance as at 1 January 2019 4,554,643,575 3,386,400,546 157,846,775 78,898,143 511,111,587 10,438,889,451 (1,557,132,360) 3,730,180 (6,968,546) - (1,560,370,726) 17,567,419,351 112,677,216 17,680,096,567
Profit for the year - - - - - 392,798,927 - - - - - 392,798,927 (45,273,238) 347,525,689
Other comprehensive income for the year - - - - - (22,157,209) (1,457,832,752) (25,680,443) 474,062 - (1,483,039,133) (1,505,196,342) (6,841,388) (1,512,037,730)
Total comprehensive income for the year - - - - - 370,641,718 (1,457,832,752) (25,680,443) 474,062 - (1,483,039,133) (1,112,397,415) (52,114,626) (1,164,512,041)
Dividend paid 36 - - - - - (409,917,922) - - - - - (409,917,922) - (409,917,922)
Share-based payment transactions 26 - - 21,971,850 - - - - - - - - 21,971,850 - 21,971,850
Increase in share capital of the subsidiary
due to convert warrants to shares - - (281,006) - - - - - - - - (281,006) 1,758,280 1,477,274
Balance as at 31 December 2019 4,554,643,575 3,386,400,546 179,537,619 78,898,143 511,111,587 10,399,613,247 (3,014,965,112) (21,950,263) (6,494,484) - (3,043,409,859) 16,066,794,858 62,320,870 16,129,115,728
- - - - - - - - - -
Balance as at 1 January 2020 4,554,643,575 3,386,400,546 179,537,619 78,898,143 511,111,587 10,399,613,247 (3,014,965,112) (21,950,263) (6,494,484) - (3,043,409,859) 16,066,794,858 62,320,870 16,129,115,728
Cumulative effect of changes in
accounting policies 4 - - - - - - - - 6,494,484 (6,494,484) - - - -
Balance as at 1 January 2020 - as restated 4,554,643,575 3,386,400,546 179,537,619 78,898,143 511,111,587 10,399,613,247 (3,014,965,112) (21,950,263) - (6,494,484) (3,043,409,859) 16,066,794,858 62,320,870 16,129,115,728
Profit for the year - - - - - 209,606,760 - - - - - 209,606,760 19,030,063 228,636,823
Other comprehensive income for the year - - - - - 65,204,959 (169,060,597) (7,303,118) - (127,693,880) (304,057,595) (238,852,636) (7,715,938) (246,568,574)
Total comprehensive income for the year - - - - - 274,811,719 (169,060,597) (7,303,118) - (127,693,880) (304,057,595) (29,245,876) 11,314,125 (17,931,751)
Dividend paid 36 - - - - - (227,732,179) - - - - - (227,732,179) - (227,732,179)
Share-based payment transactions 26 - - 48,281,136 - - - - - - - - 48,281,136 - 48,281,136
Transfer of fair value reserve of investments
in equity designated at fair value through
other comprehensive income due to
disposal of investments 14 - - - - - (67,848,916) - - - 67,848,916 67,848,916 - - -
Increase in equity attributable to non-controlling
interests of the subsidiaries from disposal
of investment in subsidiary - - - - - - - - - - - - 135,161,300 135,161,300
Balance as at 31 December 2020 4,554,643,575 3,386,400,546 227,818,755 78,898,143 511,111,587 10,378,843,871 (3,184,025,709) (29,253,381) - (66,339,448) (3,279,618,538) 15,858,097,939 208,796,295 16,066,894,234
- - - - - - - -
The accompanying notes are an integral part of the financial statements.
16
share-based payment
Consolidated financial statements
Equity attributable to owners of the Company
Other components of shareholders' equity
Other comprehensive income
Capital reserve for Retained earnings

Cal-Comp Electronics (Thailand) Public Company Limited and its subsidiaries
Statement of changes in shareholders' equity
For the year ended 31 December 2020
(Unit: US Dollar)
Share of other
comprehensive Loss on changes
Capital surplus income from Deficit in value of investments Total other
Issued and from change in investments in on changes in value in equity designated at components of Total
fully paid-up shareholding in Appropriated - associates of available-for-sale fair value through other shareholders' shareholders'
Note share capital Share premium transactions the subsidiaries statutory reserve Unappropriated and subsidiaries investments comprehensive income equity equity
Balance as at 1 January 2019 140,359,681 104,358,133 4,864,337 2,431,391 15,750,839 321,693,491 (47,870,933) (214,749) - (48,085,682) 541,372,190
Profit for the year - - - - - 12,432,578 - - - - 12,432,578
Other comprehensive income for the year - - - - - (732,764) (7,812,465) 12,820 - (7,799,645) (8,532,409)
Total comprehensive income for the year - - - - - 11,699,814 (7,812,465) 12,820 - (7,799,645) 3,900,169
Dividend paid 36 - - - - - (13,152,521) - - - - (13,152,521)
Share-based payment transactions 26 - - 713,984 - - - - - - - 713,984
Increase in share capital of the subsidiary
due to convert warrants to shares - - (9,160) - - - - - - - (9,160)
Balance as at 31 December 2019 140,359,681 104,358,133 5,569,161 2,431,391 15,750,839 320,240,784 (55,683,398) (201,929) - (55,885,327) 532,824,662
Balance as at 1 January 2020 140,359,681 104,358,133 5,569,161 2,431,391 15,750,839 320,240,784 (55,683,398) (201,929) - (55,885,327) 532,824,662
Cumulative effect of changes in accounting policies 4 - - - - - - - 201,929 (201,929) - -
Balance as at 1 January 2020 - as restated 140,359,681 104,358,133 5,569,161 2,431,391 15,750,839 320,240,784 (55,683,398) - (201,929) (55,885,327) 532,824,662
Profit for the year - - - - - 6,621,164 - - - - 6,621,164
Other comprehensive income for the year - - - - - 2,137,828 (5,988,167) - (2,035,358) (8,023,525) (5,885,697)
Total comprehensive income for the year - - - - - 8,758,992 (5,988,167) - (2,035,358) (8,023,525) 735,467
Dividend paid 36 - - - - - (7,150,333) - - - - (7,150,333)
Share-based payment transactions 26 - - 1,540,572 - - - - - - - 1,540,572
Transfer of fair value reserve of investments
in equity designated at fair value through
other comprehensive income due to
disposal of investments 14 - - - - - (2,165,278) - - 2,165,278 2,165,278 -
Balance as at 31 December 2020 140,359,681 104,358,133 7,109,733 2,431,391 15,750,839 319,684,165 (61,671,565) - (72,009) (61,743,574) 527,950,368
The accompanying notes are an integral part of the financial statements.
17
share-based payment
Separate financial statements
Other components of shareholders' equity
Other comprehensive income
Capital reserve for Retained earnings

Cal-Comp Electronics (Thailand) Public Company Limited and its subsidiaries
Statement of changes in shareholders' equity
For the year ended 31 December 2020
(Unit: Baht)
Share of other
comprehensive Loss on changes
Capital surplus income from Deficit in value of investments Total other
Issued and from change in Exchange differences investments in on changes in value in equity designated at components of Total
fully paid-up shareholding in Appropriated - on translation of associates of available-for-sale fair value through other shareholders' shareholders'
Note share capital Share premium transactions the subsidiaries statutory reserve Unappropriated financial statements and subsidiaries investments comprehensive income equity equity
Balance as at 1 January 2019 4,554,643,575 3,386,400,546 157,846,775 78,898,143 511,111,587 10,438,889,451 - (1,553,402,180) (6,968,546) - (1,560,370,726) 17,567,419,351
Profit for the year - - - - - 392,798,927 - - - - - 392,798,927
Other comprehensive income for the year - - - - - (22,157,209) (1,242,239,474) (241,273,721) 474,062 - (1,483,039,133) (1,505,196,342)
Total comprehensive income for the year - - - - - 370,641,718 (1,242,239,474) (241,273,721) 474,062 - (1,483,039,133) (1,112,397,415)
Dividend paid 36 - - - - - (409,917,922) - - - - - (409,917,922)
Share-based payment transactions 26 - - 21,971,850 - - - - - - - - 21,971,850
Increase in share capital of the subsidiary
due to convert warrants to shares - - (281,006) - - - - - - - - (281,006)
Balance as at 31 December 2019 4,554,643,575 3,386,400,546 179,537,619 78,898,143 511,111,587 10,399,613,247 (1,242,239,474) (1,794,675,901) (6,494,484) - (3,043,409,859) 16,066,794,858
- - - - - -
Balance as at 1 January 2020 4,554,643,575 3,386,400,546 179,537,619 78,898,143 511,111,587 10,399,613,247 (1,242,239,474) (1,794,675,901) (6,494,484) - (3,043,409,859) 16,066,794,858
Cumulative effect of changes in
accounting policies 4 - - - - - - - - 6,494,484 (6,494,484) - -
Balance as at 1 January 2020 - as restated 4,554,643,575 3,386,400,546 179,537,619 78,898,143 511,111,587 10,399,613,247 (1,242,239,474) (1,794,675,901) - (6,494,484) (3,043,409,859) 16,066,794,858
Profit for the year - - - - - 209,606,760 - - - - - 209,606,760
Other comprehensive income for the year - - - - - 65,204,959 (24,421,261) (215,558,654) - (64,077,680) (304,057,595) (238,852,636)
Total comprehensive income for the year - - - - - 274,811,719 (24,421,261) (215,558,654) - (64,077,680) (304,057,595) (29,245,876)
Dividend paid 36 - - - - - (227,732,179) - - - - - (227,732,179)
Share-based payment transactions 26 - - 48,281,136 - - - - - - - - 48,281,136
Transfer of fair value reserve of investments
in equity designated at fair value through
other comprehensive income due to
disposal of investment 14 - - - - - (67,848,916) - - - 67,848,916 67,848,916 -
Balance as at 31 December 2020 4,554,643,575 3,386,400,546 227,818,755 78,898,143 511,111,587 10,378,843,871 (1,266,660,735) (2,010,234,555) - (2,723,248) (3,279,618,538) 15,858,097,939
- - - - - - -
The accompanying notes are an integral part of the financial statements.
18
share-based payment
Separate financial statements
Other components of shareholders' equity
Other comprehensive income
Capital reserve for Retained earnings
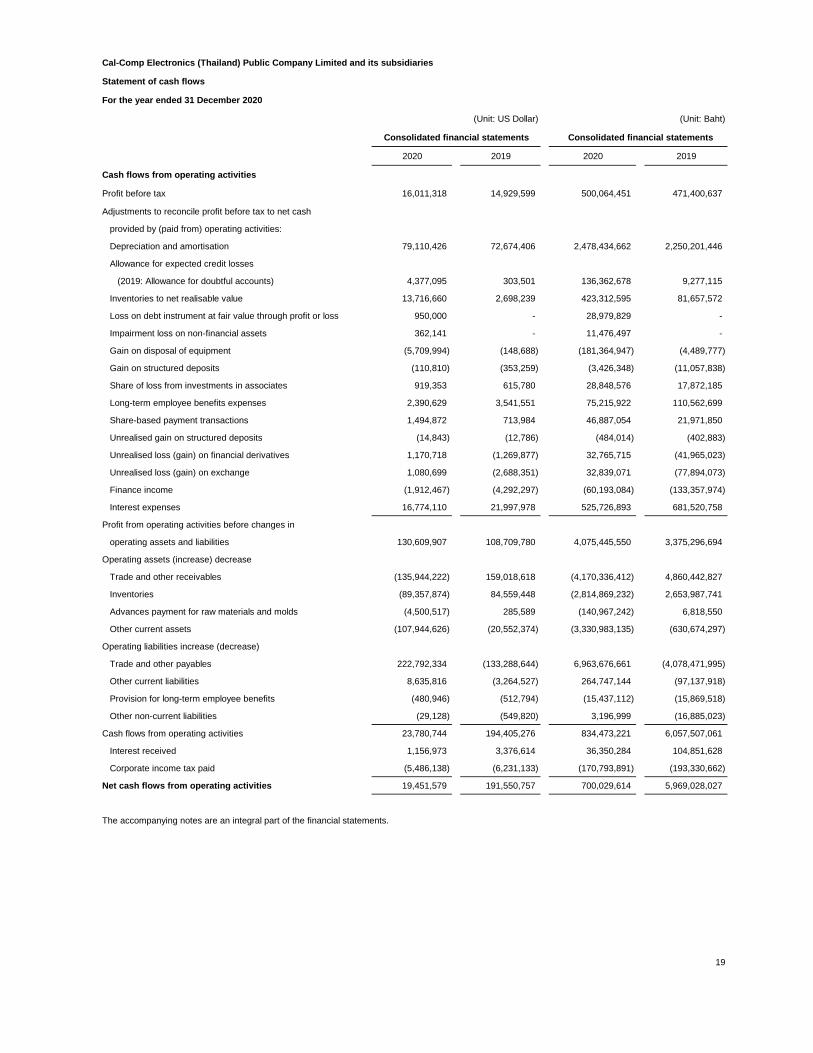
Cal-Comp Electronics (Thailand) Public Company Limited and its subsidiaries
Statement of cash flows
For the year ended 31 December 2020
(Unit: US Dollar) (Unit: Baht)
Consolidated financial statements Consolidated financial statements
2020 2019 2020 2019
Cash flows from operating activities
Profit before tax 16,011,318 14,929,599 500,064,451 471,400,637
Adjustments to reconcile profit before tax to net cash
provided by (paid from) operating activities:
Depreciation and amortisation 79,110,426 72,674,406 2,478,434,662 2,250,201,446
Allowance for expected credit losses
(2019: Allowance for doubtful accounts) 4,377,095 303,501 136,362,678 9,277,115
Inventories to net realisable value 13,716,660 2,698,239 423,312,595 81,657,572
Loss on debt instrument at fair value through profit or loss 950,000 - 28,979,829 -
Impairment loss on non-financial assets 362,141 - 11,476,497 -
Gain on disposal of equipment (5,709,994) (148,688) (181,364,947) (4,489,777)
Gain on structured deposits (110,810) (353,259) (3,426,348) (11,057,838)
Share of loss from investments in associates 919,353 615,780 28,848,576 17,872,185
Long-term employee benefits expenses 2,390,629 3,541,551 75,215,922 110,562,699
Share-based payment transactions 1,494,872 713,984 46,887,054 21,971,850
Unrealised gain on structured deposits (14,843) (12,786) (484,014) (402,883)
Unrealised loss (gain) on financial derivatives 1,170,718 (1,269,877) 32,765,715 (41,965,023)
Unrealised loss (gain) on exchange 1,080,699 (2,688,351) 32,839,071 (77,894,073)
Finance income (1,912,467) (4,292,297) (60,193,084) (133,357,974)
Interest expenses 16,774,110 21,997,978 525,726,893 681,520,758
Profit from operating activities before changes in
operating assets and liabilities 130,609,907 108,709,780 4,075,445,550 3,375,296,694
Operating assets (increase) decrease
Trade and other receivables (135,944,222) 159,018,618 (4,170,336,412) 4,860,442,827
Inventories (89,357,874) 84,559,448 (2,814,869,232) 2,653,987,741
Advances payment for raw materials and molds (4,500,517) 285,589 (140,967,242) 6,818,550
Other current assets (107,944,626) (20,552,374) (3,330,983,135) (630,674,297)
Operating liabilities increase (decrease)
Trade and other payables 222,792,334 (133,288,644) 6,963,676,661 (4,078,471,995)
Other current liabilities 8,635,816 (3,264,527) 264,747,144 (97,137,918)
Provision for long-term employee benefits (480,946) (512,794) (15,437,112) (15,869,518)
Other non-current liabilities (29,128) (549,820) 3,196,999 (16,885,023)
Cash flows from operating activities 23,780,744 194,405,276 834,473,221 6,057,507,061
Interest received 1,156,973 3,376,614 36,350,284 104,851,628
Corporate income tax paid (5,486,138) (6,231,133) (170,793,891) (193,330,662)
Net cash flows from operating activities 19,451,579 191,550,757 700,029,614 5,969,028,027
The accompanying notes are an integral part of the financial statements.
19

Cal-Comp Electronics (Thailand) Public Company Limited and its subsidiaries
Statement of cash flows (continued)
For the year ended 31 December 2020
(Unit: US Dollar) (Unit: Baht)
Consolidated financial statements Consolidated financial statements
2020 2019 2020 2019
Cash flows from investing activities
Decrease (increase) in term deposits at financial institutions 2,870,000 -6,070,000 86,024,962 -189,574,858
Decrease (increase) in structured deposits 1,570,995 22,908,943 43,625,228 716,013,167
Decrease (increase) in restricted bank deposits 92,273 -1,420 2,933,910 -52,855
Increase in long-term loans to related parties - -2,849,098 - (86,007,798)
Increase in investment in an associate (1,073,229) - (34,011,351) -
Increase in other long-term investments - (150,000) - (4,721,671)
Acquisition of plant and equipment (210,894,109) (182,940,868) (6,635,913,428) (5,652,649,482)
Acquisition of intangible assets (7,869,898) (1,593,044) (246,989,919) (49,261,380)
Proceeds from disposal of investments
in equity instruments 4,940,079 - 153,292,797 -
Proceeds from disposal of investment
in a subsidiary 4,249,273 - 135,161,300 -
Interest received 755,494 915,683 23,842,800 28,506,346
Dividend received from an associate - 1,560,307 - 49,115,019
Proceeds from disposal of equipment 8,089,420 1,799,307 254,285,913 55,918,036
Cash received from government grants 151,349,648 93,355,961 4,710,113,985 2,883,919,567
Decrease (increase) in other non-current assets 1,058,679 (2,633,585) 40,367,650 (68,345,848)
Net cash flows used in investing activities (44,861,375) (75,697,814) (1,467,266,153) (2,317,141,757)
Cash flows from financing activities
Increase (decrease) in short-term loans
from financial institutions 114,982,551 (96,510,930) 3,590,325,809 (3,007,677,727)
Repayment of long-term loans (48,200,000) - (1,476,860,100) -
Payment of principal portion of lease liabilities (6,394,052) - (200,503,140) -
Cash receipt from long-term loans - 28,000,000 - 858,970,934
Cash receipt from exercise of warrants 45,700 49,150 1,394,082 1,503,590
Interest paid (16,481,361) (21,574,795) (516,700,775) (668,455,454)
Dividend paid (7,150,333) (13,152,521) (227,732,179) (409,917,922)
Net cash flows from (used in) financing activities 36,802,505 (103,189,096) 1,169,923,697 (3,225,576,579)
Increase (decrease) in translation adjustments 16,982,031 488,946 433,449,704 (316,832,086)
Net increase in cash and cash equivalents 28,374,740 13,152,793 836,136,862 109,477,605
Cash and cash equivalents at beginning of year 138,221,053 125,068,260 4,167,917,632 4,058,440,027
Cash and cash equivalents at end of year (Note 7) 166,595,793 138,221,053 5,004,054,494 4,167,917,632
- - - -
Supplemental cash flows information
Non-cash items consist of
Purchases of plant and equipment that has not
yet been paid 4,643,906 8,533,050 139,489,475 261,041,795
Purchases of intangible assets that has not
yet been paid 4,890,000 5,700,000 146,881,419 174,373,545
Increase in right-of-use assets from lease liabilities 7,834,592 - 242,421,324 -
Sales of equipment that has not yet been received 739,299 1,286,794 22,206,411 39,365,406
Reclassify right-of-use assets and buildings to assets held for sale 13,336,302 - 400,583,851 -
The accompanying notes are an integral part of the financial statements.
20

Cal-Comp Electronics (Thailand) Public Company Limited and its subsidiaries
Statement of cash flows
For the year ended 31 December 2020
(Unit: US Dollar) (Unit: Baht)
Separate financial statements Separate financial statements
2020 2019 2020 2019
Cash flows from operating activities
Profit before tax 7,537,998 13,032,930 239,072,366 411,591,113
Adjustments to reconcile profit before tax to net cash
provided by (paid from) operating activities:
Depreciation 43,845,551 41,636,782 1,373,673,221 1,289,239,501
Allowance for expected credit losses
(2019: Allowance for doubtful accounts) 672,616 - 20,518,213 -
Inventories to net realisable value 8,814,950 646,679 273,050,206 19,521,777
Gain on disposal of equipment (5,974,777) (197,355) (189,711,261) (6,041,605)
Share of loss from investments in associates 925,463 743,441 29,007,494 21,792,243
Share of loss from investments in subsidiaries 18,712,447 22,882,213 586,858,315 703,522,482
Long-term employee benefits expenses 1,587,483 3,009,038 49,735,902 94,119,622
Share-based payment transactions 117,602 134,945 3,694,213 4,163,145
Unrealised loss on financial derivatives - 31,505 - 951,065
Unrealised loss (gain) on exchange 1,622,293 (271,433) 50,065,786 (4,386,687)
Finance income (474,008) (950,671) (14,897,586) (29,463,333)
Interest expenses 7,836,964 11,366,815 245,891,123 352,520,484
Profit from operating activities before changes in
operating assets and liabilities 85,224,582 92,064,889 2,666,957,992 2,857,529,807
Operating assets (increase) decrease
Trade and other receivables (137,388,908) 37,760,901 (4,210,512,756) 1,079,521,297
Inventories (53,035,714) 57,621,203 (1,684,197,897) 1,776,644,924
Advances payment for raw materials and molds 683,909 (308,340) 21,815,989 (10,402,645)
Other current assets (622,752) (5,636,536) (21,646,821) (177,977,539)
Other long-term receivables 5,130,780 60,914,477 162,747,108 1,886,052,282
Operating liabilities increase (decrease)
Trade and other payables 126,833,396 (59,363,778) 3,970,524,221 (1,751,192,198)
Other current liabilities (1,511,403) 1,782,614 (48,261,867) 56,750,839
Provision for long-term employee benefits - (3,065) - (96,477)
Cash flows from operating activities 25,313,890 184,832,365 857,425,969 5,716,830,290
Interest received 472,624 950,625 14,854,655 29,461,955
Corporate income tax paid (1,269,567) (679,942) (39,843,210) (20,951,658)
Net cash flows from operating activities 24,516,947 185,103,048 832,437,414 5,725,340,587
The accompanying notes are an integral part of the financial statements.

21

Cal-Comp Electronics (Thailand) Public Company Limited and its subsidiaries
Statement of cash flows (continued)
For the year ended 31 December 2020
(Unit: US Dollar) (Unit: Baht)
Separate financial statements Separate financial statements
2020 2019 2020 2019
Cash flows from investing activities
Decrease in long-term loans to related parties 19,898,305 - 632,927,275 -
Increase in investment in an associate -1,073,229 - -34,011,352 -
Increase in investments in subsidiaries (4,500,000) (138,000,000) (142,670,325) (4,202,705,316)
Acquisition of plant and equipment (54,387,469) (63,250,646) (1,708,454,261) (1,951,472,367)
Proceeds from disposal of investment in subsidiaries 4,249,273 72,198,527 135,161,300 2,179,509,880
Cash received from capital reduction of a subsidairy 163,714 - 5,129,969 -
Interest received 1,384 46 42,932 1,377
Dividend received from an associate - 1,560,307 - 49,115,019
Dividend received from subsidiaries - 39,376,497 - 1,220,617,233
Proceeds from disposal of equipment 6,579,473 1,723,337 208,425,387 52,855,920
Increase in other non-current assets (3,901,626) (4,001) (121,362,180) (124,405)
Net cash flows used in investing activities (32,970,175) (86,395,933) (1,024,811,255) (2,652,202,659)
Cash flows from financing activities
Increase (decrease) in short-term loans from financial institutions 25,672,463 (90,922,712) 736,135,250 (2,844,236,624)
Payment of principal portion of lease liabilities (88,124) - (2,759,887) -
Interest paid (7,974,779) (11,209,771) (250,113,747) (347,764,291)
Dividend paid (7,150,333) (13,152,521) (227,732,179) (409,917,922)
Net cash flows from (used in) financing activities 10,459,227 (115,285,004) 255,529,437 (3,601,918,837)
Decrease in translation adjustments - - (3,921,646) (29,208,746)
Net increase (decrease) in cash and cash equivalents 2,005,999 (16,577,889) 59,233,950 (557,989,655)
Cash and cash equivalents at beginning of year 8,729,189 25,307,078 263,219,965 821,209,620
Cash and cash equivalents at end of year (Note 7) 10,735,188 8,729,189 322,453,915 263,219,965
- - -
Supplemental cash flows information
Non-cash items consist of
Purchases of plant and equipment that has not
yet been paid 2,461,773 3,004,341 73,944,514 91,908,335
Increase in right-of-use assets from lease liabilities 41,587 - 5,760,419 -
Sales of investments in equity instruments that
has not yet been received 4,940,079 - 148,385,633 -
Sales of equipment that has not yet been received 626,102 329,644 18,806,296 10,084,408
The accompanying notes are an integral part of the financial statements.

22

23
Cal-Comp Electronics (Thailand) Public Company Limited and its subsidiaries
Notes to consolidated financial statements
For the year ended 31 December 2020
1. General information
1.1 General information of the Company
Cal-Comp Electronics (Thailand) Public Company Limited (“the Company”) is a public
company incorporated and domiciled in Thailand. Its parent company is Kinpo
Electronics, Inc., which was incorporated in Taiwan. The Company is principally engaged in
the manufacture of electronic products, such as computer and computer peripheral,
telecommunication equipment and automation equipment. The registered office of
the Company is at No. 191/54, 191/57, 18th Floor, CTI Tower, Rachadapisek Road,
Kwang Klongtoey, Khet Klongtoey, Bangkok 10110. The Company has 4 branches in
Thailand and is located at Samut Sakorn, Petchaburi and Nakhonratchasima.
1.2 Coronavirus disease 2019 Pandemic
The Coronavirus disease 2019 pandemic is adversely impacting most businesses and
industries. This situation may bring uncertainties and have an impact on the environment in
which the Group operates. The Group’s management has continuously monitored ongoing
developments and assessed the financial impact in respect of the valuation of assets,
provisions and contingent liabilities, and has used estimates and judgement in respect of
various issues as the situation has evolved.
2. Basis of preparation
2.1 The financial statements have been prepared in accordance with Thai Financial Reporting
Standards enunciated under the Accounting Professions Act B.E. 2547 and their
presentation has been made in compliance with the stipulations of the Notification of the
Department of Business Development, issued under the Accounting Act B.E. 2543.
The management of the Group has determined US Dollar as the functional currency and
presents its financial statements in US Dollar. However, the regulatory requirements in
Thailand require the entity to present its financial statements in Thai Baht, so the Group also
presents its financial statements in Thai Baht by translating from US Dollar.
24
The US Dollar functional currency financial statements are translated into the Thai Baht
presentation currency financial statements at the rate of exchange prevailing at the end of
reporting period in respect of assets and liabilities, and at a rate that approximates
the actual rate at the date of the transaction in respect of revenues and expenses,
differences being recorded as “Exchange differences on translation of financial statements”
in the statements of changes in shareholders’ equity.
The financial statements in Thai language are the official statutory financial statements of
the Company. The financial statements in English language have been translated from
the Thai language financial statements.
The financial statements have been prepared on a historical cost basis except where
otherwise disclosed in the accounting policies.
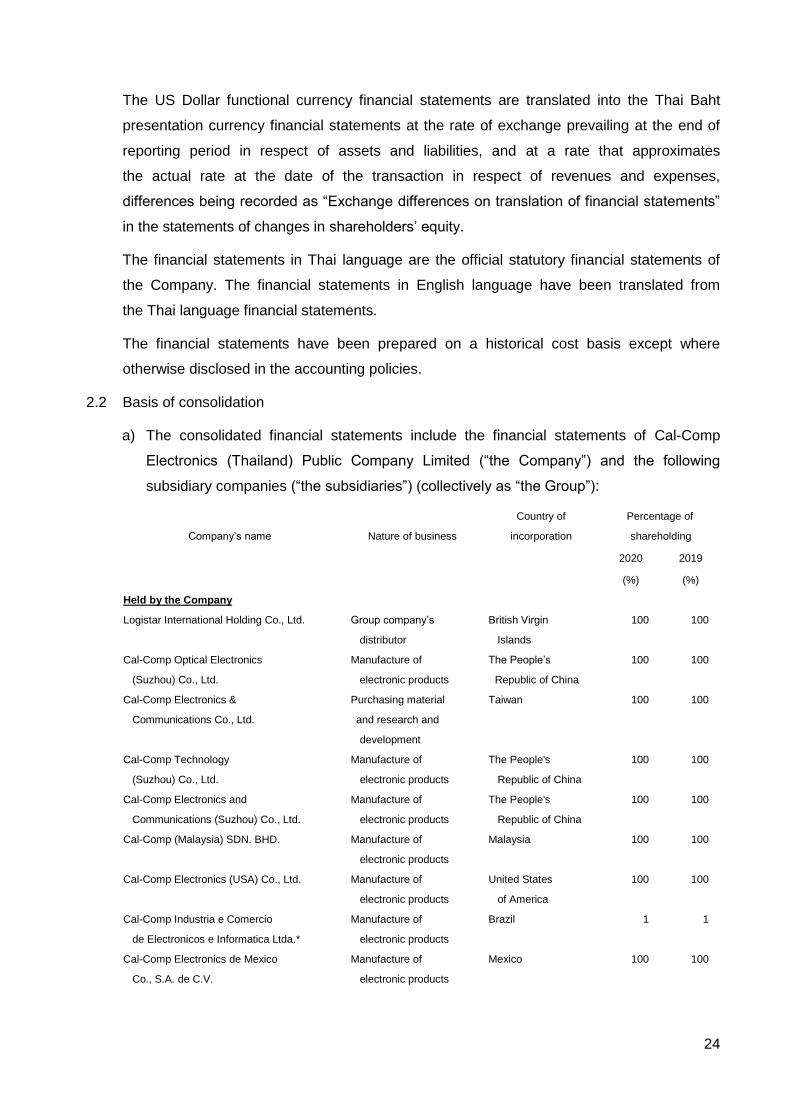
2.2 Basis of consolidation
a) The consolidated financial statements include the financial statements of Cal-Comp
Electronics (Thailand) Public Company Limited (“the Company”) and the following
subsidiary companies (“the subsidiaries”) (collectively as “the Group”):
Country of Percentage of
Company’s name Nature of business incorporation shareholding
2020 2019
(%) (%)
Held by the Company
Logistar International Holding Co., Ltd. Group company’s British Virgin 100 100
distributor Islands
Cal-Comp Optical Electronics Manufacture of The People’s 100 100
(Suzhou) Co., Ltd. electronic products Republic of China
Cal-Comp Electronics & Purchasing material Taiwan 100 100
Communications Co., Ltd. and research and
development
Cal-Comp Technology Manufacture of The People's 100 100
(Suzhou) Co., Ltd. electronic products Republic of China
Cal-Comp Electronics and Manufacture of The People's 100 100
Communications (Suzhou) Co., Ltd. electronic products Republic of China
Cal-Comp (Malaysia) SDN. BHD. Manufacture of Malaysia 100 100
electronic products
Cal-Comp Electronics (USA) Co., Ltd. Manufacture of United States 100 100
electronic products of America
Cal-Comp Industria e Comercio Manufacture of Brazil 1 1
de Electronicos e Informatica Ltda.* electronic products
Cal-Comp Electronics de Mexico Manufacture of Mexico 100 100
Co., S.A. de C.V. electronic products

25
Country of Percentage of
Company’s name Nature of business incorporation shareholding
2020 2019
(%) (%)
Cal-Comp Holding (Brasil) S.A. Holding company Brazil 100 100
Cal-Comp (India) Private Limited Research and development India 100 100
of products
Cal-Comp Automation and Industrial Provide service of design Thailand 100 100
4.0 Service (Thailand) Co., Ltd. factory automation
solution
Cal-Comp Precision Holding Co., Ltd. Holding company Cayman Islands 95 100
Qbit Semiconductor Holding Ltd. Holding company Cayman Islands 92 94
Held by its subsidiaries
Cal-Comp Precision (Singapore) Manufacture and Singapore 100 100
Limited (100% held by Cal-Comp Precision
Holding Co., Ltd.)
distributor of plastic
components
Cal-Comp Precision (Thailand) Manufacture and Thailand 100 100
Limited (100% held by Cal-Comp Precision
(Singapore) Limited)
distributor of plastic
components
Cal-Comp Precision (Malaysia) Manufacture and Malaysia 100 100
Sdn. Bhd. (100% held by Cal-Comp
Precision (Singapore) Limited)
distributor of plastic
components
Cal-Comp Precision (Dongguan) Manufacture and The People's 100 100
Limited (100% held by Cal-Comp Precision
(Singapore) Limited)
distributor of plastic
components
Republic of China
Cal-Comp Precision (Wujiang) Manufacture and The People's 100 100
Co., Ltd. (100% held by Cal-Comp
Precision (Thailand) Limited)
distributor of plastic
components
Republic of China
Cal-Comp Precision (Philippines), Inc. Manufacture and Philippines 100 100
(2020: 100% held by Cal-Comp Precision
(Singapore) Limited and 2019: 100% held
by Cal-Comp Precision (Thailand) Limited)
distributor of plastic
components
Cal-Comp Precision (Yue Yang) Manufacture and The People's 100 100
Co., Ltd. (100% held by Cal-Comp
Precision (Singapore) Limited)
distributor of plastic
components
Republic of China
Cal-Comp USA (Indiana), Inc. Manufacturer of United States 100 100
(100% held by Cal-Comp Electronics
(USA) Co., Ltd.)
electronic products of America
Cal-Comp USA (San Diego), Inc. Manufacturer of United States 100 100
(100% held by Cal-Comp Electronics
(USA) Co., Ltd.)
electronic products of America

26
Country of Percentage of
Company’s name Nature of business incorporation shareholding
2020 2019
(%) (%)
Cal-Comp Industria e Comercio Manufacturer of Brazil 99 99
de Electronicos e Informatica Ltda.
(99% held by Cal-Comp Holding
(Brasil) S.A.)
electronic products
Cal-Comp Industria de Semicondutores S.A.
(58% held by Cal-Comp Holding
(Brasil) S.A.)
Manufacturer of
electronic products
Brazil 58 58
Qbit Semiconductor Ltd.
(100% held by Qbit Semiconductor
Holding Ltd.)
Manufacturer of
electronic products
Taiwan 100 100
ICKP (Beijing) Technology Development
Co., Ltd. (80% held by Cal-Comp Optical
Electronics (Suzhou) Co., Ltd.)
Manufacturer of
electronic products
The People’s
Republic of China
80 80
Cal-Comp Optical Electronics (Yue Yang)
Co., Ltd. (100% held by Cal-Comp Optical
Electronics (Suzhou) Co., Ltd.)
Manufacturer of
electronic products
The People’s
Republic of China
100 100
NKG Advanced Intelligence & Research and The People's 100 100
Technology Development (Yue Yang)
Co., Ltd. (100% held by Cal-Comp Optical
Electronics (Suzhou) Co., Ltd.)
development of products Republic of China
* Classified as investments in subsidiaries since the Company indirectly holds the investment in such company through
Cal-Comp Holding (Brasil) S.A. with 99% of registered capital of Cal-Comp Industria e Comercio de Electronicos e
Informatica Ltda. and the Company has control over such company.
The financial statements of the subsidiaries were prepared by the management of
the subsidiaries and audited by their auditors, except the financial statements of
Cal-Comp (India) Private Limited and Cal-Comp Automation and Industrial 4.0 Service
(Thailand) Co., Ltd. which were prepared by the management, with no material effect to
the financial statements.
b) The Company is deemed to have control over an investee or subsidiaries if it has rights,
or is exposed, to variable returns from its involvement with the investee, and it has the
ability to direct the activities that affect the amount of its returns.
c) Subsidiaries are fully consolidated, being the date on which the Company obtains
control, and continue to be consolidated until the date when such control ceases.
d) The financial statements of the subsidiaries are prepared using the same significant
accounting policies as the Company.

27
e) The financial statements of all subsidiaries and associates are prepared in their
respective functional currencies. Where the functional currency is not US Dollar,
the assets and liabilities in the financial statements are translated to US Dollar using
the exchange rate prevailing at the end of reporting period, and revenues and expenses
translated using monthly average exchange rates. The resulting differences are shown
under the caption of “Exchange differences on translation of financial statements” in the
statements of changes in shareholders’ equity.
f) Material balances and transactions between the Group have been eliminated from
the consolidated financial statements.
g) Non-controlling interests represent the portion of profit or loss and net assets of
the subsidiaries that are not held by the Company and are presented separately in
the consolidated profit or loss and within equity in the consolidated statement of financial
position.
2.3 The separate financial statements present investments in subsidiaries and associates under
the equity method.
3. New financial reporting standards
(a) Financial reporting standards that became effective in the current year
During the year, the Group has adopted the revised (revised 2019) and new financial
reporting standards and interpretations which are effective for fiscal years beginning on
or after 1 January 2020. These financial reporting standards were aimed at alignment
with the corresponding International Financial Reporting Standards with most of the
changes directed towards clarifying accounting treatment and providing accounting
guidance for users of the standards. The adoption of these financial reporting standards
does not have any significant impact on the Group’s financial statements. However, the
new standard involves changes to key principles, which are summarised below:
Financial reporting standards related to financial instruments
The set of TFRSs related to financial instruments consists of five accounting standards
and interpretations, as follows:
Financial reporting standards:
TFRS 7 Financial Instruments: Disclosures
TFRS 9 Financial Instruments

28
Accounting standard:
TAS 32 Financial Instruments: Presentation
Financial Reporting Standard Interpretations:
TFRIC 16 Hedges of a Net Investment in a Foreign Operation
TFRIC 19 Extinguishing Financial Liabilities with Equity Instruments
These TFRSs related to financial instruments make stipulations relating to the
classification of financial instruments and their measurement at fair value or amortised
cost (taking into account the type of instrument, the characteristics of the contractual
cash flows and the Company’s business model), calculation of impairment using the
expected credit loss method, and hedge accounting. They also include stipulations
regarding the presentation and disclosure of financial instruments.
The adoption of these standards has the impact on the Group’s financial statements to
result in the following adjustments.
- Classification and measurement of non-listed equity instruments and investment in
available-for-sale equity security - The Group has decided to measure these
investments at fair value and classify them as financial assets at fair value through
other comprehensive income.
- Classification and measurement of non-listed debt instrument - The Group has
decided to measure this investment at fair value and classify it as financial asset at
fair value through profit or loss.
- Recognition of expected credit losses - The Group recognises an allowance for
expected credit losses on its debt instruments measured at amortised cost, and it is
no longer necessary for a credit-impaired event to have occurred.
The Group recognised the cumulative effect of the adoption of these financial reporting
standard as an adjustment to retained earnings as at 1 January 2020, and the
comparative information was not restated. However, these financial reporting standards
do not have any significant impact on the Group’s financial statements.
The cumulative effect of the change is described in Note 4.

29
TFRS 16 Leases
TFRS 16 supersedes TAS 17, Leases, together with related Interpretations.
The financial reporting standard sets out the principles for the recognition,
measurement, presentation and disclosure of leases, and requires a lessee to recognise
assets and liabilities for all leases with a term of more than 12 months, unless the
underlying asset is low value.
Accounting by lessors under TFRS 16 is substantially unchanged from TAS 17. Lessors
will continue to classify leases as either operating or finance leases.
The Group recognised the cumulative effect of the adoption of this financial reporting
standards as an adjustment to retained earnings as at 1 January 2020, and the
comparative information was not restated.
The cumulative effect of the change is described in Note 4.
Accounting Guidance on Temporary Relief Measures for Accounting Alternatives
in Response to the Impact of the COVID-19 Pandemic
The Federation of Accounting Professions announced Accounting Guidance on
Temporary Relief Measures for Accounting Alternatives in Response to the Impact of the
COVID-19 Pandemic. Its objectives are to alleviate some of the impacts of applying
certain financial reporting standards, and to provide clarification about accounting
treatments during the period of uncertainty relating to this situation.
On 22 April 2020, the Accounting Treatment Guidance was announced in the Royal
Gazette and it is effective for the financial statements prepared for reporting periods
ending between 1 January 2020 and 31 December 2020.
During the period from the first quarter to the third quarter of 2020, the Group elected to
apply the temporary relief measures on accounting alternatives relating to measurement
of expected credit losses using a simplified approach, fair value measurement of
investments in debt instrument and equity instrument and impairment of assets.
In the fourth quarter of 2020, the Group has assessed the financial impacts of the
uncertainties of the COVID-19 Pandemic on the valuation of assets, provisions and
contingent liabilities. As a result, in preparing the financial statements for the year ended
31 December 2020, the Group has decided to discontinue application of all temporary
relief measures on accounting alternatives with no significant impact on the Group’s
financial statements.

30
b) Financial reporting standards that will become effective for fiscal years beginning
on or after 1 January 2021
The Federation of Accounting Professions issued a number of revised financial reporting
standards and interpretations, which are effective for fiscal years beginning on or after
1 January 2021. These financial reporting standards were aimed at alignment with the
corresponding International Financial Reporting Standards with most of the changes
directed towards clarifying accounting treatment and providing accounting guidance for
users of the standards.
The management of the Group is currently evaluating the impact of these standards on
the financial statements in the year when they are adopted.
4. Cumulative effects of changes in accounting policies due to the adoption of new
financial reporting standards
As described in Note 3 to the consolidated financial statements, during the current year,
the Group has adopted the set of financial reporting standards related to financial
instruments and TFRS 16. The cumulative effect of initially applying these standards was
recognised as an adjustment to retained earnings as at 1 January 2020. Therefore, the
comparative information was not restated.
The impacts of changes in accounting policies on the statements of financial position at the
beginning of 2020 due to the adoption of these financial reporting standards are presented
as follows:

31
(Unit: Thousand US Dollar)
Consolidated financial statements
The effect of
31 December
2019
Financial
reporting
standards
related to
financial
instruments TFRS 16
1 January
2020
Statement of financial position
Assets
Current assets
Current investments 9,666 (9,666) - -
Other current financial assets - 11,052 - 11,052
Other current assets 44,210 (1,386) - 42,824
Non-current assets
Other non-current financial assets - 16,690 - 16,690
Other long-term investments 16,690 (16,690) - -
Right-of-use assets - - 20,470 20,470
Land occupancy rights 1,914 - (1,914) -
Liabilities
Current liabilities
Current portion of lease liabilities - - 6,091 6,091
Other current financial liabilities - 59 - 59
Other current liabilities 14,179 (59) - 14,120
Non-current liabilities
Lease liabilities, net of
current portion
-
-
12,465
12,465

32
(Unit: Thousand Baht)
Consolidated financial statements
The effect of
31 December
2019
Financial
reporting
standards
related to
financial
instruments TFRS 16
1 January
2020
Statement of financial position
Assets
Current assets
Current investments 291,476 (291,476) - -
Other current financial assets - 333,281 - 333,281
Other current assets 1,333,115 (41,805) - 1,291,310
Non-current assets
Other non-current financial assets - 503,267 - 503,267
Other long-term investments 503,267 (503,267) - -
Right-of-use assets - - 617,258 617,258
Land occupancy rights 57,705 - (57,705) -
Liabilities
Current liabilities
Current portion of lease liabilities - - 183,677 183,677
Other current financial liabilities - 1,787 - 1,787
Other current liabilities 427,556 (1,787) - 425,769
Non-current liabilities
Lease liabilities, net of
current portion
- - 375,876 375,876

33
(Unit: Thousand US Dollar)
Separate financial statements
The effect of
31 December
2019
Financial
reporting
standards
related to
financial
instruments TFRS 16
1 January
2020
Statement of financial position
Assets
Non-current assets
Other non-current financial assets - 12,757 - 12,757
Other long-term investments 12,757 (12,757) - -
Right-of-use assets - - 191 191
Liabilities
Current liabilities
Current portion of lease liabilities - - 76 76
Other current financial liabilities - 32 - 32
Other current liabilities 2,898 (32) - 2,866
Non-current liabilities
Lease liabilities, net of
current portion - - 115 115

34
(Unit: Thousand Baht)
Separate financial statements
The effect of
31 December
2019
Financial
reporting
standards
related to
financial
instruments TFRS 16
1 January
2020
Statement of financial position
Assets
Non-current assets
Other non-current financial assets - 384,661 - 384,661
Other long-term investments 384,661 (384,661) - -
Right-of-use assets - - 5,760 5,760
Liabilities
Current liabilities
Current portion of lease liabilities - - 2,295 2,295
Other current financial liabilities - 950 - 950
Other current liabilities 87,400 (950) - 86,450
Non-current liabilities
Lease liabilities, net of
current portion - - 3,465 3,465

35
4.1 Financial instruments
As at 1 January 2020, classification and measurement of financial assets required by TFRS 9, in comparison with classification and
the former carrying amount, are as follows:
(Unit: Thousand US Dollar)
Consolidated financial statements
The former
carrying amount
Classification and measurement in accordance with TFRS 9
Fair value through
profit or loss
Fair value through
other comprehensive
income Amortised cost Total
Financial assets as at 1 January 2020
Cash and cash equivalents 138,221 - - 138,221 138,221
Trade and other receivables 605,315 - - 605,315 605,315
Other current financial assets
- Fixed deposits 6,070 - - 6,070 6,070
- Structured deposits 3,596 3,596 - - 3,596
- Financial derivative assets 1,386 1,386 - - 1,386
Receivable - molds 4,910 - - 4,910 4,910
Grant receivable - Government 13,121 - - 13,121 13,121
Restricted bank deposits 501 - - 501 501
Other non-current financial assets
- Investment in debt instrument 1,900 1,900 - - 1,900
- Investments in equity instruments 14,790 - 14,790 - 14,790
Long-term loans to related parties 6,451 - - 6,451 6,451
Total financial assets 796,261 6,882 14,790 774,589 796,261

36
(Unit: Thousand Baht)
Consolidated financial statements
The former
carrying amount
Classification and measurement in accordance with TFRS 9
Fair value through
profit or loss
Fair value through
other comprehensive
income Amortised cost Total
Financial assets as at 1 January 2020
Cash and cash equivalents 4,167,918 - - 4,167,918 4,167,918
Trade and other receivables 18,252,666 - - 18,252,666 18,252,666
Other current financial assets
- Fixed deposits 183,035 - - 183,035 183,035
- Structured deposits 108,441 108,441 - - 108,441
- Financial derivative assets 41,805 41,805 - - 41,805
Receivable - molds 148,064 - - 148,064 148,064
Grant receivable - Government 395,639 - - 395,639 395,639
Restricted bank deposits 15,115 - - 15,115 15,115
Other non-current financial assets
- Investment in debt instrument 57,292 57,292 - - 57,292
- Investments in equity instruments 445,975 - 445,975 - 445,975
Long-term loans to related parties 194,508 - - 194,508 194,508
Total financial assets 24,010,458 207,538 445,975 23,356,945 24,010,458

37
(Unit: Thousand US Dollar)
Separate financial statements
The former
carrying amount
Classification and measurement in accordance with TFRS 9
Fair value through
profit or loss
Fair value through
other comprehensive
income Amortised cost Total
Financial assets as at 1 January 2020
Cash and cash equivalents 8,729 - - 8,729 8,729
Trade and other receivables 476,786 - - 476,786 476,786
Receivable - molds 4,850 - - 4,850 4,850
Investments in equity instruments 12,757 - 12,757 - 12,757
Long-term loans to related parties 27,360 - - 27,360 27,360
Total financial assets 530,482 - 12,757 517,725 530,482
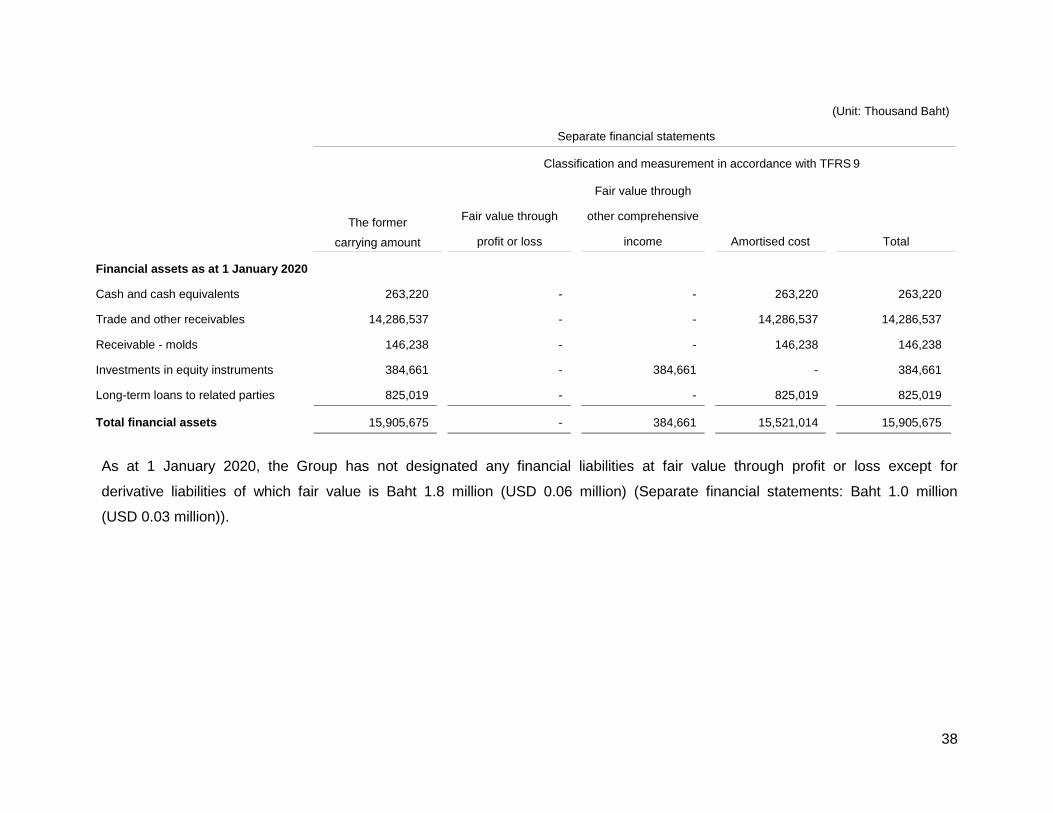
38
(Unit: Thousand Baht)
Separate financial statements
The former
carrying amount
Classification and measurement in accordance with TFRS 9
Fair value through
profit or loss
Fair value through
other comprehensive
income Amortised cost Total
Financial assets as at 1 January 2020
Cash and cash equivalents 263,220 - - 263,220 263,220
Trade and other receivables 14,286,537 - - 14,286,537 14,286,537
Receivable - molds 146,238 - - 146,238 146,238
Investments in equity instruments 384,661 - 384,661 - 384,661
Long-term loans to related parties 825,019 - - 825,019 825,019
Total financial assets 15,905,675 - 384,661 15,521,014 15,905,675
As at 1 January 2020, the Group has not designated any financial liabilities at fair value through profit or loss except for
derivative liabilities of which fair value is Baht 1.8 million (USD 0.06 million) (Separate financial statements: Baht 1.0 million
(USD 0.03 million)).

39
4.2 Leases
On adoption of TFRS 16, the Group recognised lease liabilities in relation to leases
that previously classified as operating leases measured at the present value of the
remaining lease payments, discounted using the Group’s incremental borrowing rate
at 1 January 2020 as detailed below.
(Unit: Thousand US Dollar) (Unit: Thousand Baht)
Consolidated Consolidated
financial statements financial statements
Operating lease commitments as at 31 December 2019 12,760 384,773
Less: Short-term leases and leases of low-value assets (2) (74)
Add: Option to extend lease term 7,812 235,580
Less: Others (378) (11,408)
Less: Deferred interest expenses (1,636) (49,318)
Lease liabilities as at 1 January 2020 18,556 559,553
Weighted average incremental borrowing rate
(percent per annum)
1.35% - 4.30%
1.35% - 4.30%
Comprise of:
Current lease liabilities 6,091 183,677
Non-current lease liabilities 12,465 375,876
18,556 559,553
(Unit: Thousand US Dollar) (Unit: Thousand Baht)
Separate Separate
financial statements financial statements
Operating lease commitments as at 31 December 2019 200 6,042
Less: Short-term leases and leases of low-value assets (2) (74)
Less: Others (2) (48)
Less: Deferred interest expenses (5) (160)
Lease liabilities as at 1 January 2020 191 5,760
Weighted average incremental borrowing rate
(percent per annum)
2.16%
2.16%
Comprise of:
Current lease liabilities 76 2,295
Non-current lease liabilities 115 3,465
191 5,760

40
5. Significant accounting policies
5.1 Revenue and expense recognition
Sales of goods
Revenue from sale of goods is recognised at the point in time when control of the asset is
transferred to the customer, generally upon delivery of the goods. Revenue is measured at
the amount of the consideration received or receivable, excluding value added tax, of goods
supplied after deducting returns and discounts to customers.
Rendering of services
Service income is recognised at a point in time upon completion of the service.
Interest income
Interest income is calculated using the effective interest method and recognised on
an accrual basis. The effective interest rate is applied to the gross carrying amount of
a financial asset, unless the financial assets subsequently become credit-impaired when it is
applied to the net carrying amount of the financial asset (net of the expected credit loss
allowance).
Dividends
Dividends are recognised when the right to receive the dividends is established.
Expenses
Expenses are recognised on an accrual basis.
Finance cost
Interest expense from financial liabilities at amortised cost is calculated using the effective
interest method and recognised on an accrual basis.
5.2 Cash and cash equivalents
Cash and cash equivalents consist of cash in hand and at banks, and all highly liquid
investments with an original maturity of three months or less and not subject to withdrawal
restrictions.
5.3 Inventories
Finished goods and work in process are valued at the lower of cost (under the average
method) and net realisable value. The cost of inventories includes all production costs and
attributable factory overheads.
Raw materials, spare parts and factory supplies are valued at the lower of average cost and
net realisable value and are charged to production costs whenever consumed.

41
5.4 Investments in subsidiaries and associates
Investments in subsidiaries and associates are accounted for in the consolidated and
separate financial statements using the equity method.
5.5 Property, plant and equipment and depreciation
Land is stated at cost. Buildings and equipment are stated at cost less accumulated
depreciation and allowance for loss on impairment of assets (if any). Depreciation of plant
and equipment is calculated by reference to their costs, on the straight-line basis over the
following estimated useful lives:
Buildings and building improvements - 3 - 51 years
Machinery and equipment - 1 - 15 years
Molds and spare parts - 1 - 10 years
Office furniture and equipment - 2 - 20 years
Motor vehicles - 3 - 11 years
Miscellaneous equipment and research
and development equipment
- 1 - 20 years
Depreciation is included in determining income.
No depreciation is provided on land, land improvements, construction in progress and
equipment under installation.
An item of property, plant and equipment is derecognised upon disposal or when no future
economic benefits are expected from its use or disposal. Any gain or loss arising on disposal
of an asset is included in profit or loss when the asset is derecognised.
5.6 Borrowing costs
Borrowing costs directly attributable to the acquisition, construction or production of an asset
that necessarily takes a substantial period of time to get ready for its intended use or sale
are capitalised as part of the cost of the respective assets. All other borrowing costs are
expensed in the period they are incurred. Borrowing costs consist of interest and other costs
that an entity incurs in connection with the borrowing of funds.

42
5.7 Government grants
Government grants are recognised when there is reasonable assurance that the grant will
be received and all attached conditions will be complied with. The grant that relates to an
asset will be, recognised as a deduction of the book value of the related asset and the grant
is recognised in profit or loss over the life of a depreciable asset as a reduced depreciation
expense. The grant that relates to an expense item is recognised as income over the period
when the related costs are incurred.
5.8 Intangible assets and amortisation
Intangible assets acquired through business combination are initially recognised at their fair
value on the date of business acquisition while intangible assets acquired in other cases are
recognised at cost. Following the initial recognition, the intangible assets are carried at cost
less any accumulated amortisation and any accumulated impairment losses (if any).
Intangible assets with finite lives are amortised on a systematic basis over the economic
useful life and tested for impairment whenever there is an indication that the intangible asset
may be impaired. The amortisation period and the amortisation method of such intangible
asset are reviewed at least at each financial year end. The amortisation expense is charged
to profit or loss.
A summary of the intangible assets with finite useful lives is as follows.
Computer software design - 1 - 3 years
Technical license fee - 2 - 10 years
No amortisation is provided on development cost.
5.9 Goodwill
Goodwill is initially recorded at cost, which equals to the excess of cost of business
combination over the fair value of the net assets acquired. If the fair value of the net assets
acquired exceeds the cost of business combination, the excess is immediately recognised
as gain in profit or loss.
Goodwill is carried at cost less any accumulated impairment losses. Goodwill is tested for
impairment annually and when circumstances indicate that the carrying value may be
impaired.

43
For the purpose of impairment testing, goodwill acquired in a business combination is
allocated to each of the Group's cash generating units (or group of cash-generating units)
that are expected to benefit from the synergies of the combination. The Group estimates
the recoverable amount of each cash-generating unit (or group of cash-generating units) to
which the goodwill relates. Where the recoverable amount of the cash-generating unit is less
than the carrying amount, an impairment loss is recognised in profit or loss. Impairment
losses relating to goodwill cannot be reversed in future periods.
5.10 Leases
At inception of contract, the Group assesses whether a contract is, or contains, a lease.
A contract is, or contains, a lease if the contract conveys the right to control the use of
an identified asset for a period of time in exchange for consideration.
Accounting policies adopted since 1 January 2020
The Group applied a single recognition and measurement approach for all leases, except for
short-term leases and leases of low-value assets. At the commencement date of the lease
(i.e. the date the underlying asset is available for use), the Group recognises right-of-use
assets representing the right to use underlying assets and lease liabilities based on lease
payments.
Right-of-use assets
Right-of-use assets are measured at cost, less accumulated depreciation, any accumulated
impairment losses, and adjusted for any remeasurement of lease liabilities. The cost of
right-of-use assets includes the amount of lease liabilities initially recognised, initial direct
costs incurred, and lease payments made at or before the commencement date of the lease
less any lease incentives received.
Depreciation of right-of-use assets are calculated by reference to their costs, on the
straight-line basis over the shorter of their estimated useful lives and the lease term.
Land - 49 years
Buildings and building improvements - 2 - 22 years
Office furniture and equipment - 3 years

44
Lease liabilities
Lease liabilities are measured at the present value of the lease payments to be made over
the lease term. The lease payments include fixed payments less any lease incentives
receivable. Variable lease payments that do not depend on an index or a rate are
recognised as expenses in the period in which the event or condition that triggers the
payment occurs.
The Group discounted the present value of the lease payments by the interest rate implicit in
the lease or the Group’s incremental borrowing rate. After the commencement date, the
amount of lease liabilities is increased to reflect the accretion of interest and reduced for the
lease payments made.
Short-term leases and leases of low-value assets
A lease that has a lease term less than or equal to 12 months from commencement date or
a lease of low-value assets is recognised as expenses on a straight-line basis over the
lease term.
Accounting policies adopted before 1 January 2020
Leases of property, plant or equipment which do not transfer substantially all the risks and
rewards of ownership are classified as operating leases. Operating lease payments are
recognised as an expense in profit or loss on a straight-line basis over the lease term.
5.11 Related party transactions
Related parties comprise individuals or enterprises that control, or are controlled by
the Company, whether directly or indirectly, or which are under common control with
the Company.
They also include associated companies, and individuals or enterprises which directly or
indirectly own a voting interest in the Company that gives them significant influence over
the Company, key management personnel, directors, and officers with authority in the
planning and direction of the Company’s operations.

45
5.12 Foreign currencies
Each entity in the Group determines its own functional currency while transactions included
in the financial statements of each entity in the Group are measured using US Dollar which
is the Group’s functional currency.
Transactions and balances
Transactions in foreign currencies are initially recorded by each entity in the Group at their
respective functional currency. Foreign currency transactions during a particular month are
translated into functional currency at the average exchange rates ruling during the previous
transaction month.
Monetary assets and liabilities denominated in foreign currencies are retranslated into
functional currency at the exchange rate ruling at the end of reporting period. All differences
are taken to the income statement.
Non-monetary assets and liabilities denominated in foreign currency are translated into
functional currency at a rate that approximates the actual rate at the date of the
transactions.
Group companies
The assets and liabilities of Group companies whose functional currency is not US Dollar
are translated into US Dollar at the exchange rate ruling at the end of reporting period and
their income statement and statements of comprehensive income are translated using
monthly average exchange rates.
The exchange differences arising on the translation are recognised in other comprehensive
income. On disposal of a foreign operation, the component of other comprehensive income
relating to that particular foreign operation is recognised in the income statement.
To comply with the regulatory requirements in Thailand, the Group presents the
consolidated financial statements by translating from US Dollar to Thai Baht. The assets and
liabilities are translated into Thai Baht at the rate of exchange prevailing at the end of
reporting period, whereas revenues and expenses are translated at a rate that approximates
the actual rate at the date of the transaction, differences being recorded as “Exchange
differences on translation of financial statements” in the statements of changes in
shareholders’ equity.
46
5.13 Impairment of non-financial assets
At the end of each reporting period, the Group performs impairment reviews in respect of
the property, plant and equipment, right-of-use assets and other intangible assets whenever
events or changes in circumstances indicate that an asset may be impaired. The Group also
carries out annual impairment reviews in respect of goodwill. An impairment loss is
recognised when the recoverable amount of an asset, which is the higher of the asset’s fair
value less costs to sell and its value in use, is less than the carrying amount. In determining
value in use, the estimated future cash flows are discounted to their present value using
a pre-tax discount rate that reflects current market assessments of the time value of money
and the risk specific to the asset. In determining fair value less cost to sell, an appropriate
valuation model is used. These calculations are corroborated by a valuation model that,
based on information available, reflects the amount that the Group could obtain from the
disposal of the asset in an arm's length transaction between knowledgeable, willing parties,
after deducting the costs of disposal.
An impairment loss is recognised in profit or loss.
5.14 Employee benefits
Short-term employee benefits
Salaries, wages, bonus and contributions to the social security fund are recognised as
expenses when incurred.
Post-employment benefits
Defined contribution plans
The Group and its employees have jointly established a provident fund. The fund is monthly
contributed by employees and by the Group. The fund’s assets are held in a separate trust
fund and the Group's contributions are recognised as expenses when incurred.
Defined benefit plans
The Group has obligations in respect of the severance payments it must make to employees
upon retirement under labor law. The Group treats these severance payment obligations as
a defined benefit plan.
The obligation under the defined benefit plan is determined by a professionally qualified
independent actuary based on actuarial techniques, using the projected unit credit method.
The liabilities under the defined benefit plan consist of the present value of the defined
benefit obligation less fair value of plan assets.

47
Net interest recognised in profit or loss consists of the interest cost on the defined benefit
obligation net with the interest income on plan assets which calculated using the same rate
as the discount rate applying for the post-employment benefit obligation.
Actuarial gains and losses arising from determining the measurement of the defined benefit
obligation and return of plan assets net from interest income on plan assets are recognised
immediately in other comprehensive income.
Past service costs are recognised in profit or loss on the earlier of the date of the plan
amendment or curtailment and the date that the Group recognises restructuring - related
costs.
5.15 Provisions
Provisions are recognised when the Group has a present obligation as a result of a past
event, it is probable that an outflow of resources embodying economic benefits will be
required to settle the obligation, and a reliable estimate can be made of the amount of
the obligation.
5.16 Income tax
Income tax expense represents the sum of corporate income tax currently payable and
deferred tax.
Current tax
Current income tax is provided in the accounts at the amount expected to be paid to
the taxation authorities, based on taxable profits determined in accordance with tax
legislation.
Deferred tax
Deferred income tax is provided on temporary differences between the tax bases of assets
and liabilities and their carrying amounts at the end of each reporting period, using the tax
rates enacted at the end of the reporting period.
The Group recognises deferred tax liabilities for all taxable temporary differences while
it recognises deferred tax assets for all deductible temporary differences and tax losses
carried forward to the extent that it is probable that future taxable profit will be available
against which such deductible temporary differences and tax losses carried forward can be
utilised.
At each reporting date, the Group reviews and reduces the carrying amount of deferred tax
assets to the extent that it is no longer probable that sufficient taxable profit will be available
to allow all or part of the deferred tax asset to be utilised.

48
The Group records deferred tax directly to shareholders' equity if the tax relates to items that
are recorded directly to shareholders' equity.
5.17 Financial instruments
Accounting policies adopted since 1 January 2020
Classification and measurement of financial assets
The Group initially measures financial assets at its fair value plus, in the case of financial
assets that are not measured at fair value through profit or loss, transaction costs. However,
trade receivables, that do not contain a significant financing component, are measured at
the transaction price as disclosed in the accounting policy relating to revenue recognition.
Financial assets are classified, at initial recognition, as to be subsequently measured at
amortised cost, fair value through other comprehensive income (“FVOCI”), or fair value
through profit or loss (“FVTPL”). The classification of financial assets at initial recognition is
driven by the Group’s business model for managing the financial assets and the contractual
cash flows characteristics of the financial assets.
Financial assets at amortised cost
The Group measures financial assets at amortised cost if the financial asset is held in order
to collect contractual cash flows and the contractual terms of the financial asset give rise on
specified dates to cash flows that are solely payments of principal and interest on the
principal amount outstanding.
Financial assets at amortised cost are subsequently measured using the effective interest
rate (“EIR”) method and are subject to impairment. Gains and losses are recognised in profit
or loss when the asset is derecognised, modified or impaired.
Financial assets designated at FVOCI (equity instruments)
Upon initial recognition, the Group can elect to irrevocably classify its equity investments
which are not held for trading as equity instruments designated at FVOCI. The classification
is determined on an instrument-by-instrument basis.
Gains and losses recognised in other comprehensive income on these financial assets are
never recycled to profit or loss.
Dividends are recognised as other income in profit or loss, except when the dividends
clearly represent a recovery of part of the cost of the financial asset, in which case, the
gains are recognised in other comprehensive income.
Equity instruments designated at FVOCI are not subject to impairment assessment.

49
Financial assets at FVTPL
Financial assets measured at FVTPL are carried in the statement of financial position at fair
value with net changes in fair value recognised in profit or loss.
These financial assets include derivatives and investment in debt instrument which the
Group has not irrevocably elected to classify at FVOCI and financial assets with cash flows
that are not solely payments of principal and interest.
Classification and measurement of financial liabilities
Except for derivative liabilities, at initial recognition the Group’s financial liabilities are
recognised at fair value net of transaction costs and classified as liabilities to be
subsequently measured at amortised cost using the EIR method. Gains and losses are
recognised in profit or loss when the liabilities are derecognised as well as through the EIR
amortisation process. In determining amortised cost, the Group takes into account any fees
or costs that are an integral part of the EIR. The EIR amortisation is included in finance
costs in profit or loss.
Derecognition of financial instruments
A financial asset is primarily derecognised when the rights to receive cash flows from the
asset have expired or have been transferred and either the Group has transferred
substantially all the risks and rewards of the asset, or the Group has neither transferred nor
retained substantially all the risks and rewards of the asset but has transferred control of the
asset.
A financial liability is derecognised when the obligation under the liability is discharged or
cancelled or expires. When an existing financial liability is replaced by another from the
same lender on substantially different terms, or the terms of an existing liability are
substantially modified, such an exchange or modification is treated as the derecognition of
the original liability and the recognition of a new liability. The difference in the respective
carrying amounts is recognised in profit or loss.
Impairment of financial assets
The Group recognises an allowance for expected credit losses (“ECLs”) for all debt
instruments not held at FVTPL. ECLs are based on the difference between the contractual
cash flows due in accordance with the contract and all the cash flows that the Group
expects to receive, discounted at an approximation of the original effective interest rate.

50
For credit exposures for which there has not been a significant increase in credit risk since
initial recognition, ECLs are provided for credit losses that result from default events that are
possible within the next 12-months (a 12-month ECL). For those credit exposures for which
there has been a significant increase in credit risk since initial recognition, a loss allowance
is required for credit losses expected over the remaining life of the exposure (a lifetime
ECL).
The Group considers a significant increase in credit risk to have occurred when contractual
payments are more than 30 days past due and considers a financial asset in default when
contractual payments are 365 days past due. However, in certain cases, the Group may
also consider a financial asset to have a significant increase in credit risk and to be in
default using other internal or external information.
For trade receivables, the Group applies a simplified approach in calculating ECLs.
Therefore, the Group does not track changes in credit risk, but instead recognises a loss
allowance based on lifetime ECLs at each reporting date. It is based on its historical credit
loss experience and adjusted for forward-looking factors specific to the debtors and the
economic environment.
A financial asset is written off when there is no reasonable expectation of recovering the
contractual cash flows.
Offsetting of financial instruments
Financial assets and financial liabilities are offset, and the net amount is reported in the
statement of financial position if there is a currently enforceable legal right to offset the
recognised amounts and there is an intention to settle on a net basis, to realise the assets
and settle the liabilities simultaneously.
Accounting policies adopted before 1 January 2020
Trade accounts receivable
Trade accounts receivable are stated at the net realisable value. Allowance for doubtful
accounts is provided for the estimated losses that may be incurred in collection of
receivables. The allowance is generally based on collection experience and analysis of debt
aging.

51
Investments
a) Investments in available-for-sale securities are stated at fair value. Changes in the fair
value of these securities are recorded in other comprehensive income and will be
recorded in profit or loss when the securities are sold.
b) Investments in non-marketable equity securities, which the Group classifies as other
investments, are stated at cost net of allowance for impairment loss (if any).
The fair value of marketable securities is based on the latest bid price of the last working
day of the year.
The weighted average method is used for computation of the cost of investments.
On disposal of an investment, the difference between net disposal proceeds and the
carrying amount of the investment is recognised in profit or loss.
5.18 Derivatives
The Group uses derivatives, such as forward currency contracts, to hedge its foreign
currency risks.
Derivatives are initially recognised at fair value on the date on which a derivative contract is
entered into and are subsequently remeasured at fair value. The subsequent changes are
recognised in profit or loss. Derivatives are carried as financial assets when the fair value is
positive and as financial liabilities when the fair value is negative.
Derivatives are presented as non-current assets or non-current liabilities if the remaining
maturity of the instrument is more than 12 months and it is not due to be realised or settled
within 12 months. Other derivatives are presented as current assets or current liabilities.
5.19 Fair value measurement
Fair value is the price that would be received to sell an asset or paid to transfer a liability in
an orderly transaction between buyer and seller (market participants) at the measurement
date. The Group applies a quoted market price in an active market to measure their assets
and liabilities that are required to be measured at fair value by relevant financial reporting
standards. Except in case of no active market of an identical asset or liability or when
a quoted market price is not available, the Group measures fair value using valuation
technique that are appropriate in the circumstances and maximises the use of relevant
observable inputs related to assets and liabilities that are required to be measured at fair
value.

52
All assets and liabilities for which fair value is measured or disclosed in the financial
statements are categorised within the fair value hierarchy into three levels based on
categorise of input to be used in fair value measurement as follows:
Level 1 - Use of quoted market prices in an active market for such assets or liabilities
Level 2 - Use of other observable inputs for such assets or liabilities, whether directly or
indirectly
Level 3 - Use of unobservable inputs such as estimates of future cash flows
At the end of each reporting period, the Group determines whether transfers have occurred
between levels within the fair value hierarchy for assets and liabilities held at the end of
the reporting period that are measured at fair value on a recurring basis.
6. Significant accounting judgements and estimates
The preparation of financial statements in conformity with financial reporting standards at
times requires management to make subjective judgements and estimates regarding
matters that are inherently uncertain. These judgements and estimates affect reported
amounts and disclosures; and actual results could differ from these estimates. Significant
judgements and estimates are as follows:
Allowance for expected credit losses of trade receivables
In determining an allowance for expected credit losses of trade receivables, the
management needs to make judgement and estimates based upon, among other things,
past collection history, aging profile of outstanding debts and the forecast economic
condition for groupings of various customer segments with similar credit risks. The Group’s
historical credit loss experience and forecast economic conditions may also not be
representative of whether a customer will actually default in the future.
Allowance for diminution in value of inventory
In determining an allowance for diminution in the value of inventory, the management is
required to exercise judgement in estimating losses on outstanding inventories, based on
the selling price expected in the ordinary course of business; minus selling expenses and
provision for obsolete, slow-moving and deteriorated inventories, and taking into account
the approximate useful life of each type of inventories and current changes in technology.

53
Property, plant and equipment/ Depreciation
In determining depreciation of plant and equipment, the management is required to make
estimates of the useful lives and residual values of the plant and equipment and to review
estimate useful lives and residual values when there are any changes.
In addition, the management is required to review property, plant and equipment for
impairment on a periodical basis and record impairment losses when it is determined that
their recoverable amount is lower than the carrying amount. This requires judgements
regarding forecast of future revenues and expenses relating to the assets subject to the
review.
7. Cash and cash equivalents
(Unit: Thousand US Dollar) (Unit: Thousand Baht)
Consolidated
financial statements
Consolidated
financial statements
2020 2019 2020 2019
Cash 112 130 3,352 3,933
Deposits at financial institutions 166,484 138,091 5,000,702 4,163,985
Total cash and cash equivalents 166,596 138,221 5,004,054 4,167,918
(Unit: Thousand US Dollar) (Unit: Thousand Baht)
Separate
financial statements
Separate
financial statements
2020 2019 2020 2019
Cash 9 8 285 255
Deposits at financial institutions 10,726 8,721 322,169 262,965
Total cash and cash equivalents 10,735 8,729 322,454 263,220
As at 31 December 2020, bank deposits in saving accounts and fixed deposits carried
interests between 0.01% and 2.80% per annum (2019: between 0.10% and 5.00% per
annum).
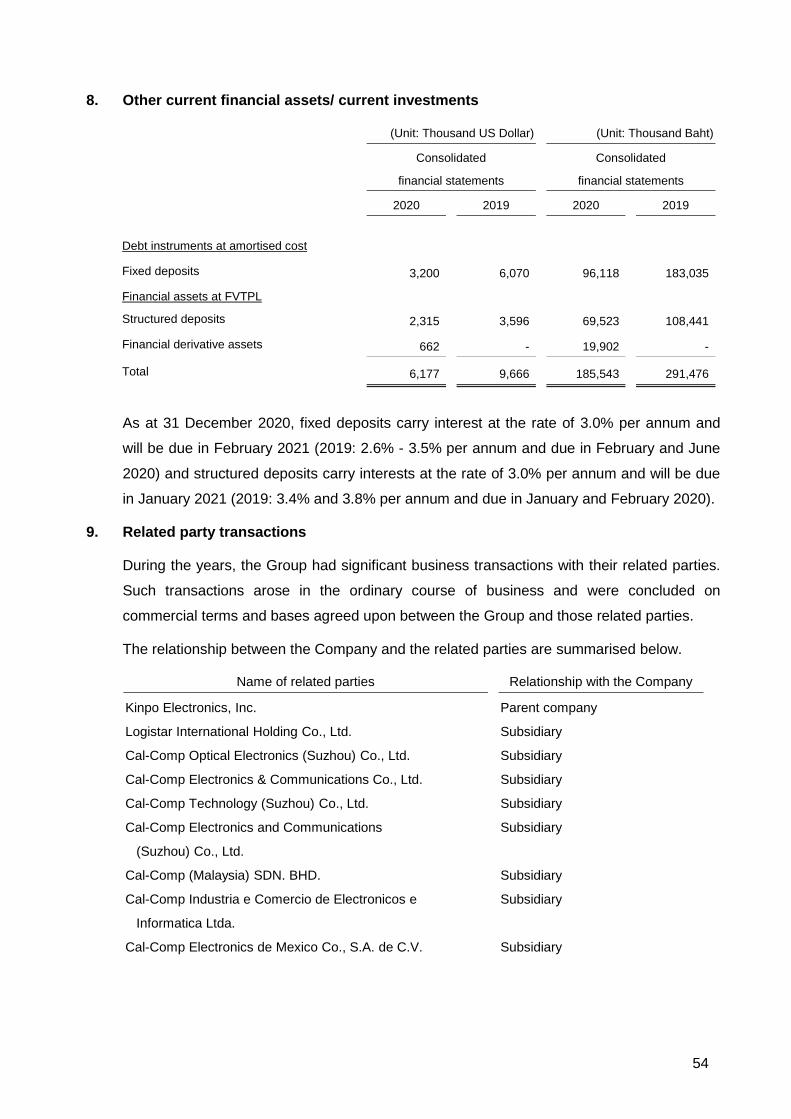
54
8. Other current financial assets/ current investments
(Unit: Thousand US Dollar) (Unit: Thousand Baht)
Consolidated
financial statements
Consolidated
financial statements
2020 2019 2020 2019
Debt instruments at amortised cost
Fixed deposits 3,200 6,070 96,118 183,035
Financial assets at FVTPL
Structured deposits 2,315 3,596 69,523 108,441
Financial derivative assets 662 - 19,902 -
Total 6,177 9,666 185,543 291,476
As at 31 December 2020, fixed deposits carry interest at the rate of 3.0% per annum and
will be due in February 2021 (2019: 2.6% - 3.5% per annum and due in February and June
2020) and structured deposits carry interests at the rate of 3.0% per annum and will be due
in January 2021 (2019: 3.4% and 3.8% per annum and due in January and February 2020).
9. Related party transactions
During the years, the Group had significant business transactions with their related parties.
Such transactions arose in the ordinary course of business and were concluded on
commercial terms and bases agreed upon between the Group and those related parties.
The relationship between the Company and the related parties are summarised below.
Name of related parties Relationship with the Company
Kinpo Electronics, Inc. Parent company
Logistar International Holding Co., Ltd. Subsidiary
Cal-Comp Optical Electronics (Suzhou) Co., Ltd. Subsidiary
Cal-Comp Electronics & Communications Co., Ltd. Subsidiary
Cal-Comp Technology (Suzhou) Co., Ltd. Subsidiary
Cal-Comp Electronics and Communications Subsidiary
(Suzhou) Co., Ltd.
Cal-Comp (Malaysia) SDN. BHD. Subsidiary
Cal-Comp Industria e Comercio de Electronicos e Subsidiary
Informatica Ltda.
Cal-Comp Electronics de Mexico Co., S.A. de C.V. Subsidiary

55
Name of related parties Relationship with the Company
Cal-Comp Electronics (USA) Co., Ltd. Subsidiary
Cal-Comp Holding (Brasil) S.A. Subsidiary
Qbit Semiconductor Holding Ltd. Subsidiary
Cal-Comp (India) Private Limited Subsidiary
Cal-Comp Automation and Industrial
4.0 Service (Thailand) Co., Ltd.
Subsidiary
Cal-Comp Precision Holding Co., Ltd. Subsidiary
Cal-Comp Precision (Singapore) Limited Subsidiary (held by a subsidiary)
Cal-Comp Precision (Thailand) Limited Subsidiary (held by a subsidiary)
Cal-Comp Precision (Malaysia) Sdn. Bhd. Subsidiary (held by a subsidiary)
Cal-Comp Precision (Dongguan) Limited Subsidiary (held by a subsidiary)
Cal-Comp Precision (Wujiang) Co., Ltd. Subsidiary (held by a subsidiary)
Cal-Comp Precision (Philippines), Inc. Subsidiary (held by a subsidiary)
Cal-Comp Precision (Yue Yang) Co., Ltd. Subsidiary (held by a subsidiary)
Cal-Comp USA (Indiana), Inc. Subsidiary (held by a subsidiary)
Cal-Comp USA (San Diego), Inc. Subsidiary (held by a subsidiary)
Cal-Comp Industria de Semicondutores S.A. Subsidiary (held by a subsidiary)
Qbit Semiconductor Ltd. Subsidiary (held by a subsidiary)
ICKP (Beijing) Technology Development Co., Ltd. Subsidiary (held by a subsidiary)
Cal-Comp Optical Electronics (Yue Yang) Co., Ltd. Subsidiary (held by a subsidiary)
NKG Advanced Intelligence & Technology
Development (Yue Yang) Co., Ltd.
Subsidiary (held by a subsidiary)
Cal-Comp Technology (Philippines), Inc. Associate
XYZprinting, Inc. Associate
PChome (Thailand) Co., Ltd. Associate
Cal-Comp Big Data, Inc. Associate
New Era AI Robotic Limited Associate
Daviscomms (S) Pte Ltd. Associate (held by a subsidiary)
Shanghai Chuang Ge Education Technology Co., Ltd. Associate (held by a subsidiary)
XYZprinting Japan, Inc. Subsidiary of an associate
XYZprinting, Inc. (SAMOA) Subsidiary of an associate
XYZprinting, Inc. (USA) Subsidiary of an associate
XYZprinting Netherlands B.V. Subsidiary of an associate
XYZprinting (Suzhou) Co., Ltd. Subsidiary of an associate
XYZprinting (Thailand) Co., Ltd. Subsidiary of an associate
XYZprinting (Shanghai) Cloud Technology Co., Ltd. Subsidiary of an associate
XYZlife (Philippines) Inc. Subsidiary of an associate
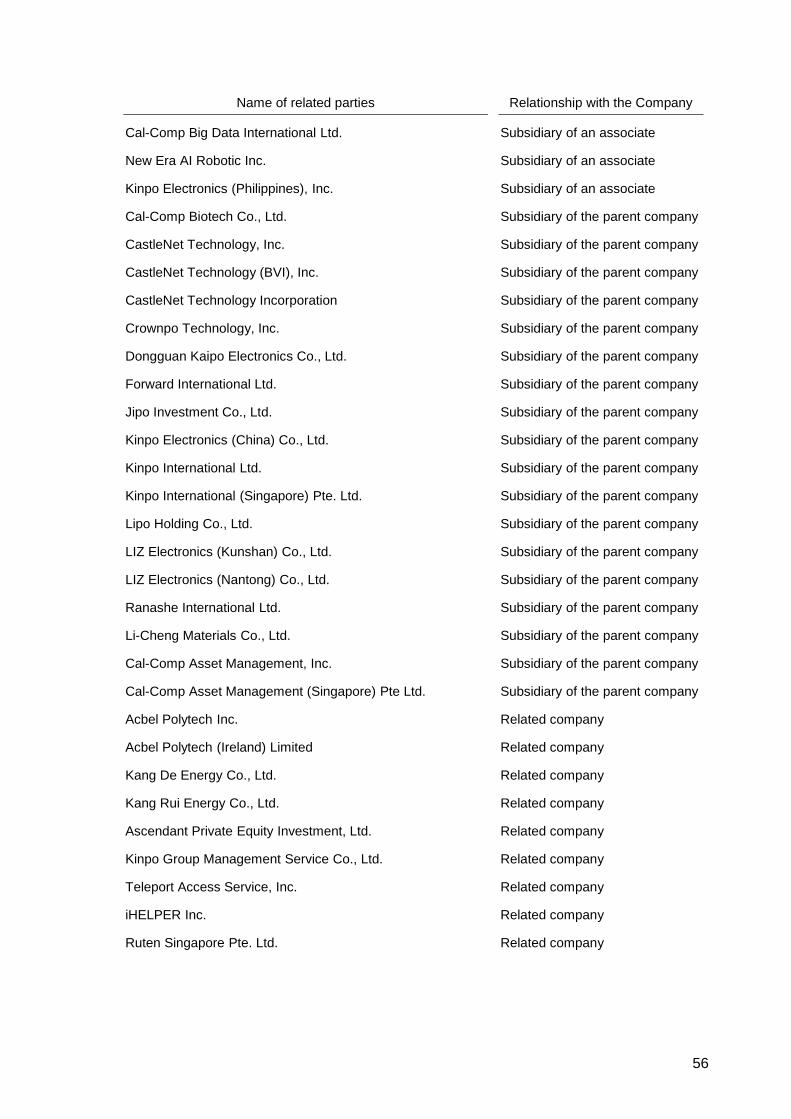
56
Name of related parties Relationship with the Company
Cal-Comp Big Data International Ltd. Subsidiary of an associate
New Era AI Robotic Inc. Subsidiary of an associate
Kinpo Electronics (Philippines), Inc. Subsidiary of an associate
Cal-Comp Biotech Co., Ltd. Subsidiary of the parent company
CastleNet Technology, Inc. Subsidiary of the parent company
CastleNet Technology (BVI), Inc. Subsidiary of the parent company
CastleNet Technology Incorporation Subsidiary of the parent company
Crownpo Technology, Inc. Subsidiary of the parent company
Dongguan Kaipo Electronics Co., Ltd. Subsidiary of the parent company
Forward International Ltd. Subsidiary of the parent company
Jipo Investment Co., Ltd. Subsidiary of the parent company
Kinpo Electronics (China) Co., Ltd. Subsidiary of the parent company
Kinpo International Ltd. Subsidiary of the parent company
Kinpo International (Singapore) Pte. Ltd. Subsidiary of the parent company
Lipo Holding Co., Ltd. Subsidiary of the parent company
LIZ Electronics (Kunshan) Co., Ltd. Subsidiary of the parent company
LIZ Electronics (Nantong) Co., Ltd. Subsidiary of the parent company
Ranashe International Ltd. Subsidiary of the parent company
Li-Cheng Materials Co., Ltd. Subsidiary of the parent company
Cal-Comp Asset Management, Inc. Subsidiary of the parent company
Cal-Comp Asset Management (Singapore) Pte Ltd. Subsidiary of the parent company
Acbel Polytech Inc. Related company
Acbel Polytech (Ireland) Limited Related company
Kang De Energy Co., Ltd. Related company
Kang Rui Energy Co., Ltd. Related company
Ascendant Private Equity Investment, Ltd. Related company
Kinpo Group Management Service Co., Ltd. Related company
Teleport Access Service, Inc. Related company
iHELPER Inc. Related company
Ruten Singapore Pte. Ltd. Related company

57
Such significant transactions are summarised below.
(Unit: Million US Dollar) (Unit: Million Baht)
Consolidated
financial statements
Consolidated
financial statements
2020 2019 2020 2019 Transfer Pricing Policy
Transactions with associated companies
Sales 100.0 91.6 3,127 2,826 Agreed upon
Sales of fixed assets 0.3 1.0 8 30 At book value plus margin
Other income 0.3 0.2 9 7 Contract price
Purchases of raw materials 0.1 - 3 - Agreed upon
Purchases of fixed assets 0.1 - 2 - Cost
Other expenses 8.5 7.4 264 227 Contract price
Transactions with related companies
Sales 42.2 80.5 1,319 2,482 Agreed upon
Sales of fixed assets - 1.3 - 41 At book value plus margin
Gain on sales of fixed assets - 0.2 - 7 At book value plus margin
Other income - 0.1 - 3 Contract price
Purchases of raw materials 34.4 31.5 1,066 980 Agreed upon
Purchases of fixed assets 3.8 0.7 119 22 Cost
Other expenses 3.9 3.6 122 114 Contract price
(Unit: Million US Dollar) (Unit: Million Baht)
Separate
financial statements
Separate
financial statements
2020 2019 2020 2019 Transfer Pricing Policy
Transactions with subsidiaries
(Eliminated from the consolidated financial statements)
Sales 702.1 718.9 21,928 22,294 Agreed upon
Sales of fixed assets 0.2 0.2 6 5 At book value plus margin
Gain on sales of fixed assets 0.1 - 2 - At book value plus margin
Dividend income - 39.4 - 1,221 As declared
Other income 3.8 5.0 118 156 Contract price
Purchases of raw materials 130.5 201.8 4,080 6,260 Agreed upon
Purchases of fixed assets 8.2 7.8 255 244 Cost
Other expenses 8.5 1.0 267 31 Contract price
Transactions with associated companies
Sales 11.7 15.1 364 466 Agreed upon
Sales of fixed assets 0.2 - 8 2 At book value plus margin
Dividend income - 1.8 - 58 As declared
Other income 0.1 - 3 3 Contract price
Purchases of raw materials 0.1 - 3 - Agreed upon
Purchases of fixed assets - - 1 - Cost
Transactions with related companies Sales 38.0 76.1 1,189 2,349 Agreed upon
Sales of fixed assets - 1.1 - 33 At book value plus margin
Gain on sales of fixed assets - 0.2 - 7 At book value plus margin
Purchases of raw materials 13.9 23.8 435 743 Agreed upon
Purchases of fixed assets 3.1 0.7 96 22 Cost
Major revenues of Logistar International Holding Co., Ltd. represent the sales of inventories,
which are purchased from the Group, to the third parties.

58
As at 31 December 2020 and 2019, the balances of the accounts between the Group and
those related companies are as follows:
(Unit: Thousand US Dollar) (Unit: Thousand Baht)
Consolidated
financial statements
Consolidated
financial statements
2020 2019 2020 2019
Trade and other receivables - related parties (Note 10)
Associated companies 49,831 54,416 1,496,790 1,640,854
Related companies 16,852 36,432 506,187 1,098,567
Total trade and other receivables - related parties 66,683 90,848 2,002,977 2,739,421
Trade and other payables - related parties (Note 22)
Associated companies 2,607 2,760 78,308 83,232
Related companies 14,958 4,548 449,298 137,128
Total trade and other payables - related parties 17,565 7,308 527,606 220,360
Lease liabilities (Note 18)
Associated companies 4,279 - 128,526 -
Related companies 171 - 5,135 -
Total lease liabilities - related parties 4,450 - 133,661 -
Advance received for purchases of mold - related parties (Note 23)
Associated companies 56 58 1,671 1,762
Total advance received for purchases of mold
- related parties
56
58
1,671
1,762
(Unit: Thousand US Dollar) (Unit: Thousand Baht)
Separate
financial statements
Separate
financial statements
2020 2019 2020 2019
Trade and other receivables - related parties (Note 10)
Subsidiaries 248,082 132,097 7,451,656 3,983,265
Associated companies 32,121 36,350 964,820 1,096,089
Related companies 15,207 34,300 456,773 1,034,274
Total trade and other receivables - related parties 295,410 202,747 8,873,249 6,113,628
Trade and other payables - related parties (Note 22)
Subsidiaries 23,591 13,509 708,600 407,355
Associated companies 82 48 2,464 1,440
Related companies 5,012 573 150,537 17,269
Total trade and other payables - related parties 28,685 14,130 861,601 426,064

59
Other long-term receivables - related parties
As at 31 December 2020 and 2019, the balances of other long-term receivables and the
movement are as follows:
(Unit: Thousand US Dollar)
Separate financial statements
Balance as at Balance as at
Other long-term 31 December Payment Translation 31 December
receivables Related by 2019 received adjustment 2020
Cal-Comp Industria e
Comercio de Electronicos
e Informatica Ltda. Subsidiary 23,489 (5,101) - 18,388
23,489 (5,101) - 18,388
(Unit: Thousand Baht)
Separate financial statements
Balance as at Balance as at
Other long-term 31 December Payment Translation 31 December
receivables Related by 2019 received adjustment 2020
Cal-Comp Industria e
Comercio de Electronicos
e Informatica Ltda. Subsidiary 708,277 (161,719) 5,759 552,317
708,277 (161,719) 5,759 552,317
Long-term loans to related parties
As at 31 December 2020 and 2019, the balances of long-term loans to related parties and
the movement are as follows:
(Unit: Thousand US Dollar)
Consolidated financial statements
Balance as at Balance as at
31 December Translation 31 December
Long-term loans Related by 2019 Increase adjustment 2020
XYZprinting Subsidiary
(Suzhou) Co., Ltd. of an associate 6,451 - 446 6,897
6,451 - 446 6,897

60
(Unit: Thousand Baht)
Consolidated financial statements
Balance as at Balance as at
31 December Translation 31 December
Long-term loans Related by 2019 Increase adjustment 2020
XYZprinting Subsidiary
(Suzhou) Co., Ltd. of an associate 194,508 - 12,648 207,156
194,508 - 12,648 207,156
The above long-term loans are the loans which Cal-Comp Optical Electronics (Suzhou)
Co., Ltd., its subsidiary in the People’s Republic of China, lended to XYZprinting (Suzhou)
Co., Ltd. Such long-term loans were denominated in CNY currency on which interest is
charged at the rate of 2.05% and 2.95% per annum and are due in January 2023 and
November 2024.
(Unit: Thousand US Dollar)
Separate financial statements
Balance as at Balance as at
31 December Payment Translation 31 December
Long-term loans Related by 2019 received adjustment 2020
Cal-Comp Industria de Subsidiary
Semicondutores S.A. (held by a subsidiary) 7,462 - - 7,462
Cal-Comp Precision Subsidiary
(Philippines), Inc. (held by a subsidiary) 19,898 (19,898) - -
27,360 (19,898) - 7,462
(Unit: Thousand Baht)
Separate financial statements
Balance as at Balance as at
31 December Payment Translation 31 December
Long-term loans Related by 2019 received adjustment 2020
Cal-Comp Industria de Subsidiary
Semicondutores S.A. (held by a subsidiary) 225,005 - (872) 224,133
Cal-Comp Precision Subsidiary
(Philippines), Inc. (held by a subsidiary) 600,014 (632,927) 32,913 -
825,019 (632,927) 32,041 224,133
Long-term loans to Cal-Comp Industria de Semicondutores S.A. were denominated in USD
currency on which interest is charged at the rate of 2.50% per annum and will be due in June
2023.

61
Directors and management’s benefits
During the years ended 31 December 2020 and 2019, the Group had employee benefit
expenses payable to their directors and management as below.
(Unit: Million US Dollar) (Unit: Million Baht)
Consolidated
financial statements
Consolidated
financial statements
2020 2019 2020 2019
Short-term employee benefits 4.4 3.8 142 118
Post-employment benefits 0.1 0.1 2 2
Share-based payment 0.2 - 6 1
Total 4.7 3.9 150 121
(Unit: Million US Dollar) (Unit: Million Baht)
Separate
financial statements
Separate
financial statements
2020 2019 2020 2019
Short-term employee benefits 0.9 0.9 28 28
Share-based payment - - 1 1
Total 0.9 0.9 29 29
10. Trade and other receivables
(Unit: Thousand US Dollar) (Unit: Thousand Baht)
Consolidated
financial statements
Consolidated
financial statements
2020 2019 2020 2019
Trade receivables - related parties
Aged on the basis of due dates
Not yet due 41,180 57,334 1,236,917 1,728,848
Past due
Less than 1 month 3,809 9,528 114,419 287,325
1 - 2 months 1,587 5,164 47,673 155,708
2 - 3 months 1,324 2,428 39,786 73,216
3 - 6 months 1,878 2,757 56,417 83,134
6 - 12 months 7,722 5,533 231,942 166,837
Over 12 months 6,557 4,962 196,940 149,637
Total trade receivables - related parties 64,057 87,706 1,924,094 2,644,705

62
(Unit: Thousand US Dollar) (Unit: Thousand Baht)
Consolidated
financial statements
Consolidated
financial statements
2020 2019 2020 2019
Trade receivables - unrelated parties
Aged on the basis of due dates
Not yet due 559,816 417,019 16,815,244 12,574,804
Past due
Less than 1 month 38,184 29,303 1,146,930 883,595
1 - 2 months 14,396 10,235 432,420 308,631
2 - 3 months 20,839 3,882 625,927 117,047
3 - 6 months 753 5,060 22,614 152,570
6 - 12 months 117 5,496 3,517 165,738
Over 12 months 5,498 3,985 165,156 120,174
Total 639,603 474,980 19,211,808 14,322,559
Less: Allowance for expected credit losses
(2019: Allowance for doubtful accounts)
(2,343)
(1,425)
(70,385)
(42,981)
Total trade receivables - unrelated
parties, net 637,260 473,555 19,141,423 14,279,578
Total trade receivables, net 701,317 561,261 21,065,517 16,924,283
Other receivables
Other receivables - related parties 2,626 3,142 78,883 94,716
Other receivables - unrelated parties 37,264 41,249 1,119,295 1,243,818
Total 39,890 44,391 1,198,178 1,338,534
Less: Allowance for expected credit losses
(2019: Allowance for doubtful accounts) (4,333) (337) (130,143) (10,151)
Total other receivables, net 35,557 44,054 1,068,035 1,328,383
Total trade and other receivables, net 736,874 605,315 22,133,552 18,252,666

63
(Unit: Thousand US Dollar) (Unit: Thousand Baht)
Separate
financial statements
Separate
financial statements
2020 2019 2020 2019
Trade receivables - related parties
Aged on the basis of due dates
Not yet due 242,089 142,497 7,271,653 4,296,849
Past due
Less than 1 month 3,612 9,748 108,488 293,931
1 - 2 months 1,610 5,497 48,363 165,763
2 - 3 months 1,337 2,749 40,147 82,905
3 - 6 months 2,199 5,605 66,057 169,029
6 - 12 months 8,297 22,736 249,224 685,576
Over 12 months 27,727 11,974 832,842 361,059
Total trade receivables - related parties 286,871 200,806 8,616,774 6,055,112
Trade receivables - unrelated parties
Aged on the basis of due dates
Not yet due 241,972 223,145 7,268,131 6,728,697
Past due
Less than 1 month 29,448 15,845 884,523 477,796
1 - 2 months 14,264 7,491 428,459 225,888
2 - 3 months 20,437 1,248 613,869 37,645
3 - 6 months 714 3,832 21,452 115,545
6 - 12 months - 5,135 - 154,832
Over 12 months 2,583 1,023 77,584 30,850
Total 309,418 257,719 9,294,018 7,771,253
Less: Allowance for expected credit losses
(2019: Allowance for doubtful accounts)
(2,026)
(1,013)
(60,857)
(30,536)
Total trade receivables - unrelated
parties, net 307,392 256,706 9,233,161 7,740,717
Total trade receivables, net 594,263 457,512 17,849,935 13,795,829
Other receivables
Other receivables - related parties 8,539 1,941 256,475 58,516
Other receivables - unrelated parties 14,009 14,670 420,794 442,343
Total 22,548 16,611 677,269 500,859
Less: Allowance for expected credit losses
(2019: Allowance for doubtful accounts) (533) (337) (16,003) (10,151)
Total other receivables, net 22,015 16,274 661,266 490,708
Total trade and other receivables, net 616,278 473,786 18,511,201 14,286,537
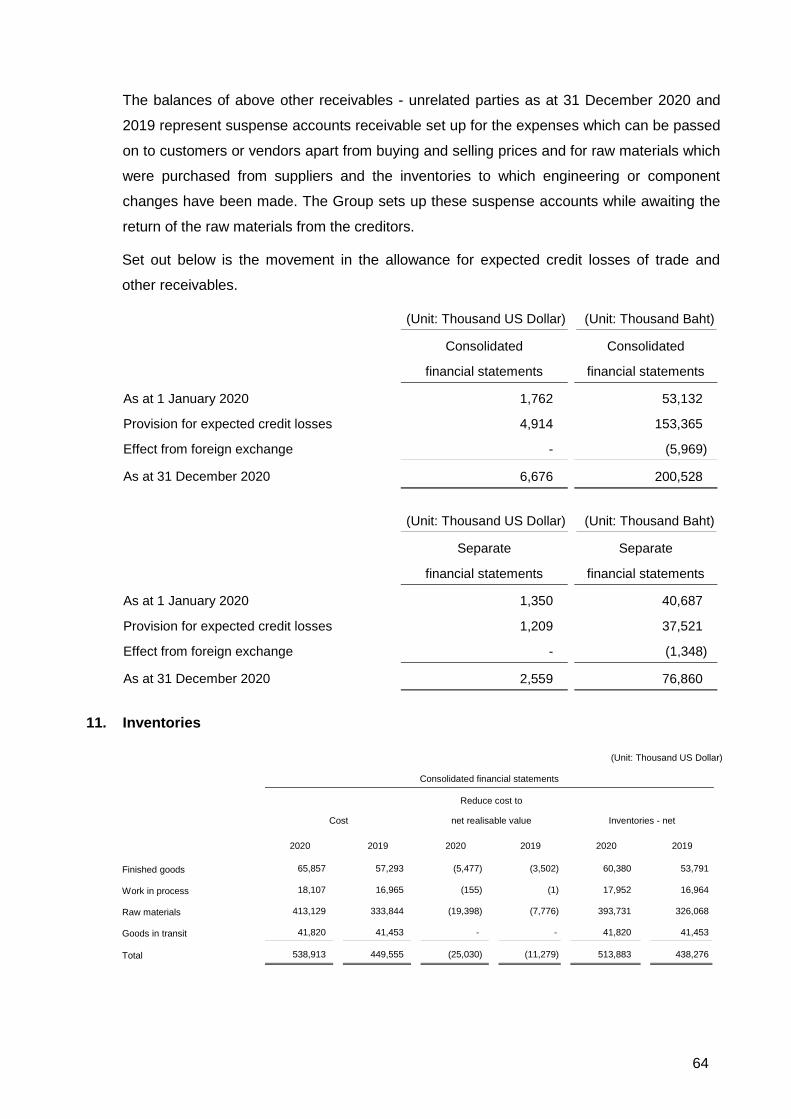
64
The balances of above other receivables - unrelated parties as at 31 December 2020 and
2019 represent suspense accounts receivable set up for the expenses which can be passed
on to customers or vendors apart from buying and selling prices and for raw materials which
were purchased from suppliers and the inventories to which engineering or component
changes have been made. The Group sets up these suspense accounts while awaiting the
return of the raw materials from the creditors.
Set out below is the movement in the allowance for expected credit losses of trade and
other receivables.
(Unit: Thousand US Dollar) (Unit: Thousand Baht)
Consolidated
financial statements
Consolidated
financial statements
As at 1 January 2020 1,762 53,132
Provision for expected credit losses 4,914 153,365
Effect from foreign exchange - (5,969)
As at 31 December 2020 6,676 200,528
(Unit: Thousand US Dollar) (Unit: Thousand Baht)
Separate
financial statements
Separate
financial statements
As at 1 January 2020 1,350 40,687
Provision for expected credit losses 1,209 37,521
Effect from foreign exchange - (1,348)
As at 31 December 2020 2,559 76,860
11. Inventories
(Unit: Thousand US Dollar)
Consolidated financial statements
Cost
Reduce cost to
net realisable value
Inventories - net
2020 2019 2020 2019 2020 2019
Finished goods 65,857 57,293 (5,477) (3,502) 60,380 53,791
Work in process 18,107 16,965 (155) (1) 17,952 16,964
Raw materials 413,129 333,844 (19,398) (7,776) 393,731 326,068
Goods in transit 41,820 41,453 - - 41,820 41,453
Total 538,913 449,555 (25,030) (11,279) 513,883 438,276

65
(Unit: Thousand Baht)
Consolidated financial statements
Cost
Reduce cost to
net realisable value
Inventories - net
2020 2019 2020 2019 2020 2019
Finished goods 1,978,139 1,727,625 (164,514) (105,606) 1,813,625 1,622,019
Work in process 543,883 511,545 (4,656) (36) 539,227 511,509
Raw materials 12,409,204 10,066,735 (582,663) (234,475) 11,826,541 9,832,260
Goods in transit 1,256,160 1,249,983 - - 1,256,160 1,249,983
Total 16,187,386 13,555,888 (751,833) (340,117) 15,435,553 13,215,771
(Unit: Thousand US Dollar)
Separate financial statements
Cost
Reduce cost to
net realisable value
Inventories - net
2020 2019 2020 2019 2020 2019
Finished goods 42,192 34,520 (4,661) (2,553) 37,531 31,967
Work in process 1,912 118 - - 1,912 118
Raw materials 281,992 231,762 (9,314) (2,607) 272,678 229,155
Goods in transit 10,649 17,309 - - 10,649 17,309
Total 336,745 283,709 (13,975) (5,160) 322,770 278,549
(Unit: Thousand Baht)
Separate financial statements
Cost
Reduce cost to
net realisable value
Inventories - net
2020 2019 2020 2019 2020 2019
Finished goods 1,267,307 1,040,933 (140,013) (76,976) 1,127,294 963,957
Work in process 57,440 3,565 - - 57,440 3,565
Raw materials 8,470,215 6,988,546 (279,754) (78,619) 8,190,461 6,909,927
Goods in transit 319,878 521,923 - - 319,878 521,923
Total 10,114,840 8,554,967 (419,767) (155,595) 9,695,073 8,399,372
During the current year, the Group reduced cost of inventories by Baht 463 million
(USD 15.0 million) (2019: Baht 94 million (USD 3.1 million)) (Separate financial statements:
Baht 273 million (USD 8.8 million) and 2019: Baht 20 million (USD 0.6 million)) to reflect the
net realisable value. This was included in cost of sales. In addition, the Group reversed the
write-down of cost of inventories by Baht 40 million (USD 1.3 million) (2019: Baht 12 million
(USD 0.4 million)) and reduced the amount of inventories recognised as expenses during
the year.

66
12. Other current assets
The balances as at 31 December 2020 and 2019 consist of the following.
(Unit: Thousand US Dollar) (Unit: Thousand Baht)
Consolidated
financial statements
Consolidated
financial statements
2020 2019 2020 2019
Receivable - molds 5,350 4,910 160,692 148,064
Value added tax 16,570 13,504 497,705 407,204
Financial derivative assets - 1,386 - 41,805
Grant receivable - Government 62,663 13,121 1,882,228 395,639
Others 16,813 11,289 505,029 340,403
Total 101,396 44,210 3,045,654 1,333,115
(Unit: Thousand US Dollar) (Unit: Thousand Baht)
Separate
financial statements
Separate
financial statements
2020 2019 2020 2019
Receivable - molds 3,636 4,850 109,229 146,238
Value added tax 12,402 9,791 372,506 295,229
Others 2,808 3,484 84,338 105,071
Total 18,846 18,125 566,073 546,538
13. Assets held for sale
On 20 October 2020, a meeting of the Board of Directors of the Company approved a plan
to dispose of fixed assets of Cal-Comp Electronics and Communications (Suzhou) Co., Ltd.,
a subsidiary in the People's Republic of China, at the amount of CNY 121.50 million,
for the purpose of disposing of unused assets and improving the Group’s cash flows.
Subsequently in November 2020, the subsidiary entered into a letter of intent to sell the
right-of-use assets (land) and buildings with an unrelated company, at a total price of
CNY 121.50 million, and already received certain deposit amounting to CNY 12.15 million.
Therefore, the subsidiary reclassified right-of-use assets (land) and buildings to assets
held for sale. In addition, the subsidiary entered into a sale and purchase agreement with
the counterparty in January 2021 and expects that sales and transfers of ownership will be
completed in the first quarter of the year 2021.

67
14. Other non-current financial assets/ Other long-term investments
(Unit: Thousand US Dollar)
Consolidated financial statements
Country of Shareholding Investments
Company’s name Nature of business incorporation percentage Cost method Fair value
2020 2019 2019 2020 2019
(%) (%)
Equity instruments designated at FVOCI
Metal Component Engineering Manufacturing of electronic Singapore 7.15 10.11 1,087 652 835
Limited products
Less: Unrealised loss on changes in the value of investments (252)
835
Kinpo Group Management Consulting business Taiwan 12.50 12.50 33 35
Service Co., Ltd.*
Memoright Memoritech Manufacturing of electronic Cayman - 3.05 986 -
Corporation products Islands
Less: Allowance for impairment of investment (986)
-
Dawning Leading Manufacturing of electronic Taiwan - 7.65 15,140 -
Technology Inc. products
Less: Allowance for impairment of investment (8,020)
7,120
Fellow Inc.** Design robot United States 4.72 4.72 2,000 -
of America
Nexa3D Inc. 3D Printing technology United States 15.65 15.65 4,802 5,147
of America
Debt instrument at FVTPL
Mojoose Inc.*** Design of electronics parts United States - - 1,900 950
of America
Total other non-current financial assets/ other long-term investments 16,690 6,784
(Unit: Thousand Baht)
Consolidated financial statements
Country of Shareholding Investments
Company’s name Nature of business incorporation percentage Cost method Fair value
2020 2019 2019 2020 2019
(%) (%)
Equity instruments designated at FVOCI
Metal Component Engineering Manufacturing of electronic Singapore 7.15 10.11 32,774 19,564 25,163
Limited products
Less: Unrealised loss on changes in the value of investments (7,611)
25,163
Kinpo Group Management Consulting business Taiwan 12.50 12.50 1,006 1,054
Service Co., Ltd.*
Memoright Memoritech Manufacturing of electronic Cayman - 3.05 29,727 -
Corporation products Islands
Less: Allowance for impairment of investment (29,727)
-
Dawning Leading Manufacturing of electronic Taiwan - 7.65 456,519 -
Technology Inc. products
Less: Allowance for impairment of investment (241,829)
214,690
Fellow Inc.** Design robot United States 4.72 4.72 60,308 -
of America
Nexa3D Inc. 3D Printing technology United States 15.65 15.65 144,808 154,626
of America
Debt instrument at FVTPL
Mojoose Inc.*** Design of electronics parts United States - - 57,292 28,535
of America
Total other non-current financial assets/ other long-term investments 503,267 203,779
* (held by Cal-Comp Electronics & Communications Co., Ltd.)
** (held by Cal-Comp Electronics (USA) Co., Ltd.)
*** (held by Logistar International Holding Co., Ltd.)

68
(Unit: Thousand US Dollar)
Separate financial statements
Country of Shareholding Investments
Company’s name Nature of business incorporation percentage Cost method Fair value
2020 2019 2019 2020 2019
(%) (%)
Equity instruments designated at FVOCI
Metal Component Engineering Manufacturing of electronic Singapore 7.15 10.11 1,087 652 835
Limited products
Less: Unrealised loss on changes in the value of investments (252)
835
Memoright Memoritech Manufacturing of electronic Cayman - 3.05 986 -
Corporation products Islands
Less: Allowance for impairment of investment (986)
-
Dawning Leading Manufacturing of electronic Taiwan - 7.65 15,140 -
Technology Inc. products
Less: Allowance for impairment of investment (8,020)
7,120
Nexa3D Inc. 3D Printing technology United States 15.65 15.65 4,802 5,147
of America
Total other non-current financial assets/ other long-term investments 12,757 5,799
(Unit: Thousand Baht)
Separate financial statements
Country of Shareholding Investments
Company’s name Nature of business incorporation percentage Cost method Fair value
2020 2019 2019 2020 2019
(%) (%)
Equity instruments designated at FVOCI
Metal Component Engineering Manufacturing of electronic Singapore 7.15 10.11 32,774 19,564 25,163
Limited products
Less: Unrealised loss on changes in the value of investments (7,611)
25,163
Memoright Memoritech Manufacturing of electronic Cayman - 3.05 29,727 -
Corporation products Islands
Less: Allowance for impairment of investment (29,727)
-
Dawning Leading Manufacturing of electronic Taiwan - 7.65 456,519 -
Technology Inc. products
Less: Allowance for impairment of investment (241,829)
214,690
Nexa3D Inc. 3D Printing technology United States 15.65 15.65 144,808 154,626
of America
Total other non-current financial assets/ other long-term investments 384,661 174,190
During the year 2018, King Yuan Electronics Co., Ltd., a company listed on the Stock
Exchange of Taiwan and a major shareholder of Dawning Leading Technology Inc., merged
with Dawning Leading Technology Inc. by repurchasing shares from minority shareholders.
However, King Yuan Electronics Co., Ltd. and the Company cannot negotiate the
repurchasing price. Therefore, King Yuan Electronics Co., Ltd. applied to the Court to
decide on the fair value of such repurchasing price. Subsequently, on 31 August 2020,
the Company entered into a settlement agreement with King Yuan Electronics Co., Ltd. and
King Yuan Electronics Co., Ltd. agreed to pay the Company compensation with interest of
TWD 148.3 million or USD 5.1 million for the disposal of investment in Dawning Leading
Technology Inc. and for damage. In this regard, Cal-Comp Electronics & Communications
Co., Ltd., its subsidiary in Taiwan, received compensation from King Yuan Electronics

69
Co., Ltd. and followed court procedures to obtain back the deposits that King Yuan
Electronics Co., Ltd. had placed with the court on behalf of the Company. The subsidiary
expects to transfer all money back to the Company in the first quarter of the year 2021. The
fair value of investments on the date of disposal was USD 4.9 million. The Company
recognised loss on disposal of investments amounting to USD 2.2 million by transferring the
accumulated loss recognised in other comprehensive income to retained earnings in the
statement of changes in shareholders’ equity of the current year.
During the third quarter of the current year, the Company wrote off investment in Memoright
Memoritech Corporation because such company closed its business and the Company was
unable to obtain the return of its investment. However, the Company had already recorded
a full amount of impairment of this investment since the year 2018.
15. Investments in associates
15.1 Details of investment in associates
(Unit: Thousand US Dollar)
Consolidated financial statements
Country of Carrying amount
Company’s name Nature of business incorporation Shareholding percentage Cost based on equity method
2020 2019 2020 2019 2020 2019
(%) (%)
Daviscomms (S) Pte Ltd.* Design and Singapore 20.00 20.00 2,955 2,955 2,299 2,234
manufacturing of
telecommunication
products
Shanghai Chuang Ge
Education Technology
Co., Ltd.**
Research and
development
especially in
education and
network field
The People’s
Republic of
China
43.53 43.53 265 265 12 54
PChome (Thailand) E-commerce service Thailand 33.75 32.50 2,075 1,002 1,051 221
Co., Ltd. provider
Cal-Comp Technology Manufacturing of Philippines 19.19 19.19 24,348 24,348 43,380 38,078
(Philippines), Inc. electronic products
Total investments in associates 29,643 28,570 46,742 40,587
(Unit: Thousand Baht)
Consolidated financial statements
Country of Carrying amount
Company’s name Nature of business incorporation Shareholding percentage Cost based on equity method
2020 2019 2020 2019 2020 2019
(%) (%)
Daviscomms (S) Pte Ltd.* Design and Singapore 20.00 20.00 88,766 89,111 69,075 67,378
manufacturing of
telecommunication
products
Shanghai Chuang Ge
Education Technology
Co., Ltd.**
Research and
development
especially in
education and
network field
The People’s
Republic of
China
43.53 43.53 7,849 7,996 357 1,620
PChome (Thailand) E-commerce service Thailand 33.75 32.50 62,320 30,201 31,576 6,661
Co., Ltd. provider
Cal-Comp Technology Manufacturing of Philippines 19.19 19.19 731,348 734,192 1,302,994 1,148,195
(Philippines), Inc. electronic products
Total investments in associates 890,283 861,500 1,404,002 1,223,854
* (held by Cal-Comp Precision (Singapore) Limited)
** (held by Cal-Comp Optical Electronics (Suzhou) Co., Ltd.)

70
(Unit: Thousand US Dollar)
Separate financial statements
Country of Carrying amount
Company’s name Nature of business incorporation Shareholding percentage Cost based on equity method
2020 2019 2020 2019 2020 2019
(%) (%)
PChome (Thailand) E-commerce service Thailand 33.75 32.50 2,075 1,002 1,051 221
Co., Ltd. provider
Cal-Comp Technology Manufacturing of Philippines 19.19 19.19 24,348 24,348 43,380 38,078
(Philippines), Inc. electronic products
Total investments in associates 26,423 25,350 44,431 38,299
(Unit: Thousand Baht)
Separate financial statements
Country of Carrying amount
Company’s name Nature of business incorporation Shareholding percentage Cost based on equity method
2020 2019 2020 2019 2020 2019
(%) (%)
PChome (Thailand) E-commerce service Thailand 33.75 32.50 62,320 30,201 31,576 6,661
Co., Ltd. provider
Cal-Comp Technology Manufacturing of Philippines 19.19 19.19 731,348 734,192 1,302,994 1,148,195
(Philippines), Inc. electronic products
Total investments in associates 793,668 764,393 1,334,570 1,154,856
The change in cost of investments in associates is from the additional investment in
PChome (Thailand) Co., Ltd. In addition, the change in cost of investments in associates is
from the exchange differences on translation of functional currency to presentation currency.
The Company presented the negative investment value based on equity method as
“Provision for transaction under equity method of investments in associates” was detailed as
follows:
(Unit: Thousand US Dollar)
Consolidated and separate financial statements
Country of Carrying amount
Company’s name Nature of business incorporation Shareholding percentage Cost based on equity method
2020 2019 2020 2019 2020 2019
(%) (%)
XYZprinting, Inc. Trading 3D printer Taiwan 46.40 46.40 14,231 14,231 4,388 4,087
Cal-Comp Big Data, Inc. Manufacturing of Taiwan 50.00 50.00 10,841 10,841 6,386 3,209
medical equipment
and providing
service of data
processing and
provision service
New Era AI Robotic Holding company Cayman 50.00 50.00 2,087 2,087 6,514 3,755
Limited Islands
Total provision for transaction under equity method of investments in associates 27,159 27,159 17,288 11,051

71
(Unit: Thousand Baht)
Consolidated and separate financial statements
Country of Carrying amount
Company’s name Nature of business incorporation Shareholding percentage Cost based on equity method
2020 2019 2020 2019 2020 2019
(%) (%)
XYZprinting, Inc. Trading 3D printer Taiwan 46.40 46.40 427,463 429,127 131,807 123,242
Cal-Comp Big Data, Inc. Manufacturing of Taiwan 50.00 50.00 325,621 326,888 191,792 96,744
medical equipment
and providing
service of data
processing and
provision service
New Era AI Robotic Limited Holding company Cayman 50.00 50.00 62,699 62,943 195,676 113,234
Islands
Total provision for transaction under equity method of investments in associates 815,783 818,958 519,275 333,220
The change in cost of investments in associates is from the exchange differences on
translation of functional currency to presentation currency.
15.2 Share of comprehensive income and dividend received
During the years, the Group recognised their share of profit (loss) from investments in
associates in the consolidated financial statements and the separate financial statements as
follows:
(Unit: Thousand US Dollar)
Consolidated financial statements
Company's name
Share of profit (loss) from
investments in associates
Share of other
comprehensive income from
investments in associates
2020 2019 2020 2019
Daviscomms (S) Pte Ltd. 48 209 17 (696)
Shanghai Chuang Ge Education
Technology Co., Ltd. (42) (82) - -
XYZprinting, Inc. (163) (3,235) (138) (47)
PChome (Thailand) Co., Ltd. (290) (252) 47 27
Cal-Comp Big Data, Inc. (3,153) (3,155) (24) 8
New Era AI Robotic Limited (2,504) (2,784) (255) (99)
Cal-Comp Technology (Philippines), Inc. 5,185 8,683 117 (32)
Total (919) (616) (236) (839)

72
(Unit: Thousand Baht)
Consolidated financial statements
Company's name
Share of profit (loss) from
investments in associates
Share of other
comprehensive income from
investments in associates
2020 2019 2020 2019
Daviscomms (S) Pte Ltd. 1,470 6,454 508 (21,400)
Shanghai Chuang Ge Education
Technology Co., Ltd. (1,312) (2,534) - -
XYZprinting, Inc. (5,945) (100,122) (4,307) (1,395)
PChome (Thailand) Co., Ltd. (9,096) (7,816) 1,454 850
Cal-Comp Big Data, Inc. (98,087) (97,799) (725) 214
New Era AI Robotic Limited (78,708) (86,355) (7,907) (2,973)
Cal-Comp Technology (Philippines), Inc. 162,829 270,300 3,674 (976)
Total (28,849) (17,872) (7,303) (25,680)
(Unit: Thousand US Dollar)
Separate financial statements
Company's name
Share of profit (loss) from
investments in associates
Share of other
comprehensive income from
investments in associates
2020 2019 2020 2019
XYZprinting, Inc. (163) (3,235) (138) (47)
PChome (Thailand) Co., Ltd. (290) (252) 47 27
Cal-Comp Big Data, Inc. (3,153) (3,155) (24) 8
New Era AI Robotic Limited (2,504) (2,784) (255) (99)
Cal-Comp Technology (Philippines), Inc. 5,185 8,683 117 (32)
Total (925) (743) (253) (143)
(Unit: Thousand Baht)
Separate financial statements
Company's name
Share of profit (loss) from
investments in associates
Share of other
comprehensive income from
investments in associates
2020 2019 2020 2019
XYZprinting, Inc. (5,945) (100,122) (4,307) (1,395)
PChome (Thailand) Co., Ltd. (9,096) (7,816) 1,454 850
Cal-Comp Big Data, Inc. (98,087) (97,799) (725) 214
New Era AI Robotic Limited (78,708) (86,355) (7,907) (2,973)
Cal-Comp Technology (Philippines), Inc. 162,829 270,300 3,674 (976)
Total (29,007) (21,792) (7,811) (4,280)
In 2019, the Group received dividend income from Cal-Comp Technology (Philippines), Inc.
amounting to Baht 58 million (USD 1.8 million) (2020: There was no dividend income from
associates).

73
15.3 Summarised financial information about material associates
Summarised information about financial position
(Unit: Million US Dollar)
XYZprinting, Inc.
Cal-Comp
Big Data, Inc.
New Era AI
Robotic Limited
Cal-Comp Technology
(Philippines), Inc.
2020 2019 2020 2019 2020 2019 2020 2019
Current assets 42 42 8 12 3 3 286 303
Non-current assets 12 11 1 3 1 1 151 153
Current liabilities (50) (55) (21) (20) (17) (11) (187) (257)
Non-current liabilities (13) (7) (1) (1) - - (24) (1)
Net assets (9) (9) (13) (6) (13) (7) 226 198
Shareholding percentage (%) 46.40 46.40 50.00 50.00 50.00 50.00 19.19 19.19
Share of net assets (4) (4) (6) (3) (7) (4) 43 38
(Unit: Million Baht)
XYZprinting, Inc.
Cal-Comp
Big Data, Inc.
New Era AI
Robotic Limited
Cal-Comp Technology
(Philippines), Inc.
2020 2019 2020 2019 2020 2019 2020 2019
Current assets 1,269 1,276 242 365 103 86 8,604 9,141
Non-current assets 355 336 38 75 13 23 4,538 4,619
Current liabilities (1,508) (1,678) (636) (615) (503) (332) (5,634) (7,755)
Non-current liabilities (400) (200) (28) (18) (4) (3) (718) (19)
Net assets (284) (266) (384) (193) (391) (226) 6,790 5,986
Shareholding percentage (%) 46.40 46.40 50.00 50.00 50.00 50.00 19.19 19.19
Share of net assets (132) (123) (192) (97) (196) (113) 1,303 1,148
Summarised information about comprehensive income
(Unit: Million US Dollar)
For the year ended 31 December
XYZprinting, Inc.
Cal-Comp
Big Data, Inc.
New Era AI
Robotic Limited
Cal-Comp Technology
(Philippines), Inc.
2020 2019 2020 2019 2020 2019 2020 2019
Revenue 29.7 25.4 6.8 6.0 2.0 2.3 684.8 658.6
Profit (loss) (0.4) (6.9) (6.3) (6.3) (5.0) (5.6) 27.0 45.2
Other comprehensive income 0.1 0.1 0.5 0.2 (0.6) (0.2) (0.1) (0.1)
Total comprehensive income (0.3) (6.8) (5.8) (6.1) (5.6) (5.8) 26.9 45.1
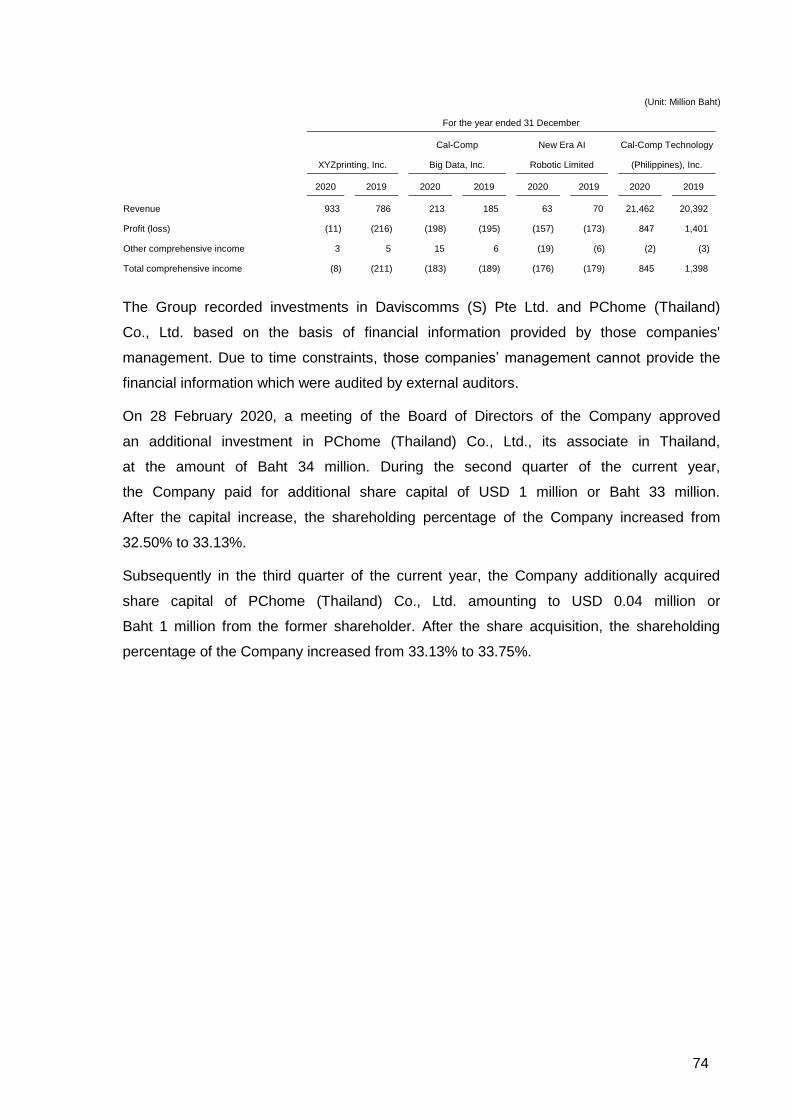
74
(Unit: Million Baht)
For the year ended 31 December
XYZprinting, Inc.
Cal-Comp
Big Data, Inc.
New Era AI
Robotic Limited
Cal-Comp Technology
(Philippines), Inc.
2020 2019 2020 2019 2020 2019 2020 2019
Revenue 933 786 213 185 63 70 21,462 20,392
Profit (loss) (11) (216) (198) (195) (157) (173) 847 1,401
Other comprehensive income 3 5 15 6 (19) (6) (2) (3)
Total comprehensive income (8) (211) (183) (189) (176) (179) 845 1,398
The Group recorded investments in Daviscomms (S) Pte Ltd. and PChome (Thailand)
Co., Ltd. based on the basis of financial information provided by those companies'
management. Due to time constraints, those companies’ management cannot provide the
financial information which were audited by external auditors.
On 28 February 2020, a meeting of the Board of Directors of the Company approved
an additional investment in PChome (Thailand) Co., Ltd., its associate in Thailand,
at the amount of Baht 34 million. During the second quarter of the current year,
the Company paid for additional share capital of USD 1 million or Baht 33 million.
After the capital increase, the shareholding percentage of the Company increased from
32.50% to 33.13%.
Subsequently in the third quarter of the current year, the Company additionally acquired
share capital of PChome (Thailand) Co., Ltd. amounting to USD 0.04 million or
Baht 1 million from the former shareholder. After the share acquisition, the shareholding
percentage of the Company increased from 33.13% to 33.75%.

75
16. Investments in subsidiaries
16.1 Detail of investments in subsidiaries as presented in the separate financial statements are
as follows:
(Unit: Thousand US Dollar)
Carrying amount
Paid-up capital Shareholding percentage Cost based on equity method
Company’s name 2020 2019 2020 2019 2020 2019 2020 2019
(%) (%)
Cal-Comp Optical Electronics CNY 547.15 CNY 547.15 100 100 59,962 59,962 132,382 122,533
(Suzhou) Co., Ltd. million million
Cal-Comp Electronics & TWD 69.92 TWD 69.92 100 100 7,295 6,843 9,415 4,726
Communications Co., Ltd. million million
Cal-Comp Technology CNY 73.05 CNY 73.05 100 100 10,434 10,434 25,871 25,781
(Suzhou) Co., Ltd. million million
Cal-Comp Electronics CNY 239.60 CNY 239.60 100 100 34,685 34,685 1,851 1,788
and Communications million million
(Suzhou) Co., Ltd.
Cal Comp (Malaysia) MYR 28.04 MYR 28.04 100 100 8,699 8,699 13,703 14,013
SDN. BHD. million million
Cal-Comp Electronics USD 100.00 USD 100.00 100 100 98,736 98,736 67,695 60,931
(USA) Co., Ltd. million million
Cal-Comp Industria e BRL 165.02 BRL 165.02 1 1 698 698 544 399
Comercio de Electronicos million million
e Informatica Ltda.*
Cal-Comp Electronics de MXN 141.18 MXN 141.18 100 100 9,557 9,557 13,205 14,633
Mexico Co., S.A. de C.V. million million
Cal-Comp Holding BRL 258.22 BRL 258.22 100 100 78,422 78,422 85,337 74,244
(Brasil) S.A. million million
Cal-Comp (India) INR 3.23 INR 32.23 100 100 54 542 15 288
Private Limited million million
Cal-Comp Automation and Baht 100.00 Baht 100.00 100 100 3,082 3,082 4,120 2,909
Industrial 4.0 Service
(Thailand) Co., Ltd.
million million
Cal-Comp Precision Holding TWD 565.00 TWD 565.00 95 100 80,787 85,000 92,747 86,838
Co., Ltd. million million
Qbit Semiconductor USD 1.13 USD 0.82 92 94 12,873 8,373 62 -
Holding Ltd. million million
Translation adjustment - - 102 (1,756)
Total investments in subsidiaries 405,284 405,033 447,049 407,327

76
(Unit: Thousand Baht)
Carrying amount
Paid-up capital Shareholding percentage Cost based on equity method
Company’s name 2020 2019 2020 2019 2020 2019 2020 2019
(%) (%)
Cal-Comp Optical Electronics CNY 547.15 CNY 547.15 100 100 1,801,109 1,808,118 3,976,381 3,694,866
(Suzhou) Co., Ltd. million million
Cal-Comp Electronics & TWD 69.92 TWD 69.92 100 100 219,100 206,343 282,801 142,494
Communications Co., Ltd. million million
Cal-Comp Technology CNY 73.05 CNY 73.05 100 100 313,395 314,615 777,073 777,393
(Suzhou) Co., Ltd. million million
Cal-Comp Electronics CNY 239.60 CNY 239.60 100 100 1,041,825 1,045,880 55,603 53,908
and Communications million million
(Suzhou) Co., Ltd.
Cal Comp (Malaysia) MYR 28.04 MYR 28.04 100 100 261,305 262,322 411,569 422,535
SDN. BHD. million million
Cal-Comp Electronics USD 100.00 USD 100.00 100 100 2,965,732 2,977,274 2,033,359 1,837,304
(USA) Co., Ltd. million million
Cal-Comp Industria e BRL 165.02 BRL 165.02 1 1 20,975 21,056 16,318 12,016
Comercio de Electronicos million million
e Informatica Ltda.*
Cal-Comp Electronics de MXN 141.18 MXN 141.18 100 100 287,067 288,184 396,652 441,242
Mexico Co., S.A. de C.V. million million
Cal-Comp Holding BRL 258.22 BRL 258.22 100 100 2,355,579 2,364,747 2,563,288 2,238,763
(Brasil) S.A. million million
Cal-Comp (India) INR 3.23 INR 32.23 100 100 1,629 16,356 460 8,679
Private Limited million million
Cal-Comp Automation and Baht 100.00 Baht 100.00 100 100 92,565 92,925 123,735 87,716
Industrial 4.0 Service
(Thailand) Co., Ltd.
million million
Cal-Comp Precision Holding TWD 565.00 TWD 565.00 95 100 2,426,610 2,563,090 2,785,885 2,618,508
Co., Ltd. million million
Qbit Semiconductor USD 1.13 USD 0.82 92 94 386,674 252,486 1,877 -
Holding Ltd. million million
Translation adjustment - - 3,049 (52,883)
Total investments in subsidiaries 12,173,565 12,213,396 13,428,050 12,282,541
* Classified as investments in subsidiaries since the Company indirectly holds the investment in such company through Cal-Comp Holding
(Brasil) S.A. with 99% of registered capital of Cal-Comp Industria e Comercio de Electronicos e Informatica Ltda. and the Company has
control over such company.
The change in cost of investments in subsidiaries is mainly from the exchange differences
on translation of functional currency to presentation currency. In addition, the change in cost
of investments in subsidiaries is from the capital reduction of Cal-Comp (India) Private
Limited, the disposal of investment in Cal-Comp Precision Holding Co., Ltd. and the
additional investment in Qbit Semiconductor Holding Ltd.

77
The Company presented the negative investment value based on equity method as
“Provision for transaction under equity method of investments in subsidiaries” was detailed
as follow:
(Unit: Thousand US Dollar)
Carrying amount
Paid-up capital Shareholding percentage Cost based on equity method
Company’s name 2020 2019 2020 2019 2020 2019 2020 2019
(%) (%)
Logistar International USD 40.05 USD 40.05 100 100 43,208 43,208 378,137 310,889
Holding Co., Ltd. million million
Qbit Semiconductor USD 1.13 USD 0.82 92 94 - 8,373 - 5,023
Holding Ltd. million million
Total provision for transaction under equity method of investments in subsidiaries 43,208 51,581 378,137 315,912
(Unit: Thousand Baht)
Carrying amount
Paid-up capital Shareholding percentage Cost based on equity method
Company’s name 2020 2019 2020 2019 2020 2019 2020 2019
(%) (%)
Logistar International USD 40.05 USD 40.05 100 100 1,297,853 1,302,904 11,358,152 9,374,555
Holding Co., Ltd. million million
Qbit Semiconductor USD 1.13 USD 0.82 92 94 - 252,486 - 151,458
Holding Ltd. million million
Total provision for transaction under equity method of investments in subsidiaries 1,297,853 1,555,390 11,358,152 9,526,013
The change in cost of investments in subsidiaries is from the exchange differences on
translation of functional currency to presentation currency. In addition, the change in cost of
investments in subsidiaries is from the additional investment in Qbit Semiconductor Holding
Ltd.
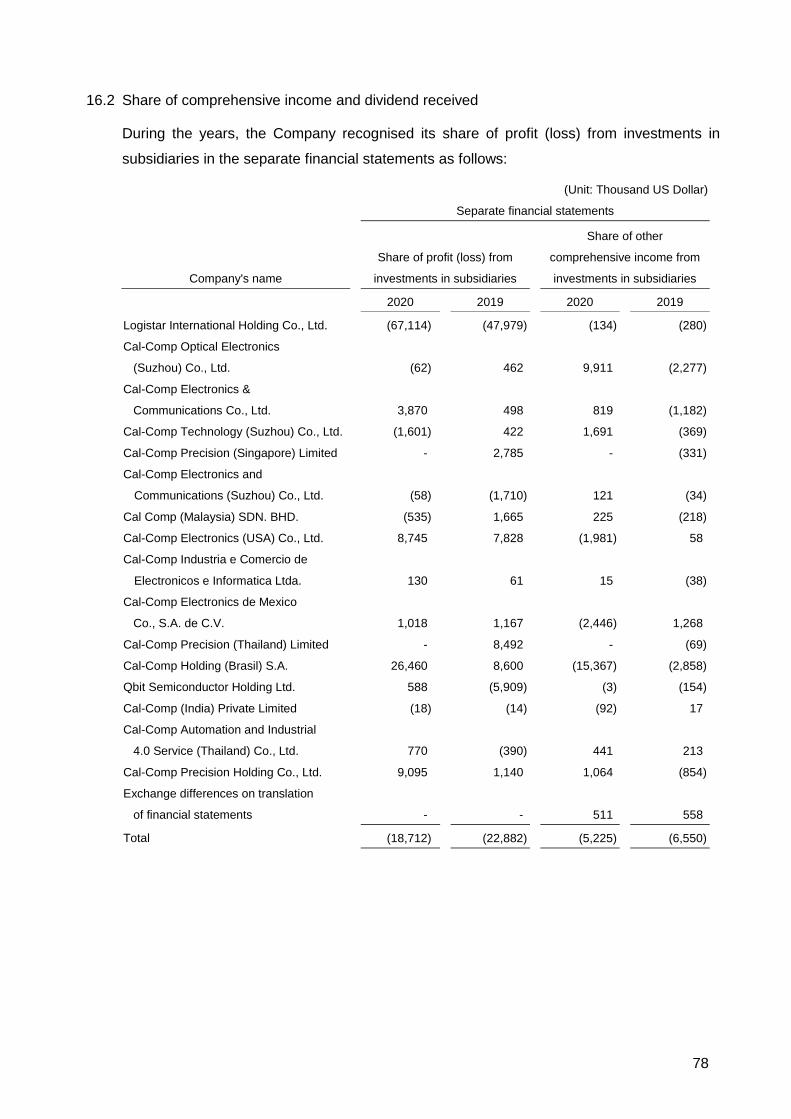
78
16.2 Share of comprehensive income and dividend received
During the years, the Company recognised its share of profit (loss) from investments in
subsidiaries in the separate financial statements as follows:
(Unit: Thousand US Dollar)
Separate financial statements
Share of profit (loss) from
Share of other
comprehensive income from
Company's name investments in subsidiaries investments in subsidiaries
2020 2019 2020 2019
Logistar International Holding Co., Ltd. (67,114) (47,979) (134) (280)
Cal-Comp Optical Electronics
(Suzhou) Co., Ltd. (62) 462 9,911 (2,277)
Cal-Comp Electronics &
Communications Co., Ltd. 3,870 498 819 (1,182)
Cal-Comp Technology (Suzhou) Co., Ltd. (1,601) 422 1,691 (369)
Cal-Comp Precision (Singapore) Limited - 2,785 - (331)
Cal-Comp Electronics and
Communications (Suzhou) Co., Ltd. (58) (1,710) 121 (34)
Cal Comp (Malaysia) SDN. BHD. (535) 1,665 225 (218)
Cal-Comp Electronics (USA) Co., Ltd. 8,745 7,828 (1,981) 58
Cal-Comp Industria e Comercio de
Electronicos e Informatica Ltda.
130
61 15 (38)
Cal-Comp Electronics de Mexico
Co., S.A. de C.V.
1,018
1,167
(2,446) 1,268
Cal-Comp Precision (Thailand) Limited - 8,492 - (69)
Cal-Comp Holding (Brasil) S.A. 26,460 8,600 (15,367) (2,858)
Qbit Semiconductor Holding Ltd. 588 (5,909) (3) (154)
Cal-Comp (India) Private Limited (18) (14) (92) 17
Cal-Comp Automation and Industrial
4.0 Service (Thailand) Co., Ltd. 770 (390) 441 213
Cal-Comp Precision Holding Co., Ltd. 9,095 1,140 1,064 (854)
Exchange differences on translation
of financial statements - - 511 558
Total (18,712) (22,882) (5,225) (6,550)

79
(Unit: Thousand Baht)
Separate financial statements
Share of profit (loss) from
Share of other
comprehensive income from
Company's name investments in subsidiaries investments in subsidiaries
2020 2019 2020 2019
Logistar International Holding Co., Ltd. (2,110,273) (1,485,092) (4,250) (8,978)
Cal-Comp Optical Electronics
(Suzhou) Co., Ltd. (336) 15,445 304,350 (70,895)
Cal-Comp Electronics &
Communications Co., Ltd. 118,228 16,157 25,254 (35,826)
Cal-Comp Technology (Suzhou) Co., Ltd. (49,138) 13,138 51,898 (11,473)
Cal-Comp Precision (Singapore) Limited - 87,603 - (10,168)
Cal-Comp Electronics and
Communications (Suzhou) Co., Ltd. (2,467) (53,075) 3,689 (1,040)
Cal Comp (Malaysia) SDN. BHD. (16,629) 52,394 6,366 (6,926)
Cal-Comp Electronics (USA) Co., Ltd. 277,921 241,127 (62,957) 1,974
Cal-Comp Industria e Comercio de
Electronicos e Informatica Ltda. 4,047 1,892 468 (1,170)
Cal-Comp Electronics de Mexico
Co., S.A. de C.V.
31,958
35,529 (79,713) 38,615
Cal-Comp Precision (Thailand) Limited - 264,848 - (1,080)
Cal-Comp Holding (Brasil) S.A. 827,390 267,033 (495,847) (88,575)
Qbit Semiconductor Holding Ltd. 19,807 (182,397) (81) (4,639)
Cal-Comp (India) Private Limited (539) (445) (2,916) 559
Cal-Comp Automation and Industrial
4.0 Service (Thailand) Co., Ltd. 24,054 (12,114) 13,680 6,654
Cal-Comp Precision Holding Co., Ltd. 289,119 34,435 31,607 (25,788)
Exchange differences on translation
of financial statements - - 16,279 15,565
Total (586,858) (703,522) (192,173) (203,191)
In 2019, the Company received dividend income from Cal-Comp Precision (Singapore)
Limited, Cal-Comp (Malaysia) SDN. BHD. and Cal-Comp Precision (Thailand) Limited
totaling Baht 1,221 million (USD 39.4 million) (2020: There was no dividend income from
subsidiaries).

80
16.3 Details of investments in subsidiaries that has material non-controlling interests
(Unit: Million US Dollar)
Company’s name
Proportion of equity
interest held by
non-controlling interests
Accumulated balance of
non-controlling interests
Profit (loss) allocated
to non-controlling
interests during
the year
2020 2019 2020 2019 2020 2019
(%) (%)
Cal-Comp Industria de
Semicondutores S.A.
41.96 41.96 2 2 0.1 (1)
Cal-Comp Precision
Holding Co., Ltd.
5.00 - 5 - 0.5 -
(Unit: Million Baht)
Company’s name
Proportion of equity
interest held by
non-controlling interests
Accumulated balance of
non-controlling interests
Profit (loss) allocated
to non-controlling
interests during
the year
2020 2019 2020 2019 2020 2019
(%) (%)
Cal-Comp Industria de
Semicondutores S.A.
41.96 41.96 53 59 2 (44)
Cal-Comp Precision
Holding Co., Ltd.
5.00 - 149 - 15 -
16.4 Summarised financial information that based on amounts before inter-company elimination
about subsidiaries that have material non-controlling interest
Summarised information about financial position
(Unit: Million US Dollar)
Cal-Comp Industria de
Semicondutores S.A.
Cal-Comp Precision
Holding Co., Ltd.
2020 2019 2020 2019
Current assets 17 5 141 -
Non-current assets 14 20 109 -
Current liabilities 20 14 143 -
Non-current liabilities 9 8 8 -
(Unit: Million Baht)
Cal-Comp Industria de
Semicondutores S.A.
Cal-Comp Precision
Holding Co., Ltd.
2020 2019 2020 2019
Current assets 520 168 4,237 -
Non-current assets 417 605 3,275 -
Current liabilities 589 419 4,282 -
Non-current liabilities 262 251 244 -

81
Summarised information about comprehensive income
(Unit: Million US Dollar)
Cal-Comp Industria de
Semicondutores S.A.
Cal-Comp Precision
Holding Co., Ltd.
2020 2019 2020 2019
Revenue 35 19 271 -
Profit (loss) 0.3 (4) 10 -
Other comprehensive income - - 0.1 -
Total comprehensive income 0.3 (4) 10 -
(Unit: Million Baht)
Cal-Comp Industria de
Semicondutores S.A.
Cal-Comp Precision
Holding Co., Ltd.
2020 2019 2020 2019
Revenue 1,096 561 8,490 -
Profit (loss) 8 (106) 301 -
Other comprehensive income - - 5 -
Total comprehensive income 8 (106) 306 -
Summarised information about cash flow
(Unit: Million US Dollar)
Cal-Comp Industria de
Semicondutores S.A.
Cal-Comp Precision
Holding Co., Ltd.
2020 2019 2020 2019
Cash flow from operating activities 3 1 16 -
Cash flow used in investing activities - - (12) -
Cash flow used in financing activities - - (20) -
Increase in currency translation adjustment - - 3 -
Net increase (decrease) in cash and cash equivalents 3 1 (13) -
(Unit: Million Baht)
Cal-Comp Industria de
Semicondutores S.A.
Cal-Comp Precision
Holding Co., Ltd.
2020 2019 2020 2019
Cash flow from operating activities 87 31 512 -
Cash flow used in investing activities (7) - (381) -
Cash flow used in financing activities - - (628) -
Increase in currency translation adjustment - - 78 -
Net increase (decrease) in cash and cash equivalents 80 31 (419) -

82
On 26 February 2014, a meeting of the Board of Directors of the Company approved the
merger of the Company’s subsidiaries in the People’s Republic of China, Cal-Comp
Technology (Suzhou) Co., Ltd. and Cal-Comp Electronics and Communications (Suzhou)
Co., Ltd., and it is in the process of operation.
On 12 November 2018, a meeting of the Board of Directors of the Company approved
the closing down of Cal-Comp (India) Private Limited, its subsidiary in India, in order to
reduce unnecessary expenses of the Group and to improve the operational efficiency.
During the third quarter of the current year, the Company received money from capital
reduction from such subsidiary amounting to USD 0.2 million. Currently, the closing down of
the subsidiary is in process.
On 14 May 2019, a meeting of the Board of Directors of the Company approved
the dissolution and liquidation of Cal Comp (Malaysia) SDN. BHD., which is a subsidiary in
Malaysia since the customer relocated its manufacturing base to Thailand. Currently,
it is in the process of operation.
On 12 November 2019, a meeting of the Board of Directors of the Company approved
the following matters.
1) To approve an investment of a new subsidiary in 100% with the amount not exceeding
USD 55 million in order to support the restructuring of the group companies in Brazil.
Currently, it is in the process of operation.
2) To approve an internal restructuring of shareholding of the group companies in Brazil.
Currently, it is in the process of operation.
On 13 December 2019, a meeting of the Board of Directors of the Company approved to sell
partial investment in Cal-Comp Precision Holding Co., Ltd. amounted to 2,826,000 shares at
TWD 129 million, for a purpose of meeting the Group’s long-term business plan and future
funding purpose in potential capital market. During the first quarter of the current year,
the Company partially sold investment in such company in an amount of USD 4 million or
Baht 135 million and after the share disposition, the shareholding percentage of the
Company decreased from 100% to 95%.

83
On 12 May 2020, a meeting of the Board of Directors of the Company approved the
following matters.
1) To approve an additional investment in Qbit Semiconductor Holding Ltd., its subsidiary
in Cayman Islands, at the amount of USD 4.5 million. During the second quarter of
the current year, the Company paid for additional share capital of USD 4.5 million.
After the capital increase, the shareholding percentage of the Company increased from
94% to 95%.
2) To approve an additional investment in Cal-Comp Precision (Yue Yang) Co., Ltd.
by Cal-Comp Precision (Singapore) Limited, its indirect subsidiary, at the amount of
USD 10 million. During the third quarter of the current year, Cal-Comp Precision
(Singapore) Limited paid for additional share capital of USD 10 million.
3) To approve the initial public offering plan of Cal-Comp Precision Holding Co., Ltd.,
its subsidiary in Taiwan, in the Taiwan Stock Exchange and over-allotment plan. It is
expected that the initial public offering will be completed in the first quarter of the year
2021.
On 13 August 2020, a meeting of the Board of Directors of the Company approved the
following matters.
1) To approve the capital reduction of Qbit Semiconductor Ltd., its indirect subsidiary in
Taiwan, at the amount of TWD 300 million, for the purpose of capital management and
offsetting the deficit in retained earnings for future business plan. It is expected that the
capital reduction will be completed in the second quarter of the year 2021.
2) To approve the shareholding restructuring of Qbit Semiconductor Holding Ltd.,
its subsidiary in Cayman Islands, for the purpose of supporting long-term business
development plan. It is expected that the organisation restructuring will be completed in
the second quarter of the year 2021.
On 13 November 2020, a meeting of the Board of Directors of the Company approved
the plan to repurchase 2,781,000 shares at TWD 45.5 per share, or for a total of
TWD 126.5 million from minor shareholders of Cal-Comp Precision Holding Co., Ltd.,
a subsidiary in Cayman Islands, by repurchasing 1,205,000 shares from related persons
and 1,576,000 shares from non-related persons. The purpose of share repurchases is to
revise the capital funding plan in response to the world economic situation at present.
After the share repurchase, the Company’s shareholding percentage will increase from
95% to 99.92%. The share repurchase is expected to be completed in the first quarter of
2021.

84
17. Property, plant and equipment
Movements of property, plant and equipment for the years ended 31 December 2020 and
2019 are summarised below.
(Unit: Thousand US Dollar)
Consolidated financial statements
Construction in
Buildings Machinery progress and
Land and land and buildings and Molds and Office furniture equipment
improvements improvements equipment spare parts and equipment Motor vehicles under installation Total
Cost
1 January 2019 19,321 262,163 411,024 133,353 77,387 1,895 20,759 925,902
Additions 2,645 7,168 15,392 7,762 3,864 42 53,322 90,195
Disposals - (2,229) (22,295) (2,606) (2,285) (154) (12) (29,581)
Transfers in (out) - 3,396 12,525 8,850 18 102 (25,363) (472)
Translation adjustment 65 (340) (598) 81 (365) (8) 270 (895)
31 December 2019 22,031 270,158 416,048 147,440 78,619 1,877 48,976 985,149
Additions 321 33,287 52,687 11,053 6,144 63 7,865 111,420
Disposals - (77) (41,357) (4,506) (2,619) (197) (139) (48,895)
Reclassify to assets held for sale - (16,321) - - - - - (16,321)
Transfers in (out) - 1,108 1,096 8,603 2,157 19 (18,460) (5,477)
Translation adjustment 14 705 (26,060) 352 1,016 32 (14) (23,955)
31 December 2020 22,366 288,860 402,414 162,942 85,317 1,794 38,228 1,001,921
Accumulated depreciation
1 January 2019 - 84,478 245,420 87,559 51,239 1,222 - 469,918
Depreciation for the year - 12,660 35,115 16,695 7,361 116 - 71,947
Depreciation on disposals - (2,227) (20,914) (2,584) (2,113) (77) - (27,915)
Translation adjustment - (311) (2,576) 74 (487) - - (3,300)
31 December 2019 - 94,600 257,045 101,744 56,000 1,261 - 510,650
Depreciation for the year - 13,492 33,420 18,686 6,903 135 - 72,636
Depreciation on disposals - (64) (40,240) (3,826) (2,581) (351) - (47,062)
Reclassify to assets held for sale - (3,682) - - - - - (3,682)
Translation adjustment - (509) (2,601) 395 968 25 - (1,722)
31 December 2020 - 103,837 247,624 116,999 61,290 1,070 - 530,820
Allowance for impairment loss
31 December 2019 - 719 304 - - - - 1,023
Increase during the year - - 362 - - - - 362
31 December 2020 - 719 666 - - - - 1,385
Net book value 31 December 2019 22,031 174,839 158,699 45,696 22,619 616 48,976 473,476
31 December 2020 22,366 184,304 154,124 45,943 24,027 724 38,228 469,716
Depreciation for the year
2019 (USD 66 million included in manufacturing cost, and the remaining balance is in selling, distribution and administrative expenses) 71,947
2020 (USD 65 million included in manufacturing cost, and the remaining balance is in selling, distribution and administrative expenses) 72,636

85
(Unit: Thousand Baht)
Consolidated financial statements
Construction in
Buildings Machinery progress and
Land and land and buildings and Molds and Office furniture equipment
improvements improvements equipment spare parts and equipment Motor vehicles under installation Total
Cost
1 January 2019 626,963 8,507,140 13,337,632 4,327,264 2,511,183 61,494 673,630 30,045,306
Additions 79,847 222,575 472,524 240,103 119,400 1,323 1,658,990 2,794,762
Disposals - (67,419) (696,024) (81,305) (70,707) (4,859) (378) (920,692)
Transfers in (out) - 106,552 388,933 272,714 523 3,115 (786,601) (14,764)
Translation adjustment (42,487) (622,506) (957,557) (312,880) (189,722) (4,475) (68,791) (2,198,418)
31 December 2019 664,323 8,146,342 12,545,508 4,445,896 2,370,677 56,598 1,476,850 29,706,194
Additions 9,792 1,052,943 1,648,126 347,256 192,148 1,974 246,899 3,499,138
Disposals - (2,413) (1,302,144) (138,972) (81,431) (6,193) (4,295) (1,535,448)
Reclassify to assets held for sale - (490,230) - - - - - (490,230)
Transfers in (out) - 19,935 40,560 269,065 67,990 604 (577,661) (179,507)
Translation adjustment (2,305) (50,063) (844,696) (28,940) 13,291 904 6,495 (905,314)
31 December 2020 671,810 8,676,514 12,087,354 4,894,305 2,562,675 53,887 1,148,288 30,094,833
Accumulated depreciation
1 January 2019 - 2,741,291 7,963,829 2,841,256 1,662,694 39,645 - 15,248,715
Depreciation for the year - 391,879 1,087,600 516,748 227,875 3,586 - 2,227,688
Depreciation on disposals - (67,358) (653,543) (80,628) (65,414) (2,427) - (869,370)
Translation adjustment - (213,245) (646,951) (209,387) (136,531) (2,781) - (1,208,895)
31 December 2019 - 2,852,567 7,750,935 3,067,989 1,688,624 38,023 - 15,398,138
Depreciation for the year - 422,662 1,047,123 585,108 216,311 4,237 - 2,275,441
Depreciation on disposals - (2,006) (1,267,801) (117,653) (80,258) (10,885) - (1,478,603)
Reclassify to assets held for sale - (110,601) - - - - - (110,601)
Translation adjustment - (43,631) (92,350) (21,133) 16,297 765 - (140,052)
31 December 2020 - 3,118,991 7,437,907 3,514,311 1,840,974 32,140 - 15,944,323
Allowance for impairment loss
31 December 2019 - 21,681 9,167 - - - - 30,848
Increase during the year - - 11,476 - - - - 11,476
Translation adjustment - (84) (639) - - - - (723)
31 December 2020 - 21,597 20,004 - - - - 41,601
Net book value 31 December 2019 664,323 5,272,094 4,785,406 1,377,907 682,053 18,575 1,476,850 14,277,208
31 December 2020 671,810 5,535,926 4,629,443 1,379,994 721,701 21,747 1,148,288 14,108,909
Depreciation for the year
2019 (Baht 2,030 million included in manufacturing cost, and the remaining balance is in selling, distribution and administrative expenses) 2,227,688
2020 (Baht 2,041 million included in manufacturing cost, and the remaining balance is in selling, distribution and administrative expenses) 2,275,441

86
(Unit: Thousand US Dollar)
Separate financial statements
Construction in
Buildings Machinery progress and
Land and land and buildings and Molds and Office furniture equipment
improvements improvements equipment spare parts and equipment Motor vehicles under installation Total
Cost
1 January 2019 16,589 156,523 189,280 125,741 26,858 638 8,931 524,560
Additions 2,300 1,835 6,952 7,054 2,306 49 46,016 66,512
Disposals - - (8,825) (2,606) (1,067) - - (12,498)
Transfers in (out) - - - 8,850 - - (9,365) (515)
31 December 2019 18,889 158,358 187,407 139,039 28,097 687 45,582 578,059
Additions 321 30,814 21,576 7,971 2,395 - - 63,077
Disposals - (4) (33,664) (4,506) (434) - - (38,608)
Transfers in (out) - - - 8,603 - - (17,836) (9,233)
31 December 2020 19,210 189,168 175,319 151,107 30,058 687 27,746 593,295
Accumulated depreciation
1 January 2019 - 54,120 123,759 81,022 16,825 270 - 275,996
Depreciation for the year - 8,375 14,807 15,786 2,603 66 - 41,637
Depreciation on disposals - - (7,770) (2,584) (1,039) - - (11,393)
31 December 2019 - 62,495 130,796 94,224 18,389 336 - 306,240
Depreciation for the year - 9,068 14,871 17,260 2,502 56 - 43,757
Depreciation on disposals - (1) (33,457) (3,826) (423) - - (37,707)
31 December 2020 - 71,562 112,210 107,658 20,468 392 - 312,290
Allowance for impairment loss
31 December 2019 - 719 304 - - - - 1,023
31 December 2020 - 719 304 - - - - 1,023
Net book value
31 December 2019 18,889 95,144 56,307 44,815 9,708 351 45,582 270,796
31 December 2020 19,210 116,887 62,805 43,449 9,590 295 27,746 279,982
Depreciation for the year
2019 (USD 38 million included in manufacturing cost, and the remaining balance is in selling, distribution and administrative expenses) 41,637
2020 (USD 40 million included in manufacturing cost, and the remaining balance is in selling, distribution and administrative expenses) 43,757
(Unit: Thousand Baht)
Separate financial statements
Construction in
Buildings Machinery progress and
Land and land and buildings and Molds and Office furniture equipment
improvements improvements equipment spare parts and equipment Motor vehicles under installation Total
Cost
1 January 2019 538,304 5,079,128 6,142,075 4,080,273 871,531 20,687 289,813 17,021,811
Additions 69,454 57,179 214,928 218,411 71,296 1,549 1,419,336 2,052,153
Disposals - - (272,489) (81,306) (33,111) - - (386,906)
Transfers in (out) - - - 272,717 - - (288,857) (16,140)
Translation adjustment (38,162) (361,193) (433,460) (297,476) (62,475) (1,528) (45,827) (1,240,121)
31 December 2019 569,596 4,775,114 5,651,054 4,192,619 847,241 20,708 1,374,465 17,430,797
Additions 9,779 976,365 675,189 251,615 74,999 - - 1,987,947
Disposals - (126) (1,065,114) (138,961) (13,368) - - (1,217,569)
Transfers in (out) - - - 269,071 - - (566,578) (297,507)
Translation adjustment (2,357) (69,297) 4,924 (35,489) (5,995) (80) 25,515 (82,779)
31 December 2020 577,018 5,682,056 5,266,053 4,538,855 902,877 20,628 833,402 17,820,889
Accumulated depreciation
1 January 2019 - 1,756,172 4,015,950 2,629,164 545,980 8,752 - 8,956,018
Depreciation for the year - 259,303 458,662 488,624 80,600 2,051 - 1,289,240
Depreciation on disposals - - (240,234) (80,624) (32,270) - - (353,128)
Translation adjustment - (131,011) (290,370) (195,920) (39,795) (673) - (657,769)
31 December 2019 - 1,884,464 3,944,008 2,841,244 554,515 10,130 - 9,234,361
Depreciation for the year - 284,087 465,907 540,755 78,432 1,744 - 1,370,925
Depreciation on disposals - (40) (1,058,540) (117,654) (13,013) - - (1,189,247)
Translation adjustment - (19,013) 19,092 (30,578) (5,114) (117) - (35,730)
31 December 2020 - 2,149,498 3,370,467 3,233,767 614,820 11,757 - 9,380,309
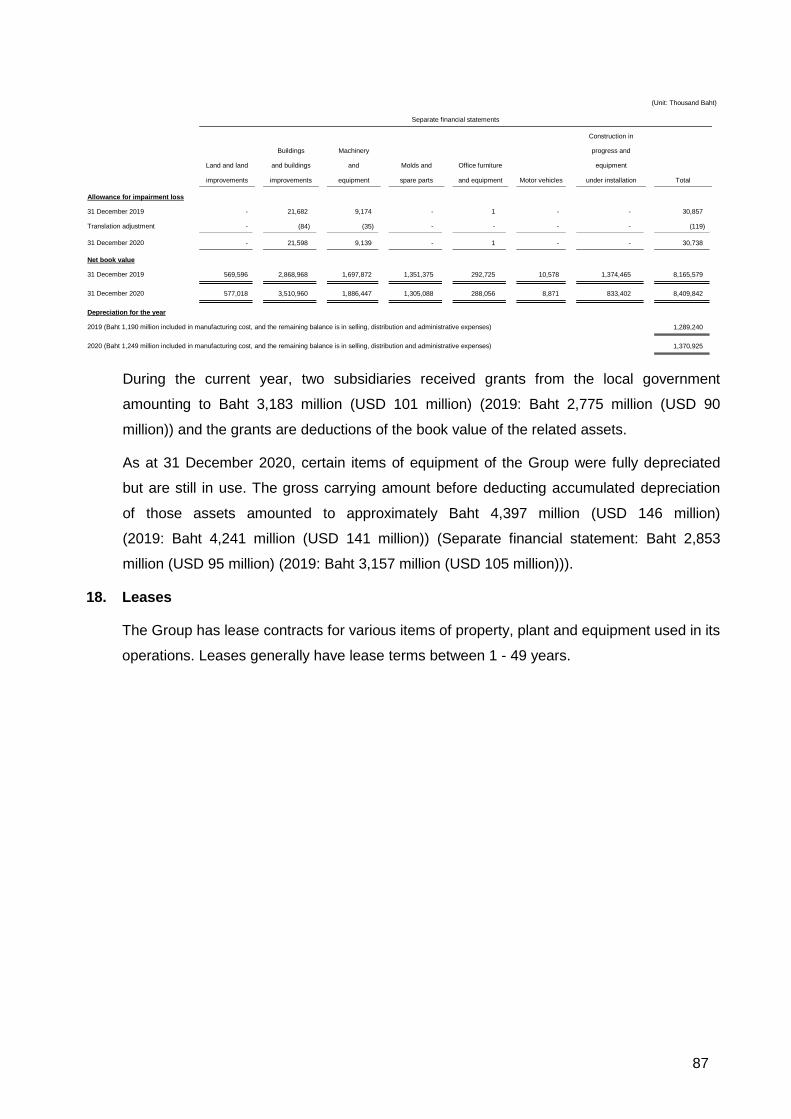
87
(Unit: Thousand Baht)
Separate financial statements
Construction in
Buildings Machinery progress and
Land and land and buildings and Molds and Office furniture equipment
improvements improvements equipment spare parts and equipment Motor vehicles under installation Total
Allowance for impairment loss
31 December 2019 - 21,682 9,174 - 1 - - 30,857
Translation adjustment - (84) (35) - - - - (119)
31 December 2020 - 21,598 9,139 - 1 - - 30,738
Net book value
31 December 2019 569,596 2,868,968 1,697,872 1,351,375 292,725 10,578 1,374,465 8,165,579
31 December 2020 577,018 3,510,960 1,886,447 1,305,088 288,056 8,871 833,402 8,409,842
Depreciation for the year
2019 (Baht 1,190 million included in manufacturing cost, and the remaining balance is in selling, distribution and administrative expenses) 1,289,240
2020 (Baht 1,249 million included in manufacturing cost, and the remaining balance is in selling, distribution and administrative expenses) 1,370,925
During the current year, two subsidiaries received grants from the local government
amounting to Baht 3,183 million (USD 101 million) (2019: Baht 2,775 million (USD 90
million)) and the grants are deductions of the book value of the related assets.
As at 31 December 2020, certain items of equipment of the Group were fully depreciated
but are still in use. The gross carrying amount before deducting accumulated depreciation
of those assets amounted to approximately Baht 4,397 million (USD 146 million)
(2019: Baht 4,241 million (USD 141 million)) (Separate financial statement: Baht 2,853
million (USD 95 million) (2019: Baht 3,157 million (USD 105 million))).
18. Leases
The Group has lease contracts for various items of property, plant and equipment used in its
operations. Leases generally have lease terms between 1 - 49 years.

88
18.1 Right-of-use assets
Movement of right-of-use assets for the year ended 31 December 2020 are summarised
below.
(Unit: Thousand US Dollar)
Consolidated financial statements
Land
Buildings
and buildings
improvements
Office furniture
and equipment
Total
Balance as at 31 December 2019 - - - -
Adjustments of right-of-use assets
due to TFRS 16 adoption -
18,512 44 18,556
Reclassify from land occupancy rights
due to TFRS 16 adoption
1,914
-
-
1,914
Balance as at 1 January 2020 1,914 18,512 44 20,470
Additions - 7,793 42 7,835
Write-off - (281) - (281)
Depreciation for the year (57) (5,726) (27) (5,810)
Reclassify to assets held for sale (697) - - (697)
Translation adjustment 129 (1,627) - (1,498)
Balance as at 31 December 2020 1,289 18,671 59 20,019
(Unit: Thousand Baht)
Consolidated financial statements
Land
Buildings
and buildings
improvements
Office furniture
and equipment
Total
Balance as at 31 December 2019 - - - -
Adjustments of right-of-use assets
due to TFRS 16 adoption -
558,226 1,327 559,553
Reclassify from land occupancy rights
due to TFRS 16 adoption
57,705
-
-
57,705
Balance as at 1 January 2020 57,705 558,226 1,327 617,258
Additions - 241,103 1,319 242,422
Write-off - (8,586) - (8,586)
Depreciation for the year (1,772) (179,494) (841) (182,107)
Reclassify to assets held for sale (20,955) - - (20,955)
Translation adjustment 3,729 (50,396) (41) (46,708)
Balance as at 31 December 2020 38,707 560,853 1,764 601,324

89
(Unit: Thousand US Dollar)
Separate financial statements
Buildings
and buildings
improvements
Office furniture
and equipment
Total
Balance as at 31 December 2019 - - -
Adjustments of right-of-use assets
due to TFRS 16 adoption
147
44
191
Balance as at 1 January 2020 147 44 191
Additions - 42 42
Depreciation for the year (61) (27) (88)
Balance as at 31 December 2020 86 59 145
(Unit: Thousand Baht)
Separate financial statements
Buildings
and buildings
improvements
Office furniture
and equipment
Total
Balance as at 31 December 2019 - - -
Adjustments of right-of-use assets
due to TFRS 16 adoption
4,433
1,327
5,760
Balance as at 1 January 2020 4,433 1,327 5,760
Additions - 1,319 1,319
Depreciation for the year (1,907) (841) (2,748)
Translation adjustment 62 (41) 21
Balance as at 31 December 2020 2,588 1,764 4,352
18.2 Lease liabilities
(Unit: Thousand US Dollar) (Unit: Thousand Baht)
Consolidated
financial statements
Consolidated
financial statements
Lease payments 20,573 615,924
Less: Deferred interest expenses (1,253) (35,604)
Total 19,320 580,320
Less: Portion due within one year (5,559) (166,965)
Lease liabilities - net of current portion 13,761 413,355

90
(Unit: Thousand US Dollar) (Unit: Thousand Baht)
Separate
financial statements
Separate
financial statements
Lease payments 152 4,574
Less: Deferred interest expenses (3) (82)
Total 149 4,492
Less: Portion due within one year (93) (2,797)
Lease liabilities - net of current portion 56 1,695
A maturity analysis of lease payments is disclosed in Note 39 under the liquidity risk.
18.3 Expenses relating to leases that are recognised in profit or loss
(Unit: Thousand US Dollar) (Unit: Thousand Baht)
For the year ended 31 December 2020
Consolidated
financial statements
Consolidated
financial statements
Depreciation expense of right-of-use assets 5,810 182,107
Interest expense on lease liabilities 683 21,316
Expense relating to short-term leases 2,463 77,066
Expense relating to leases of low-value assets 8 238
Expense relating to variable lease payment 658 20,565
(Unit: Thousand US Dollar) (Unit: Thousand Baht)
For the year ended 31 December 2020
Separate
financial statements
Separate
financial statements
Depreciation expense of right-of-use assets 88 2,748
Interest expense on lease liabilities 4 122
Expense relating to short-term leases 4 120
The Group has lease contracts for parking space and photocopiers that contain variable
payments based on number of car park and used paper. The lease term is between
1 and 4 years.

91
18.4 Others
The Group had total cash outflows for leases for the year ended 31 December 2020
of Baht 298 million (USD 9.5 million) (Separate financial statements: Baht 3 million
(USD 0.1 million)), including the cash outflow related to short-term lease, leases of
low-value assets and variable lease payments that do not depend on an index or a rate.
Moreover, the Group had non-cash additions to right-of-use assets and lease liabilities of
Baht 242 million (USD 7.8 million) (Separate financial statements: Baht 1 million
(USD 0.1 million).
19. Intangible assets
The net book value of intangible assets as at 31 December 2020 and 2019 are as follows:
(Unit: Thousand US Dollar)
Consolidated financial statements
Customer
list
Computer
software
design
Technical
license
fee
Development
cost Total
Cost
1 January 2019 3,460 1,397 3,381 - 8,238
Additions - 477 4,534 2,281 7,292
Disposal - (1,148) (68) - (1,216)
Translation adjustment - 12 229 74 315
31 December 2019 3,460 738 8,076 2,355 14,629
Additions - 32 3,380 4,458 7,870
Disposal - (604) (102) - (706)
Transfer in (out) - - 4,458 (4,458) -
Translation adjustment - (37) 1,461 124 1,548
31 December 2020 3,460 129 17,273 2,479 23,341
Accumulated amortisation
1 January 2019 3,460 904 396 - 4,760
Amortisation for the year - 484 186 - 670
Amortisation on disposal - (1,148) (68) - (1,216)
Translation adjustment - 1 13 - 14
31 December 2019 3,460 241 527 - 4,228
Amortisation for the year - 455 210 - 665
Amortisation on disposal - (604) (102) - (706)
Translation adjustment - (6) 42 - 36
31 December 2020 3,460 86 677 - 4,223
Net book value
31 December 2019 - 497 7,549 2,355 10,401
31 December 2020 - 43 16,596 2,479 19,118
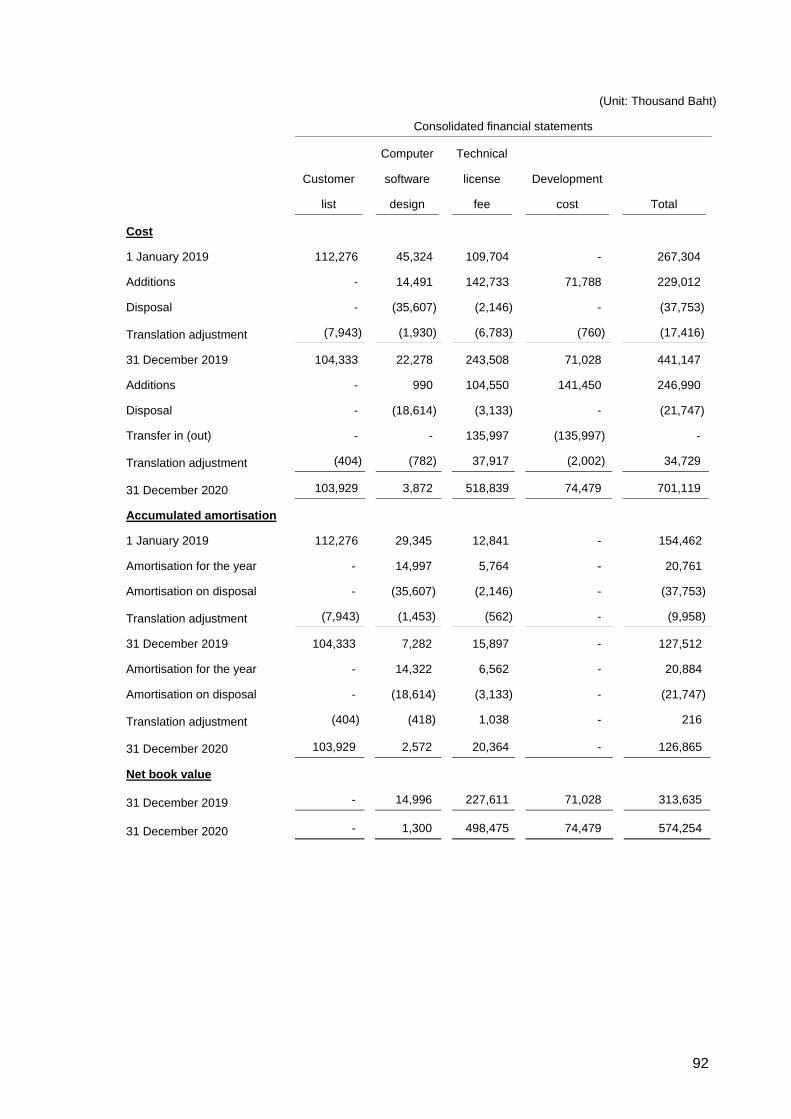
92
(Unit: Thousand Baht)
Consolidated financial statements
Customer
list
Computer
software
design
Technical
license
fee
Development
cost Total
Cost
1 January 2019 112,276 45,324 109,704 - 267,304
Additions - 14,491 142,733 71,788 229,012
Disposal - (35,607) (2,146) - (37,753)
Translation adjustment (7,943) (1,930) (6,783) (760) (17,416)
31 December 2019 104,333 22,278 243,508 71,028 441,147
Additions - 990 104,550 141,450 246,990
Disposal - (18,614) (3,133) - (21,747)
Transfer in (out) - - 135,997 (135,997) -
Translation adjustment (404) (782) 37,917 (2,002) 34,729
31 December 2020 103,929 3,872 518,839 74,479 701,119
Accumulated amortisation
1 January 2019 112,276 29,345 12,841 - 154,462
Amortisation for the year - 14,997 5,764 - 20,761
Amortisation on disposal - (35,607) (2,146) - (37,753)
Translation adjustment (7,943) (1,453) (562) - (9,958)
31 December 2019 104,333 7,282 15,897 - 127,512
Amortisation for the year - 14,322 6,562 - 20,884
Amortisation on disposal - (18,614) (3,133) - (21,747)
Translation adjustment (404) (418) 1,038 - 216
31 December 2020 103,929 2,572 20,364 - 126,865
Net book value
31 December 2019 - 14,996 227,611 71,028 313,635
31 December 2020 - 1,300 498,475 74,479 574,254

93
20. Land occupancy rights
The balance represents the rights to use public property in the People’s Republic of China
of two subsidiaries. These rights have a period of 49 years.
(Unit: Thousand US Dollar) (Unit: Thousand Baht)
Consolidated
financial statements
Consolidated
financial statements
Cost
1 January 2019 2,786 90,408
Translation adjustment (42) (7,680)
31 December 2019 2,744 82,728
Reclassify to right-of-use assets
due to TFRS 16 adoption (2,744) (82,728)
31 December 2020 - -
Accumulated amortisation
1 January 2019 786 25,504
Amortisation for the year 57 1,752
Translation adjustment (13) (2,233)
31 December 2019 830 25,023
Reclassify to right-of-use assets
due to TFRS 16 adoption (830) (25,023)
31 December 2020 - -
Net book value
31 December 2019 1,914 57,705
31 December 2020 - -
21. Short-term loans from financial institutions
Short-term loans from financial institutions of the Group consists of loans from both local
banks and overseas financial institutions in both Baht currency and foreign currencies.
The loans are mainly repayable within 3 months, and carry interest rates of 0.80% - 4.20%
per annum (2019: 1.60% - 3.80% per annum).

94
22. Trade and other payables
(Unit: Thousand US Dollar) (Unit: Thousand Baht)
Consolidated
financial statements
Consolidated
financial statements
2020 2019 2020 2019
Trade payable - related parties 11,965 4,126 359,394 124,423
Trade payable - unrelated parties 740,635 560,348 22,246,514 16,896,746
Advance from related parties 5,600 3,182 168,212 95,937
Accrued interest expenses 478 1,229 14,349 37,058
Accrued expenses 60,015 46,752 1,802,672 1,409,759
Other payables 49,355 33,650 1,482,490 1,014,683
Total trade and other payables 868,048 649,287 26,073,631 19,578,606
(Unit: Thousand US Dollar) (Unit: Thousand Baht)
Separate
financial statements
Separate
financial statements
2020 2019 2020 2019
Trade payable - related parties 21,261 9,641 638,614 290,717
Trade payable - unrelated parties 446,687 359,366 13,417,191 10,836,323
Advance from related parties 7,424 4,489 222,987 135,347
Accrued interest expenses 290 432 8,725 13,031
Accrued expenses 10,169 9,763 305,456 294,385
Other payables 33,555 7,625 1,007,881 229,951
Total trade and other payables 519,386 391,316 15,600,854 11,799,754
The outstanding balance of above other payables represents accounts payable suspense
for goods sales which subject to changes in price, specifications and other components.
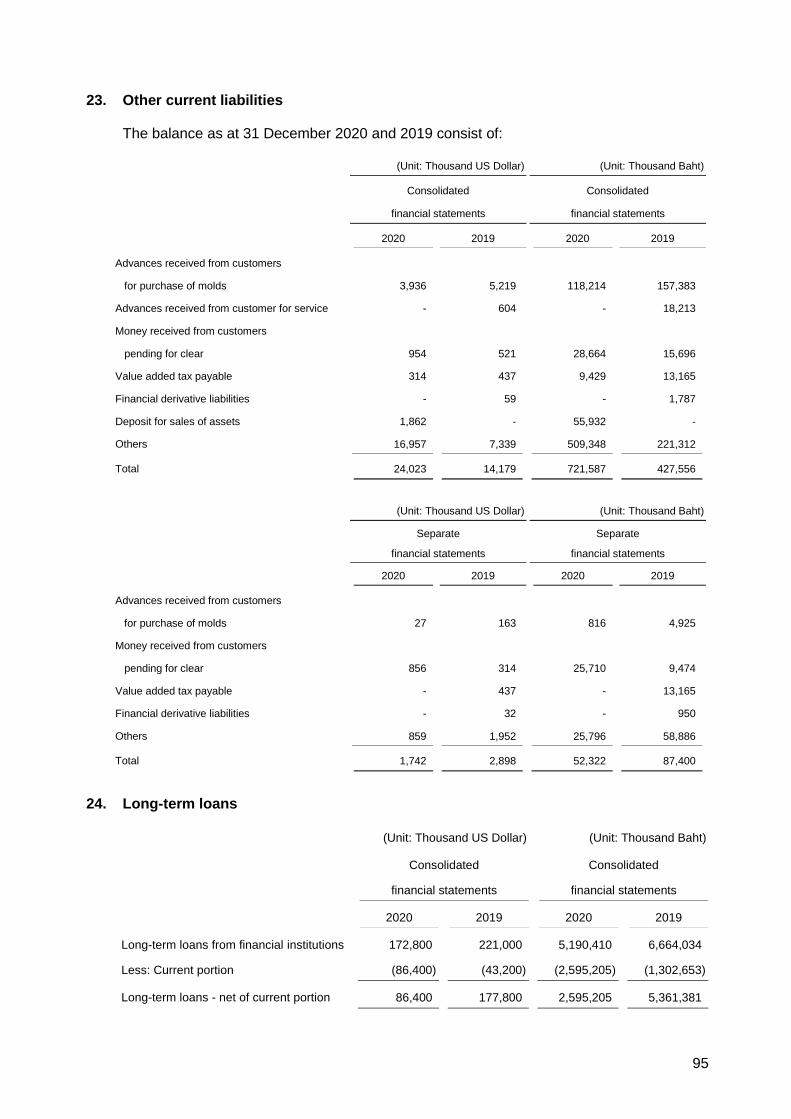
95
23. Other current liabilities
The balance as at 31 December 2020 and 2019 consist of:
(Unit: Thousand US Dollar) (Unit: Thousand Baht)
Consolidated
financial statements
Consolidated
financial statements
2020 2019 2020 2019
Advances received from customers
for purchase of molds 3,936 5,219 118,214 157,383
Advances received from customer for service - 604 - 18,213
Money received from customers
pending for clear 954 521 28,664 15,696
Value added tax payable 314 437 9,429 13,165
Financial derivative liabilities - 59 - 1,787
Deposit for sales of assets 1,862 - 55,932 -
Others 16,957 7,339 509,348 221,312
Total 24,023 14,179 721,587 427,556
(Unit: Thousand US Dollar) (Unit: Thousand Baht)
Separate
financial statements
Separate
financial statements
2020 2019 2020 2019
Advances received from customers
for purchase of molds 27 163 816 4,925
Money received from customers
pending for clear 856 314 25,710 9,474
Value added tax payable - 437 - 13,165
Financial derivative liabilities - 32 - 950
Others 859 1,952 25,796 58,886
Total 1,742 2,898 52,322 87,400
24. Long-term loans
(Unit: Thousand US Dollar) (Unit: Thousand Baht)
Consolidated
financial statements
Consolidated
financial statements
2020 2019 2020 2019
Long-term loans from financial institutions 172,800 221,000 5,190,410 6,664,034
Less: Current portion (86,400) (43,200) (2,595,205) (1,302,653)
Long-term loans - net of current portion 86,400 177,800 2,595,205 5,361,381

96
Movement of long-term loans during the year ended 31 December 2020 are summarised
below.
(Unit: Thousand US Dollar) (Unit: Thousand Baht)
Consolidated
financial statements
Consolidated
financial statements
Balance as at 1 January 2020 221,000 6,664,034
Repayment (48,200) (1,476,860)
Translation adjustment - 3,236
Balance as at 31 December 2020 172,800 5,190,410
The above long-term loans consisted of loan which the Company and Logistar International
Holding Co., Ltd., its subsidiary (Co-Borrowers), entered into 3-year syndicated loan
agreement with financial institutions for a facility of USD 216 million and the loan is
extendable for another two years. Subsequently in December 2019, the Company and
Logistar International Holding Co., Ltd. granted the approval to extend the final maturity date
for another two years, from 23 December 2020 to 23 December 2022. The purpose of
the loan is to repay the previous long-term loan and to increase the working capital
to support business operations. The co-borrowing loan carries interest at the reference rate
as stipulated in the agreement plus margin.
The co-borrowing loan agreement contains covenants as specified in the loan agreement
that, among other things, require the Company and its subsidiary to maintain certain current
ratio and financial debt ratio according to the agreement.
As at 31 December 2020 and 2019, there was no long-term credit facilities of the Group
which has not yet been drawn down.
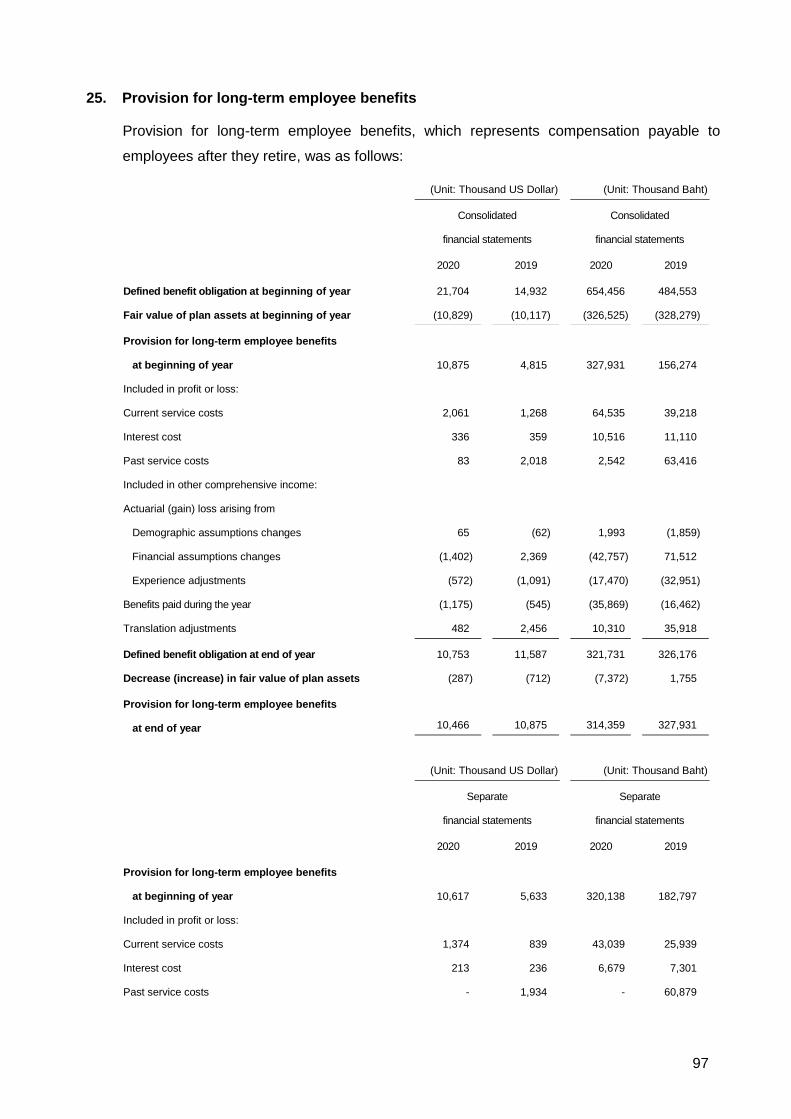
97
25. Provision for long-term employee benefits
Provision for long-term employee benefits, which represents compensation payable to
employees after they retire, was as follows:
(Unit: Thousand US Dollar) (Unit: Thousand Baht)
Consolidated
financial statements
Consolidated
financial statements
2020 2019 2020 2019
Defined benefit obligation at beginning of year 21,704 14,932 654,456 484,553
Fair value of plan assets at beginning of year (10,829) (10,117) (326,525) (328,279)
Provision for long-term employee benefits
at beginning of year
10,875
4,815
327,931
156,274
Included in profit or loss:
Current service costs 2,061 1,268 64,535 39,218
Interest cost 336 359 10,516 11,110
Past service costs 83 2,018 2,542 63,416
Included in other comprehensive income:
Actuarial (gain) loss arising from
Demographic assumptions changes 65 (62) 1,993 (1,859)
Financial assumptions changes (1,402) 2,369 (42,757) 71,512
Experience adjustments (572) (1,091) (17,470) (32,951)
Benefits paid during the year (1,175) (545) (35,869) (16,462)
Translation adjustments 482 2,456 10,310 35,918
Defined benefit obligation at end of year 10,753 11,587 321,731 326,176
Decrease (increase) in fair value of plan assets (287) (712) (7,372) 1,755
Provision for long-term employee benefits
at end of year 10,466 10,875 314,359 327,931
(Unit: Thousand US Dollar) (Unit: Thousand Baht)
Separate
financial statements
Separate
financial statements
2020 2019 2020 2019
Provision for long-term employee benefits
at beginning of year
10,617
5,633
320,138
182,797
Included in profit or loss:
Current service costs 1,374 839 43,039 25,939
Interest cost 213 236 6,679 7,301
Past service costs - 1,934 - 60,879

98
(Unit: Thousand US Dollar) (Unit: Thousand Baht)
Separate
financial statements
Separate
financial statements
2020 2019 2020 2019
Included in other comprehensive income:
Actuarial (gain) loss arising from
Financial assumptions changes (1,594) 2,149 (48,634) 64,878
Experience adjustments (136) (171) (4,154) (5,179)
Benefits paid during the year - (3) - (96)
Translation adjustments - - (2,465) (16,381)
Provision for long-term employee benefits
at end of year 10,474 10,617 314,603 320,138
The Group expects to pay Baht 16 million (USD 0.5 million) of long-term employee benefits
during the next year (Separate financial statements: Baht 3 million (USD 0.1 million))
(2019: Baht 18 million (USD 0.6 million) (Separate financial statements: Baht 3 million
(USD 0.1 million))).
As at 31 December 2020, the weighted average duration of the liabilities for long-term
employee benefit is 15 years (Separate financial statements: 16 years) (2019: 14 years
(Separate financial statements: 17 years)).
The change in the fair value of plan assets is as follows:
(Unit: Thousand US Dollar) (Unit: Thousand Baht)
Consolidated
financial statements
Consolidated
financial statements
2020 2019 2020 2019
Fair value of plan assets at beginning of year 10,829 10,117 326,524 328,279
Expected return 90 103 2,820 3,181
Contributions 463 494 14,482 15,284
Benefits paid during the year (1,157) (526) (35,309) (15,876)
Actuarial gain 332 358 10,129 10,806
Translation adjustments 559 283 15,250 (15,150)
Fair value of plan assets at end of year 11,116 10,829 333,896 326,524
The above plan asset of an oversea subsidiary is a deposit at an oversea financial
institution.

99
Significant actuarial assumptions are summarised below:
Consolidated financial statements Separate financial statements
2020 2019 2020 2019
(% per annum) (% per annum) (% per annum) (% per annum)
Discount rate 0.4 - 4.2 0.8 - 7.5 1.8 2.0
Salary increase rate 3.0 - 5.0 3.0 - 5.5 5.0 6.0
The result of sensitivity analysis for significant assumptions that affect the present value
of the long-term employee benefit obligation as at 31 December 2020 and 2019 are
summarised below:
(Unit: Million US Dollar)
Consolidated financial statements
2020 2019
Increase 0.5% Decrease 0.5% Increase 0.5% Decrease 0.5%
Discount rate (1) 2 (1) 2
Increase 1.0% Decrease 1.0% Increase 1.0% Decrease 1.0%
Salary increase rate 4 (2) 3 (3)
(Unit: Million Baht)
Consolidated financial statements
2020 2019
Increase 0.5% Decrease 0.5% Increase 0.5% Decrease 0.5%
Discount rate (25) 66 (45) 48
Increase 1.0% Decrease 1.0% Increase 1.0% Decrease 1.0%
Salary increase rate 115 (64) 100 (86)
(Unit: Million US Dollar)
Separate financial statements
2020 2019
Increase 0.5% Decrease 0.5% Increase 0.5% Decrease 0.5%
Discount rate (0.2) 2 (1) 1
Increase 1.0% Decrease 1.0% Increase 1.0% Decrease 1.0%
Salary increase rate 3 (1) 2 (2)
(Unit: Million Baht)
Separate financial statements
2020 2019
Increase 0.5% Decrease 0.5% Increase 0.5% Decrease 0.5%
Discount rate (7) 47 (28) 31
Increase 1.0% Decrease 1.0% Increase 1.0% Decrease 1.0%
Salary increase rate 80 (32) 67 (55)

100
26. Warrants
On 25 February 2019, the Company allotted warrants under Employee Stock Option Plan
(CCET-WC) to employees of the Group for 225,000,000 units. The details are as follows:
No. of securities offered: 225,000,000 units
No. of shares reserved for exercise: 225,000,000 shares
Term: 4 years from the issuance date of warrants
Offering date: 25 February 2019
Expiry date: 25 February 2023
Offering price: 0 Baht per unit
Exercise price: 2.16 Baht per share
Exercise ratio: 1 ordinary share per 1 warrant unless the exercise
ratio is adjusted under a rights adjustment.
Allotment method: This issuance of warrants under CCET-WC will be
offered directly to eligible employees of the Company
and/or its subsidiaries and in the amount as
determined by the Board of Directors and/or the
person(s) entrusted by the Board of Directors and the
determination will base on the position, role and
responsibilities, year of working with the Company
and/or its subsidiaries, experience, and contribution
in the future of the employees. The Board of Directors
and/or the person(s) entrusted by the Board of
Directors will determine any condition and/or other
details necessary for the pertinent to the issue and
offer newly issued shares including the approval from
any related agency, and any other acts necessary and
related to the issued warrants.
There are no employees allocated warrants more than
5% of the total issued warrants under CCET-WC.

101
Lock-up period: With respect to this issuance of warrants under
CCET-WC which will be allocated to employees at the
offering date, not exceeding 30% of the allocated
portion of the warrants shall be exercisable after 1
year of the issuance date, and total accumulated not
exceeding 60% allocated portion shall be exercisable
after 2 years of the issuance date, and total
accumulated 100% of the allocated portion shall be
exercisable after 3 years of the issuance date.
The Company will make a written agreement with all
allocated employees involving the lock-up period.
Exercise period: Subject to the lock-up period, the holders of
CCET-WC can exercise the rights to purchase
the newly issued ordinary shares of the Company
after one year period from the date of issuance of the
warrants and can exercise their right to purchase
the Company’s ordinary shares on the 10th of every
3 months which are 10th February, 10th May,
10th August, 10th November of each year until the
maturity of the warrants except the first exercise date
will be on 25 February 2020 and the last exercise date
will be at the maturity date of the warrants which will
be on 25 February 2023.
If the last exercise date is a holiday, the last business
day prior to the maturity date of the warrants shall be
the last exercise date.
The estimated fair value of each share option granted is Baht 0.24. This was calculated
using the Black-Scholes model. The model inputs were the share price at price
determination date of Baht 1.805, exercise price of Baht 2.16, expected volatility of 25.26%,
life of warrants of 4 years, and a risk-free interest rate of 1.83% - 1.99%.

102
As at 31 December 2020 and 2019, the Group has capital reserve for share-based payment
as follow:
(Unit: Thousand US Dollar) (Unit: Thousand Baht)
Consolidated and separate
financial statements
Consolidated and separate
financial statements
2020 2019 2020 2019
Capital reserve for share-based payment
transactions of the Company 4,623 4,032 148,275 129,697
Capital reserve for share-based payment
transactions of its subsidiaries 2,487 1,537 79,544 49,841
7,110 5,569 227,819 179,538
During the current year, the Group recorded expenses of the Employee Stock Option Plan
amounting to Baht 48 million (USD 1.5 million) (2019: Baht 22 million (USD 0.7 million))
(Separate financial statements: Baht 3 million (USD 0.1 million) (2019: Baht 4 million
(USD 0.1 million))) as personnel expenses.
As at 31 December 2020 and 2019, there is no warrants of the Company remained
unallocated.
27. Statutory reserve
Pursuant to Section 116 of the Public Limited Companies Act B.E. 2535, the Company is
required to set aside a statutory reserve at least 5 percent of its net profit after deducting
accumulated deficit brought forward (if any), until the reserve reaches 10 percent of
the registered capital. The statutory reserve is not available for dividend distribution.
At present, the statutory reserve has fully been set aside.
28. Revenue to be recognised for the remaining performance obligations
As at 31 December 2019, revenue totaling to Baht 18 million (USD 0.6 million) is expected
to be recognised in the future in respect of performance obligations under contracts with
customer that are unsatisfied (2020: None). The Group expects to satisfy these
performance obligations within 1 year.

103
29. Finance cost
(Unit: Thousand US Dollar) (Unit: Thousand Baht)
Consolidated
financial statements
Consolidated
financial statements
2020 2019 2020 2019
Interest expenses on borrowings 15,183 21,982 476,855 681,037
Interest expenses on lease liabilities 683 - 21,316 -
Bank charges and others 4,643 7,284 145,178 226,154
Total 20,509 29,266 643,349 907,191
(Unit: Thousand US Dollar) (Unit: Thousand Baht)
Separate
financial statements
Separate
financial statements
2020 2019 2020 2019
Interest expenses on borrowings 7,828 11,367 245,608 352,521
Interest expenses on lease liabilities 4 - 122 -
Bank charges and others 1,003 1,060 31,382 32,810
Total 8,835 12,427 277,112 385,331
30. Expenses by nature
Significant expenses classified by nature are as follows:
(Unit: Thousand US Dollar) (Unit: Thousand Baht)
Consolidated
financial statements*
Consolidated
financial statements*
2020 2019 2020 2019
Salaries and wages and other
employee benefits 298,931 242,767 9,356,543 7,514,173
Depreciation 78,446 71,947 2,457,548 2,227,688
Amortisation expenses 665 727 20,884 22,513
Impairment loss on non-financial assets 362 - 11,476 -
Exchange loss 14,483 7,040 462,153 216,253
Raw materials and consumables used 2,927,654 2,967,211 91,513,853 91,849,180
Changes in inventories of finished goods
and work in process 9,706 (4,954) 348,746 (119,773)
* Expenses before elimination from the consolidated financial statements

104
(Unit: Thousand US Dollar) (Unit: Thousand Baht)
Separate
financial statements
Separate
financial statements
2020 2019 2020 2019
Salaries and wages and other
employee benefits 95,617 94,207 2,991,502 2,915,381
Depreciation 43,845 41,637 1,373,673 1,289,240
Exchange loss 226 6,859 4,858 213,410
Raw materials and consumables used 2,073,407 2,293,172 64,851,654 71,007,758
Changes in inventories of finished goods
and work in process 9,466 (4,918) 339,467 (118,385)
31. Income tax/deferred tax assets (liabilities)
Income tax is provided in the accounts at the amount expected to be paid to the taxation
authorities, based on the taxable profits from the non-promoted activities determined in
accordance with tax legislation. Income tax of the overseas subsidiaries is provided for in
the accounts based on the taxable profits determined in accordance with tax legislation of
their countries.
Income tax expenses for the years ended 31 December 2020 and 2019 are made up as
follows:
(Unit: Thousand US Dollar) (Unit: Thousand Baht)
Consolidated
financial statements
Consolidated
financial statements
2020 2019 2020 2019
Current income tax:
Current income tax charge 9,242 4,944 286,351 154,334
Deferred tax:
Relating to origination and reversal of
temporary differences (487) (983) (14,923) (30,459)
Income tax expenses reported in profit or loss 8,755 3,961 271,428 123,875

105
(Unit: Thousand US Dollar) (Unit: Thousand Baht)
Separate
financial statements
Separate
financial statements
2020 2019 2020 2019
Current income tax:
Current income tax charge 1,309 517 41,366 16,001
Deferred tax:
Relating to origination and reversal of
temporary differences (392) 83 (11,900) 2,791
Income tax expenses reported in profit or loss 917 600 29,466 18,792
The amounts of income tax relating to each component of other comprehensive income for
the years ended 31 December 2020 and 2019 are as follows:
(Unit: Thousand US Dollar) (Unit: Thousand Baht)
Consolidated
financial statements
Consolidated
financial statements
2020 2019 2020 2019
Deferred tax on gain from the change
in value of available-for-sale investments - (3) - (56)
Deferred tax on gain from the change
in value of financial assets measured at FVOCI (32) - (943) -
Deferred tax on actuarial (gain) loss (104) 125 (3,158) 3,739
Total (136) 122 (4,101) 3,683
(Unit: Thousand US Dollar) (Unit: Thousand Baht)
Separate
financial statements
Separate
financial statements
2020 2019 2020 2019
Deferred tax on gain from the change
in value of available-for-sale investments - (3) - (56)
Deferred tax on gain from the change
in value of financial assets measured at FVOCI (32) - (943) -
Deferred tax on actuarial (gain) loss (104) 125 (3,158) 3,739
Total (136) 122 (4,101) 3,683
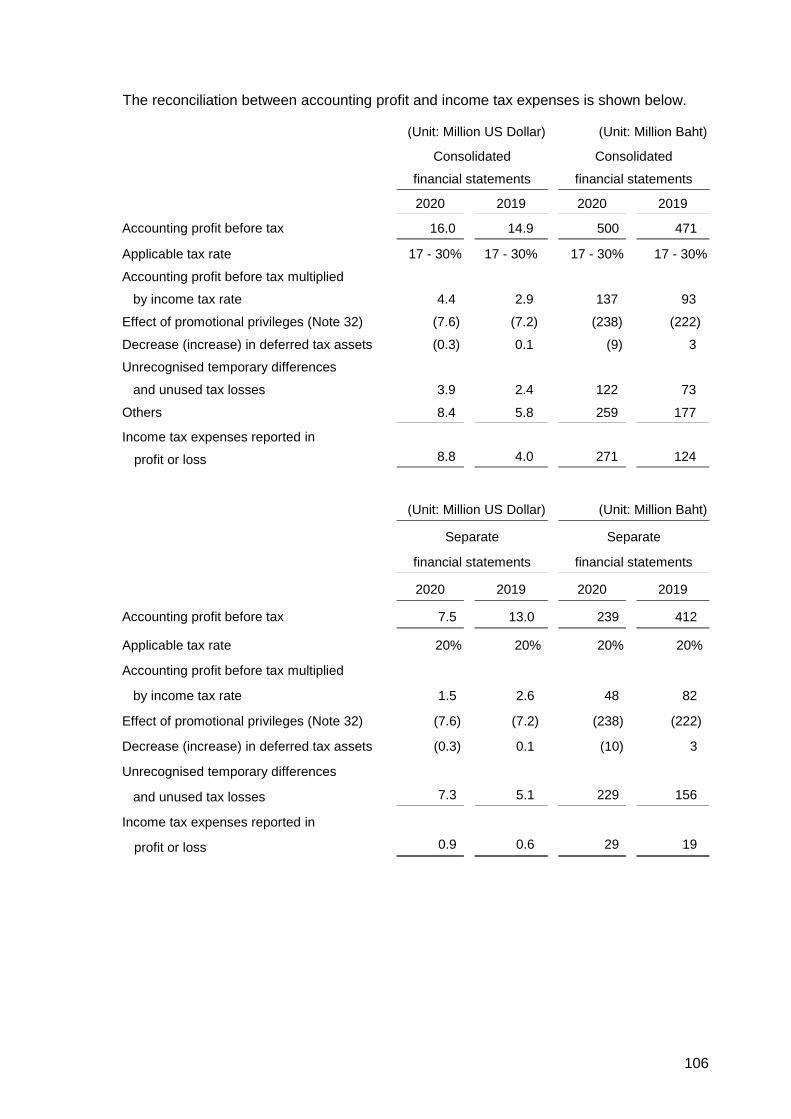
106
The reconciliation between accounting profit and income tax expenses is shown below.
(Unit: Million US Dollar) (Unit: Million Baht)
Consolidated
financial statements
Consolidated
financial statements
2020 2019 2020 2019
Accounting profit before tax 16.0 14.9 500 471
Applicable tax rate 17 - 30% 17 - 30% 17 - 30% 17 - 30%
Accounting profit before tax multiplied
by income tax rate 4.4 2.9 137 93
Effect of promotional privileges (Note 32) (7.6) (7.2) (238) (222)
Decrease (increase) in deferred tax assets (0.3) 0.1 (9) 3
Unrecognised temporary differences
and unused tax losses 3.9 2.4 122 73
Others 8.4 5.8 259 177
Income tax expenses reported in
profit or loss 8.8 4.0 271 124
(Unit: Million US Dollar) (Unit: Million Baht)
Separate
financial statements
Separate
financial statements
2020 2019 2020 2019
Accounting profit before tax 7.5 13.0 239 412
Applicable tax rate 20% 20% 20% 20%
Accounting profit before tax multiplied
by income tax rate 1.5 2.6 48 82
Effect of promotional privileges (Note 32) (7.6) (7.2) (238) (222)
Decrease (increase) in deferred tax assets (0.3) 0.1 (10) 3
Unrecognised temporary differences
and unused tax losses 7.3 5.1 229 156
Income tax expenses reported in
profit or loss 0.9 0.6 29 19

107
The components of deferred tax assets and deferred tax liabilities are as follows:
(Unit: Thousand US Dollar) (Unit: Thousand Baht)
Consolidated
financial statements
Consolidated
financial statements
2020 2019 2020 2019
Deferred tax assets
Allowance for expected credit losses 146 47 4,386 1,413
(2019: Allowance for doubtful accounts)
Allowance for diminution in value of
inventories 199 16 5,972 482
Unrealised fair value loss on investments 18 50 542 1,522
Unrealised loss on exchange 39 121 1,175 3,655
Accumulated depreciation
- Machinery 422 367 12,660 11,055
Provision for long-term
employee benefits 376 207 11,281 6,238
Unused tax losses 2,387 2,362 71,707 71,236
Others 640 476 19,246 14,327
Total 4,227 3,646 126,969 109,928
Deferred tax liabilities
Actuarial gains 405 259 12,153 7,803
Unrealised gain on exchange 65 93 1,967 2,800
Others 112 - 3,350 -
Total 582 352 17,470 10,603
(Unit: Thousand US Dollar) (Unit: Thousand Baht)
Separate
financial statements
Separate
financial statements
2020 2019 2020 2019
Deferred tax assets
Allowance for expected credit losses 146 47 4,386 1,413
(2019: Allowance for doubtful accounts)
Unrealised fair value loss on investments 18 50 542 1,522
Accumulated depreciation
- Machinery 92 36 2,757 1,094
Provision for long-term
employee benefits 363 141 10,923 4,245
Others - 13 - 369
Total 619 287 18,608 8,643

108
As at 31 December 2020, the Group has deductible temporary differences and unused tax
losses totaling Baht 7,369 million (USD 245 million) (Separate financial statements:
Baht 4,449 million (USD 148 million)) (2019: Baht 7,709 million (USD 256 million) (Separate
financial statements: Baht 5,015 (USD 166 million))), on which deferred tax assets have not
been recognised as the Group believes future taxable profits may not be sufficient to allow
utilisation of the temporary differences and unused tax losses.
Details of expiry date of unused tax losses are summarised as below:
(Unit: Thousand US Dollar) (Unit: Thousand Baht)
Consolidated
financial statements
Consolidated
financial statements
2020 2019 2020 2019
31 December 2020 - 3,804 - 114,707
31 December 2021 8,066 7,571 242,275 228,281
31 December 2022 2,660 2,512 79,892 75,757
31 December 2023 1,974 1,799 59,278 54,246
31 December 2024 1,984 5,005 59,596 150,911
31 December 2025 19,447 - 584,120 -
31 December 2031 4,311 4,311 129,493 129,997
31 December 2032 7,082 7,082 212,731 213,558
31 December 2033 10,325 10,325 310,134 331,341
31 December 2034 9,857 9,857 296,076 297,228
31 December 2035 10 10 303 304
31 December 2036 7 7 195 196
31 December 2037 8,978 8,978 269,687 270,737
31 December 2038 3,378 3,378 101,455 101,849
Total 78,079 64,639 2,345,235 1,969,112
In addition, its subsidiaries in Brazil and Singapore have unused tax losses with no expiry
date amounting to Baht 453 million (USD 15 million) (2019: Baht 745 million (USD 25
million)). These subsidiaries are able to utilise the tax losses until they are fully utilised.
As at 31 December 2020, the total amount of temporary difference associated with
investments in subsidiaries and associate for which deferred tax liabilities have not been
recognised, is Baht 3,856 million (USD 128 million) (2019: Baht 3,132 million (USD 104
million)).

109
32. Promotional privileges
The Company has received promotional privileges from the Board of Investment, for the
manufacture of electronics and electronics equipment. Under certain significant conditions,
the significant privileges of the Company are summarised as follows:
Details
1. Certificate No. 1701(2)/2554 60-0577-0-00-1-0 60-0584-0-00-1-0
2. The significant privileges are
2.1 Exemption of corporate income tax for profit from
promotional privileges and exemption of income tax
on dividends paid from the income of the operations
throughout the period in which the corporate income
tax is exempted.
8 years 5 years 8 years
2.2 Exemption of import duty on machinery as approved
by the board.
Granted Granted Granted
2.3 Exemption of import duty on raw materials and
significant supplies used in export production for a
period of (year) from the first import date.
Granted
(1 year)
Granted
(1 year)
Granted
(5 years)
2.4 A fifty percent reduction of the normal rate of
corporate income tax on profit derived from the
promoted activity for a period of five years after the
expiration of the above corporate income tax
exemption period.
Non-granted Non-granted Non-granted
2.5 Permission to double deduct the costs of
transportation, electricity and water supply for a
period of ten years, commencing as from the date of
first earning operating income.
Non-granted Non-granted Non-granted
3. Date of first earning operating income 1 Jul 2014 3 Jan 2018 2 Jan 2020

110
The Company’s operating revenues for the years ended 31 December 2020 and 2019,
divided between promoted and non-promoted operations, are summarised below.
(Unit: Million US Dollar)
Non-promoted
Promoted operations operations Total
2020 2019 2020 2019 2020 2019
Sales
Domestic sales 51 57 1 1 52 58
Export sales 1,832 2,281 395 166 2,227 2,447
Total sales 1,883 2,338 396 167 2,279 2,505
(Unit: Million Baht)
Non-promoted
Promoted operations operations Total
2020 2019 2020 2019 2020 2019
Sales
Domestic sales 1,590 1,775 23 23 1,613 1,798
Export sales 57,610 70,653 12,066 5,107 69,676 75,760
Total sales 59,200 72,428 12,089 5,130 71,289 77,558
33. Earnings per share
Basic earnings per share is calculated by dividing profit for the year attributable to equity
holders of the Company (excluding other comprehensive income) by the weighted average
number of ordinary shares in issue during the year.
Diluted earnings per share is calculated by dividing profit for the year attributable to equity
holders of the Company (excluding other comprehensive income) by the weighted average
number of ordinary shares in issue during the year plus the weighted average number of
ordinary shares which would need to be issued to convert all dilutive potential ordinary
shares into ordinary shares. The calculation assumes that the conversion took place either
at the beginning of the year or on the date the potential ordinary shares were issued.

111
The following tables set forth the computation of basic and diluted earnings per share:
Consolidated and separate financial statements
Profit for the year
Weighted average
number of ordinary shares Earnings per share
2020 2019 2020 2019 2020 2019
(Thousand (Thousand (Thousand (Thousand (US Dollar) (US Dollar)
US Dollar) US Dollar) shares) shares)
Basic earnings per shares
Profit attributable to equity holders
of the Company 6,621 12,433 4,554,644 4,554,644 0.0015 0.0027
Effect of dilutive potential ordinary shares
Warrants - - - -
Diluted earnings per shares
Profit attributable to ordinary
shareholders assuming
the conversion of warrants to
ordinary shares 6,621 12,433 4,554,644 4,554,644 0.0015 0.0027
Consolidated and separate financial statements
Profit for the year
Weighted average
number of ordinary shares Earnings per share
2020 2019 2020 2019 2020 2019
(Thousand (Thousand (Thousand (Thousand (Baht) (Baht)
Baht) Baht) shares) shares)
Basic earnings per shares
Profit attributable to equity holders
of the Company 209,607 392,799 4,554,644 4,554,644 0.05 0.09
Effect of dilutive potential ordinary shares
Warrants - - - -
Diluted earnings per shares
Profit attributable to ordinary
shareholders assuming
the conversion of warrants to
ordinary shares 209,607 392,799 4,554,644 4,554,644 0.05 0.09
No calculation of diluted earnings per share for the years ended 31 December 2020 and
2019 were required for warrant since the exercise price and the fair value of the warrant
were higher than the average market price of the Company’s ordinary shares.

112
34. Segment information
Operating segment information is reported in a manner consistent with the internal reports
that are regularly reviewed by the chief operating decision maker in order to make decisions
about the allocate of resources to the segment and assess its performance.
For management purposes, the Group is organised into business units based on its
products and service and have three reportable segments which are computer peripheral,
telecommunication products and service income.
No operating segment have been aggregated to form the above reportable operating
segments.
The chief operating decision maker monitors the operating results of the business units
separately for the purpose of making decisions about resource allocation and assessing
performance. Segment performance is measured based on operating profit or loss
on a basis consistent with that used to measure operating profit or loss in the financial
statements.
The basis of accounting for any transactions between reportable segment is consistent with
that for third party transactions.
The following tables present revenue and profit information regarding the Group’s operating
segments for the years ended 31 December 2020 and 2019, respectively.
(Unit: Million US Dollar)
For the year ended 31 December 2020
Computer
peripheral
Telecommunication
products
Service
income
Total
reportable
segments Eliminations
Consolidated
financial
statements
Revenues
Revenues from external customers 2,429 766 4 3,199 - 3,199
Inter-segment revenues 1,441 55 80 1,576 (1,434) 142
Total revenues from contracts
with customers
3,870 821 84 4,775
(1,434) 3,341
Segment profit 122 24 3 149 - 149
Finance income 2
Other income 12
Reduce cost of inventories to net realisable value 14
Depreciation and amortisation (9)
Administrative expenses (130)
Share of loss from investments in associates (1)
Finance cost (21)
Profit before income tax expenses 16
Income tax expenses (9)
Profit for the year 7

113
(Unit: Million Baht)
For the year ended 31 December 2020
Computer
peripheral
Telecommunication
products
Service
income
Total
reportable
segments Eliminations
Consolidated
financial
statements
Revenues
Revenues from external customers 75,920 23,947 137 100,004 - 100,004
Inter-segment revenues 44,969 1,730 2,491 49,190 (44,748) 4,442
Total revenues from contracts
with customers
120,889 25,677 2,628 149,194 (44,748) 104,446
Segment profit 3,832 734 88 4,654 - 4,654
Finance income 60
Other income 375
Reduce cost of inventories to net realisable value 423
Depreciation and amortisation (295)
Administrative expenses (4,045)
Share of loss from investments in associates (29)
Finance cost (643)
Profit before income tax expenses 500
Income tax expenses (271)
Profit for the year 229
(Unit: Million US Dollar)
For the year ended 31 December 2019
Computer
peripheral
Telecommunication
products
Service
income
Total
reportable
segments Eliminations
Consolidated
financial
statements
Revenues
Revenues from external customers 2,144 993 4 3,141 - 3,141
Inter-segment revenues 1,151 87 70 1,308 (1,136) 172
Total revenues from contracts
with customers
3,295 1,080
74 4,449
(1,136) 3,313
Segment profit 132 30 3 165 - 165
Finance income 4
Other income 4
Reduce cost of inventories to net realisable value (3)
Depreciation and amortisation (7)
Administrative expenses (118)
Share of loss from investments in associates (1)
Finance cost (29)
Profit before income tax expenses 15
Income tax expenses (4)
Profit for the year 11

114
(Unit: Million Baht)
For the year ended 31 December 2019
Computer
peripheral
Telecommunication
products
Service
income
Total
reportable
segments Eliminations
Consolidated
financial
statements
Revenues
Revenues from external customers 66,296 30,904 125 97,325 - 97,325
Inter-segment revenues 35,663 2,686 2,174 40,523 (35,229) 5,294
Total revenues from contracts
with customers
101,959 33,590
2,299 137,848
(35,229) 102,619
Segment profit 4,095 936 84 5,115 - 5,115
Finance income 133
Other income 132
Reduce cost of inventories to net realisable value (82)
Depreciation and amortisation (222)
Administrative expenses (3,679)
Share of loss from investments in associates (18)
Finance cost (907)
Profit before income tax expenses 472
Income tax expenses (124)
Profit for the year 348
Geographic information
Revenue from external customers is based on locations of the Group which are
summarised as follow:
(Unit: Million US Dollar) (Unit: Million Baht)
2020 2019 2020 2019
Revenue from external customers
Thailand 1,579 1,788 49,433 55,371
British Virgin Island 1,124 872 35,113 27,007
The People’s Republic of China 12 12 380 385
Brazil 315 241 9,816 7,459
Philippines 96 83 2,998 2,565
United States of America 191 214 6,013 6,637
Others 24 103 693 3,195
Total 3,341 3,313 104,446 102,619

115
(Unit: Million US Dollar) (Unit: Million Baht)
2020 2019 2020 2019
Non-current assets (other than
financial instruments, deferred tax
assets and net defined benefit assets)
Thailand 359 359 10,786 10,838
The People’s Republic of China 75 72 2,238 2,173
Brazil 30 32 890 970
Philippines 60 55 1,793 1,665
United States of America 13 15 398 449
Others 44 30 1,352 891
Total 581 563 17,457 16,986
Major customers
For the year 2020, the Group has revenue from four major customers in amount of Baht
33,845 million (USD 1,080 million), Baht 13,463 million (USD 430 million), Baht 12,173
million (USD 388 million) and Baht 9,866 million (USD 315 million) (2019: from four major
customers in amount of Baht 25,423 million (USD 821 million), Baht 14,631 million (USD
473 million), Baht 10,685 million (USD 345 million) and Baht 9,766 million (USD 315
million)), arising from sales by the computer peripheral and telecommunication products
segments.
35. Provident fund
The Company and its employees have jointly established a provident fund in accordance
with the Provident Fund Act B.E. 2530. Both employees and the Company contribute to the
fund monthly, at the rate of 2 percent of basic salary. The fund, which is managed by TISCO
Securities Company Limited, will be paid to employees upon termination in accordance with
the fund rules. The contributions for the year 2020 amounting to Baht 3 million (USD 0.1
million) (2019: Baht 3 million (USD 0.1 million)) were recognised as expense.

116
36. Dividend payment
Dividend Approved by
Total
dividends
Dividend
per share
(Million Baht) (Baht)
Final dividends for 2018 Annual General Meeting
of the shareholders on
26 April 2019
137
0.03
Interim dividends for 2019 Board of Directors’ Meeting
on 12 August 2019 273 0.06
Total for 2019 410 0.09
Interim dividends for 2019 Board of Directors’ Meeting
on 17 April 2020
137
0.03
Interim dividends for 2020 Board of Directors’ Meeting
on 13 August 2020 91 0.02
Total for 2020 228 0.05
On 3 August 2020, the 2020 Annual General Meeting of the Company’s shareholders
acknowledged the above interim dividend for 2019, which were paid from the operating
results from 1 July 2019 to 31 December 2019 and approved no additional dividend
payment for the year 2019.
37. Commitments and contingent liabilities
37.1 Capital commitments
As at 31 December 2020, the Group had capital commitments of Baht 68 million,
USD 11 million, JPY 7 million and CNY 117 million (Separate financial statements:
Baht 67 million, USD 1 million and JPY 7 million), relating to the construction of
factory buildings and acquisition of machinery (2019: Baht 107 million, USD 21 million,
JPY 1 million, CNY 266 million and PHP 26 million (Separate financial statements:
Baht 107 million and JPY 1 million)).
37.2 Lease and other service commitments
As at 31 December 2020 and 2019, the Group has future lease payments required under
these non-cancellable leases contracts and other service agreements that have not yet
commence as follows:
(Unit: Million US Dollar) (Unit: Million Baht)
Consolidated
financial statements
Consolidated
financial statements
2020 2019 2020 2019
Payable
In up to 1 year 2.1 6.4 64 193
In over 1 to 5 years - 6.1 1 184

117
(Unit: Million US Dollar) (Unit: Million Baht)
Separate
financial statements
Separate
financial statements
2020 2019 2020 2019
Payable
In up to 1 year 0.6 0.7 19 21
In over 1 to 5 years - 0.1 - 4
In 2020, the Group adopted the TFRS 16 as at 1 January 2020. Therefore, the Group
recognised the lease liabilities previously classified as operating lease at the present value
of the remaining lease payments, discounted using the incremental borrowing rate, as
described in Note 4.2.
37.3 Other commitments
As at 31 December 2020, the Company had outstanding commitment of TWD 443 million,
MYR 22 million and INR 133 million in respect of uncalled portion of investments in
four subsidiaries (2019: TWD 443 million, MYR 22 million and INR 104 million).
37.4 Agreements for hire of production of molds
As at 31 December 2020, the Company had outstanding commitments of Baht 2 million and
USD 2 million with suppliers in respect of agreements for hire of production of molds
(2019: Baht 3 million and USD 4 million).
37.5 Guarantees
As at 31 December 2020, the Group had outstanding bank guarantees of Baht 1,035 million,
CNY 24 million, MYR 1 million and BRL 13 million (Separate financial statements: Baht
1,030 million) (2019: Baht 813 million, MYR 1 million and BRL 13 million (Separate financial
statements: Baht 808 million)) issued by the banks on behalf of the Group in respect of
certain performance bonds as required in the normal course of business.

118
38. Fair value hierarchy
As at 31 December 2020 and 2019, the Group had the assets and liabilities that were
measured at fair value using different levels of inputs as follows:
(Unit: Thousand US Dollar)
Consolidated financial statements
As at 31 December 2020
Level 1 Level 2 Level 3 Total
Assets measured at fair value
Financial assets measured at FVTPL
Structured deposits - 2,315 - 2,315
Debt investment - - 950 950
Financial assets measured at FVOCI
Equity investments 652 - 5,182 5,834
Derivatives
Foreign currency forward contracts - 662 - 662
Liabilities measured at fair value
Derivatives
Foreign currency forward contracts - 1,833 - 1,833
(Unit: Thousand Baht)
Consolidated financial statements
As at 31 December 2020
Level 1 Level 2 Level 3 Total
Assets measured at fair value
Financial assets measured at FVTPL
Structured deposits - 69,523 - 69,523
Debt investment - - 28,535 28,535
Financial assets measured at FVOCI
Equity investments 19,564 - 155,680 175,244
Derivatives
Foreign currency forward contracts - 19,902 - 19,902
Liabilities measured at fair value
Derivatives
Foreign currency forward contracts - 55,067 - 55,067
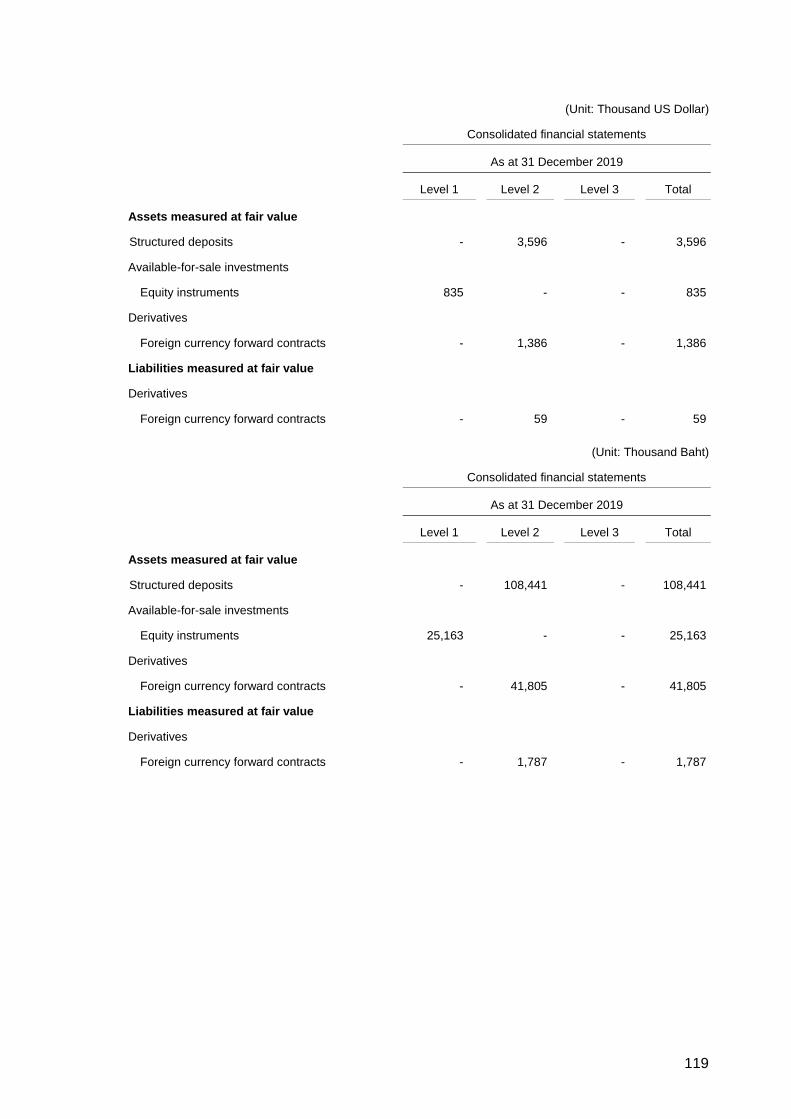
119
(Unit: Thousand US Dollar)
Consolidated financial statements
As at 31 December 2019
Level 1 Level 2 Level 3 Total
Assets measured at fair value
Structured deposits - 3,596 - 3,596
Available-for-sale investments
Equity instruments 835 - - 835
Derivatives
Foreign currency forward contracts - 1,386 - 1,386
Liabilities measured at fair value
Derivatives
Foreign currency forward contracts - 59 - 59
(Unit: Thousand Baht)
Consolidated financial statements
As at 31 December 2019
Level 1 Level 2 Level 3 Total
Assets measured at fair value
Structured deposits - 108,441 - 108,441
Available-for-sale investments
Equity instruments 25,163 - - 25,163
Derivatives
Foreign currency forward contracts - 41,805 - 41,805
Liabilities measured at fair value
Derivatives
Foreign currency forward contracts - 1,787 - 1,787

120
(Unit: Thousand US Dollar)
Separate financial statements
As at 31 December 2020
Level 1 Level 2 Level 3 Total
Assets measured at fair value
Financial assets measured at FVOCI
Equity investments 652 - 5,147 5,799
(Unit: Thousand Baht)
Separate financial statements
As at 31 December 2020
Level 1 Level 2 Level 3 Total
Assets measured at fair value
Financial assets measured at FVOCI
Equity investments 19,564 - 154,626 174,190
(Unit: Thousand US Dollar)
Separate financial statements
As at 31 December 2019
Level 1 Level 2 Level 3 Total
Assets measured at fair value
Available-for-sale investments
Equity instruments 835 - - 835
Liabilities measured at fair value
Derivatives
Foreign currency forward contracts - 32 - 32
(Unit: Thousand Baht)
Separate financial statements
As at 31 December 2019
Level 1 Level 2 Level 3 Total
Assets measured at fair value
Available-for-sale investments
Equity instruments 25,163 - - 25,163
Liabilities measured at fair value
Derivatives
Foreign currency forward contracts - 950 - 950

121
Valuation techniques and inputs to Level 2 and 3 valuation
a) The fair value of debt security and equity securities are based on generally accepted
pricing models.
b) The fair value of structured deposits and derivatives has been determined by using
a discounted future cash flow model and a valuation model technique. Most of the inputs
used for the valuation are observable in the relevant market, such as spot rates of
foreign currencies, yield curves of the respective currencies, interest rate yield curves
and commodity price yield curves.
39. Financial instruments
39.1 Financial risk management objectives and policies
The Group’s financial instruments principally comprise cash and cash equivalents, trade and
other receivable, loans, investments, and short-term and long-term loans. The financial risks
associated with these financial instruments and how they are managed is described below.
Credit risk
The Group is exposed to credit risk primarily with respect to trade and other receivable,
loans, deposits with banks and financial institutions and other financial instruments. Except
for derivatives, the maximum exposure to credit risk is limited to the carrying amounts as
stated in the statement of financial position. The Group’s maximum exposure relating to
derivatives is noted in the liquidity risk topic.
Trade and other receivables
The Group manages the risk by adopting appropriate credit control policies and procedures
and therefore does not expect to incur material financial losses. Outstanding trade and other
receivables are regularly monitored and any shipments to major customers are generally
covered by letters of credit.
An impairment analysis is performed at each reporting date to measure expected credit
losses. The provision rates are based on days past due for groupings of various customer
segments with similar credit risks. The calculation reflects the reasonable and supportable
information that is available at the reporting date about past events, current conditions and
forecasts of future economic conditions. Generally, trade and other receivables are written-
off in accordance with the Group’s policy.

122
Financial instruments and cash deposits
The Group manages the credit risk from balances with banks and financial institutions by
making investments only with approved counterparties and within credit limits assigned to
each counterparty. Counterparty credit limits may be updated throughout the year. The limits
are set to minimise the concentration of risks and therefore mitigate financial loss through
a counterparty’s potential failure to make payments.
Market risk
There are two types of market risk comprising interest rate risk and currency risk. The Group
enters into foreign exchange forward contracts to hedge the foreign currency risk arising on
the export or import of goods.
Foreign currency risk
The Group’s exposure to the foreign currency risk relates primarily to its trading transactions
that are denominated in foreign currencies. The Group seeks to reduce this risk by entering
into foreign exchange forward contracts when it considers appropriate. Generally, the foreign
exchange forward contracts mature within three months.
As at 31 December 2020 and 2019, the Group had the balances of financial assets
and liabilities denominated in foreign currencies as follows.
As at 31 December 2020 Average exchange rate
Foreign currency Financial assets Financial liabilities as at 31 December 2020
(Million) (Million)
Baht 1,265 2,819 0.033 USD per 1 Baht
US Dollar 18 132 6.525 CNY per 1 USD
US Dollar 2 - 28.480 TWD per 1 USD
US Dollar 3 87 5.196 BRL per 1 USD
US Dollar 3 - 4.017 MYR per 1 USD
As at 31 December 2019 Average exchange rate
Foreign currency Financial assets Financial liabilities as at 31 December 2019
(Million) (Million)
Baht 1,095 2,730 0.033 USD per 1 Baht
US Dollar 11 17 6.976 CNY per 1 USD
US Dollar 3 59 4.030 BRL per 1 USD
US Dollar 1 - 4.093 MYR per 1 USD

123
Foreign currency sensitivity
The following tables demonstrate the sensitivity of the Group’s profit before tax to a reasonably
possible change in Baht and US Dollar exchange rates, with all other variables held constant.
The impact on the Group’s profit before tax is due to changes in the fair value of monetary assets
and liabilities including non-designated foreign currency derivatives as at 31 December 2020.
The Group’s exposure to foreign currency changes for all other currencies is not material.
Currency Change in FX rate
Effect on profit
before tax
Effect on profit
before tax
(%) (Million US Dollar) (Million Baht)
Baht +4 (2) (65)
Baht -4 2 65
US Dollar +4 (8) (251)
US Dollar -4 8 251
The information is not a forecast or prediction of future market conditions and should be used
with care.
Interest rate risk
The Group’s exposure to interest rate risk relates primarily to its long-term borrowings. Most
of the Group‘s financial assets and liabilities bear floating interest rates or fixed interest rates
which are close to the market rate.
As at 31 December 2020 and 2019, significant financial assets and liabilities classified by
type of interest rate are summarised in the table below, with those financial assets and
liabilities that carry fixed interest rates further classified based on the maturity date, or the
repricing date if this occurs before the maturity date.
(Unit: Million US Dollar)
As at 31 December 2020
Consolidated financial statements
Fixed interest rates Non-
Within Over Floating interest Interest
1 year 1 - 5 years 5 years interest rate bearing Total rate
(% per annum)
Financial assets
Cash and cash equivalents 47.2 - - 119.3 0.1 166.6 0.01 - 2.80
Fixed deposits 3.2 - - - - 3.2 3.00
Structured deposits - - - 2.3 - 2.3 3.00
Trade and other receivables - - - - 736.9 736.9 -
Receivable - molds - - - - 5.4 5.4 -
Grant receivable - Government - - - - 62.7 62.7 -
Restricted bank deposits - - - 0.4 - 0.4 0.02 - 2.00
Investment in debt instrument 1.0 - - - - 1.0 4.00
Investments in equity instruments - - - - 5.8 5.8 -
Long-term loans to related parties - 6.9 - - - 6.9 2.05, 2.95
51.4 6.9 - 122.0 810.9 991.2

124
(Unit: Million US Dollar)
As at 31 December 2020
Consolidated financial statements
Fixed interest rates Non-
Within Over Floating interest Interest
1 year 1 - 5 years 5 years interest rate bearing Total rate
(% per annum)
Financial liabilities
Short-term loans from
financial institutions 471.9 - - - - 471.9
0.80 - 4.20
Trade and other payables - - - - 868.0 868.0 -
Lease liabilities 5.6 12.8 0.9 - - 19.3 1.35 - 4.30
Long-term loans -
-
-
172.8
-
172.8
1.4 + 3 month
LIBOR rate
477.5 12.8 0.9 172.8 868.0 1,532.0
(Unit: Million Baht)
As at 31 December 2020
Consolidated financial statements
Fixed interest rates Non-
Within Over Floating interest Interest
1 year 1 - 5 years 5 years interest rate bearing Total rate
(% per annum)
Financial assets
Cash and cash equivalents 1,419 - - 3,582 3 5,004 0.01 - 2.80
Fixed deposits 96 - - - - 96 3.00
Structured deposits - - - 70 - 70 3.00
Trade and other receivables - - - - 22,134 22,134 -
Receivable - molds - - - - 161 161 -
Grant receivable - Government - - - - 1,882 1,882 -
Restricted bank deposits - - - 11 - 11 0.02 - 2.00
Investment in debt instrument 29 - - - - 29 4.00
Investments in equity instruments - - - - 175 175 -
Long-term loans to related parties - 207 - - - 207 2.05, 2.95
1,544 207 - 3,663 24,355 29,769
Financial liabilities
Short-term loans from
financial institutions
14,174 - -
-
- 14,174
0.80 - 4.20
Trade and other payables - - - - 26,074 26,074 -
Lease liabilities 167 385 28 - - 580 1.35 - 4.30
Long-term loans -
-
-
5,190
-
5,190
1.4 + 3 month
LIBOR rate
14,341 385 28 5,190 26,074 46,018

125
(Unit: Million US Dollar)
As at 31 December 2019
Consolidated financial statements
Fixed interest rates Non-
Within Floating interest Interest
1 year 1 - 5 years interest rate bearing Total rate
(% per annum)
Financial assets
Cash and cash equivalents 45.4 - 92.7 0.1 138.2 0.10 - 5.00
Fixed deposits 6.1 - - - 6.1 2.60 - 3.50
Structured deposits - - 3.6 - 3.6 3.40 - 3.80
Trade and other receivables - - - 605.3 605.3 -
Receivable - molds - - - 4.9 4.9 -
Grant receivable - Government - - - 13.1 13.1 -
Restricted bank deposits - - 0.5 - 0.5 0.10 - 5.00
Other long-term investments - - - 16.7 16.7 -
Long-term loans to related parties - 6.5 - - 6.5 2.05, 2.95
51.5 6.5 96.8 640.1 794.9
Financial liabilities
Short-term loans from financial institutions 356.9 - - - 356.9 1.60 - 3.80
Trade and other payables - - - 649.3 649.3 -
Long-term loans - - 221.0 - 221.0 1.40 + 3 month
LIBOR rate,
3.20 - 3.40
356.9 - 221.0 649.3 1,227.2
(Unit: Million Baht)
As at 31 December 2019
Consolidated financial statements
Fixed interest rates Non-
Within Floating interest Interest
1 year 1 - 5 years interest rate bearing Total rate
(% per annum)
Financial assets
Cash and cash equivalents 1,370 - 2,794 4 4,168 0.10 - 5.00
Fixed deposits 183 - - - 183 2.60 - 3.50
Structured deposits - - 108 - 108 3.40 - 3.80
Trade and other receivables - - - 18,253 18,253 -
Receivable - molds - - - 148 148 -
Grant receivable - Government - - - 396 396 -
Restricted bank deposits - - 15 - 15 0.10 - 5.00
Other long-term investments - - - 503 503 -
Long-term loans to related parties - 195 - - 195 2.05, 2.95
1,553 195 2,917 19,304 23,969
Financial liabilities
Short-term loans from financial institutions 10,762 - - - 10,762 1.60 - 3.80
Trade and other payables - - - 19,579 19,579 -
Long-term loans - - 6,664 - 6,664 1.40 + 3 month
LIBOR rate,
3.20 - 3.40
10,762 - 6,664 19,579 37,005

126
(Unit: Million US Dollar)
As at 31 December 2020
Separate financial statements
Fixed interest rates Non-
Within Floating interest Interest
1 year 1 - 5 years interest rate bearing Total rate
(% per annum)
Financial assets
Cash and cash equivalents 3.6 - 7.1 - 10.7 0.13 - 0.25
Trade and other receivables - - - 616.3 616.3 -
Receivable - molds - - - 3.6 3.6 -
Investments in equity instruments - - - 5.8 5.8 -
Long-term loans to related parties - 7.5 - - 7.5 2.50
3.6 7.5 7.1 625.7 643.9
Financial liabilities
Short-term loans from
financial institutions 322.5 - - - 322.5 1.68 - 1.98
Trade and other payables - - - 519.4 519.4 -
Lease liabilities 0.1 0.1 - - 0.2 2.16
322.6 0.1 - 519.4 842.1
(Unit: Million Baht)
As at 31 December 2020
Separate financial statements
Fixed interest rates Non-
Within Floating interest Interest
1 year 1 - 5 years interest rate bearing Total rate
(% per annum)
Financial assets
Cash and cash equivalents 107 - 215 - 322 0.13 - 0.25
Trade and other receivables - - - 18,511 18,511 -
Receivable - molds - - - 109 109 -
Investments in equity instruments - - - 174 174 -
Long-term loans to related parties - 224 - - 224 2.50
107 224 215 18,794 19,340
Financial liabilities
Short-term loans from
financial institutions 9,687 - - - 9,687 1.68 - 1.98
Trade and other payables - - - 15,601 15,601 -
Lease liabilities 3 2 - - 5 2.16
9,690 2 - 15,601 25,293

127
(Unit: Million US Dollar)
As at 31 December 2019
Separate financial statements
Fixed interest rates Non-
Within Floating interest Interest
1 year 1 - 5 years interest rate bearing Total rate
(% per annum)
Financial assets
Cash and cash equivalents - - 8.7 - 8.7 0.10 - 0.80
Trade and other receivables - - - 473.8 473.8 -
Receivable - molds - - - 4.9 4.9 -
Other long-term investments - - - 12.8 12.8 -
Other long-term receivables - - - 23.5 23.5 -
Long-term loans to related parties - 7.4 20.0 - 27.4 2.50, 1 year
USD LIBOR +
1.05
- 7.4 28.7 515.0 551.1
Financial liabilities
Short-term loans from
financial institutions
296.8 - - - 296.8 2.30 - 3.20
Trade and other payables - - - 391.3 391.3 -
296.8 - - 391.3 688.1
(Unit: Million Baht)
As at 31 December 2019
Separate financial statements
Fixed interest rates Non-
Within Floating interest Interest
1 year 1 - 5 years interest rate bearing Total rate
(% per annum)
Financial assets
Cash and cash equivalents 1 - 262 - 263 0.10 - 0.80
Trade and other receivables - - - 14,287 14,287 -
Receivable - molds - - - 146 146 -
Other long-term investments - - - 385 385 -
Other long-term receivables - - - 708 708 -
Long-term loans to related parties - 225 600 - 825 2.50, 1 year
USD LIBOR +
1.05
1 225 862 15,526 16,614
Financial liabilities
Short-term loans from
financial institutions
8,951 - - - 8,951 2.30 - 3.20
Trade and other payables - - - 11,800 11,800 -
8,951 - - 11,800 20,751
Interest rate sensitivity
The following table demonstrates the sensitivity of the Group’s profit before tax to
a reasonably possible change in interest rates on that portion of floating rate long-term
loans affected as at 31 December 2020.
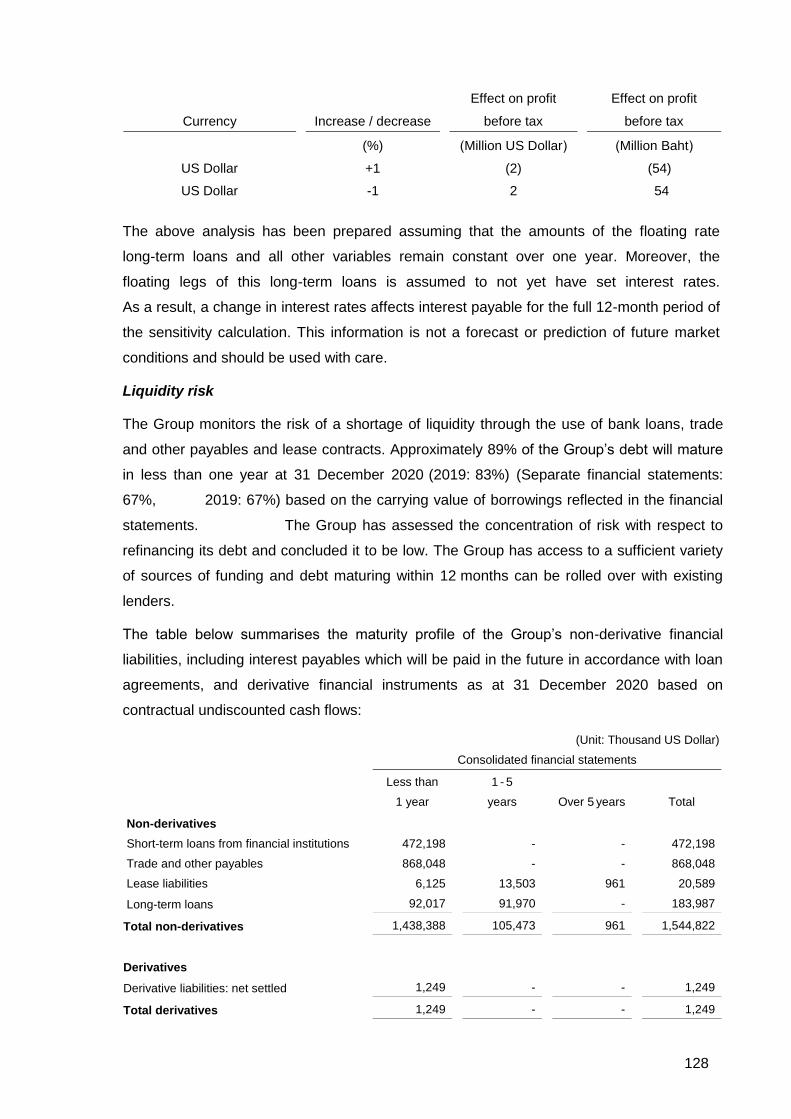
128
Currency Increase / decrease
Effect on profit
before tax
Effect on profit
before tax
(%) (Million US Dollar) (Million Baht)
US Dollar +1 (2) (54)
US Dollar -1 2 54
The above analysis has been prepared assuming that the amounts of the floating rate
long-term loans and all other variables remain constant over one year. Moreover, the
floating legs of this long-term loans is assumed to not yet have set interest rates.
As a result, a change in interest rates affects interest payable for the full 12-month period of
the sensitivity calculation. This information is not a forecast or prediction of future market
conditions and should be used with care.
Liquidity risk
The Group monitors the risk of a shortage of liquidity through the use of bank loans, trade
and other payables and lease contracts. Approximately 89% of the Group’s debt will mature
in less than one year at 31 December 2020 (2019: 83%) (Separate financial statements:
67%, 2019: 67%) based on the carrying value of borrowings reflected in the financial
statements. The Group has assessed the concentration of risk with respect to
refinancing its debt and concluded it to be low. The Group has access to a sufficient variety
of sources of funding and debt maturing within 12 months can be rolled over with existing
lenders.
The table below summarises the maturity profile of the Group’s non-derivative financial
liabilities, including interest payables which will be paid in the future in accordance with loan
agreements, and derivative financial instruments as at 31 December 2020 based on
contractual undiscounted cash flows:
(Unit: Thousand US Dollar)
Consolidated financial statements
Less than
1 year
1 - 5
years Over 5 years Total
Non-derivatives
Short-term loans from financial institutions 472,198 - - 472,198
Trade and other payables 868,048 - - 868,048
Lease liabilities 6,125 13,503 961 20,589
Long-term loans 92,017 91,970 - 183,987
Total non-derivatives 1,438,388 105,473 961 1,544,822
Derivatives
Derivative liabilities: net settled 1,249 - - 1,249
Total derivatives 1,249 - - 1,249

129
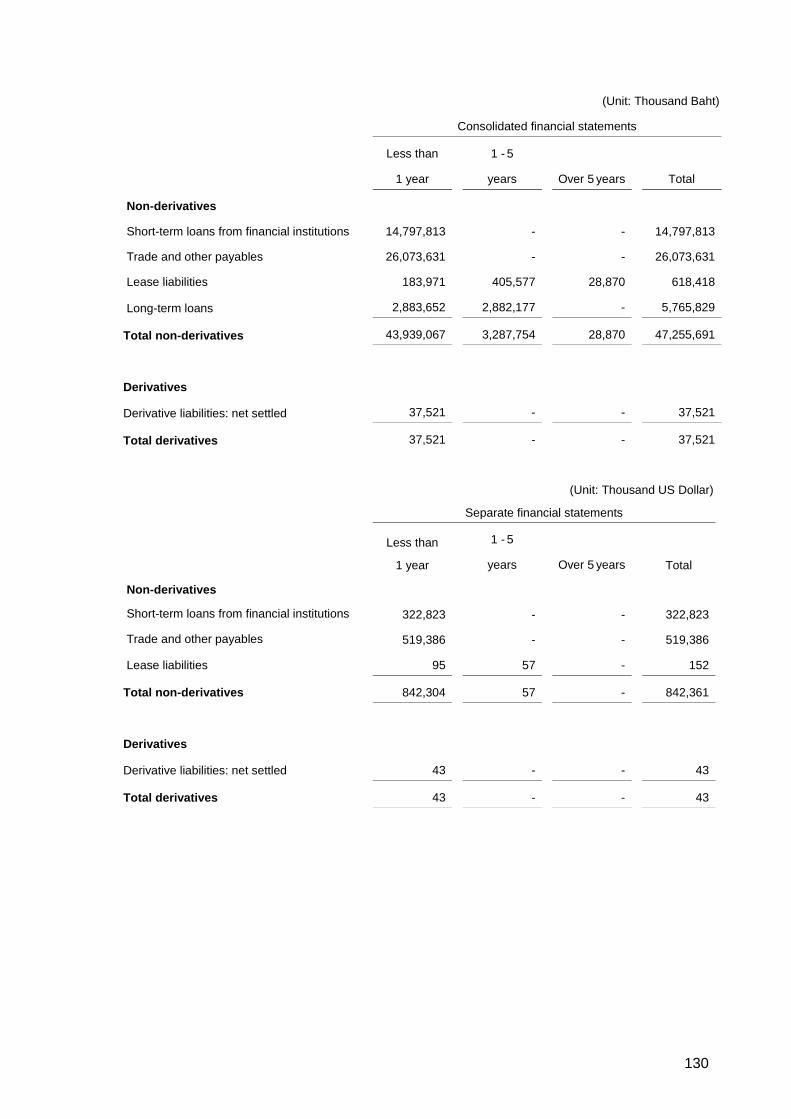
130
(Unit: Thousand Baht)
Consolidated financial statements
Less than
1 year
1 - 5
years Over 5 years Total
Non-derivatives
Short-term loans from financial institutions 14,797,813 - - 14,797,813
Trade and other payables 26,073,631 - - 26,073,631
Lease liabilities 183,971 405,577 28,870 618,418
Long-term loans 2,883,652 2,882,177 - 5,765,829
Total non-derivatives 43,939,067 3,287,754 28,870 47,255,691
Derivatives
Derivative liabilities: net settled 37,521 - - 37,521
Total derivatives 37,521 - - 37,521
(Unit: Thousand US Dollar)
Separate financial statements
Less than
1 year
1 - 5
years Over 5 years Total
Non-derivatives
Short-term loans from financial institutions 322,823 - - 322,823
Trade and other payables 519,386 - - 519,386
Lease liabilities 95 57 - 152
Total non-derivatives 842,304 57 - 842,361
Derivatives
Derivative liabilities: net settled 43 - - 43
Total derivatives 43 - - 43

131
(Unit: Thousand Baht)
Separate financial statements
Less than
1 year
1 - 5
years Over 5 years Total
Non-derivatives
Short-term loans from financial institutions 10,116,665 - - 100,116,665
Trade and other payables 15,600,854 - - 15,600,854
Lease liabilities 2,865 1,709 - 4,574
Total non-derivatives 25,720,384 1,709 - 25,722,093
Derivatives
Derivative liabilities: net settled 1,289 - - 1,289
Total derivatives 1,289 - - 1,289
39.2 Fair values of financial instruments
Since the majority of the Group’s financial instruments are short-term in nature or carrying
interest at rates closed to the market interest rates, their fair value is not expected to be
materially different from the amounts presented in the statement of financial position.
40. Capital management
The primary objectives of the Group’s capital management is to ensure that it has
appropriate capital structure, in order to support its business and maximise shareholder
value. As at 31 December 2020, the Group’s debt-to-equity ratio was 3.03:1 (2019: 2.39:1)
and the Company's was 2.37:1 (2019: 1.93:1).
41. Events after the reporting period
41.1 On 10 February 2021, the warrant holders exercised their rights (CCET-WC) to purchase
ordinary shares totaling 122,100 units of warrants at an exercise price of Baht 2.16 each,
totaling Baht 263,736. The Company registered the change in its paid-up capital
from Baht 4,554,643,575 to Baht 4,554,765,675 with the Ministry of Commerce on
15 February 2021.

132
41.2 On 26 February 2021, a meeting of the Board of Directors of the Company passed a
resolution to propose to the Annual General Meeting of shareholders to be held in April
2021 to adopt a resolution to pay dividend in respect of the operating results for the year
2020, in the total amount Baht 512 million. The Company paid an interim dividend of Baht
0.02 per share, or a total of Baht 91 million, leaving a dividend of Baht 421 million
which will be paid in stock dividend at a ratio of 1 dividend share to 12 existing shares
together with cash dividend in the amount of Baht 0.0094 per share. The indivisible shares
will be paid in cash in the amount of Baht 0.083 per share. However, the actual payment
amount is subject to a change following an approval of the Annual General Shareholder's
Meeting to be held in April.
Such payments of cash dividend together with stock dividend will be recorded after being
approved by the Annual General Meeting of the Company’s shareholders.
41.3 On 26 February 2021, a meeting of the Board of Directors of the Company resolved to
approve the following matters.
- To approve a decrease in the registered capital from Baht 4,979,068,075 to
Baht 4,779,643,575 by cancelling shares remaining from the allocation of ordinary
shares under Employee Stock Option Plan (CCET-WB) in the amount of 199,424,500
shares with a par value of Baht 1 each.
- To approve additional registered capital of the Company from Baht 4,779,643,575
to Baht 5,176,353,992 in order to support the allotment of stock dividend and right
adjustment under Employee Stock Option plan (CCET-WC) in the total amount of
396,710,417 shares with a par value of Baht 1 each.
- To approve an additional investment in Cal-Comp Electronics and Communication
Co., Ltd., a subsidiary in Taiwan, at the amount of USD 270 million for a purpose of
business expansion in the future. It is expected that such investment will be completed
in the fourth quarter of the year 2021.
- To approve the shareholding restructuring of New Era AI Group., an associate
in Taiwan, for the purpose of streamlining the group organisation and management cost
reduction. It is expected that the restructuring will be completed in the second quarter of
the year 2022.
42. Approval of financial statements
These financial statements were authorised for issue by the Company’s Board of Directors
on 26 February 2021.


![index []...p 104—109 comp. 190 p 110—115 comp. 191 p 116—121 comp. 192 p 122—127 comp. 193 p 128—133 comp. 194 p 134—139 comp. 195 p 140—147 comp. 196 p 148—153 comp](https://img.pdfslide.net/doc/110x75/5f95526362174b59db2f2d15/index-p-104a109-comp-190-p-110a115-comp-191-p-116a121-comp-192.jpg)