Embed Size (px)
Citation preview
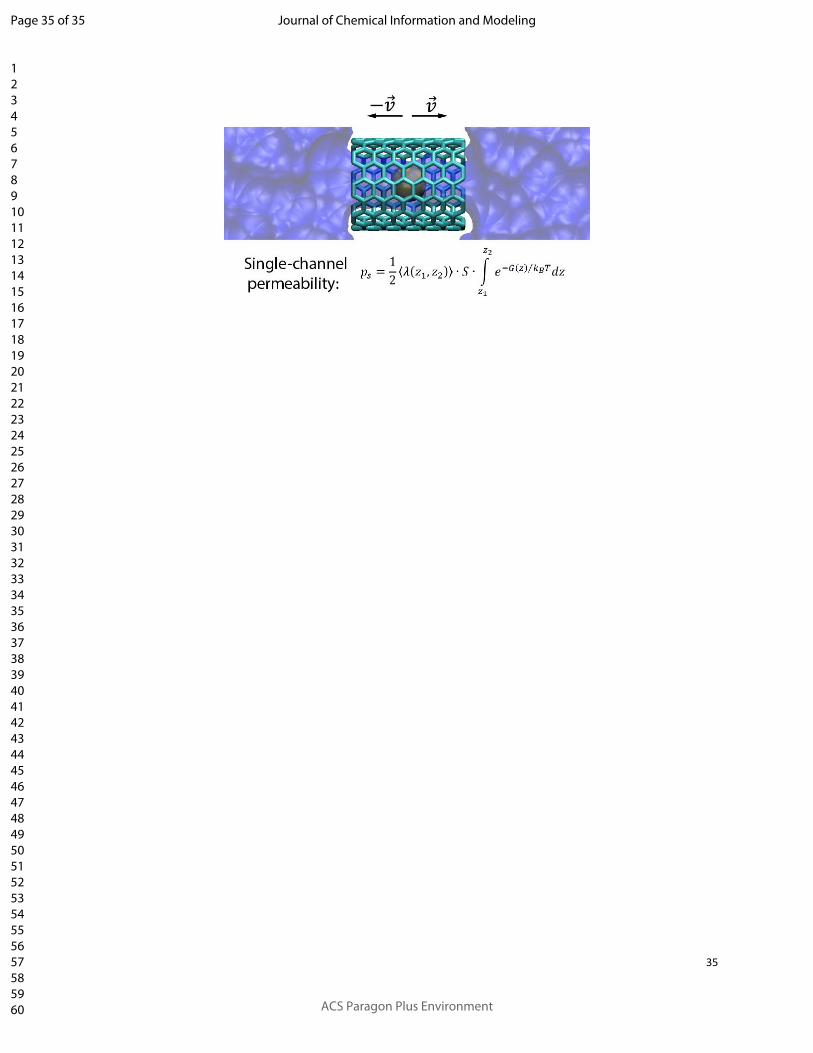
Calculating Single-Channel Permeability and
Conductance from Transition Paths
Xiaoyan Zhou1,2 and Fangqiang Zhu2,*
1Department of Physics, Zhejiang Normal University, Jinhua 321004, China
2Department of Physics, Indiana University Purdue University Indianapolis, 402 North Blackford
Street, Indianapolis, Indiana 46202, United States
* Correspondence: [email protected]
Page 1 of 35 Journal of Chemical Information and Modeling
12345678910111213141516171819202122232425262728293031323334353637383940414243444546474849505152535455
___________________________________________________________________
This is the author's manuscript of the article published in final edited form as:Zhou, X., & Zhu, F. (2019). Calculating Single-Channel Permeability and Conductance from Transition Paths. Journal of Chemical Information and Modeling. https://doi.org/10.1021/acs.jcim.8b00914
2
ABSTRACT
Permeability and conductance are the major transport property of membrane channels,
quantifying the rate of channel crossing by the solute. It is highly desirable to calculate these
quantities in all-atom molecular dynamics simulations. When the solute crossing rate is low,
however, direct methods would require prohibitively long simulations, and one thus typically
adopts alternative strategies based on the free energy of single solute along the channel. Here we
present a new method to calculate the crossing rate by initiating unbiased trajectories in which
the solute is released at the free energy barrier. In this method, the total time the solute spends in
the barrier region during a channel crossing (transition path) is used to determine the kinetic rate.
Our method achieves a significantly higher statistical accuracy than the classical reactive flux
method, especially for diffusive barrier crossing. Our test on ion permeation through a carbon
nanotube verifies that the method correctly predicts the crossing rate and reproduces the
spontaneous crossing events as in long equilibrium simulations. The rigorous and efficient
method here will be valuable for quantitatively connecting simulations to experimental
measurement of membrane channels.
Page 2 of 35
ACS Paragon Plus Environment
Journal of Chemical Information and Modeling
123456789101112131415161718192021222324252627282930313233343536373839404142434445464748495051525354555657585960
3
INTRODUCTION
Cell membranes create a barrier that separates the inside of the cell from the outside and prevents
the passage of most hydrophilic molecules. Some membrane proteins, in the meantime, are
designed to transport materials across this barrier. Channels, a major class of these transport
proteins, form pores in the membrane and allow specific molecules to pass through.1 Membrane
channels are ubiquitous and play indispensable physiological roles in all living systems, from the
uptake of nutrients to the transduction of neural signals.
The major transport property of a membrane channel is its permeability, which determines the
net flux of solute through the channel under a concentration difference. For ion channels, the
major characteristic is their conductance, which determines the ionic current under an applied
transmembrane voltage. If the passages of individual ions are completely independent and not
coupled to each other, the conductance of an ion channel at low voltages can be predicted from
its permeability at equilibrium.2
Given the available atomic structures of many membrane channels, it is desirable to calculate
their permeability or conductance from molecular dynamics (MD) simulations.3, 4 Furthermore, it
is of great interest to reveal in the simulations the full atomic details of how the solutes cross the
channel. For membrane channels (such as those with large pores) with fast transport kinetics,
both the permeability (conductance) and the crossing events can be directly obtained from
straightforward MD simulations at equilibrium2 or under an electrochemical potential5-7. For
channels with small permeability or when the solute concentrations are low, however, the
required simulation time to capture spontaneous permeation events can be very long. In such
cases, it is often more efficient to first calculate a single-solute free energy profile, based on
Page 3 of 35
ACS Paragon Plus Environment
Journal of Chemical Information and Modeling
123456789101112131415161718192021222324252627282930313233343536373839404142434445464748495051525354555657585960

4
which the permeability can be further estimated. For example, a diffusion model that
incorporates the free energy and position-dependent diffusion coefficients8 was applied to
calculate the conductance of an ion channel.9 Similar methods were recently proposed to
calculate the permeability of lipid bilayers.10, 11 Alternatively, the channel permeability can be
rigorously calculated using the classical reactive flux method developed by Bennett and
Chandler,12 by releasing the solute at the free energy barrier and computing the transmission
coefficient.13 However, this method will become inefficient for diffusive barrier crossing,12 when
the solute re-crosses the free energy barrier many times before exiting the channel.
Based on earlier theories14-16, we recently demonstrated a method17 to calculate the rates of
spontaneous barrier crossing, in a simulation setup essentially identical to that in the reactive flux
method. However, although our method does not explicitly assume diffusive motions, it is much
more efficient than the reactive flux method for the cases of diffusive barrier crossing. In this
study, we propose computational protocols based on this method to calculate the permeability
and conductance of membrane channels.
We test our proposed method by calculating ion permeability for carbon nanotubes (CNTs).
CNTs with appropriate radii have been used as model systems for biological channels in a
number of computational studies.18-21 In addition to water transport, the permeation and
selectivity of , , and ions were investigated for various CNTs in simulations.22-25 Na + K + Cl ―
Furthermore, CNTs have shown potential applications in desalination of seawater26-28 and
separation of ions29, 30, which are contingent on their properties of selective ion transport or
rejection. The conductance of individual CNTs or CNT membranes has also been experimentally
measured for a variety of ions.24, 31-35
Page 4 of 35
ACS Paragon Plus Environment
Journal of Chemical Information and Modeling
123456789101112131415161718192021222324252627282930313233343536373839404142434445464748495051525354555657585960

5
Pristine CNTs can be modified by adding functional groups to the surface, and such
functionalization could significantly change their properties.36-40 Using our proposed method,
here we carry out MD simulations to calculate the permeability for a narrow (8,8) CNT K +
(diameter ~1.1 nm) in its pristine and functionalized (by adding a carboxylate group) forms. In
addition to validating our method, the simulations also quantify the effect of a single carboxylate
group on the ion conductance of the CNT.
Page 5 of 35
ACS Paragon Plus Environment
Journal of Chemical Information and Modeling
123456789101112131415161718192021222324252627282930313233343536373839404142434445464748495051525354555657585960
6
METHODS
In this section, we first present the theories and methods for calculating the channel permeability
and conductance, and then describe our simulations for a test system of CNT.
Crossing rate, permeability, and conductance
Consider a single channel in a membrane that separates two reservoirs with equal concentration
of a certain solute. We define the equilibrium crossing rate, , as the average number of 𝜌 𝑘0
solutes spontaneously crossing the channel in one direction per unit time. At equilibrium, the
crossing rate for the other direction is also . Clearly, is a function of the solute 𝑘0 𝑘0
concentration . Under sufficiently low concentrations such that the interactions between 𝜌
individual solute molecules can be ignored, will be linearly proportional to .𝑘0 𝜌
When a concentration difference between the two reservoirs exists, there will be a net ∆𝜌
transport of the solute down the concentration gradient. If the concentrations are sufficiently low,
the net solute flux through the channel, , will be linearly proportional to :𝑗 ∆𝜌
, (1)𝑗 = 𝑝𝑠∆𝜌
where the linear coefficient, denoted as here, can be defined as the single-channel 𝑝𝑠
permeability for the solute. We note that whereas the number flux (s-1) and number 𝑗
concentration (cm-3) are adopted here, in experiments the molar flux (mol/s) and molar 𝜌 𝑗/𝑁𝐴
concentration (mol/cm3) are more commonly used, with the Avogadro’s number. 𝐶 ≡ 𝜌/𝑁𝐴 𝑁𝐴
Nevertheless, the permeability (cm3/s), defined as the ratio of the flux to the concentration 𝑝𝑠
difference, remains the same in both notations. Also, if the solutes may only cross the membrane
through the channels, the single-channel permeability here multiplied by the channel density 𝑝𝑠
Page 6 of 35
ACS Paragon Plus Environment
Journal of Chemical Information and Modeling
123456789101112131415161718192021222324252627282930313233343536373839404142434445464748495051525354555657585960
7
(in unit of cm-2) in the membrane will give the commonly-used membrane permeability 𝑃𝑚
(cm/s), which determines the per-area flux (mol/scm2) through the membrane.
When the interaction between the solutes can be ignored, the motion of each individual solute
molecule would not be affected by the presence or absence of other solutes in either reservoir.
Consequently, the rate of crossing events from reservoir A to B is linearly proportional to the
solute concentration in A, and the rate of crossing from B to A is linearly proportional to the
concentration in B, with the linear coefficient corresponding to the permeability:
. (2)𝑝𝑠 = 𝑘0 𝜌
This equation relates the channel permeability to the equilibrium crossing rate under 𝑝𝑠 𝑘0
symmetric solute concentrations.
For channels that conduct ions, the major experimental observable is the ionic current under 𝐼
an applied transmembrane voltage and a symmetric bulk ion concentration . At sufficiently 𝑉 𝜌
small , the - relation will be linear, and the slope defines a constant single-channel 𝑉 𝐼 𝑉
conductance . In fact, for many biological41 or synthetic42 ion channels, the linear Ohm's 𝛾 ≡ 𝐼/𝑉
law can be valid up to voltages much higher than physiological membrane potentials (~80 mV).
Importantly, although the conductance is a non-equilibrium property, our earlier theory2 shows 𝛾
that can be predicted from the spontaneous ion crossings at equilibrium. In general, this linear 𝛾
response theory only applies for the net charge transport arising from all of the ions in the
system.2 Under sufficiently low ion concentrations, however, the crossings of individual ions
will be independent of each other. In such single-ion conduction regime, we previously proved2, 9
that the conductance arising from a given ion species is related to the equilibrium crossing rate:
, (3)𝛾 = 𝑒2𝑘0 𝑘𝐵𝑇
Page 7 of 35
ACS Paragon Plus Environment
Journal of Chemical Information and Modeling
123456789101112131415161718192021222324252627282930313233343536373839404142434445464748495051525354555657585960

8
where is the charge of the ion, the Boltzmann constant, and the temperature. Equations 2 𝑒 𝑘𝐵 𝑇
and 3 then indicate:
. (4)𝛾 =𝑒2
𝑘𝐵𝑇𝑝𝑠𝜌
Therefore, when the ion concentration is sufficiently low, the single-channel conductance 𝜌 𝛾
will be linearly proportional to , with the linear coefficient determined by the equilibrium 𝜌
permeability .𝑝𝑠
We note that both the permeability (Eq. 2) and the conductance (Eq. 3) for a single channel at
a low solute concentration are determined by the equilibrium crossing rate , which is thus the 𝑘0
key objective of our computational method presented below.
Free energy for single-solute crossing
For membrane channels with small permeability/conductance or under low solute concentrations,
the crossing rate will be very small, and very long simulations will thus be needed to produce 𝑘0
spontaneous crossing events and to directly obtain . To overcome such difficulty, enhanced 𝑘0
sampling techniques can be applied to calculate the thermodynamics and kinetics of single-solute
crossing, and the first step is typically to calculate the free energy profile for a single “tagged”
solute along the channel, as described below.
We assume that the membrane channel is aligned along the -axis and located at the origin in 𝑧
the - plane. To properly sample the bulk region, the tagged solute is typically under a lateral 𝑥 𝑦
restraint9 in the simulations. One such example is a flat-bottom harmonic potential:𝑢(𝑥,𝑦)
, (5)𝑢(𝑥,𝑦) = {0 if 𝑅 ≤ 𝑅0𝐾𝑥𝑦(𝑅 ― 𝑅0)2 2 if 𝑅 > 𝑅0
Page 8 of 35
ACS Paragon Plus Environment
Journal of Chemical Information and Modeling
123456789101112131415161718192021222324252627282930313233343536373839404142434445464748495051525354555657585960

9
where , and is the spring constant. The parameter should be chosen to be 𝑅 ≡ 𝑥2 + 𝑦2 𝐾𝑥𝑦 𝑅0
larger than the pore radius, such that the lateral restraint only acts to confine the tagged solute
when it is in the bulk region but has no effect when inside the channel. The effective cross-
sectional area due to the lateral restraint is defined as9
, (6)𝑆 = ∬exp [ ― 𝑢(𝑥,𝑦) 𝑘𝐵𝑇]𝑑𝑥𝑑𝑦
which quantifies the accessible lateral area when the tagged solute is in the bulk.
In the presence of the lateral potential above, we can calculate a one-dimensional free energy
as a function of the -coordinate of the tagged solute, using umbrella sampling or other 𝐺(𝑧) 𝑧
methods. We assume that the vertical offset of is set such that its flat baselines at the two 𝐺(𝑧)
ends (representing regions of bulk solution) are at the zero level. We previously proved9 that
under a symmetric bulk solute concentration that is sufficiently low, the one-dimensional 𝜌
equilibrium solute density (occupancy) along the channel is related to the free energy of 𝑝0(𝑧)
the tagged solute:
. (7)𝑝0(𝑧) = 𝜌𝑆exp [ ― 𝐺(𝑧) 𝑘𝐵𝑇]
provides the equilibrium probability density for finding a solute molecule at the given 𝑝0(𝑧)
vertical position in the channel region. We note that the choice of the lateral potential 𝑧 𝑢(𝑥,𝑦)
will affect the values of both and , but will not affect9 the equilibrium density in the 𝐺(𝑧) 𝑆 𝑝0(𝑧)
pore region where the tagged solute always experiences a zero .𝑢(𝑥,𝑦)
Rate calculation
The crossing rate can be calculated using our recent method17 from pairs of unbiased forward
and backward simulations with the tagged solute molecule initially at the free energy barrier. The
Page 9 of 35
ACS Paragon Plus Environment
Journal of Chemical Information and Modeling
123456789101112131415161718192021222324252627282930313233343536373839404142434445464748495051525354555657585960

10
two simulations in each pair start with identical coordinates and reverted velocities for all the
atoms. If the solute molecule exits to opposite sides of the membrane in the two simulations, the
two trajectories will form a transition path (or reactive trajectory) that represents a spontaneous
crossing event. Given any interval in the channel region, we define the duration [𝑧1,𝑧2] 𝜏(𝑧1,𝑧2)
for a transition path as the total time the trajectory spends in the interval.17 If the transition path
visits the interval multiple times, should be the sum of all the individual [𝑧1,𝑧2] 𝜏(𝑧1,𝑧2)
durations. Furthermore, each pair of the forward/backward simulations is associated with a
kinetic factor defined as17𝜆
. (8)𝜆(𝑧1,𝑧2) = {1 𝜏(𝑧1,𝑧2) for transition path0 otherwise
According to this definition, if the two trajectories form a transition path, will be the inverse 𝜆
duration. In contrast, will be zero if the solute molecule exits to the same side of the channel in 𝜆
the two simulations (thus not forming a transition path).
Accordingly to our theory,17 the crossing rate is related to the average value and the 𝜆
equilibrium occupancies:
. (9)𝑘0 =12𝑃(𝑧1 ≤ 𝑧 ≤ 𝑧2) ∙ ⟨𝜆(𝑧1,𝑧2)⟩𝑧1 ≤ 𝑧 ≤ 𝑧2
Here is the equilibrium probability of finding a solute in the 𝑃(𝑧1 ≤ 𝑧 ≤ 𝑧2) = ∫𝑧2
𝑧1𝑝0(𝑧)𝑑𝑧
interval and can be obtained (Eq. 7) from the free energy discussed earlier. The expected [𝑧1,𝑧2]
value can be estimated by averaging over the values from all the ⟨𝜆(𝑧1,𝑧2)⟩𝑧1 ≤ 𝑧 ≤ 𝑧2𝜆(𝑧1,𝑧2)
forward/backward simulation pairs described above. Importantly, Eq. 9 requires that the initial
coordinates of these unbiased simulations be drawn from the equilibrium distribution when the
Page 10 of 35
ACS Paragon Plus Environment
Journal of Chemical Information and Modeling
123456789101112131415161718192021222324252627282930313233343536373839404142434445464748495051525354555657585960

11
solute is in the interval .17 These initial coordinates can be sampled from a simulation with [𝑧1,𝑧2]
the solute confined in by a flat-bottom potential such that the equilibrium distribution of [𝑧1,𝑧2]
the microstates within is preserved. Due to the independence of velocity distribution, the [𝑧1,𝑧2]
initial velocities for all the atoms (including the solute atoms) in the forward simulation can be
taken from the sampling simulation above or simply assigned randomly according to the
Maxwell–Boltzmann distribution. Then these velocities should be reverted and used as the initial
atomic velocities in the backward simulation. Although Eq. 9 is valid for any , choosing [𝑧1,𝑧2]
the interval in the barrier region of the free energy would result in a higher fraction of the
transition paths, thus making the calculation more efficient. Combining Eq. 9 with Eqs. 2 and 7,
we obtain an expression for the single-channel permeability:
. (10)𝑝𝑠 =12⟨𝜆(𝑧1,𝑧2)⟩𝑧1 ≤ 𝑧 ≤ 𝑧2
∙ 𝑆 ∙ ∫𝑧2
𝑧1exp [ ― 𝐺(𝑧) 𝑘𝐵𝑇]𝑑𝑧
For ion channels, the conductance under an ion concentration can then be obtained from Eq. 4.𝜌
If we choose an interval centered at and with a sufficiently small [𝑧0 ― 𝛿𝑧 2,𝑧0 + 𝛿𝑧 2] 𝑧0
width , Eq. 9 can be expressed in a slightly simplified form:17𝛿𝑧
,𝑘0 =12𝑝0(𝑧0) ∙ 𝛿𝑧 ∙ ⟨𝜆(𝑧0 ―
𝛿𝑧2 ,𝑧0 +
𝛿𝑧2 )⟩
𝑧0
or
. (11)𝑘0 =12𝜌𝑆exp [ ― 𝐺(𝑧0) 𝑘𝐵𝑇] ∙ 𝛿𝑧 ∙ ⟨𝜆(𝑧0 ―
𝛿𝑧2 ,𝑧0 +
𝛿𝑧2 )⟩
𝑧0
Here the unbiased simulations for evaluating the should start with the solute at close vicinity ⟨𝜆⟩
of . As mentioned earlier, it is preferable to choose at the barrier top of the free energy. 𝑧0 𝑧0
Page 11 of 35
ACS Paragon Plus Environment
Journal of Chemical Information and Modeling
123456789101112131415161718192021222324252627282930313233343536373839404142434445464748495051525354555657585960
12
With the obtained , the single-channel permeability or conductance can then be calculated 𝑘0
using Eq. 2 or 3.
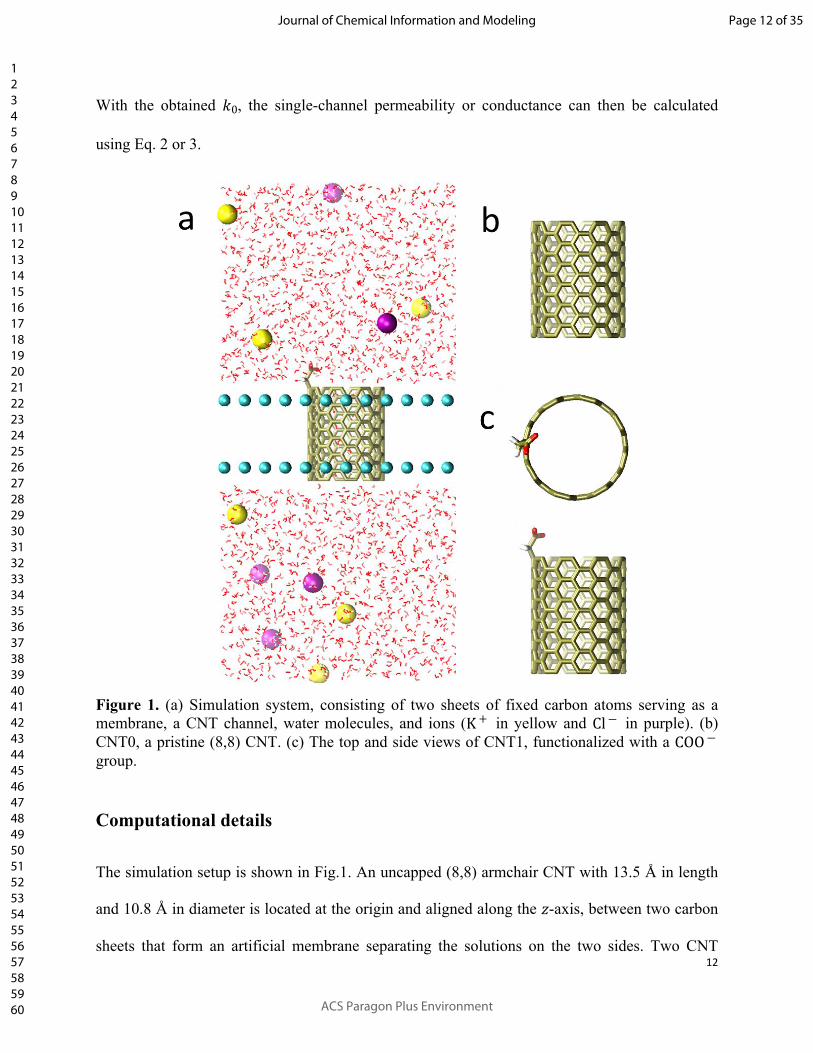
Figure 1. (a) Simulation system, consisting of two sheets of fixed carbon atoms serving as a membrane, a CNT channel, water molecules, and ions ( in yellow and in purple). (b) K + Cl ―
CNT0, a pristine (8,8) CNT. (c) The top and side views of CNT1, functionalized with a COO ―
group.
Computational details
The simulation setup is shown in Fig.1. An uncapped (8,8) armchair CNT with 13.5 Å in length
and 10.8 Å in diameter is located at the origin and aligned along the -axis, between two carbon 𝑧
sheets that form an artificial membrane separating the solutions on the two sides. Two CNT
Page 12 of 35
ACS Paragon Plus Environment
Journal of Chemical Information and Modeling
123456789101112131415161718192021222324252627282930313233343536373839404142434445464748495051525354555657585960
13
systems are studied in this work. The first system (denoted as CNT0) is a pristine CNT, and the
second system (denoted as CNT1) has a functional (carboxylate ) group at the edge. The COO ―
solution contains 6 ions and 6 or 5 ions in the CNT0 or CNT1 system, respectively, K + Cl ―
representing a bulk KCl concentration of about 130 mM. The CNT atoms and the membrane are
fixed in all simulations, whereas the attached carboxylate group in CNT1 is free to move.
Simulation parameters were taken from an early version of the CHARMM22 force field43 with
the TIP3P water model44, without the more recent calibration45 for the K+-Cl- interaction
parameters. The parameters for the CNT atoms here are identical to those in the up-to-date
CHARMM force field, which reasonably reproduced the experimental adsorption affinities of
many small molecules on CNTs.46 All MD simulations were performed using the NAMD2
program47 with a time step of 1 fs and under constant volume. Periodic boundary conditions were
imposed with the unit cell size . Unless noted otherwise, a constant 36 Å × 36 Å × 73.5 Å
temperature (300 K) was maintained by Langevin dynamics. The Particle Mesh Ewald (PME)48
summation was used with a grid size of 1 Å for long-range electrostatic interactions. The van der
Waals interactions were calculated with a cutoff distance of 12 Å.
Umbrella sampling simulations. For both the CNT0 and CNT1 systems, we took the -𝑧
coordinate of a ion as the reaction coordinate, and employed a total of 55 umbrella windows K +
that cover the range with a constant spacing of 1 Å. In each simulation, - 27 Å ≤ z ≤ 27 Å
the z-coordinate of the tagged ion was subject to a harmonic restraint with spring constant K + 𝐾
. In addition, a lateral restraint is applied in the - plane = 2.5 kcal ∙ mol ―1 ∙ Å ―2 𝑢(𝑥,𝑦) 𝑥 𝑦
according to Eq. 5 with and = 6 Å. We also adopted 𝐾𝑥𝑦 = 10 kcal ∙ mol ―1 ∙ Å ―2 𝑅0
Hamiltonian replica exchange49 in which a swap between the neighboring windows was
attempted every 200 fs. The exchanges allowed the ion in each individual simulation (replica) to
Page 13 of 35
ACS Paragon Plus Environment
Journal of Chemical Information and Modeling
123456789101112131415161718192021222324252627282930313233343536373839404142434445464748495051525354555657585960
14
move along the -direction and could facilitate the equilibration of the orthogonal degrees of 𝑧
freedom.9 The simulation for each window was run for 20 ns, and the coordinate of the tagged
ion was recorded every time step. The first 2 ns of each simulation was discarded and the rest of
the trajectory was used to calculate the free energy.
Unbiased simulations at barrier top. For the purpose of rate calculation, we performed forward
and backward unbiased simulations at the free energy barrier as described below. First, 10
frames were selected from the umbrella sampling trajectories where the tagged ion is near the
barrier at z = 0 Å. Next, starting from each frame, we performed a simulation of 20 ns in which
the tagged ion was strongly restrained (200 kcal/mol/Å2) at z = 0 Å, and then uniformly K +
(every 2 ns) sampled 10 frames of atomic coordinates and velocities from the trajectory.
Therefore, we obtained a total of 100 microstates from the 10 simulations. For each microstate,
we further generated a companion microstate by reverting the velocities of all atoms in the
system while keeping all the atomic positions unchanged. Finally, starting from each of these
200 microstates, we carried out a simulation of 1 ns without any restraint on the ion. In total, we
thus performed 100 pairs of unbiased simulations with the tagged ion initially at z = 0 Å. K +
Importantly, the two simulations in each pair started with identical coordinates but opposite
velocities for all the atoms. To enable time reversibility, these unbiased simulations were under
constant-NVE condition.
Page 14 of 35
ACS Paragon Plus Environment
Journal of Chemical Information and Modeling
123456789101112131415161718192021222324252627282930313233343536373839404142434445464748495051525354555657585960
15
RESULTS
We tested our method by calculating ion permeability for two carbon nanotubes, CNT0 and
CNT1, as described in Methods. First, for the thermodynamics, we performed umbrella sampling
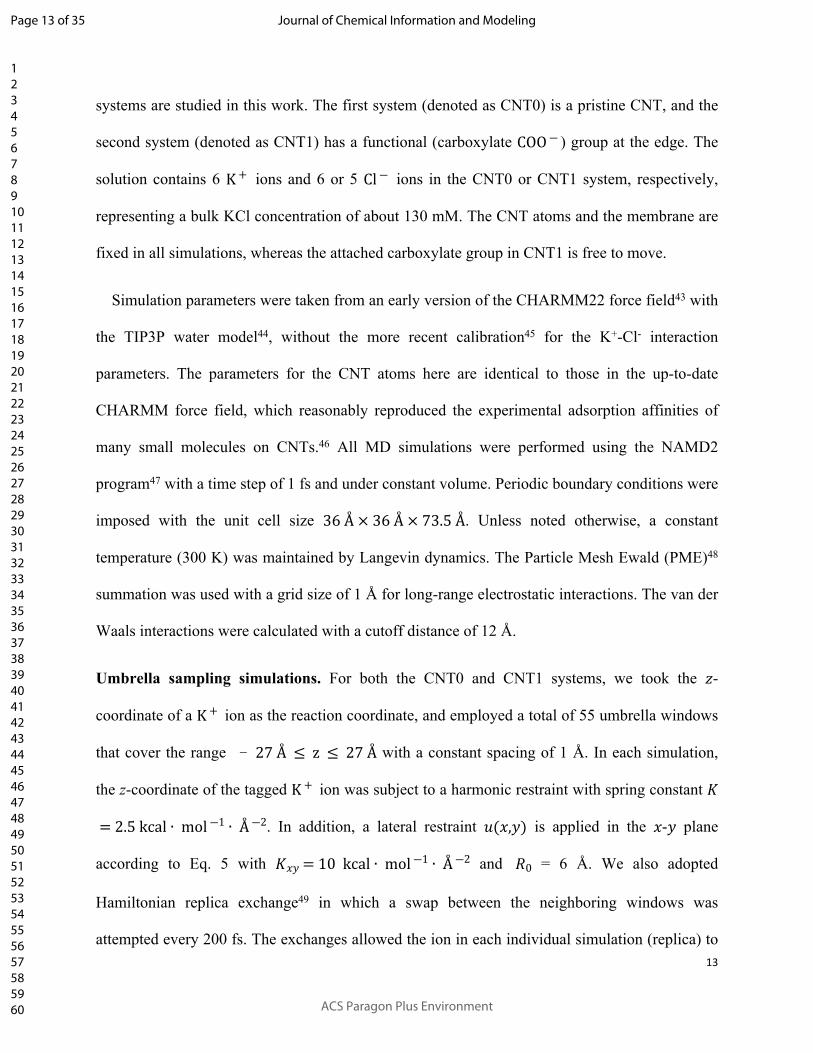
simulations with Hamiltonian replica exchange49. For each system, the free energy profile 𝐺(𝑧)
(Fig. 2) as a function of the -coordinate of a tagged ion was calculated from the umbrella 𝑧 K +
sampling trajectories, using a fast numerical algorithm50 of the weighted histogram analysis
method51. By evaluating the variances of the mean forces,50 the statistical errors in the calculated
free energies are estimated to be about 0.1 kcal/mol, according to the established method.50 In
both cases, the free energies exhibit a relatively broad barrier inside the CNT, as shown in Fig. 2.
The free energy profile for CNT0 is highly symmetric with respect to the center ( ), as 𝑧 = 0 Å
expected for a symmetric pore. In contrast, CNT1 features an energy well near the entrance
where the attractive group24, 38 is located.COO ―
Figure 2. The calculated free energy profiles for the tagged ion in the CNT0 and the 𝐺(𝑧) K +
CNT1 systems. The dashed lines indicate the length of the CNT.
Page 15 of 35
ACS Paragon Plus Environment
Journal of Chemical Information and Modeling
123456789101112131415161718192021222324252627282930313233343536373839404142434445464748495051525354555657585960
16
We further calculated the kinetics by initiating forward and backward trajectories at the free
energy barrier. For both CNT0 and CNT1, the highest free energies (Fig. 2) are found near the
center of the CNT ( ). For each system, therefore, we performed 100 pairs of unbiased 𝑧 = 0 Å
simulations with the tagged ion initially at the CNT center. The ion exited the CNT within 1 ns
in all of these simulations. In about one half of the simulation pairs, the ion exited opposite
entrances of the CNT in the forward and backward simulations, thus forming a transition path
(reactive trajectory). The ~50% fraction (Table 1) of transition paths among all the
forward/backward trajectory pairs is consistent with diffusive barrier crossing, and also indicates
that the -coordinate of the tagged ion is a good reaction coordinate for the relatively simple 𝑧
systems here.
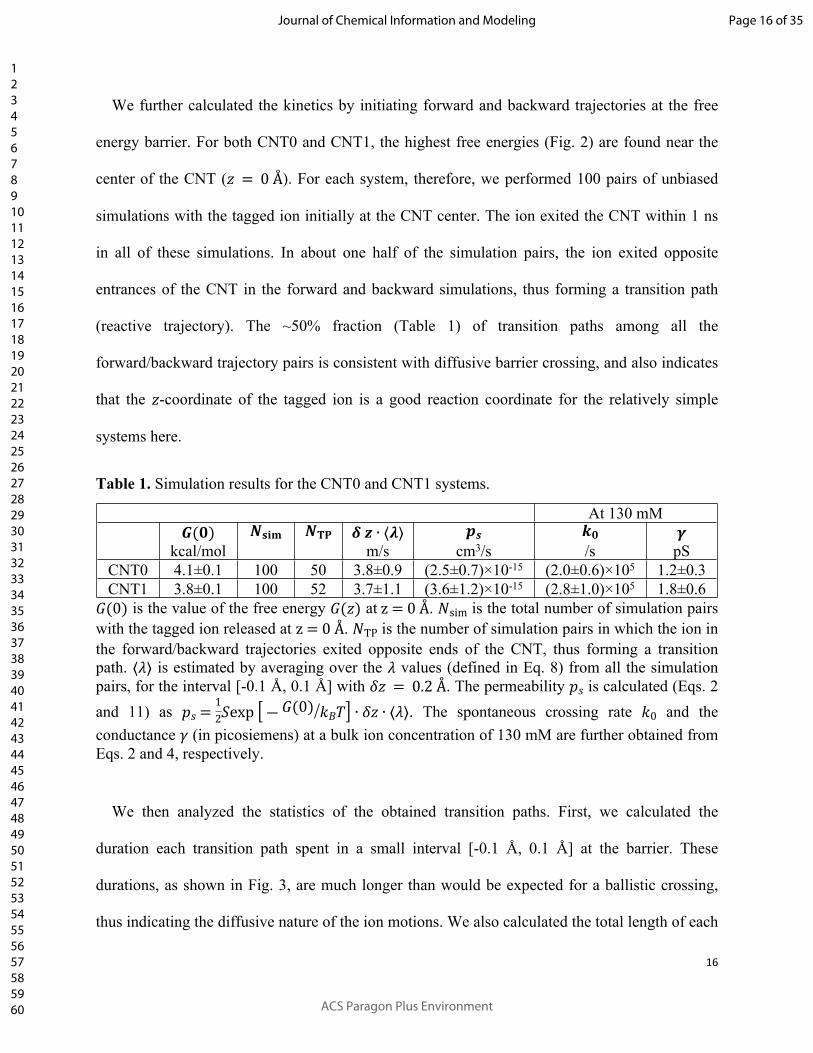
Table 1. Simulation results for the CNT0 and CNT1 systems.
At 130 mM𝑮(𝟎)
kcal/mol𝑵𝐬𝐢𝐦 𝑵𝐓𝐏 𝜹 𝒛 ∙ ⟨𝝀⟩
m/s𝒑𝒔
cm3/s𝒌𝟎/s
𝜸pS
CNT0 4.1±0.1 100 50 3.8±0.9 (2.5±0.7)×10-15 (2.0±0.6)×105 1.2±0.3CNT1 3.8±0.1 100 52 3.7±1.1 (3.6±1.2)×10-15 (2.8±1.0)×105 1.8±0.6
is the value of the free energy at . is the total number of simulation pairs 𝐺(0) 𝐺(𝑧) z = 0 Å 𝑁simwith the tagged ion released at . is the number of simulation pairs in which the ion in z = 0 Å 𝑁TPthe forward/backward trajectories exited opposite ends of the CNT, thus forming a transition path. is estimated by averaging over the values (defined in Eq. 8) from all the simulation ⟨𝜆⟩ 𝜆pairs, for the interval [-0.1 Å, 0.1 Å] with . The permeability is calculated (Eqs. 2 𝛿𝑧 = 0.2 Å 𝑝𝑠
and 11) as . The spontaneous crossing rate and the 𝑝𝑠 =12𝑆exp [ ― 𝐺(0) 𝑘𝐵𝑇] ∙ 𝛿𝑧 ∙ ⟨𝜆⟩ 𝑘0
conductance (in picosiemens) at a bulk ion concentration of 130 mM are further obtained from 𝛾Eqs. 2 and 4, respectively.
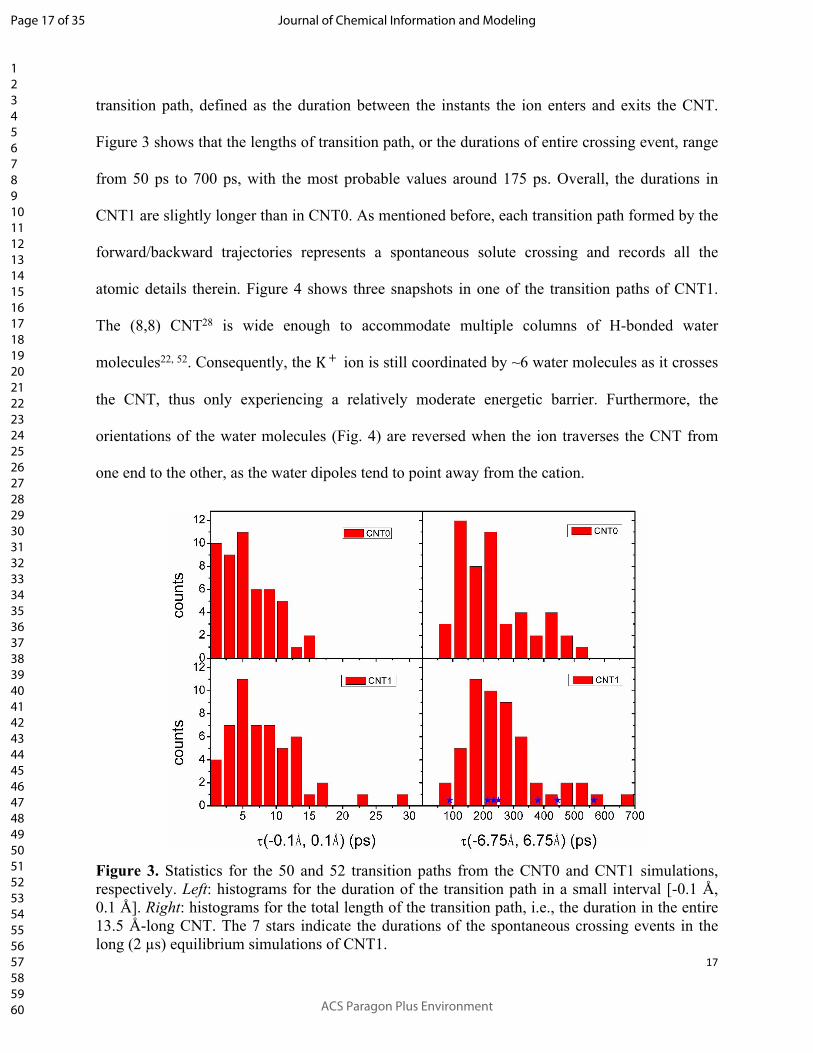
We then analyzed the statistics of the obtained transition paths. First, we calculated the
duration each transition path spent in a small interval [-0.1 Å, 0.1 Å] at the barrier. These
durations, as shown in Fig. 3, are much longer than would be expected for a ballistic crossing,
thus indicating the diffusive nature of the ion motions. We also calculated the total length of each
Page 16 of 35
ACS Paragon Plus Environment
Journal of Chemical Information and Modeling
123456789101112131415161718192021222324252627282930313233343536373839404142434445464748495051525354555657585960
17
transition path, defined as the duration between the instants the ion enters and exits the CNT.
Figure 3 shows that the lengths of transition path, or the durations of entire crossing event, range
from 50 ps to 700 ps, with the most probable values around 175 ps. Overall, the durations in
CNT1 are slightly longer than in CNT0. As mentioned before, each transition path formed by the
forward/backward trajectories represents a spontaneous solute crossing and records all the
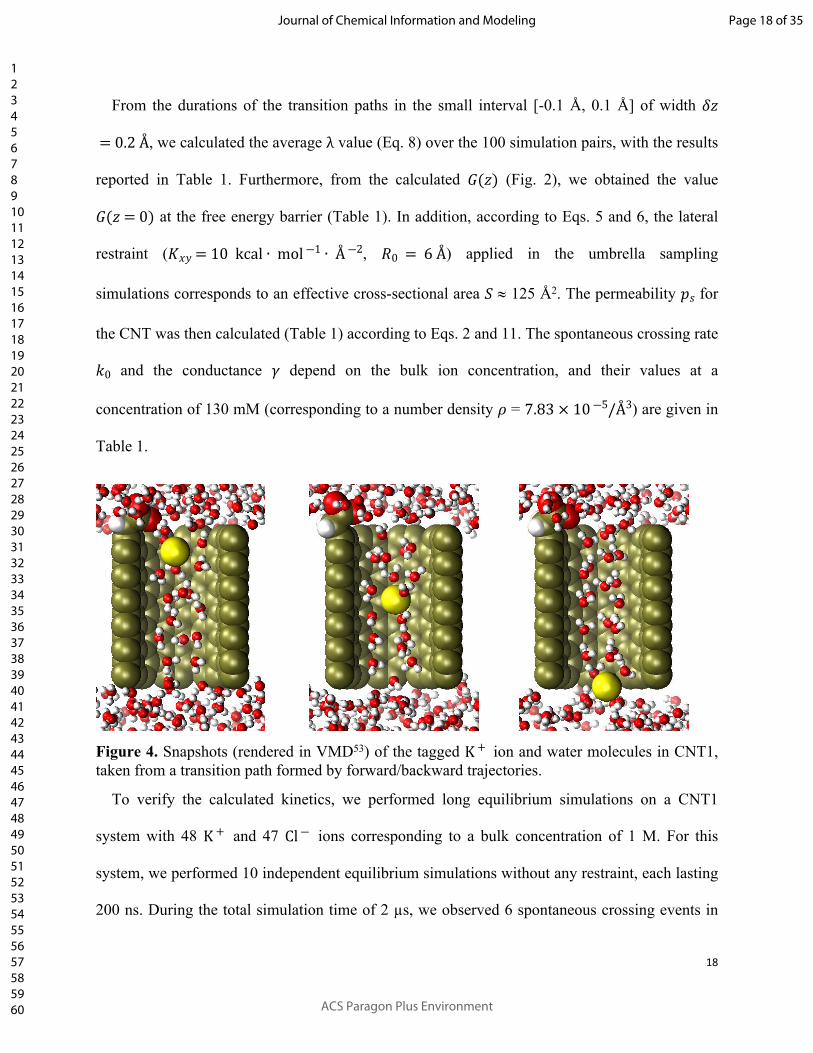
atomic details therein. Figure 4 shows three snapshots in one of the transition paths of CNT1.
The (8,8) CNT28 is wide enough to accommodate multiple columns of H-bonded water
molecules22, 52. Consequently, the ion is still coordinated by ~6 water molecules as it crosses K +
the CNT, thus only experiencing a relatively moderate energetic barrier. Furthermore, the
orientations of the water molecules (Fig. 4) are reversed when the ion traverses the CNT from
one end to the other, as the water dipoles tend to point away from the cation.
Figure 3. Statistics for the 50 and 52 transition paths from the CNT0 and CNT1 simulations, respectively. Left: histograms for the duration of the transition path in a small interval [-0.1 Å, 0.1 Å]. Right: histograms for the total length of the transition path, i.e., the duration in the entire 13.5 Å-long CNT. The 7 stars indicate the durations of the spontaneous crossing events in the long (2 µs) equilibrium simulations of CNT1.
Page 17 of 35
ACS Paragon Plus Environment
Journal of Chemical Information and Modeling
123456789101112131415161718192021222324252627282930313233343536373839404142434445464748495051525354555657585960
18
From the durations of the transition paths in the small interval [-0.1 Å, 0.1 Å] of width 𝛿𝑧
, we calculated the average value (Eq. 8) over the 100 simulation pairs, with the results = 0.2 Å λ
reported in Table 1. Furthermore, from the calculated (Fig. 2), we obtained the value 𝐺(𝑧)
at the free energy barrier (Table 1). In addition, according to Eqs. 5 and 6, the lateral 𝐺(𝑧 = 0)
restraint ( , ) applied in the umbrella sampling 𝐾𝑥𝑦 = 10 kcal ∙ mol ―1 ∙ Å ―2 𝑅0 = 6 Å
simulations corresponds to an effective cross-sectional area 125 Å2. The permeability for 𝑆 𝑝𝑠
the CNT was then calculated (Table 1) according to Eqs. 2 and 11. The spontaneous crossing rate
and the conductance depend on the bulk ion concentration, and their values at a 𝑘0 𝛾
concentration of 130 mM (corresponding to a number density = ) are given in 𝜌 7.83 × 10 ―5/Å3
Table 1.
Figure 4. Snapshots (rendered in VMD53) of the tagged ion and water molecules in CNT1, K +
taken from a transition path formed by forward/backward trajectories.
To verify the calculated kinetics, we performed long equilibrium simulations on a CNT1
system with 48 and 47 ions corresponding to a bulk concentration of 1 M. For this K + Cl ―
system, we performed 10 independent equilibrium simulations without any restraint, each lasting
200 ns. During the total simulation time of 2 µs, we observed 6 spontaneous crossing events in
Page 18 of 35
ACS Paragon Plus Environment
Journal of Chemical Information and Modeling
123456789101112131415161718192021222324252627282930313233343536373839404142434445464748495051525354555657585960
19
the direction and 1 crossing event in the direction for the ions, and no crossing for +𝑧 ―𝑧 K +
the ions. Therefore, the K+ crossing rate in these equilibrium simulations is = 1.8±1.3 /µs. Cl ― 𝑘0
In comparison, at a concentration of 1 M (or ρ = 6.02×10⁻⁴ /Å3), the crossing rate predicted from
our calculated permeability (Table 1) of CNT1 is = 2.2±0.7 /µs. We note that the prediction is 𝑘0
under the assumption that the crossing rate is linearly proportional to the bulk ion 𝑘0
concentration (Eq. 2), which may not be accurate for our case here with a relatively high ion 𝜌
concentration. Nevertheless, our predicted and observed crossing rates appear to agree
reasonably well. Furthermore, the seven spontaneous crossing events in these long equilibrium
simulations appear similar to those produced by the forward/backward trajectories initiated at the
barrier top (Fig. 4). In particular, the durations of the seven crossing events here (Fig. 3) are
consistent with the length distribution of the transition paths obtained from the forward/backward
trajectories. Therefore, the combination of the free energy calculation and the unbiased
simulations at the barrier top could faithfully reproduce the kinetic rates and the atomic details of
the spontaneous solute crossing in long equilibrium simulations.
As an alternative approach, we also applied a diffusion model to calculate the single-channel
permeability. To obtain the diffusivity, we performed additional umbrella sampling simulations,
5 ns per window, without Hamiltonian replica exchange. The trajectory of the ion under the
constant harmonic potential in each window could then reveal the local diffusivity there.
Specifically, we calculated the diffusion coefficient from the position autocorrelation time,8
which was estimated from the variance of the mean position in the trajectory, as described in our
previous study.9 The estimated local diffusion coefficients as well as the values after a curve
smoothing are shown in Fig. 5. The diffusion coefficients inside the hydrophobic CNTs here are
about one half of the bulk values. In comparison, our previous study revealed that for a more
Page 19 of 35
ACS Paragon Plus Environment
Journal of Chemical Information and Modeling
123456789101112131415161718192021222324252627282930313233343536373839404142434445464748495051525354555657585960
20
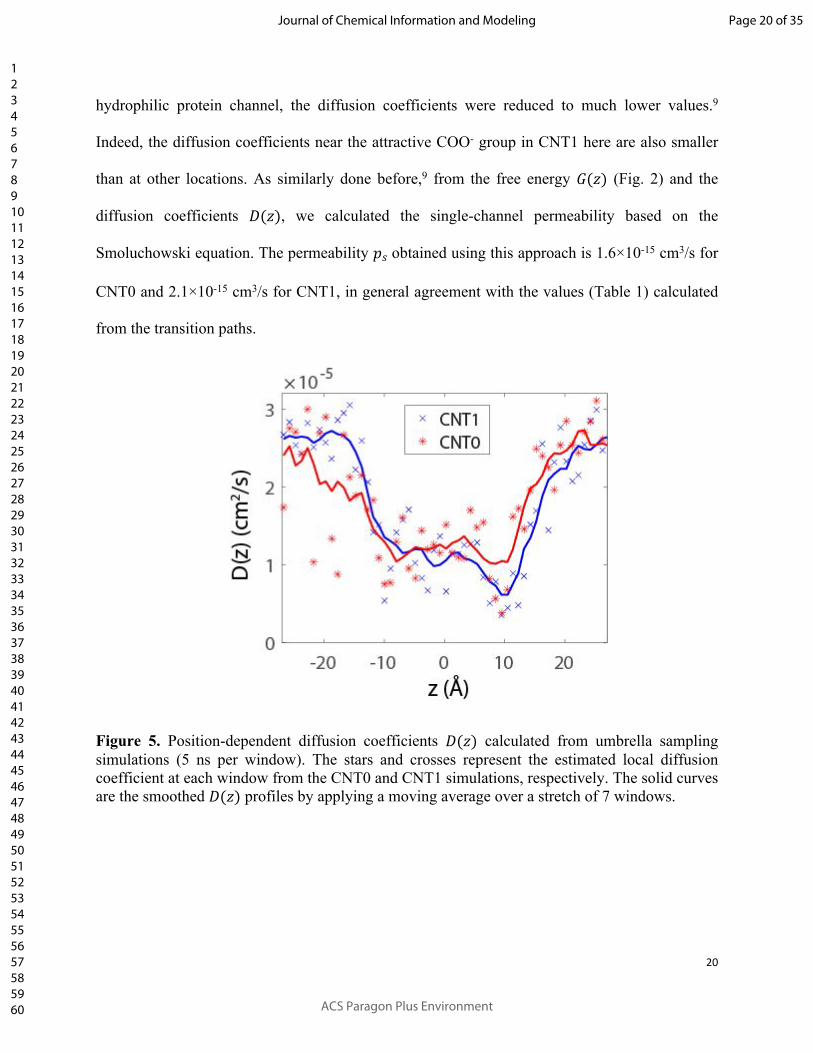
hydrophilic protein channel, the diffusion coefficients were reduced to much lower values.9
Indeed, the diffusion coefficients near the attractive COO- group in CNT1 here are also smaller
than at other locations. As similarly done before,9 from the free energy (Fig. 2) and the 𝐺(𝑧)
diffusion coefficients , we calculated the single-channel permeability based on the 𝐷(𝑧)
Smoluchowski equation. The permeability obtained using this approach is 1.6×10⁻¹⁵ cm3/s for 𝑝𝑠
CNT0 and 2.1×10⁻¹⁵ cm3/s for CNT1, in general agreement with the values (Table 1) calculated
from the transition paths.
Figure 5. Position-dependent diffusion coefficients calculated from umbrella sampling 𝐷(𝑧)simulations (5 ns per window). The stars and crosses represent the estimated local diffusion coefficient at each window from the CNT0 and CNT1 simulations, respectively. The solid curves are the smoothed profiles by applying a moving average over a stretch of 7 windows.𝐷(𝑧)
Page 20 of 35
ACS Paragon Plus Environment
Journal of Chemical Information and Modeling
123456789101112131415161718192021222324252627282930313233343536373839404142434445464748495051525354555657585960
21
DISCUSSION
In this study, we demonstrated a new method to calculate the permeability of membrane
channels, based on a one-dimensional free energy where the vertical position of a tagged solute
is typically used as the reaction coordinate. The test on the CNT1 channel shows that our method
provides reasonable predictions for the rate and the atomic details of the spontaneous crossings
in long equilibrium simulations. For channels with much slower kinetics or at much lower solute
concentrations, straightforward equilibrium simulations will become inefficient or infeasible to
capture spontaneous crossing events, whereas our method could still be readily applied.
Therefore, this method makes the calculation of single-channel permeability and conductance
more convenient and reliable.
The simulation setups here are identical to those in the classical reactive flux method.
Therefore, from these same simulations, we could also apply that method to calculate the rate.
Specifically, from the correlation between the initial ion velocity at the barrier top and the final
commitment of the ion in the unbiased trajectories, we calculated the transmission coefficient12,
13, defined as the ratio of the transition rate to the ideal rate for ballistic barrier crossing as in the
transition state theory. The calculated transmission coefficients are 0.18±0.17 for CNT0 and -
0.15±0.17 for CNT1. With the very large relative statistical uncertainties here, the reactive flux
method could only give a rough estimate for the upper bound of the transmission coefficient. In
contrast, the transmission coefficients calculated from our method are 0.019±0.004 for CNT0
and 0.018±0.006 for CNT1, thus with a much higher statistical accuracy. Therefore, our method
is clearly superior to the reactive flux method as it achieves significantly more accurate results
with the same data and computational cost. The improvement arises from the fact that whereas
Page 21 of 35
ACS Paragon Plus Environment
Journal of Chemical Information and Modeling
123456789101112131415161718192021222324252627282930313233343536373839404142434445464748495051525354555657585960

22
the reactive flux method takes only the initial velocity of each trajectory into the calculation, our
method effectively averages over all the velocities14, 15 when the dividing plane is crossed in a
transition path, thus obtaining better statistics in the cases of multiple barrier re-crossings.
As formulated previously,9 the crossing rate and single-channel permeability/conductance can
also be calculated using a diffusion model. In principle, such a model assumes that the relaxation
of orthogonal degrees of freedom is fast relative to the reaction coordinate. Also, the underlying
Smoluchowski equation in the high friction limit is only valid for time scales in which the
velocity autocorrelation function vanishes. Although the diffusion model also provides a good
estimate of the permeability (see Results) for the relatively simple and rigid CNT channels here,
a recent study54 revealed that for some small molecules in lipid bilayers, the classical
Smoluchowski equation is no longer valid due to subdiffusion behaviors. In contrast, although
our method could efficiently handle diffusive barrier crossing, it is rigorous and is not contingent
on the validity of diffusion model or the calculation of diffusion coefficients. Furthermore, our
method does not require the reaction coordinate to be perfect. In fact, whereas the quality of the
reaction coordinate can be evaluated by the fraction of the transition paths among the
forward/backward trajectory pairs, it affects only the efficiency but not the correctness of the
method.17
The kinetics of channel crossing can also be obtained by other methods that employ many
short unbiased simulation trajectories. Notably, in the milestoning approach,55, 56 the phase space
is partitioned by boundaries called milestones, which, e.g., can be hyperplanes orthogonal to the
chosen reaction coordinate. The kinetic information can then be obtained from unbiased
trajectories initiated from one milestone and reaching another, assuming that the memory of the
initial microstate has been lost. This approach is general and broadly applicable to both
Page 22 of 35
ACS Paragon Plus Environment
Journal of Chemical Information and Modeling
123456789101112131415161718192021222324252627282930313233343536373839404142434445464748495051525354555657585960

23
equilibrium and non-equilibrium processes. In contrast, our method17 is specifically designed for
two-state barrier-crossing transitions and aims to predict the rate constants that are most relevant
to experimental observables. Importantly, our method does not require the key assumption of
loss of memory as in milestoning, which is not always trivially satisfied in complex systems.
The direct outcome of our method is the single-channel permeability for ion or uncharged
solute at equilibrium. For ions, the equilibrium permeability also determines the single-channel
conductance (Eq. 4) when the ionic current is linearly proportional to both the transmembrane
voltage and the ion concentration. In contrast, to obtain the current at a high voltage beyond 𝐼 𝑉
the linear range of the - curve, one will need to explicitly apply a voltage in the simulations6 𝐼 𝑉
and evaluate the net ion flux across the channel. If such direct simulations are inefficient when
the current is small and the crossing events are rare, our method17 could similarly be applied to
calculate the ion crossing rates and the flux under the applied voltage, as long as the single-ion
conduction regime is still valid. In the presence of a voltage , there will be a difference of 𝑉 𝑒𝑉
between the baselines on the two sides of the free energy profile, and the forward and backward
crossing rates will differ by a ratio of , with the net ion flux given by the difference exp ( 𝑒𝑉𝑘𝐵𝑇)
between these two rates.
The channel crossings for the relatively simple CNTs in this study are typical two-state
transitions, as the free energy (Fig. 2) features a single barrier only. For some complex
membrane channels, in contrast, the free energy along the pore may have multiple valleys and
barriers, and our method as well as the reactive flux method may have a problem because the
solute could stay in some local free energy minima for a long time and a complete transition path
would thus be very long. In such cases, it would be advisable to consider the complete channel
Page 23 of 35
ACS Paragon Plus Environment
Journal of Chemical Information and Modeling
123456789101112131415161718192021222324252627282930313233343536373839404142434445464748495051525354555657585960
24
crossing as a sequence of multiple partial transition steps, each between two adjacent free energy
minima as metastable states. With each step being a two-state transition, its forward and
backward rates can be readily obtained by our method.17 The overall crossing rate can then be
calculated from all the stepwise transition rates. Sometimes, instead of using a single reaction
coordinate as in this study, two- or three-dimensional (2D or 3D) free energies can be defined as
a function of multiple descriptors of the solute or other degrees of freedom. If such a 2D or 3D
free energy map has been sampled, it should be feasible either to further project it onto a 1D free
energy along a single collective variable as the reaction coordinate, or to represent the solute
crossing as multiple two-state transitions described above. In both cases our method17 will be
applicable to calculate the kinetic rates.
For the (8,8) CNTs used as the test case in this study, our calculations predict a picosiemens-
conductance at a physiological KCl concentration, which is similar to the single-channel
conductance9 of some biological ion channels41. In this regard, other simulation studies23, 57
indicated that the ion ( , ) conductance depends sensitively on the size (diameter) of the Na + K +
CNT. Furthermore, given that charged functional groups are an important factor for the transport
properties of CNTs,24, 32 here we evaluated the effect of adding one carboxylate group to the (8,8)
CNT. Our calculations showed that in comparison to the pristine CNT0, the functionalized
CNT1 with a single group has only a slightly reduced free energy barrier (Fig. 2) and a COO ―
slightly larger permeability/conductance for the K+ ion (see Table 1). It appears that although the
group increases the local K+ concentration at the entrance, it does not have as much an COO ―
influence on the free energy barrier located at the center of the CNT (see Fig. 2), which is the
main determinant for the permeability. In contrast, an earlier work found that a ring of eight
groups at the entrance of a (8,8) CNT does have a very significant effect on water and ion COO ―
Page 24 of 35
ACS Paragon Plus Environment
Journal of Chemical Information and Modeling
123456789101112131415161718192021222324252627282930313233343536373839404142434445464748495051525354555657585960
25
permeation,38 which may suggest that such effects are only prominent when the total charge of
the functional groups is sufficiently large.
Ion conduction across individual CNTs or CNT membranes have also been measured in
experiments.24, 32-35, 58 Currently, MD simulations have not systematically reproduced the
experimental results. In particular, a recent experimental study42 reported that a narrow CNT
(diameter 0.68 nm) has a single-channel conductance of ~69 pS at a KCl concentration of 1 M,
which is even higher than the calculated conductance of the wider CNTs (diameter 1.08 nm) here.
Most other MD studies22, 25, 28, 57 also predicted very low conductance for CNTs with diameters
less than 1.0 nm. The source of such discrepancy should be further investigated in future studies.
Page 25 of 35
ACS Paragon Plus Environment
Journal of Chemical Information and Modeling
123456789101112131415161718192021222324252627282930313233343536373839404142434445464748495051525354555657585960
26
CONCLUSION
Our method presented here along with free energy calculations enables a rigorous and efficient
calculation of the spontaneous solute crossing rate, which further determines the single-channel
permeability and conductance, the major experimental observables for membrane channels. The
method will thus quantitatively connect MD simulations and experiments.
Page 26 of 35
ACS Paragon Plus Environment
Journal of Chemical Information and Modeling
123456789101112131415161718192021222324252627282930313233343536373839404142434445464748495051525354555657585960
27
ACKNOWLEDGEMENT
X.Z. was supported by the National Natural Science Foundation of China under Grants No.
11505156 and No.11875237 and the China Scholarship Council under Grant No. 201707260004.
Page 27 of 35
ACS Paragon Plus Environment
Journal of Chemical Information and Modeling
123456789101112131415161718192021222324252627282930313233343536373839404142434445464748495051525354555657585960

28
References
1. Alberts, B.; Johnson, A.; Lewis, J.; Raff, M.; Roberts, K.; Walter, P., Molecular Biology
of the Cell. 5th ed.; Garland Science: New York, 2008.
2. Liu, Y.; Zhu, F. Collective Diffusion Model for Ion Conduction through Microscopic
Channels. Biophys. J. 2013, 104, 368-376.
3. Roux, B.; Allen, T.; Berneche, S.; Im, W. Theoretical and Computational Models of
Biological Ion Channels. Q. Rev. Biophys. 2004, 37, 15-103.
4. Pothula, K. R.; Solano, C. J.; Kleinekathofer, U. Simulations of Outer Membrane
Channels and Their Permeability. Biochim. Biophys. Acta 2016, 1858, 1760-1771.
5. Kutzner, C.; Grubmüller, H.; de Groot, B. L.; Zachariae, U. Computational
Electrophysiology: The Molecular Dynamics of Ion Channel Permeation and Selectivity
in Atomistic Detail. Biophys. J. 2011, 101, 809-817.
6. Gumbart, J.; Khalili-Araghi, F.; Sotomayor, M.; Roux, B. Constant Electric Field
Simulations of the Membrane Potential Illustrated with Simple Systems. Biochim.
Biophys. Acta 2012, 1818, 294-302.
7. Khalili-Araghi, F.; Ziervogel, B.; Gumbart, J. C.; Roux, B. Molecular Dynamics
Simulations of Membrane Proteins under Asymmetric Ionic Concentrations. J. Gen.
Physiol. 2013, 142, 465-475.
8. Hummer, G. Position-Dependent Diffusion Coefficients and Free Energies from
Bayesian Analysis of Equilibrium and Replica Molecular Dynamics Simulations. New J.
Phys. 2005, 7, 34.
9. Zhu, F.; Hummer, G. Theory and Simulation of Ion Conduction in the Pentameric GLIC
Channel. J. Chem. Theory Comput. 2012, 8, 3759-3768.
Page 28 of 35
ACS Paragon Plus Environment
Journal of Chemical Information and Modeling
123456789101112131415161718192021222324252627282930313233343536373839404142434445464748495051525354555657585960
29
10. Lee, C. T.; Comer, J.; Herndon, C.; Leung, N.; Pavlova, A.; Swift, R. V.; Tung, C.;
Rowley, C. N.; Amaro, R. E.; Chipot, C.; Wang, Y.; Gumbart, J. C. Simulation-Based
Approaches for Determining Membrane Permeability of Small Compounds. J. Chem. Inf.
Model. 2016, 56, 721-733.
11. Bennion, B. J.; Be, N. A.; McNerney, M. W.; Lao, V.; Carlson, E. M.; Valdez, C. A.;
Malfatti, M. A.; Enright, H. A.; Nguyen, T. H.; Lightstone, F. C.; Carpenter, T. S.
Predicting a Drug's Membrane Permeability: A Computational Model Validated with in
Vitro Permeability Assay Data. J. Phys. Chem. B 2017, 121, 5228-5237.
12. Frenkel, D.; Smit, B., Understanding Molecular Simulation: From Algorithms to
Applications. 2 ed.; Academic Press: San Diego, 2002.
13. Roux, B.; Karplus, M. Ion-Transport in a Gramicidin-Like Channel - Dynamics and
Mobility. J. Phys. Chem. 1991, 95, 4856-4868.
14. Hummer, G. From Transition Paths to Transition States and Rate Coefficients. J. Chem.
Phys. 2004, 120, 516-523.
15. Best, R. B.; Hummer, G. Reaction Coordinates and Rates from Transition Paths. Proc.
Natl. Acad. Sci. U. S. A. 2005, 102, 6732-6737.
16. Daru, J.; Stirling, A. Divided Saddle Theory: A New Idea for Rate Constant Calculation.
J. Chem. Theory Comput. 2014, 10, 1121-1127.
17. Zhu, F. Calculating Transition Rates from Durations of Transition Paths. J. Chem. Phys.
2017, 146, 124128.
18. Hummer, G.; Rasaiah, J. C.; Noworyta, J. P. Water Conduction through the Hydrophobic
Channel of a Carbon Nanotube. Nature 2001, 414, 188-190.
Page 29 of 35
ACS Paragon Plus Environment
Journal of Chemical Information and Modeling
123456789101112131415161718192021222324252627282930313233343536373839404142434445464748495051525354555657585960
30
19. Zhu, F. Q.; Schulten, K. Water and Proton Conduction through Carbon Nanotubes as
Models for Biological Channels. Biophys J 2003, 85, 236-244.
20. Majumder, M.; Chopra, N.; Andrews, R.; Hinds, B. J. Nanoscale Hydrodynamics:
Enhanced Flow in Carbon Nanotubes. Nature 2005, 438, 44.
21. Lu, H. J.; Zhou, X. Y.; Wu, F. M.; Xu, Y. S. Effect of Charge on Water Filling/Emptying
Transitions of Nanochannel. J. Phys. Chem. B 2008, 112, 16777-16781.
22. Peter, C.; Hummer, G. Ion Transport through Membrane-Spanning Nanopores Studied by
Molecular Dynamics Simulations and Continuum Electrostatics Calculations. Biophys J
2005, 89, 2222-2234.
23. Song, C.; Corry, B. Intrinsic Ion Selectivity of Narrow Hydrophobic Pores. J. Phys.
Chem. B 2009, 113, 7642–7649.
24. Amiri, H.; Shepard, K. L.; Nuckolls, C.; Hernandez Sanchez, R. Single-Walled Carbon
Nanotubes: Mimics of Biological Ion Channels. Nano Lett. 2017, 17, 1204-1211.
25. Sumikama, T.; Saito, S.; Ohmine, I. Mechanism of Ion Permeation in a Model Channel:
Free Energy Surface and Dynamics of K+ Ion Transport in an Anion-Doped Carbon
Nanotube. J. Phys. Chem. B 2006, 110, 20671-20677.
26. Das, R.; Ali, M. E.; Hamid, S. B. A.; Ramakrishna, S.; Chowdhury, Z. Z. Carbon
Nanotube Membranes for Water Purification: A Bright Future in Water Desalination.
Desalination 2014, 336, 97-109.
27. Yang, H. Y.; Han, Z. J.; Yu, S. F.; Pey, K. L.; Ostrikov, K.; Karnik, R. Carbon Nanotube
Membranes with Ultrahigh Specific Adsorption Capacity for Water Desalination and
Purification. Nat. Commun. 2013, 4, 2220.
Page 30 of 35
ACS Paragon Plus Environment
Journal of Chemical Information and Modeling
123456789101112131415161718192021222324252627282930313233343536373839404142434445464748495051525354555657585960
31
28. Corry, B. Designing Carbon Nanotube Membranes for Efficient Water Desalination. J.
Phys. Chem. B 2008, 112, 1427-1434.
29. Rao, G. P.; Lu, C.; Su, F. Sorption of Divalent Metal Ions from Aqueous Solution by
Carbon Nanotubes: A Review. Sep. Purif. Technol. 2007, 58, 224-231.
30. Jae Hyun, P.; Susan, B. S.; Aluru, N. R. Ion Separation Using a Y-Junction Carbon
Nanotube. Nanotechnology 2006, 17, 895.
31. Choi, W.; Lee, C. Y.; Ham, M.-H.; Shimizu, S.; Strano, M. S. Dynamics of
Simultaneous, Single Ion Transport through Two Single-Walled Carbon Nanotubes:
Observation of a Three-State System. J. Am. Chem. Soc. 2011, 133, 203-205.
32. Wu, J.; Gerstandt, K.; Zhang, H.; Liu, J.; Hinds, B. J. Electrophoretically Induced
Aqueous Flow through Single-Walled Carbon Nanotube Membranes. Nat. Nanotech.
2012, 7, 133-139.
33. Choi, W.; Ulissi, Z. W.; Shimizu, S. F. E.; Bellisario, D. O.; Ellison, M. D.; Strano, M. S.
Diameter-Dependent Ion Transport through the Interior of Isolated Single-Walled Carbon
Nanotubes. Nat. Commun. 2013, 4, 2397.
34. Secchi, E.; Nigues, A.; Jubin, L.; Siria, A.; Bocquet, L. Scaling Behavior for Ionic
Transport and Its Fluctuations in Individual Carbon Nanotubes. Phys. Rev. Lett. 2016,
116, 154501.
35. Pang, P.; He, J.; Park, J. H.; Krstić, P. S.; Lindsay, S. Origin of Giant Ionic Currents in
Carbon Nanotube Channels. ACS Nano 2011, 5, 7277-7283.
36. Fornasiero, F.; In, J. B.; Kim, S.; Park, H. G.; Wang, Y.; Grigoropoulos, C. P.; Noy, A.;
Bakajin, O. Ph-Tunable Ion Selectivity in Carbon Nanotube Pores. Langmuir 2010, 26,
14848-14853.
Page 31 of 35
ACS Paragon Plus Environment
Journal of Chemical Information and Modeling
123456789101112131415161718192021222324252627282930313233343536373839404142434445464748495051525354555657585960
32
37. Majumder, M.; Chopra, N.; Hinds, B. J. Effect of Tip Functionalization on Transport
through Vertically Oriented Carbon Nanotube Membranes. J. Am. Chem. Soc. 2005, 127,
9062-9070.
38. Corry, B. Water and Ion Transport through Functionalised Carbon Nanotubes:
Implications for Desalination Technology. Energy & Environmental Science 2011, 4,
751-759.
39. Chan, W. F.; Chen, H.; Surapathi, A.; Taylor, M. G.; Shao, X.; Marand, E.; Johnson, J.
K. Zwitterion Functionalized Carbon Nanotube/Polyamide Nanocomposite Membranes
for Water Desalination. Acs Nano 2013, 7, 5308.
40. Fornasiero, F.; Park, H. G.; Holt, J. K.; Stadermann, M.; Grigoropoulos, C. P.; Noy, A.;
Bakajin, O. Ion Exclusion by Sub-2-Nm Carbon Nanotube Pores. Proc. Natl. Acad. Sci.
U. S. A. 2008, 105, 17250-17255.
41. Bocquet, N.; Prado de Carvalho, L.; Cartaud, J.; Neyton, J.; Le Poupon, C.; Taly, A.;
Grutter, T.; Changeux, J. P.; Corringer, P. J. A Prokaryotic Proton-Gated Ion Channel
from the Nicotinic Acetylcholine Receptor Family. Nature 2007, 445, 116-119.
42. Tunuguntla, R. H.; Henley, R. Y.; Yao, Y. C.; Pham, T. A.; Wanunu, M.; Noy, A.
Enhanced Water Permeability and Tunable Ion Selectivity in Subnanometer Carbon
Nanotube Porins. Science 2017, 357, 792.
43. MacKerell, A. D.; Bashford, D.; Bellott, M.; Dunbrack, R. L.; Evanseck, J. D.; Field, M.
J.; Fischer, S.; Gao, J.; Guo, H.; Ha, S.; Joseph-McCarthy, D.; Kuchnir, L.; Kuczera, K.;
Lau, F. T. K.; Mattos, C.; Michnick, S.; Ngo, T.; Nguyen, D. T.; Prodhom, B.; Reiher, W.
E.; Roux, B.; Schlenkrich, M.; Smith, J. C.; Stote, R.; Straub, J.; Watanabe, M.;
Page 32 of 35
ACS Paragon Plus Environment
Journal of Chemical Information and Modeling
123456789101112131415161718192021222324252627282930313233343536373839404142434445464748495051525354555657585960
33
Wiórkiewicz-Kuczera, J.; Yin, D. All-Atom Empirical Potential for Molecular Modeling
and Dynamics Studies of Proteins. J. Phys. Chem. B 1998, 102, 3586.
44. Jorgensen, W. L.; Chandrasekhar, J.; Madura, J. D.; Impey, R. W.; Klein, M. L.
Comparison of Simple Potential Functions for Simulating Liquid Water. J. Chem. Phys.
1983, 79, 926.
45. Luo, Y.; Roux, B. Simulation of Osmotic Pressure in Concentrated Aqueous Salt
Solutions. J Phys Chem Lett 2010, 1, 183-189.
46. Comer, J.; Chen, R.; Poblete, H.; Vergara-Jaque, A.; Riviere, J. E. Predicting Adsorption
Affinities of Small Molecules on Carbon Nanotubes Using Molecular Dynamics
Simulation. ACS Nano 2015, 9, 11761-11774.
47. Phillips, J. C.; Braun, R.; Wang, W.; Gumbart, J.; Tajkhorshid, E.; Villa, E.; Chipot, C.;
Skeel, R. D.; Kale, L.; Schulten, K. Scalable Molecular Dynamics with Namd. J.
Comput. Chem. 2005, 26, 1781-1802.
48. Essmann, U.; Perera, L.; Berkowitz, M. L.; Darden, T.; Lee, H.; Pedersen, L. G. A
Smooth Particle Mesh Ewald Method. J. Chem. Phys. 1995, 103, 8577-8593.
49. Fukunishi, H. On the Hamiltonian Replica Exchange Method for Efficient Sampling of
Biomolecular Systems: Application to Protein Structure Prediction. J. Chem. Phys. 2002,
116, 9058-9067.
50. Zhu, F.; Hummer, G. Convergence and Error Estimation in Free Energy Calculations
Using the Weighted Histogram Analysis Method. J Comput Chem 2012, 33, 453-465.
51. Kumar, S.; Rosenberg, J.; Bouzida, D.; Swendsen, R.; Kollman, P. The Weighted
Histogram Analysis Method for Free-Energy Calculations on Biomolecules. I. The
Method. J. Comput. Chem. 1992, 13, 1011-1021.
Page 33 of 35
ACS Paragon Plus Environment
Journal of Chemical Information and Modeling
123456789101112131415161718192021222324252627282930313233343536373839404142434445464748495051525354555657585960
34
52. Dzubiella, J.; Allen, R. J.; Hansen, J. P. Electric Field-Controlled Water Permeation
Coupled to Ion Transport through a Nanopore. J. Chem. Phys. 2004, 120, 5001-5004.
53. Humphrey, W.; Dalke, A.; Schulten, K. Vmd: Visual Molecular Dynamics. J. Mol.
Graph. 1996, 14, 33-38.
54. Chipot, C.; Comer, J. Subdiffusion in Membrane Permeation of Small Molecules. Sci Rep
2016, 6, 35913.
55. Faradjian, A. K.; Elber, R. Computing Time Scales from Reaction Coordinates by
Milestoning. J. Chem. Phys. 2004, 120, 10880-10889.
56. Elber, R. A New Paradigm for Atomically Detailed Simulations of Kinetics in
Biophysical Systems. Q. Rev. Biophys. 2017, 50, e8.
57. Samoylova, O. N.; Calixte, E. I.; Shuford, K. L. Molecular Dynamics Simulations of Ion
Transport in Carbon Nanotube Channels. J. Phys. Chem. C 2015, 119, 1659-1666.
58. Liu, H.; He, J.; Tang, J.; Liu, H.; Pang, P.; Cao, D.; Krstic, P.; Joseph, S.; Lindsay, S.;
Nuckolls, C. Translocation of Single-Stranded DNA through Single-Walled Carbon
Nanotubes. Science 2010, 327, 64-67.
Page 34 of 35
ACS Paragon Plus Environment
Journal of Chemical Information and Modeling
123456789101112131415161718192021222324252627282930313233343536373839404142434445464748495051525354555657585960
35
Page 35 of 35
ACS Paragon Plus Environment
Journal of Chemical Information and Modeling
123456789101112131415161718192021222324252627282930313233343536373839404142434445464748495051525354555657585960