Embed Size (px)
Citation preview
Calibration and uncertainty for air temperature
measurements
Stephanie Bell, Peng Miao, Jenny Wilkinson,
Michael de Podesta
National Physical Laboratory
Metrology for air temperature
9 December 2014
Contents
Temperature calibration in air at NPL
Improvement of uncertainties
Experiments in moving and still air

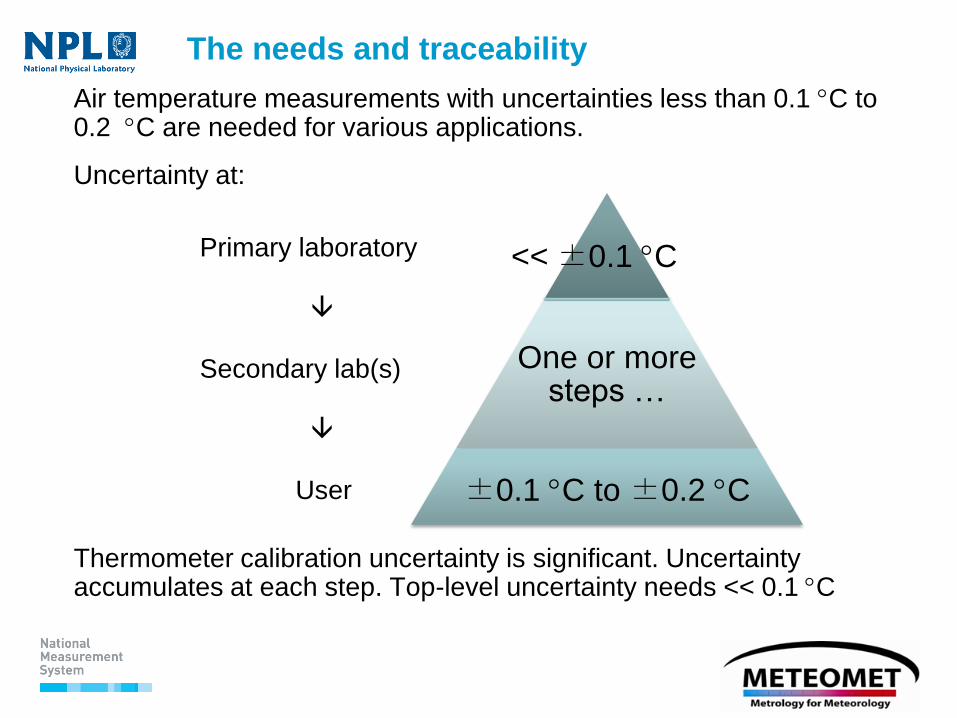
The needs and traceability
Air temperature measurements with uncertainties less than 0.1 C to 0.2 C are needed for various applications.
Uncertainty at:
Thermometer calibration uncertainty is significant. Uncertainty accumulates at each step. Top-level uncertainty needs <<0.1 C
One or more steps …
<<±0.1 C
±0.1 C to ±0.2 C
Primary laboratory
Secondary lab(s)
User
The needs
Thermometer calibration in liquid bath can have small
uncertainty (at best a few millikelvin)
But use in air incurs some extra uncertainty – different
thermal medium
Can the user judge the added uncertainty?
Thermometer performance is affected by medium (air)
effects of electrical self-heating, stem conduction, others
typical calibration in liquid bath may not reproduce
conditions of use
Calibration in medium of use (in air) allows relevant uncertainties
to be included at time of calibration
Temperature calibration in air at
NPL
Towards improved calibrations
Established NPL air temperature calibrations
(together with wide scope of humidity work)
Ranger -40 C to +100 C
Expanded uncertainty U = ±0.08 C (k=2,
coverage probability of 95 %)
Target improvement U < 0.05 C in range
-20C to +50 C
Aspects of improvement:
upgrading of facilities
improvements in uncertainty
tests under varying airflows
Smaller uncertainties require work
- extra measurements, selectivity, specialisation
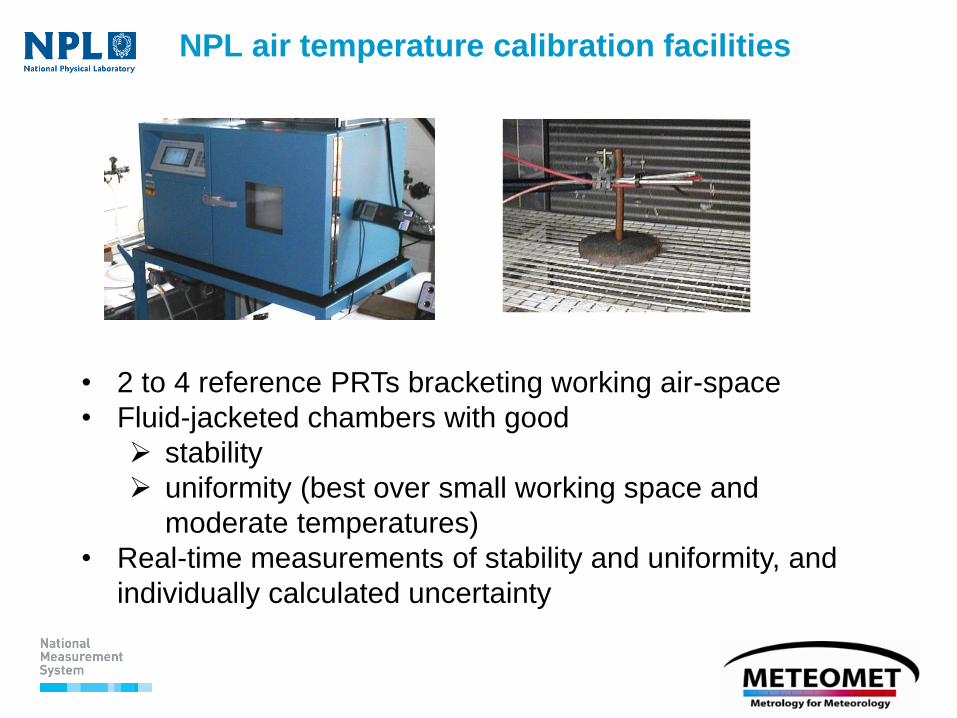
NPL air temperature calibration facilities
• 2 to 4 reference PRTs bracketing working air-space
• Fluid-jacketed chambers with good
stability
uniformity (best over small working space and
moderate temperatures)
• Real-time measurements of stability and uniformity, and
individually calculated uncertainty
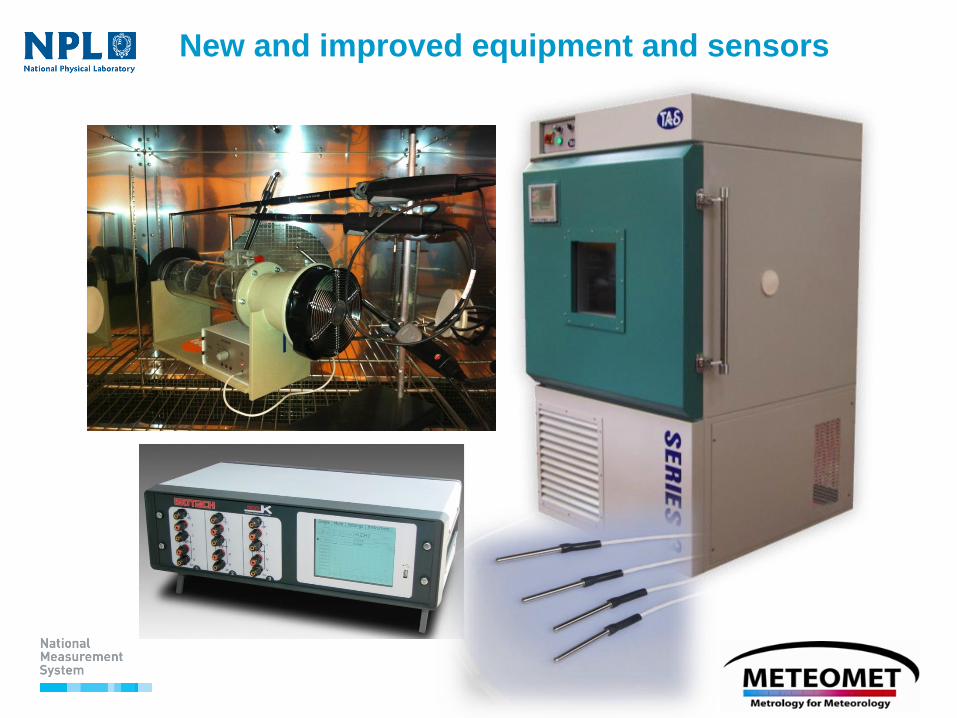
New and improved equipment and sensors
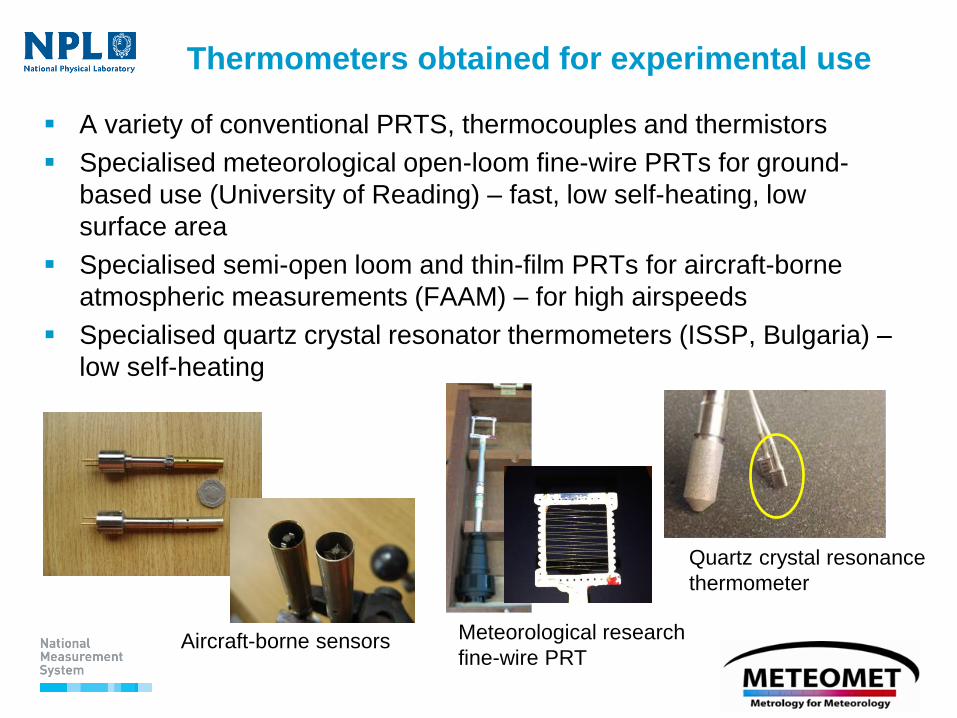
Thermometers obtained for experimental use
A variety of conventional PRTS, thermocouples and thermistors
Specialised meteorological open-loom fine-wire PRTs for ground-
based use (University of Reading) – fast, low self-heating, low
surface area
Specialised semi-open loom and thin-film PRTs for aircraft-borne
atmospheric measurements (FAAM) – for high airspeeds
Specialised quartz crystal resonator thermometers (ISSP, Bulgaria) –
low self-heating
Meteorological research
fine-wire PRT
Quartz crystal resonance
thermometer
Aircraft-borne sensors
New and improved equipment, and sensors
Larger TAS Series 3 lTCL/LT climatic chamber range -75 C
to +180 C.
Additional Isotech “MicroK” temperature bridge and channel
expander
Testo miniature airflow tunnel and air velocity sensors
New reference PRTs
Additional thermometers for study purposes
A variety of conventional PRTS, thermocouples and
thermistors
Some specialised and novel temperature sensors for
demonstration purposes
Typical main sources of uncertainty for
temperature calibrations in air
Chamber air temperature non-uniformity
Chamber air temperature instability
Reference thermometer
calibration uncertainty
drift (between calibrations)
self-heating
stem or lead conduction (heat leak)
Electrical measurements (resistance bridge or
multimeter)
calibration, drift, etc …
Approach to improving measurement
uncertainties
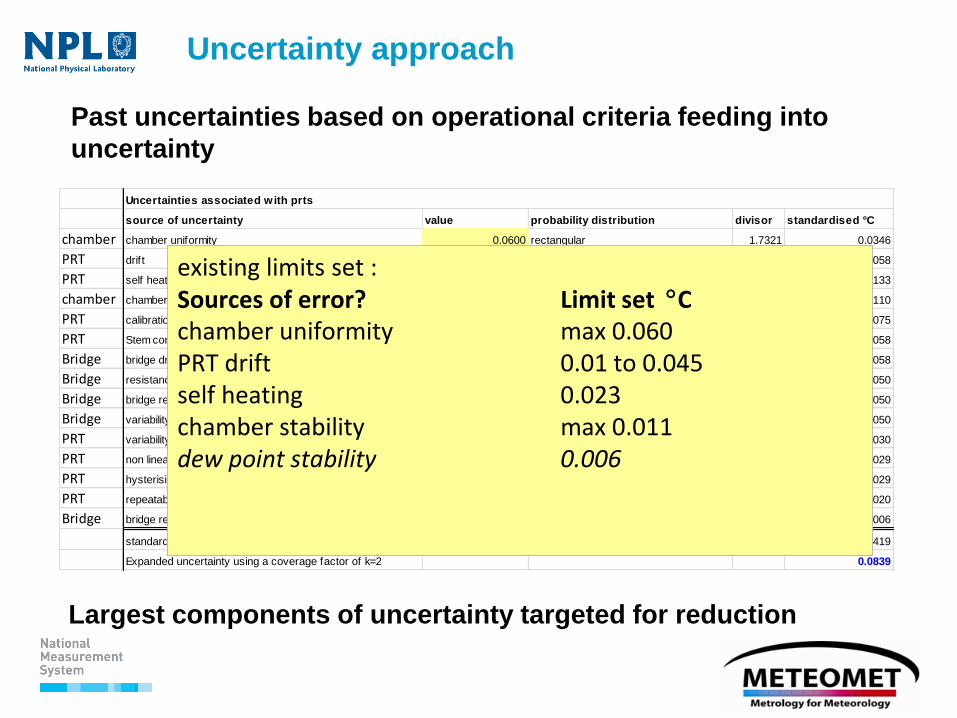
Uncertainty approach
Past uncertainties based on operational criteria feeding into
uncertainty
source of uncertainty value probability distribution divisor standardised °C
chamber chamber uniformity 0.0600 rectangular 1.7321 0.0346
PRT drift 0.01 rectangular 1.7321 0.0058
PRT self heating 0.023 rectangular 1.7321 0.0133
chamber chamber stability 0.0110 normal 1.0000 0.0110
PRT calibration uncertainty 0.015 normal 2.0000 0.0075
PRT Stem conduction 0.01 rectangular 1.7321 0.0058
Bridge bridge drift 0.01 rectangular 1.7321 0.0058
Bridge resistance bridge calibration 0.01 normal 2.0000 0.0050
Bridge bridge repeatability 0.005 normal 1.0000 0.0050
Bridge variability in drift calculation 0.005 normal 1.0000 0.0050
PRT variability in drift calculation 0.003 normal 1.0000 0.0030
PRT non linearity 0.005 rectangular 1.7321 0.0029
PRT hysterisis 0.005 rectangular 1.7321 0.0029
PRT repeatability 0.002 normal 1.0000 0.0020
Bridge bridge resolution 0.001 rectangular 1.7321 0.0006
standard unc 0.0419
Expanded uncertainty using a coverage factor of k=2 0.0839
Uncertainties associated with prts
existing limits set : Sources of error? Limit set C chamber uniformity max 0.060 PRT drift 0.01 to 0.045 self heating 0.023 chamber stability max 0.011 dew point stability 0.006
Largest components of uncertainty targeted for reduction
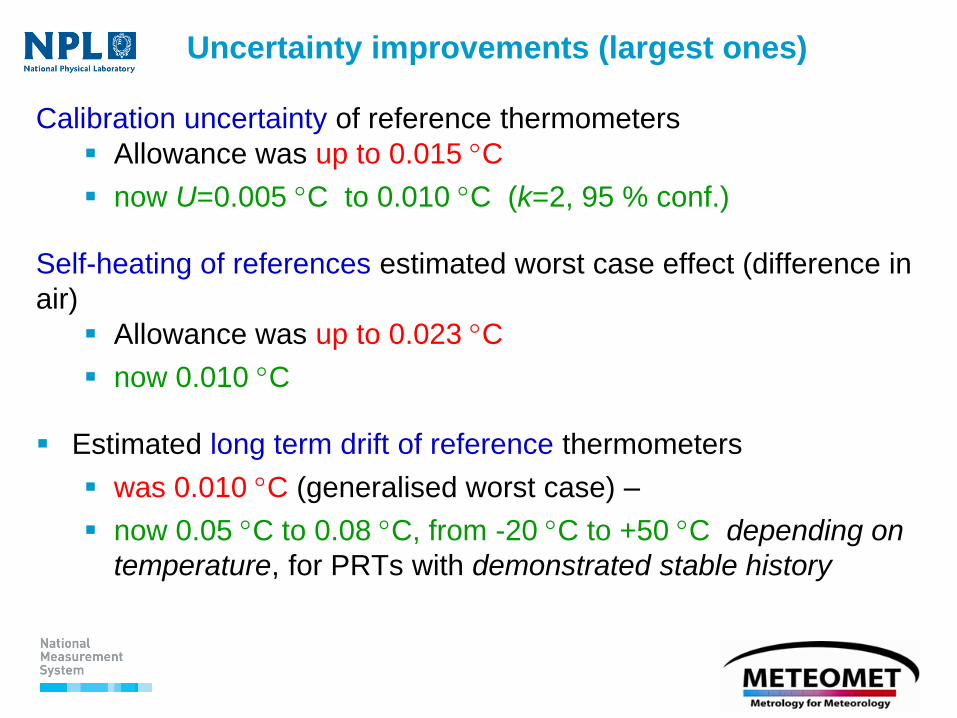
Uncertainty improvements (largest ones)
Calibration uncertainty of reference thermometers
Allowance was up to 0.015 C
now U=0.005 C to 0.010 C (k=2, 95 % conf.)
Self-heating of references estimated worst case effect (difference in
air)
Allowance was up to 0.023 C
now 0.010 C
Estimated long term drift of reference thermometers
was 0.010 C (generalised worst case) –
now 0.05 C to 0.08 C, from -20 C to +50 C depending on
temperature, for PRTs with demonstrated stable history
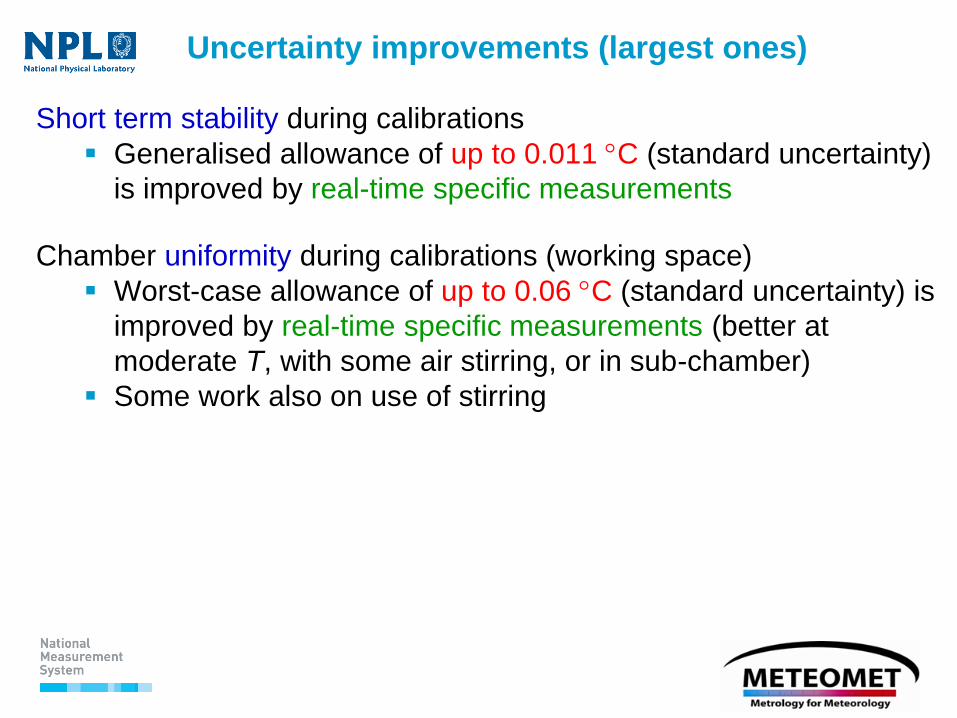
Uncertainty improvements (largest ones)
Short term stability during calibrations
Generalised allowance of up to 0.011 C (standard uncertainty)
is improved by real-time specific measurements
Chamber uniformity during calibrations (working space)
Worst-case allowance of up to 0.06 C (standard uncertainty) is
improved by real-time specific measurements (better at
moderate T, with some air stirring, or in sub-chamber)
Some work also on use of stirring
Uncertainty improvement
The improvement strategies summarised:
Instead of generalisation: specialisation
- such as by range – lower uncertainties at “easier
temperatures”
Real-time measurements of influence variable
- not worst-case general estimates
Selecting best-performing reference PRTs
- less-good ones non critical uses
Uncertainty re-evaluation every time – case by case, not
generalised
Reducing uncertainty takes work
Uncertainty modelling
Modelling is not enough by itself, the improvements must be
achieved
Other aspects of best practice
Use of a sub-chamber – can damp fluctuations due to climatic
chamber control cycles
Immersion – aim to completely immerse the sensors in the thermal
medium (chamber) to avoid heat leaks across different temperature
zones.
Avoidance of lead conduction - heat can leaks along cables:
minimise this by placing the sensor leads mainly inside the
chamber if possible.
Screening from thermal radiation - chambers that have heating
and cooling elements in line of sight. Fluid-jacketed chambers
usually have more thermally uniform surfaces.
Plus others …
Flow testing of thermometers
Thermometers in flowing air
Thermometers and other sensors can be affected by still/flowing air
Self-heating, turbulence …
Calibration usually does not test these effects
For PRTs with electrical resistance bridge measurements – effect of
self-heating can be measured by applying variations in current
(power) supplied to sensor
Effect of self-heating can vary from single millikelvins to ~0.1 C
But not all thermometers can be tested this way
An alternative is to vary airflow to detect self heating
We studied this using miniature wind tunnel and air velocity sensors,
and combinations of thermometers
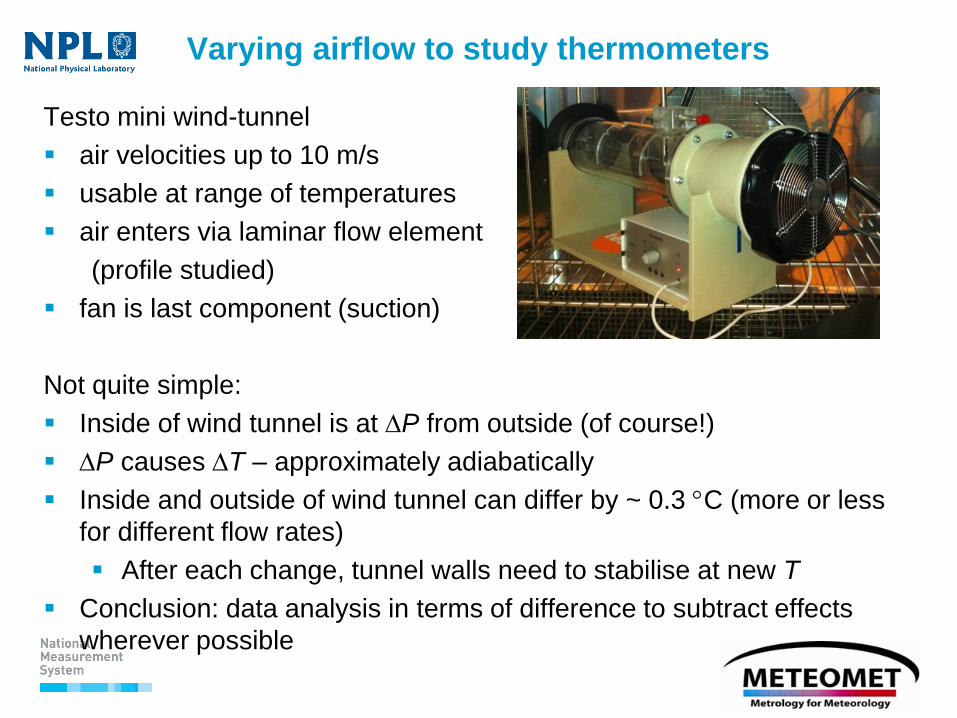
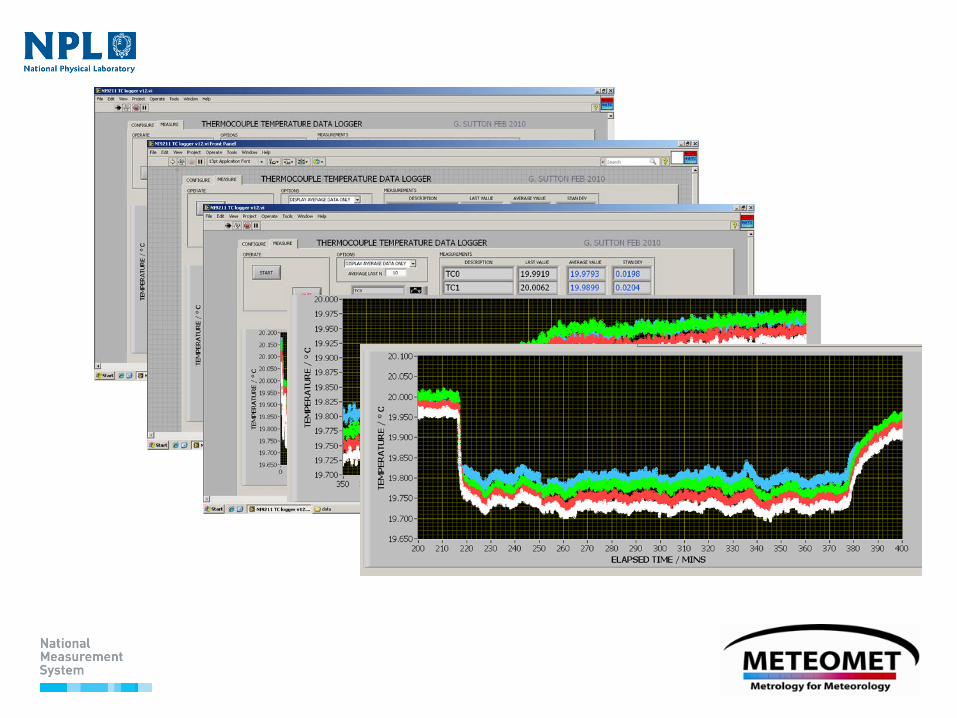
Varying airflow to study thermometers
Testo mini wind-tunnel
air velocities up to 10 m/s
usable at range of temperatures
air enters via laminar flow element
(profile studied)
fan is last component (suction)
Not quite simple:
Inside of wind tunnel is at P from outside (of course!)
P causes T – approximately adiabatically
Inside and outside of wind tunnel can differ by ~ 0.3 C (more or less
for different flow rates)
After each change, tunnel walls need to stabilise at new T
Conclusion: data analysis in terms of difference to subtract effects
wherever possible
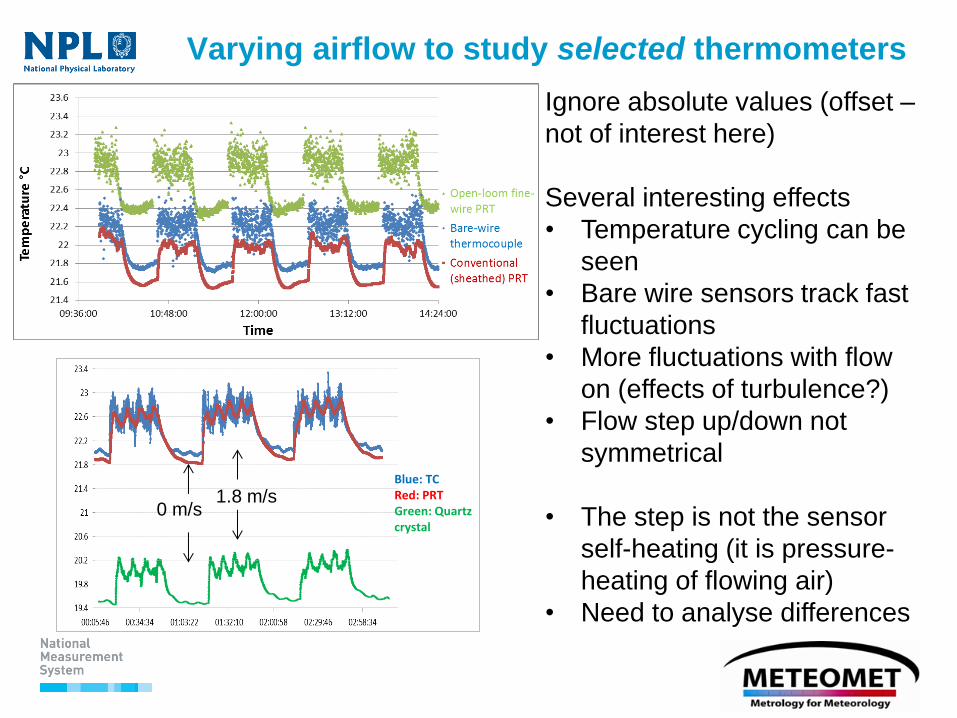
Varying airflow to study selected thermometers
Ignore absolute values (offset –
not of interest here)
Several interesting effects
• Temperature cycling can be
seen
• Bare wire sensors track fast
fluctuations
• More fluctuations with flow
on (effects of turbulence?)
• Flow step up/down not
symmetrical
• The step is not the sensor
self-heating (it is pressure-
heating of flowing air)
• Need to analyse differences
Blue: TC Red: PRT Green: Quartz crystal
1.8 m/s 0 m/s
30 minute
intervals
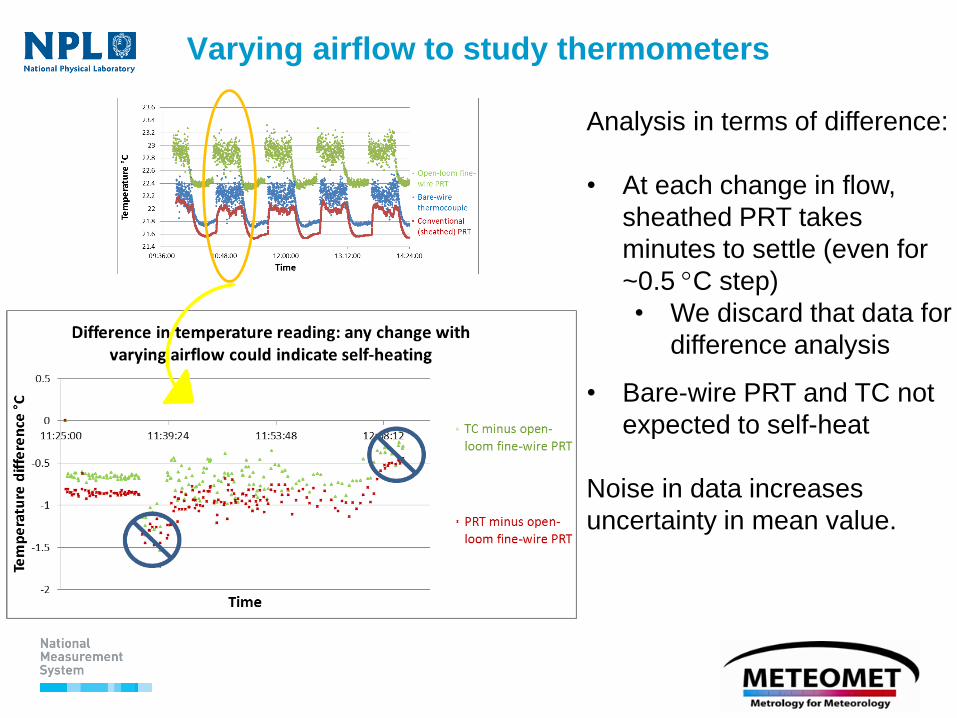
Varying airflow to study thermometers
Analysis in terms of difference:
• At each change in flow,
sheathed PRT takes
minutes to settle (even for
~0.5 C step)
• We discard that data for
difference analysis
• Bare-wire PRT and TC not
expected to self-heat
Noise in data increases
uncertainty in mean value.
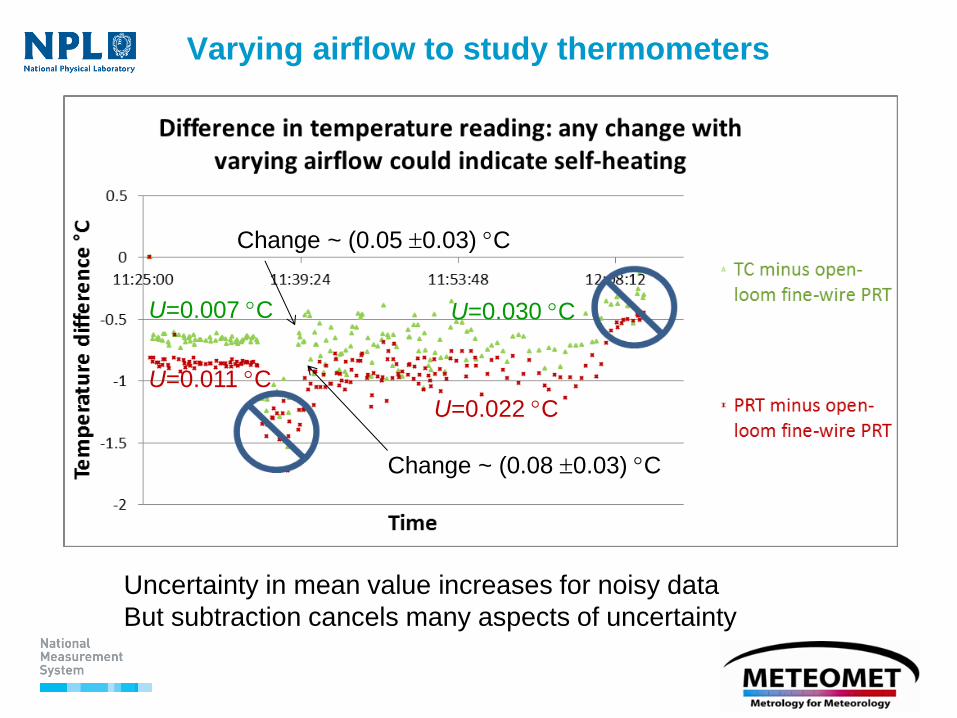
Varying airflow to study thermometers
Uncertainty in mean value increases for noisy data
But subtraction cancels many aspects of uncertainty
Change ~ (0.05 0.03) C
Change ~ (0.08 0.03) C
U=0.007 C U=0.030 C
U=0.022 C
U=0.011 C
Further investigation
We studied thermometers in airflows of 0 to 10 m/s
But we saw a number of effects we did not understand
due to air temperature changes, or sensor response, or
airflow phenomena?
Tried
wind-tunnel inside climatic chamber
… with chamber control switched off
well-controlled laboratory space
Finally, close-control dimensional laboratory
- better than 0.1 C (actually much better over small
working space)
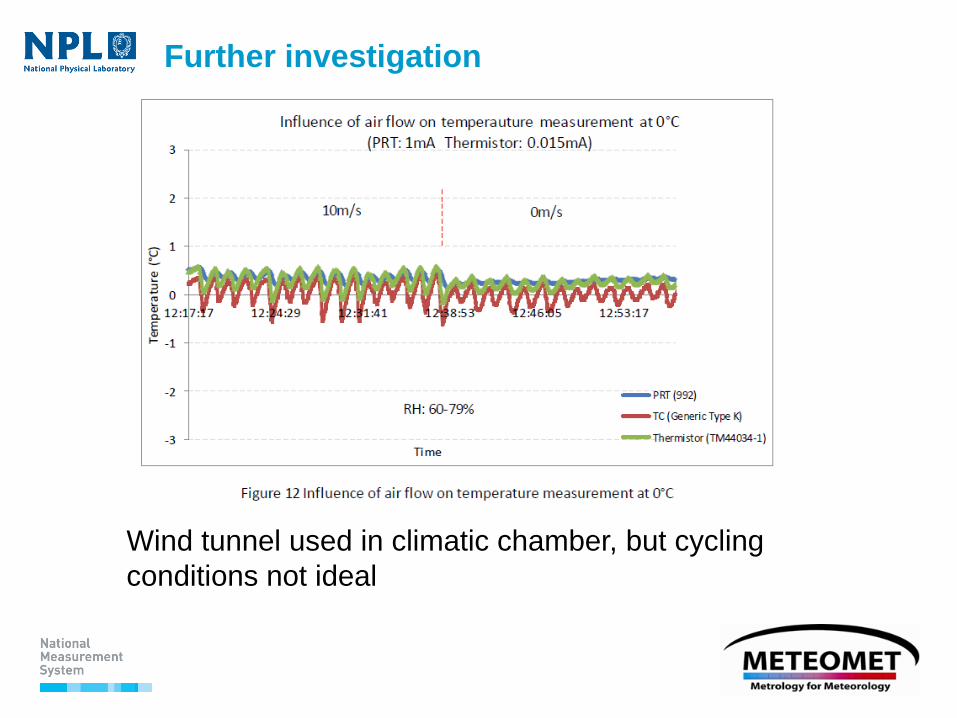
Further investigation
Wind tunnel used in climatic chamber, but cycling
conditions not ideal
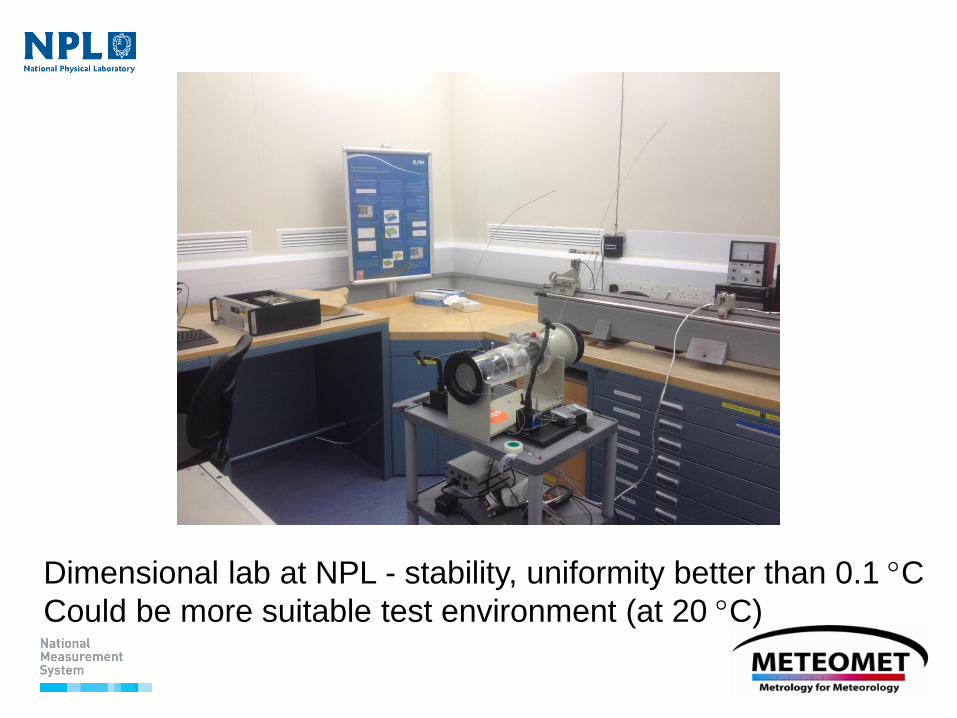
Dimensional lab at NPL - stability, uniformity better than 0.1 C
Could be more suitable test environment (at 20 C)
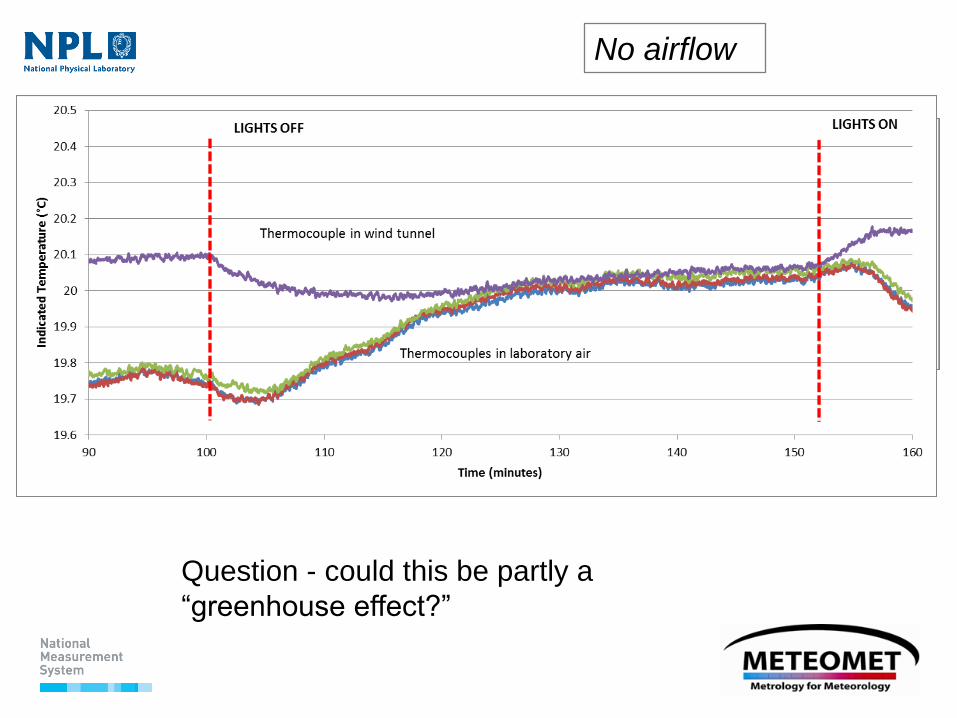
No airflow
Question - could this be partly a
“greenhouse effect?”
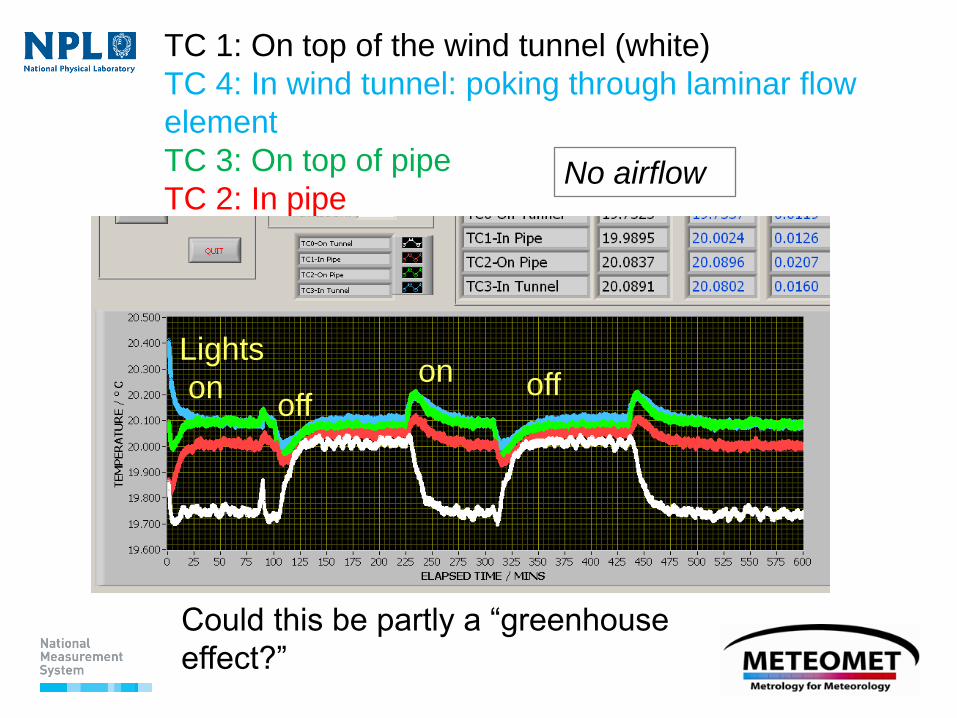
TC 1: On top of the wind tunnel (white)
TC 4: In wind tunnel: poking through laminar flow
element
TC 3: On top of pipe
TC 2: In pipe
Lights
on off on off
No airflow
Could this be partly a “greenhouse
effect?”
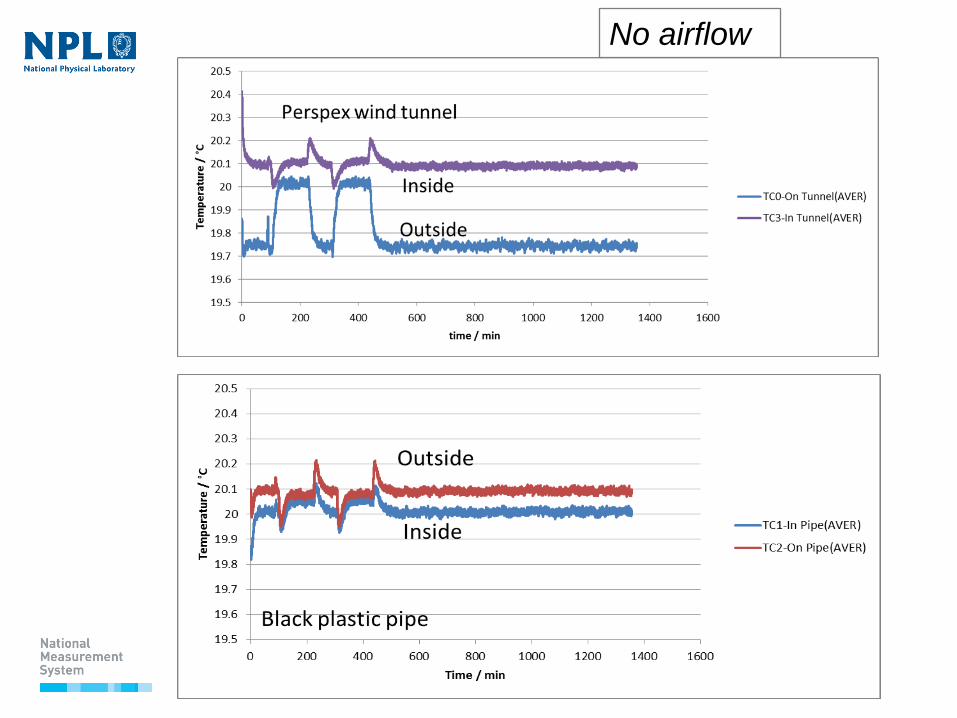
No airflow
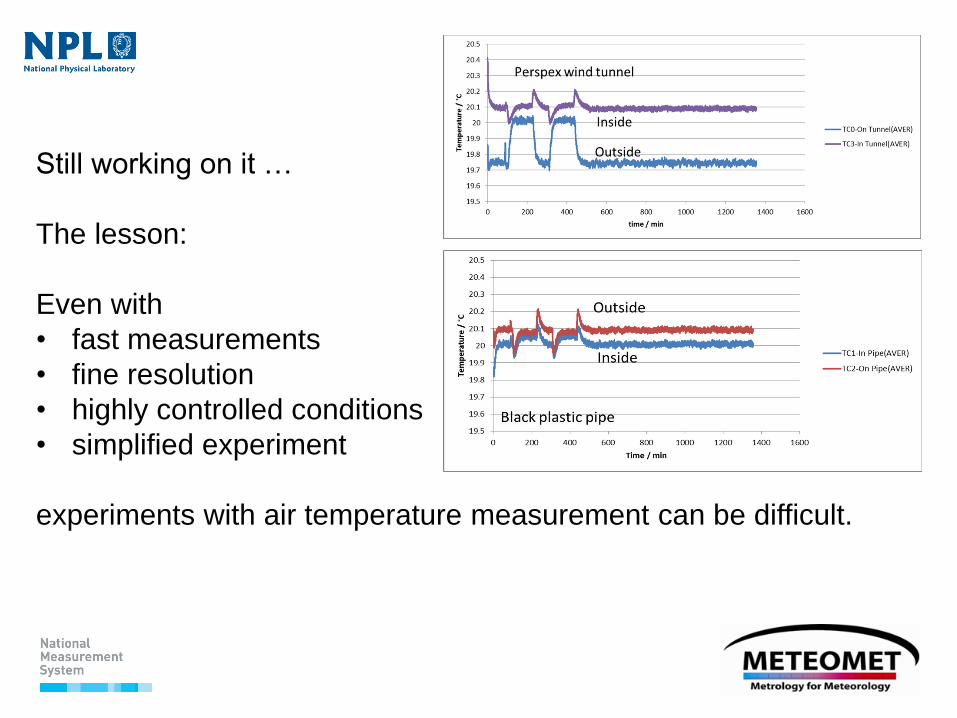
Still working on it …
The lesson:
Even with
• fast measurements
• fine resolution
• highly controlled conditions
• simplified experiment
experiments with air temperature measurement can be difficult.
Acknowledgements
This work was carried out as part of the EMRP collaborative project
MeteoMet – Metrology for Meteorology (JRP ENV 07).
It was co-funded by the UK National Measurement System Programme for
Engineering and Flow Metrology.
The EMRP is jointly funded by the EMRP participating countries within
EURAMET and the European Union.
We gratefully acknowledge
Prof Giles Harrison of University of Reading UK
Alan Woolley of FAAM
Prof Lozan Spassov of ISSP, Bulgaria
for supplying novel air temperature sensors to the project.