Embed Size (px)
Citation preview
CALIBRATION OF TETHERED PARTICLE MOTION
EXPERIMENTS
LIN HAN∗, BERTRAND LUI∗† , SETH BLUMBERG∗‡ , JOHN F. BEAUSANG§ ,
PHILIP C. NELSON§ , AND ROB PHILLIPS∗¶
Abstract. The Tethered Particle Motion (TPM) method has been used to observeand characterize a variety of protein-DNA interactions including DNA looping and tran-scription. TPM experiments exploit the Brownian motion of a DNA-tethered bead toprobe biologically relevant conformational changes of the tether. In these experiments, achange in the extent of the bead’s random motion is used as a reporter of the underlyingmacromolecular dynamics and is often deemed sufficient for TPM analysis. However,a complete understanding of how the motion depends on the physical properties of thetethered particle complex would permit more quantitative and accurate evaluation ofTPM data. For instance, such understanding can help extract details about a loopedcomplex geometry (or multiple coexisting geometries) from TPM data. To better char-acterize the measurement capabilities of TPM experiments involving DNA tethers, wehave carried out a detailed calibration of TPM magnitude as a function of DNA lengthand particle size. We also explore how experimental parameters such as acquisitiontime and exposure time affect the apparent motion of the tethered particle. We varythe DNA length from 200 bp to 2.6 kbp and consider particle diameters of 200, 490 and970 nm. We also present a systematic comparison between measured particle excursionsand theoretical expectations, which helps clarify both the experiments and models ofDNA conformation.
Key words. Tethered particle; DNA; Brownian motion; calibration; single molecule
AMS(MOS) subject classifications. Primary 92C05; secondary 92C40, 92C37.
∗Department of Applied Physics, California Institute of Technology, Pasadena CA91125. Partially supported by the Keck Foundation, National Science Foundation grantsCMS-0301657 and CMS-0404031, and the National Institutes of Health Director’s Pio-neer Award grant DP1 OD000217.
†Current address: Department of Bioengineering, Stanford University, Stanford, CA.‡Current address: University of Michigan Medical Scientist Training Program, Ann
Arbor, MI 48109.§Department of Physics and Astronomy, University of Pennsylvania, Philadelphia PA
19104. Partially supported by NSF grants DGE-0221664, DMR04-25780, and DMR-0404674.
¶Corresponding author: [email protected].
1
2 L. HAN, B. LUI, S. BLUMBERG, J. BEAUSANG, P. NELSON, R PHILLIPS
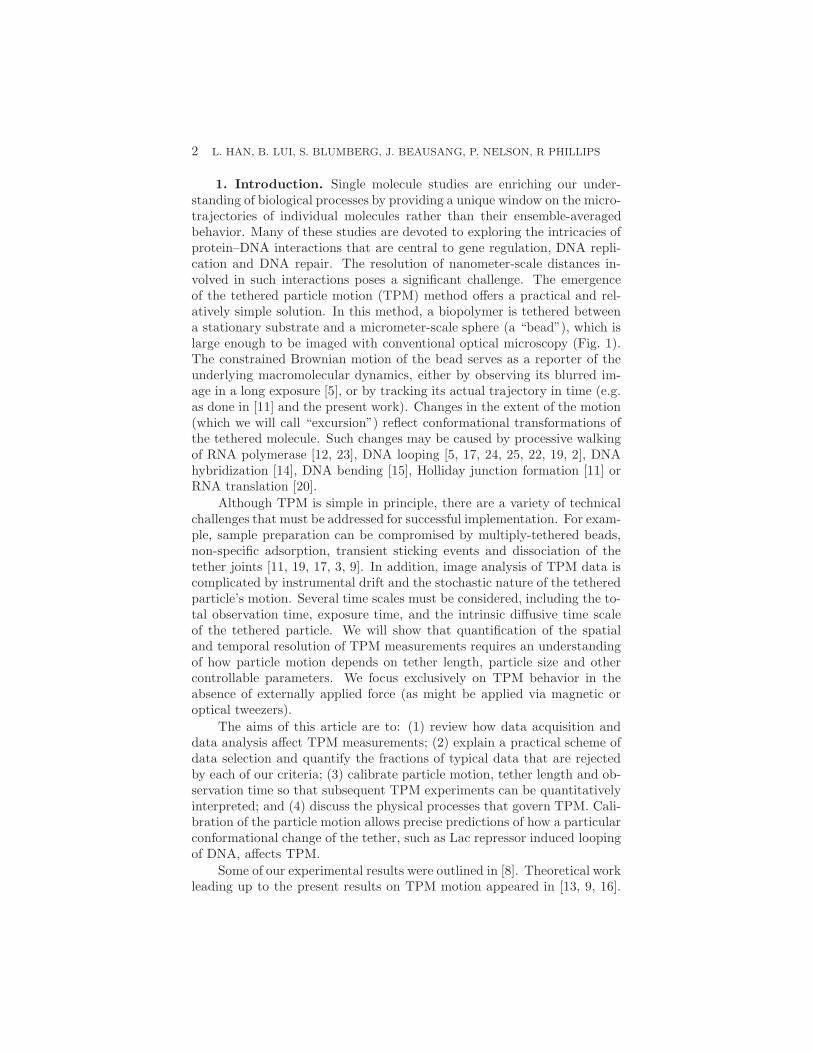
1. Introduction. Single molecule studies are enriching our under-standing of biological processes by providing a unique window on the micro-trajectories of individual molecules rather than their ensemble-averagedbehavior. Many of these studies are devoted to exploring the intricacies ofprotein–DNA interactions that are central to gene regulation, DNA repli-cation and DNA repair. The resolution of nanometer-scale distances in-volved in such interactions poses a significant challenge. The emergenceof the tethered particle motion (TPM) method offers a practical and rel-atively simple solution. In this method, a biopolymer is tethered betweena stationary substrate and a micrometer-scale sphere (a “bead”), which islarge enough to be imaged with conventional optical microscopy (Fig. 1).The constrained Brownian motion of the bead serves as a reporter of theunderlying macromolecular dynamics, either by observing its blurred im-age in a long exposure [5], or by tracking its actual trajectory in time (e.g.as done in [11] and the present work). Changes in the extent of the motion(which we will call “excursion”) reflect conformational transformations ofthe tethered molecule. Such changes may be caused by processive walkingof RNA polymerase [12, 23], DNA looping [5, 17, 24, 25, 22, 19, 2], DNAhybridization [14], DNA bending [15], Holliday junction formation [11] orRNA translation [20].
Although TPM is simple in principle, there are a variety of technicalchallenges that must be addressed for successful implementation. For exam-ple, sample preparation can be compromised by multiply-tethered beads,non-specific adsorption, transient sticking events and dissociation of thetether joints [11, 19, 17, 3, 9]. In addition, image analysis of TPM data iscomplicated by instrumental drift and the stochastic nature of the tetheredparticle’s motion. Several time scales must be considered, including the to-tal observation time, exposure time, and the intrinsic diffusive time scaleof the tethered particle. We will show that quantification of the spatialand temporal resolution of TPM measurements requires an understandingof how particle motion depends on tether length, particle size and othercontrollable parameters. We focus exclusively on TPM behavior in theabsence of externally applied force (as might be applied via magnetic oroptical tweezers).
The aims of this article are to: (1) review how data acquisition anddata analysis affect TPM measurements; (2) explain a practical scheme ofdata selection and quantify the fractions of typical data that are rejectedby each of our criteria; (3) calibrate particle motion, tether length and ob-servation time so that subsequent TPM experiments can be quantitativelyinterpreted; and (4) discuss the physical processes that govern TPM. Cali-bration of the particle motion allows precise predictions of how a particularconformational change of the tether, such as Lac repressor induced loopingof DNA, affects TPM.
Some of our experimental results were outlined in [8]. Theoretical workleading up to the present results on TPM motion appeared in [13, 9, 16].
CALIBRATION OF TETHERED PARTICLE MOTION EXPERIMENTS 3
(a) (b)
Ly
x
Rbead
Fig. 1. Idea of the tethered particle motion method. Cartoons showing thetethered bead in the (a) absence and (b) presence of a DNA-binding protein,which changes the effective tether length by looping and/or bending the DNA.For example, Lac repressor protein (LacR) has two binding sites, which recognizeand bind to two specific sequences (“operators”) on DNA.
For example, Segall et al. predicted effects of changing the size of the beadand tether length, which we document experimentally in the present work.Our results are preparatory to experimental [7] and theoretical [16] workon DNA looping in the lac operon system.
2. Results and Discussion. Using differential interference contrast(DIC) microscopy, the projected position of several beads in a field of vieware recorded using a CCD camera. Sub-pixel resolution position traces foreach bead in the image is determined using a cross-correlation method [6].Standard microscopy systems such as ours are limited to two spatial dimen-sions; tracking of three dimensions has been accomplished using evanescentfields or diffraction rings [3], but this involves additional calibration andtechnical challenges. Two-dimensional tracking is sufficient for the applica-tions we have in mind, such as DNA-looping studies. The tracked positionof the bead is subject to slow drift, due to vibrations of the experimen-tal apparatus, which we removed using a first order Butterworth filter at0.05Hz cutoff frequency [19]. To quantify bead excursion, we then usedthe square root of the sum of the variances of the drift corrected particleposition (x, y) along two orthogonal image-plane axes:
RMSt =√
〈(x − x)2 + (y − y)2〉t. (2.1)
Here t is the time interval over which the RMS motion is measured (typ-ically 4 s); x and y represent the average of x and y over time t. Eq. 2.1is evaluated as a sliding filter at each point along the trajectory, and per-mits us to capture the tether dynamics using a single scalar quantity, asillustrated in Fig. 7 below. The finite-sample means x, y are subtractedas an additional method of eliminating instrumental drift not removed bythe Butterworth filter; in practice, this subtraction has little effect. Whensimulating the motion numerically, we will compute the same quantity asEq. 2.1, in order to make an appropriate comparison.
4 L. HAN, B. LUI, S. BLUMBERG, J. BEAUSANG, P. NELSON, R PHILLIPS
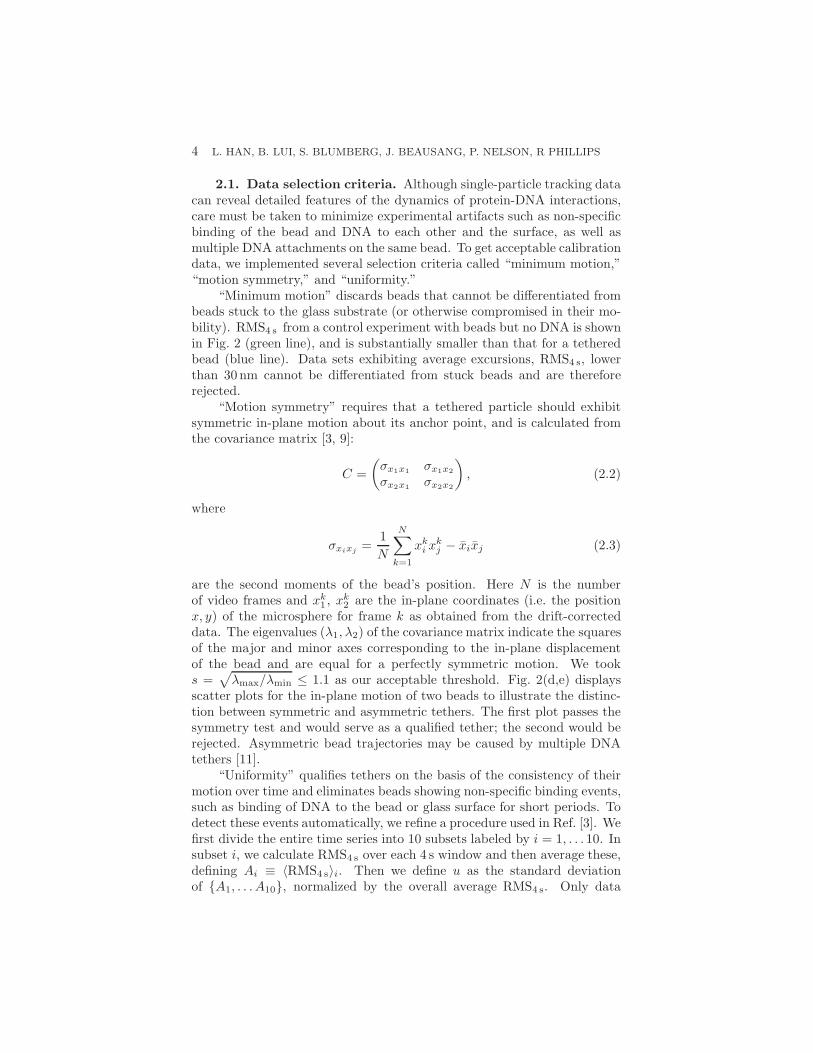
2.1. Data selection criteria. Although single-particle tracking datacan reveal detailed features of the dynamics of protein-DNA interactions,care must be taken to minimize experimental artifacts such as non-specificbinding of the bead and DNA to each other and the surface, as well asmultiple DNA attachments on the same bead. To get acceptable calibrationdata, we implemented several selection criteria called “minimum motion,”“motion symmetry,” and “uniformity.”
“Minimum motion” discards beads that cannot be differentiated frombeads stuck to the glass substrate (or otherwise compromised in their mo-bility). RMS4 s from a control experiment with beads but no DNA is shownin Fig. 2 (green line), and is substantially smaller than that for a tetheredbead (blue line). Data sets exhibiting average excursions, RMS4 s, lowerthan 30 nm cannot be differentiated from stuck beads and are thereforerejected.
“Motion symmetry” requires that a tethered particle should exhibitsymmetric in-plane motion about its anchor point, and is calculated fromthe covariance matrix [3, 9]:
C =
(
σx1x1σx1x2
σx2x1σx2x2
)
, (2.2)
where
σxixj=
1
N
N∑
k=1
xki xk
j − xixj (2.3)
are the second moments of the bead’s position. Here N is the numberof video frames and xk
1 , xk2 are the in-plane coordinates (i.e. the position
x, y) of the microsphere for frame k as obtained from the drift-correcteddata. The eigenvalues (λ1, λ2) of the covariance matrix indicate the squaresof the major and minor axes corresponding to the in-plane displacementof the bead and are equal for a perfectly symmetric motion. We tooks =
√
λmax/λmin ≤ 1.1 as our acceptable threshold. Fig. 2(d,e) displaysscatter plots for the in-plane motion of two beads to illustrate the distinc-tion between symmetric and asymmetric tethers. The first plot passes thesymmetry test and would serve as a qualified tether; the second would berejected. Asymmetric bead trajectories may be caused by multiple DNAtethers [11].
“Uniformity” qualifies tethers on the basis of the consistency of theirmotion over time and eliminates beads showing non-specific binding events,such as binding of DNA to the bead or glass surface for short periods. Todetect these events automatically, we refine a procedure used in Ref. [3]. Wefirst divide the entire time series into 10 subsets labeled by i = 1, . . . 10. Insubset i, we calculate RMS4 s over each 4 s window and then average these,defining Ai ≡ 〈RMS4 s〉i. Then we define u as the standard deviationof {A1, . . . A10}, normalized by the overall average RMS4 s. Only data
CALIBRATION OF TETHERED PARTICLE MOTION EXPERIMENTS 5
200
400
600
0
20
−500 0
−500
0
500
y [nm
]
0 50 100 150 200
200
400
600 [nm
]
Time [s]
0 400
0
400
x [nm]
y [nm
]
0
200
400
600
(b)
(a)
(c)
(e)
(d)
(x2
+y2)1
/2
or
RM
St
0 30 60 90 120 150 180 210 240 270 300 3300
20
40
60
80
100
120
140
[nm]
Nu
mb
er
of b
ea
ds
Original Data
Minimum Motion
Symmetry
Uniformity
RMS4s
(f)
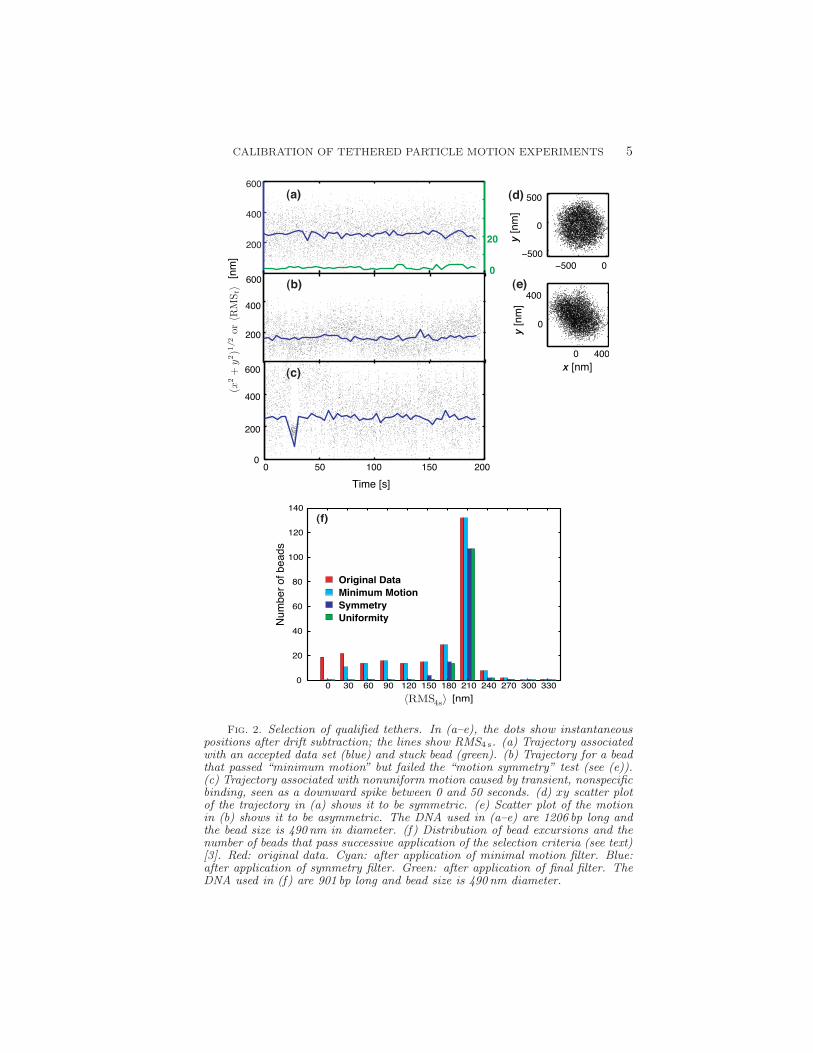
Fig. 2. Selection of qualified tethers. In (a–e), the dots show instantaneouspositions after drift subtraction; the lines show RMS4 s. (a) Trajectory associatedwith an accepted data set (blue) and stuck bead (green). (b) Trajectory for a beadthat passed “minimum motion” but failed the “motion symmetry” test (see (e)).(c) Trajectory associated with nonuniform motion caused by transient, nonspecificbinding, seen as a downward spike between 0 and 50 seconds. (d) xy scatter plotof the trajectory in (a) shows it to be symmetric. (e) Scatter plot of the motionin (b) shows it to be asymmetric. The DNA used in (a–e) are 1206 bp long andthe bead size is 490 nm in diameter. (f) Distribution of bead excursions and thenumber of beads that pass successive application of the selection criteria (see text)[3]. Red: original data. Cyan: after application of minimal motion filter. Blue:after application of symmetry filter. Green: after application of final filter. TheDNA used in (f) are 901 bp long and bead size is 490 nm diameter.
6 L. HAN, B. LUI, S. BLUMBERG, J. BEAUSANG, P. NELSON, R PHILLIPS
sets with relative standard deviation u < 0.2 are accepted. For example,the bead shown in Fig. 2(c) meets the motion and symmetry criterions;however, it displays a non-specific binding event at 30s. In short, our thirdcriterion removes tethers with temporal inconsistency in their Brownianmotion.
The first two selection criteria discard tethers that are permanently de-fective, whereas the third eliminates time series with undesirable transientevents. Note that if the purpose of the experiment is to identify interestingmolecular binding events, such as those leading to DNA looping or bending,then the last criterion cannot be applied, because these transient events canappear similar to the sticking events rejected by the uniformity criterion.In the present work we aimed at characterizing uniform DNA tethers, so weenforced all three criteria. Prior to applying the selection criteria, Fig. 2(f)displays a broad distribution in the measured RMS4 s (red). Afterwards,∼ 50% of the data are qualified and exhibit well-defined Brownian motion(green bars). This figure shows that the primary cause of bead rejection isasymmetric in-plane motion. Experimentally, beads with multiple tetherscan be minimized by reducing the concentration of DNA.
2.2. Acquisition Time. The drift-corrected (x, y) trajectories arenoisy due to the stochastic Brownian motion of the particle, and are thusfiltered using Eq. 2.1 over a particular time window t (usually four seconds).Although analysis methods exist that make no use of this windowing step [2,1], nevertheless many experiments do use it, and so we investigated its effecton reported bead excursion. Too short a window will increase the noise,leading to broad peaks in the distribution of RMSt that makes signals fromdifferently sized tethers too difficult distinguish. Moreover, for short t thebead will not adequately explore its full range of accessible configurations,leading to an underestimate of RMSt , as we document below. At theother extreme, however, too long a window will result in a loss of temporalresolution.
To determine the optimum TPM window size, we recorded data for200 s, for several bead sizes and a wide range of tether lengths, then found
the mean (〈RMSt 〉) and standard deviation (stdt =√
〈RMS2
t 〉 − 〈RMSt 〉2)
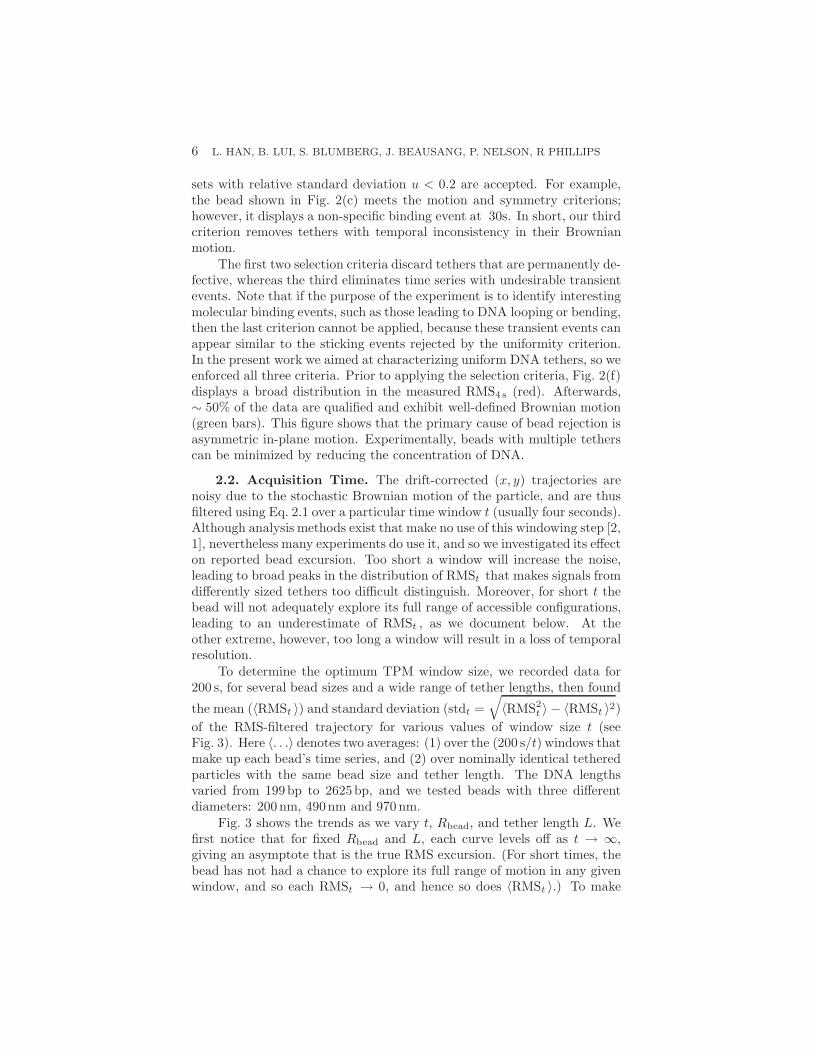
of the RMS-filtered trajectory for various values of window size t (seeFig. 3). Here 〈. . .〉 denotes two averages: (1) over the (200 s/t) windows thatmake up each bead’s time series, and (2) over nominally identical tetheredparticles with the same bead size and tether length. The DNA lengthsvaried from 199bp to 2625bp, and we tested beads with three differentdiameters: 200 nm, 490nm and 970 nm.
Fig. 3 shows the trends as we vary t, Rbead, and tether length L. Wefirst notice that for fixed Rbead and L, each curve levels off as t → ∞,giving an asymptote that is the true RMS excursion. (For short times, thebead has not had a chance to explore its full range of motion in any givenwindow, and so each RMSt → 0, and hence so does 〈RMSt 〉.) To make
CALIBRATION OF TETHERED PARTICLE MOTION EXPERIMENTS 7
100
200
300
400
Rbead = 100 nm:
0 5 100
10
20
30
40
50
60
70
Time [s]
Rbead
= 245 nm:
0 10 20Time [s]
Rbead = 485 nm:
0 10 20 30Time [s]
979bp199bp 522bp 997bp 1338bp
1654bp 2147bp 2343bp 2625bp
[nm
] [n
m]
RM
St
std
t
Fig. 3. Top: Average RMS excursion and bottom: standard deviation ofRMSt as functions of window time t in Eq. 2.1 for different bead sizes (columns)and lengths L of the DNA tether (colored lines). As discussed in the text, blackdotted lines indicate “large enough” choices of t.
the tradeoff discussed earlier, we now ask: How long must we choose thewindow time t in order to get a reliable estimate of the true excursion?
Naively we might suppose that each video frame gives an independentdraw from a distribution of bead positions whose RMS value we seek. Inthat case, we would expect that as soon as t/(30 msec) becomes large, wewould have a good estimate of the true RMS excursion. But the top rowof Fig. 3 shows that, on the contrary, the minimum required observationtime increases both with increasing bead radius (moving between the threepanels) and with increasing tether length (moving between the curves ona given panel). Physically, the point is that successive video frames arenot independent draws from the distribution of particle positions, becausethe particle’s motion is diffusive. The diffusion time τdiff of a particle in atrap increases with increasing trap radius and with increasing viscous dragconstant for the particle, giving rise to the trends observed in the figure.(For a theoretical discussion see the Supplement to [16].)
Similarly, the second row of graphs in Fig. 3 shows that the scatter
8 L. HAN, B. LUI, S. BLUMBERG, J. BEAUSANG, P. NELSON, R PHILLIPS
between successive determinations of RMSt decreases with increasing t.This “sharpening” effect also explains how RMS filtering takes rather dif-fuse raw data (e.g. Fig. 2a–c) and transforms it into a fairly well-defined“state” (e.g. the individual states visible in filtered traces such as Fig. 7).In both rows of Fig. 3, we have drawn dotted lines to illustrate a value oft that is “safe” (long enough) for tether lengths up to 2600bp.
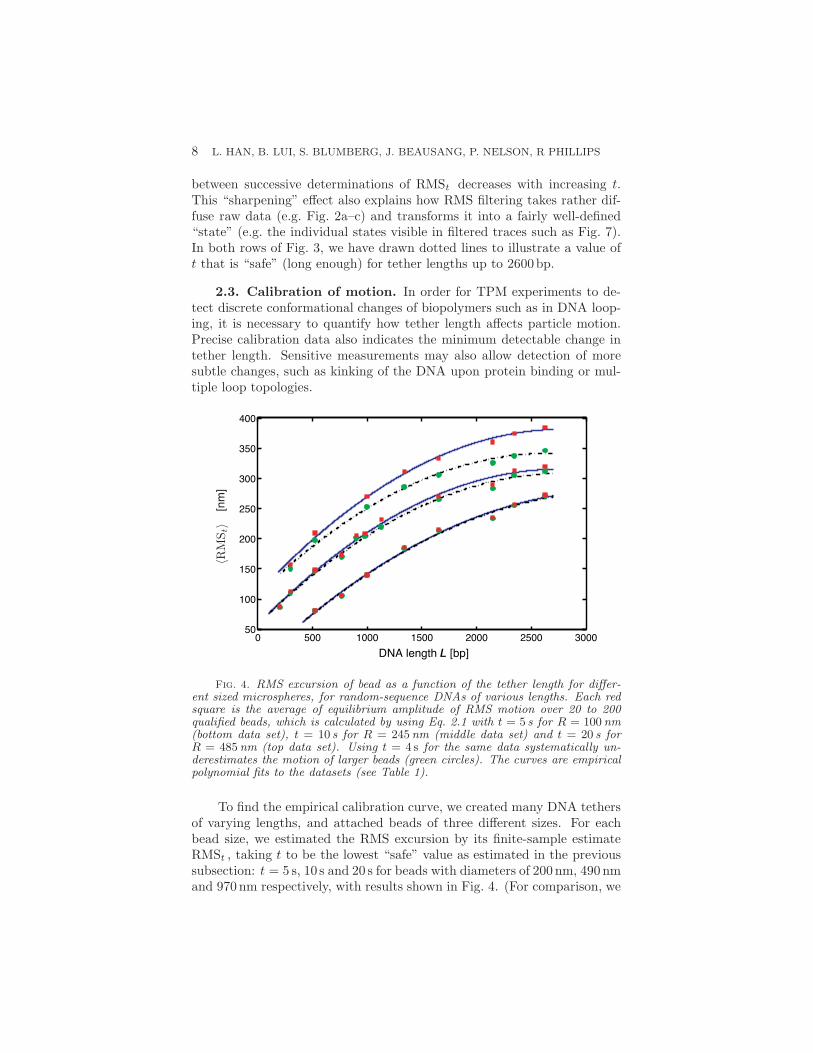
2.3. Calibration of motion. In order for TPM experiments to de-tect discrete conformational changes of biopolymers such as in DNA loop-ing, it is necessary to quantify how tether length affects particle motion.Precise calibration data also indicates the minimum detectable change intether length. Sensitive measurements may also allow detection of moresubtle changes, such as kinking of the DNA upon protein binding or mul-tiple loop topologies.
0 500 1000 1500 2000 2500 300050
100
150
200
250
300
350
400
DNA length L [bp]
[nm]
RM
St
Fig. 4. RMS excursion of bead as a function of the tether length for differ-ent sized microspheres, for random-sequence DNAs of various lengths. Each redsquare is the average of equilibrium amplitude of RMS motion over 20 to 200qualified beads, which is calculated by using Eq. 2.1 with t = 5 s for R = 100 nm(bottom data set), t = 10 s for R = 245 nm (middle data set) and t = 20 s forR = 485 nm (top data set). Using t = 4 s for the same data systematically un-derestimates the motion of larger beads (green circles). The curves are empiricalpolynomial fits to the datasets (see Table 1).
To find the empirical calibration curve, we created many DNA tethersof varying lengths, and attached beads of three different sizes. For eachbead size, we estimated the RMS excursion by its finite-sample estimateRMSt , taking t to be the lowest “safe” value as estimated in the previoussubsection: t = 5 s, 10 s and 20 s for beads with diameters of 200 nm, 490 nmand 970 nm respectively, with results shown in Fig. 4. (For comparison, we
CALIBRATION OF TETHERED PARTICLE MOTION EXPERIMENTS 9
Table 1
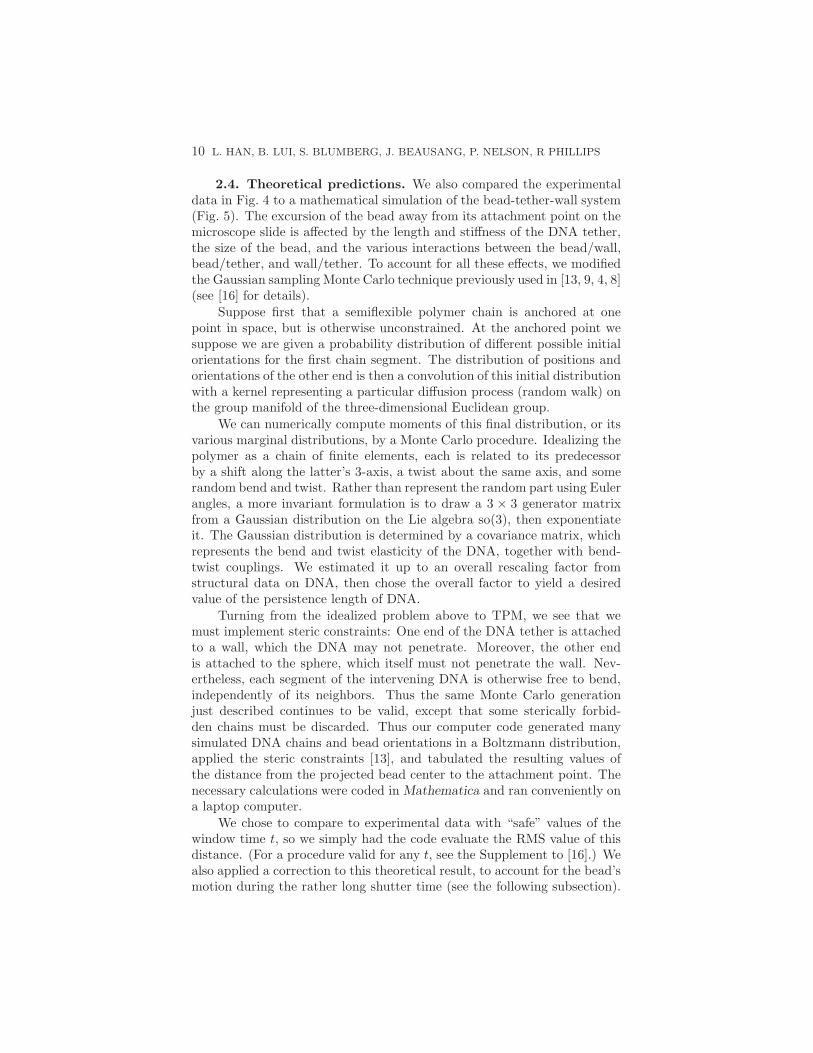
Parameters of quadratic function ax2 + bx + c obtained for fitting both theequilibrium motion data (red squares in Fig. 4) and 4 s interval data (green circlesin Fig. 4).
Time [s] Diameter a × 10−5 b c5 200nm -2.58 ± 0.68 0.17 ± 0.02 -4.5±14.810 490nm -3.37 ± 0.47 0.19 ± 0.01 57.3± 7.220 970nm –3.49 ±0.46 0.20 ± 0.01 109.5 ± 8.74 200nm -2.60 ±0.69 0.17 ±0.02 -4.75±14.74 490nm -3.17 ± 0.41 0.18± 0.01 58.05± 6.64 970nm –3.31 ±0.48 0.18 ± 0.01 107.7 ± 8.7
also show corresponding results with t fixed to 4 s, which deviate signifi-cantly from the longer observations for the larger beads.) We summarizedall these data with polynomial fits shown in the figure and given explicitlyin Table 1.
200 400 600 800
100
200
300
400
L [nm]
[nm
]R
MS
t
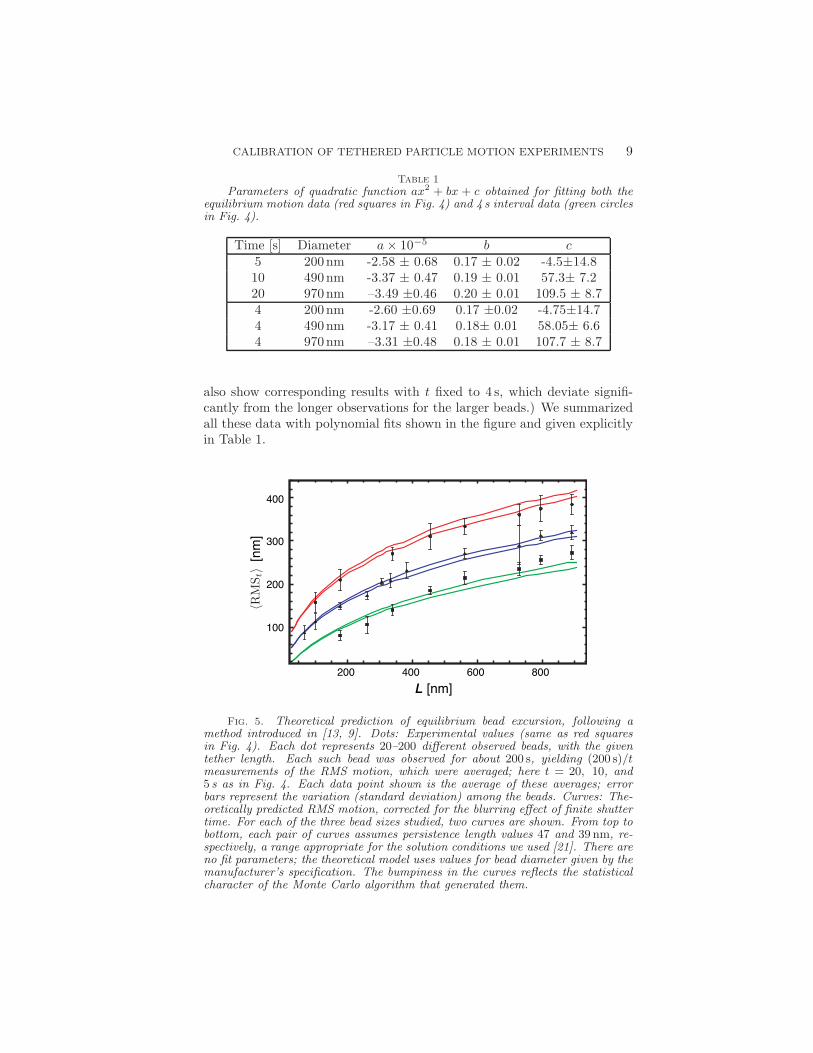
Fig. 5. Theoretical prediction of equilibrium bead excursion, following amethod introduced in [13, 9]. Dots: Experimental values (same as red squaresin Fig. 4). Each dot represents 20–200 different observed beads, with the giventether length. Each such bead was observed for about 200 s, yielding (200 s)/tmeasurements of the RMS motion, which were averaged; here t = 20, 10, and5 s as in Fig. 4. Each data point shown is the average of these averages; errorbars represent the variation (standard deviation) among the beads. Curves: The-oretically predicted RMS motion, corrected for the blurring effect of finite shuttertime. For each of the three bead sizes studied, two curves are shown. From top tobottom, each pair of curves assumes persistence length values 47 and 39 nm, re-spectively, a range appropriate for the solution conditions we used [21]. There areno fit parameters; the theoretical model uses values for bead diameter given by themanufacturer’s specification. The bumpiness in the curves reflects the statisticalcharacter of the Monte Carlo algorithm that generated them.
10 L. HAN, B. LUI, S. BLUMBERG, J. BEAUSANG, P. NELSON, R PHILLIPS
2.4. Theoretical predictions. We also compared the experimentaldata in Fig. 4 to a mathematical simulation of the bead-tether-wall system(Fig. 5). The excursion of the bead away from its attachment point on themicroscope slide is affected by the length and stiffness of the DNA tether,the size of the bead, and the various interactions between the bead/wall,bead/tether, and wall/tether. To account for all these effects, we modifiedthe Gaussian sampling Monte Carlo technique previously used in [13, 9, 4, 8](see [16] for details).
Suppose first that a semiflexible polymer chain is anchored at onepoint in space, but is otherwise unconstrained. At the anchored point wesuppose we are given a probability distribution of different possible initialorientations for the first chain segment. The distribution of positions andorientations of the other end is then a convolution of this initial distributionwith a kernel representing a particular diffusion process (random walk) onthe group manifold of the three-dimensional Euclidean group.
We can numerically compute moments of this final distribution, or itsvarious marginal distributions, by a Monte Carlo procedure. Idealizing thepolymer as a chain of finite elements, each is related to its predecessorby a shift along the latter’s 3-axis, a twist about the same axis, and somerandom bend and twist. Rather than represent the random part using Eulerangles, a more invariant formulation is to draw a 3 × 3 generator matrixfrom a Gaussian distribution on the Lie algebra so(3), then exponentiateit. The Gaussian distribution is determined by a covariance matrix, whichrepresents the bend and twist elasticity of the DNA, together with bend-twist couplings. We estimated it up to an overall rescaling factor fromstructural data on DNA, then chose the overall factor to yield a desiredvalue of the persistence length of DNA.
Turning from the idealized problem above to TPM, we see that wemust implement steric constraints: One end of the DNA tether is attachedto a wall, which the DNA may not penetrate. Moreover, the other endis attached to the sphere, which itself must not penetrate the wall. Nev-ertheless, each segment of the intervening DNA is otherwise free to bend,independently of its neighbors. Thus the same Monte Carlo generationjust described continues to be valid, except that some sterically forbid-den chains must be discarded. Thus our computer code generated manysimulated DNA chains and bead orientations in a Boltzmann distribution,applied the steric constraints [13], and tabulated the resulting values ofthe distance from the projected bead center to the attachment point. Thenecessary calculations were coded in Mathematica and ran conveniently ona laptop computer.
We chose to compare to experimental data with “safe” values of thewindow time t, so we simply had the code evaluate the RMS value of thisdistance. (For a procedure valid for any t, see the Supplement to [16].) Wealso applied a correction to this theoretical result, to account for the bead’smotion during the rather long shutter time (see the following subsection).
CALIBRATION OF TETHERED PARTICLE MOTION EXPERIMENTS 11
Fig. 5 shows that an a priori calculation of the expected motion matches thedata fairly well, with a value of persistence length consistent with others’experiments; there were no other fitting parameters.
δt [ms]
Normalized
1 10 100
0.6
0.7
0.8
0.9
1.0
RM
S 4s
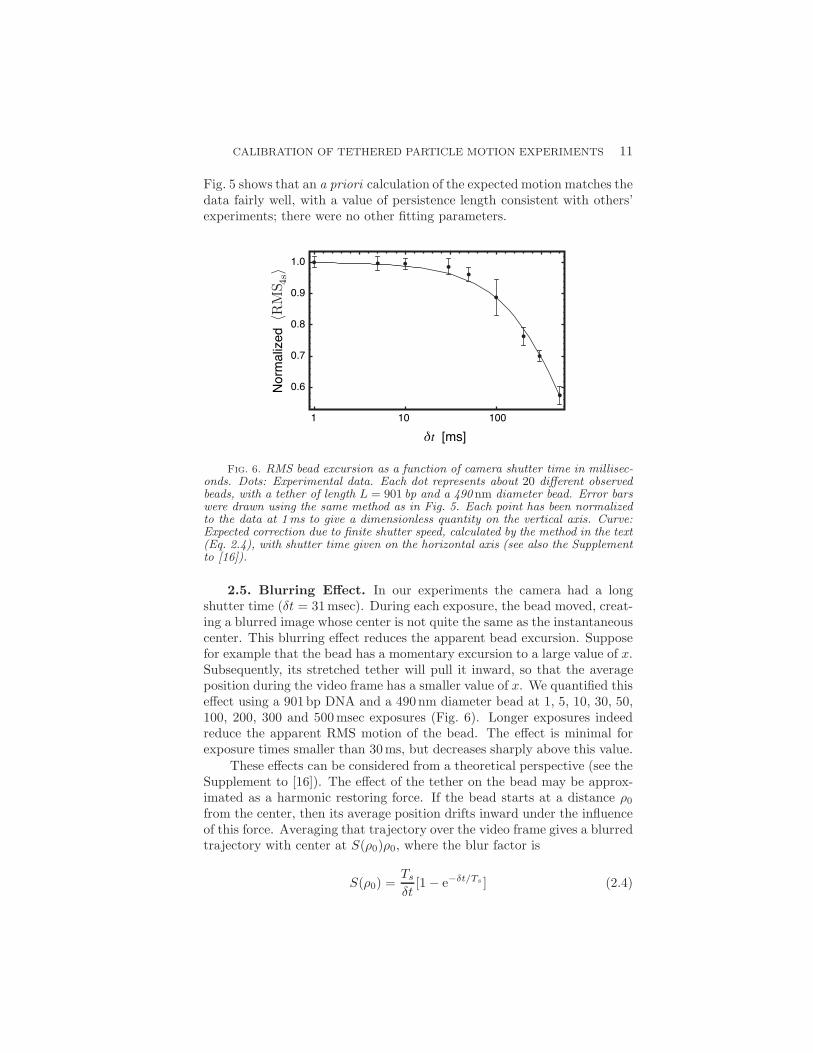
Fig. 6. RMS bead excursion as a function of camera shutter time in millisec-onds. Dots: Experimental data. Each dot represents about 20 different observedbeads, with a tether of length L = 901 bp and a 490 nm diameter bead. Error barswere drawn using the same method as in Fig. 5. Each point has been normalizedto the data at 1 ms to give a dimensionless quantity on the vertical axis. Curve:Expected correction due to finite shutter speed, calculated by the method in the text(Eq. 2.4), with shutter time given on the horizontal axis (see also the Supplementto [16]).
2.5. Blurring Effect. In our experiments the camera had a longshutter time (δt = 31 msec). During each exposure, the bead moved, creat-ing a blurred image whose center is not quite the same as the instantaneouscenter. This blurring effect reduces the apparent bead excursion. Supposefor example that the bead has a momentary excursion to a large value of x.Subsequently, its stretched tether will pull it inward, so that the averageposition during the video frame has a smaller value of x. We quantified thiseffect using a 901bp DNA and a 490 nm diameter bead at 1, 5, 10, 30, 50,100, 200, 300 and 500 msec exposures (Fig. 6). Longer exposures indeedreduce the apparent RMS motion of the bead. The effect is minimal forexposure times smaller than 30ms, but decreases sharply above this value.
These effects can be considered from a theoretical perspective (see theSupplement to [16]). The effect of the tether on the bead may be approx-imated as a harmonic restoring force. If the bead starts at a distance ρ0
from the center, then its average position drifts inward under the influenceof this force. Averaging that trajectory over the video frame gives a blurredtrajectory with center at S(ρ0)ρ0, where the blur factor is
S(ρ0) =Ts
δt[1 − e−δt/Ts ] (2.4)
12 L. HAN, B. LUI, S. BLUMBERG, J. BEAUSANG, P. NELSON, R PHILLIPS
The time constant Ts can in principle be estimated from first principles,but in practice we fit it to data such as those in Fig. 6. For very small δtwe get S → 1. For large δt, we have S → 0.
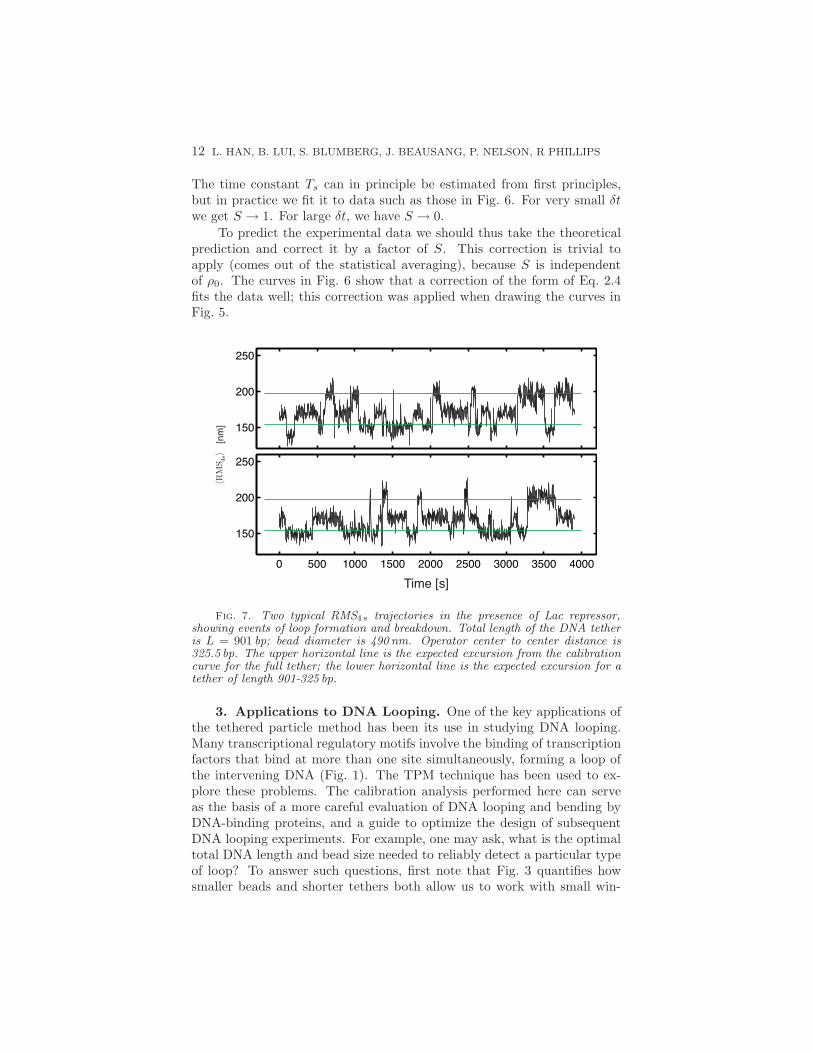
To predict the experimental data we should thus take the theoreticalprediction and correct it by a factor of S. This correction is trivial toapply (comes out of the statistical averaging), because S is independentof ρ0. The curves in Fig. 6 show that a correction of the form of Eq. 2.4fits the data well; this correction was applied when drawing the curves inFig. 5.
150
200
250
0 500 1000 1500 2000 2500 3000 3500 4000
150
200
250
Time [s]
[nm
]R
MS 4
s
Fig. 7. Two typical RMS4 s trajectories in the presence of Lac repressor,showing events of loop formation and breakdown. Total length of the DNA tetheris L = 901 bp; bead diameter is 490 nm. Operator center to center distance is325.5 bp. The upper horizontal line is the expected excursion from the calibrationcurve for the full tether; the lower horizontal line is the expected excursion for atether of length 901-325 bp.
3. Applications to DNA Looping. One of the key applications ofthe tethered particle method has been its use in studying DNA looping.Many transcriptional regulatory motifs involve the binding of transcriptionfactors that bind at more than one site simultaneously, forming a loop ofthe intervening DNA (Fig. 1). The TPM technique has been used to ex-plore these problems. The calibration analysis performed here can serveas the basis of a more careful evaluation of DNA looping and bending byDNA-binding proteins, and a guide to optimize the design of subsequentDNA looping experiments. For example, one may ask, what is the optimaltotal DNA length and bead size needed to reliably detect a particular typeof loop? To answer such questions, first note that Fig. 3 quantifies howsmaller beads and shorter tethers both allow us to work with small win-
CALIBRATION OF TETHERED PARTICLE MOTION EXPERIMENTS 13
dow size t, while still giving the narrow peak widths necessary to resolvesubstructure in the distribution of RMSt . Fig. 4 reinforces this point andalso quantifies how smaller beads also optimize the resolution of TPM bymaintaining a high slope to the calibration curve over a wide range of L.There are limits to what can be achieved in this way, of course: Smallbeads are hard to observe, and short DNA tethers tend to collapse (due tosurface absorption). Our work helps the experimenter to make appropriatetradeoffs when designing an experiments.
Another benefit derived from the calibration curve is a better under-standing of the geometry of the conformational changes we have studied.For example, Fig. 7 clearly shows the existence of a third state, not coin-ciding with either of the horizontal lines naively predicted from the cali-bration curve [22, 10, 7]. More detailed simulations can then shed light onthe geometries of the two distinct looped species disclosed by TPM assays[16, 7].
4. Conclusions. The tethered particle motion method is one of thesimplest tools for performing single-molecule experiments on DNA-proteincomplexes. In contrast to other methods involving fluorescence, TPM neverbleaches, allowing very long observations. The central idea is to use theBrownian motion of a small particle tethered to a DNA molecule as areporter of the underlying macromolecular dynamics of the DNA in itscomplexes with DNA-binding proteins. The point of this paper has beento examine the challenges that are inherent in making useful quantitativemeasurements using this method. One of the main outcomes of that efforthas been the development of calibration curves that illustrate how tethered-particle excursions depend upon both bead size and tether length.
5. Materials and Methods.
5.1. Sample preparation. The first step in any TPM experimentis construction of the relevant DNA tethers with their associated reporterbeads. Polymerase Chain Reaction (PCR) was used to amplify labeledDNA with two modified primers. The primers were either biotin or digoxi-genin labeled at the 5’ ends (MWG Biotech AG, Ebersberg, Germany). Thelabels permit specific linkage of the DNA to a polystyrene microsphere orglass coverslip, respectively. The PCR templates were taken from lambdaphage or modified pUC19 plasmid (sequences available upon request). ThePCR products were purified by gel extraction (QIAquick Gel ExtractionKit, QIAGEN).
Streptavidin (Bangs lab) or neutravidin (Molecular Probes) coated mi-crospheres of diameter 200, 490 and 970nm served as our tethered particle.In contrast to the 490 and 970 nm microspheres, the 200nm microsphereswere fluorescent. Prior to incubation with DNA, a buffer exchange on thebeads was performed by three cycles of centrifugation and resuspensionin TPB buffer (20mM Tris-acetate, pH=8.0, 130mM KCl, 4mM MgCl2,
14 L. HAN, B. LUI, S. BLUMBERG, J. BEAUSANG, P. NELSON, R PHILLIPS
0.1mM DTT, 0.1mM EDTA, 20 µg/ml acetylated BSA (Sigma-Aldrich), 80µg/ml heparin(Sigma-Aldrich) and 3 mg/ml casein (Sigma), filtered with300kD MWCO polysulfone membrane (Millipore)). This combination ofreagents was chosen in an attempt to maximize sample yield and longevity,while minimizing non-specific adsorption of DNA and microspheres ontothe coverslip.
The second step is DNA tether assembly. Tethered particle sampleswere created inside a 20-30 µl flow cell made out of a glass slide, glass cov-erslip, double-sided tape and tygon tubing. The coverslip and slide werecleaned with 4N HCl for 24 hours and then the flow cell was constructed inthe same manner as described by van Oijen et al. [18]. Next, the flow cham-ber was incubated with 20 µg/mg anti-digoxigenin (Sigma) in PBS bufferfor 30 minutes, and then rinsed with 400 µl wash buffer (TPB buffer withno casein) followed by 400 µl of TPB buffer. Microsphere-DNA complexeswere created by incubating approximately 100 pM microspheres with 10pM labeled DNA in TPB buffer for at least an hour. The DNA concen-tration was estimated via gel band strength. The 10:1 ratio of beads toDNA was designed to minimize the occurrence of multiple DNA strandsattached to a single microsphere. The tethering procedure was completedby introducing 50 µl of the microsphere-DNA complexes into the flow cellfor four to ten minutes. Additional tethering yield could be accomplishedby another round of incubation with fresh microsphere-DNA complexes.Finally, unbound microspheres were removed by flushing the chamber with1 mL TPB buffer. Once microspheres were introduced into the flow cell,tether integrity was improved by taking care to minimize flow rates withinthe sample chamber.
5.2. Data Acquisition and Analysis. The sample is imaged onan inverted microscope using Differential Interference Contrast (DIC) op-tics and a 1.3 NA 100x oil-objective (Olympus). The tethered particle’smotion was captured using an Andor Ixon camera. Each pixel dimensioncorresponds to 102nm in the sample plane. Image transfer and storagewas either controlled through Ixon software (Andor Technology) or customMatlab code (all of our Matlab acquisition and analysis code is availableupon request). The former recorded 8-14 bits per pixel, while the lattercaptured 14 bits per pixel. However, a comparison of the capture meth-ods showed insignificant differences (data not shown). Care was taken toensure that the image intensity exhibited broad dynamic range withoutsaturation. Some data was obtained using a Matlab-based autofocus rou-tine that interfaced with a Prior controller. However, for acquisition timesshorter than five minutes, the paraxial drift was small and autofocus wasnot needed.
The first step in analyzing TPM data is to compute trajectories forevery tethered particle. The particle’s X and Y displacement as a functionof time was extracted from the raw data using a cross-correlation tracking
CALIBRATION OF TETHERED PARTICLE MOTION EXPERIMENTS 15
algorithm [6]. Such raw positional data are subject to a slow drift dueto vibrations of the experimental apparatus. A drift correction is thenapplied using high pass first-order Butterworth filter at cutoff frequency0.05Hz [19].
6. Acknowledgements. The senior authors gratefully acknowledgeNick Cozarelli’s direct and indirect influence on our work. We especially re-call Nick’s tactful, wise counsel at a time when one of us was an embryonicbiological physicist with an interesting, but poorly presented, idea. Multi-plied manyfold, such attentions have shaped a generation of researchers.
We are grateful to generous colleagues who have advised us on manyaspects of this work, including: Meredith Betterton, David Dunlap, LauraFinzi, Arivalagan Gajraj, Jeff Gelles, Jane Kondev, Chris Meiners, KeirNeuman, Matthew Pennington, Tom Perkins, Bob Schleif, Kevin Towles.
REFERENCES
[1] J. F. Beausang and P. C. Nelson, Diffusive hidden Markov model characteriza-
tion of DNA looping dynamics in tethered particle experiments, Phys, Biol., 4(2007), pp. 205–219.
[2] J. F. Beausang, C. Zurla, C. Manzo, D. Dunlap, L. Finzi, and P. C. Nelson,DNA looping kinetics analyzed using diffusive hidden Markov model, Biophys.J., 92 (2007), pp. L64–6.
[3] S. Blumberg, A. Gajraj, M. W. Pennington, and J. Meiners, Three-
dimensional characterization of tethered microspheres by total internal re-
flection fluorescence microscopy, Biophys. J., (2005), pp. 1272–1281.[4] L. Czapla, D. Swigon, and W. K. Olson, Sequence-dependent effects in the
cyclization of short DNA, Journal of Chemical Theory and Computation, 2(2006), pp. 685–695.
[5] L. Finzi and J. Gelles, Measurement of lactose repressor-mediated loop forma-
tion and breakdown in single DNA molecules, Science, 267 (1995), pp. 378–80.[6] J. Gelles, B. Schnapp, and M. Sheetz, Tracking kinesin-driven movements with
nanometre-scale precision, Nature, 331 (1988), pp. 450–453.[7] L. Han, H. G. Garcia, S. Blumberg, K. B. Towles, J. F. Beausang,
P. C. Nelson, and R. Phillips, Concentration and length dependence
of DNA looping in transcriptional regulation. Submitted; available athttp://arxiv.org/abs/0806.1860, 2008.
[8] P. C. Nelson, Colloidal particle motion as a diagnostic of DNA conformational
transitions, Curr. Op. Colloid Intef. Sci., 12 (2007), pp. 307–313.[9] P. C. Nelson, C. Zurla, D. Brogioli, J. F. Beausang, L. Finzi, and D. Dun-
lap, Tethered particle motion as a diagnostic of DNA tether length, J. Phys.Chem. B, 110 (2006), pp. 17260–17267.
[10] D. Normanno, F. Vanzi, and F. Pavone, Single-molecule manipulation reveals
supercoiling-dependent modulation of lac repressor-mediated DNA looping.,Nucl. Acids Res., 36 (2008), pp. 2505–2513.
[11] N. Pouget, C. Dennis, C. Turlan, M. Grigoriev, M. Chandler, and L. Sa-
lome, Single-particle tracking for DNA tether length monitoring, Nucl. AcidsRes., 32 (2004), pp. e73–(1–7).
[12] D. A. Schafer, J. Gelles, M. P. Sheetz, and R. Landick, Transcription by
single molecules of RNA polymerase observed by light microscopy, Nature,352 (1991), pp. 444–8.
16 L. HAN, B. LUI, S. BLUMBERG, J. BEAUSANG, P. NELSON, R PHILLIPS
[13] D. E. Segall, P. C. Nelson, and R. Phillips, Volume-exclusion effects in
tethered-particle experiments: Bead size matters, Phys. Rev. Lett., 96 (2006),pp. 088306–(1–4).
[14] M. Singh-Zocchi, S. Dixit, V. Ivanov, and G. Zocchi, Single-molecule detection
of DNA hybridization, Proc. Natl. Acad. Sci. USA, 100 (2003), pp. 7605–10.[15] S. Tolic-Norrelykke, M. Rasmussen, F. Pavone, K. Berg-Sorensen, and
L. Oddershede, Stepwise bending of DNA by a single TATA-box binding
protein, Biophys. J., 90 (2006), pp. 3694–703.[16] K. Towles, J. F. Beausang, H. G. Garcia, R. Phillips, and P. C. Nelson,
First-principles calculation of DNA looping in tethered particle experiments.Submitted; available at http://arxiv.org/abs/0806.1551, 2008.
[17] B. van den Broek, F. Vanzi, D. Normanno, F. S. Pavone, and G. J. Wuite,Real-time observation of DNA looping dynamics of Type IIE restriction en-
zymes NaeI and NarI, Nucleic acids research, 34 (2006), pp. 167–74.[18] A. M. van Oijen, P. C. Blainey, D. J. Crampton, C. C. Richardson, T. Ellen-
berger, and X. S. Xie, Single-molecule kinetics of lambda exonuclease reveal
base dependence and dynamic disorder, Science, 301 (2003), pp. 1235–8.[19] F. Vanzi, C. Broggio, L. Sacconi, and F. S. Pavone, Lac repressor hinge flex-
ibility and DNA looping: single molecule kinetics by tethered particle motion,Nucl. Acids Res., 34 (2006), pp. 3409–20.
[20] F. Vanzi, S. Vladimirov, C. R. Knudsen, Y. E. Goldman, and B. S. Cooper-
man, Protein synthesis by single ribosomes, RNA, 9 (2003), pp. 1174–9.[21] M. D. Wang, H. Yin, R. Landick, J. Gelles, and S. M. Block, Stretching DNA
with optical tweezers, Biophys. J., 72 (1997), pp. 1335–1346.[22] O. K. Wong, M. Guthold, D. A. Erie, and J. Gelles, Interconvertable lac-
tose repressor-DNA looped complexes revealed by single-molecule experiments,2008. PLoS Biology, in press.
[23] H. Yin, R. Landick, and J. Gelles, Tethered particle motion method for studying
transcript elongation by a single RNA polymerase molecule, Biophys. J., 67(1994), pp. 2468–2478.
[24] C. Zurla, A. Franzini, G. Galli, D. Dunlap, D. E. A. Lewis, S. Adhya, and
L. Finzi, Novel tethered particle motion analysis of CI protein-mediated DNA
looping in the regulation of bacteriophage lambda, J. Phys.: Condens. Matter,18 (2006), pp. S225–S234.
[25] C. Zurla, T. Samuely, G. Bertoni, F. Valle, G. Dietler, L. Finzi, and D. D.
Dunlap, Integration host factor alters LacI-induced DNA looping, Biophys.Chem., 128 (2007), pp. 245–52.


![TPM Manual básico de Entrenamiento TPM[1]](https://img.pdfslide.net/doc/110x75/55cf9ad3550346d033a3957d/tpm-manual-basico-de-entrenamiento-tpm1.jpg)