Embed Size (px)
Citation preview

California ED Diversion Project Evaluation Final Report February 2009 Edward M. Castillo, Ph.D., MPH University of California, San Diego Gary M. Vilke, M.D. Department of Emergency Medicine Theodore C. Chan, M.D.
Supported by a grant from theCalifornia HealthCare Foundation, based in Oakland, California
UCSD Dept of Emergency Medicine CEDDP Evaluation
1
TABLE OF CONTENTS
TABLE OF CONTENTS ....................................................................................................................................1 PROJECT BACKGROUND ...............................................................................................................................3 STATEWIDE DIVERSION TRENDS, 2003‐2007 ...............................................................................................4 CEDDP COLLABORATIVE COMMUNITIES .....................................................................................................8
Evaluation Process .................................................................................................................................9 Overall Survey Findings .........................................................................................................................9 Overall Impact on Diversion ............................................................................................................... 11 Los Angeles Region ............................................................................................................................. 13 Inland Counties Region ....................................................................................................................... 17 Ventura Region ................................................................................................................................... 21 Santa Clara Region .............................................................................................................................. 25 Summary of Ambulance Diversion Mitigation Practices & ED Capacity Initiatives ............................ 27 Evaluation Limitations ........................................................................................................................ 29
REFERENCES .............................................................................................................................................. 31 APPENDICES
Appendix A: Summit Survey Tool ....................................................................................................... 32 Appendix B: Standardized Site Visit Questions .................................................................................. 37 Appendix C: Project Key Performance Indicators (KPIs) .................................................................... 39
TABLES
Table 1. Diversion Hours and Change from 2003 to 2007 ....................................................................4 Table 2. Diversion Hours Percent Change by Year and from 2003 to 2007 ..........................................5 Table 3. Total Diversion Hours and Change from 2003 to 2007 for Los Angeles, Inland
Counties and All Other Regions ...............................................................................................6 Table 4. Total Diversion Hours Percent Change by Year and from 2003 to 2007 for Los Angeles,
Inland Counties and All Other Regions ....................................................................................6 Table 5. Participating EMS Regions and Partner Hospitals ...................................................................8 Table 6. Diversion Hours and Change from 2003 to 2007 by Collaboration Participation ...................8 Table 7. Diversion Hours Percent Change by Year and from 2003 to 2007 by Collaboration
Participation .............................................................................................................................9 Table 8. Los Angeles Region Diversion Hours and Percent Change, 2003‐2007 ................................ 13 Table 9. Inland Counties Region Diversion Hours and Percent Change, 2003‐2007 .......................... 17 Table 10. Ventura Region Diversion Hours and Percent Change, 2003‐2007 .................................... 21 Table 11. Santa Clara Region Diversion Hours and Percent Change, 2003‐2007 ............................... 25

UCSD Dept of Emergency Medicine CEDDP Evaluation
2
FIGURES Figure 1. Percent Contribution to Decreased Diversion Hours from 2003 ‐ 2008 ................................7 Figure 2. Decrease in Diversion Hours by Year for Select Regions, 2003‐2007 ....................................7 Figure 3. Total ED Diversion Hours for Participating Hospitals,
May 2006 ‐ August 2008 ...................................................................................................... 12 Figure 4. Total ED Diversion Hours for Participating Hospitals , Los Angeles Region,
May 2006 ‐ August 2008 ...................................................................................................... 13 Figure 5. ED Diversion Hours for Participating Hospitals, Los Angeles Region,
May 2006 ‐ August 2008 ...................................................................................................... 15 Figure 6. Total ED Diversion Hours for Participating Hospitals, Inland Counties Region,
May 2006 ‐ August 2008 ...................................................................................................... 17 Figure 7. ED Diversion Hours for Participating Hospitals, Inland Counties Region,
May 2006 ‐ August 2008 ...................................................................................................... 19 Figure 8. ED Diversion Hours for Participating Hospitals, Ventura Region,
May 2006 ‐ August 2008 ...................................................................................................... 21 Figure 9. ED Diversion Hours for Participating Hospitals, Ventura Region,
May 2006 ‐ August 2008 ...................................................................................................... 23 Figure 10. ED Diversion Hours for Participating Hospitals, Santa Clara (RMC‐SJ),
May 2006 ‐ August 2008 ...................................................................................................... 25

UCSD Dept of Emergency Medicine CEDDP Evaluation
3
PROJECT BACKGROUND The goal of this report is to provide an independent evaluation of the California Emergency Department Diversion Project (CEDDP). CEDDP was a two‐year project (2006‐2008) conducted by The Abaris Group with funding from the California HealthCare Foundation (CHCF). The goal of CEDDP was to measure and publicly report the extent of ambulance diversion by EMS area and hospital, identify best practices to minimize diversion, and create a collaborative of a select group of California communities to implement a series of best practices and measure their outcomes. ED capacity and ambulance diversion continues to be a growing problem world‐wide, receiving increasing attention from the medical literature, professional organizations, and the media.1‐4 When patients do not reach requested facilities, challenges in care are compounded by lack of available medical records and delays in transferring admitted patients back to the originally requested facility. Ambulance diversion has repeatedly been shown to have negative impact on patient care, including timeliness of medical attention as well as overall health outcomes.5‐7 CEDDP had four major phases. First, data were collected, analyzed and reported from all 36 of California’s local Emergency Medical Services Agencies (EMSAs) to describe the nature and extent of diversion throughout the state. Second, through a variety of methods, an inventory of hospital practices and diversion mitigation efforts was created and best practices identified. Third, a collaborative was formed with four EMSAs and selected hospitals in their regions to develop and implement best practices, and measure the impact of these processes on ED capacity and ambulance diversion. Much of this collaborative effort was based on the national Robert Wood Johnson Urgent Matters program (http://www.urgentmatters.org/). Fourth, subsequent data were collected, analyzed and reported on ambulance diversion for the collaborative as well as statewide. This report outlines results from an independent evaluation of the CEDDP. Specific objectives were developed, incorporating quantitative and qualitative data collection techniques, to measure and analyze the impact of the project. These specific objectives were:
1. Analyze quantitative data collected and reported by CEDDP on the following levels: statewide data collected initially and at project end; regional EMS data collected from the four regions of the collaboration; and specific hospital ED and diversion data collected from participating hospitals.
2. Assess the collaborative using qualitative data collection and analysis methods in terms of program development, implementation and overall success, as well as outcomes for each of the four participating regions.
3. Assess the impact, sustainability and exportability of specific ED capacity and ambulance diversion mitigation practices implemented within the collaborative. This assessment will include quantitative and qualitative methods utilized in both specific objectives 1 and 2.

UCSD Dept of Emergency Medicine CEDDP Evaluation
4
STATEWIDE DIVERSION TRENDS, 20032007 The goal of the first phase of CEDDP was to collect ED diversion data for the EMS regions throughout California. Table 1 reports diversion hours and the change from 2003 to 2007. Data were collected from multiple sources including EMS agencies and California Office of Statewide Health Planning Department (OSHPD).
Table 1. Diversion Hours and Change from 2003 to 2007
EMS Region 2003 2004 2005 2006 2007 ∆2003‐2007Alameda 3,496 1,764 1,319 1,073 714 ‐2,782Central California ‐ ‐ ‐ ‐ ‐ ‐Coastal Valleys 229 2,990 2,747 238 ‐ ‐Contra Costa 381 257 506 1,674 ‐ ‐El Dorado ‐ ‐ ‐ ‐ ‐ ‐Imperial 806 1,276 1,073 518 1,120 314Inland Counties* 52,387 37,114 32,661 22,318 19,224 ‐33,163Kern 1,532 1,368 1,905 1,020 621 ‐911Los Angeles* 166,159 165,026 174,952 102,609 81,741 ‐84,418Marin 0 98 204 126 65 65Merced ‐ ‐ ‐ ‐ ‐ ‐Monterey 119 603 428 ‐ ‐ ‐Mountain Valley 2,295 207 253 622 1,089 ‐1,206North Coast 0 0 ‐ ‐ ‐ ‐Northern California 141 251 196 593 594 453Orange 14,561 10,767 10,608 9,821 7,197 ‐7,364Riverside 6,712 3,216 3,847 2,573 2,423 ‐4,289Sacramento 6,380 7,785 5,811 6,644 3,905 ‐2,475San Benito ‐ ‐ ‐ ‐ ‐ ‐San Diego 23,084 22,063 18,841 21,771 24,458 1,374San Francisco 13,582 8,015 7,106 4,725 6,477 ‐7,105San Joaquin 153 134 131 196 320 167San Luis Obispo 57 48 48 18 376 319San Mateo 1,948 2,160 2,458 2,079 2,499 551Santa Barbara 0 3 1,004 402 236 236Santa Clara* 2,084 3,077 2,638 2,546 2,600 516Santa Cruz 479 371 689 686 1,440 961Sierra‐Sacramento 766 623 1,516 1,825 681 ‐85Solano 0 ‐ ‐ ‐ ‐ ‐Toulumne 0 0 4 1 ‐ ‐Ventura* 4,819 9,257 9,521 10,836 7,400 2,581
*Regions participating in the CEDDP Collaborative ‐Data not available

UCSD Dept of Emergency Medicine CEDDP Evaluation
5
Table 2 reports the yearly percentage change from 2003 to 2004 as well as 2003 to 2007. Data were complete for the majority of regions for the specific time period, include those who participated in the collaborative.
Table 2. Diversion Hours Percent Change by Year and from 2003 to 2007
EMS Region 2003‐2004 2004‐2005 2005‐2006 2006‐2007 ∆2003‐2007Alameda ‐49.5% ‐25.2% ‐18.7% ‐33.5% ‐79.6%Central California ‐ ‐ ‐ ‐ ‐Coastal Valleys 1205.7% ‐8.1% ‐91.3% ‐ ‐Contra Costa ‐32.5% 96.9% 230.8% ‐ ‐El Dorado ‐ ‐ ‐ ‐ ‐Imperial 58.3% ‐15.9% ‐51.7% 116.2% 39.0%Inland Counties* ‐29.2% ‐12.0% ‐31.7% ‐13.9% ‐63.3%Kern ‐10.7% 39.3% ‐46.5% ‐39.1% ‐59.5%Los Angeles* ‐0.7% 6.0% ‐41.4% ‐20.3% ‐50.8%Marin ** 108.2% ‐38.2% ‐48.4% **Merced ‐ ‐ ‐ ‐ ‐Monterey 406.7% ‐29.0% ‐ ‐ ‐Mountain Valley ‐91.0% 22.2% 145.8% 75.1% ‐52.5%North Coast 0.0% ‐ ‐ ‐ ‐Northern California 78.0% ‐21.9% 202.6% 0.2% 321.3%Orange ‐26.1% ‐1.5% ‐7.4% ‐26.7% ‐50.6%Riverside ‐52.1% 19.6% ‐33.1% ‐5.8% ‐63.9%Sacramento 22.0% ‐25.4% 14.3% ‐41.2% ‐38.8%San Benito ‐ ‐ ‐ ‐ ‐San Diego ‐4.4% ‐14.6% 15.6% 12.3% 6.0%San Francisco ‐41.0% ‐11.3% ‐33.5% 37.1% ‐52.3%San Joaquin ‐12.4% ‐2.2% 49.6% 63.3% 109.2%San Luis Obispo ‐15.8% 0.0% ‐62.5% 1988.9% 559.6%San Mateo 10.9% 13.8% ‐15.4% 20.2% 28.3%Santa Barbara ** ** ‐60.0% ‐41.3% **Santa Clara* 47.6% ‐14.3% ‐3.5% 2.1% 24.8%Santa Cruz ‐22.5% 85.7% ‐0.4% 109.9% 200.6%Sierra‐Sacramento ‐18.7% 143.3% 20.4% ‐62.7% ‐11.1%Solano ‐ ‐ ‐ ‐ ‐Toulumne 0.0% ‐ ‐75.0% ‐ ‐Ventura* 92.1% 2.9% 13.8% ‐31.7% 53.6%
*Regions participating in the CEDDP Collaborative **Increased from 0 or near 0 ‐Data not available
UCSD Dept of Emergency Medicine CEDDP Evaluation
6
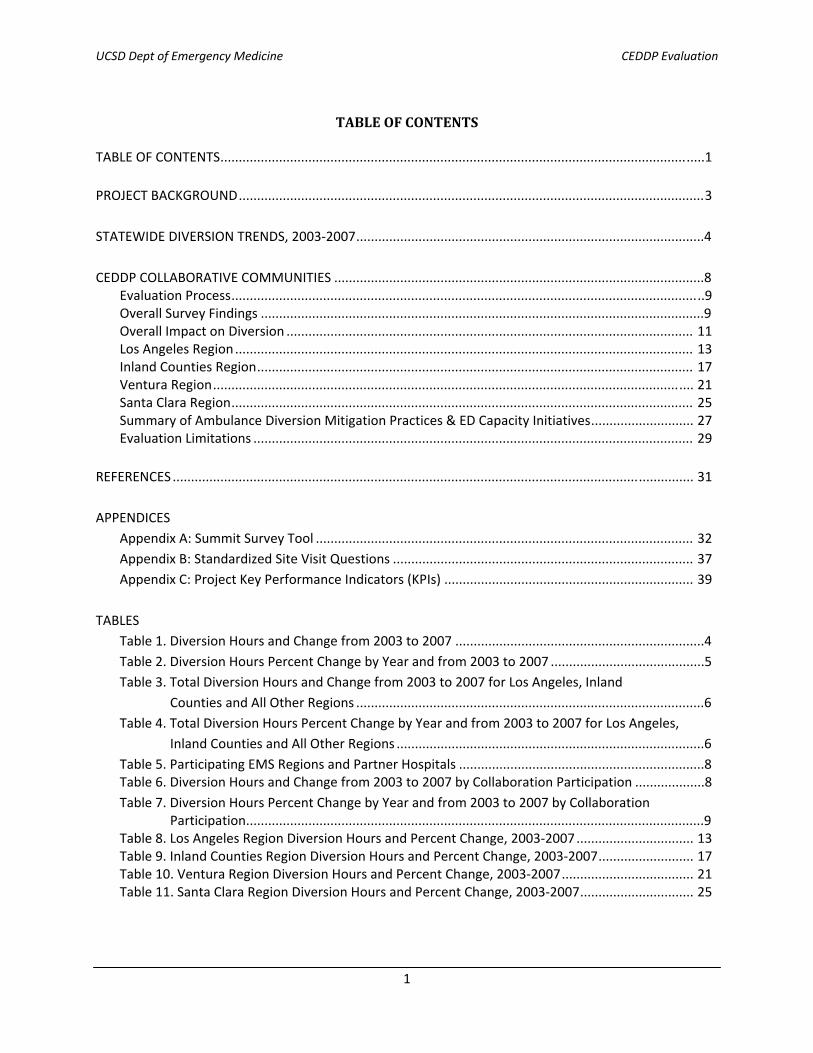
A total of 21 EMS Agencies had complete yearly diversion data from 2003 to 2007. The ten regions with incomplete data were Central California, Coastal Valleys, Contra Costa, El Dorado, Merced, Monterey, North
Coast, San Benito, Solano, and Toulumne and are not included in the following analysis. The Los Angles and Inland Counties regions both had changes of over 10,000 hours between 2003 and 2007 (Table 3). The next two largest decreases over the same time period were seen in the Orange and San Francisco regions each with about 7,000 hours. The remaining regions accounted for very little change in diversion hours.
Table 3. Total Diversion Hours and Change from 2003 to 2007 for Los Angeles, Inland Counties and All Other Regions
EMS Region 2003 2004 2005 2006 2007 ∆2003 ‐2007Los Angeles and Inland Counties 218,546 202,140 207,613 124,927 100,965 ‐117,581All Other Regions 82,895 72,483 69,168 68,074 64,215 ‐18,680 Table 4 shows where the largest year to year percentage changes are in the Los Angeles and Inland Counties regions. There were two years with large drops in diversion hours, 2003‐2004 and 2005‐2006.
Table 4. Total Diversion Hours Percent Change by Year and from 2003 to 2007 for Los Angeles, Inland Counties and All Other Regions
EMS Region 2003‐2004 2004‐2005 2005‐2006 2006‐2007 ∆2003‐2007Los Angeles and Inland Counties ‐7.5% 2.7% ‐39.8% ‐19.2% ‐53.8%All Other Regions ‐12.6% ‐4.6% ‐1.6% ‐5.7% ‐22.5% Figure 1 illustrates the percent contribution to the decrease in statewide diversion hours from 2003 to 2007. The decrease in diversion hours in the Los Angeles region contributed to 62% of the total statewide decrease. The Inland County region was responsible for 24% of the total decrease.

UCSD Dept of Emergency Medicine CEDDP Evaluation
7
Figure 2 illustrates the decrease in the Los Angeles, Inland Counties and All Other Regions by year from 2003 to 2007. The largest decrease in Los Angeles occurred from 2005 and 2006. The Inland Counties region decreased consistently over the time period. All Other Regions combined had the largest decrease from 2003 to 2004.
Los Angeles62%
Inland Counties24%
All Other Regions14%
Figure 1. Percent Contribution to Decreased Diversion Hours Statewide from 2003 - 2007
0
25,000
50,000
75,000
100,000
125,000
150,000
175,000
200,000
2003 2004 2005 2006 2007
Figure 2. Decrease in Diversion Hours by Year for Select Regions, 2003-2007
Los Angeles
All Other Regions
Inland Counties

UCSD Dept of Emergency Medicine CEDDP Evaluation
8
CEDDP COLLABORATIVE COMMUNITIES There were four EMAs selected for participation in the CEDDP collaborative, each of which included three to four hospital participants. Santa Clara EMSA was originally included in the collaborative, but later dropped from the project and data were only available from the one hospital that had started. The goal of the collaborative was to develop and implement best practices and measure the impact of these processes on ED capacity and ambulance diversion for the participants and the region as a whole. The list of the CEDDP Collaborative Regions and Participants are listed in Table 5 below. Table 5. Participating EMS Regions and Partner Hospitals EMS Region Partner Hospitals Los Angeles St. Francis Medical Center, Presbyterian Intercommunity Hospital,
Methodist Hospital Inland Counties Arrowhead Regional Medical Center, Loma Linda University, St. Mary’s
Medical Center Ventura Community Memorial Hospital, Simi Valley Hospital, St. John’s Regional
Medical Center, Ventura County Medical Center Santa Clara Regional Medical Center of San Jose
In reviewing the data from 2003‐2007 prior to participation, these four communities combined had significant decreases in diversion hours BEFORE the collaborative was initiated even when compared to other counties. However, much of this decrease can be explained as noted in the section above by the inclusion of both Los Angeles and Inland Counties, the EMSAs with the largest decreases in diversion during the 5‐year time period before the collaborative (Table 6).
Table 6. Diversion Hours and Change from 2003 to 2007 by Collaboration Participation
EMS Region 2003 2004 2005 2006 2007 ∆2003‐2007Not in Collaborative
75,992 60,149 57,009 54,692 54,215 ‐21,777
In Collaborative 225,449 214,474 219,772 138,309 110,965 ‐114,484
Inland Counties 52,387 37,114 32,661 22,318 19,224 ‐33,163 Los Angeles 166,159 165,026 174,952 102,609 81,741 ‐84,418 Santa Clara 2,084 3,077 2,638 2,546 2,600 516
Ventura 4,819 9,257 9,521 10,836 7,400 2,581 Table 7 reports percent changes in diversion hours by year. The changes in the regions with participating hospitals were largest between 2005 and 2006.

UCSD Dept of Emergency Medicine CEDDP Evaluation
9
Table 7. Diversion Hours Percent Change by Year from 2003 to 2007 by Collaboration Participation EMS Region 2003‐2004 2004‐2005 2005‐2006 2006‐2007 ∆2003‐2007Not In Collaborative ‐20.8% ‐5.2% ‐4.1% ‐0.9% ‐28.7%In Collaborative ‐4.9% 2.5% ‐37.1% ‐19.8% ‐50.8%
Inland Counties ‐29.2% ‐12.0% ‐31.7% ‐13.9% ‐63.3% Los Angeles ‐0.7% 6.0% ‐41.4% ‐20.3% ‐50.8% Santa Clara 47.6% ‐14.3% ‐3.5% 2.1% 24.8% Ventura 92.1% 2.9% 13.8% ‐31.7% 53.6% Evaluation Process Each region was evaluated on a quantitative and qualitative level. Data were collected from the State EMS agency as well as local EMSA and participating hospitals. An initial standardized survey tool was administered to all participants including the EMSA and hospital staff involved in the collaborative (Appendix A). On‐site visits were conducted by the evaluation team at each of the four regions with the lead EMSA, as well as participating hospitals, if available, using a standardized interview format (Appendix B). Follow‐up telephone interviews were conducted for the remaining hospitals that were not able to participate in the on‐site evaluations. The reminder of the report will focus on the results of the site visit surveys collected by the evaluation team and the reported diversion hours in participating EMSAs and participating hospitals collected by the Abaris Group from May 2006 through August 2008. Overall Survey findings Data Collection and Reporting Issues There were several data collection and reporting challenges that were identified during the course of this project, many of which focused on the project’s key performance indicators (KPIs) (see Appendix C). First, many participating hospitals felt that too many KPIs were collected, and that not all of the KPIs had a direct relationship to ambulance diversion (such as the KPI to measure time to pain management in the ED). Second, although data definitions and reporting parameters were defined initially, the process of collecting the data was challenging for many hospitals, requiring resources and staff time, particularly for those participants relying on manual data extraction. In addition, the frequency of data collection (twice monthly or every 2 weeks) was also challenging for many participants. As a result, data reporting was often incomplete or delayed. Third, many participants noted that even when they had collected data in a timely manner, reporting their results via the collaborative’s website proved challenging, particularly at the beginning of the

UCSD Dept of Emergency Medicine CEDDP Evaluation
10
project year. This difficulty was related to problems getting the website up and running, as well as some challenges with entering data initially. In particular, the collection of ambulance “off load” times should be highlighted. Despite the developed data definitions and ongoing consultation throughout the project, the actual definition used by the varying regions was still challenging to determine. Different EMSAs, agencies and hospitals had different definitions for the “off load” time (aka “wall time”). For some participants, it was defined as the time from ambulance arrival at the hospital to transfer of patient to the ED bed; for others it was the time from arrival to the time the ambulance was reported ready for a new call; and for others it was defined simply as a standard 20 minutes. Because of this variability in the definition, no conclusions can be made regarding the potential impact of efforts to reduce ambulance diversion by hospitals on the potential for increasing “off load” times for ambulances once they arrive to a hospital with a full ED. Abaris Coaching It was apparent throughout the evaluation that the Abaris staff provided excellent consultation and were very responsive and willing to assist participants whenever possible. However, as is not unexpected with this type of project, many participants expressed that their initial expectation was that the Abaris group would have provided more of the actual efforts involved in instituting changes at their facilities. Many felt that participation was too “labor‐intensive” on the hospital side. In essence, staff at many hospitals had hoped for more “consulting” in the form of live meetings and engagement of in‐hospital personnel, leadership and administration, to initiate change. ED staff involved in the project appreciated the Abaris coaching, and its emphasis on ED crowding being a hospital‐wide problem, not just one solely occurring in the ED. The Abaris staff was instrumental in gaining the support of hospital leadership at the start of the collaborative. However, participants did emphasize that they needed to have the continuous support of non‐ED hospital staff and leadership throughout the project year; with some noting that enthusiasm at this level waned over time as the Abaris staff engagement decreased. Overall Benefit The overall benefits of the CEDDP were evident through the evaluation process. Prior to the collaborative, many agencies and hospitals were not tracking diversion and throughput data. With participation, many agencies and hospitals improved their collection, tracking and utilization of data providing a strong basis for data‐driven decision making. For the most part, all participants stated they would continue collecting the KPI data as performance measures, though to a lesser frequency than during the collaborative year. Participation in the project also helped staff realize that diversion is not necessarily a solution to overcrowding. As a result, many expressed a willingness to try “no diversion” provided their hospital leadership would agree, and that other area hospitals would do the same. Similarly, a number of EMSAs reported that they are more strongly considering a “no diversion” practice based on participating in the CEDDP. Although the project has assisted many agencies and hospitals to improve data collection and tracking of important factors, the actual impact of the project of the project on diversion hours remains unclear. Much of the data collected were only done so for the project period and when comparing these types of

UCSD Dept of Emergency Medicine CEDDP Evaluation
11
data, there are many factors that confound the measure such as seasonal trends. Comparing measures between month of differing seasons and even the same month between different years can lead to ecological fallacy and misinterpretation. There were also participation factors that affect the ability to generalize the methods used and make the benefit of the CEDDP challenging to quantify. Regions and hospitals were asked to participate based on their willingness and desire to address the issue of ambulance diversion. Most participants already had plans for implementing various changes and initiatives prior to participating in the project and diversion was already trending lower in the years leading into the project. Additionally, the geographic location of participants provided a further challenge for determining the success of the project. Diversion is impacted by neighboring EMS agencies and hospitals. The affect of the non‐participating hospitals on those participating is unknown. This is even further diluted because although the majority of participating hospitals were decreasing diversion over time, the statewide data showed similar trends. Therefore, it appears that non‐participating hospitals were also decreasing their diversion hours. Although the direct benefit is difficult to quantify based on the factors reported above, the majority of participants reported a benefit to participating in the program. It was noted that the project helped bring raise the issue of ambulance diversion as a major concern to their leadership, and provided a platform for cooperation and collaboration with other hospitals and the EMSAs. While many hospitals already had plans for implementing various initiatives, participation in the collaborative seemed to focus the energy and enthusiasm to make these efforts a reality. The resources provided by Abaris were useful in modifying their current practices as well as considering and implementing new ideas. Many participants indicated that they will continue after the collaborative in implementing new initiatives at their facilities. Overall Impact on Diversion As noted above, it is difficult to measure the full impact of CEDDP on ambulance diversion. First, as previously described, ambulance diversion throughout the State, as well as within the 4 EMSA areas was decreasing in the years prior to the collaborative and this trend continued during the project year. Second, hospital and EMSA diversion hours were subject to seasonal trends, such as the winter flu season, which impacted the analysis of the 9 months of data available from the collaborative. Third, because diversion is greatly affected by neighboring hospitals, and it appears that hours decreased both with participating and non‐participating hospitals (as evidenced by the EMSA diversion data), the exact impact of CEDDP participation within a given region is difficult to determine. Figure 3 reports the total ED diversion hours for participating hospitals from May 2006 through August 2008. There was a decreasing trend in hours among participants with a more dramatic decrease toward the end of the project period (April 2008 through May 2008) when compared to previous years. The typical seasonal trend in ED utilization and diversion is demonstrated in the increased hours during the winter months. The increase in the most recent winter season was likely due to a higher than normal incidence of influenza during that year.

UCSD Dept of Emergency Medicine CEDDP Evaluation
12
-
500
1,000
1,500
2,000
2,500
3,000
May
-06
Jul-0
6
Sep
-06
Nov
-06
Jan-
07
Mar
-07
May
-07
Jul-0
7
Sep
-07
Nov
-07
Jan-
08
Mar
-08
May
-08
Jul-0
8
Figure 3. Total ED Diversion Hours for Participating Hospitals, May 2006 - August 2008
Project Period (9/07-6/08)

UCSD Dept of Emergency Medicine CEDDP Evaluation
13
Los Angeles Region Los Angeles County has the highest diversion hours annually in the State. As noted above, this county also had the largest drop in ambulance diversion hours in the years preceding the CEDDP collaborative (Table 8). Table 8. Los Angeles Region Diversion Hours and Percent Change, 2003‐2007
2003 2004 2005 2006 2007 ∆2003‐2007Diversion Hours 166,159 165,026 174,952 102,609 81,741 ‐84,418
2003‐2004 2004‐2005 2005‐2006 2006‐2007 ∆2003‐2007Percent Change ‐0.7% 6.0% ‐41.4% ‐20.3% ‐50.8% For the 9 months of data available during the collaborative (September 2007 – June 2008), there was an increase initially in diversion hours, followed by a decrease (Figure 4). Although this change appears to mirror seasonal variations reported with ambulance diversion previously, the decrease is larger and appears to be sustained longer than previous years. Overall, the changes during 2007 in terms of ambulance diversion continued an ongoing trend in Los Angeles of decreasing diversion over the past several years with a larger decrease toward the end of the project period.
0
200
400
600
800
1000
1200
1400
May
-06
Jun-
06Ju
l-06
Aug
-06
Sep
-06
Oct
-06
Nov
-06
Dec
-06
Jan-
07Fe
b-07
Mar
-07
Apr
-07
May
-07
Jun-
07Ju
l-07
Aug
-07
Sep
-07
Oct
-07
Nov
-07
Dec
-07
Jan-
08Fe
b-08
Mar
-08
Apr
-08
May
-08
Jun-
08Ju
l-08
Aug
-08
Figure 4. Total ED Diversion Hours for Participating Hospitals , Los Angeles Region, May 2006 - August 2008
Project Period (9/07-6/08)

UCSD Dept of Emergency Medicine CEDDP Evaluation
14
Los Angeles County EMS LA EMSA staff believed that participation in CEDDP was valuable. Their initial hope was to address the impact of the threatened closure of hospitals in East Los Angeles County. Unfortunately, just before the start of the collaborative, Martin Luther King Medical Center closed. Subsequently, Downey Hospital, located in close proximity to MLK, withdrew from the collaborative. In general, EMSA staff felt that the process and outcomes would have been more useful if more hospitals in the given geographic region would have participated in the collaborative, as one hospital diversion is greatly influenced by the status of neighboring institutions.9 As to the specifics of the collaborative, staff felt that the data collected was robust and comprehensive, but presented challenges because of short time requirements for data submission and variable website reliability early on in the project. The staff did note that the data collection process improved significantly over the months of the collaborative. Two data elements proved to be particularly challenging for the agency. These were the off‐load times (also known as wall time, the time from ambulance hospital arrival to patient transfer or ambulance ready status), which some of the EMS providers did not track; and numbers of patients diverted, which was manually collected at a number of the hospital EMS bases. However, the EMS staff did note that the data reporting requirements of the collaborative were useful in highlighting the problem of ambulance diversion and its various components such as off‐load times, to area EMS agencies and hospitals. LA EMSA did not institute new policy changes as a direct result of the collaborative. However, they plan on continuing the data collection, as well as periodic audits of performance measures. The do plan to use their IT system (READINET) to mandate a 15 minute period after one‐hour of diversion where the hospital cannot go back on diversion. In terms of wall‐time, the agency is considering policy changes to address the issue of ambulance “stacking” at various hospitals, including allowing real‐time access to READINET data on wall‐time for EMS providers. Staff also felt the collaborative was useful in getting hospitals to consider a “no‐diversion” policy, but also felt that the agency itself could not mandate such a policy without some means of enforcement.
Los Angeles County Hospitals Similar to the overall Los Angeles EMS County data, ambulance diversion varied seasonally, but appeared to follow a general trend toward decreasing diversion (Figure 5). There was a significant drop in diversion for all 3 remaining participating hospitals in April 2008 which was sustained through the end of the collaborative. In particular, the decrease was most notable for one of the participating hospitals (St. Francis Medical Center).

UCSD Dept of Emergency Medicine CEDDP Evaluation
15
Presbyterian Intercommunity Hospital (PIH) PIH is a moderate‐sized hospital with a fairly busy ED (200 patients seen daily). The institution already had fairly low diversion hours and they believed they were selected to serve” as a model” for other collaborative participants. PIH staff did not feel the collaborative had a significant impact on their institution’s diversion hours which were low already, but they did feel that participation was very useful. As a results of the collaborative, PIH initiated a number of changes to improve patient flow including adopting a new triage process and culture in the ED, implementing an electronic bed request system, and creating a bed capacity alert process. In addition, staff felt there were significant benefits from the “networking” that occurred with the collaborative, introducing new ideas, such as a physician at triage, that PIH is considering. PIH did note a number of challenges to participating in the collaborative. Similar to other hospitals, data collection was challenging because of the number of different KPIs to be collected, the short time frame in which to report the data, and initial difficulty with the online system. In particular, the specific breakdown of the admission Length of Stay process proved difficult. In addition, at the time of the collaborative, the hospital implemented a new IT system which diverted resources from the collaborative. Methodist Hospital Methodist Hospital in Arcadia is a moderate‐sized hospital with a high‐acuity, medium volume ED (110 patients seen daily). Nearly one‐third of all ED patients are admitted to the hospital at Methodist. Staff believed participation in the collaborative was useful, particularly in highlighting and addressing issues of admission patient flow to others at their institution.
0
50
100
150
200
250
300
350
May
-06
Jun-
06
Jul-0
6
Aug
-06
Sep
-06
Oct
-06
Nov
-06
Dec
-06
Jan-
07
Feb-
07
Mar
-07
Apr
-07
May
-07
Jun-
07
Jul-0
7
Aug
-07
Sep
-07
Oct
-07
Nov
-07
Dec
-07
Jan-
08
Feb-
08
Mar
-08
Apr
-08
May
-08
Jun-
08
Jul-0
8
Aug
-08
Figure 5. ED Diversion Hours for Participating Hospitals, Los Angeles Region,May 2006 - August 2008
MHSC PIH SFM Project Period (9/07-6/08)

UCSD Dept of Emergency Medicine CEDDP Evaluation
16
Participation in the collaborative led directly to the implementation of daily bed meetings and a color‐coded alert system highlighting inpatient bed status. A new “bed czar” RN was initiated to manage patient flow and make bed assignments; and a 30 minute rule was adopted for time from ED admission decision to inpatient bed. Staff felt that these improvements in the admission process would be sustainable. Other initiatives undertaken with variable success including adding additional triage RN staff, implementing universal ED beds, and attempting to improve inpatient bed turnaround times. Methodist staff noted similar challenges of other hospital participants in terms of data collection and reporting. In particular, because less data were electronic, collection was difficult and required manual processes conducted on a randomized sample of patient charts. In addition, Methodist experienced an increased admission rate which has continued. During the collaborative period, the ED also was hit with a busy flu season resulting in an increase of 20‐30% in ED volume during those months. St. Francis Medical Center St. Francis Medical Center had the highest diversion hours of the participating hospitals in the LA EMSA. During the collaborative period, the institution had a dramatic decrease in diversion hours. Interestingly, the staff felt that many of the processes driving toward this improvement were in place or planned before the collaborative started, and that participation did not make any appreciable impact. Administrative staff did feel that participation was useful in terms of networking with other hospitals to see what efforts others were making to improve patient flow and reduce diversion. In particular, the hospital plans on studying the utility of “hallway” inpatient beds to address admission patient flow in the future. Downey Hospital Unfortunately, Downey Hospital withdrew from participation in the collaborative early on. It is unclear as to the specific reasons for withdrawal, but may have been related to the closure of MLK.

UCSD Dept of Emergency Medicine CEDDP Evaluation
17
Inland Counties Region
Inland Counties has the second highest diversion hours annually in the State. As noted above, this county had the second largest drop in ambulance diversion hours in the years preceding the CEDDP collaborative (Table 9). Table 9. Inland Counties Region Diversion Hours and Percent Change, 2003‐2007
2003 2004 2005 2006 2007 ∆2003‐2007Diversion Hours 52,387 37,114 32,661 22,318 19,224 ‐33,163
2003‐2004 2004‐2005 2005‐2006 2006‐2007 ∆2003‐2007Percent Change ‐29.2% ‐12.0% ‐31.7% ‐13.9% ‐63.3% For the 9 months of data available during the collaborative (September 2007 – June 2008), there was an increase initially in diversion hours, followed by a decrease (Figure 6). This transient increase likely reflects flu seasonal variation with the continued trend during the warmer months. Overall, the changes during 2007 in terms of ambulance diversion continued an ongoing trend in Inland Counties of decreasing diversion over the past several years.
0
100
200
300
400
500
600
700
800
900
May
-06
Jun-
06Ju
l-06
Aug
-06
Sep
-06
Oct
-06
Nov
-06
Dec
-06
Jan-
07Fe
b-07
Mar
-07
Apr
-07
May
-07
Jun-
07
Jul-0
7A
ug-0
7S
ep-0
7
Oct
-07
Nov
-07
Dec
-07
Jan-
08Fe
b-08
Mar
-08
Apr
-08
May
-08
Jun-
08Ju
l-08
Aug
-08
Figure 6. Total ED Diversion Hours for Participating Hospitals, Inland Counties Region, May 2006 - August 2008
Project Period (9/07-6/08)
UCSD Dept of Emergency Medicine CEDDP Evaluation
18
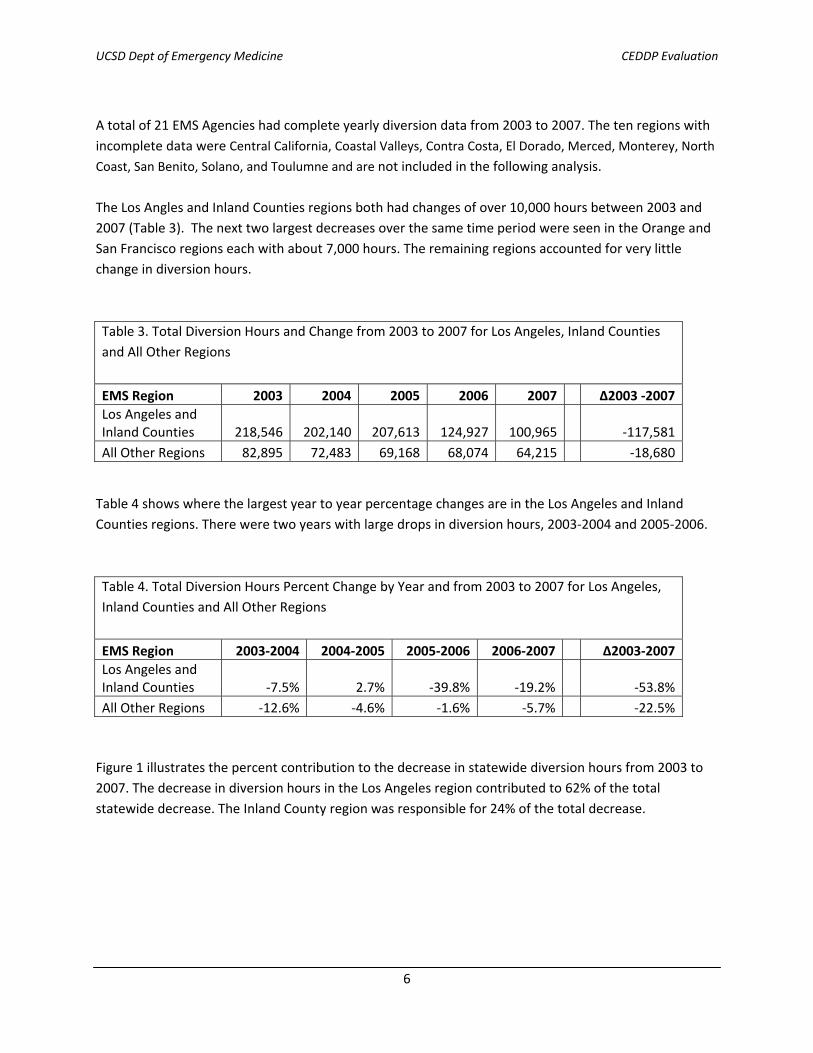
Inland Counties EMS
Inland Counties incorporates a three county area which is diverse and tremendous in area and includes basin, high desert and isolated rural areas and mountains. Inland Counties EMSA reported a long history of issues with ambulance diversion and was eager to try to utilize participation in CEDDP to assist with diversion process changes. In fact, three rural area hospitals in the region already have no diversion practices because there is literally nowhere else for ambulances to go. With participation in CEDDP, the EMSA staff saw the project as an opportunity for the hospitals to look at key practices, make change and reassess practices. Their goal was to eliminate diversion. The EMSA chose two major trauma centers in the area, Loma Linda, Arrowhead Regional (County hospital) and also asked St. Mary’s Hospital, as representative of high desert, to participate. They reported that they would have included more hospitals, but were limited to 2 or 3 based on the structure of the CEDDP. They report the process was followed closely by community and the County Board of Supervisors and reported to the community oversight committees monthly. One of the biggest benefits of the study as reported by the EMSA included the ability to work with hospitals to think “outside the box” to improve patient movement within the hospital. Additionally the project enabled the EMSA the ability to make diversion a countywide issue to be addressed and increase the awareness of the problem for hospital administrators. Data collection challenges included that there was no mechanism to collect numbers of actual patients bypassed initially (but was later addressed in the electronic record system). One of the two large agencies reported data for ambulance offload time, but the other did not. There was question as to the reliability and consistency of the off load time data being collected. Ultimately, they reported no significant changes in offload times. The EMSA did not institute new policies as a result of participation in the collaborative and are unlikely to go directly to a no divert policy, but hope to use the data and increased awareness to tighten the current policy and practice. Of note, the EMSA also reported that the neighboring county, Riverside, recently went to a No Divert Policy which has impacted bordering hospitals in Inland Counties. Inland Counties Hospitals In Inland Counties, ambulance diversion varied seasonally, but appeared to follow a general trend toward decreasing diversion over several years and including the CEDDP period (Figure 7). There was a significant drop in diversion for two of the three participating hospitals at the start of the program with a bump in January and February, consisted with flu season, which then came down to even lower levels for the last several months of the program. Of note, the decrease in ambulance diversion was most dramatic for one of the participating hospitals (Loma Linda Medical Center).

UCSD Dept of Emergency Medicine CEDDP Evaluation
19
Arrowhead Hospital Because the large majority of admissions are through the ED (89%), the ED in particular, and hospital staff in general were very interested in the collaborative. They saw participation in CEDDP as a chance to bring patient flow issues and the holding of admissions in the ED to attention of hospital administration. They report rollout challenges revolving around buy in. The ED leadership and staff supported the program, but felt that the actual roll out was a bit disorganized, citing lack of definitions, no formal training on how to enter data, and that the website was not up initially. Just as important, staff felt that meetings with hospital leadership were lacking. The ED staff had hoped to get the hospital in alignment on the common goals of improving patient flow, decreasing admission bordering time and in turn, decrease ambulance diversion hours. Ultimately they report that there was no inpatient champion, nor buy in from hospital leadership. The hospital would have preferred on‐site visits instead of just coaching calls as they felt they really needed a third party to assist with aligning hospital leadership. The calls were reported as productive, but not really shedding any new wisdom. The hospital reported challenges in data collection. They had to acquire data from several different sources, including the ED physician group for physician times, EMS run sheets, inpatient charts; most of which had to be collected manually as there was no electronic system. Admission boarding hours had to be calculated based on admit orders times compared with the time of leaving the ED which had to be collected manually for every admitted patient. They received the offload hours from the ambulance
0
50
100
150
200
250
300
350
400
450M
ay-0
6
Jun-
06
Jul-0
6
Aug
-06
Sep
-06
Oct
-06
Nov
-06
Dec
-06
Jan-
07
Feb-
07
Mar
-07
Apr
-07
May
-07
Jun-
07
Jul-0
7
Aug
-07
Sep
-07
Oct
-07
Nov
-07
Dec
-07
Jan-
08
Feb-
08
Mar
-08
Apr
-08
May
-08
Jun-
08
Jul-0
8
Aug
-08
Figure 7. ED Diversion Hours for Participating Hospitals, Inland Counties Region, May 2006 - August 2008
Arrowhead Loma Linda St. Mary
Project Period (9/07-6/08)

UCSD Dept of Emergency Medicine CEDDP Evaluation
20
provider but staff questioned its accuracy, and did not have a way of easily validating these times. Additionally, they did not collect the number of patients diverted. Though they felt that the program did not change anything internally for their hospital specifically, they thought participation was beneficial for increasing awareness. They report that during the year, they had already initiated their own processes that were in works before CEDDP was initiated, and believe it was these efforts, as opposed to participation in the collaborative, that led to the continuing downward trend in ambulance diversion hours. Loma Linda Medical Center Loma Linda Medical Center had the highest numbers of ambulance diversion hours of the three participating hospitals. It is a level I trauma center and burn center with a large urban indigent population. They report that they utilize 10‐12 hallway beds a day The hospital reports that participation was decided by the CEO and was then handed over to ED staff to complete. The hospital reported challenges with initiation of the program in that many of the data definitions differed between the way the hospital collected these data points compared with what was being requested (i.e. door to disposition was a different time set). Some data were collected electronically and some manually. The requested reporting time frames were challenging as some of the requested data were not available until a few weeks after the end of each month. Though initiated by the CEO, they felt that the hospital leadership while encouraging, did not empower staff to initiate improvements. The hospital felt that the success stories from the website were useful and of high quality. Staff also appreciated the data from other sites and frequently looked to compare themselves to others as a form of “friendly competition” with Arrowhead Medical Center. The data increased awareness and the ability to change staff behavior in following the diversion policy. They did note that it would have been more helpful if the hospitals participants were more regionalized rather than spread out. One area internally that they report coming from the collaborative was that it gave the hospital the impetus to start a hospital wide “Code Capacity” process , to increase inpatient service awareness of ED capacity issues to hopefully encourage more rapid discharging of inpatients. This initiative was scheduled to start after the project timeframe. Areas that staff still feel need for improvement include solving ED outflow issue and getting admitted patients upstairs in a more timely manner. Staff also felt that ambulance offload times remain a major problem. St. Mary’s Medical Center The evaluation team was unable to contact staff at St. Mary’s Medical Center for evaluation purposes.

UCSD Dept of Emergency Medicine CEDDP Evaluation
21
Ventura Region In the years prior to the collaborative, Ventura County experienced dramatic increase in the cumulative hours of diversion (53% over 5 years as noted in Table 10). As a result, the EMSA was a more than willing participant in CEDDP. Table 10. Ventura Region Diversion Hours and Percent Change, 2003‐2007
2003 2004 2005 2006 2007 ∆2003‐2007Diversion Hours 4,819 9,257 9,521 10,836 7,400 2,581
2003‐2004 2004‐2005 2005‐2006 2006‐2007 ∆2003‐2007Percent Change 92.1% 2.9% 13.8% ‐31.7% 53.6% Figure 8 illustrates ED diversion hours for the Ventura region. Interestingly, just prior to the collaborative, one hospital, St. John’s underwent tenting for mold for a 1 month time period. During that time, the EMS agency enforced a “no diversion” policy for all hospitals. Area hospitals also adopted a number of changes and increased their resources as a part of the planning for St. Johns closure. As a result, hours on diversion significantly declined for that one month (August 2007) and the EMSA reported that the temporary policy was a success. A number of hospitals objected to the idea of continuing the “no divert” policy and the policy was rescinded once St. Johns was again operational.
-
200
400
600
800
1,000
1,200
May
-06
Jun-
06Ju
l-06
Aug
-06
Sep
-06
Oct
-06
Nov
-06
Dec
-06
Jan-
07Fe
b-07
Mar
-07
Apr
-07
May
-07
Jun-
07Ju
l-07
Aug
-07
Sep
-07
Oct
-07
Nov
-07
Dec
-07
Jan-
08Fe
b-08
Mar
-08
Apr
-08
May
-08
Jun-
08Ju
l-08
Aug
-08
Figure 8. ED Diversion Hours for Participating Hospitals, Ventura Region,May 2006 - August 2008
Project Period (9/07-6/08)

UCSD Dept of Emergency Medicine CEDDP Evaluation
22
Ventura County EMS Ventura County EMS staff believed participation in the CEDDP collaborative was valuable from a number of standpoints. First, the collaborative provided the impetus for collecting “hard data” on ED ambulance diversion and hospital patient flow. The EMS director felt this was particularly important in basing decisions on more comprehensive data rather than anecdote. Second, CEDDP “forced” collaboration between the EMSA, EMS providers and hospitals to not only collect data, but review patient care flow processes. As a result, regular monthly meetings have been instituted, incorporating both administrative and front‐line ED leadership. The main challenges for the EMSA were in getting hospitals to participate and in collecting data. The agency had some difficulty in convincing the 3rd and 4th hospitals to participate in the program. Data collection was difficult because of the number of different dispatch centers (3) and EMS agency providers. As a result, the definition and reporting of off‐service In addition, while the EMSA utilizes a READINET and CAD system for data collection, there was no universal system for tracking and collecting hospitals times. In fact, the EMSA questioned the validity of some of the hospital data points collected as EMS and hospital data often differed as to diversion time and number of patients diverted. Finally, EMSA noted that while diversion hours decreased over the project year, numbers of patients diverted actually increased. The EMSA believes participation in the collaborative, along with the 1‐month no diversion trial as a result of temporary closure of one hospital, has laid a foundation upon which a “no diversion” policy may be implemented in the future. However, they acknowledge that such a policy is fraught with political ramifications and that the administrative leadership of a number of hospitals would be opposed to such a policy. Ultimately, the issue of ED diversion may be better addressed at the level of a regional hospital association opposed to the local EMSA.
Ventura County Hospitals While seasonal variation in diversion hours occurred for the hospitals similar to the EMS aggregate data, the decrease in diversion in August 2007 as a result of the temporary closure of St. Johns just prior to the start of the collaborative is remarkable (Figure 9). As noted above, anticipation and preparation of this closure led to surge capacity planning for the EMSA and local area hospitals, as well as implementation of a “no diversion” policy during the time period of the closure. Hospital increased resources, staffing and space to address the anticipated increase in patient loads. However, these efforts were not sustained and as such, once the policy was lifted, diversion hours dramatically rose in concert with expected seasonal increases, followed by a decrease over the latter half of the collaborative project time frame.

UCSD Dept of Emergency Medicine CEDDP Evaluation
23
Community Memorial Hospital Community Memorial Hospital had generally low diversion hours at baseline and were more interested in improving their patient flow and admission process with participation in the collaborative. The staff had an ED throughput project in place for a number of years prior to the collaborative and continued these processes during the project timeframe. At the start of the project, ED staff felt the collaborative had done an excellent job of getting the buy‐in from administrative leadership, particularly the Chief Nursing Officer (CNO), but that this momentum waned over time due to personnel changes and lack of engagement between the collaborative staff and the CEO and COO of the hospital. In terms of data collection, hospital staff faced similar challenges that of other hospitals. In particular, staff felt that the bimonthly or 2‐week reports were too frequent and redundant, requiring resources and time from staff that could be spent elsewhere moving the project forward. The staff appreciated the guidance from the Abaris staff, but felt that the collaborative could have been more useful in terms of maintaining leadership buy‐in to initiate and move changes forward. The staff felt that the collaborative was useful in exposing them to other ideas to improve patient flow. In particular, the idea of “hallway” inpatient beds was particularly noteworthy. In addition, they intend to implement some of the changes highlighted by others including fax reporting and holding orders. In general, however, Community Memorial staff felt that the planning and implementation of measures to prepare for the temporary closure of St. Johns proved to be more useful than the collaborative in terms of improving ED patient flow and providing support for a “no diversion” policy implementation. Ventura County Medical Center Ventura County Medical Center’s diversion hours have waxed and waned relative to overall ED census over the past few years according to staff. Participation in the collaborative was useful in gaining
0
100
200
300
400
500
600
May
-06
Jun-
06
Jul-0
6
Aug
-06
Sep
-06
Oct
-06
Nov
-06
Dec
-06
Jan-
07
Feb-
07
Mar
-07
Apr
-07
May
-07
Jun-
07
Jul-0
7
Aug
-07
Sep
-07
Oct
-07
Nov
-07
Dec
-07
Jan-
08
Feb-
08
Mar
-08
Apr
-08
May
-08
Jun-
08
Jul-0
8
Aug
-08
Figure 9. ED Diversion Hours for Participating Hospitals, Ventura Region,May 2006 - August 2008
Community Simi St. John's Ventura County MCProject Period (9/07-6/08)

UCSD Dept of Emergency Medicine CEDDP Evaluation
24
support for a number of initiatives which had proposed previously. Specifically, staff were able to initiate a standard page to all MDs to discharge patients whenever hospital capacity was reached. These calls also went to the Medical Directors to facilitate disposition of patients. Other efforts included measures to improve flow of patients from the waiting room to open ED beds. However, ED RN staff, citing the State’s current Nurse Patient Ratio law, resisted this measure and it did not result in any measurable success. Other measures included the requirement that the CNO be contacted before going on diversion which resulted in blocking diversion 75% of the time according to staff. Ventura County Medical Center encountered significant obstacles to the data collection. Because data were not electronic, all data were manually collected. In addition, the staff felt that some of the suggestions from the Abaris staff were unrealistic and did not take into account the underlying conditions at the facility. Overall, however, it was felt that participation in the collaborative allowed staff to measure and highlight the diversion and crowding problem, and to see that a “no diversion” policy may not be completely out of reach. Simi Valley Hospital Simi Valley Hospital experienced a change in project champions midway through the collaborative. As a result, their impression of the results of the institution’s participation was mixed. Staff did implement a number of initiatives during the project year including triage bypass, bedside registration, and a monthly ED working group focused on patient flow issues. Efforts were “conservative” by their own admission, in order to insure sustainability over the long term. Data collection remains a challenge for staff. In fact, not all data elements were collected by the end of the project period. Staff felt that too many data elements with too great a frequency were required by the collaborative. While not all data elements were felt to be related to improving diversion hours, staff did indicate that the KPIs were useful in assessing overall ED performance. St. John’s Regional Medical Center As noted above, St. John’s Regional Medical Center experienced a temporary closure just prior to the collaborative. Following this closure, diversion hours increased remarkable in concert with seasonal increases, then decreased over the collaborative period. Similar to Simi Valley Hospital, St. John’s experienced a change in staffing midway through the project time period. Efforts to improve patient flow over this time period focused the initiation of a rapid care fast track, staffing triage with a nurse practitioner, and faxed reporting for admitted patients; all of which staff felt had a measurable impact on patient flow parameters. In terms of challenges, St. John’s data collection was completely manual and relied on review of paper charts and logs, including ambulance times. As a result, data collection was time and resource intensive. In terms of the Abaris coaching, staff felt that too much focus was placed on the data collection and the mechanics of the project, rather than directly addressing the diversion and patient flow issues. Ultimately, while staff felt that a “no diversion” policy was a good idea, they believed that implementation would not be successful unless their hospital’s patient flow processes were addressed first.

UCSD Dept of Emergency Medicine CEDDP Evaluation
25
Santa Clara Region Unlike statewide trends, diversion in hours in Santa Clara County increased over the 2003 to 2007 time period. This trend was notable for a marked increase in diversion hours in 2004 following the closure of San Jose Medical Center (Table 11). Participation in CEDDP was felt to be an opportunity to bring the issue to light to the community at large. Table 11. Santa Clara Region Diversion Hours and Percent Change, 2003‐2007
2003 2004 2005 2006 2007 ∆2003‐2007Diversion Hours 2,084 3,077 2,638 2,546 2,600 516
2003‐2004 2004‐2005 2005‐2006 2006‐2007 ∆2003‐2007Percent Change 47.6% ‐14.3% ‐3.5% 2.1% 24.8% For the 9 months of data available during the collaborative (September 2007 – June 2008), there was a transient increase in diversion hours, likely related to seasonal changes, followed by a decrease (Figure 10). Overall, the changes during 2007 at the only participating hospital , Regional Medical Center, followed a similar trend to the rest of Santa Clara County.
0
5
10
15
20
25
30
35
Jan-
06Fe
b-06
Mar
-06
Apr
-06
May
-06
Jun-
06Ju
l-06
Aug
-06
Sep
-06
Oct
-06
Nov
-06
Dec
-06
Jan-
07Fe
b-07
Mar
-07
Apr
-07
May
-07
Jun-
07Ju
l-07
Aug
-07
Sep
-07
Oct
-07
Nov
-07
Dec
-07
Jan-
08Fe
b-08
Mar
-08
Apr
-08
May
-08
Jun-
08Ju
l-08
Aug
-08
Figure 10. ED Diversion Hours for Participating Hospitals, Santa Clara (RMC-SJ), May 2006 - August 2008
Project Period (9/07-6/08)

UCSD Dept of Emergency Medicine CEDDP Evaluation
26
Santa Clara County EMS
Santa Clara County runs 95,000 EMS calls a year for a population of 2 million persons. In 2004, San Jose Medical Center closed with a notable increase in ambulance diversion as described above. As a result, the EMSA conducted an impact report was done from an EMS perspective to assess flow of patients to the remaining hospitals. In 2005, the diversion policy was revised to “tighten it up.” The EMSA wanted to participate because of the impact of SJMC closure had on ambulance diversion and they saw this as an opportunity to bring the issue to the higher levels in the hospitals. The EMSA reported that the biggest issues they had with the program were that the ongoing requirements were more than what they were expecting. Initially Stanford, Santa Clara Valley Medical Center and Regional Medical Center planned to participate in the collaborative. The biggest issues the participants had with the collaborative were that they felt the data collection and reporting were much more time and resource intensive that originally anticipated. They were under the impression that they would be using previously collected data, but as the program moved forward, they felt additional new requirements were being added including new and different data elements to be collected. The EMSA was also hoping the collaborative would lead to more interaction with hospital administration to align efforts to address diversion, but report that only a single meeting was held with participating hospital leaders. Finally, there was a cost to participate in the program by the EMSA and hospitals and they believe there was to be reimbursement including funding for travel and participation in summits, but in the end report that that ultimately, no funding was forthcoming. Given the challenges, in the end, only one hospital submitted data to the EMSA, Regional Medical Center In summary, they felt positive about the community oversight committee that was initiated, which was a good start, but ultimately the overall program was not what Santa Clara needed as it was too resource intensive and costly according to EMSA staff.

UCSD Dept of Emergency Medicine CEDDP Evaluation
27
Summary of Ambulance Diversion Mitigation Practices & ED Capacity Initiatives During the collaborative, both EMSAs and hospital initiated multiple strategies and mitigation efforts to address ambulance diversion and ED capacity. Although this list is not exhaustive, nor necessarily identified as best practices, they were noted by participants as real efforts implemented during the project year. In general, while the details of these initiatives were often specific to their institutions, the conceptual underpinnings of most are largely exportable to other settings. Ambulance Diversion Mitigation Initiatives Most EMSAs have established diversion policies. These measures vary from limiting the amount of time a hospital can go on diversion (ie. 60 minutes), to requiring a certain time for a given hospital to be completely off diversion (ie. 15 minutes) when coming off a diversion period. These types of policies have been implemented with a dramatic effect in Los Angeles County as well as San Diego County.10
Participants of the collaborative often expressed the desire to “tighten up” their existing diversion policies, but noted some resistance from hospitals as well as EMS providers. In addition, most EMSAs felt that the sustainability of these measures depended on the resources to audit and track hospital compliance, as well as the ability to enforce such measures. The use of electronic real‐time tracking of EMS data has been utilized to good effect to address these issues by some EMSAs. A number of EMSAs expressed a desire to move to a true “No Diversion” policy in the future. Indeed, there appeared to be a shift in the openness of ED and hospital staffs who participated in the collaborative to such a “No Diversion” idea. Many staff felt that participation in the collaborative along with reviewing their own institution’s data indicated to them that diversion itself was no solution to the ED crowding problem. However, staff also expressed that there were political dynamics and resistance from their own hospital leadership that must be overcome prior to any real movement to no diversion. Moreover, such a policy would likely be sustainable only if other area hospitals also agreed to a no diversion policy such that no institution would bear the brunt of a potential large influx of ambulance patients by itself. These issues go across regional boundaries as evidenced by Inland Counties EMSA staff concerns regarding the adoption of a “no diversion” policy by neighboring Riverside County. In addition, the impact of no diversion policies and hospital diversion decisions on ambulance “off load” times remains to be determined as participants reported, when tracked, significant variability in these times. ED Capacity Initiatives Asplin et al. have propose a conceptual model of ED patient flow three interdependent components providing an operations management framework for understanding the causes of and potential solutions to overcrowding.11 These components are Input (ambulatory patient and ambulance arrivals to the ED); Throughput (patient length of stay in the ED including wait time, placement, evaluation and care time); and Output (patient disposition including admission, transfer, and discharge). During the

UCSD Dept of Emergency Medicine CEDDP Evaluation
28
collaborative year, participants implemented or planned a number of initiatives targeting improvements in flow in each of these three components. In general, none of the projects implemented by the hospitals were particularly innovative as most focused on well‐established initiatives previously reported in the literature (unlike the Urgent Matters program which highlighted a number of ED flow innovations). However, the collaborative did provide many hospitals the impetus with which to implement these practices during the year. It is also important to remember, that while ED capacity overall plays an important role in diversion decisions, the impact of each of these measures on mitigating ambulance diversion has yet to be determined. Input Initiatives A number of hospital participants implemented efforts to speed the entry of patients into the ED for care. Many efforts focused on eliminating the sequential queuing that occurs upon patient arrival to the ED including process steps of sign‐in, registration, triage, and waiting for open ED bed. Bedside registration was implemented to eliminate waits for registration on patient arrival. This initiative is likely exportable and sustainable, provided adequate resources including staff are available, and in fact may be enhanced by informatics resources such as wireless capabilities. Other efforts included increased staffing at triage with RNs and nurse practitioners to more rapidly triage patients, as well as the potential to initiate actual evaluation and care at the patient entry point. Again, these measures are likely sustainable and exportability provided resources such as staff and space are in fact available. One input initiative that met with mixed success were efforts to facility triage‐to‐bed patient movement. These efforts focused on moving patients directly from triage to an ED bed for evaluation. At one institution, resistance came from RN staff who cited California state nurse ratio laws that limited the number of patients who could be placed in ED beds at any one time. Ironically, while this law was designed to improve patient safety, its unclear how having patients stay in crowded waiting rooms rather than be placed in open ED beds improves patient safety in the long run. Throughput Initiatives Initiatives to improve patient care times in the ED included on surge capacity planning with expanded resources and staff (such as occurred in Ventura County in preparation for the closure of St. Johns) to meet the needs of an anticipated increased inflow of patients. These efforts could potentially be sustained and exportable provided resources are available, but as was demonstrated with the St. Johns planning, no effort was made to continue the surge effort once that hospital reopened. Another initiative implemented was the creation of an urgent care or fast‐track to expedite low acuity patients through the ED. These measures have proven to be successful in improving ED care times for select patients provided space and resources are made available. However, the actual impact of fast track on ambulance diversion remains unknown.

UCSD Dept of Emergency Medicine CEDDP Evaluation
29
Output Initiatives A major focus of all hospital participants of the collaborative was improving inpatient flow to reduce ED boarding of admitted patients, recognized as a major component of ED crowding and, by inference, ambulance diversion.12 Efforts of the collaborative essentially targeted improving overall hospital inpatient bed management and expediting patient flow from the ED to inpatient beds. Bed management initiatives included the creation of a “bed czar(ina)” or “flow master” in the hospital to manage and direct inpatient admissions and discharges; establishing “bed huddles” of ED and inpatient RN staff so that information and communication regarding inpatient bed availability and needs could be matched in real‐time; and the adoption of informatics tools and electronic bed tracking systems so that again needs and availabilities could be matched. Essentially these measures address a universal problem for many hospitals which is the lack of accessible, real‐time information regarding inpatient bed needs and availabilities, as well as a single decision‐making authority to assign beds appropriately. Efforts to expedite patient flow from the ED focused on process improvements to remove potential obstacles including the adoption of holding orders (for use when physicians were delayed in writing inpatient orders), and faxing of nurse reports (for use when inpatient nurses were not available to take a telephone report). In addition, use of hallway beds on inpatient floors as has been done at other institutions was considered by a number of collaborative partners, but was felt to be problematic to implement due to regulatory concerns.
Evaluation Limitations
Limitations of the objective evaluation are predicated on the limitations of the original CEDDP work, as the data evaluated quantitatively were obtained from this report. The CEDDP statewide data were obtained from EMSAs when available and then supplemented with OSHPD data when not available. There were several regions where data were not available from either source, thus limiting the data comprehensiveness and evaluation. Obviously, data are as useful as the reliability and accuracy with which they were collected and reported. Certain KPIs were not defined nor collected in the same manner (i.e. ambulance offload times) and thus impact any subsequent analysis and resulting interpretation.
In addition, the evaluation of statewide data was limited by time period. As noted above, diversion hours were trending downward statewide prior to the start of the collaborative. While it appears this trend continued, if not accelerated, during the collaborative year, no data were available to assess the whether the trend continued beyond just the few months after the collaborative ended. To fully assess the impact of the collaborative would require data for 2009 to adjust for seasonal fluctuations, as well as to assess the sustainability of any long‐term improvements.
Evaluation of the overall impact on ambulance diversion were limited region by region in that the predetermined plan of the collaborative was to work with 3‐4 hospitals in a region and evaluate four regions, rather than focus on a couple of regions and the geographically associated hospitals. There
UCSD Dept of Emergency Medicine CEDDP Evaluation
30
were several areas in which hospitals were spread out and participating hospitals were being impacted by non‐participating hospitals. In certain participating regions, there were unexpected events (i.e. mold tenting at one hospital) that, although part of doing EMS business, has an impact on patient flow and the data being collected.
There were potential limits to the administered survey tool and on site evaluations in that, although most hospitals and EMS Agencies seemed to answer candidly and openly, there may have been some comments limited out of political concerns. Additionally, although representatives from all EMSAs and the majority or participating hospitals responded to our inquiries, some did not. Although their participation would have added to this evaluation report, it is unlikely that they would have changed its content dramatically. Their non‐participation was likely based on time availability and other commitments and less on their satisfaction with the project.

UCSD Dept of Emergency Medicine CEDDP Evaluation
31
REFERENCES 1. Brennan JA, Allin DM, Calkins AM, Enguidanos ER, Heimbach LJ, Pruden JN Sr, Stilley DG. Guidelines
for ambulance diversion. American College of Emergency Physicians. Ann Emerg Med. 2000;36(4):376‐7.
2. Glushak C, Delbridge TR, Garrison HG. Ambulance diversion. Standards and Clinical Practices Committee, National Association of EMS Physicians. Prehosp Emerg Care. 1997;1(2):100‐3.
3. Asplin BR. Does ambulance diversion matter? Ann Emerg Med. 2003;41(4):477‐80.
4. NBC News. F.D. Ambulances Turned Away From 16 Chicago Hospitals. February 2005. Available online at http://www.msnbc.msn.com/id/6976703/.
5. Schull MJ, Morrison LJ, Vermeulen M, Redelmeier DA. Emergency department gridlock and out‐of‐hospital delays for cardiac patients. Acad Emerg Med. 2003;10(7):709‐16.
6. Schull MJ, Morrison LJ, Vermeulen M, Redelmeier DA. Emergency department overcrowding and ambulance transport delays for patients with chest pain. CMAJ. 2003;168(3):277‐83.
7. Begley CE, Chang Y, Wood RC, Weltge A. Emergency department diversion and trauma mortality: evidence from Houston, Texas. J Trauma. 2004;57(6):1260‐5.
8. Henderson SO. Academic Productivity in Emergency Medicine. Journal of Emergency Medicine 2001;21(1): 71–73.
9. Vilke GM, Brown L, Skogland P, Simmons C, Guss DA: Approach to decreasing emergency department ambulance diversion hours. J Emerg Med 2004;26(2):189‐192.
10. Vilke, GM, Castillo EM, Metz MA, Upledger Ray L, Murrin PA, Lev R, Chan TC. Community trial to decrease ambulance diversion hours: the San Diego County patient destination trial. Ann Emerg Med 2004; 44(4):295‐303.
11. Asplin BR, Magid DJ, Rhodes KV, Solberg LI, Lurie N, Carmargo CA: A conceptual model of emergency
department crowding. Ann Emerg Med 2003;42:173‐80.
12. General Accounting Office. Hospital Emergency Departments: Crowded Conditions Vary among Hospitals and Communities. Washington, DC: General Accounting Office; 2003.

UCSD Dept of Emergency Medicine CEDDP Evaluation
32
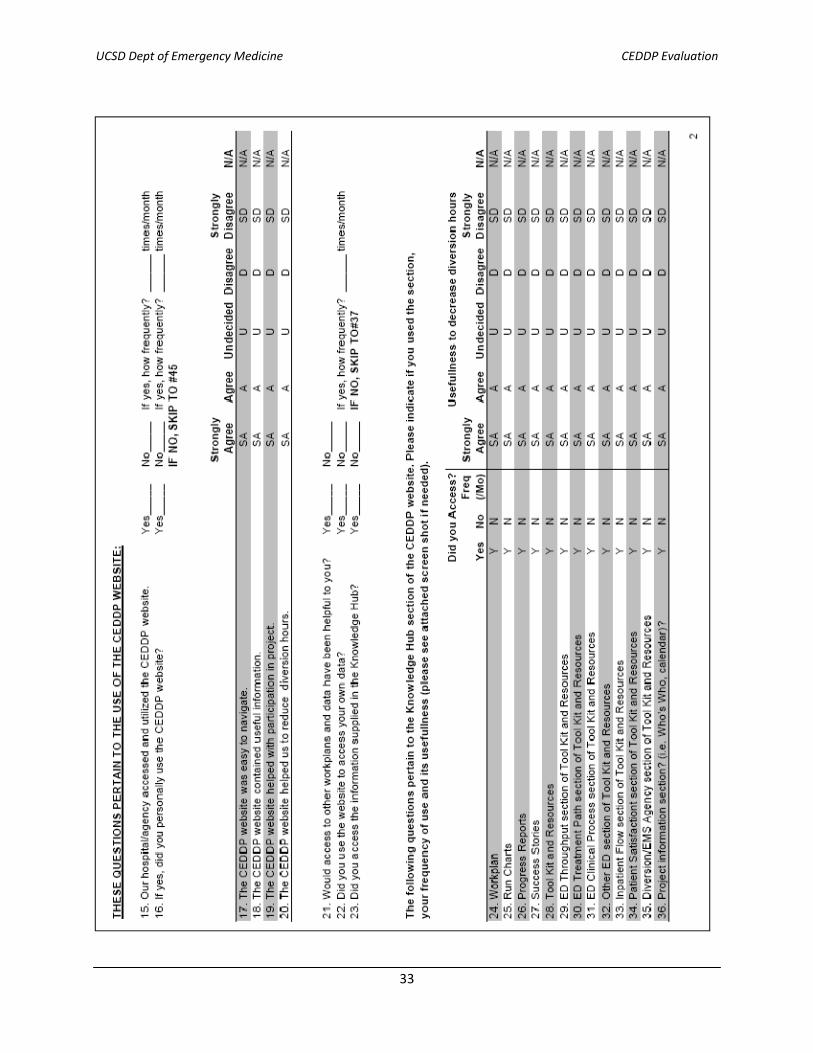
Appendix A: Summit Survey Tool
UCSD Dept of Emergency Medicine CEDDP Evaluation
33

UCSD Dept of Emergency Medicine CEDDP Evaluation
34

UCSD Dept of Emergency Medicine CEDDP Evaluation
35

UCSD Dept of Emergency Medicine CEDDP Evaluation
36

UCSD Dept of Emergency Medicine CEDDP Evaluation
37
Appendix B: Standardized Site Visit Questions
County EMS Standardized Questions What are your overall impressions of the CEDD program?
Why did you choose to participate?
Background on hospitals
Challenges getting started
What problems with diversion improved with the program? Why?
What problems are still in existence despite the program? Why?
What did you try that was new that worked?
Is it sustainable (why or why not?) / Resources required?
What did you try that was new that did not work?
Why do you think that it did not work?
What did the hospitals try that was new that worked?
Is it sustainable (why or why not?)
What did the hospitals try that was new that did not work?
Why do you think it did not work?
Website issues
Website positives:
Usefulness of EMS Toolkit?
Other Abaris Questions
Useful nature of the coaching calls for EMS agency?
Responsiveness of Abaris with questions
What Were Biggest Positives for Participation
Data Collection
Should other KPI have been collected
Issues for future diversion successes
Overall outcomes on diversion
Misc comments

UCSD Dept of Emergency Medicine CEDDP Evaluation
38
Hospital Standardized Questions What are your overall impressions of the CEDD program?
Why did you choose to participate?
Background on hospital
Challenges getting started
What problems with diversion improved with the program? Why?
What problems are still in existence despite the program? Why?
What did you try that was new that worked?
Is it sustainable (why or why not?) / Resources required?
What did you try that was new that did not work?
Why do you think that it did not work?
Website issues
Website positives
Usefulness of EMS Toolkit?
Other Abaris Questions
Useful nature of the coaching calls for hospital?
Responsiveness of Abaris with questions
What Were Biggest Positives for Participation
Data Collection
Should other KPI have been collected?
Any changes that may have affected data?
Would you participate in the future if re‐invited?
Issues for future diversion successes
Overall outcomes on diversion
Misc comments

UCSD Dept of Emergency Medicine CEDDP Evaluation
39
Appendix C: Project Key Performance Indicators (KPIs) The following are the required hospital and LEMSAs’ KPIs provided to each participant at the kickoff summit. ED Clinical Process Time to heart treatment or time to pain management for orthopedic patients (only one) Inpatient Throughput Five inpatient KPIs were requested:
• Time from inpatient bed assignment to bed placement • Time of discharge • Inpatient bed turnaround time • Hospital discharges
ED Throughput The time a patient spends in the ED was broken down by three treatment paths: admitted patients, fast track patients and patient treated and released from the ED. The following were collected for each path:
• Total ED throughput time • Arrival to seen by provider • Provider to disposition decision • Disposition decision to actual disposition
Other ED KPIs In addition to throughput measurements each ED was asked to supply the following data:
• Hours on diversion • Incomplete Treatment (or Patients Left Without Being Seen) • Total Boarding Hours • ED Volume • ED Admissions
Total LEMSA Each LEMSA was asked to submit combined data for the hospital participants in their county for:
• Total diversion hours • Patients diverted • Offload hours total
The LEMSAs also reported data for each participant hospital separately for the following metrics:
• Total Diversion Hours • Total Offload Hours • Average Ambulance Offload Time (in minutes)