Embed Size (px)
Citation preview
Jordan River Project Water Use Plan Diversion Reservoir Fish Indexing (Year 4) Reference: JORMON#4 Jordan River Diversion Reservoir Fish Indexing - 2008 Study Period: 2008
MJ Lough, RB Rollins, SE Rutherford MJ Lough Environmental Consultants 608 Bruce Avenue Nanaimo, BC
March 2009
Jordan River Water Use Plan Monitoring Program Diversion Reservoir Fish Indexing - 2008
prepared for:
BC Hydro Vancouver Island Generation 10 John Hart Road Campbell River, BC prepared by:
MJ Lough Environmental Consultants 608 Bruce Avenue Nanaimo, BC MJ Lough, RB Rollins, SE Rutherford
March 2009 Final Version
BCH-WUP Monitoring Program Diversion Reservoir Fish Indexing ______________________________________________________________________________________
______________________________________________________________________________________
mjl i
Contents Summary ........................................................................................................................... ii 1.0 Background ............................................................................................................. 1 2.0 Methods................................................................................................................... 1
2.1 Limnology .......................................................................................................................... 2 2.2 Biological Sampling ........................................................................................................... 3 2.3 Photodocumentation ......................................................................................................... 3
3.0 Results and Discussion ........................................................................................... 5
3.1 Limnology .......................................................................................................................... 5 3.1.1 Reservoir Levels ........................................................................................................ 5 3.1.2 Temperature and Dissolved Oxygen ......................................................................... 6 3.1.3 Secchi Depth and Water Color .................................................................................. 9 3.1.4 Nutrients ................................................................................................................... 10 3.1.5 Phytoplankton .......................................................................................................... 11
3.2 Fish .................................................................................................................................. 12
3.2.1 Netting and Trapping ............................................................................................... 13 3.2.2 Catch Per Unit Effort ................................................................................................ 14 3.2.3 Length Frequency Distribution ................................................................................. 15 3.2.4 Age ........................................................................................................................... 15 3.2.5 Length-Weight Regressions .................................................................................... 16 3.2.6 Condition Factor ....................................................................................................... 17
4.0 Four Year Data Trends .......................................................................................... 20 5.0 Recommendations ................................................................................................ 21 6.0 References ............................................................................................................ 22 7.0 Personal Communications .................................................................................... 23 Appendix 1 Field Data - Temperature - Dissolved Oxygen Profile ........................ A-1 Appendix 2 Field Data - Phosphorous .................................................................. A-2 Appendix 3 Field Data - Chlorophyll ..................................................................... A-3 Appendix 4 Field Data - Individual Fish Data ........................................................ A-4 Appendix 5 Photo Documentation ........................................................................ A-6 Appendix 6 Summary of Gillnet Effort and Catch Data ......................................... A-8 Appendix 7 Length Frequency Distribution, 2005-2008. ....................................... A-9
BCH-WUP Monitoring Program Diversion Reservoir Fish Indexing ______________________________________________________________________________________
______________________________________________________________________________________
mjl ii
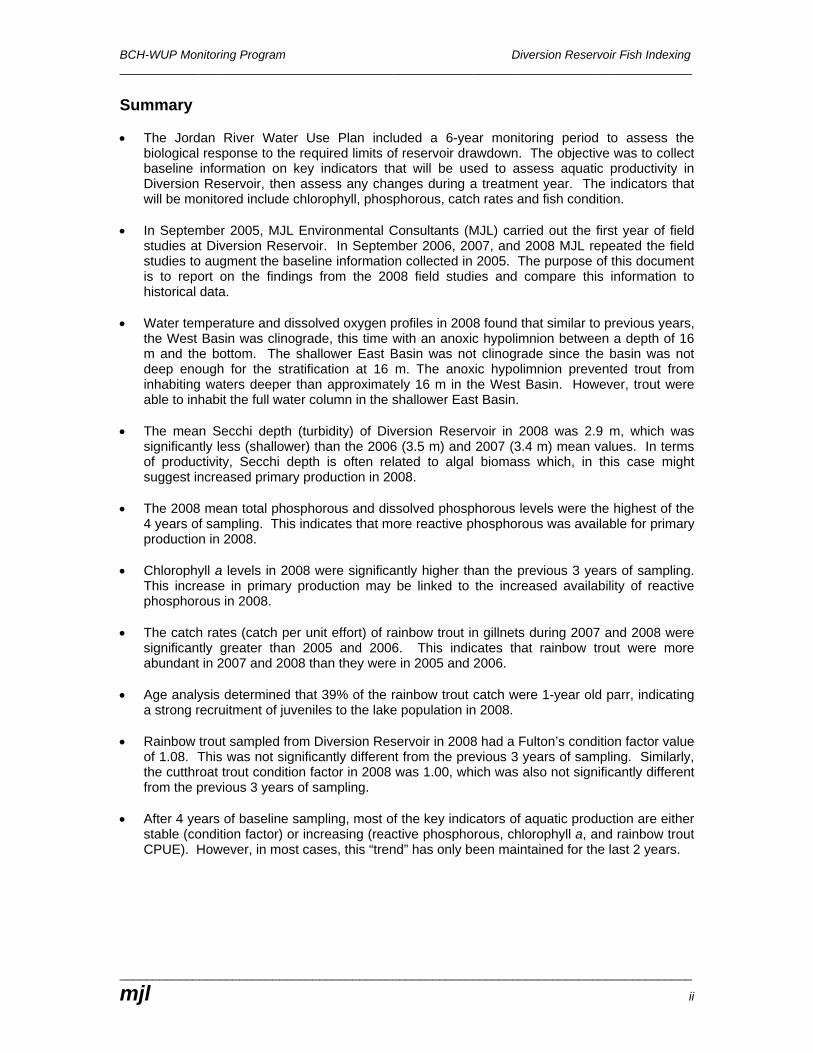
Summary • The Jordan River Water Use Plan included a 6-year monitoring period to assess the
biological response to the required limits of reservoir drawdown. The objective was to collect baseline information on key indicators that will be used to assess aquatic productivity in Diversion Reservoir, then assess any changes during a treatment year. The indicators that will be monitored include chlorophyll, phosphorous, catch rates and fish condition.
• In September 2005, MJL Environmental Consultants (MJL) carried out the first year of field
studies at Diversion Reservoir. In September 2006, 2007, and 2008 MJL repeated the field studies to augment the baseline information collected in 2005. The purpose of this document is to report on the findings from the 2008 field studies and compare this information to historical data.
• Water temperature and dissolved oxygen profiles in 2008 found that similar to previous years,
the West Basin was clinograde, this time with an anoxic hypolimnion between a depth of 16 m and the bottom. The shallower East Basin was not clinograde since the basin was not deep enough for the stratification at 16 m. The anoxic hypolimnion prevented trout from inhabiting waters deeper than approximately 16 m in the West Basin. However, trout were able to inhabit the full water column in the shallower East Basin.
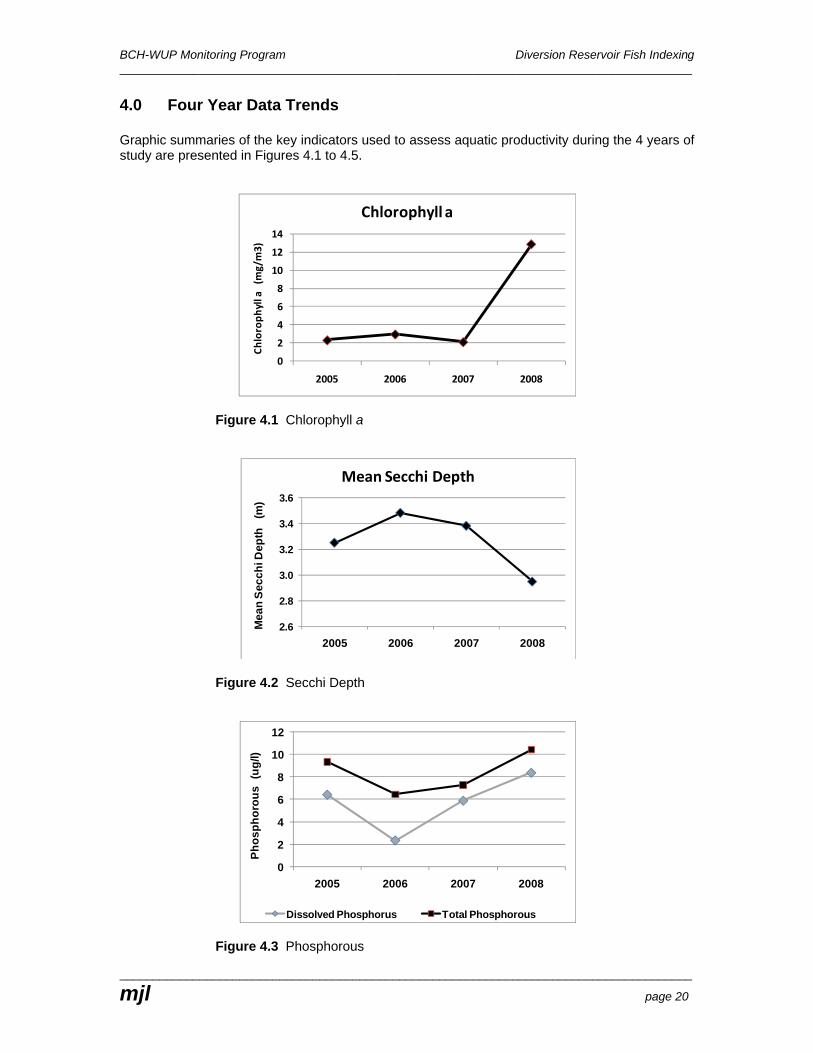
• The mean Secchi depth (turbidity) of Diversion Reservoir in 2008 was 2.9 m, which was
significantly less (shallower) than the 2006 (3.5 m) and 2007 (3.4 m) mean values. In terms of productivity, Secchi depth is often related to algal biomass which, in this case might suggest increased primary production in 2008.
• The 2008 mean total phosphorous and dissolved phosphorous levels were the highest of the
4 years of sampling. This indicates that more reactive phosphorous was available for primary production in 2008.
• Chlorophyll a levels in 2008 were significantly higher than the previous 3 years of sampling.
This increase in primary production may be linked to the increased availability of reactive phosphorous in 2008.
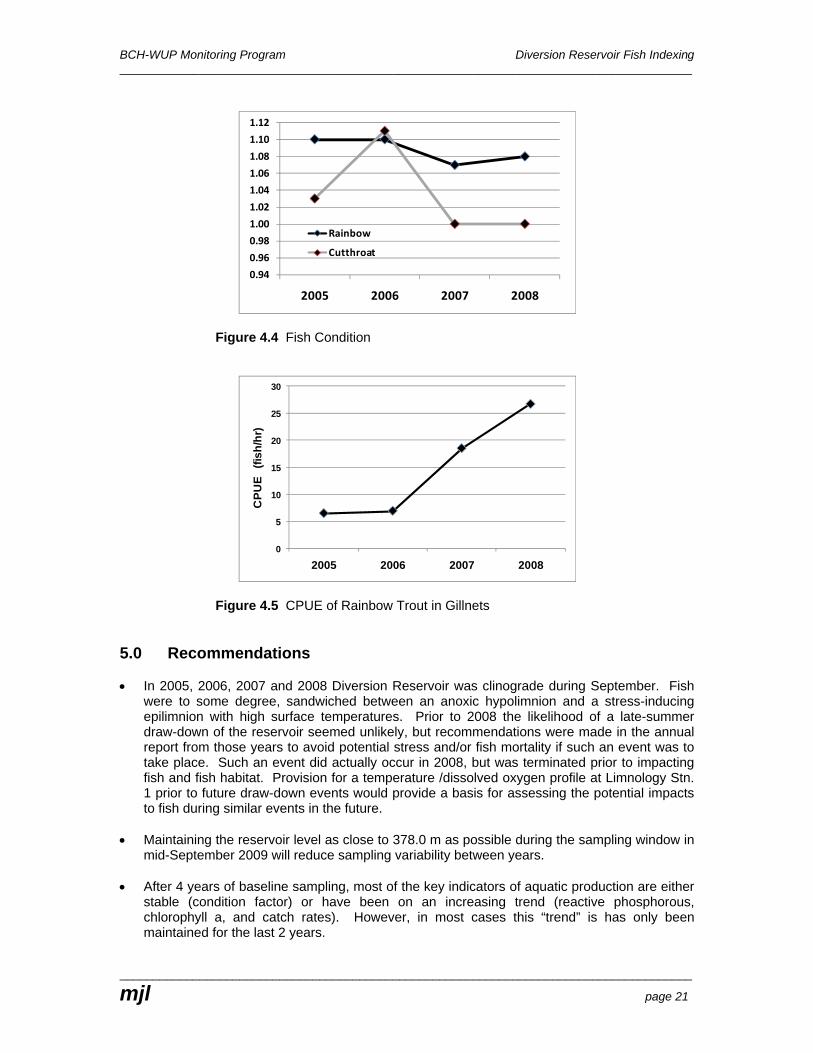
• The catch rates (catch per unit effort) of rainbow trout in gillnets during 2007 and 2008 were
significantly greater than 2005 and 2006. This indicates that rainbow trout were more abundant in 2007 and 2008 than they were in 2005 and 2006.
• Age analysis determined that 39% of the rainbow trout catch were 1-year old parr, indicating
a strong recruitment of juveniles to the lake population in 2008. • Rainbow trout sampled from Diversion Reservoir in 2008 had a Fulton’s condition factor value
of 1.08. This was not significantly different from the previous 3 years of sampling. Similarly, the cutthroat trout condition factor in 2008 was 1.00, which was also not significantly different from the previous 3 years of sampling.
• After 4 years of baseline sampling, most of the key indicators of aquatic production are either
stable (condition factor) or increasing (reactive phosphorous, chlorophyll a, and rainbow trout CPUE). However, in most cases, this “trend” has only been maintained for the last 2 years.
BCH-WUP Monitoring Program Diversion Reservoir Fish Indexing ______________________________________________________________________________________
______________________________________________________________________________________
mjl page 1
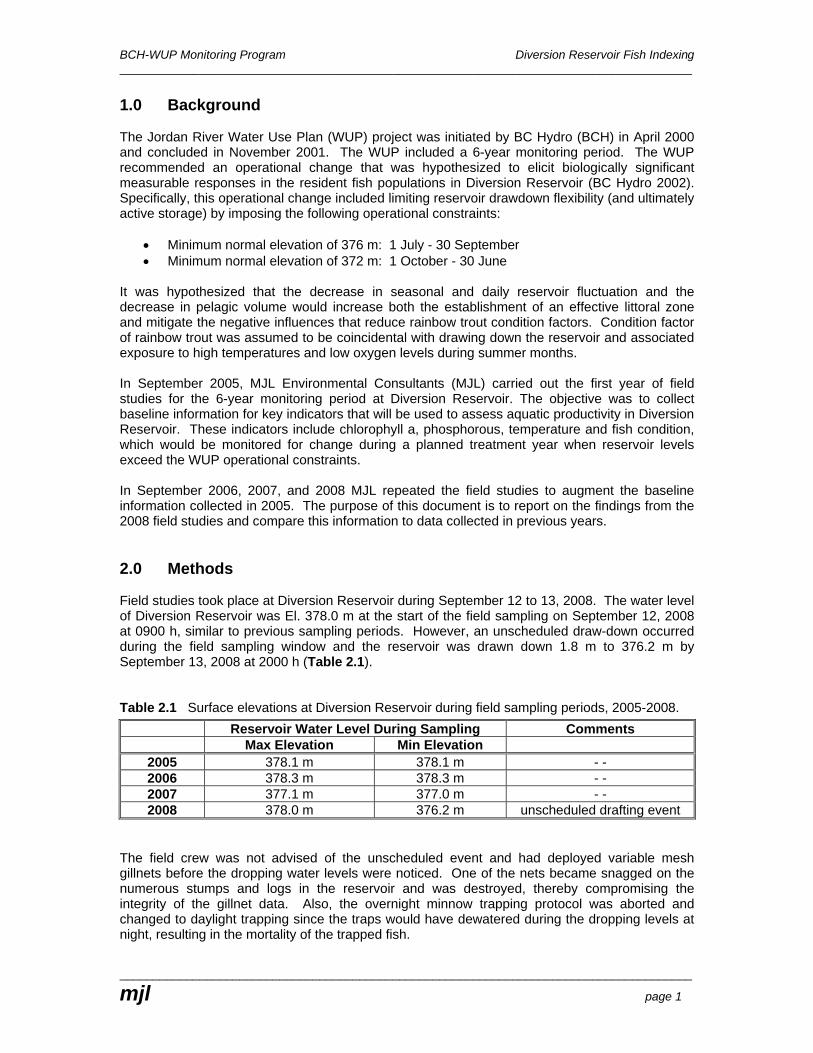
1.0 Background The Jordan River Water Use Plan (WUP) project was initiated by BC Hydro (BCH) in April 2000 and concluded in November 2001. The WUP included a 6-year monitoring period. The WUP recommended an operational change that was hypothesized to elicit biologically significant measurable responses in the resident fish populations in Diversion Reservoir (BC Hydro 2002). Specifically, this operational change included limiting reservoir drawdown flexibility (and ultimately active storage) by imposing the following operational constraints:
• Minimum normal elevation of 376 m: 1 July - 30 September • Minimum normal elevation of 372 m: 1 October - 30 June
It was hypothesized that the decrease in seasonal and daily reservoir fluctuation and the decrease in pelagic volume would increase both the establishment of an effective littoral zone and mitigate the negative influences that reduce rainbow trout condition factors. Condition factor of rainbow trout was assumed to be coincidental with drawing down the reservoir and associated exposure to high temperatures and low oxygen levels during summer months. In September 2005, MJL Environmental Consultants (MJL) carried out the first year of field studies for the 6-year monitoring period at Diversion Reservoir. The objective was to collect baseline information for key indicators that will be used to assess aquatic productivity in Diversion Reservoir. These indicators include chlorophyll a, phosphorous, temperature and fish condition, which would be monitored for change during a planned treatment year when reservoir levels exceed the WUP operational constraints. In September 2006, 2007, and 2008 MJL repeated the field studies to augment the baseline information collected in 2005. The purpose of this document is to report on the findings from the 2008 field studies and compare this information to data collected in previous years. 2.0 Methods Field studies took place at Diversion Reservoir during September 12 to 13, 2008. The water level of Diversion Reservoir was El. 378.0 m at the start of the field sampling on September 12, 2008 at 0900 h, similar to previous sampling periods. However, an unscheduled draw-down occurred during the field sampling window and the reservoir was drawn down 1.8 m to 376.2 m by September 13, 2008 at 2000 h (Table 2.1). Table 2.1 Surface elevations at Diversion Reservoir during field sampling periods, 2005-2008.
Reservoir Water Level During Sampling Comments Max Elevation Min Elevation
2005 378.1 m 378.1 m - - 2006 378.3 m 378.3 m - - 2007 377.1 m 377.0 m - - 2008 378.0 m 376.2 m unscheduled drafting event
The field crew was not advised of the unscheduled event and had deployed variable mesh gillnets before the dropping water levels were noticed. One of the nets became snagged on the numerous stumps and logs in the reservoir and was destroyed, thereby compromising the integrity of the gillnet data. Also, the overnight minnow trapping protocol was aborted and changed to daylight trapping since the traps would have dewatered during the dropping levels at night, resulting in the mortality of the trapped fish.
BCH-WUP Monitoring Program Diversion Reservoir Fish Indexing ______________________________________________________________________________________
______________________________________________________________________________________
mjl page 2
2.1 Limnology
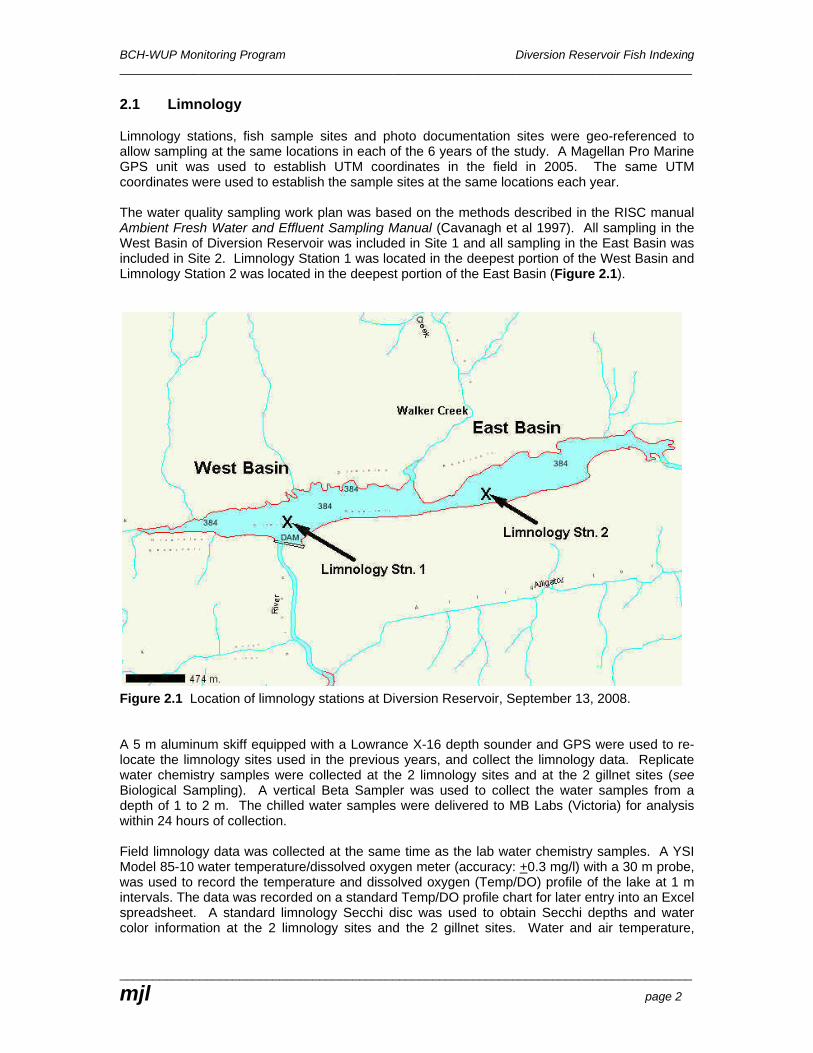
Limnology stations, fish sample sites and photo documentation sites were geo-referenced to allow sampling at the same locations in each of the 6 years of the study. A Magellan Pro Marine GPS unit was used to establish UTM coordinates in the field in 2005. The same UTM coordinates were used to establish the sample sites at the same locations each year. The water quality sampling work plan was based on the methods described in the RISC manual Ambient Fresh Water and Effluent Sampling Manual (Cavanagh et al 1997). All sampling in the West Basin of Diversion Reservoir was included in Site 1 and all sampling in the East Basin was included in Site 2. Limnology Station 1 was located in the deepest portion of the West Basin and Limnology Station 2 was located in the deepest portion of the East Basin (Figure 2.1).
Figure 2.1 Location of limnology stations at Diversion Reservoir, September 13, 2008. A 5 m aluminum skiff equipped with a Lowrance X-16 depth sounder and GPS were used to re-locate the limnology sites used in the previous years, and collect the limnology data. Replicate water chemistry samples were collected at the 2 limnology sites and at the 2 gillnet sites (see Biological Sampling). A vertical Beta Sampler was used to collect the water samples from a depth of 1 to 2 m. The chilled water samples were delivered to MB Labs (Victoria) for analysis within 24 hours of collection. Field limnology data was collected at the same time as the lab water chemistry samples. A YSI Model 85-10 water temperature/dissolved oxygen meter (accuracy: +0.3 mg/l) with a 30 m probe, was used to record the temperature and dissolved oxygen (Temp/DO) profile of the lake at 1 m intervals. The data was recorded on a standard Temp/DO profile chart for later entry into an Excel spreadsheet. A standard limnology Secchi disc was used to obtain Secchi depths and water color information at the 2 limnology sites and the 2 gillnet sites. Water and air temperature,

BCH-WUP Monitoring Program Diversion Reservoir Fish Indexing ______________________________________________________________________________________
______________________________________________________________________________________
mjl page 3
weather conditions, time, date, reservoir level and estimated stream inflows were recorded when the water samples were collected.
2.2 Biological Sampling
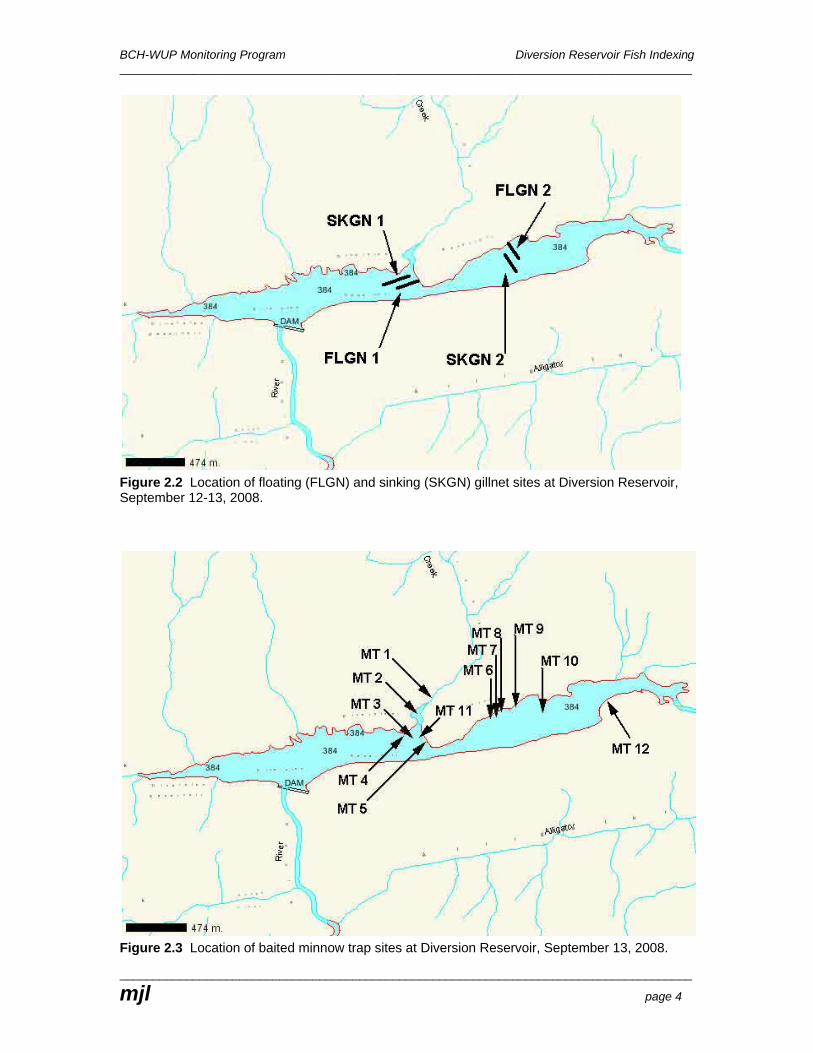
A Provincial scientific collection permit was obtained prior to commencement of the fieldwork. The methods for fish sampling described in the RISC manual Fish Collection Methods and Standards, Version 4.0 (BCMELP-FIU 1997) were used for this study. Fish sampling locations were chosen in 2005 to target habitats used by each life history stage of trout, including littoral habitat, tributary mouth and instream habitat. The same locations were used for fish sampling in 2006, 2007 and 2008 (Figures 2.2 and 2.3). Fish samples were collected using a combination of standard variable-mesh lake gillnets and baited minnow traps. Two 91.5 m long by 2.4 m deep gillnets made up of standard gillnet gangs, one sinking and one floating, were set during the day at each of the gillnet sites. Care was taken to ensure that the sinking gillnets were not deployed in the anoxic hypolimnion. The minnow traps were baited with salmon roe. One instream minnow trap was deployed in one of the isolated pools near the mouth of Walker Creek. The 2 additional minnow trap sites (MT 11 and MT 12) that were added in 2006 were sampled again in 2007 and 2008 in an attempt to increase the fry component of the fish sample. The Jordan River Water Use Plan Monitoring Program Terms of Reference (Attachment B) for Diversion Reservoir suggest that fish samples should be measured using standard length (Equation 1). Following discussions with BCH personnel (Dodd pers. comm.) it was agreed that fork length was preferable, so that the data could be compared to regional data or historical data from Diversion Reservoir. Fish collected that were larger than fry size were weighed to the nearest gram using an Ohaus Model LS 2000 portable electronic balance, measured for fork length to the nearest millimeter on a fish measuring board, inspected for gonad maturation, and photographed. Fry were weighed to the nearest 0.1 gram using an Acculab PP-159B portable electronic balance. Fish scales were collected from each sampled fish, except for the fry caught in the minnow traps, and otoliths were collected from approximately 1 in every 5 fish that were aged from scale samples. A CCD ST-30 10X-60X stereo microscope with a digital imaging system was used for scale and otolith analysis. Digital images of the magnified scales and otoliths were archived for future reference.
2.3 Photodocumentation
Digital photographs of sample sites and sampled fish were collected each year. Images were archived and details of the photo documentation were summarized on a standard data collection form (Appendix 5).
BCH-WUP Monitoring Program Diversion Reservoir Fish Indexing ______________________________________________________________________________________
______________________________________________________________________________________
mjl page 4
Figure 2.2 Location of floating (FLGN) and sinking (SKGN) gillnet sites at Diversion Reservoir, September 12-13, 2008.
Figure 2.3 Location of baited minnow trap sites at Diversion Reservoir, September 13, 2008.
BCH-WUP Monitoring Program Diversion Reservoir Fish Indexing ______________________________________________________________________________________
______________________________________________________________________________________
mjl page 5
3.0 Results and Discussion
3.1 Limnology
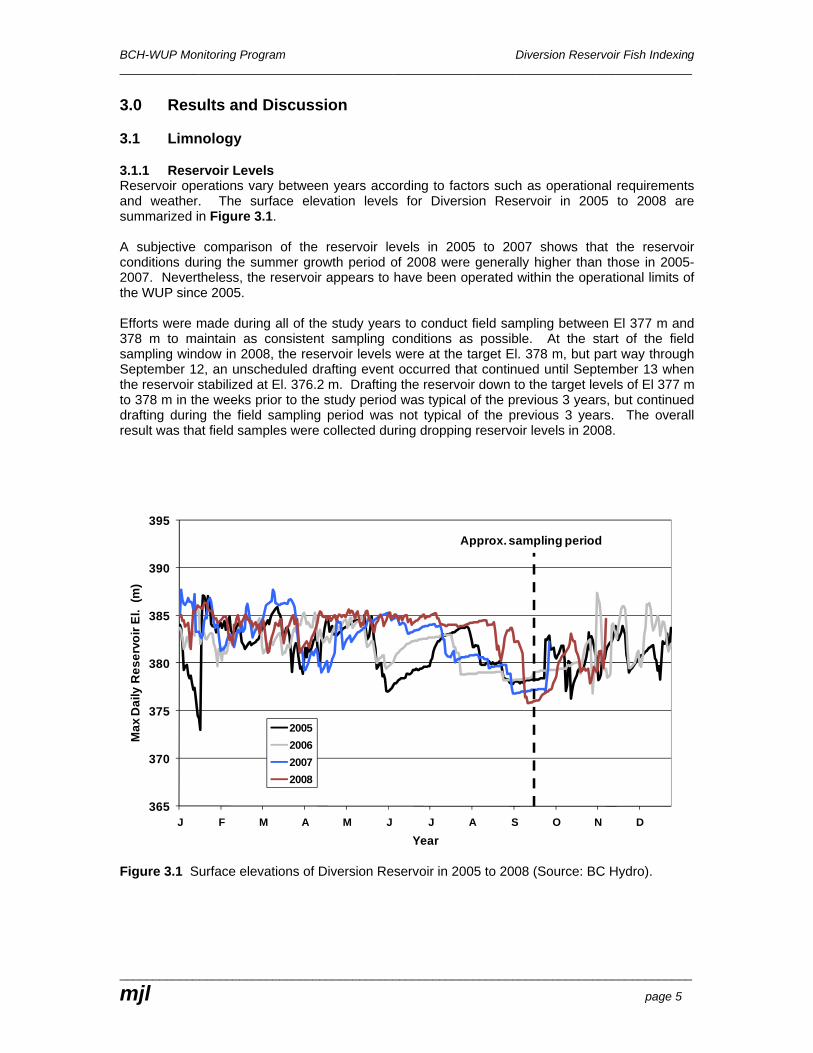
3.1.1 Reservoir Levels Reservoir operations vary between years according to factors such as operational requirements and weather. The surface elevation levels for Diversion Reservoir in 2005 to 2008 are summarized in Figure 3.1. A subjective comparison of the reservoir levels in 2005 to 2007 shows that the reservoir conditions during the summer growth period of 2008 were generally higher than those in 2005-2007. Nevertheless, the reservoir appears to have been operated within the operational limits of the WUP since 2005. Efforts were made during all of the study years to conduct field sampling between El 377 m and 378 m to maintain as consistent sampling conditions as possible. At the start of the field sampling window in 2008, the reservoir levels were at the target El. 378 m, but part way through September 12, an unscheduled drafting event occurred that continued until September 13 when the reservoir stabilized at El. 376.2 m. Drafting the reservoir down to the target levels of El 377 m to 378 m in the weeks prior to the study period was typical of the previous 3 years, but continued drafting during the field sampling period was not typical of the previous 3 years. The overall result was that field samples were collected during dropping reservoir levels in 2008.
Figure 3.1 Surface elevations of Diversion Reservoir in 2005 to 2008 (Source: BC Hydro).
365
370
375
380
385
390
395
J F M A M J J A S O N D
Max
Dai
ly R
eser
voir
El.
(m)
Year
2005200620072008
Approx. sampling period

BCH-WUP Monitoring Program Diversion Reservoir Fish Indexing ______________________________________________________________________________________
______________________________________________________________________________________
mjl page 6
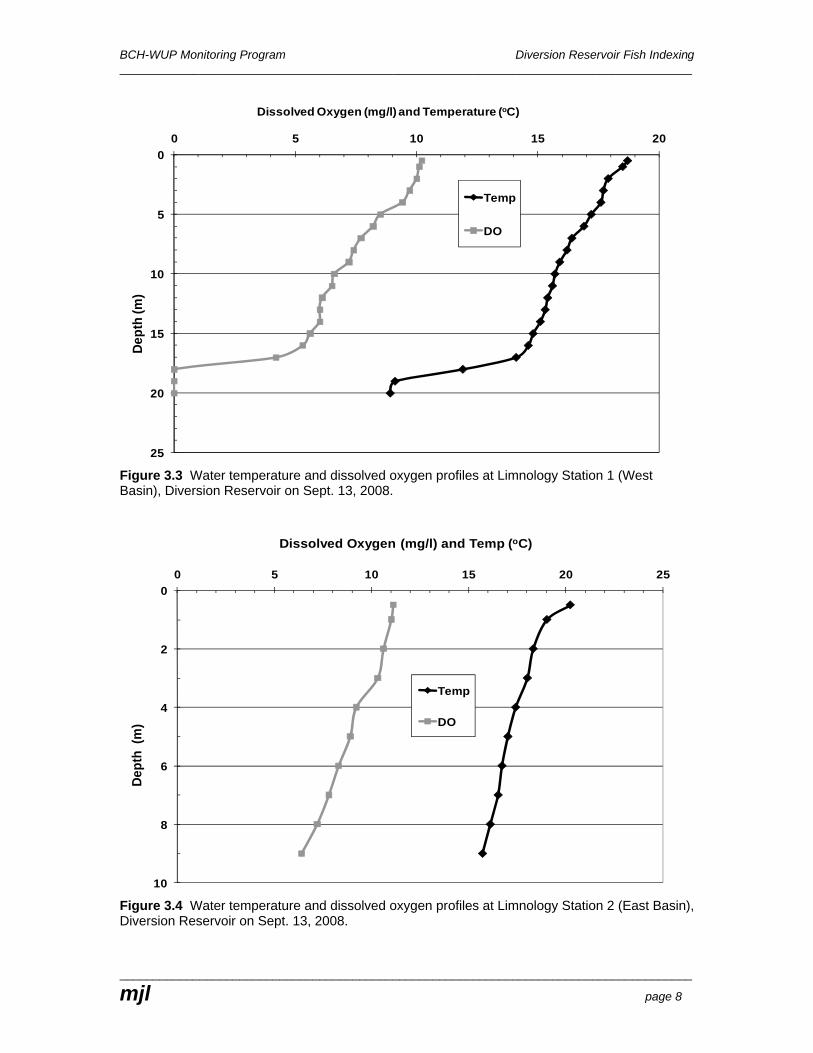
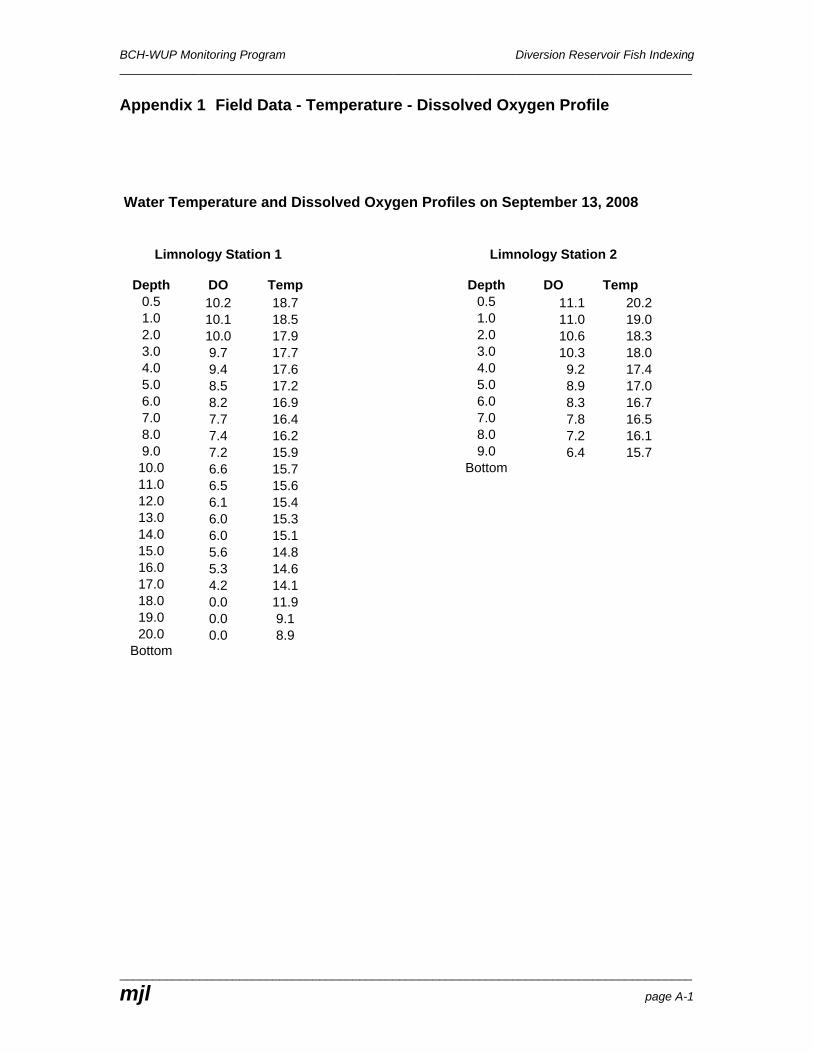
3.1.2 Temperature and Dissolved Oxygen Limnology sampling was done after the unscheduled drafting event of September 12-13. We found that the thermocline and anoxic layer were approximately 2 or 3 m deeper than the 12-13 m observed in the previous 3 years of sampling. The thermocline was at El. 363 m; the same elevation as the upper lip of the hollow cone valve (HCV). It is therefore likely that the prior to the drafting event, the thermocline and anoxic layer were similar to the previous 3 years, with the HCV situated in the hypolimnion. Drafting the reservoir in 2008 would therefore have drawn at least 2 m of the water column from the anoxic hypolimnion but probably had little effect on the fish-bearing waters of the epilimnion other than a slight reduction in the surface area of the reservoir. The drafting event was terminated just as it was about to draw water and possibly fish from the “preferred fish layer” in the epilimnion (Figure 3.2). Mitigative measures regarding draft events during these stratified conditions in the late-summer have been described in the annual reports since 2005 (Lough et al. 2006, Lough et al. 2007, Lough et al. 2008). These include sampling the Temp/DO profile of the water column prior to drafting to establish the depth of the “preferred fish layer”. The Temp/DO profiles for Limnology Station 1 are summarized in Figure 3.3, with the field measurements included in Appendix 1. Water temperatures in the deeper West Basin were thermally stratified with a thermocline at approximately 16 m. DO levels in the epilimnion ranged from 10.2 mg/l near the surface to 5.3 mg/l at 16m, then rapidly declined to 0 mg/l at 18m. The hypolimnion between 17m and 20m was anoxic and therefore uninhabitable by fish. These conditions were similar but less pronounced than the previous 3 years, when the upper level of the anoxic layer was approximately 13 m. (Lough et al. 2006, Lough et al. 2007, Lough et al. 2008). In 2008 as in previous years, trout were unable to inhabit the portion of the water column that was deeper than approximately 16 m because it was anoxic. This could affect the distribution of cutthroat trout more than rainbow trout since the cutthroat trout tend to be benthic foragers that inhabit the deep portions of the lake. The Temp/DO profile at Limnology Station 2 in the East Basin (Figure 3.4) indicates that the East Basin was not thermally stratified, primarily because the basin was too shallow. DO levels in the water column ranged from 11.1 mg/l near the surface to 6.4 mg/l at the bottom depth of 9 m. The West Basin has had an anoxic hypolimnion during September in each year of the study, but anoxic conditions in the shallower East Basin are less consistent. In 2005 and 2008 anoxic conditions did not occur and in 2006 and 2007 only a thin anoxic hypolimnion occurred near the bottom of the east basin. This is because most of the East Basin is shallower than the thermocline depth in the deeper West Basin. In 2008 the East Basin was only 10 m deep during sampling, which was 7 m shallower than the thermocline.

BCH-WUP Monitoring Program Diversion Reservoir Fish Indexing ______________________________________________________________________________________
______________________________________________________________________________________
mjl page 7
Figure 3.2 Section view of Diversion Reservoir Dam showing conceptual conditions before and after the unscheduled drafting event, Sept. 12-13, 2008. The top drawing shows conditions that were not documented, but likely present prior to drafting on Sept. 12. The bottom drawing shows that drafting had reduced the hypolimnion and was at the threshold of extracting water from the preferred layer for fish when drafting activities were terminated.
BCH-WUP Monitoring Program Diversion Reservoir Fish Indexing ______________________________________________________________________________________
______________________________________________________________________________________
mjl page 8
Figure 3.3 Water temperature and dissolved oxygen profiles at Limnology Station 1 (West Basin), Diversion Reservoir on Sept. 13, 2008.
Figure 3.4 Water temperature and dissolved oxygen profiles at Limnology Station 2 (East Basin), Diversion Reservoir on Sept. 13, 2008.
0
5
10
15
20
25
0 5 10 15 20De
pth
(m)
Dissolved Oxygen (mg/l) and Temperature (oC)
Temp
DO
0
2
4
6
8
10
0 5 10 15 20 25
Dept
h (m
)
Dissolved Oxygen (mg/l) and Temp (oC)
Temp
DO

BCH-WUP Monitoring Program Diversion Reservoir Fish Indexing ______________________________________________________________________________________
______________________________________________________________________________________
mjl page 9
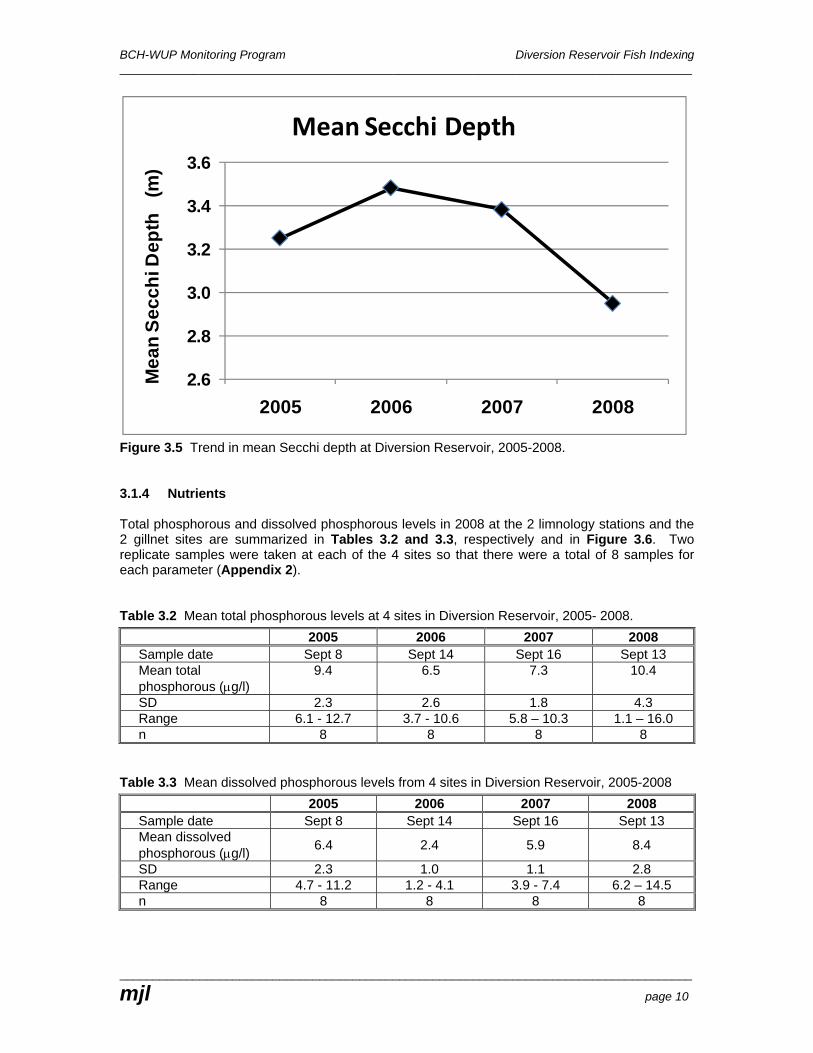
The dissolved oxygen levels in the epilimnion ranged from 10 mg/l near the surface to 4.2 mg/l near the thermocline. Although rainbow trout can survive DO levels as low as 3 or 4 mg/l, low DO levels have a negative effect on their feeding rate and hence growth rate. Some studies have indicated that rainbow trout will avoid oxygen concentrations lower than 5 mg/l and will move to find higher oxygen concentrations if available (Matthews and Berg 1996). This suggests that in 2008 trout were less likely to inhabit portions of the reservoir that were deeper than approximately 16 m in the West Basin. The optimum water temperature for rainbow trout growth is approximately 12 oC (Bell, 1973). They can tolerate higher water temperatures, but cease growth at approximately 18oC primarily because of increased metabolic rates. They avoid temperatures higher than 19 oC and cannot survive water temperatures of 25o C (Bell 1973). In previous years the water temperature in Diversion Reservoir was approximately 17 oC to 18 oC from the surface down to the anoxic hypolimnion, but in 2008 the temperatures in the deep epilimnion were as low as 14 oC. Conditions were therefore slightly more favorable for trout than the previous 3 years. During the summers from 2005-2008, trout in Diversion Reservoir have been sandwiched between the high, stress-inducing temperatures near the surface and the uninhabitable anoxic layer near the bottom. BCH operations could potentially have a substantial negative influence on the preferred trout habitat in some years. For example, in 2005 the thermocline in the West Basin was at a depth of approximately 15 m (El. 363 m), the same depth as the upper portion of the hollow cone valve (HCV) intake at the dam. Under slightly different conditions, such as a deeper anoxic layer, HCV releases would draw from the cooler oxygenated layer that is inhabited by the trout. Since the trout are sandwiched in this layer, any further reduction due to HCV operation could potentially reduce the amount of suitable habitat and have a negative influence on the trout population. 3.1.3 Secchi Depth and Water Color Secchi depths and water color at the 2 limnology stations and the 2 gillnet sites are summarized in Table 3.1. In 2006, 2 additional sites (Gillnet Sites 1 and 2) were added to the 2005 protocol and replicate samples at each of the 4 sites taken to allow for more robust statistical comparisons between years and these 2 additional sites were sampled again in 2007 and 2008. Table 3.1 Secchi depths and water color at Diversion Reservoir September 2005 to 2008.
2005 2006 2007 2008 Sample date Sept 8 Sept 14 Sept 16 Sept 13 Mean Secchi depth 3.3 3.5 3.4 3.0 SD 0.4 0.2 0.2 0.1 N 2 8 8 8 Color brown brown brown brown
ANOVA tests indicate that turbidity levels in 2008 were significantly more than 2006 (p=0.003) and 2007 (p=.004), but not different than 2005. Since Secchi depth is a measure of turbidity, this means that the reservoir was more turbid than the last 2 years. In terms of productivity, Secchi depth is often related to algal biomass which, in this case might suggest increased primary production in 2008 (Figure 3.5).
BCH-WUP Monitoring Program Diversion Reservoir Fish Indexing ______________________________________________________________________________________
______________________________________________________________________________________
mjl page 10
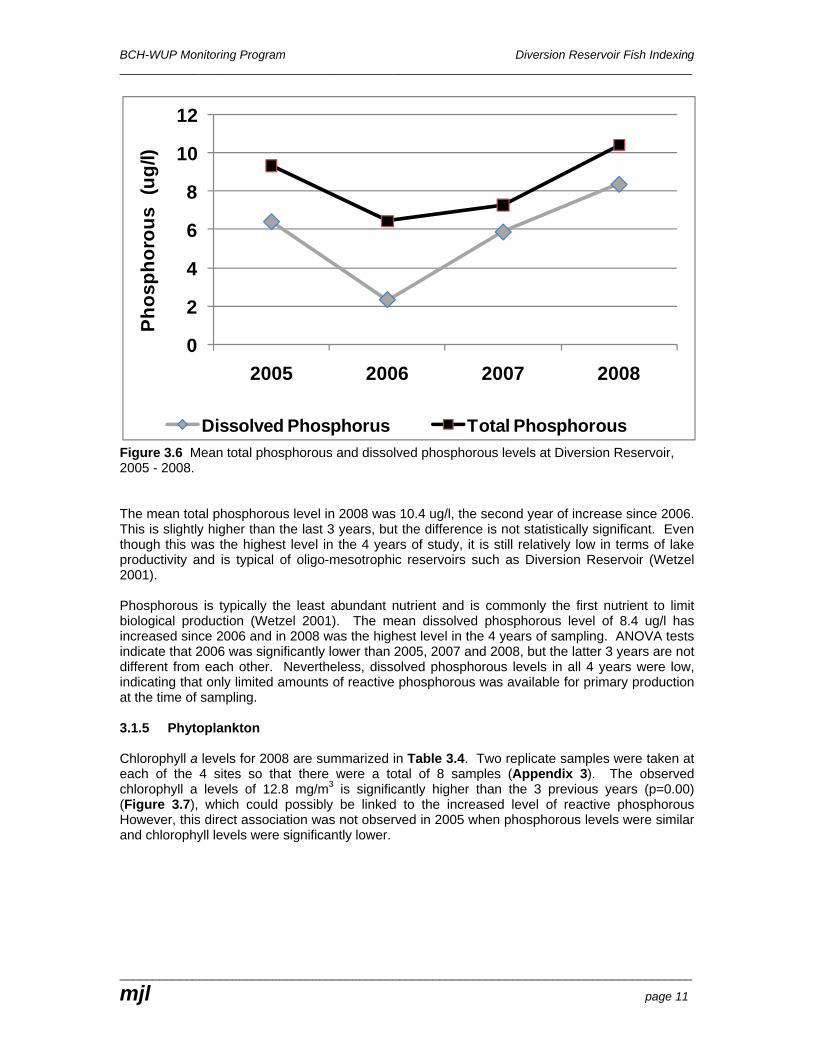
Figure 3.5 Trend in mean Secchi depth at Diversion Reservoir, 2005-2008. 3.1.4 Nutrients Total phosphorous and dissolved phosphorous levels in 2008 at the 2 limnology stations and the 2 gillnet sites are summarized in Tables 3.2 and 3.3, respectively and in Figure 3.6. Two replicate samples were taken at each of the 4 sites so that there were a total of 8 samples for each parameter (Appendix 2). Table 3.2 Mean total phosphorous levels at 4 sites in Diversion Reservoir, 2005- 2008. 2005 2006 2007 2008
Sample date Sept 8 Sept 14 Sept 16 Sept 13 Mean total phosphorous (μg/l)
9.4 6.5 7.3 10.4
SD 2.3 2.6 1.8 4.3 Range 6.1 - 12.7 3.7 - 10.6 5.8 – 10.3 1.1 – 16.0 n 8 8 8 8
Table 3.3 Mean dissolved phosphorous levels from 4 sites in Diversion Reservoir, 2005-2008 2005 2006 2007 2008
Sample date Sept 8 Sept 14 Sept 16 Sept 13 Mean dissolved phosphorous (μg/l) 6.4 2.4 5.9 8.4
SD 2.3 1.0 1.1 2.8 Range 4.7 - 11.2 1.2 - 4.1 3.9 - 7.4 6.2 – 14.5 n 8 8 8 8
2.6
2.8
3.0
3.2
3.4
3.6
2005 2006 2007 2008
Mea
n Se
cchi
Dep
th
(m)
Mean Secchi Depth
BCH-WUP Monitoring Program Diversion Reservoir Fish Indexing ______________________________________________________________________________________
______________________________________________________________________________________
mjl page 11
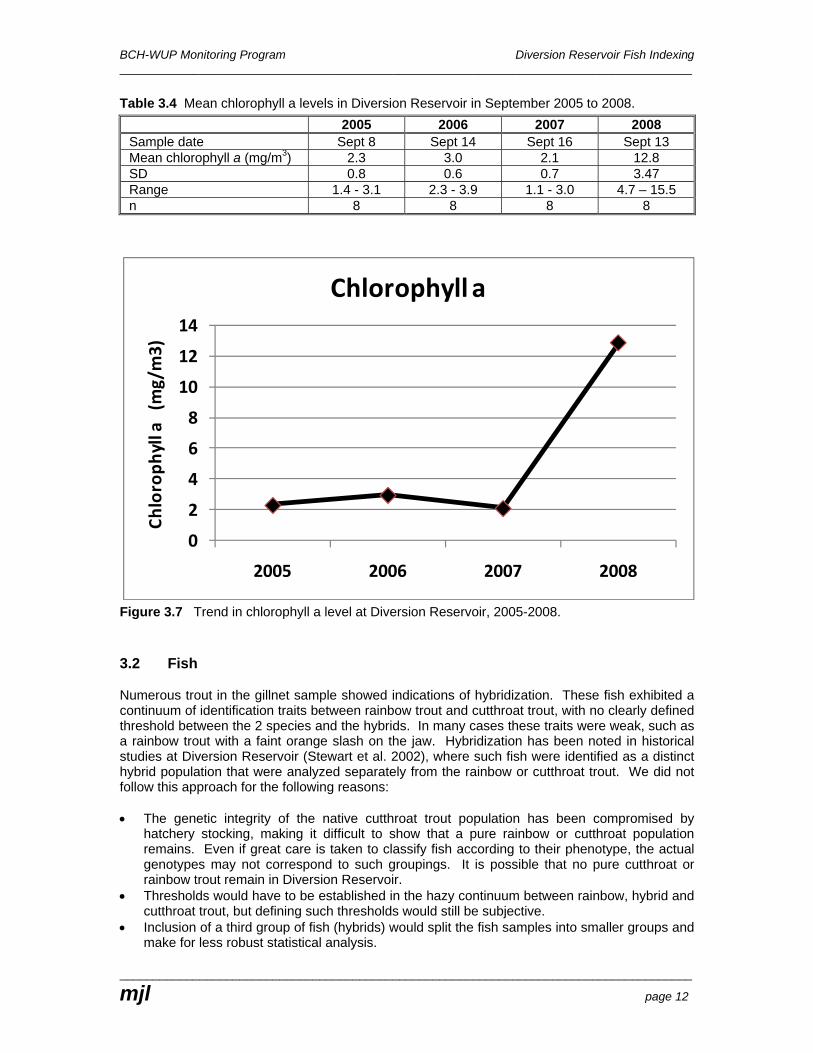
Figure 3.6 Mean total phosphorous and dissolved phosphorous levels at Diversion Reservoir, 2005 - 2008. The mean total phosphorous level in 2008 was 10.4 ug/l, the second year of increase since 2006. This is slightly higher than the last 3 years, but the difference is not statistically significant. Even though this was the highest level in the 4 years of study, it is still relatively low in terms of lake productivity and is typical of oligo-mesotrophic reservoirs such as Diversion Reservoir (Wetzel 2001). Phosphorous is typically the least abundant nutrient and is commonly the first nutrient to limit biological production (Wetzel 2001). The mean dissolved phosphorous level of 8.4 ug/l has increased since 2006 and in 2008 was the highest level in the 4 years of sampling. ANOVA tests indicate that 2006 was significantly lower than 2005, 2007 and 2008, but the latter 3 years are not different from each other. Nevertheless, dissolved phosphorous levels in all 4 years were low, indicating that only limited amounts of reactive phosphorous was available for primary production at the time of sampling. 3.1.5 Phytoplankton Chlorophyll a levels for 2008 are summarized in Table 3.4. Two replicate samples were taken at each of the 4 sites so that there were a total of 8 samples (Appendix 3). The observed chlorophyll a levels of 12.8 mg/m3 is significantly higher than the 3 previous years (p=0.00) (Figure 3.7), which could possibly be linked to the increased level of reactive phosphorous However, this direct association was not observed in 2005 when phosphorous levels were similar and chlorophyll levels were significantly lower.
0
2
4
6
8
10
12
2005 2006 2007 2008
Phos
phor
ous
(ug
/l)
Dissolved Phosphorus Total Phosphorous
BCH-WUP Monitoring Program Diversion Reservoir Fish Indexing ______________________________________________________________________________________
______________________________________________________________________________________
mjl page 12
Table 3.4 Mean chlorophyll a levels in Diversion Reservoir in September 2005 to 2008. 2005 2006 2007 2008 Sample date Sept 8 Sept 14 Sept 16 Sept 13 Mean chlorophyll a (mg/m3) 2.3 3.0 2.1 12.8 SD 0.8 0.6 0.7 3.47 Range 1.4 - 3.1 2.3 - 3.9 1.1 - 3.0 4.7 – 15.5 n 8 8 8 8
Figure 3.7 Trend in chlorophyll a level at Diversion Reservoir, 2005-2008.
3.2 Fish
Numerous trout in the gillnet sample showed indications of hybridization. These fish exhibited a continuum of identification traits between rainbow trout and cutthroat trout, with no clearly defined threshold between the 2 species and the hybrids. In many cases these traits were weak, such as a rainbow trout with a faint orange slash on the jaw. Hybridization has been noted in historical studies at Diversion Reservoir (Stewart et al. 2002), where such fish were identified as a distinct hybrid population that were analyzed separately from the rainbow or cutthroat trout. We did not follow this approach for the following reasons: • The genetic integrity of the native cutthroat trout population has been compromised by
hatchery stocking, making it difficult to show that a pure rainbow or cutthroat population remains. Even if great care is taken to classify fish according to their phenotype, the actual genotypes may not correspond to such groupings. It is possible that no pure cutthroat or rainbow trout remain in Diversion Reservoir.
• Thresholds would have to be established in the hazy continuum between rainbow, hybrid and cutthroat trout, but defining such thresholds would still be subjective.
• Inclusion of a third group of fish (hybrids) would split the fish samples into smaller groups and make for less robust statistical analysis.
0
2
4
6
8
10
12
14
2005 2006 2007 2008
Chloroph
yll a (m
g/m3)
Chlorophyll a
BCH-WUP Monitoring Program Diversion Reservoir Fish Indexing ______________________________________________________________________________________
______________________________________________________________________________________
mjl page 13
• Adult trout and parr were speciated according to their most dominate identification traits. Handled in a consistent manner, this allowed for larger sample sizes and more robust analyses.
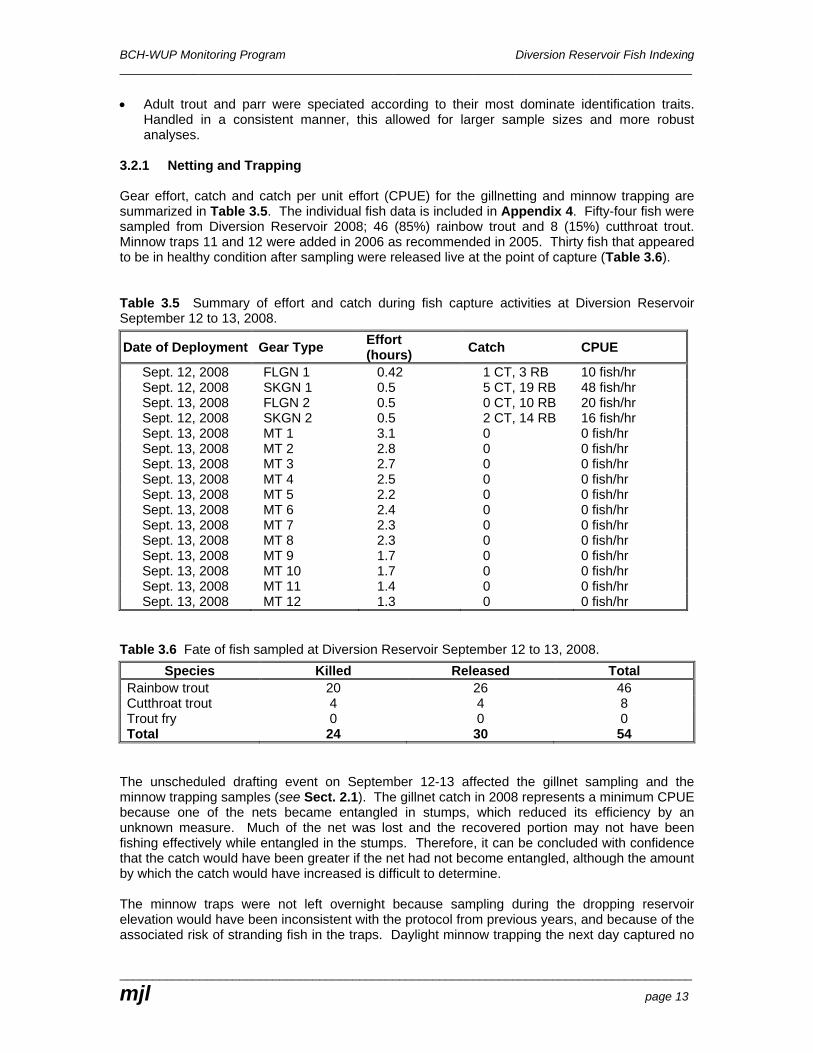
3.2.1 Netting and Trapping Gear effort, catch and catch per unit effort (CPUE) for the gillnetting and minnow trapping are summarized in Table 3.5. The individual fish data is included in Appendix 4. Fifty-four fish were sampled from Diversion Reservoir 2008; 46 (85%) rainbow trout and 8 (15%) cutthroat trout. Minnow traps 11 and 12 were added in 2006 as recommended in 2005. Thirty fish that appeared to be in healthy condition after sampling were released live at the point of capture (Table 3.6). Table 3.5 Summary of effort and catch during fish capture activities at Diversion Reservoir September 12 to 13, 2008.
Date of Deployment Gear Type Effort (hours) Catch CPUE
Sept. 12, 2008 FLGN 1 0.42 1 CT, 3 RB 10 fish/hr Sept. 12, 2008 SKGN 1 0.5 5 CT, 19 RB 48 fish/hr Sept. 13, 2008 FLGN 2 0.5 0 CT, 10 RB 20 fish/hr Sept. 12, 2008 SKGN 2 0.5 2 CT, 14 RB 16 fish/hr Sept. 13, 2008 MT 1 3.1 0 0 fish/hr Sept. 13, 2008 MT 2 2.8 0 0 fish/hr Sept. 13, 2008 MT 3 2.7 0 0 fish/hr Sept. 13, 2008 MT 4 2.5 0 0 fish/hr Sept. 13, 2008 MT 5 2.2 0 0 fish/hr Sept. 13, 2008 MT 6 2.4 0 0 fish/hr Sept. 13, 2008 MT 7 2.3 0 0 fish/hr Sept. 13, 2008 MT 8 2.3 0 0 fish/hr Sept. 13, 2008 MT 9 1.7 0 0 fish/hr Sept. 13, 2008 MT 10 1.7 0 0 fish/hr Sept. 13, 2008 MT 11 1.4 0 0 fish/hr Sept. 13, 2008 MT 12 1.3 0 0 fish/hr
Table 3.6 Fate of fish sampled at Diversion Reservoir September 12 to 13, 2008.
Species Killed Released Total Rainbow trout 20 26 46 Cutthroat trout 4 4 8 Trout fry 0 0 0 Total 24 30 54
The unscheduled drafting event on September 12-13 affected the gillnet sampling and the minnow trapping samples (see Sect. 2.1). The gillnet catch in 2008 represents a minimum CPUE because one of the nets became entangled in stumps, which reduced its efficiency by an unknown measure. Much of the net was lost and the recovered portion may not have been fishing effectively while entangled in the stumps. Therefore, it can be concluded with confidence that the catch would have been greater if the net had not become entangled, although the amount by which the catch would have increased is difficult to determine. The minnow traps were not left overnight because sampling during the dropping reservoir elevation would have been inconsistent with the protocol from previous years, and because of the associated risk of stranding fish in the traps. Daylight minnow trapping the next day captured no

BCH-WUP Monitoring Program Diversion Reservoir Fish Indexing ______________________________________________________________________________________
______________________________________________________________________________________
mjl page 14
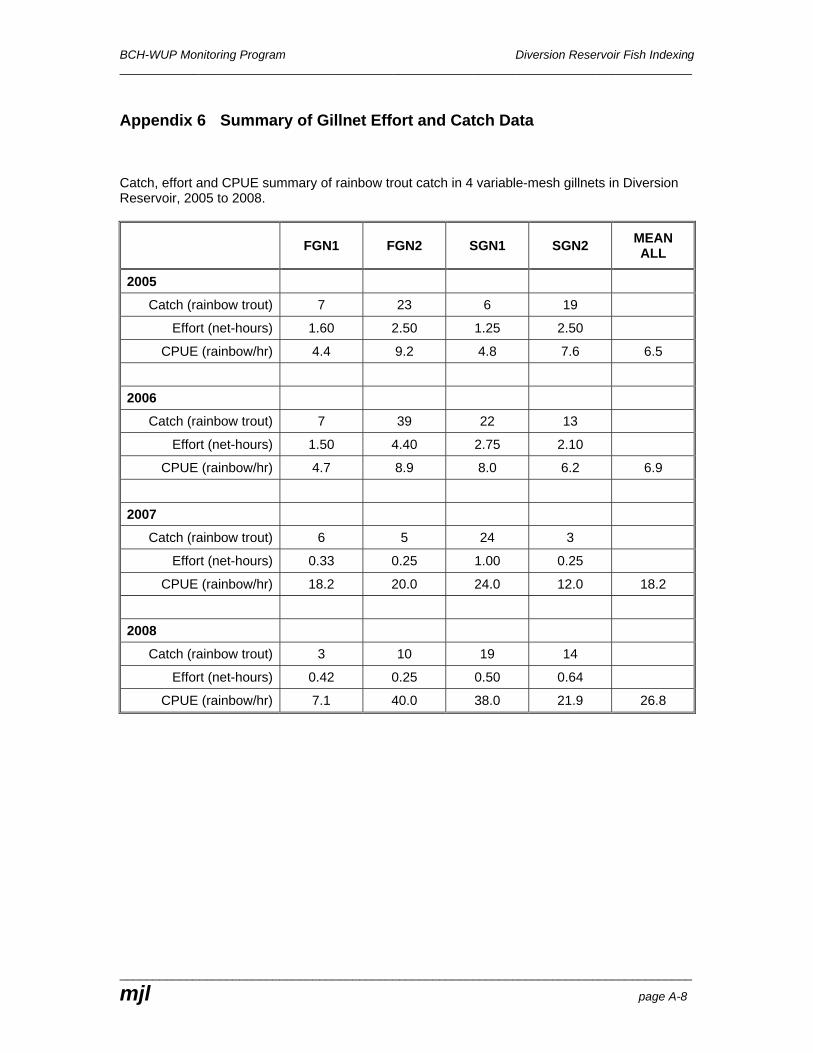
fish, suggesting either a low abundance of juvenile trout or a reduced CPUE when trapping during daylight hours. It is therefore unclear if the catch of no 0+ trout fry in the traps accurately reflects a very low fry abundance in 2008. In comparison, 88% of the 0+ fry sampled in 2007 (n=27) were captured in traps, with the remaining 12% captured in gillnets. The fact that no 0+ fry were caught using either method in 2008 suggests that 0+ fry abundance may have in fact been low during 2008. If this was the case, we would expect to observe a low abundance of 1+ parr in the 2009 sample. 3.2.2 Catch Per Unit Effort CPUE is often used as an indicator of fish abundance. We compared the mean CPUE for rainbow trout in the 4 variable-mesh gillnet sets (2 floating gillnets, 2 sinking gillnets) made each year to monitor trends in fish abundance. The CPUE data for rainbow trout sampled using gillnets in 2005-2008 are summarized in Table 3.7, Figure 3.8 and Appendix 6. Table 3.7 CPUE for rainbow trout gillnetted in Diversion Reservoir, 2005 to 2008.
Year
n
CPUE (fish/hr)
FLGN1
CPUE (fish/hr)
FLGN2
CPUE (fish/hr)
SKGN1
CPUE (fish/hr)
SKGN2
CPUE (fish/hr)
Mean All
Standard Deviation
All 2005 4 4.4 9.2 4.8 7.6 6.8 2.3 2006 4 4.7 8.9 8.0 6.2 6.8 1.9 2007 4 18.2 20.0 24.0 12.0 19.1 5.0 2008 4 7.1 40.0 38.0 21.9 23.6 15.4
Figure 3.8 Trend of CPUE for rainbow trout gillnetted in Diversion Reservoir, 2005 to 2008. An analysis of variance test found that the difference in CPUE for rainbow trout between the years was significant (p=0.01). The 2008 CPUE was greater than the 2005 (p=0.04) and 2006
0
5
10
15
20
25
30
2005 2006 2007 2008
CPU
E (
fish/
hr)
BCH-WUP Monitoring Program Diversion Reservoir Fish Indexing ______________________________________________________________________________________
______________________________________________________________________________________
mjl page 15
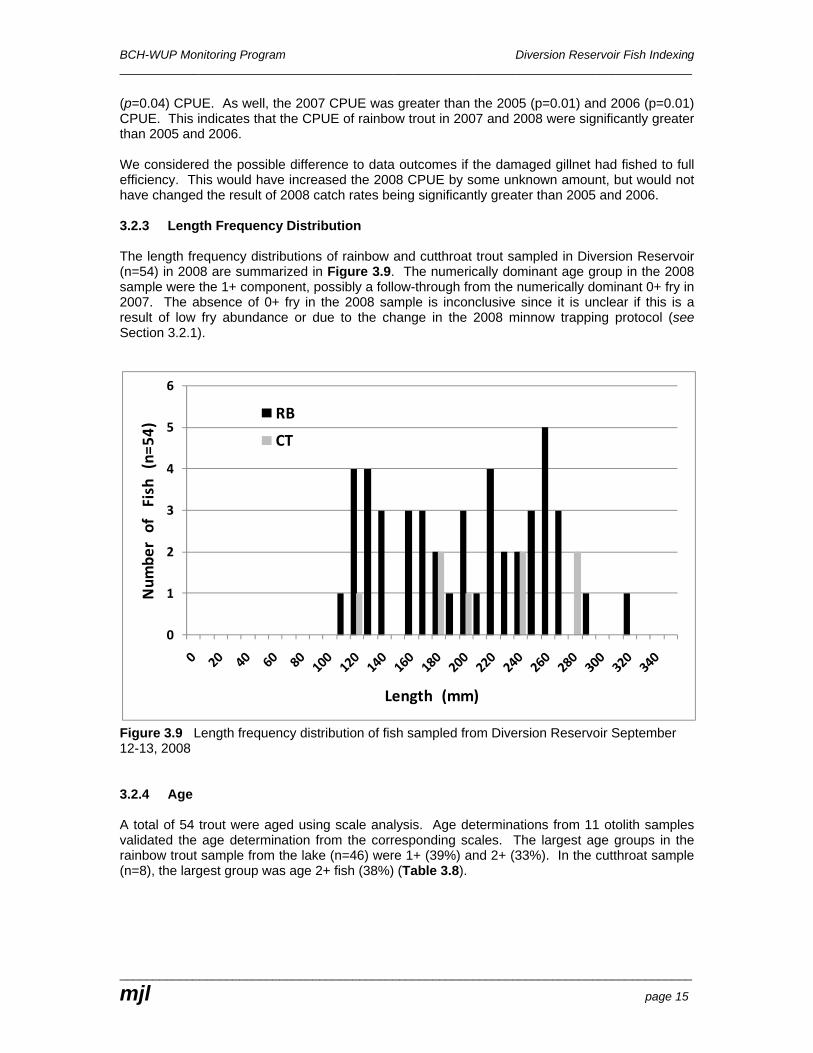
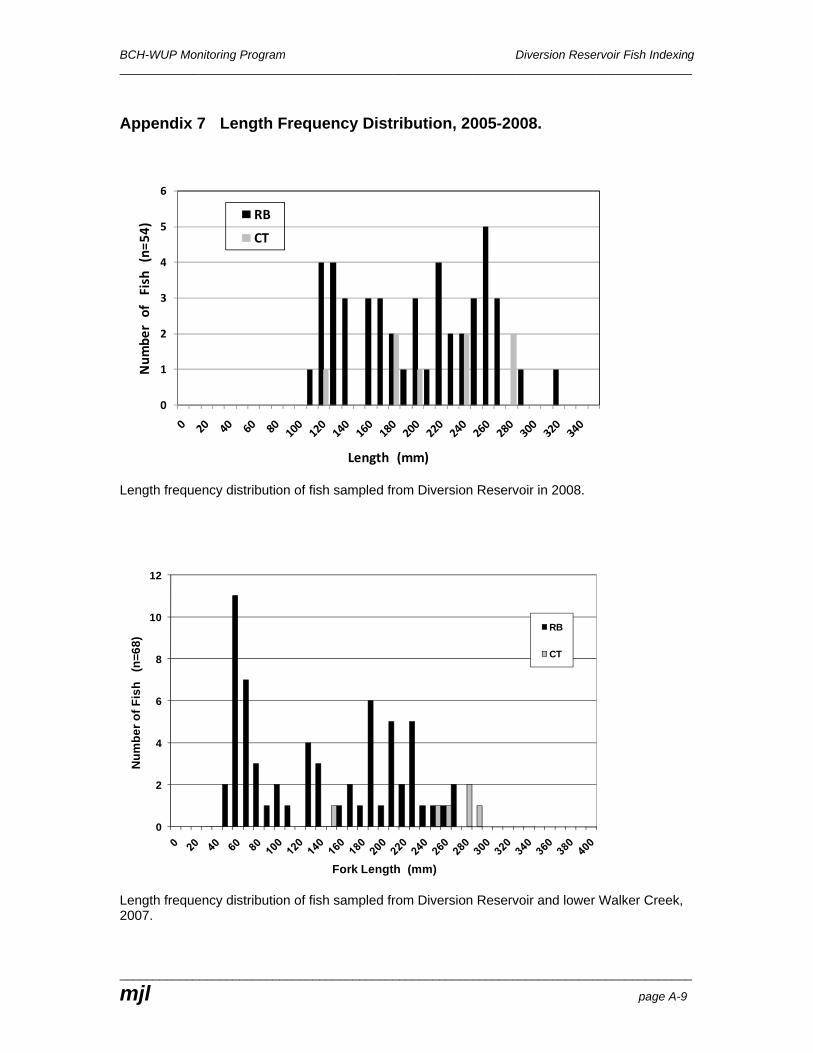
(p=0.04) CPUE. As well, the 2007 CPUE was greater than the 2005 (p=0.01) and 2006 (p=0.01) CPUE. This indicates that the CPUE of rainbow trout in 2007 and 2008 were significantly greater than 2005 and 2006. We considered the possible difference to data outcomes if the damaged gillnet had fished to full efficiency. This would have increased the 2008 CPUE by some unknown amount, but would not have changed the result of 2008 catch rates being significantly greater than 2005 and 2006. 3.2.3 Length Frequency Distribution The length frequency distributions of rainbow and cutthroat trout sampled in Diversion Reservoir (n=54) in 2008 are summarized in Figure 3.9. The numerically dominant age group in the 2008 sample were the 1+ component, possibly a follow-through from the numerically dominant 0+ fry in 2007. The absence of 0+ fry in the 2008 sample is inconclusive since it is unclear if this is a result of low fry abundance or due to the change in the 2008 minnow trapping protocol (see Section 3.2.1).
Figure 3.9 Length frequency distribution of fish sampled from Diversion Reservoir September 12-13, 2008 3.2.4 Age A total of 54 trout were aged using scale analysis. Age determinations from 11 otolith samples validated the age determination from the corresponding scales. The largest age groups in the rainbow trout sample from the lake (n=46) were 1+ (39%) and 2+ (33%). In the cutthroat sample (n=8), the largest group was age 2+ fish (38%) (Table 3.8).
0
1
2
3
4
5
6
Num
ber of Fish (n=
54)
Length (mm)
RB
CT
BCH-WUP Monitoring Program Diversion Reservoir Fish Indexing ______________________________________________________________________________________
______________________________________________________________________________________
mjl page 16
Table 3.8 Number of fish in each age group for rainbow trout and cutthroat trout sampled from Diversion Reservoir on September 12-13, 2008.
Age Group
0+
1+
2+
3+
4+
5+
Rainbow (n=46) 0 (0%) 18 (39%) 15 (33%) 8 (17%) 3 (7%) 2 (4%) Cutthroat (n=8) 0 (0%) 2 (25%) 3 (38%) 2 (25%) 1 (12%) 0 (0%)
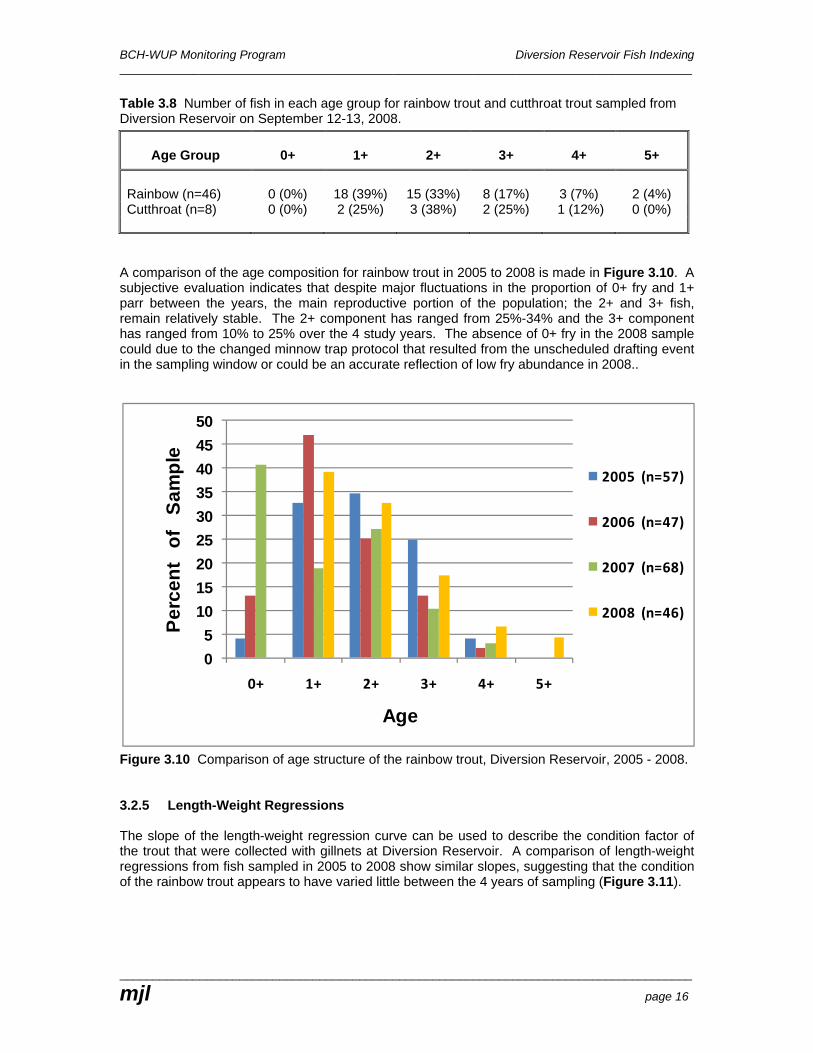
A comparison of the age composition for rainbow trout in 2005 to 2008 is made in Figure 3.10. A subjective evaluation indicates that despite major fluctuations in the proportion of 0+ fry and 1+ parr between the years, the main reproductive portion of the population; the 2+ and 3+ fish, remain relatively stable. The 2+ component has ranged from 25%-34% and the 3+ component has ranged from 10% to 25% over the 4 study years. The absence of 0+ fry in the 2008 sample could due to the changed minnow trap protocol that resulted from the unscheduled drafting event in the sampling window or could be an accurate reflection of low fry abundance in 2008..
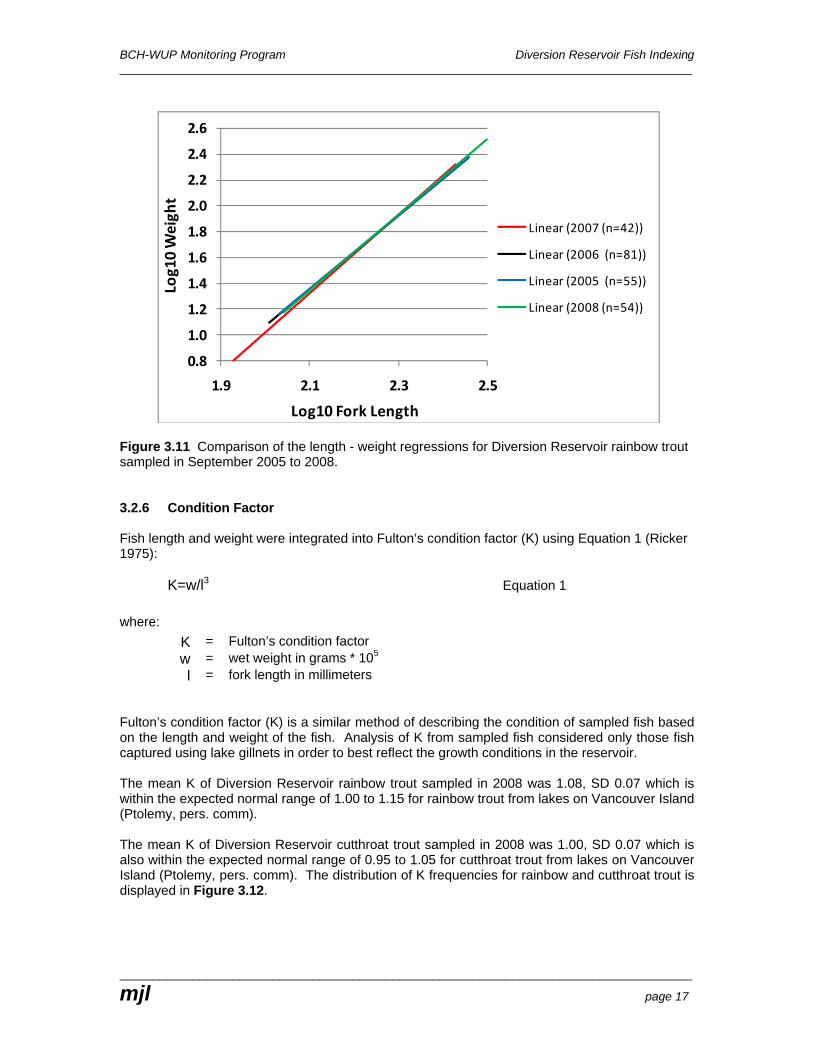
Figure 3.10 Comparison of age structure of the rainbow trout, Diversion Reservoir, 2005 - 2008. 3.2.5 Length-Weight Regressions The slope of the length-weight regression curve can be used to describe the condition factor of the trout that were collected with gillnets at Diversion Reservoir. A comparison of length-weight regressions from fish sampled in 2005 to 2008 show similar slopes, suggesting that the condition of the rainbow trout appears to have varied little between the 4 years of sampling (Figure 3.11).
05
101520253035404550
0+ 1+ 2+ 3+ 4+ 5+
Perc
ent
of
Sam
ple
Age
2005 (n=57)
2006 (n=47)
2007 (n=68)
2008 (n=46)
BCH-WUP Monitoring Program Diversion Reservoir Fish Indexing ______________________________________________________________________________________
______________________________________________________________________________________
mjl page 17
Figure 3.11 Comparison of the length - weight regressions for Diversion Reservoir rainbow trout sampled in September 2005 to 2008. 3.2.6 Condition Factor Fish length and weight were integrated into Fulton’s condition factor (K) using Equation 1 (Ricker 1975): K=w/l3 Equation 1 where:
K = Fulton’s condition factor w = wet weight in grams * 105 l = fork length in millimeters
Fulton’s condition factor (K) is a similar method of describing the condition of sampled fish based on the length and weight of the fish. Analysis of K from sampled fish considered only those fish captured using lake gillnets in order to best reflect the growth conditions in the reservoir. The mean K of Diversion Reservoir rainbow trout sampled in 2008 was 1.08, SD 0.07 which is within the expected normal range of 1.00 to 1.15 for rainbow trout from lakes on Vancouver Island (Ptolemy, pers. comm). The mean K of Diversion Reservoir cutthroat trout sampled in 2008 was 1.00, SD 0.07 which is also within the expected normal range of 0.95 to 1.05 for cutthroat trout from lakes on Vancouver Island (Ptolemy, pers. comm). The distribution of K frequencies for rainbow and cutthroat trout is displayed in Figure 3.12.
0.8
1.0
1.2
1.4
1.6
1.8
2.0
2.2
2.4
2.6
1.9 2.1 2.3 2.5
Log10 Weigh
t
Log10 Fork Length
Linear (2007 (n=42))
Linear (2006 (n=81))
Linear (2005 (n=55))
Linear (2008 (n=54))

BCH-WUP Monitoring Program Diversion Reservoir Fish Indexing ______________________________________________________________________________________
______________________________________________________________________________________
mjl page 18
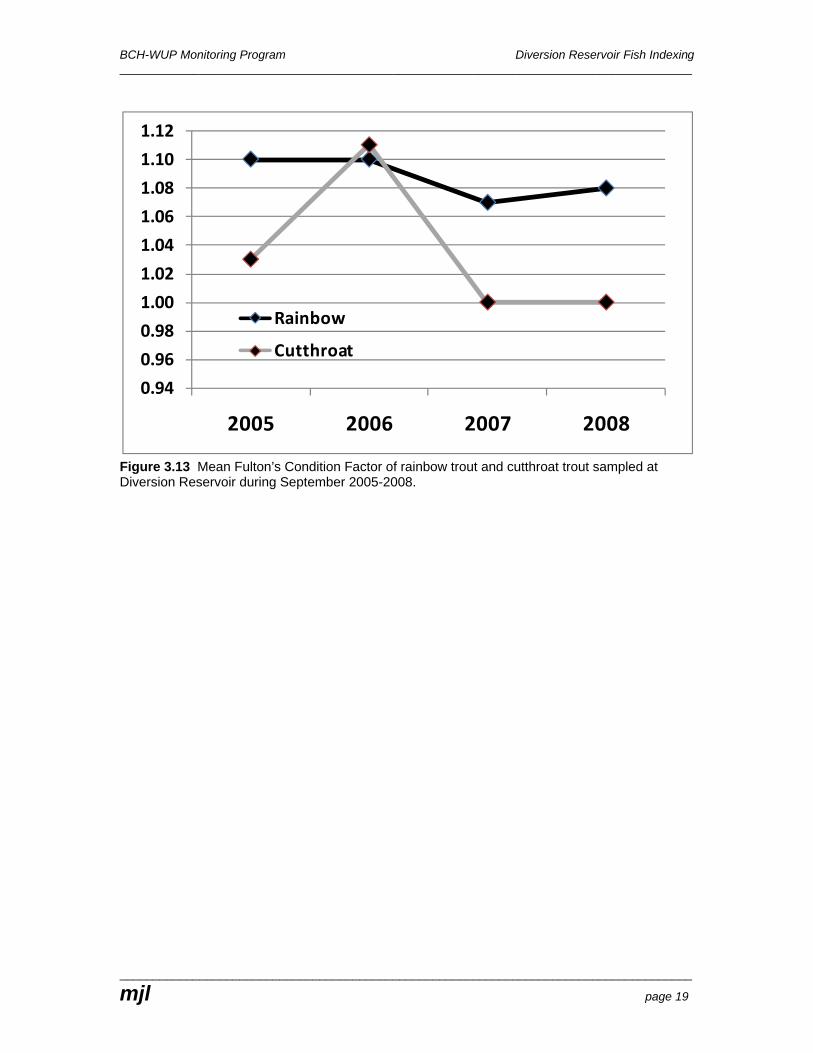
Figure 3.12 Frequency distribution of K-values of lentic rainbow and cutthroat trout sampled from Diversion Reservoir, September 12-13, 2008. The K-values of rainbow trout sampled in 2005 to 2008 are summarized in Tables 3.9 and 3.10, with mean values plotted in Figure 3.13. Despite some variability in the 4 years of sampling, ANOVA tests found that the differences were not statistically significant (p=0.05). This suggests that the physical condition of the fish has not changed significantly since the beginning of the study. The analysis for cutthroat trout is less robust, due to the small sample size in most years. Table 3.9 Summary of Fulton’s condition factor values (K) for Diversion Reservoir rainbow trout sampled in 2005–2008.
Sample Date N K SD Diversion Reservoir 2005 Sept 7-8 55 1.10 0.11 Diversion Reservoir 2006 Sept 12-14 81 1.10 0.12 Diversion Reservoir 2007 Sept 15-16 38 1.07 0.14 Diversion Reservoir 2008 Sept 12-13 46 1.08 0.07
Table 3.10 Summary of Fulton’s condition factor values (K) for Diversion Reservoir cutthroat trout sampled in 2005-2008.
Sample Date N K SD Diversion Reservoir 2005 Sept 7-8 7 1.03 0.08 Diversion Reservoir 2006 Sept 12-14 4 1.11 0.13 Diversion Reservoir 2007 Sept 15-16 10 1.00 0.05 Diversion Reservoir 2008 Sept 12-13 8 1.00 0.07
0
5
10
15
20
25
0.8 0.9 1 1.1 1.2 1.3 1.4 1.5 1.6
Num
ber o
f Fish (n
=54)
K
RB
CT
BCH-WUP Monitoring Program Diversion Reservoir Fish Indexing ______________________________________________________________________________________
______________________________________________________________________________________
mjl page 19
Figure 3.13 Mean Fulton’s Condition Factor of rainbow trout and cutthroat trout sampled at Diversion Reservoir during September 2005-2008.
0.94
0.96
0.98
1.00
1.02
1.04
1.06
1.08
1.10
1.12
2005 2006 2007 2008
Rainbow
Cutthroat
BCH-WUP Monitoring Program Diversion Reservoir Fish Indexing ______________________________________________________________________________________
______________________________________________________________________________________
mjl page 20
4.0 Four Year Data Trends Graphic summaries of the key indicators used to assess aquatic productivity during the 4 years of study are presented in Figures 4.1 to 4.5.
Figure 4.1 Chlorophyll a
Figure 4.2 Secchi Depth
Figure 4.3 Phosphorous
0
2
4
6
8
10
12
14
2005 2006 2007 2008
Chloroph
yll a (m
g/m3)
Chlorophyll a
2.6
2.8
3.0
3.2
3.4
3.6
2005 2006 2007 2008
Mea
n S
ecch
i Dep
th
(m)
Mean Secchi Depth
0
2
4
6
8
10
12
2005 2006 2007 2008
Phos
phor
ous
(ug
/l)
Dissolved Phosphorus Total Phosphorous
BCH-WUP Monitoring Program Diversion Reservoir Fish Indexing ______________________________________________________________________________________
______________________________________________________________________________________
mjl page 21
Figure 4.4 Fish Condition
Figure 4.5 CPUE of Rainbow Trout in Gillnets 5.0 Recommendations • In 2005, 2006, 2007 and 2008 Diversion Reservoir was clinograde during September. Fish
were to some degree, sandwiched between an anoxic hypolimnion and a stress-inducing epilimnion with high surface temperatures. Prior to 2008 the likelihood of a late-summer draw-down of the reservoir seemed unlikely, but recommendations were made in the annual report from those years to avoid potential stress and/or fish mortality if such an event was to take place. Such an event did actually occur in 2008, but was terminated prior to impacting fish and fish habitat. Provision for a temperature /dissolved oxygen profile at Limnology Stn. 1 prior to future draw-down events would provide a basis for assessing the potential impacts to fish during similar events in the future.
• Maintaining the reservoir level as close to 378.0 m as possible during the sampling window in mid-September 2009 will reduce sampling variability between years.
• After 4 years of baseline sampling, most of the key indicators of aquatic production are either
stable (condition factor) or have been on an increasing trend (reactive phosphorous, chlorophyll a, and catch rates). However, in most cases this “trend” is has only been maintained for the last 2 years.
0.94
0.96
0.98
1.00
1.02
1.04
1.06
1.08
1.10
1.12
2005 2006 2007 2008
Rainbow
Cutthroat
0
5
10
15
20
25
30
2005 2006 2007 2008
CPU
E (
fish/
hr)
BCH-WUP Monitoring Program Diversion Reservoir Fish Indexing ______________________________________________________________________________________
______________________________________________________________________________________
mjl page 22
6.0 References BC Hydro. 2002. Jordan River Water Use Plan Consultative Report. Prepared for BC Hydro
Jordan River Water Use Plan Project. Burnaby, BC. [BCMELP-FIU] British Columbia Ministry of Environment, Lands and Parks, Fish Inventory Unit.
1997. British Columbia Resources Inventory Standards Committee. Available at: http://ilmbwww.gov.bc.ca/risc/pubs/aquatic/fishcol/index.htm
Bell MC. 1973. Fisheries handbook of engineering requirements and biological criteria.
Fisheries Engineering Research Program. US Army Corps of Engineers, North Pacific Division, Portland, Oregon.
Cavanagh N, Nordin RN, Swain LG, Pommen LW. 1997. Ambient fresh water and effluent
sampling manual. British Columbia Resources Inventory Standards Committee. Available at: http://ilmbwww.gov.bc.ca/risc/pubs/aquatic/ambient/index.htm#TOC
[FOC] Fisheries and Oceans Canada. 2005. Mapster Website. Available at:
http://www.canbcdw.pac.dfo-mpo.gc.ca/ows/imf.jsp?site=mapster Griffith RP. 1996. Biophysical assessment of fish production within the Jordan River Drainage in
1994. BC Hydro and Power Authority, Environmental Affairs, Burnaby, BC. Matthews KR, Berg NH. 1996. Rainbow trout response to water temperature and dissolved
oxygen stress in two southern California stream pools. J of Fish Biology (1997) 50:50-67. LePage S, Garrison T, Young T, Wells W. 2001. Limnological assessment of Diversion
Reservoir. Prepared for Royal Roads University, Sooke, BC. Lough, MJ. 2006. Jordan River water use plan monitoring program: Diversion Reservoir fish
indexing – 2005. Prepared for BC Hydro and Power Authority by MJ Lough Environmental Consultants.
Lough, MJ. 2007. Jordan River water use plan monitoring program: Diversion Reservoir fish
indexing – 2006. Prepared for BC Hydro and Power Authority by MJ Lough Environmental Consultants.
Lough, MJ. 2008. Jordan River water use plan monitoring program: Diversion Reservoir fish
indexing – 2007. Prepared for BC Hydro and Power Authority by MJ Lough Environmental Consultants.
Perrin CJ. 1995. Letter to RP Griffith regarding interpretation of limnology data collected at
Diversion Reservoir in 1994. Limnotek Research and Development Inc. 3p. (in Griffith 1996).
Ricker WE. 1975. Computation and interpretation of biological statistics of fish populations. Bull.
Fish. Res. Board. Ca. Bulletin 191: 382 p. Sinclair DC. 1965. The effects of water level changes on the limnology of two British Columbia
lakes with particular reference to bottom fauna. Masters Thesis. Dept. of Zoology, University of British Columbia, Vancouver, BC.
Stewart S, Shon M, McHale R, Francis A. 2002. The limnological assessment of two Jordan
River reservoirs (Phase ll). Prepared for Royal Roads University, Sooke, BC. Wetzel RG. 2001. Limnology. Lake and river ecosystems, Third edition. Academic Press.

BCH-WUP Monitoring Program Diversion Reservoir Fish Indexing ______________________________________________________________________________________
______________________________________________________________________________________
mjl page 23
7.0 Personal Communications Dodd I. Biologist. BC Hydro, Campbell River, BC. Ptolemy R. Fish biologist, Aquatic Ecosystems Science Section, BC Ministry of Environment,
Victoria, BC.
BCH-WUP Monitoring Program Diversion Reservoir Fish Indexing ______________________________________________________________________________________
______________________________________________________________________________________
mjl page A-1
Appendix 1 Field Data - Temperature - Dissolved Oxygen Profile Water Temperature and Dissolved Oxygen Profiles on September 13, 2008
Limnology Station 1
Limnology Station 2
Depth DO Temp Depth DO Temp 0.5 10.2 18.7 0.5 11.1 20.2 1.0 10.1 18.5 1.0 11.0 19.0 2.0 10.0 17.9 2.0 10.6 18.3 3.0 9.7 17.7 3.0 10.3 18.0 4.0 9.4 17.6 4.0 9.2 17.4 5.0 8.5 17.2 5.0 8.9 17.0 6.0 8.2 16.9 6.0 8.3 16.7 7.0 7.7 16.4 7.0 7.8 16.5 8.0 7.4 16.2 8.0 7.2 16.1 9.0 7.2 15.9 9.0 6.4 15.7 10.0 6.6 15.7 Bottom 11.0 6.5 15.6 12.0 6.1 15.4 13.0 6.0 15.3 14.0 6.0 15.1 15.0 5.6 14.8 16.0 5.3 14.6 17.0 4.2 14.1 18.0 0.0 11.9 19.0 0.0 9.1 20.0 0.0 8.9
Bottom
BCH-WUP Monitoring Program Diversion Reservoir Fish Indexing ______________________________________________________________________________________
______________________________________________________________________________________
mjl page A-2
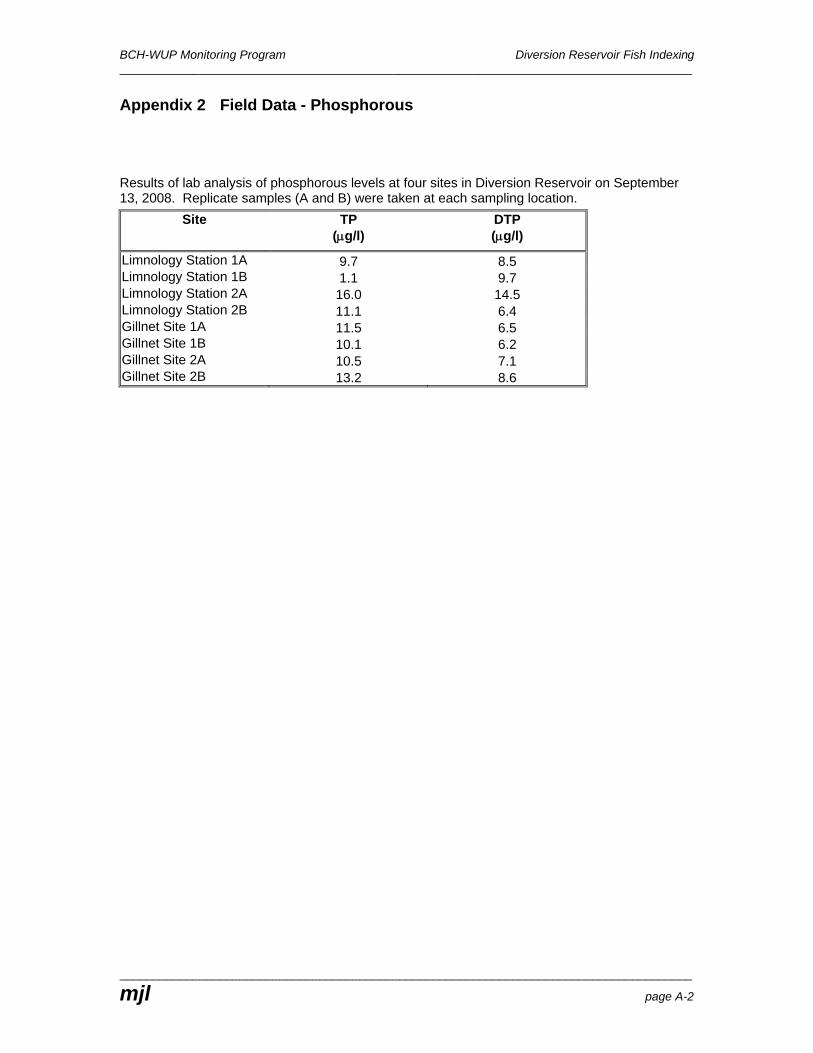
Appendix 2 Field Data - Phosphorous Results of lab analysis of phosphorous levels at four sites in Diversion Reservoir on September 13, 2008. Replicate samples (A and B) were taken at each sampling location.
Site TP (μg/l)
DTP (μg/l)
Limnology Station 1A 9.7 8.5 Limnology Station 1B 1.1 9.7 Limnology Station 2A 16.0 14.5 Limnology Station 2B 11.1 6.4 Gillnet Site 1A 11.5 6.5 Gillnet Site 1B 10.1 6.2 Gillnet Site 2A 10.5 7.1 Gillnet Site 2B 13.2 8.6
BCH-WUP Monitoring Program Diversion Reservoir Fish Indexing _________________________________________________________________________________________________________________________________
_________________________________________________________________________________________________________________________________
mjl page A-3
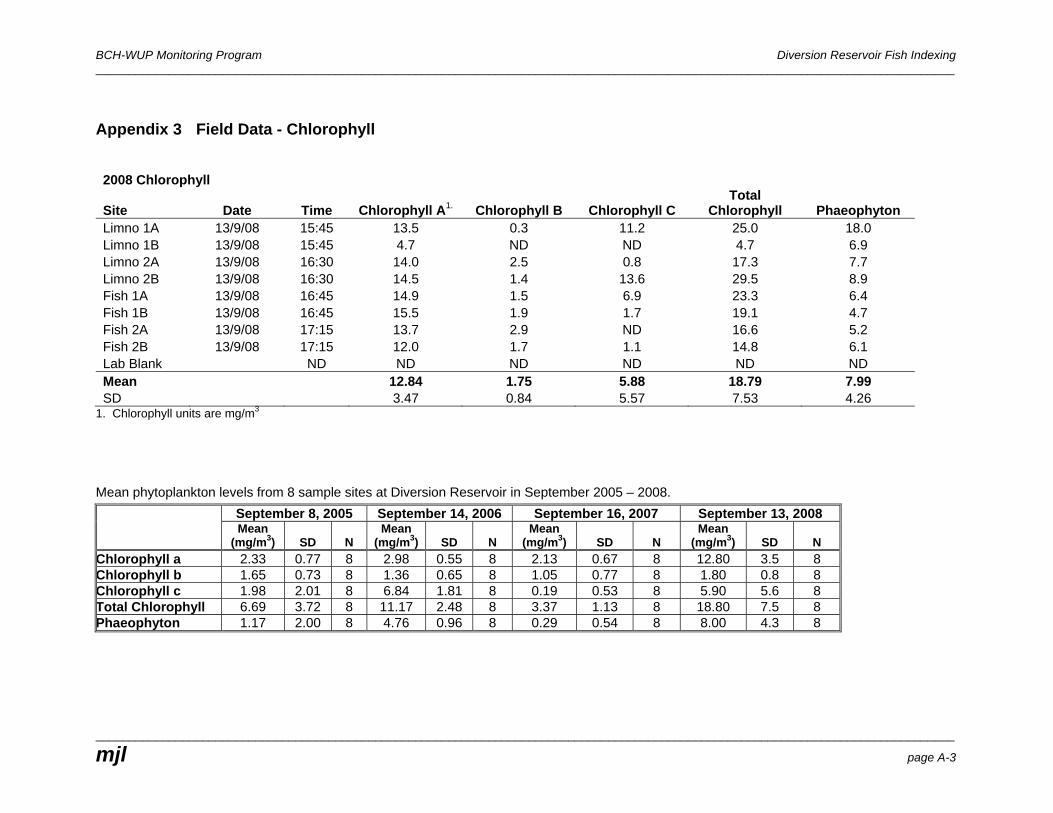
Appendix 3 Field Data - Chlorophyll
2008 Chlorophyll
Site Date Time Chlorophyll A1. Chlorophyll B Chlorophyll C Total
Chlorophyll Phaeophyton Limno 1A 13/9/08 15:45 13.5 0.3 11.2 25.0 18.0 Limno 1B 13/9/08 15:45 4.7 ND ND 4.7 6.9 Limno 2A 13/9/08 16:30 14.0 2.5 0.8 17.3 7.7 Limno 2B 13/9/08 16:30 14.5 1.4 13.6 29.5 8.9 Fish 1A 13/9/08 16:45 14.9 1.5 6.9 23.3 6.4 Fish 1B 13/9/08 16:45 15.5 1.9 1.7 19.1 4.7 Fish 2A 13/9/08 17:15 13.7 2.9 ND 16.6 5.2 Fish 2B 13/9/08 17:15 12.0 1.7 1.1 14.8 6.1 Lab Blank ND ND ND ND ND ND Mean 12.84 1.75 5.88 18.79 7.99 SD 3.47 0.84 5.57 7.53 4.26
1. Chlorophyll units are mg/m3 Mean phytoplankton levels from 8 sample sites at Diversion Reservoir in September 2005 – 2008.
September 8, 2005 September 14, 2006 September 16, 2007 September 13, 2008 Mean
(mg/m3)
SD N Mean
(mg/m3) SD N Mean
(mg/m3) SD N Mean
(mg/m3) SD N Chlorophyll a 2.33 0.77 8 2.98 0.55 8 2.13 0.67 8 12.80 3.5 8 Chlorophyll b 1.65 0.73 8 1.36 0.65 8 1.05 0.77 8 1.80 0.8 8 Chlorophyll c 1.98 2.01 8 6.84 1.81 8 0.19 0.53 8 5.90 5.6 8 Total Chlorophyll 6.69 3.72 8 11.17 2.48 8 3.37 1.13 8 18.80 7.5 8 Phaeophyton 1.17 2.00 8 4.76 0.96 8 0.29 0.54 8 8.00 4.3 8
BCH-WUP Monitoring Program Diversion Reservoir Fish Indexing _________________________________________________________________________________________________________________________________
________________________________________________________________________________________________________________________________
mjl page A-4
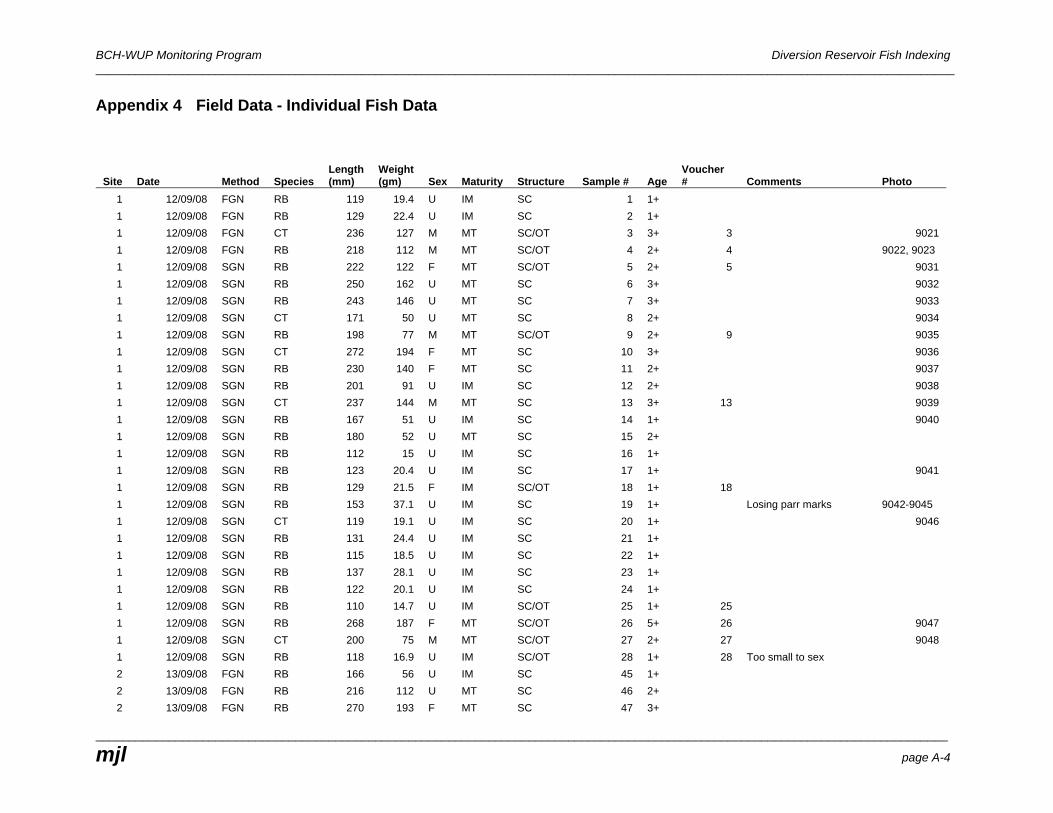
Appendix 4 Field Data - Individual Fish Data
Site Date Method Species Length (mm)
Weight (gm) Sex Maturity Structure Sample # Age
Voucher # Comments Photo
1 12/09/08 FGN RB 119 19.4 U IM SC 1 1+ 1 12/09/08 FGN RB 129 22.4 U IM SC 2 1+ 1 12/09/08 FGN CT 236 127 M MT SC/OT 3 3+ 3 9021 1 12/09/08 FGN RB 218 112 M MT SC/OT 4 2+ 4 9022, 9023 1 12/09/08 SGN RB 222 122 F MT SC/OT 5 2+ 5 9031 1 12/09/08 SGN RB 250 162 U MT SC 6 3+ 9032 1 12/09/08 SGN RB 243 146 U MT SC 7 3+ 9033 1 12/09/08 SGN CT 171 50 U MT SC 8 2+ 9034 1 12/09/08 SGN RB 198 77 M MT SC/OT 9 2+ 9 9035 1 12/09/08 SGN CT 272 194 F MT SC 10 3+ 9036 1 12/09/08 SGN RB 230 140 F MT SC 11 2+ 9037 1 12/09/08 SGN RB 201 91 U IM SC 12 2+ 9038 1 12/09/08 SGN CT 237 144 M MT SC 13 3+ 13 9039 1 12/09/08 SGN RB 167 51 U IM SC 14 1+ 9040 1 12/09/08 SGN RB 180 52 U MT SC 15 2+ 1 12/09/08 SGN RB 112 15 U IM SC 16 1+ 1 12/09/08 SGN RB 123 20.4 U IM SC 17 1+ 9041 1 12/09/08 SGN RB 129 21.5 F IM SC/OT 18 1+ 18 1 12/09/08 SGN RB 153 37.1 U IM SC 19 1+ Losing parr marks 9042-9045 1 12/09/08 SGN CT 119 19.1 U IM SC 20 1+ 9046 1 12/09/08 SGN RB 131 24.4 U IM SC 21 1+ 1 12/09/08 SGN RB 115 18.5 U IM SC 22 1+ 1 12/09/08 SGN RB 137 28.1 U IM SC 23 1+ 1 12/09/08 SGN RB 122 20.1 U IM SC 24 1+ 1 12/09/08 SGN RB 110 14.7 U IM SC/OT 25 1+ 25 1 12/09/08 SGN RB 268 187 F MT SC/OT 26 5+ 26 9047 1 12/09/08 SGN CT 200 75 M MT SC/OT 27 2+ 27 9048 1 12/09/08 SGN RB 118 16.9 U IM SC/OT 28 1+ 28 Too small to sex 2 13/09/08 FGN RB 166 56 U IM SC 45 1+ 2 13/09/08 FGN RB 216 112 U MT SC 46 2+ 2 13/09/08 FGN RB 270 193 F MT SC 47 3+
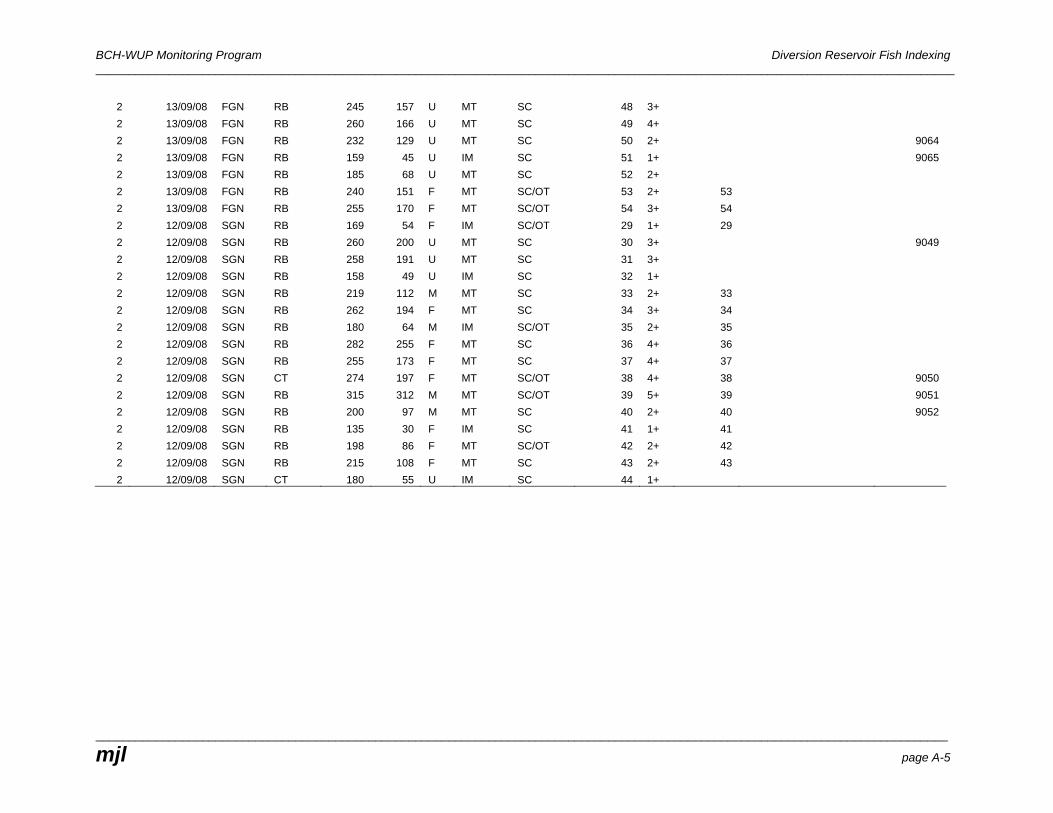
BCH-WUP Monitoring Program Diversion Reservoir Fish Indexing _________________________________________________________________________________________________________________________________
________________________________________________________________________________________________________________________________
mjl page A-5
2 13/09/08 FGN RB 245 157 U MT SC 48 3+ 2 13/09/08 FGN RB 260 166 U MT SC 49 4+ 2 13/09/08 FGN RB 232 129 U MT SC 50 2+ 9064 2 13/09/08 FGN RB 159 45 U IM SC 51 1+ 9065 2 13/09/08 FGN RB 185 68 U MT SC 52 2+ 2 13/09/08 FGN RB 240 151 F MT SC/OT 53 2+ 53 2 13/09/08 FGN RB 255 170 F MT SC/OT 54 3+ 54 2 12/09/08 SGN RB 169 54 F IM SC/OT 29 1+ 29 2 12/09/08 SGN RB 260 200 U MT SC 30 3+ 9049 2 12/09/08 SGN RB 258 191 U MT SC 31 3+ 2 12/09/08 SGN RB 158 49 U IM SC 32 1+ 2 12/09/08 SGN RB 219 112 M MT SC 33 2+ 33 2 12/09/08 SGN RB 262 194 F MT SC 34 3+ 34 2 12/09/08 SGN RB 180 64 M IM SC/OT 35 2+ 35 2 12/09/08 SGN RB 282 255 F MT SC 36 4+ 36 2 12/09/08 SGN RB 255 173 F MT SC 37 4+ 37 2 12/09/08 SGN CT 274 197 F MT SC/OT 38 4+ 38 9050 2 12/09/08 SGN RB 315 312 M MT SC/OT 39 5+ 39 9051 2 12/09/08 SGN RB 200 97 M MT SC 40 2+ 40 9052 2 12/09/08 SGN RB 135 30 F IM SC 41 1+ 41 2 12/09/08 SGN RB 198 86 F MT SC/OT 42 2+ 42 2 12/09/08 SGN RB 215 108 F MT SC 43 2+ 43 2 12/09/08 SGN CT 180 55 U IM SC 44 1+
BCH-WUP Monitoring Program Diversion Reservoir Fish Indexing ______________________________________________________________________________________
______________________________________________________________________________________
mjl page A-6
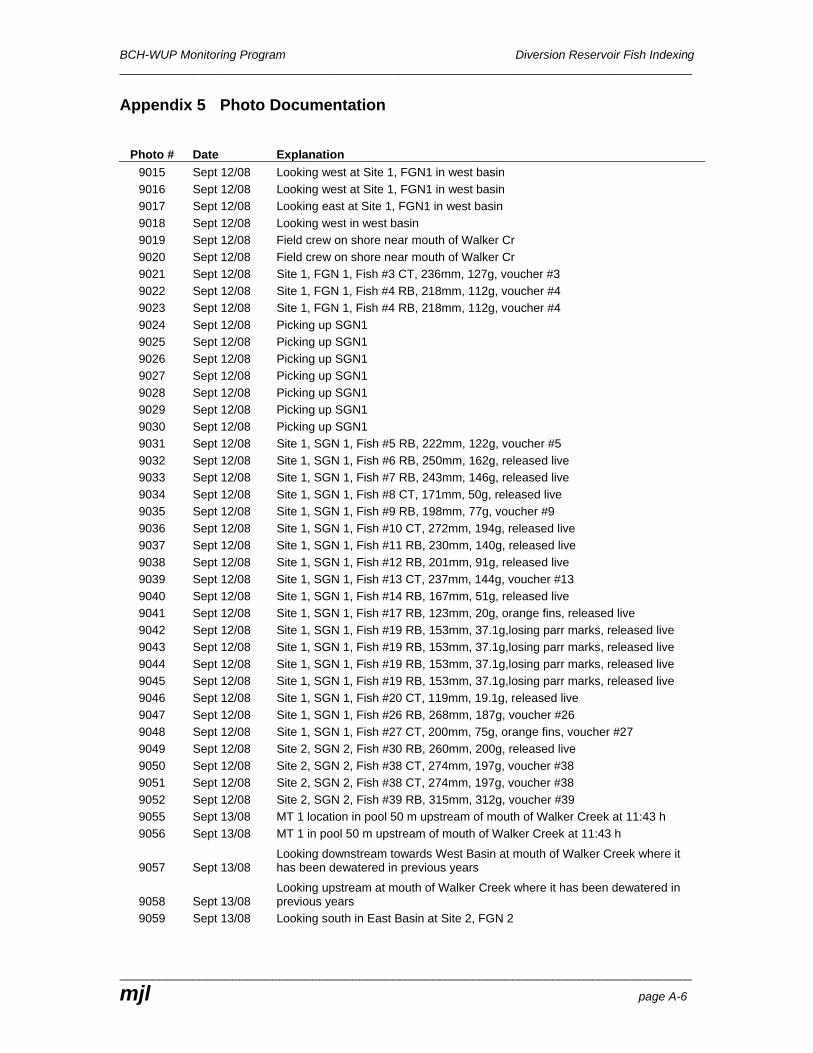
Appendix 5 Photo Documentation
Photo # Date Explanation 9015 Sept 12/08 Looking west at Site 1, FGN1 in west basin 9016 Sept 12/08 Looking west at Site 1, FGN1 in west basin 9017 Sept 12/08 Looking east at Site 1, FGN1 in west basin 9018 Sept 12/08 Looking west in west basin 9019 Sept 12/08 Field crew on shore near mouth of Walker Cr 9020 Sept 12/08 Field crew on shore near mouth of Walker Cr 9021 Sept 12/08 Site 1, FGN 1, Fish #3 CT, 236mm, 127g, voucher #3 9022 Sept 12/08 Site 1, FGN 1, Fish #4 RB, 218mm, 112g, voucher #4 9023 Sept 12/08 Site 1, FGN 1, Fish #4 RB, 218mm, 112g, voucher #4 9024 Sept 12/08 Picking up SGN1 9025 Sept 12/08 Picking up SGN1 9026 Sept 12/08 Picking up SGN1 9027 Sept 12/08 Picking up SGN1 9028 Sept 12/08 Picking up SGN1 9029 Sept 12/08 Picking up SGN1 9030 Sept 12/08 Picking up SGN1 9031 Sept 12/08 Site 1, SGN 1, Fish #5 RB, 222mm, 122g, voucher #5 9032 Sept 12/08 Site 1, SGN 1, Fish #6 RB, 250mm, 162g, released live 9033 Sept 12/08 Site 1, SGN 1, Fish #7 RB, 243mm, 146g, released live 9034 Sept 12/08 Site 1, SGN 1, Fish #8 CT, 171mm, 50g, released live 9035 Sept 12/08 Site 1, SGN 1, Fish #9 RB, 198mm, 77g, voucher #9 9036 Sept 12/08 Site 1, SGN 1, Fish #10 CT, 272mm, 194g, released live 9037 Sept 12/08 Site 1, SGN 1, Fish #11 RB, 230mm, 140g, released live 9038 Sept 12/08 Site 1, SGN 1, Fish #12 RB, 201mm, 91g, released live 9039 Sept 12/08 Site 1, SGN 1, Fish #13 CT, 237mm, 144g, voucher #13 9040 Sept 12/08 Site 1, SGN 1, Fish #14 RB, 167mm, 51g, released live 9041 Sept 12/08 Site 1, SGN 1, Fish #17 RB, 123mm, 20g, orange fins, released live 9042 Sept 12/08 Site 1, SGN 1, Fish #19 RB, 153mm, 37.1g,losing parr marks, released live 9043 Sept 12/08 Site 1, SGN 1, Fish #19 RB, 153mm, 37.1g,losing parr marks, released live 9044 Sept 12/08 Site 1, SGN 1, Fish #19 RB, 153mm, 37.1g,losing parr marks, released live 9045 Sept 12/08 Site 1, SGN 1, Fish #19 RB, 153mm, 37.1g,losing parr marks, released live 9046 Sept 12/08 Site 1, SGN 1, Fish #20 CT, 119mm, 19.1g, released live 9047 Sept 12/08 Site 1, SGN 1, Fish #26 RB, 268mm, 187g, voucher #26 9048 Sept 12/08 Site 1, SGN 1, Fish #27 CT, 200mm, 75g, orange fins, voucher #27 9049 Sept 12/08 Site 2, SGN 2, Fish #30 RB, 260mm, 200g, released live 9050 Sept 12/08 Site 2, SGN 2, Fish #38 CT, 274mm, 197g, voucher #38 9051 Sept 12/08 Site 2, SGN 2, Fish #38 CT, 274mm, 197g, voucher #38 9052 Sept 12/08 Site 2, SGN 2, Fish #39 RB, 315mm, 312g, voucher #39 9055 Sept 13/08 MT 1 location in pool 50 m upstream of mouth of Walker Creek at 11:43 h 9056 Sept 13/08 MT 1 in pool 50 m upstream of mouth of Walker Creek at 11:43 h
9057 Sept 13/08 Looking downstream towards West Basin at mouth of Walker Creek where it has been dewatered in previous years
9058 Sept 13/08 Looking upstream at mouth of Walker Creek where it has been dewatered in previous years
9059 Sept 13/08 Looking south in East Basin at Site 2, FGN 2
BCH-WUP Monitoring Program Diversion Reservoir Fish Indexing ______________________________________________________________________________________
______________________________________________________________________________________
mjl page A-7
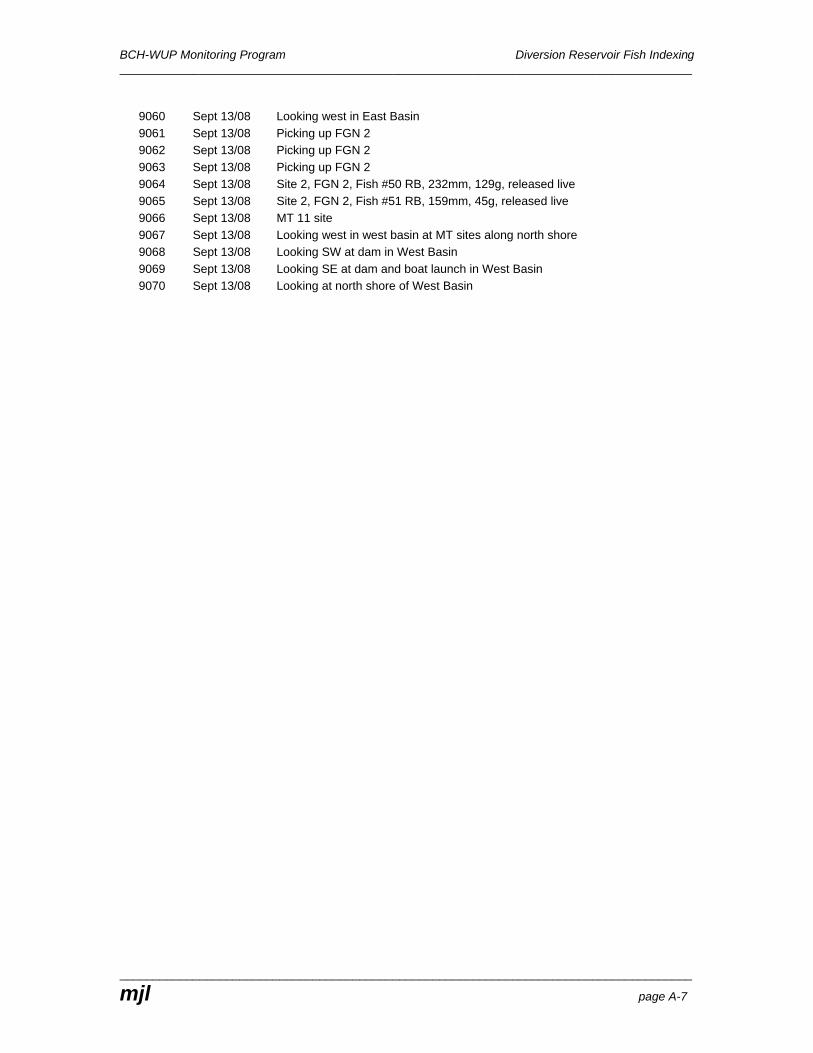
9060
Sept 13/08
Looking west in East Basin
9061 Sept 13/08 Picking up FGN 2 9062 Sept 13/08 Picking up FGN 2 9063 Sept 13/08 Picking up FGN 2 9064 Sept 13/08 Site 2, FGN 2, Fish #50 RB, 232mm, 129g, released live 9065 Sept 13/08 Site 2, FGN 2, Fish #51 RB, 159mm, 45g, released live 9066 Sept 13/08 MT 11 site 9067 Sept 13/08 Looking west in west basin at MT sites along north shore 9068 Sept 13/08 Looking SW at dam in West Basin 9069 Sept 13/08 Looking SE at dam and boat launch in West Basin 9070 Sept 13/08 Looking at north shore of West Basin
BCH-WUP Monitoring Program Diversion Reservoir Fish Indexing ______________________________________________________________________________________
______________________________________________________________________________________
mjl page A-8
Appendix 6 Summary of Gillnet Effort and Catch Data Catch, effort and CPUE summary of rainbow trout catch in 4 variable-mesh gillnets in Diversion Reservoir, 2005 to 2008.
FGN1 FGN2 SGN1 SGN2 MEAN ALL
2005
Catch (rainbow trout) 7 23 6 19
Effort (net-hours) 1.60 2.50 1.25 2.50
CPUE (rainbow/hr) 4.4 9.2 4.8 7.6 6.5
2006
Catch (rainbow trout) 7 39 22 13
Effort (net-hours) 1.50 4.40 2.75 2.10
CPUE (rainbow/hr) 4.7 8.9 8.0 6.2 6.9
2007
Catch (rainbow trout) 6 5 24 3
Effort (net-hours) 0.33 0.25 1.00 0.25
CPUE (rainbow/hr) 18.2 20.0 24.0 12.0 18.2
2008
Catch (rainbow trout) 3 10 19 14
Effort (net-hours) 0.42 0.25 0.50 0.64
CPUE (rainbow/hr) 7.1 40.0 38.0 21.9 26.8
BCH-WUP Monitoring Program Diversion Reservoir Fish Indexing ______________________________________________________________________________________
______________________________________________________________________________________
mjl page A-9
Appendix 7 Length Frequency Distribution, 2005-2008.
Length frequency distribution of fish sampled from Diversion Reservoir in 2008.
Length frequency distribution of fish sampled from Diversion Reservoir and lower Walker Creek, 2007.
0
1
2
3
4
5
6
Num
ber of Fish (n=
54)
Length (mm)
RB
CT
0
2
4
6
8
10
12
Num
ber o
f Fis
h (
n=68
)
Fork Length (mm)
RB
CT
BCH-WUP Monitoring Program Diversion Reservoir Fish Indexing ______________________________________________________________________________________
______________________________________________________________________________________
mjl page A-10
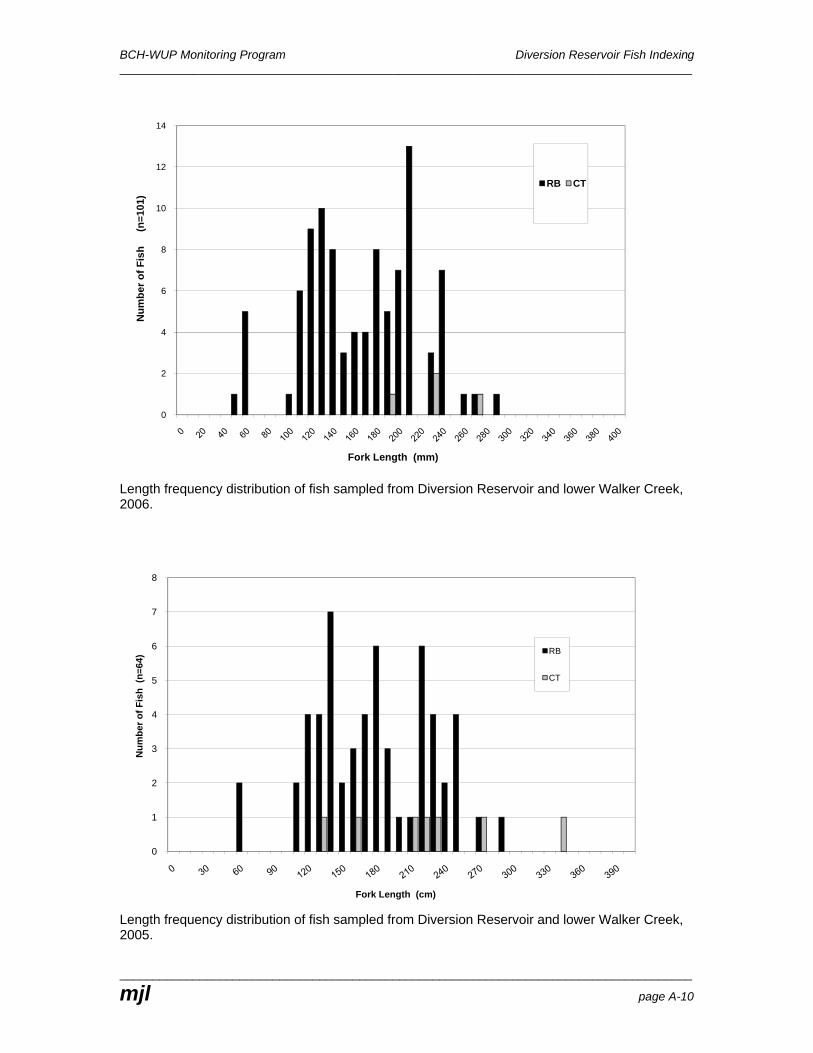
Length frequency distribution of fish sampled from Diversion Reservoir and lower Walker Creek, 2006.
Length frequency distribution of fish sampled from Diversion Reservoir and lower Walker Creek, 2005.
0
2
4
6
8
10
12
14N
umbe
r of F
ish
(n
=101
)
Fork Length (mm)
RB CT
0
1
2
3
4
5
6
7
8
Num
ber o
f Fis
h (n
=64)
Fork Length (cm)
RB
CT