Embed Size (px)
Citation preview
California Energy Commission Presentation
Tom KoehlerTom KoehlerApril 6, 2009
DATE RECD.
DOCKET08-ALT-1
APR 06 2009
APR 07 2009
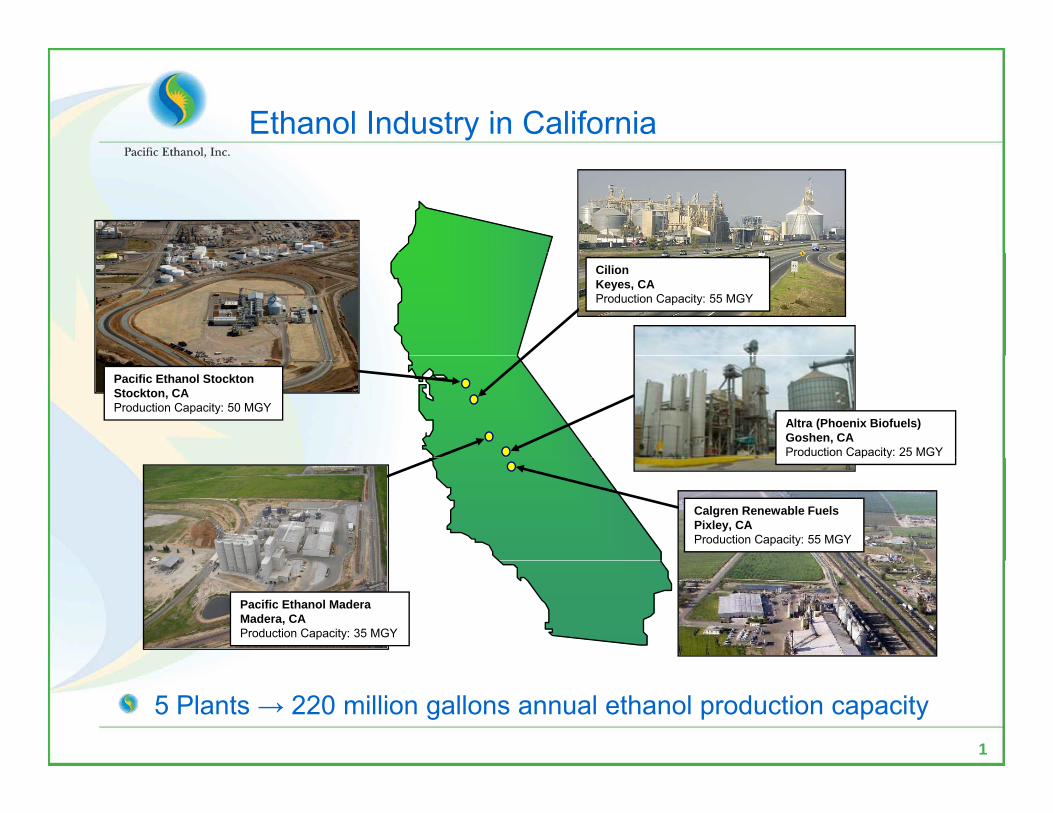
Ethanol Industry in California
Cilion Keyes, CAProduction Capacity: 55 MGY
Altra (Phoenix Biofuels) Goshen, CAProduction Capacity: 25 MGY
Pacific Ethanol Stockton Stockton, CAProduction Capacity: 50 MGY
Calgren Renewable Fuels Pixley, CAProduction Capacity: 55 MGY
p y
Pacific Ethanol Madera Madera, CAProduction Capacity: 35 MGY
1
5 Plants → 220 million gallons annual ethanol production capacity

Economic Impact
$500 illi i i t t$500+million in investment
3,500 jobs economy wide
Net tax proceeds to local, state, and federal treasuries
New diversified fuel production base in stateNew diversified fuel production base in state
Infrastructure for current and advanced fuels
2
Current Market Conditions
Currently all plants are idledCurrently all plants are idled
Supply/Demand imbalance
Oil price declineOil price decline
Credit crunch
Older plants in other states ith prod cerOlder plants in other states with producer incentives policy have debt paid off and are operating
3
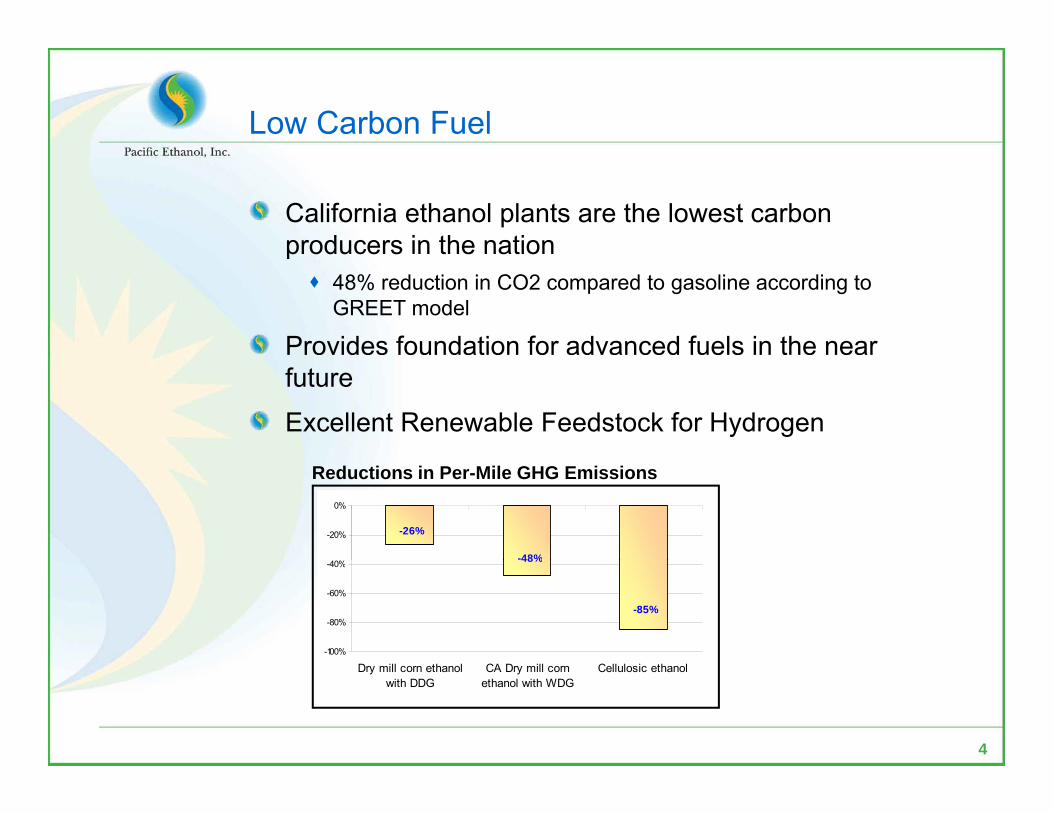
Low Carbon Fuel
California ethanol plants are the lowest carbon producers in the nationproducers in the nation
48% reduction in CO2 compared to gasoline according to GREET model
Provides foundation for advanced fuels in the near future
Excellent Renewable Feedstock for Hydrogen
Reductions in Per-Mile GHG Emissions
-48%
-26%
%
-20%
0%
-85%
48%
-100%
-80%
-60%
-40%
4
Dry mill corn ethanolwith DDG
CA Dry mill cornethanol with WDG
Cellulosic ethanol
Report Confirms GHG Reduction from Ethanol Use
“An Examination of the Potential for Improving Carbon/Energy Balance of Bioethanol”Carbon/Energy Balance of Bioethanol
International Energy Agency (IEA)February 15, 2009
Ethanol projected to cut greenhouse gas (GHG) emissions up to 55% over gasoline by 2015emissions up to 55% over gasoline by 2015
Projected increased reductions are due primarily to efficiency gains in both feedstock production and ethanol manufacturingethanol manufacturing
GHG performance and energy balance of ethanol continues to improve while gasoline and petroleum declinesdeclines
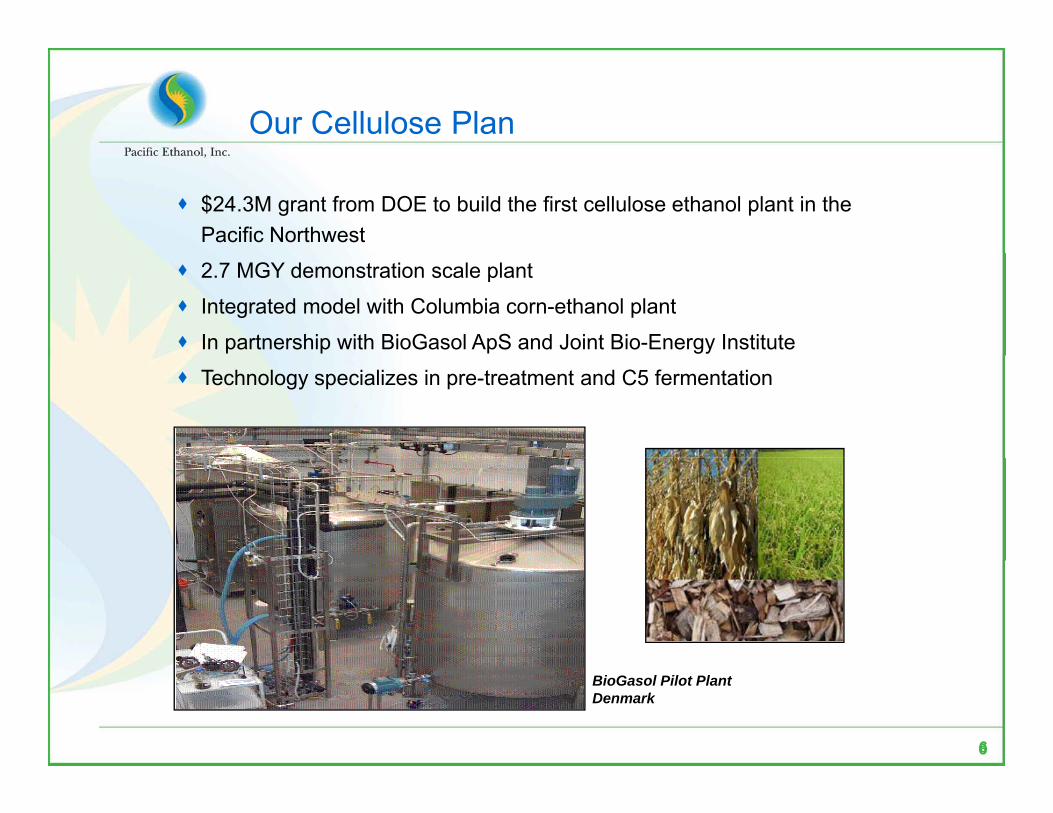
Our Cellulose Plan
$24.3M grant from DOE to build the first cellulose ethanol plant in the Pacific Northwest
2.7 MGY demonstration scale plant
Integrated model with Columbia corn-ethanol plant
In partnership with BioGasol ApS and Joint Bio-Energy Institute
Technology specializes in pre-treatment and C5 fermentation
66
BioGasol Pilot Plant Denmark
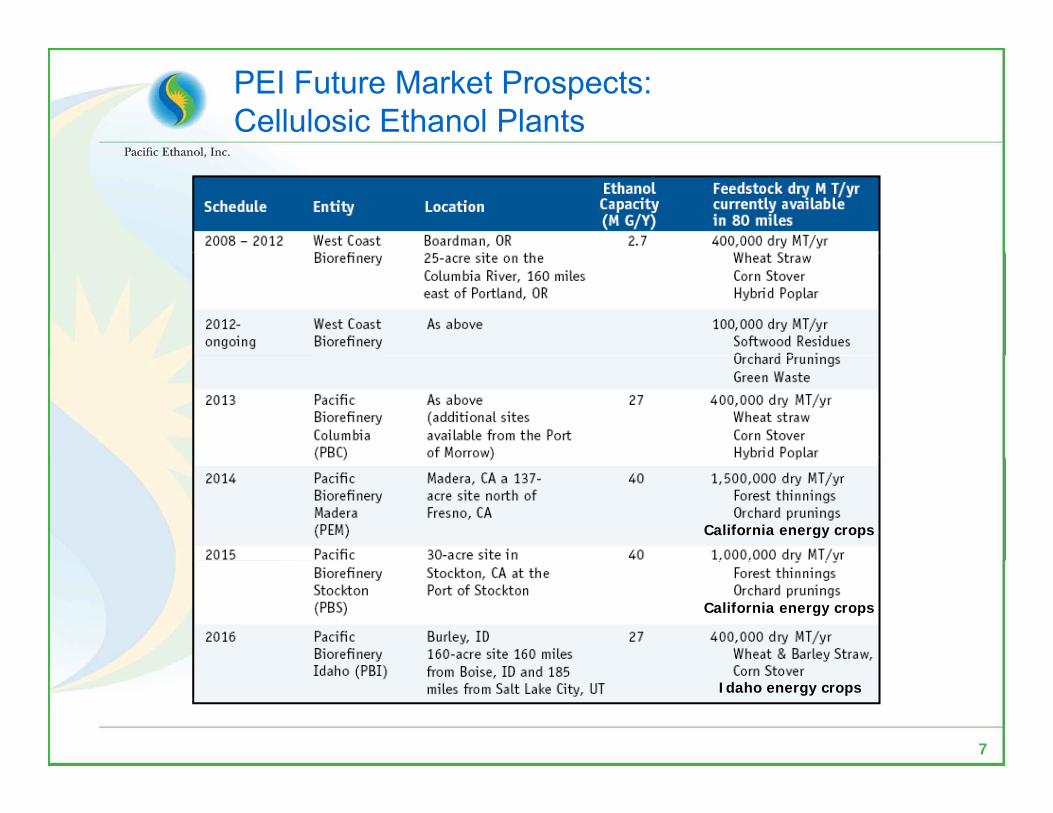
PEI Future Market Prospects: Cellulosic Ethanol Plants
California energy crops
California energy crops
7
Idaho energy crops
State Producer Incentive
Truly a performance based incentiveBuys lowest carbon in the country and begins transition to cellulosebegins transition to celluloseLCFS does not kick in until 2011Incentive can transition to cellulose after f ffirst year – remains performance based Many models out there – the simpler the better
8
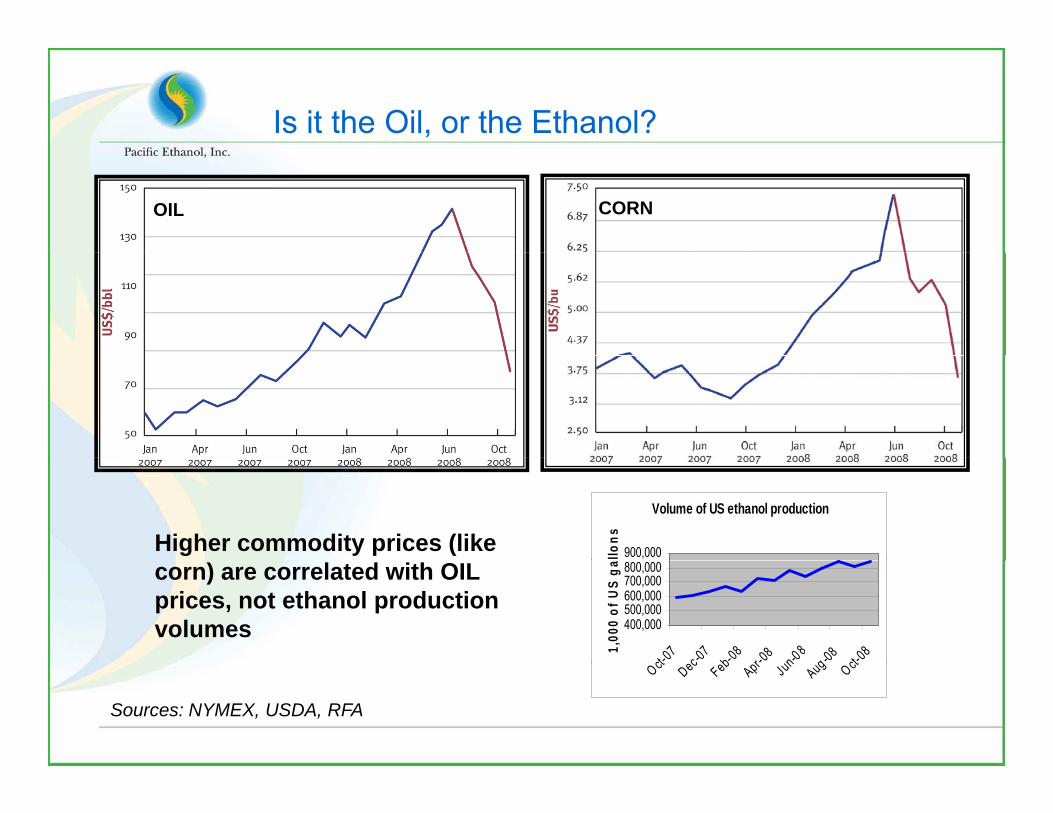
Is it the Oil, or the Ethanol?
OIL CORN
Volume of US ethanol production
900,000llonsHigher commodity prices (like
400,000500,000600,000700,000800,000
ct-07
ec-07b-08r-0
8n-0 8g -08ct-0
81,00
0 of
US
gacorn) are correlated with OIL prices, not ethanol production volumes
Sources: NYMEX, USDA, RFA
Oct DecFebApr JunAug Oct
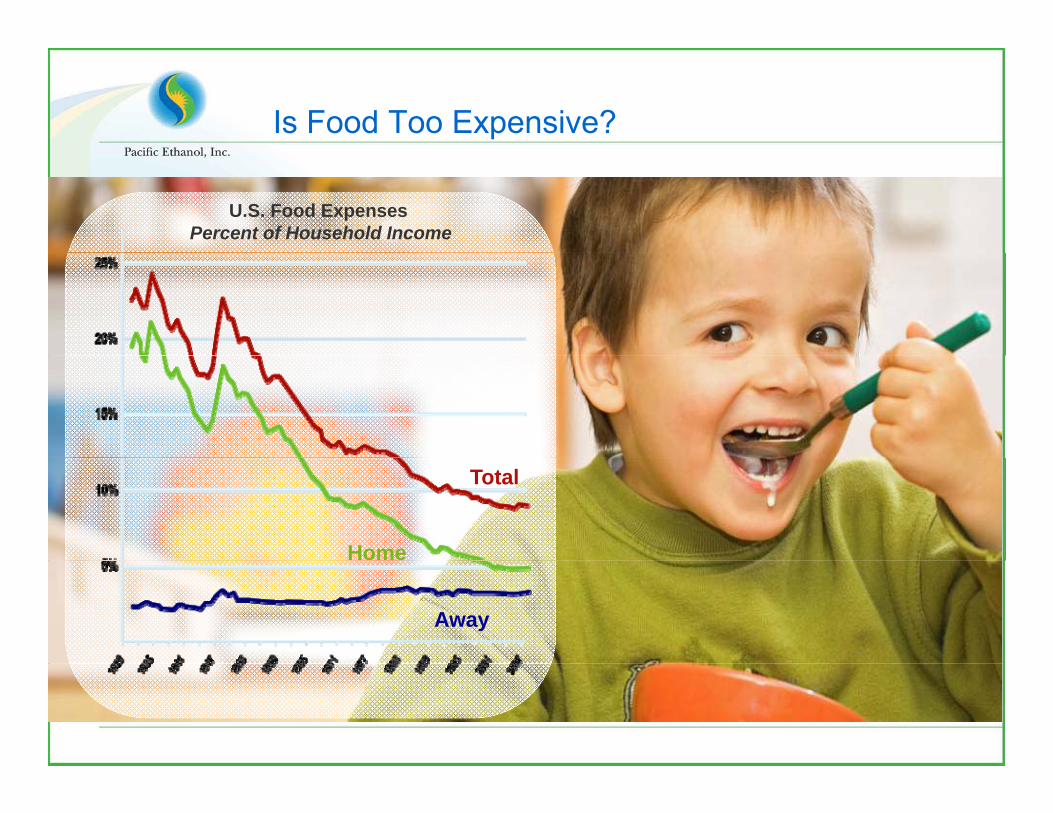
Is Food Too Expensive?
U.S. Food Expenses Percent of Household Income
Home
Total
Away
Source: USDA Economic Research Service
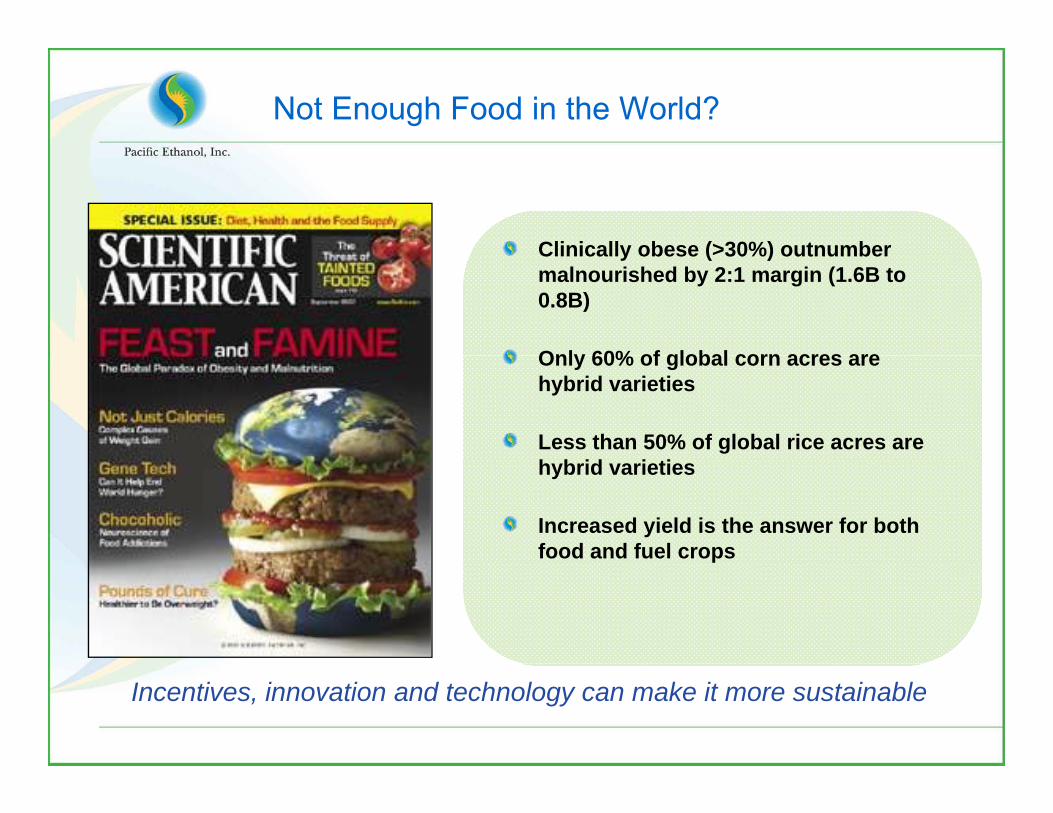
Not Enough Food in the World?
Clinically obese (>30%) outnumberClinically obese (>30%) outnumber malnourished by 2:1 margin (1.6B to 0.8B)
Only 60% of global corn acres areOnly 60% of global corn acres are hybrid varieties
Less than 50% of global rice acres are hybrid varieties
Increased yield is the answer for both food and fuel cropsp
Incentives, innovation and technology can make it more sustainable
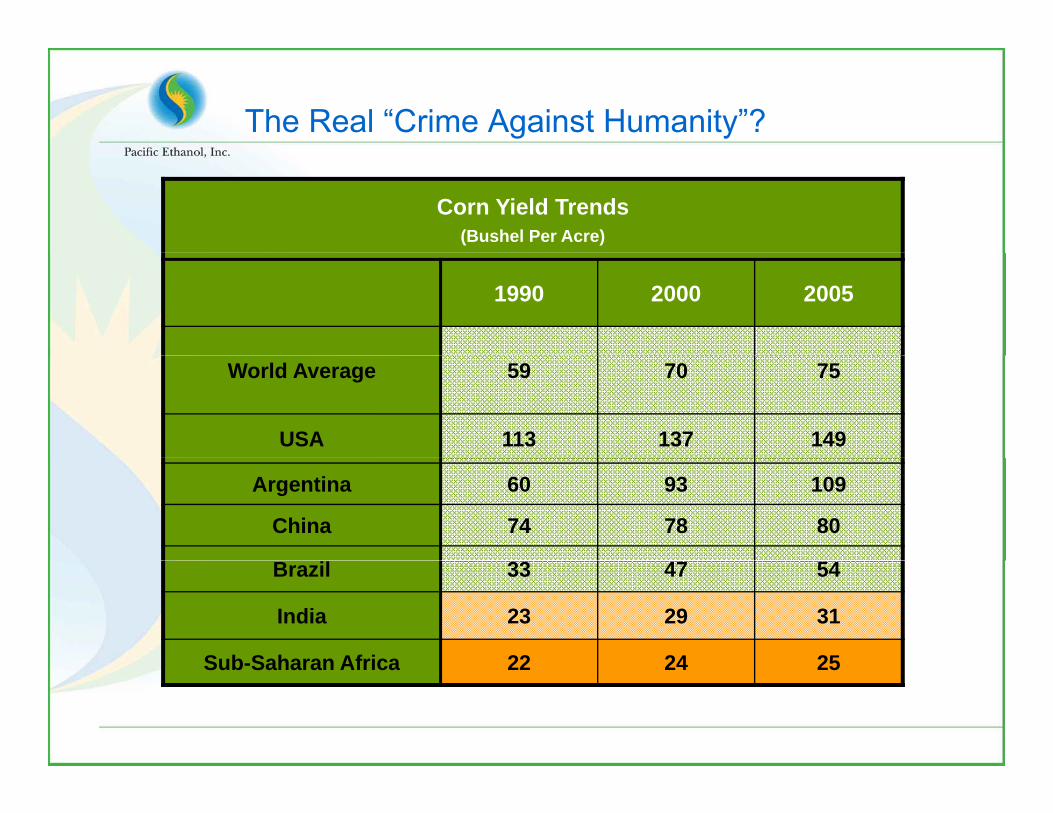
The Real “Crime Against Humanity”?
Corn Yield Trends(Bushel Per Acre)
1990 2000 2005
World Average 59 70 75
USA 113 137 149
Argentina 60 93 109
China 74 78 80
Brazil 33 47 54
India 23 29 31
Sub-Saharan Africa 22 24 25Sub-Saharan Africa 22 24 25
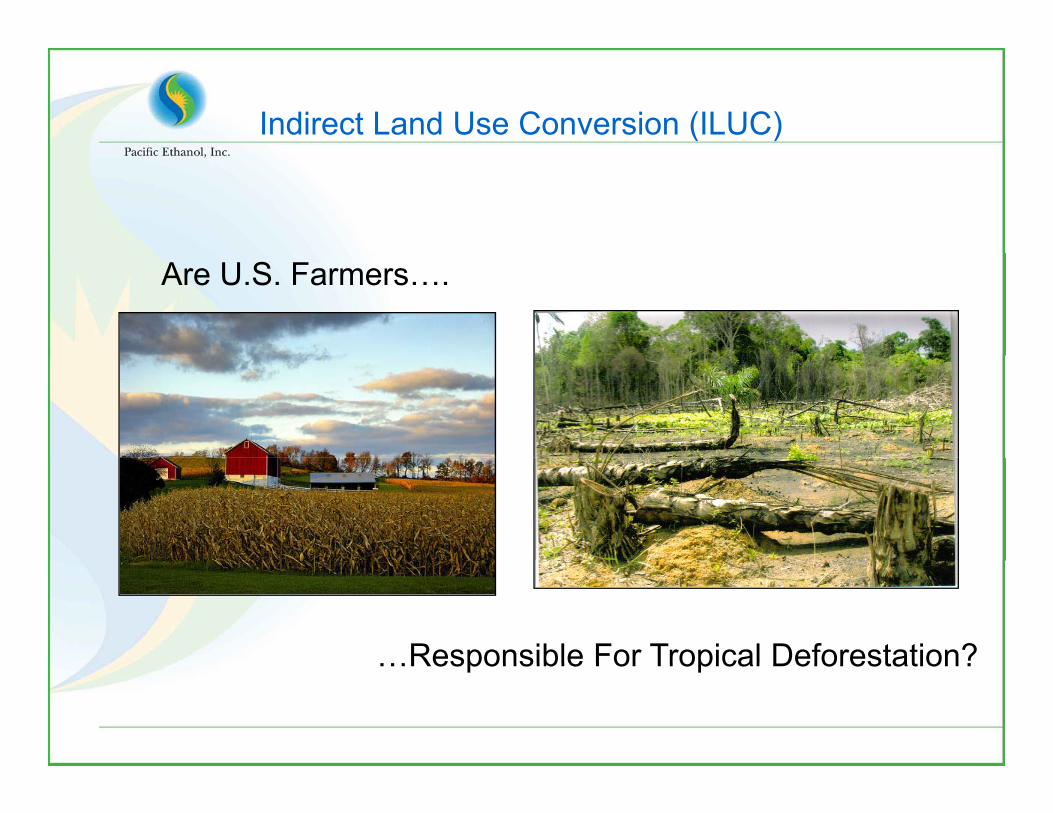
Indirect Land Use Conversion (ILUC)
Are U.S. Farmers….
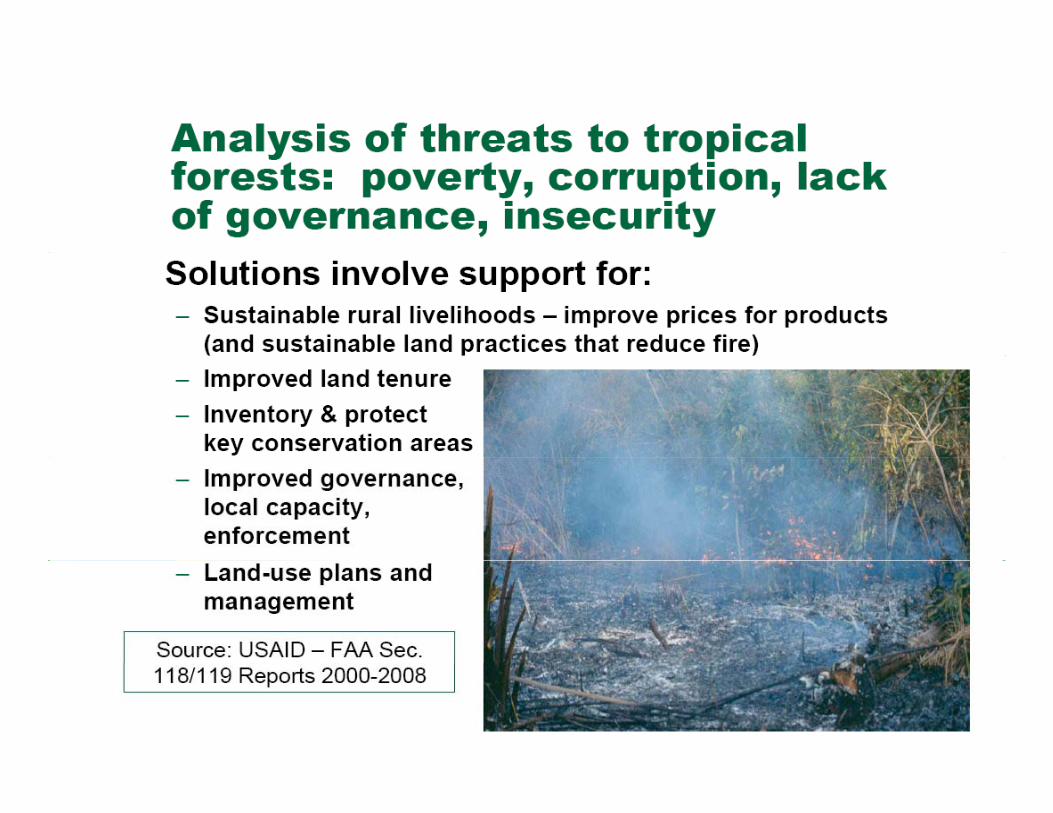
…Responsible For Tropical Deforestation?…Responsible For Tropical Deforestation?
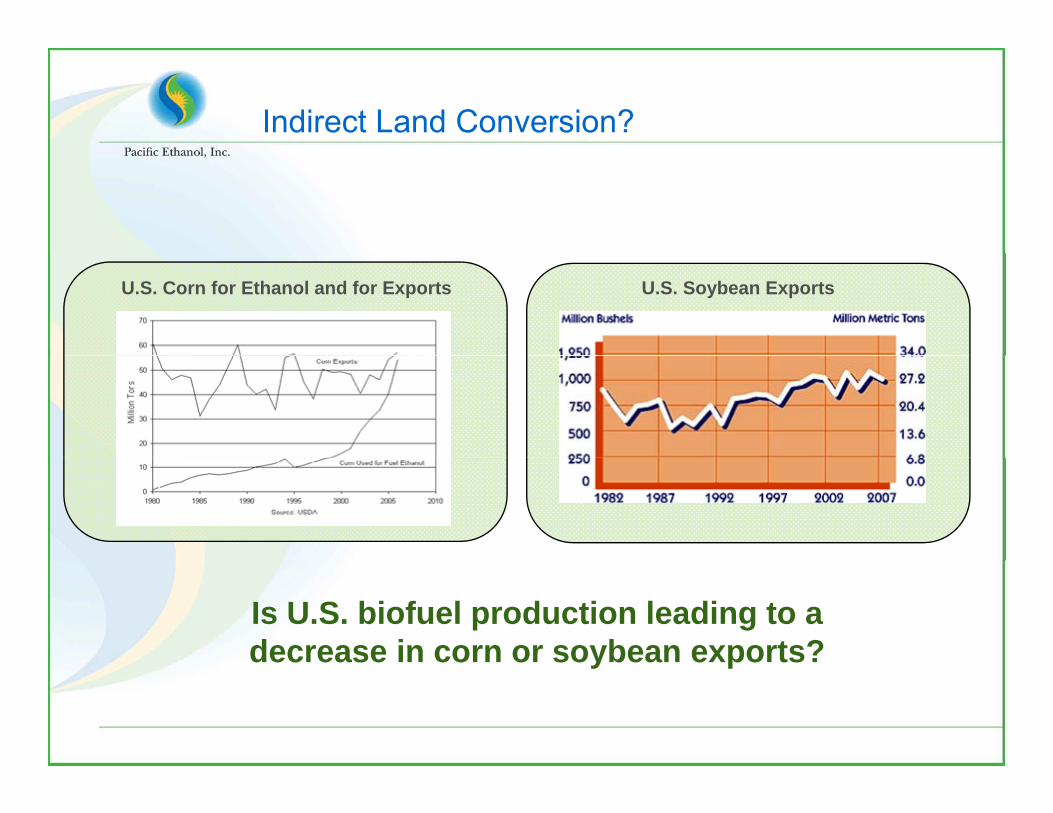
Indirect Land Conversion?
U.S. Soybean ExportsU.S. Corn for Ethanol and for Exports
Is U.S. biofuel production leading to a decrease in corn or soybean exports?y p
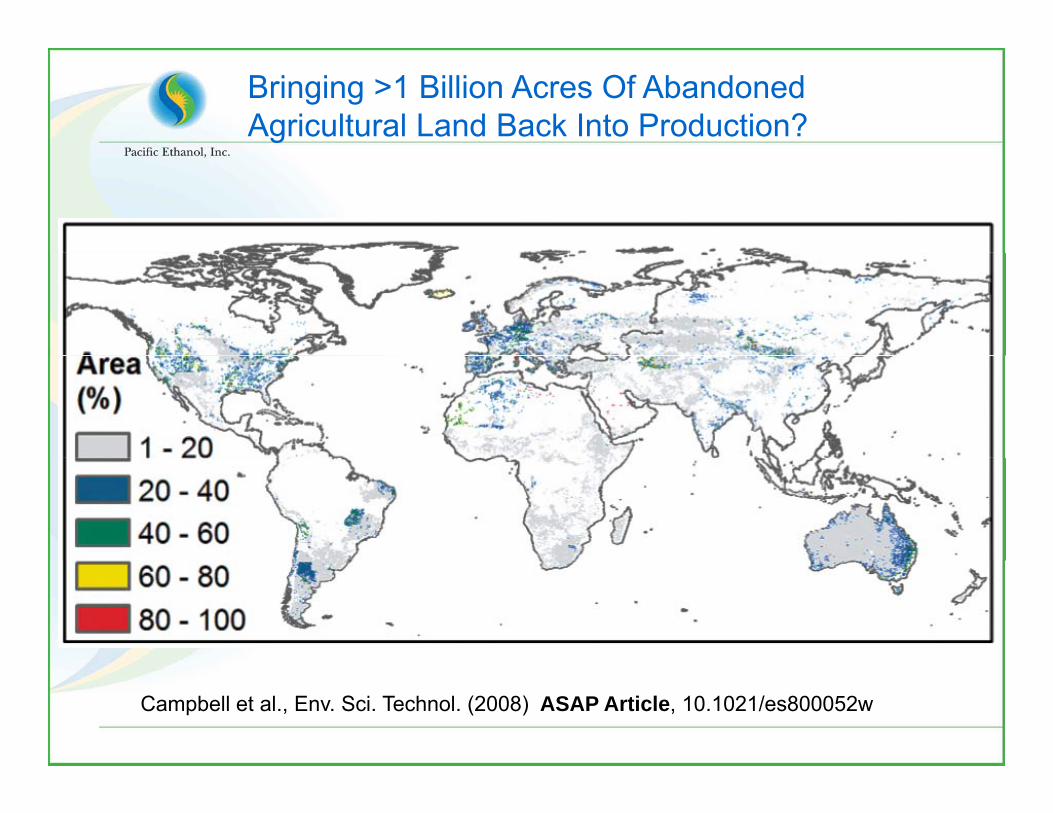
Bringing >1 Billion Acres Of Abandoned Agricultural Land Back Into Production?
Campbell et al., Env. Sci. Technol. (2008) ASAP Article, 10.1021/es800052w
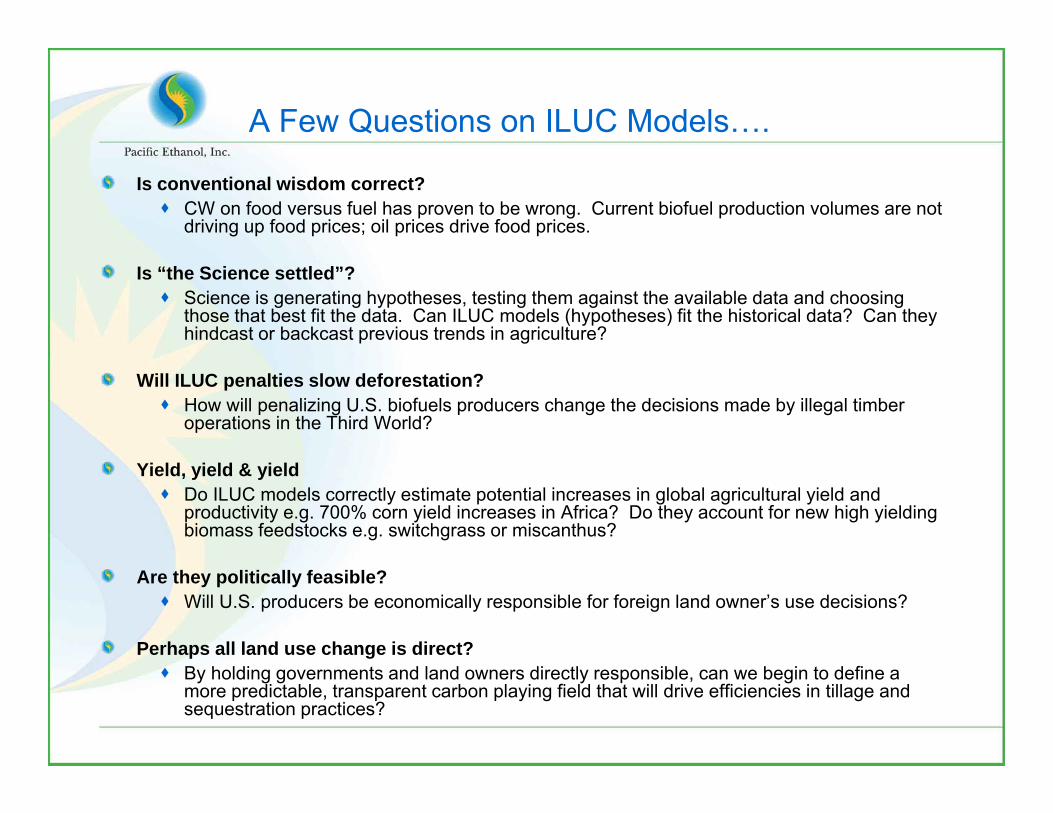
A Few Questions on ILUC Models….
Is conventional wisdom correct?CW on food versus fuel has proven to be wrong. Current biofuel production volumes are not driving up food prices; oil prices drive food prices.
Is “the Science settled”?Science is generating hypotheses, testing them against the available data and choosing those that best fit the data. Can ILUC models (hypotheses) fit the historical data? Can they hindcast or backcast previous trends in agriculture?
Will ILUC penalties slow deforestation?How will penalizing U.S. biofuels producers change the decisions made by illegal timber operations in the Third World?
Yield, yield & yieldDo ILUC models correctly estimate potential increases in global agricultural yield and productivity e.g. 700% corn yield increases in Africa? Do they account for new high yielding biomass feedstocks e.g. switchgrass or miscanthus?
Are they politically feasible?Will U.S. producers be economically responsible for foreign land owner’s use decisions?
Perhaps all land use change is direct?By holding governments and land owners directly responsible, can we begin to define a more predictable, transparent carbon playing field that will drive efficiencies in tillage and sequestration practices?

“For the great enemy of the truth is very often not the lie – deliberate, contrived and dishonest, but the myth, persistent, persuasive, unrealistic. We enjoy the comfort of opinion without the discomfort of thought.”
J h F K d- John F. Kennedy
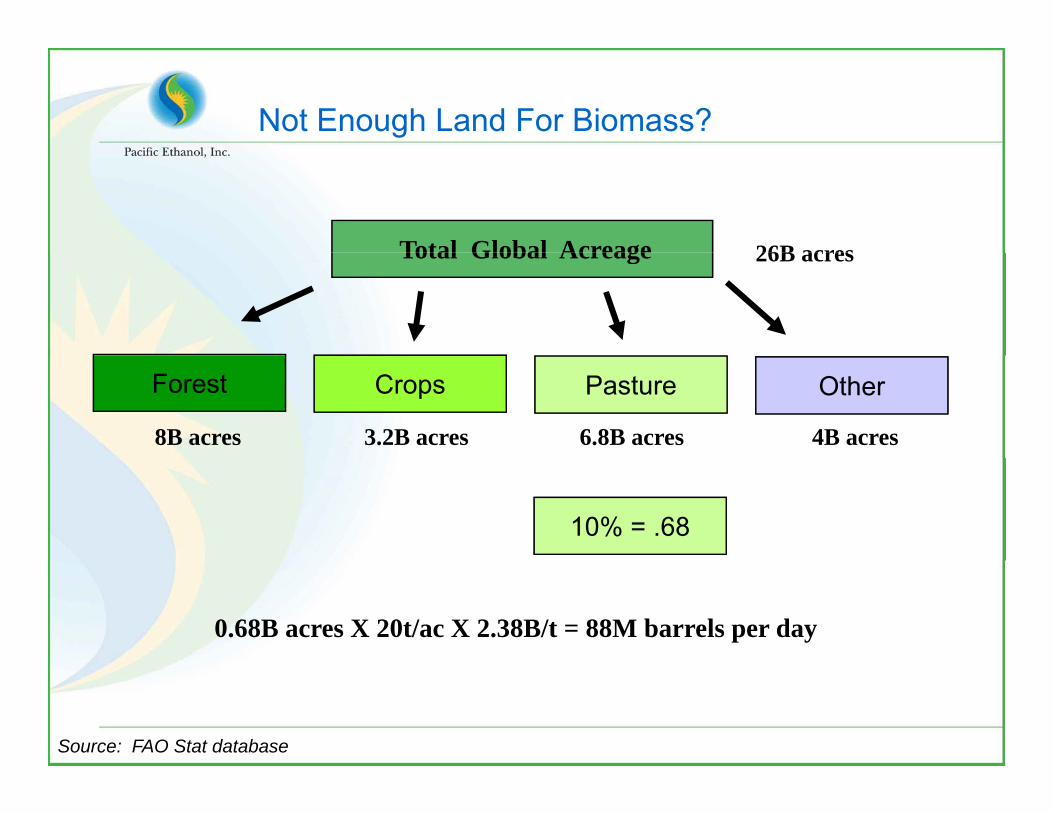
Not Enough Land For Biomass?
Total Global Acreage 26B acresTotal Global Acreage 26B acres
Forest Crops Pasture Other
8B acres 3.2B acres 6.8B acres 4B acres
10% = .68
0.68B acres X 20t/ac X 2.38B/t = 88M barrels per day
Source: FAO Stat database
Status of ARB Proceedings: Major Sins of Omission in Terms of
Analysis
A new study by Informa and Air Resources Inc. using a “top down” approach shows ZERO land use change with 15 billion gallons of corn ethanol. ARB staff has not responded to the new panalysis.
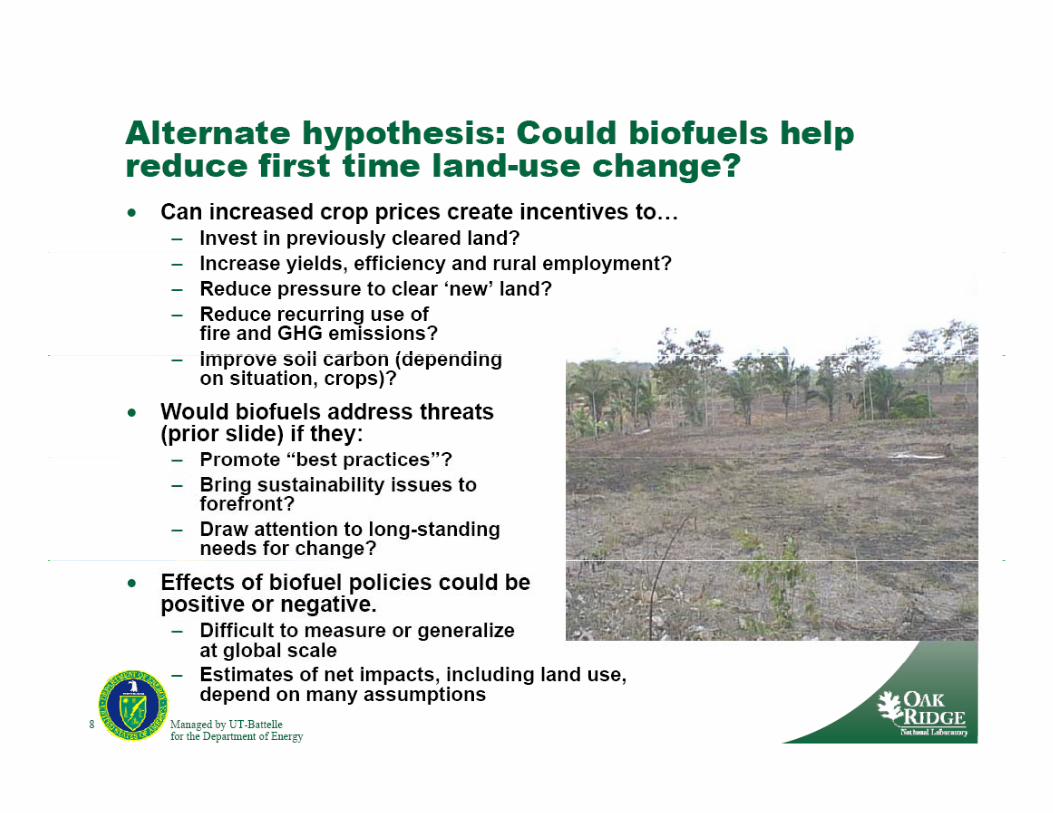
New Paper by Keith Kline (1/26/09) –
Expert on international development and land use change at Oak Ridge National Laboratory :
“Lack of evidence that biofuels are significant cause of indirect LUC.”
ARB staff has not responded to report. A t f k h f O k Rid trequest for a workshop for Oak Ridge to
present has been ignored.
Zero economic equilibrium modeling for Oil, Electricity, Natural gas, Hydrogen etc…
New study by LifeCycle and Associates (3/2/09) shows petroleum carbon score to be way too low, suggests many directbe way too low, suggests many direct effects are not included. Study concludes that indirect effects should and can be studied and analyzed ARB staff has notstudied and analyzed. ARB staff has not commented or incorporated into analysis.
111 nationally renowned scientists from the best laboratories and institutions (3/2/09):laboratories and institutions (3/2/09):“The science is far too limited and uncertain for regulatory enforcement.”
“Enforcing different compliance metrics against different fuels is the i l t f i ki i d l hi h i i di t fli t ithequivalent of picking winners and losers, which is in direct conflict with
the ambition of the LCFS.”
“We know very little about the indirect effects of the fuels, and therefore t t bli h l ti l th i licannot establish a proper relative value among the various compliance
fuels and petroleum under the LCFS.”

Issues with Staff-Proposed Regulation
Issue 1
2010 is “reporting only” – so refiners have no incentive to use lowest carbon fuels until 2011. This has significant negative impact on California facilities.
Issue 2
Science currently too controversial and nascent to regulate on indirect. No data to support modeling. Conflicting information, no backscasting to determine accuracy, no scientific y,consensus.
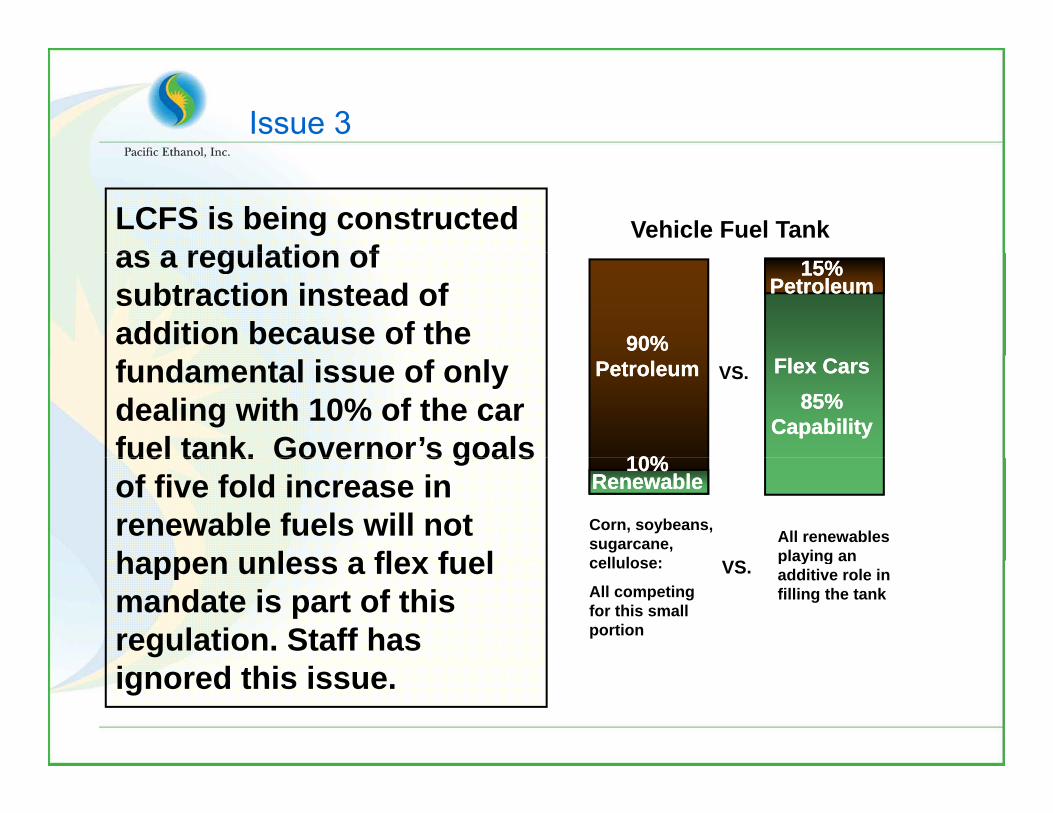
Issue 3
LCFS is being constructed as a regulation of
Vehicle Fuel Tankas a regulation of subtraction instead of addition because of the 90% 90%
15% 15% PetroleumPetroleum
fundamental issue of only dealing with 10% of the car fuel tank. Governor’s goals
PetroleumPetroleum Flex CarsFlex Cars85% 85%
CapabilityCapability
10%10%
VS.
fuel tank. Governor s goals of five fold increase in renewable fuels will not happen unless a flex fuel
10% 10% RenewableRenewable
Corn, soybeans, sugarcane, cellulose: VS
All renewables playing anhappen unless a flex fuel
mandate is part of this regulation. Staff has
cellulose:
All competing for this small portion
VS. playing an additive role in filling the tank
ignored this issue.
Issue 4
Schedule for LCFS is too anemic in first five years and does not incent refiners to use lowest carbon fuels.

Proposed SolutionsProposed Solutions
Proposed Solutions
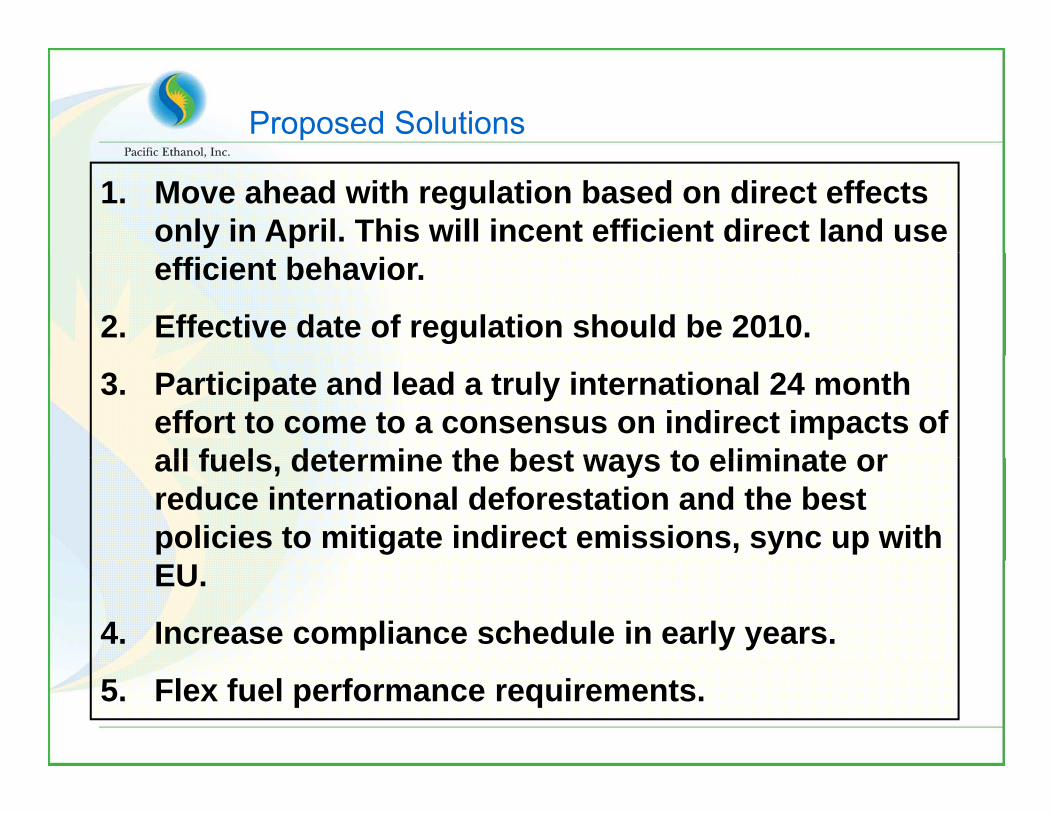
1. Move ahead with regulation based on direct effects only in April. This will incent efficient direct land use efficient behavior.
2. Effective date of regulation should be 2010.
3. Participate and lead a truly international 24 month effort to come to a consensus on indirect impacts of all fuels determine the best ways to eliminate orall fuels, determine the best ways to eliminate or reduce international deforestation and the best policies to mitigate indirect emissions, sync up with EU.
4. Increase compliance schedule in early years.
5. Flex fuel performance requirements.
Proposed Solutions
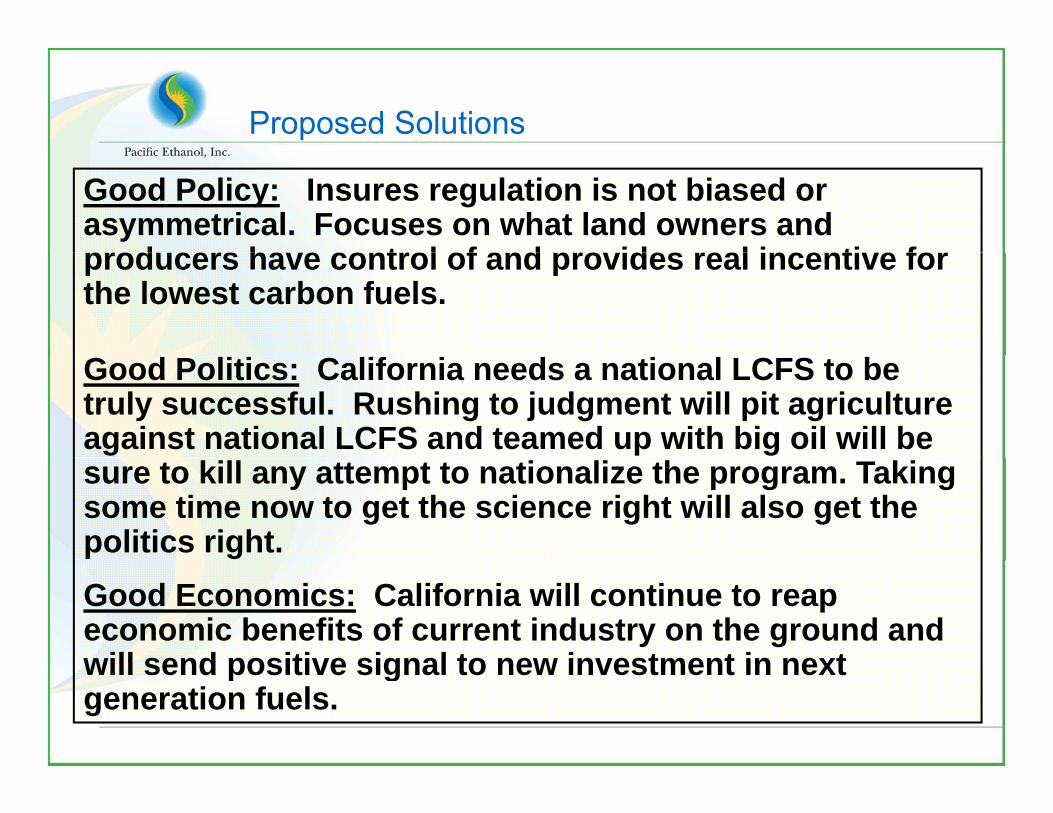
Good Policy: Insures regulation is not biased or asymmetrical. Focuses on what land owners and prod cers ha e control of and pro ides real incenti e forproducers have control of and provides real incentive for the lowest carbon fuels.
Good Politics: California needs a national LCFS to be truly successful. Rushing to judgment will pit agriculture against national LCFS and teamed up with big oil will be sure to kill any attempt to nationalize the program. Taking some time now to get the science right will also get the politics right.Good Economics: California will continue to reap economic benefits of current industry on the ground and will send positive signal to new investment in nextwill send positive signal to new investment in next generation fuels.

Visit our website: www.pacificethanol.net
3636