Embed Size (px)
Citation preview
California Energy Resources Scheduling
A Division of
California Department of Water Resources
Activities and Expenditures Report
Quarter Ended December 31, 2011
(Provides Data as Required by Section 80250 of the California Water Code )
2
Activities and Expenditures Report For The Year Ended December 31, 2011
Topic Page
Preface 3
Background and 2011 Activities
CERS History 4
Refunds 6
Long-Term Contracts Summary 7
Revenue Requirement 11
Bond Refunding Activities 13
Bonds Outstanding after Refunding 14
Financial Results for Calendar Year Ended December 31, 2011
Cash Balances at the End of Year 15
Revenues from Ratepayers of IOUs 16
Contract Energy Expenditures 17
Appropriated Costs for Fiscal Year 2012 18

3
Activities and Expenditures Report Preface
Pursuant to the reporting requirement in Section 80250 of the California Water Code, the following information reflects energy
acquisition activities and expenditures incurred by the California Energy Resources Scheduling Division (CERS) of the Department
of Water Resources (DWR) for calendar year 2011. Included are all costs related to energy acquisition and administration.
CERS purchases power under the terms of its existing contracts, all of which were entered into prior to January 1, 2003. The
scheduling, dispatch and certain other administrative functions for the existing contracts are managed by the investor owned utilities.
CERS continues to have financial and legal responsibility for its contract portfolio and will oversee repayment of the revenue bonds.
The audited financial statements for the fiscal years ended June 30, 2011 and 2010, and the un-audited financial statements for the quarter ended December 31, 2011, prepared in accordance with generally accepted accounting principles, can be referenced at the following link: http://www.cers.water.ca.gov/financial_bonds.cfm
This report is available on the DWR website at www.cers.water.ca.gov.
4
CERS History
Winter 2000-2001
Spot market prices skyrocket to $2,000 per megawatt hour (MWh) while averaging about $400 per MWh –
nearly 10 times the cost of power at the same time in the previous year.
Debt grows for California’s investor-owned utilities (IOUs) as purchased power costs exceed what they are
able to recoup from ratepayers. Suppliers refuse to sell to IOUs over credit concerns.
A number of generators go off-line resulting in statewide rotating blackouts.
Governor Issues Emergency Proclamation
On January 17, 2001, the Governor issues an Emergency Proclamation directing the DWR to purchase
power on behalf of the State’s IOU customers.
DWR creates a new division within DWR, CERS division, that immediately begins purchasing power.
During the summer of 2001 alone, CERS purchases 17,000 megawatts (MW) of electricity, enough power
to supply about 17 million homes and businesses. By the end of 2001, CERS spends nearly $11 billion to
keep the power flowing in California.
Long-Term Power Contracts
To reduce its daily exposure to the volatile spot energy market, CERS enters into various long-term
contracts to lock in more stable, predictable prices.
The contracts also result in an injection in new power supplies by providing a guaranteed revenue source
needed to finance more than 5,000 MW of newly built power plants. In total, DWR enters into 58 long-term
agreements in 2001 and 2002 at a cost of $42 billion.
5
CERS History – Cont.
Power Markets Stabilize - Reliability Restored
The average spot market price of electricity falls from $355 per MWh in January 2001 to $72 per MWh just
five months later. There are no power interruptions in the summers of 2001 or 2002.
CERS concludes its daily power purchases operation on December 31, 2002, successfully returning that
responsibility to the utilities who were able to improve their credit standing during DWR’s nearly two years as
California’s principal power buyer.
CERS Today
The utilities currently act as CERS’ agent in managing and dispatching the energy associated with the long-
term contracts. Absent full assignment of the contracts to the utilities, CERS fulfills its financial and legal
responsibilities for the contracts by auditing the utilities’ performance to ensure accurate billing and supplier
compliance with contract terms, as well as reviewing and approving utility gas supply plans and financial
hedging for those contracts with gas tolling arrangements.
CERS also services $7.7 billion in bonds. Initial bond proceeds of $11.3 billion in 2002 were used to repay
$6.5 billion to the General Fund, retire a $3.4 billion short-term loan, and to maintain adequate reserve levels.
CERS produces an annual Revenue Requirement – provided to the California Public Utilities Commission
(CPUC) – that specifies the contract and bond-related expenses that must be recovered from the utility
customers, and actively monitors and reports on its revenue flows and operating balances in compliance
with its financial duties related to the bonds.
6
Refunds
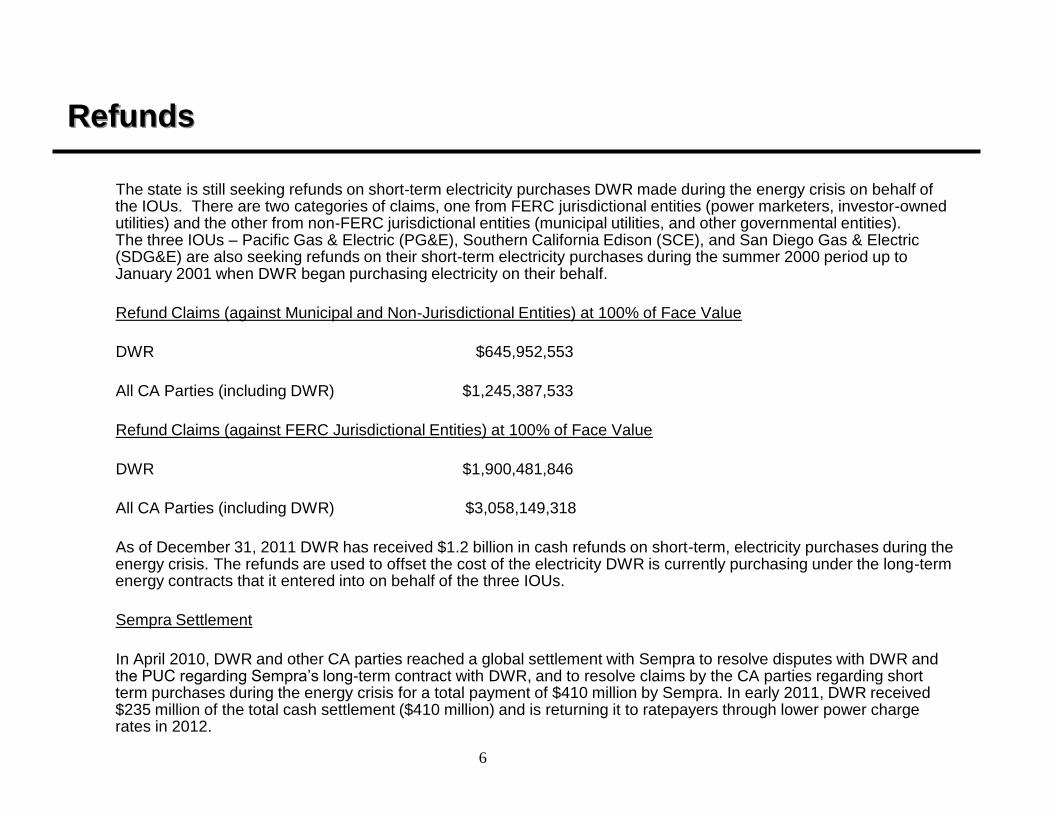
The state is still seeking refunds on short-term electricity purchases DWR made during the energy crisis on behalf of the IOUs. There are two categories of claims, one from FERC jurisdictional entities (power marketers, investor-owned utilities) and the other from non-FERC jurisdictional entities (municipal utilities, and other governmental entities). The three IOUs – Pacific Gas & Electric (PG&E), Southern California Edison (SCE), and San Diego Gas & Electric (SDG&E) are also seeking refunds on their short-term electricity purchases during the summer 2000 period up to January 2001 when DWR began purchasing electricity on their behalf.
Refund Claims (against Municipal and Non-Jurisdictional Entities) at 100% of Face Value
DWR $645,952,553
All CA Parties (including DWR) $1,245,387,533
Refund Claims (against FERC Jurisdictional Entities) at 100% of Face Value
DWR $1,900,481,846
All CA Parties (including DWR) $3,058,149,318
As of December 31, 2011 DWR has received $1.2 billion in cash refunds on short-term, electricity purchases during the energy crisis. The refunds are used to offset the cost of the electricity DWR is currently purchasing under the long-term energy contracts that it entered into on behalf of the three IOUs.
Sempra Settlement
In April 2010, DWR and other CA parties reached a global settlement with Sempra to resolve disputes with DWR and the PUC regarding Sempra’s long-term contract with DWR, and to resolve claims by the CA parties regarding short term purchases during the energy crisis for a total payment of $410 million by Sempra. In early 2011, DWR received $235 million of the total cash settlement ($410 million) and is returning it to ratepayers through lower power charge rates in 2012.
7
Long-Term Contracts Summary
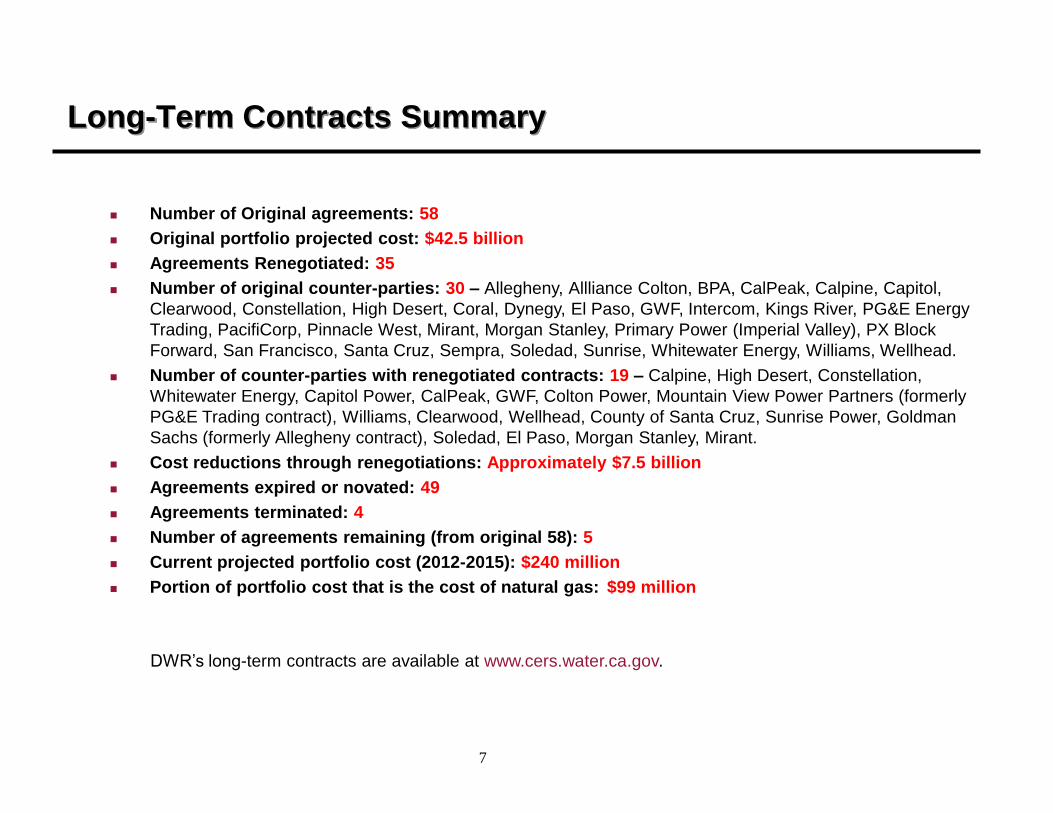
Number of Original agreements: 58
Original portfolio projected cost: $42.5 billion
Agreements Renegotiated: 35
Number of original counter-parties: 30 – Allegheny, Allliance Colton, BPA, CalPeak, Calpine, Capitol,
Clearwood, Constellation, High Desert, Coral, Dynegy, El Paso, GWF, Intercom, Kings River, PG&E Energy
Trading, PacifiCorp, Pinnacle West, Mirant, Morgan Stanley, Primary Power (Imperial Valley), PX Block
Forward, San Francisco, Santa Cruz, Sempra, Soledad, Sunrise, Whitewater Energy, Williams, Wellhead.
Number of counter-parties with renegotiated contracts: 19 – Calpine, High Desert, Constellation,
Whitewater Energy, Capitol Power, CalPeak, GWF, Colton Power, Mountain View Power Partners (formerly
PG&E Trading contract), Williams, Clearwood, Wellhead, County of Santa Cruz, Sunrise Power, Goldman
Sachs (formerly Allegheny contract), Soledad, El Paso, Morgan Stanley, Mirant.
Cost reductions through renegotiations: Approximately $7.5 billion
Agreements expired or novated: 49
Agreements terminated: 4
Number of agreements remaining (from original 58): 5
Current projected portfolio cost (2012-2015): $240 million
Portion of portfolio cost that is the cost of natural gas: $99 million
DWR’s long-term contracts are available at www.cers.water.ca.gov.
8
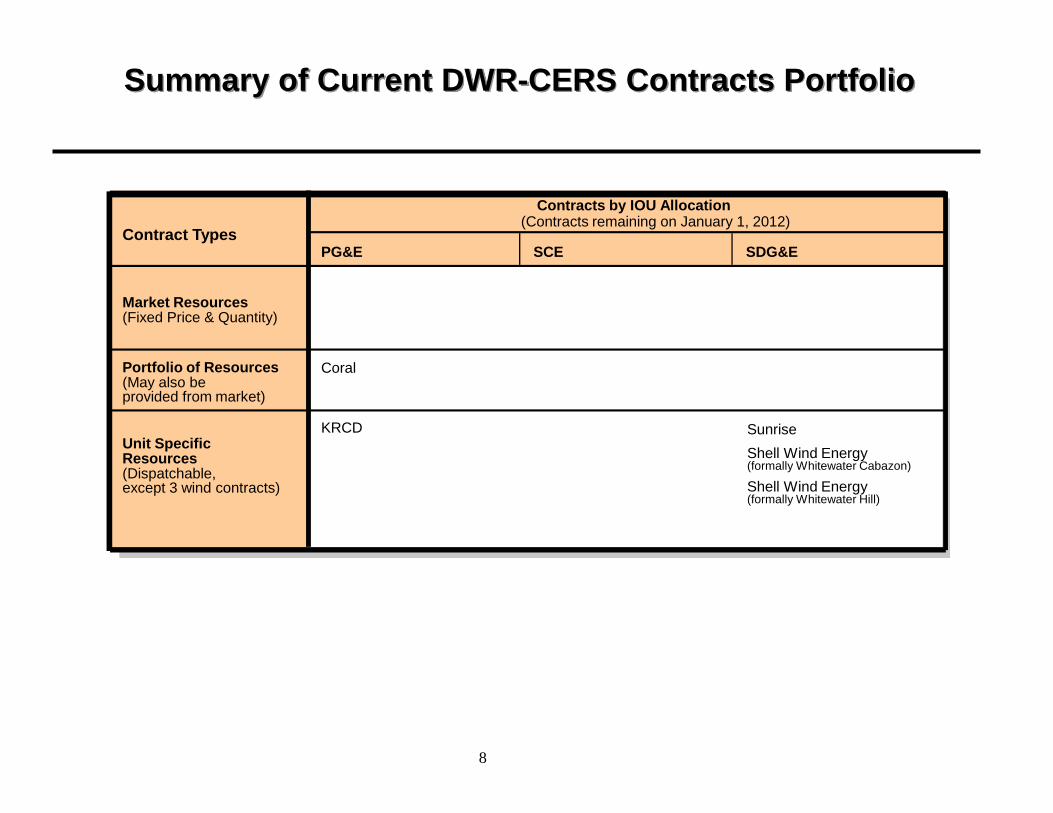
Summary of Current DWR-CERS Contracts Portfolio
PG&E SCE SDG&E
Coral
Sunrise
Shell Wind Energy (formally Whitewater Cabazon)
Shell Wind Energy (formally Whitewater Hill)
KRCD Unit Specific Resources (Dispatchable, except 3 wind contracts)
Contracts by IOU Allocation (Contracts remaining on January 1, 2012)
Contract Types
Market Resources (Fixed Price & Quantity)
Portfolio of Resources (May also be provided from market)
9
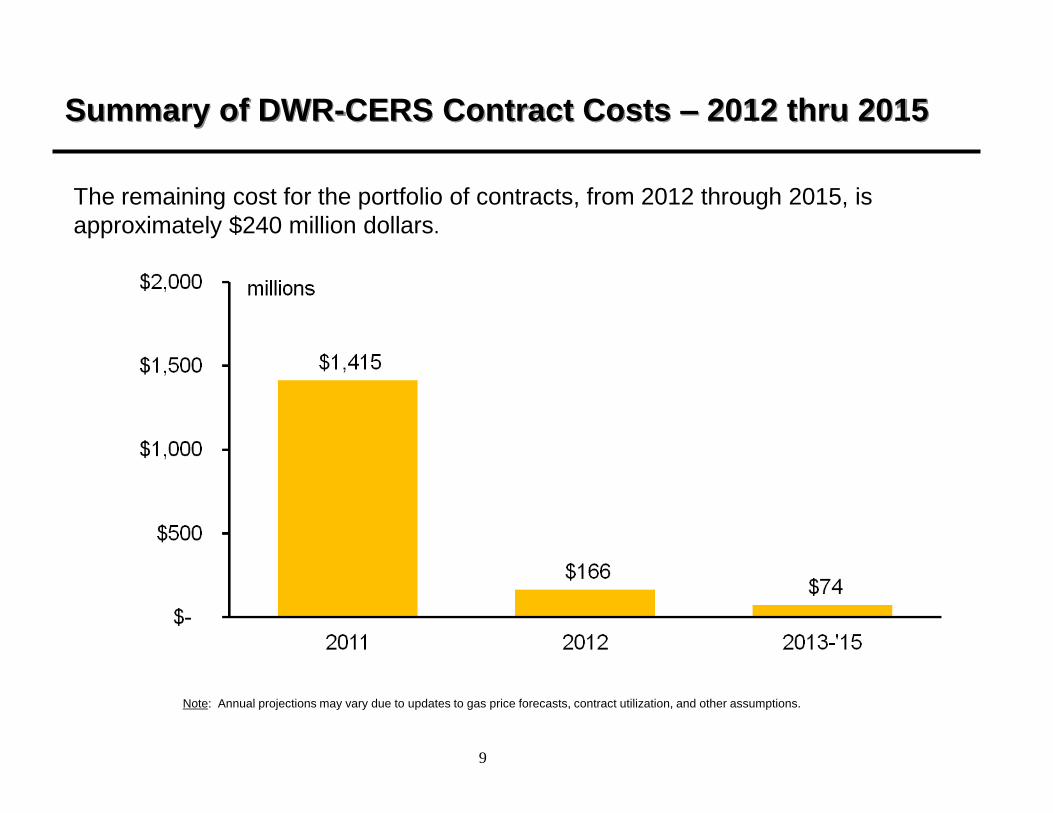
The remaining cost for the portfolio of contracts, from 2012 through 2015, is
approximately $240 million dollars.
Note: Annual projections may vary due to updates to gas price forecasts, contract utilization, and other assumptions.
Summary of DWR-CERS Contract Costs – 2012 thru 2015
10
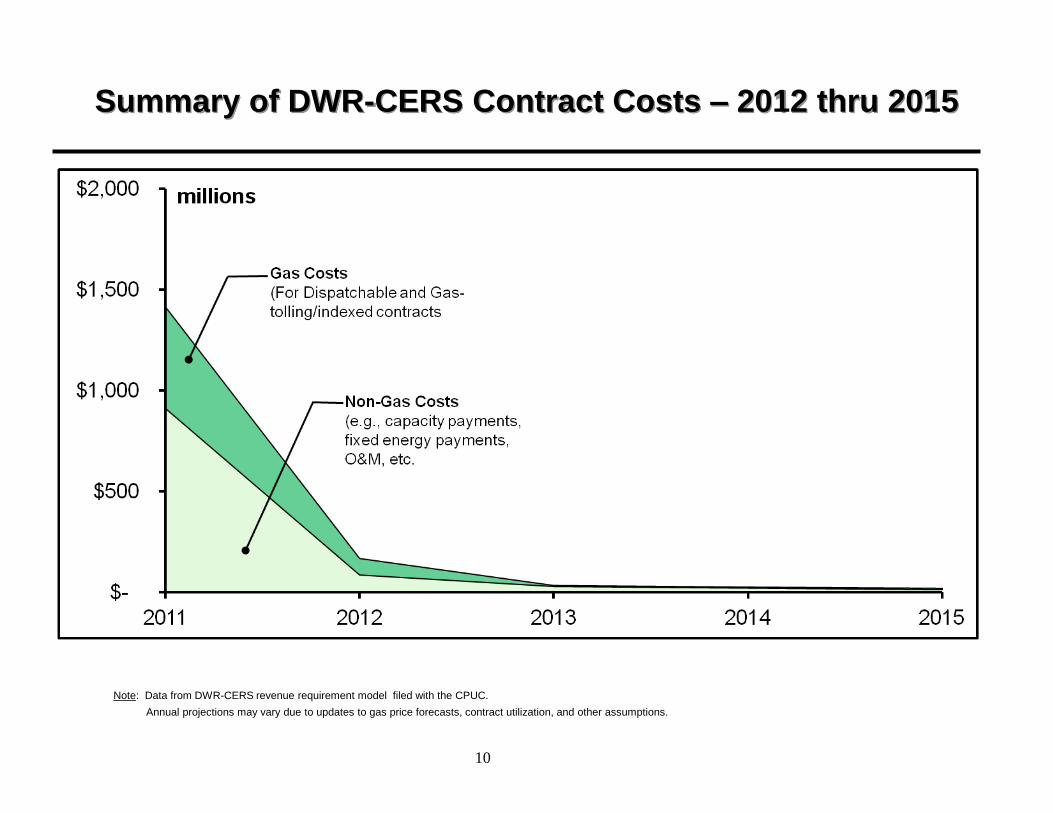
Note: Data from DWR-CERS revenue requirement model filed with the CPUC.
Annual projections may vary due to updates to gas price forecasts, contract utilization, and other assumptions.
Summary of DWR-CERS Contract Costs – 2012 thru 2015
11
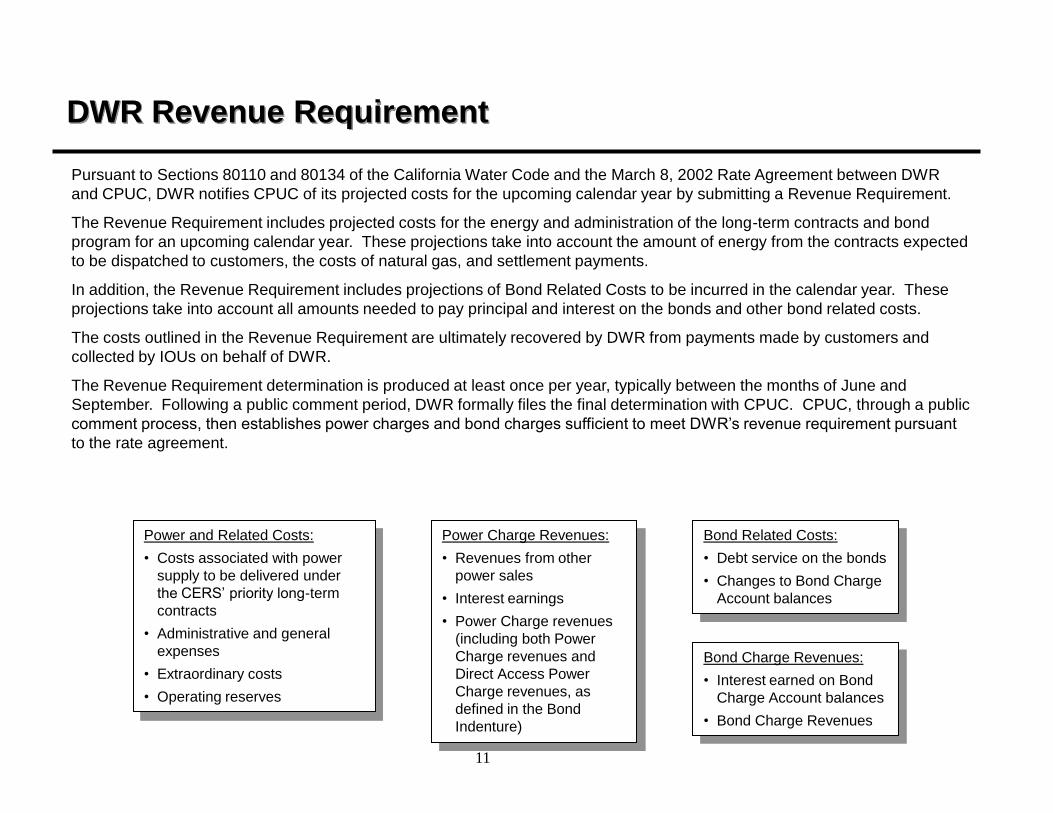
DWR Revenue Requirement
Pursuant to Sections 80110 and 80134 of the California Water Code and the March 8, 2002 Rate Agreement between DWR
and CPUC, DWR notifies CPUC of its projected costs for the upcoming calendar year by submitting a Revenue Requirement.
The Revenue Requirement includes projected costs for the energy and administration of the long-term contracts and bond
program for an upcoming calendar year. These projections take into account the amount of energy from the contracts expected
to be dispatched to customers, the costs of natural gas, and settlement payments.
In addition, the Revenue Requirement includes projections of Bond Related Costs to be incurred in the calendar year. These
projections take into account all amounts needed to pay principal and interest on the bonds and other bond related costs.
The costs outlined in the Revenue Requirement are ultimately recovered by DWR from payments made by customers and
collected by IOUs on behalf of DWR.
The Revenue Requirement determination is produced at least once per year, typically between the months of June and
September. Following a public comment period, DWR formally files the final determination with CPUC. CPUC, through a public
comment process, then establishes power charges and bond charges sufficient to meet DWR’s revenue requirement pursuant
to the rate agreement.
Power and Related Costs:
• Costs associated with power
supply to be delivered under
the CERS’ priority long-term
contracts
• Administrative and general
expenses
• Extraordinary costs
• Operating reserves
Power Charge Revenues:
• Revenues from other
power sales
• Interest earnings
• Power Charge revenues
(including both Power
Charge revenues and
Direct Access Power
Charge revenues, as
defined in the Bond
Indenture)
Bond Related Costs:
• Debt service on the bonds
• Changes to Bond Charge
Account balances
Bond Charge Revenues:
• Interest earned on Bond
Charge Account balances
• Bond Charge Revenues

12
Revenue Requirement – continued
2012 Revenue Requirement
DWR’s 2012 Revenue Requirement was released for public review and comment on August 4, 2011. DWR finalized its 2011 Revenue Requirement and submitted it to the CPUC on October 27, 2011.
DWR total Revenue Requirement for 2012 is $923 million consisting of $71 million for power charges and $852 million for bond charges.
Power charges required for 2012 are $438 million lower than 2011, as a result of declining power costs from the expiration of long term contracts and lower forecasted gas prices. These reduced power costs will allow DWR to return excess reserves of $883 million to ratepayers through lower rates in 2012.
Power charge rates are forecasted to be $58 per MWh in 2012, up from $23 per MWh in 2011. However, overall power charges are lower because the 2012 rate does not include the impact of the return to the IOUs of $693 million in excess reserves.
Bond charge rates are forecasted to be $5/MWh, similar to prior years as the Power Fund has a level debt service and amortization schedule as part of its financing structure.
The CPUC approved the 2012 Revenue Requirement during its December 1, 2011 meeting and implemented new rates on January 1, 2012.
DWR’s Revenue Requirement filings are available at www.cers.water.ca.gov.
13
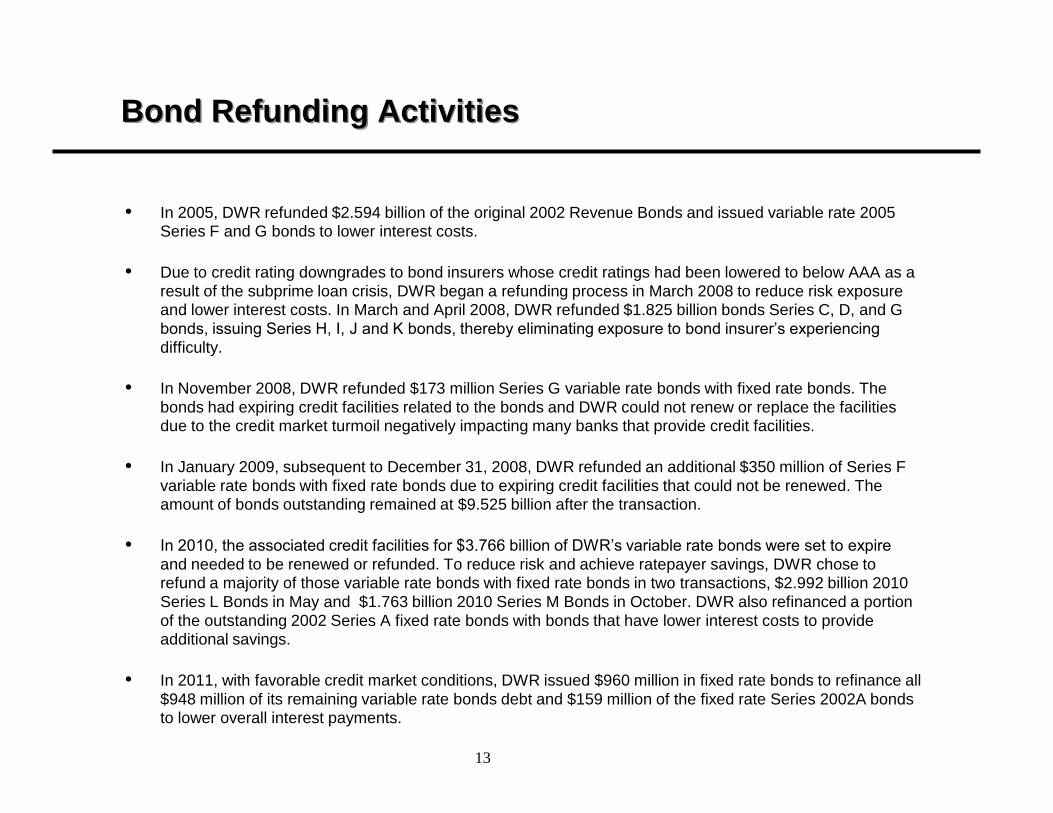
Bond Refunding Activities
In 2005, DWR refunded $2.594 billion of the original 2002 Revenue Bonds and issued variable rate 2005 Series F and G bonds to lower interest costs.
Due to credit rating downgrades to bond insurers whose credit ratings had been lowered to below AAA as a
result of the subprime loan crisis, DWR began a refunding process in March 2008 to reduce risk exposure and lower interest costs. In March and April 2008, DWR refunded $1.825 billion bonds Series C, D, and G
bonds, issuing Series H, I, J and K bonds, thereby eliminating exposure to bond insurer’s experiencing
difficulty.
In November 2008, DWR refunded $173 million Series G variable rate bonds with fixed rate bonds. The
bonds had expiring credit facilities related to the bonds and DWR could not renew or replace the facilities due to the credit market turmoil negatively impacting many banks that provide credit facilities.
In January 2009, subsequent to December 31, 2008, DWR refunded an additional $350 million of Series F
variable rate bonds with fixed rate bonds due to expiring credit facilities that could not be renewed. The amount of bonds outstanding remained at $9.525 billion after the transaction.
In 2010, the associated credit facilities for $3.766 billion of DWR’s variable rate bonds were set to expire
and needed to be renewed or refunded. To reduce risk and achieve ratepayer savings, DWR chose to refund a majority of those variable rate bonds with fixed rate bonds in two transactions, $2.992 billion 2010
Series L Bonds in May and $1.763 billion 2010 Series M Bonds in October. DWR also refinanced a portion
of the outstanding 2002 Series A fixed rate bonds with bonds that have lower interest costs to provide additional savings.
In 2011, with favorable credit market conditions, DWR issued $960 million in fixed rate bonds to refinance all
$948 million of its remaining variable rate bonds debt and $159 million of the fixed rate Series 2002A bonds to lower overall interest payments.
14
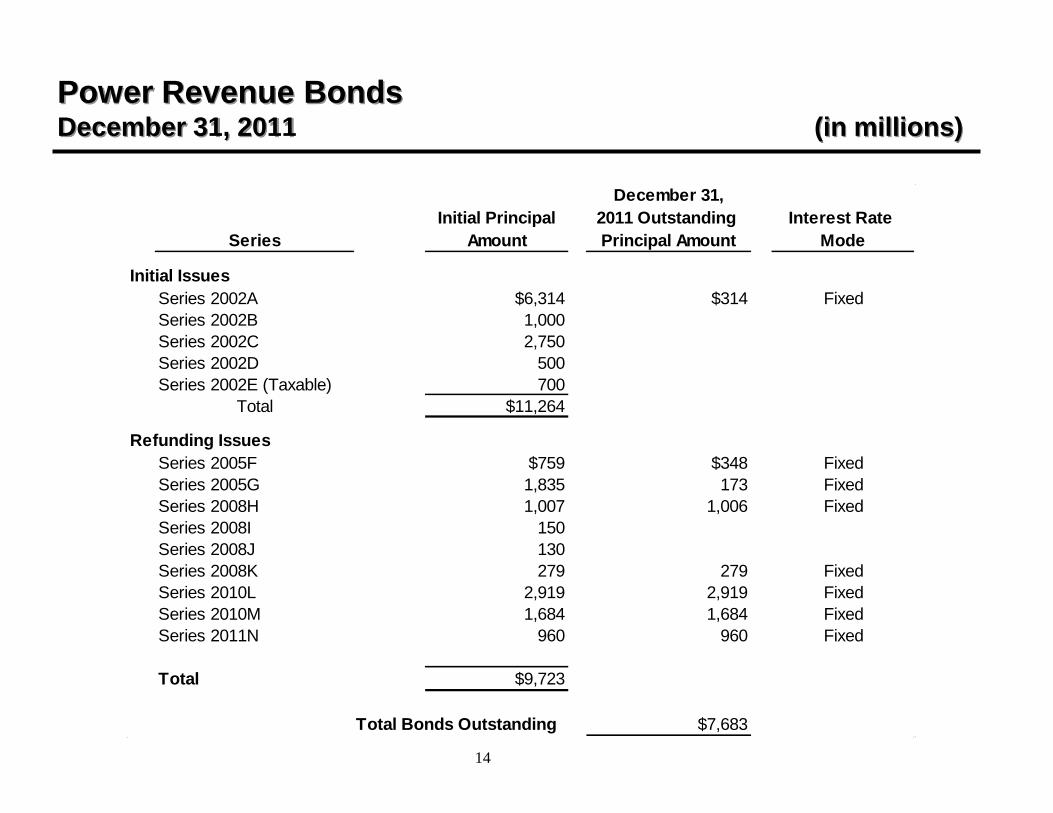
Power Revenue Bonds December 31, 2011 (in millions)
Series
Initial Principal
Amount
December 31,
2011 Outstanding
Principal Amount
Interest Rate
Mode
Initial Issues
Series 2002A $6,314 $314 Fixed
Series 2002B 1,000
Series 2002C 2,750
Series 2002D 500
Series 2002E (Taxable) 700
Total $11,264
Refunding Issues
Series 2005F $759 $348 Fixed
Series 2005G 1,835 173 Fixed
Series 2008H 1,007 1,006 Fixed
Series 2008I 150
Series 2008J 130
Series 2008K 279 279 Fixed
Series 2010L 2,919 2,919 Fixed
Series 2010M 1,684 1,684 Fixed
Series 2011N 960 960 Fixed
Total $9,723
Total Bonds Outstanding $7,683
15
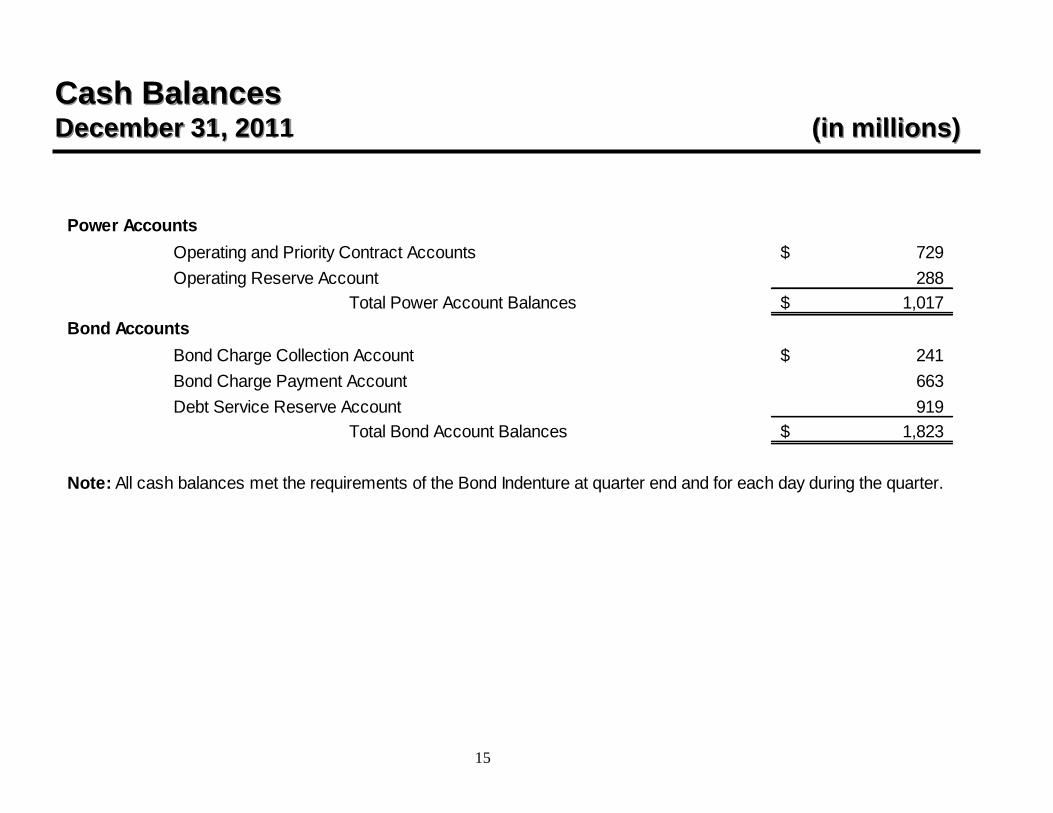
Cash Balances December 31, 2011 (in millions)
Power Accounts
Operating and Priority Contract Accounts 729$
Operating Reserve Account 288
Total Power Account Balances 1,017$
Bond Accounts
Bond Charge Collection Account 241$
Bond Charge Payment Account 663
Debt Service Reserve Account 919
Total Bond Account Balances 1,823$
Note: All cash balances met the requirements of the Bond Indenture at quarter end and for each day during the quarter.
16
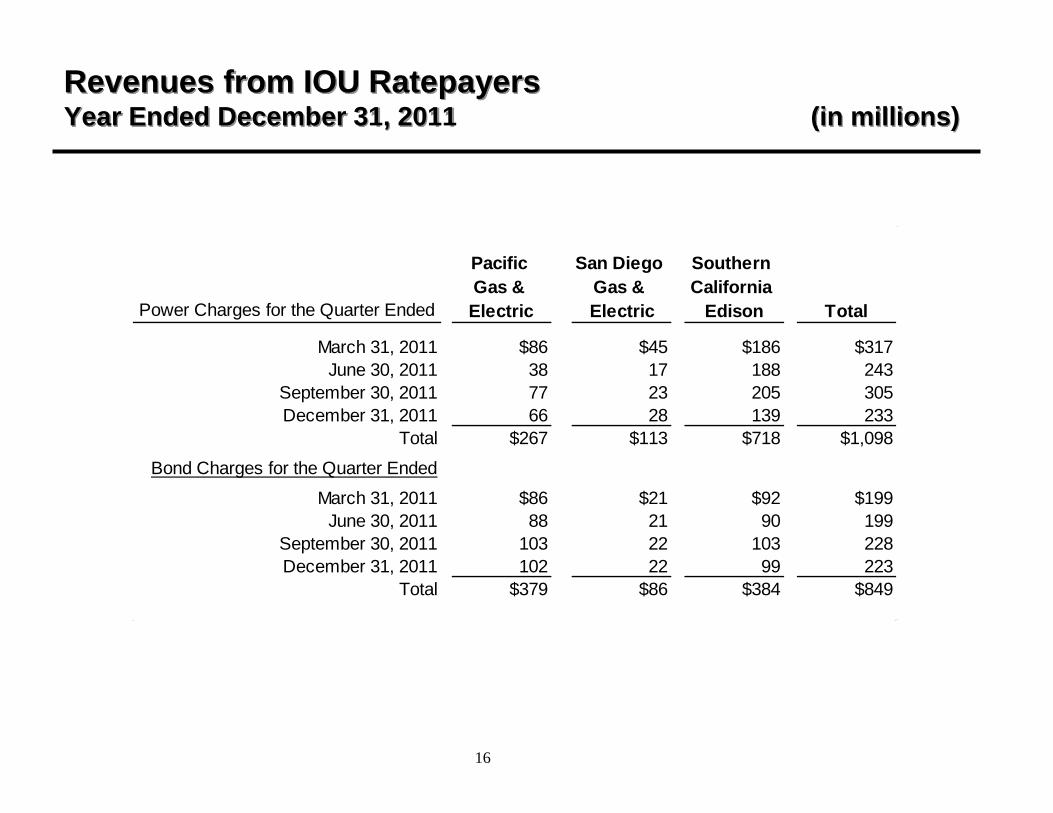
Revenues from IOU Ratepayers Year Ended December 31, 2011 (in millions)
Power Charges for the Quarter Ended
Pacific
Gas &
Electric
San Diego
Gas &
Electric
Southern
California
Edison Total
March 31, 2011 $86 $45 $186 $317
June 30, 2011 38 17 188 243
September 30, 2011 77 23 205 305
December 31, 2011 66 28 139 233
Total $267 $113 $718 $1,098
Bond Charges for the Quarter Ended
March 31, 2011 $86 $21 $92 $199
June 30, 2011 88 21 90 199
September 30, 2011 103 22 103 228
December 31, 2011 102 22 99 223
Total $379 $86 $384 $849
17
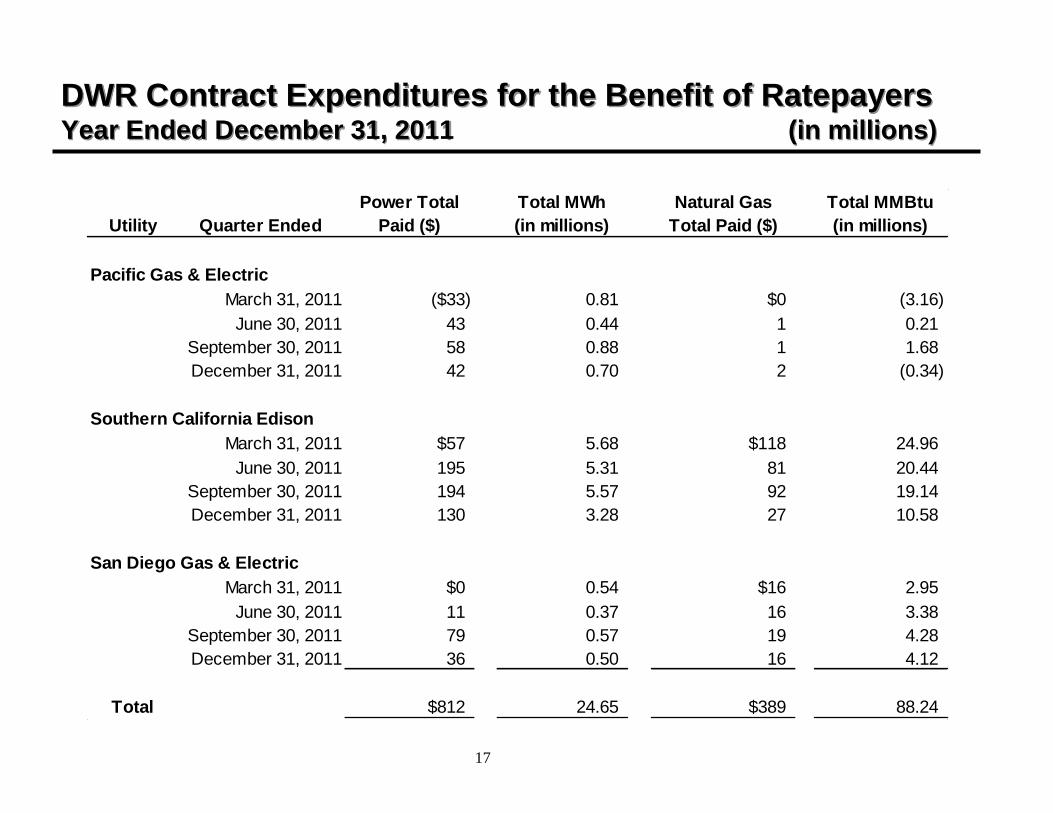
DWR Contract Expenditures for the Benefit of Ratepayers Year Ended December 31, 2011 (in millions)
Utility Quarter Ended
Power Total
Paid ($)
Total MWh
(in millions)
Natural Gas
Total Paid ($)
Total MMBtu
(in millions)
Pacific Gas & Electric
March 31, 2011 ($33) 0.81 $0 (3.16)
June 30, 2011 43 0.44 1 0.21
September 30, 2011 58 0.88 1 1.68
December 31, 2011 42 0.70 2 (0.34)
Southern California Edison
March 31, 2011 $57 5.68 $118 24.96
June 30, 2011 195 5.31 81 20.44
September 30, 2011 194 5.57 92 19.14
December 31, 2011 130 3.28 27 10.58
San Diego Gas & Electric
March 31, 2011 $0 0.54 $16 2.95
June 30, 2011 11 0.37 16 3.38
September 30, 2011 79 0.57 19 4.28
December 31, 2011 36 0.50 16 4.12
Total $812 24.65 $389 88.24
18
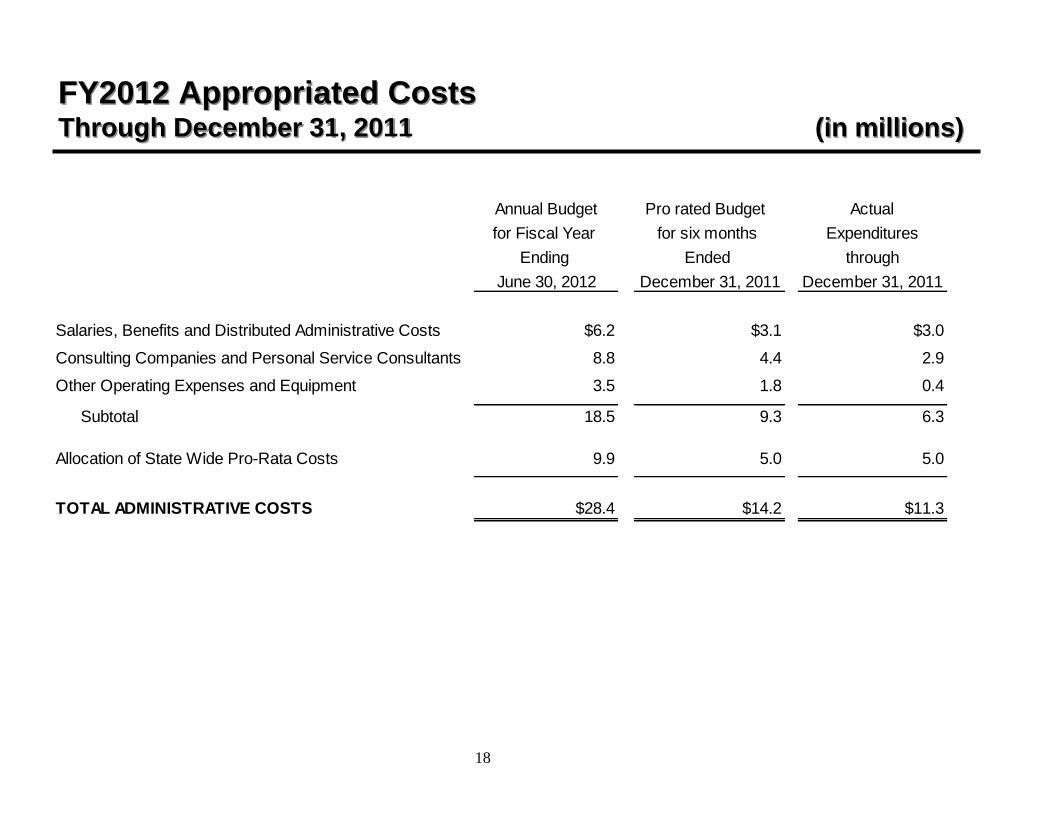
FY2012 Appropriated Costs Through December 31, 2011 (in millions)
Annual Budget Pro rated Budget Actual
for Fiscal Year for six months Expenditures
Ending Ended through
June 30, 2012 December 31, 2011 December 31, 2011
Salaries, Benefits and Distributed Administrative Costs $6.2 $3.1 $3.0
Consulting Companies and Personal Service Consultants 8.8 4.4 2.9
Other Operating Expenses and Equipment 3.5 1.8 0.4
Subtotal 18.5 9.3 6.3
Allocation of State Wide Pro-Rata Costs 9.9 5.0 5.0
TOTAL ADMINISTRATIVE COSTS $28.4 $14.2 $11.3