Embed Size (px)
Citation preview

Prepared in cooperation with the CALIFORNIA STATE WATER RESOURCES CONTROL BOARD
California GAMA Program: Fate and Transport of Wastewater Indicators: Results from Ambient Groundwater and from Groundwater Directly Influenced by Wastewater
L A W R E N C E L I V E R M O R E N A T I O N A L L A B O R A T O R Y
UCRL-TR-222531
June, 2006
This work was performed under the auspices of the U.S. Department of Energy by the University of California, Lawrence Livermore National Laboratory under contract No. W-7405-ENG-48.
OH
C9H19
4-nonylphenol (NP)
O
C9H19
OH
NPEOs NP2EC
O
C9H19
OCH2COOH
NP1EC
O
C9H19
COOH
n

2
EXECUTIVE SUMMARY 3 INTRODUCTION 4 SELECTION OF TARGET COMPOUNDS 5 MATERIALS & METHODS 14 SAMPLE COLLECTION 14 ANALYSIS BY SOLID-PHASE EXTRACTION (SPE)-ISOTOPE DILUTION LC/MS/MS 14 ANALYSIS BY GAS CHROMATOGRAPHY/MASS SPECTROMETRY (GC/MS) 18 RESULTS & DISCUSSION 20 QUALITY ASSURANCE/QUALITY CONTROL (QA/QC) FOR TARGET COMPOUNDS 20 RESULTS FOR TEHAMA COUNTY GROUNDWATER 30 RESULTS FOR GROUNDWATER AT CALIFORNIA DAIRIES 34 RESULTS FOR CHICO GROUNDWATER 35 RESULTS FOR GILROY GROUNDWATER 40 RESULTS FOR LIVERMORE GOLF COURSE GROUNDWATER 47 COMPARING RESULTS FROM TWO AREAS OF RECYCLED WATER APPLICATION 57 REFERENCES 60

3
EXECUTIVE SUMMARY A study of the occurrence and transport of wastewater indicator compounds in
groundwater is reported here, as part of the California State Water Resources Control Board’s Groundwater Ambient Monitoring and Assessment (GAMA) program. One component of the study consisted of analytical methods development for organic compounds of interest as possible tracers of wastewater. Subsequently, the wastewater indicator target compounds were analyzed in groundwater samples from two areas strongly influenced by recharge of tertiary treated wastewater, and from three regions with widely spaced wells and differing land use. Target compounds were analyzed by liquid chromatography/tandem mass spectrometry (LC/MS/MS) and gas chromatography/mass spectrometry (GC/MS), and include endocrine-disrupting compounds such as 4-nonylphenol (NP) and its precursors, and steroid estrogens, pharmaceuticals such as ibuprofen, carbamazepine, and primadone, and personal care products such as triclosan, caffeine, linear akylbenzene sulfonates (LAS), and N, N-diethyl-m-toluamide (DEET). These compounds are frequently detected in treated wastewater at concentrations in the microgram per liter (μg/L) range. Reporting limits for the methods used ranged from 3 to 100 nanograms per liter (ng/L).
Wells from two areas where tertiary treated wastewater is used for irrigation, a golf course in Livermore and a farm and public park in Gilroy, were sampled and analyzed for the trace organic compounds that could serve as wastewater indicators. Other chemical and isotopic tracers of wastewater in groundwater were used to identify and quantify the component of produced groundwater that originated as wastewater effluent. At the Livermore golf course site, tritium released by Lawrence Livermore National Laboratory (LLNL) to the municipal sewer system served as an excellent tracer of the wastewater component because it was closely monitored in treatment plant effluent and in groundwater over a 25-year period. At both the Livermore and Gilroy sites, major ions, stable isotope signatures of the water molecule, groundwater age, and stable isotope signatures of nitrogen and oxygen in nitrate, serve to demarcate groundwater that has a component of wastewater recharge. Results for these other tracers indicate that a significant component of wastewater is produced from shallow monitoring wells at both sites. However, of the large number of trace organic compounds analyzed, only a small number of compounds were detected in the same samples, and at very low concentrations. At both sites, alkylphenol ethoxycarboxylic acids (APECs, the precursor compounds of NP) were detected at concentrations greater than 50 ng/L. The pharmaceuticals carbamazepine and primadone were found at a maximum concentration of 110 ng/L at the Gilroy site. Overall, the results indicate efficient removal of wastewater compounds, likely due to sorption and biodegradation in the vadose zone and in the anaerobic zone that exists at depth at both sites.
The occurrence of wastewater indicator compounds was similarly very limited in ambient groundwater, sampled in three regions of differing land use. Domestic wells from Tehama County were entirely free of the target analytes. Results from shallow monitoring wells adjacent to lagoons at three dairy sites suggest that NP may be an indicator of lagoon seepage, although detections of NP may be related to sampling artifacts. Norflurazon and its degradation product, desmethylnorflurazon, served as tracers of groundwater recharged from an area of pesticide application at one dairy site. Twenty three shallow monitoring wells and seven longer-screened drinking water wells in the Chico area were sampled for wastewater indicator compounds, as part of a larger study to determine the source(s) and fate of nitrate. One major potential source of nitrate is discharge from septic systems. Wastewater indicator compounds could potentially serve to distinguish among nitrate sources, as certain target compounds are likely to derive from

4
septic system discharge (caffeine, surfactant-related compounds such as APECs and LAS, ibuprofen and other pharmaceuticals and estrogenic compounds). In all, 14 different target compounds were detected at 11 monitoring wells. Carbamazepine was detected at 4 wells, polycyclic musk compounds and flame retardants were detected at 1 well, caffeine was detected at 2 wells, DEET and NP were detected at one well, and herbicides and their breakdown products were detected at 3 wells. Seven drinking water wells in Chico had no detections of any of the target analytes.
Limitations of the study include: (1) a lack of control over well construction and sampling equipment at some dairy sites and private domestic wells where introduction of contaminants cannot be ruled out, (2) method detection limits for certain compounds (LAS, sterols) that are higher than concentrations expected in groundwater samples, and (3) not all analytes were measured in every sample. A conservative approach was taken in reporting detections in order to minimize the possibility of reporting false positives. The study limitations do not affect the overall conclusions that the occurrence of wastewater indicator compounds in ambient groundwater is extremely rare and that these compounds are substantially removed during recharge to groundwater.
INTRODUCTION
In California, a steep increase in population has been accompanied by an increase in per capita use of pharmaceuticals and personal care products. In the meantime, demand for limited fresh water supplies for use as drinking water has increased. These factors combine to draw public and scientific attention to the environmental fate of trace organic compounds from human wastewater discharges. Since publication of "Pharmaceuticals, Hormones, and Other Organic Wastewater Contaminants in US Streams, 1999-2000: A National Reconnaissance," (Kolpin et al., 2002), there has been a great deal of interest in the occurrence of pharmaceuticals, personal care products, and other compounds from wastewater in drinking water supplies. Many reports on the fate of trace organic compounds during wastewater treatment and on their occurrence in surface water bodies have appeared in the last several years (e.g., Tixier et al., 2003, Standley et al., 2000, Stamatelatou et al., 2003, Bryrns, 2001, Kolpin et al., 2002). Studies of the fate and transport of these compounds in field studies of groundwater are on the rise, but are still relatively few in number (e.g., Drewes et al., 2002, Fenz et al., 2005, Heberer and Adams, 2004, Hinkle et al., 2005).
Under the State Water Resources Control Board’s (SWRCB) comprehensive, state-wide Groundwater Ambient Monitoring and Assessment (GAMA) program, pharmaceutical and other wastewater-derived compounds are analyzed in public drinking water wells by the United States Geological Survey (USGS) at the National Water Quality Laboratory. In addition, a focused study on the fate and transport of wastewater indicator compounds has been carried out by Lawrence Livermore National Laboratory (LLNL) under the GAMA program, and is the subject of this report. The first phase of the study focused on method development, including development of extraction techniques for groundwater samples, extensive analysis of field blanks and equipment blanks, and development of analytical techniques for liquid chromatography/tandem mass spectrometry (LC/MS/MS) and gas chromatography/mass spectrometry (GC/MS). Method development was carried out with the following factors in mind: (1) detection limits needed to be sufficiently low to be consistent with expected concentrations of individual compounds in the ng/L range, (2) specificity and selectivity needed

5
to be high to account for the typically complex groundwater matrix and variable extraction recovery, (3) target analytes had to be selected that were likely to persist in groundwater (based on their physical-chemical and biochemical properties), and (4) quality control issues (mainly blank controls) related specifically to groundwater sampling needed to be addressed.
Selection of sample locations was also carried out to maximize the possibility of collecting meaningful results. Hence two areas known to be strongly affected by recharge of treated municipal wastewater were chosen as study areas. The Livermore golf course and Gilroy farm sites offered an opportunity to compare and contrast results from two areas where tertiary treated effluent has been used for irrigation for more than twenty years. Opportunities to sample groundwater with a very high fraction of recharged wastewater are excellent in these two areas. We focused in particular on shallow monitoring wells at each site where there was a groundwater mound, and where there were multiple lines of geochemical evidence for the presence of recharged wastewater.
In addition, samples of ambient groundwater from shallow and deep aquifers used for private and public water supplies were included to begin to assess the frequency of occurrence of wastewater indicator compounds in areas outside the influence of municipal wastewater irrigation. These included private wells from a relatively undeveloped region in Tehama County, shallow monitoring wells and public supply wells in an area of high nitrate concentrations in Chico, and monitoring wells at three dairy sites.
A key component of the study was to use multiple, complementary techniques for tracing the source and flow of the groundwater along with the various wastewater constituents. To that end, the following analyses were carried out in each study area in addition to analysis of target wastewater indicator compounds: (1) stable isotopes of the water molecule (for source water identification and evidence for evaporation), (2) total dissolved organic carbon and major anions and cations (as indicators of a significant wastewater component), (3) isotopes of N and O in nitrate (wastewater denitrification indicators), and (4) tritium-helium (for groundwater age and source water identification). In this manner, the fate of individual trace organic compounds of interest could be tracked and quantified, since the component of groundwater from a wastewater source and the compounds of interest were quantified in both influent and groundwater samples.
SELECTION OF TARGET COMPOUNDS
Alkylphenol ethoxylate metabolites Alkylphenol ethoxylates (APEOs), a class of nonionic surfactants, and their metabolites are closely associated with wastewater and treated wastewater, and have attracted attention from the environmental community because they constitute the most prominent group of endocrine-disrupting compounds identified in that matrix. In particular, nonylphenol ethoxylates (NPEOs) constitute the largest subgroup of the APEOs (encompassing more than 80% of the world market). Municipal wastewater treatment (including biological treatment) tends to result in efficient elimination of the parent APEOs but formation of biologically refractory metabolites including the following: alkylphenol mono- and diethoxylates (i.e., n=1 or 2 in Figure 1), alkylphenol carboxylic acids (e.g., NP1EC and NP2EC; Figure 1), and 4-nonylphenol (NP; Figure 1) (Ahel et al., 1994). NP has recently been reported to have a wide distribution in surface waters (Kolpin et al., 2002) and is well documented to be present in effluents of wastewater treatment plants (WWTP) at μg/L concentrations (e.g., Rudel et al., 1998; Johnson and Sumpter, 2001; Ying et al., 2002; Planas et al., 2002). The hormonal and toxicological

6
properties of NP have resulted in the banning of NPEOs for domestic and industrial use in many parts of Europe (Blackburn and Waldock, 1995). The U.S. EPA has recently initiated an effort to encourage a voluntary phase-out of nonylphenol ethoxylate surfactants from detergents (http://pubs.acs.org/cen/news/84/i25/8425notw3.html). APECs have been observed at considerably (e.g., ten-fold) higher concentrations in WWTP effluents than NP (Johnson and Sumpter, 2001). Notably, since APECs have carboxyl groups that are likely to be ionized in a groundwater environment at circumneutral pH, they would be expected to be more soluble and mobile in groundwater than NP.
Caffeine Caffeine (Figure 1) was chosen as a target compound because it is a unique indicator of human waste that has been widely detected in surface waters and groundwater, and its presence in environmental samples has specifically been linked to WWTP effluent (Seiler et al., 1999 and references therein; Kolpin et al., 2002; Standley et al., 2000; Buerge et al., 2003). Although it is relatively biodegradable (considerably more so than NP), caffeine is nonetheless highly water-soluble and has been observed in the environment near WWTP sources.
Ibuprofen Ibuprofen (Figure 1) is an acidic pharmaceutical that exhibits a high degree of removal during the waste treatment process, but its high degree of consumption still results in this compound being detected in surface waters and is linked to WWTP effluent, although its frequency of detection and range of detected concentrations appears to be lower than that of caffeine (Kolpin et al., 2002; Tixier et al., 2003; Lindqvist et al., 2005). The lower solubility of ibuprofen in water compared to caffeine may partially explain its lower detection frequency.
Steroid estrogens Estrogenic steroid hormones such as estrone (E1) and 17β-estradiol (E2) (Figure 1) are low-level but distinctive wastewater components that have received attention from environmental community because they are significant contributors to the total estrogenic activity observed in that matrix (Johnson and Sumpter, 2001). DEET N,N-diethyl-3-methylbenzamide, also known as N, N-diethyl-m-toluamide (DEET), is a broad spectrum insect repellent that is currently the safest and most effective, and therefore the most widely used, topical insect repellent. DEET has been available to the general public since 1957 and as of 1998 there were 225 registered products listing DEET as an active ingredient (USEPA, 1998). The U.S. EPA estimates that approximately 30% of the U.S. population uses a DEET-based insect repellent annually (USEPA, 1998; Fradin, 1998). Total use in 2000 was between 5 and 7 million pounds (Kiely et al., 2004). Because DEET is applied directly to the body or clothing, this limited use pattern makes DEET an “indoor residential” use repellent, where a primary route of introduction to the wastewater is through washing, since essentially all absorbed DEET is metabolized prior to being eliminated in the urine (EPA, 1998). DEET is stable to hydrolysis and is commonly identified in WWTP effluents, surface waters (Kolpin et al., 2002; Weigel et al., 2002) and has also been detected in groundwater impacted by a municipal landfill (Barnes et al., 2004).
7
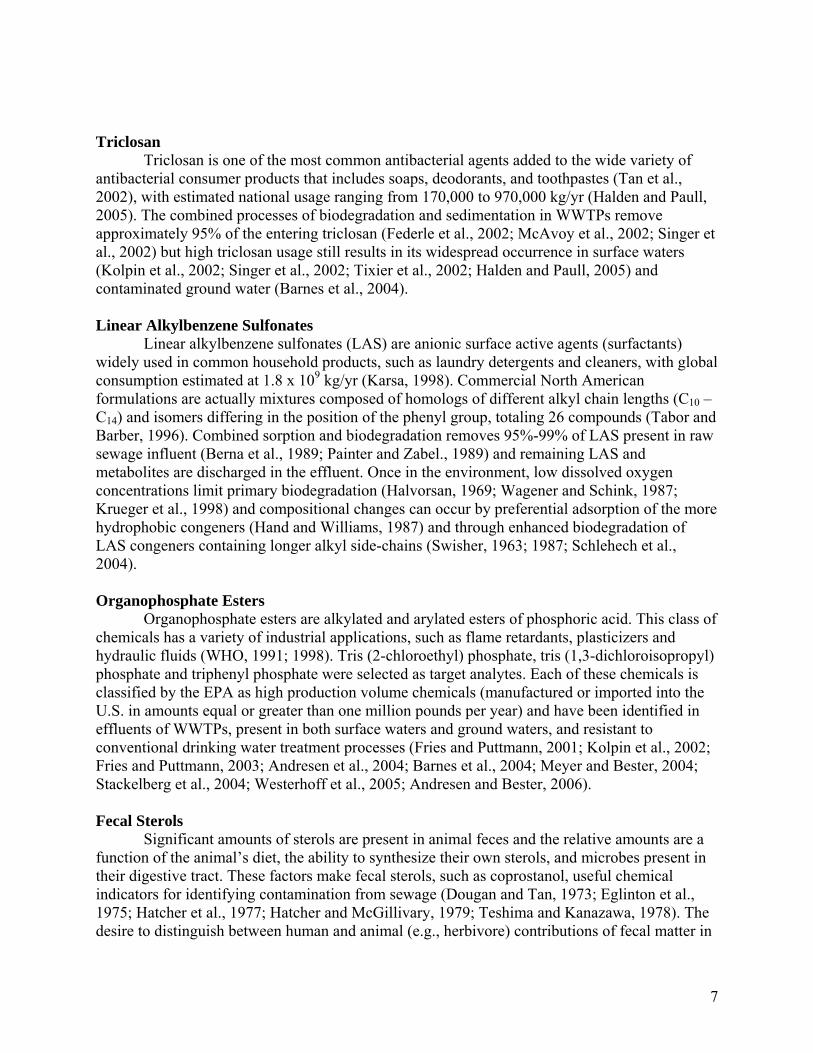
Triclosan Triclosan is one of the most common antibacterial agents added to the wide variety of antibacterial consumer products that includes soaps, deodorants, and toothpastes (Tan et al., 2002), with estimated national usage ranging from 170,000 to 970,000 kg/yr (Halden and Paull, 2005). The combined processes of biodegradation and sedimentation in WWTPs remove approximately 95% of the entering triclosan (Federle et al., 2002; McAvoy et al., 2002; Singer et al., 2002) but high triclosan usage still results in its widespread occurrence in surface waters (Kolpin et al., 2002; Singer et al., 2002; Tixier et al., 2002; Halden and Paull, 2005) and contaminated ground water (Barnes et al., 2004). Linear Alkylbenzene Sulfonates Linear alkylbenzene sulfonates (LAS) are anionic surface active agents (surfactants) widely used in common household products, such as laundry detergents and cleaners, with global consumption estimated at 1.8 x 10⁹ kg/yr (Karsa, 1998). Commercial North American formulations are actually mixtures composed of homologs of different alkyl chain lengths (C10 – C14) and isomers differing in the position of the phenyl group, totaling 26 compounds (Tabor and Barber, 1996). Combined sorption and biodegradation removes 95%-99% of LAS present in raw sewage influent (Berna et al., 1989; Painter and Zabel., 1989) and remaining LAS and metabolites are discharged in the effluent. Once in the environment, low dissolved oxygen concentrations limit primary biodegradation (Halvorsan, 1969; Wagener and Schink, 1987; Krueger et al., 1998) and compositional changes can occur by preferential adsorption of the more hydrophobic congeners (Hand and Williams, 1987) and through enhanced biodegradation of LAS congeners containing longer alkyl side-chains (Swisher, 1963; 1987; Schlehech et al., 2004). Organophosphate Esters Organophosphate esters are alkylated and arylated esters of phosphoric acid. This class of chemicals has a variety of industrial applications, such as flame retardants, plasticizers and hydraulic fluids (WHO, 1991; 1998). Tris (2-chloroethyl) phosphate, tris (1,3-dichloroisopropyl) phosphate and triphenyl phosphate were selected as target analytes. Each of these chemicals is classified by the EPA as high production volume chemicals (manufactured or imported into the U.S. in amounts equal or greater than one million pounds per year) and have been identified in effluents of WWTPs, present in both surface waters and ground waters, and resistant to conventional drinking water treatment processes (Fries and Puttmann, 2001; Kolpin et al., 2002; Fries and Puttmann, 2003; Andresen et al., 2004; Barnes et al., 2004; Meyer and Bester, 2004; Stackelberg et al., 2004; Westerhoff et al., 2005; Andresen and Bester, 2006). Fecal Sterols Significant amounts of sterols are present in animal feces and the relative amounts are a function of the animal’s diet, the ability to synthesize their own sterols, and microbes present in their digestive tract. These factors make fecal sterols, such as coprostanol, useful chemical indicators for identifying contamination from sewage (Dougan and Tan, 1973; Eglinton et al., 1975; Hatcher et al., 1977; Hatcher and McGillivary, 1979; Teshima and Kanazawa, 1978). The desire to distinguish between human and animal (e.g., herbivore) contributions of fecal matter in

8
polluted water led to a technique developed by Leeming et al. (1994, 1996), which involves determining the relative amounts of specific C27 and C29 sterols present in a particular sample. This approach has been used in a variety of locations and has been useful in tracing sources in which multiple fecal contamination inputs may be present (Gregor et al., 2002; Leeming et al., 1998; Isobe et al., 2002). Miscellaneous Compounds In addition to the selected target compounds, the concentrated extracts from the water samples were monitored for non-target organic contaminants during the GC/MS full-scan runs. Compound identifications were made using authentic standards and tentative compound identifications were based on suitable matches using mass spectra database searches and comparisons with published mass spectra. Baseline data were obtained for the study areas and any additional compounds identified in the water samples were useful for future contaminant monitoring. A wide variety of additional anthropogenic compounds were either identified or tentatively identified during the screening process. These include the following: herbicides and herbicide breakdown products (e.g., atrazine, simazine, desethyl atrazine, desisopropyl atrazine, oxadiazon, norflurazon, desmethyl norflurazon), pharmaceuticals (e.g., carbamazepine, primidone), fragrances/personal care products (e.g., HHCB, AHTN, oxybenzone, dometrizole), and industrial chemicals (e.g. benzothiazole, 2-methylthiobenzothiazole, naphthalene).

9
Figure 1. Structures of selected wastewater indicators analyzed by LC/MS/MS for this project. The value of “n” for APEOs is 3 to 20. Not all metabolites in the biodegradation of NPEOs to NP are shown, but the relationships among APEOs, APECs, and NP can be ascertained from the figure.
OH
C9H19
4-nonylphenol (NP)
O
C9H19
OH
APEOs (specifically, NPEOs)
AP2EC
O
C9H19
OCH2COOH
AP1EC
O
C9H19
COOH
O
HO
Estrone
OH
HO
Estradiol
N
N N
NH3C
CH3
CH3O
O
Caffeine
OHO
Ibuprofen
n

10
O
O
OP
O
O
O
OP
OCl
Cl
Cl Cl
Cl
Cl
O
O
OP
O
Cl
Cl
Cl
Triphenyl phosphate Tris (1,3-dichloroisopropyl) phosphate Tris (2-chloroethyl) phosphate
O
OH Cl
ClCl
N
O
N
NH2O
CarbamazepineDEETTriclosan Primidone
NH
HNO
O
NN
O
Cl
HN
FF
F NN
O
Cl
H2N
FF
F
Norflurazon Desmethyl norflurazon
N
O
Diphenamid
H3C
CH3
O
H3C CH3
H3C CH3
CH3
3S-AHTN (Tonalide)
O
CH3
H3C
CH3H3C
CH3H3C
4R,7S-HHCB (Galaxolide) 4R,7S-HHCB-lactone (Galaxolidone)
O
CH3
H3C
CH3H3C
CH3H3C
O
Figure 2. Structures of selected wastewater indicators analyzed by GC/MS.

11
CH3
CH3
HO
CH3
CH3
HOH
H
CH3
CH3
HO
CH3
CH3
HOH
5-Cholesten-3b-ol (Cholesterol) 5a-Cholestan-3b-ol (Cholestanol)
5b-Cholestan-3a-ol (Epicoprostanol)5b-Cholestan-3b-ol (Coprostanol)
C27 Sterols
Figure 2 (cont). Structures of selected wastewater indicators analyzed by GC/MS.

12
CH3
CH3
HO
CH3
CH3
HOH
CH3
CH3
HOH
CH3
CH3
HHO
24-Ethylcholesterol
24-Ethylcoprostanol
24-Ethylcholestanol
24-Ethyl-epicoprostanol
C29 Sterols
Figure 2 (cont). Structures of selected wastewater indicators analyzed by GC/MS.

13
N
N
N
NHCH2CH3
NHCH2CH3
Cl
Simazine
N
N
N
NHCH2CH3
NHCH(CH3)2
Cl
Atrazine
N
N
N
NHCH(CH3)2
NHCH(CH3)2
Cl
Propazine
N
N
N
NHCH2CH3
NH2
Cl
N
N
N
NH2
NHCH(CH3)2
Cl
Desethylatrazine (DEA)
Desisopropylatrazine (DIA)
Figure 2 (cont). Structures of selected wastewater indicators analyzed by GC/MS.

14
MATERIALS & METHODS
SAMPLE COLLECTION Two water samples were collected at each site in certified precleaned one liter amber I-Chem bottles with Teflon-lined caps. Bottles were typically filled directly from the sampling port. New nitrile gloves were worn by the sampler during sample collection to minimize any trace contamination from the sampler during the sample handling process. The water samples were then placed in a cooler and transported to the lab, where they remained refrigerated at 4°C until extraction. Extraction was carried out within approximately 72 hours of sampling.
A major goal of the study was to examine and minimize artifacts due to sampling equipment and sampling procedures. To that end, individual wells were sampled with stainless steel bailers, single-use Teflon bailers, a low-flow “bladder” pump equipped with polypropylene plastic tubing, and three different Grundfos submersible pumps. Two of the Grundfos pumps were equipped with Teflon-lined tubing. A test was carried out comparing samples collected after well purging by bailing with a Teflon bailer and after well purging by pumping with a Grundfos pump equipped with Teflon-lined tubing. In addition, a large volume of laboratory reagent water was prepared and bailers and pumps were tested by collecting samples of the reagent water. Duplicate samples were collected a frequency of 10%. Trip blanks, which consisted of IsoChem bottles filled with laboratory-cleaned reagent water, were carried with samplers on three occasions and were included to monitor for potential sample artifacts during shipping and storage. All of the wells from the two areas of wastewater irrigation were sampled on at least two separate occasions, and six of the wells from a dairy site were sampled on two separate occasions.
ANALYSIS BY SOLID-PHASE EXTRACTION (SPE)-ISOTOPE DILUTION LC/MS/MS
Spiking of samples with isotopically labeled surrogate compounds Samples (0.5 L or 1 L) were spiked with appropriate isotopically labeled internal standards. For nonylphenol, the internal standard employed for quantification was [ring-13C6]-n-nonylphenol (Cambridge Isotope Laboratories, Andover, MA). For the other APEO metabolites studied (NP1EC and NP2EC), the internal standard was 13C2-n-nonylphenoxyacetic acid (custom-synthesized by Cerilliant, Round Rock, TX); this NP1EC analog was used to represent both NP1EC and NP2EC. For the steroid estrogens 17 β-estradiol and estrone, the internal standard employed for quantification was 17β-estradiol 16,17,17-d3 (ICN, Pointe-Claire, Quebec). For caffeine, the internal standard used for quantification was caffeine-trimethyl 13C3 (Sigma Aldrich, MO). For ibuprofen, the internal standard was ibuprofen-propionic-13C3 (Cambridge Isotope Laboratories, Inc.).
Sample pre-concentration by SPE Samples were pre-concentrated by solid-phase extraction (SPE)(ENVI-18 disks, Supelco, Bellefonte, PA), followed by elution of the analytes with 10 mL of ultra-pure methanol. This constituted a 50-fold concentration of the analytes for a 0.5-L sample or a 100-fold concentration for a 1-L sample. Additionally, for each batch of samples, a method blank consisting of 0.5-L or 1-L aliquot of reagent water was spiked with internal standards and extracted simultaneously

15
with the aqueous samples. To improve sensitivity for some target analytes (e.g., 17β-estradiol and estrone), an aliquot of the methanol extract was concentrated (e.g., 10-fold from 2 mL to 200 μL) with a gentle stream of nitrogen gas prior to LC/MS/MS analysis.
Analysis by isotope dilution LC/MS/MS A Waters Model 2690 (Waters Corporation, Milford, MA) HPLC (High Performance Liquid Chromatography) instrument with a Nova-Pak C18 column (150 x 2.1 mm, 4-μm particle size; Waters Corporation) was used for chromatographic separation of analytes. The sample injection volume was 25 μL. The mobile phase typically consisted of methanol:water mixtures, with the flow rates ranging from 100-200 μL/min, depending on the analyte of interest. In some cases, chromatographic optimization studies revealed that methanol:water mixtures were not sufficient for good chromatographic separation or retention. For example, chromatographic separation of APECs was achieved with a 65:35 mixture of methanol and 5 mM ammonium acetate (in 90% water:10% methanol).
A triple quadrupole mass spectrometer - Quattro LC™ (Micromass, Manchester, UK) - was employed for mass determination and quantification. Operating conditions included a nitrogen flow rate of 75 L/hr for the nebulizer and a flow rate of 350 L/hr during desolvation. Ion source temperatures were 80oC for the source block and 300oC for desolvation. Compound-specific optimization of MS and MS/MS parameters (e.g., sample cone voltage, capillary voltage, collision energy) for method development involved infusions of standards (typically 10 μL/min for a 200 μg/L standard) and acquisition in full-scan mode or daughter ion mode. Optimized parameters are listed in Table 1. Isotope dilution quantification (with compound-specific corrections for internal standard recovery) was performed in selected reaction monitoring mode for all analytes.
Some method development for acetaminophen was performed, but technical problems precluded regular analysis of this compound in field-collected samples for this project. Both an isotopically labeled acetaminophen standard (Acetyl-13C2, 99%; 15N, 98%) and unlabeled acetaminophen standard were acquired. Standard compound solutions (200 μg/L) were infused through a syringe pump at a flow rate of 20 μL/min for tuning and parameter optimization. Positive electrospray ionization was employed, with a capillary voltage of 3.5 kV and cone voltage of 24 V. For the unlabeled acetaminophen standard, the base peak was at m/z 174.2, which corresponds to the parent ion with sodium adduct [M + Na]+; the isotopically-labeled acetaminophen standard had a base peak at m/z 177.2, as expected. Observed sensitivity was favorable. Unfortunately, a suitable mass fragment for tandem MS analysis was not produced under the wide range of tuning conditions tested, so the detection limit for acetaminophen was considered too high relative to the concentrations expected in environmental samples.

16
Table 1. Trace organic compounds of interest. Compound Pre-concentration
techniquea Ionization
mode Instrumentationb Mass fragment or
transition for analyte (m/z)
Mass fragment or transition for
internal std. (m/z)c
Detection limitd (ng/L)
Caffeine SPE, ENVI-18 disks
Positive Electrospray
LC/MS/MS m/z 195 m/z 138 m/z of 198 m/z 140
5-10
4-Nonylphenol SPE, ENVI-18 disks
Negative Electrospray
LC/MS/MS m/z 219 m/z 133 m/z 225 m/z 112 10-15
NP1ECe SPE, ENVI-18 disks
Negative Electrospray
LC/MS/MS m/z 277 m/z 219 m/z 279 m/z 219 10
NP2ECf SPE, ENVI-18 disks
Negative Electrospray
LC/MS/MS m/z 321 m/z 219 m/z 279 m/z 219 e 10
17β-estradiol SPE, ENVI-18 disks
Negative Electrospray
LC/MS/MS m/z 271 m/z 143, 145, 183
m/z 274 m/z 145, 185
1-10
Estrone SPE, ENVI-18 disks
Negative Electrospray
LC/MS/MS m/z 269 m/z 143, 145
m/z 274 m/z 145, 185 g
1-10
Ibuprofen SPE, ENVI-18 disks
Negative Electrospray
LC/MS/MS m/z 205 m/z 161 m/z 208 m/z 163 5-10
DEET SPE, OASIS HLB cartridges
Electron Impact
GC/MS m/z 119 m/z 217h 10
Tris (2-chloroethyl)phosphate
SPE, OASIS HLB cartridges
Electron Impact
GC/MS m/z 63 m/z 217h 100
Tris (1,3-dichloroisopropyl) phosphate
SPE, OASIS HLB cartridges
Electron Impact
GC/MS m/z 75 m/z 217h 100
Triphenyl phosphate SPE, OASIS HLB cartridges
Electron Impact
GC/MS m/z 326 m/z 217h 100
Triclosan (2,4,4’-trichloro-2’-hydroxydiphenyl ether)
SPE, OASIS HLB cartridges
Electron Impact
GC/MS m/z 290 m/z 217h 100
Coprostanol i SPE, OASIS HLB cartridges
Electron Impact
GC/MS m/z 215 m/z 217h 100
Cholesterol i
SPE, OASIS HLB cartridges
Electron Impact
GC/MS m/z 275 m/z 217h 100
Stigmastanol i SPE, OASIS HLB cartridges
Electron Impact
GC/MS m/z 215 m/z 217h 100

17
Ethylenediamine tetraacetic acid (EDTA)j
Rotary evaporation Electron Impact
GC/MS m/z 174 m/z 180j 100
Linear alkylbenzenesulfonates (LAS) j
SPE, OASIS HLB cartridges
Electron Impact
GC/MS m/z 185 m/z 91 k 1000
Carbamazepine SPE, OASIS HLB cartridges
Electron Impact
GC/MS m/z 193 m/z 217h 20
Primadone SPE, OASIS HLB cartridges
Electron Impact
GC/MS m/z 146 m/z 217h 40
a SPE media included ENVI-18 disks (Supelco, Bellefonte, PA) and OASIS HLB cartridges (Waters Corporation, Milford, MA).
b Liquid chromatography/tandem mass spectrometry, LC/MS/MS. Gas chromatography/mass spectrometry, GC/MS. cIsotopically (i.e., 13C, 2H, 15N) labeled internal standards were employed for isotope dilution liquid chromatography/tandem mass spectrometry unless noted otherwise. d Estimated detection limits are based on solid-phase extraction of a 0.5- or 1-L aqueous sample and account for typical extraction blank concentration levels. e Nonylphenoxyacetic acid (Figure 1), a metabolite of alkylphenol ethoxylates. f Nonylphenoxyethoxyacetic acid (Figure 1), a metabolite of alkylphenol ethoxylates; the internal standard for NP1EC was also used for NP2EC. g The internal standard for 17β-estradiol was also used for estrone. h Internal standard is 5α-cholestane. i C27 and C29 fecal sterols. Samples are routinely scanned for these sterols, and if observed, 5 other sterol compounds are investigated. j Internal standard is D12-EDTA. k Internal standard is 4-octylbenzene sulfonate.

18
ANALYSIS BY GAS CHROMATOGRAPHY/MASS SPECTROMETRY (GC/MS)
Spiking of samples with isotopically labeled surrogate compounds Prior to extraction each water sample was spiked with an isotopically labeled surrogate recovery standard (D5-atrazine, Isotope Laboratories, Andover, MA) to monitor extraction efficiency and chromatographic performance.
Sample pre-concentration by SPE Extraction and pre-concentration of target wastewater indicators was achieved using
Oasis HLB solid phase extraction (SPE) cartridges (3 cc/60 mg, Waters Corporation, Milford, MA). The Oasis HLB cartridge has been successfully used for the extraction of a broad spectrum of organic compounds from a variety of matrices (Liu et al., 2004; Quintana et al., 2004; Benijts et al., 2004) and was a suitable SPE cartridge for the current list of wastewater indicators. Prior to sample extraction, the SPE cartridges were pre-conditioned with 5 mL hexane, 3 mL ethyl acetate, 3 mL methanol and 3 mL Milli-Q water. A short section of precleaned Teflon tubing was inserted into each sample bottle (0.5 – 1 liter) and water samples drawn through the SPE cartridges at a flow rate of ≤1.5 ml/min using a peristaltic pump (Gilson Minipuls 2) equipped with an eight channel pump head, allowing up to eight samples to be extracted simultaneously. After extraction, each SPE cartridge was air dried and a first fraction was eluted with 5 mL ultra-pure ethyl acetate. All target compounds except the LAS surfactants were eluted from the cartridge in an ethyl acetate fraction (fraction 1) and the LAS surfactants were eluted using acetonitrile (fraction 2). This first extract was concentrated with a stream of nitrogen gas, extracts spiked with an internal standard, and final volume adjusted to 50 μL (ethyl acetate). A second fraction, which included the LAS, was eluted using ultra-pure acetonitrile. Fraction 2 was evaporated to dryness using a stream of dry nitrogen gas and residue redissolved in 50 μL dichloromethane containing 0.005M tetrabutylammonium hydrogen sulfate. The LAS-TBA ion pair reacts to esterify the LAS in the injection port. Quantification was performed using an internal standard (4-octylbenzene sulfonate). Typical carryover problems were avoided by following each sample injection with a blank dichloromethane/TBA injection.
Analysis by GC/MS
A 1 μL splitless injection was analyzed using an HP 6890 Series gas chromatograph coupled to an HP 6890MSD (5972 MS) using a Restek Rtx-5ms column (40m x 0.25mm i.d., 0.25 μm film thickness), with the injection port at 280°C and a constant head pressure of 12 psi. The mass spectrometer was operated in selected ion monitoring (SIM) mode for target compound quantification and in full-scan mode for mass spectrometry compound verification. Full-scan runs were also used to screen the extracts for non-target compounds of interest. The temperature program of the GC oven was as follows: isothermal at 65°C for 1 min., 5°C/min. to 310°C, held isothermal at 310°C for 10 min. Helium was used as the carrier gas. The concentrations of the target compounds were determined by using a five-point calibration curve for each analyte, ranging in concentration from 8 to 800 ng/L (based on a 1L water sample) and compounds were quantified using relative response factors of an internal standard (5α-cholestane), with %RSDs ≤20%.

19
Volatile Organic Compounds
Selected sample locations included analyses for volatile organic compounds in addition to the semivolatile target compounds. The GAMA volatile organic compound (VOC) list, which originally contained 16 compounds, was expanded to 36 compounds. A five-point initial calibration, ranging in concentration from 3.5 ng/L to 176 ng/L, was checked daily with a midpoint continuing calibration check. Detection limits were variable but all compounds in the current target list were calibrated down to a level of 3.5 ng/L. The reporting limit was set at 5 ng/L. Replicates were run at a frequency of 10% and samples with analytes exceeding the linear calibration range were diluted accordingly and rerun. Analytical procedures and QA considerations follow those reported by Moran et al. (2005).
EDTA
The current method for EDTA works well only for waters low in total dissolved solids. This method involved spiking the water samples with an isotopically labeled internal standard (D12-EDTA, Cambridge Isotope Laboratories, Inc.). Each sample was then concentrated by rotary evaporation to approximately 2 mL. The concentrated samples were transferred to 10 mL test tubes with Teflon-lined screw caps. Formic acid (0.5 mL) was added to each, and samples reduced to dryness under a stream of dry nitrogen gas. The dried residue was dissolved in 1 mL of a BF3/MeOH solution (10%) and reacted at 85°C for 45 min. to methylate the EDTA and D12-EDTA. This solution was cooled to room temperature and diluted with 2.5 mL of a 2% potassium bicarbonate solution, then solvent extracted using two 0.5 mL portions of dichloromethane to extract the methylated EDTA and methylated D12-EDTA. The extracts were combined and prepared for analysis using GC/MS by adjusting the extract volume to 50 μL. GC/MS analyses were performed on the dichloromethane extracts using a Hewlett Packard 6890 GC coupled to a Hewlett Packard 6890 MSD (5972 MSD) using an HP-5 ms open tubular column (30 m x 0.25 mm i.d., 0.25 μm film thickness). The injection temperature was set at 280°C and the GC oven program was as follows: isothermal at 65°C for 2 min., then ramped at 5°C/min. to a final temperature of 310°C and held isothermal for 10 min. Injection volumes were 1 μL using a constant column head pressure of 12 psig. Selected ion monitoring (SIM) with electron impact was employed for quantification. A six-point calibration curve for EDTA was used (D12-EDTA as internal standard), ranging in concentration from 100 ng/L to 10,000 ng/L. Good linearity was obtained (e.g., r2 = 0.999). Method blanks had EDTA amounts below the reporting limit (~ 40 ng/L). This method works well and recoveries are high only with waters low in total dissolved solids. The presence of salts interferes with the methylation reaction, resulting in very low or no recoveries of EDTA and the internal standard.

20
RESULTS & DISCUSSION
QUALITY ASSURANCE/QUALITY CONTROL (QA/QC) FOR TARGET COMPOUNDS
LC/MS/MS calibration Internal standard calibration curves (3-point to 5-point) for NP, caffeine, NP1EC, and NP2EC were highly linear over the concentration range relevant to samples analyzed. Representative calibration curves are presented in Figures 3-5. For NP, caffeine, NP1EC, and NP2EC, calibration curves typically covering the concentration ranges of 10 to 250, 10 to 1000, or 10 to 2500 ng/L (assuming a sample size of 1 L) had r2 values between 0.996 and 0.99997. Internal standard calibration curves (5-point) for 17β-estradiol, estrone, and ibuprofen were linear over the concentration range relevant to samples analyzed, with r2 values greater than 0.99.
Surrogate recoveries For 147 samples (including well water samples, replicates, trip blanks, and equipment blanks) analyzed for NP by isotope dilution LC/MS/MS, recovery of the 13C-labeled surrogate compound averaged 68 + 25% (mean + standard deviation) and had a median value of 69%. The surrogate compound was spiked into samples at a concentration of either 0.5 or 1 μg/L (depending on the sample size). For 154 samples analyzed by isotope dilution LC/MS/MS for caffeine, recovery of the 13C-labeled surrogate compound averaged 14 + 9% and had a median value of 13%. The surrogate compound for caffeine was spiked into samples at a concentration of either 0.1 or 0.2 μg/L (depending on the sample size). The relatively poor recovery for caffeine probably reflects that this compound is too polar to be effectively captured by the octadecyl silica solid phase extraction discs that were used for this project. For 17 samples analyzed for AP1EC and AP2EC by isotope dilution, LC/MS/MS, recovery of the 13C-labeled surrogate compound averaged 139 + 25% and had a median value of 144%. The surrogate compound was spiked into samples at a concentration of either 0.5 or 1 μg/L (depending on the sample size). The cause of the high recovery for the APEC surrogate compound is not known, but could potentially be associated with signal enhancement related to the sample matrix. One advantage of the isotope dilution technique is that it corrects for signal enhancement (or signal suppression) on a compound-specific and sample-specific basis.
For groundwater samples analyzed by GC/MS, recovery of the surrogate compound (D5-Atrazine) averaged 98 + 8% (mean + standard deviation for n=90).

21
Figure 3. Internal standard calibration for NP. Standard concentrations (accounting for a 1-L sample processed through SPE) range from 10 to 2500 ng/L.
Figure 4. Internal standard calibration for AP1EC and AP2EC. Standard concentrations (accounting for a 1-L sample processed through SPE) range from 10 to 1000 ng/L.
y = 0.657x + 0.018R2 = 0.99996
0.0
0.5
1.0
1.5
2.0
2.5
3.0
3.5
0 1 2 3 4 5 6
Nonylphenol Relative Concentration
y = 0.68x + 0.0038R2 = 0.9995
y = 0.56x + 0.0038R2 = 0.9999
0.0
0.2
0.4
0.6
0.8
1.0
1.2
1.4
1.6
0 1 1 2 2 3
APEC Relative Concentration
AP2EC
AP1EC

22
Figure 5. Internal standard calibration for caffeine. Standard concentrations (accounting for a 1-L sample processed through SPE) range from 10 to 250 ng/L.
Reporting conventions for LC/MS/MS (detection limits) Accurate method detection limits should reflect more than the absolute sensitivity of the analytical instrumentation (the instrumental detection limit). Specifically, for compounds that can occur at low levels as laboratory contaminants, method detection limits should also reflect the background level of such contamination. Thus, for caffeine, detection limits were established as the highest concentration among method blanks analyzed in a sample batch. This concentration (10-15 ng/L) is considerably higher than the absolute sensitivity of the LC/MS/MS method, but effectively minimizes the possibility of false positive detections. For NP, two levels of detection limits were established: (1) the highest concentration among method blanks analyzed in a sample batch (as for caffeine) and (2) double that concentration. To illustrate, if the highest method blank concentration for NP was 10 ng/L, a sample with 8 ng/L was reported as <10 ng/L, a sample with 15 ng/L was reported as <20 ng/L, and a sample with 22 ng/L was reported as 22 ng/L. This reporting convention was based on the best professional judgment of the analyst, and reflects the observation that there were a number of samples with NP concentrations in the range of the method blank, and the analyst did not consider these to be sufficiently above background to be confidently reported. It should be noted that, even with this conservative reporting convention, detection limits were still quite low as compared to conventional EPA analysis of organic priority pollutants.
y = 1.02x + 0.062R2 = 0.9999
0.0
0.5
1.0
1.5
2.0
2.5
3.0
0 0.5 1 1.5 2 2.5 3
Caffeine Relative Concentration

23
Method and Trip blanks Method blanks are defined for this project as reagent water samples that are processed through the entire laboratory analysis procedure (i.e., spiking with surrogate compounds, solid-phase extraction, and analysis by LC/MS/MS). A method blank was run with each extraction batch (typically 4 or 5 groundwater samples).
For the method blanks analyzed, caffeine concentrations were typically less than 5 to 10 ng/L and always less than 15 ng/L. As discussed in the previous section, the highest method blank for an LC/MS/MS analysis batch was used to establish the detection limit (at least for certain compounds). For NP, method blank concentrations were typically less than 10 ng/L and always less than 37 ng/L. Method blanks did not contain detectable levels of NP1EC, NP2EC, ibuprofen, or estrogenic compounds (i.e., above 3 ng/L for NPEC’s or above 11 ng/L for other compounds).
None of the target compounds was detected by either GC/MS or by LC/MS/MS in any of the five trip blanks. Equipment Blanks
The results of the series of equipment blanks should serve as a cautionary tale. Of the target analytes, NP is arguably the most likely target compound to suffer such artifacts because this compound is included in the manufacture of a range of plastics. As shown in Table 2, some sampling equipment resulted in NP contamination that clearly exceeded the concentrations observed in method blanks. In particular, two samples of reagent water that had passed through a Grundfos pump (samples 103943 and 103944) had 200 ng/L NP concentrations, which is at least 20-fold higher than concentrations in method blanks. This artifact was observed despite the fact that this pump included Teflon-lined tubing, which is the optimal material for minimizing plasticizer contamination. In addition, NP was observed at concentrations less than 50 ng/L in blank samples collected using both the stainless steel and Teflon bailers, and in blank water stored in a plastic bucket (Table 2). Only the ¾” Teflon bailer and bladder pump blanks were free of NP at the 20 ng/L level. Hence, for NP, it is very difficult to completely rule out the possibility of sampling artifacts; detections must be viewed with caution and ideally confirmed by multiple samplings with different equipment. Other LC/MS/MS-analyzed compounds such as caffeine and ibuprofen were not detected in equipment blanks.
For compounds analyzed by GC/MS, all of the plastic bailer blanks were significantly cleaner than the stainless steel bailer blanks (see Table 2); this may be attributed to the fact that some organic compounds sorb to the stainless steel and are transferred to subsequent samples. Some of the compounds identified in the stainless steel bailer blank appear to come from a typical sunscreen lotion, and being somewhat oily in composition, would have a tendency to persist. The stainless steel bailer blank samples also contained compounds usually associated with plastics (e.g., butyl citrate, triphenylphosphine oxide and benzyl butyl phthalate).

24
Table 2. Results from equipment blank experiments Sample Type Compounds Detected (ng/L) method blank none trip blank none stainless steel bailer N-butyl-benzenesulfonamide, benzyl butyl
phthalate, Diphenyl sulfone 1/2" teflon bailer NP (40) 3/4" teflon bailer N-butyl-benzenesulfonamide, phthalates bladder pump N-butyl-benzenesulfonamide (100,000),
Diphenyl sulfone, phthalates Grundfos pump 1 (Teflon tubing)
NP (200), Diphenyl sulfone
Grundfos pump 2 (Teflon tubing)
NP (20), N-butyl-benzenesulfonamide
N-butyl-benzenesulfonamide was detected at relatively high concentrations (up to 100
μg/L) in blank water samples that had been stored in a new plastic bucket, pumped through a Grundfos pump with new Teflon-lined tubing, pumped with the bladder pump, and passed through a ¾” Teflon bailer. N-butyl-benzenesulfonamide is a plasticizer used in polymerization of polyamide compounds, and was not a target analyte. Diphenyl sulfone and some phthalates were also detected in these samples at lower concentrations. Only one sample, passed through a narrow (1/2”) teflon bailer, did not have detections of any contaminants by GC/MS. Results for Groundwater Samples
Results for groundwater samples are discussed in five sections: (1) Tehama County private wells, (2) Chico area monitoring and drinking water wells, (3) dairy site monitoring wells, (4) Gilroy wells, and (5) Livermore wells. Analytical results, along with well information for the five regions, are shown in Table 3. The latter two regions include local areas where tertiary treated wastewater has been used for irrigation for at least two decades. Monitoring wells from those areas are most likely to show the effects of transport of wastewater compounds. Multiple isotopic tracers and wastewater indicator compounds were analyzed in 8 monitoring wells from wastewater irrigation areas in Gilroy and 10 such wells in Livermore. In addition, trace organic compounds of interest as wastewater indicators have been analyzed in 93 samples, 20 of which are from shallow monitoring wells in Chico, 35 from private domestic wells in Tehama County (26), Chico (2), and Livermore (7), 5 from public drinking water wells in Chico, and 33 from dairy monitoring wells.
Following the results section, there is a discussion of the major factors affecting the fate and transport of wastewater indicators, and a comparison between results from Livermore and Gilroy, as well as a comparison between results from those areas and the regions that are outside of the area of influence of wastewater irrigation.
Many target analytes were not detected in any of the well water samples. For example, no groundwater samples contained ibuprofen or estrogenic compounds at detectable concentration levels (i.e., above 11 ng/L). In addition, none of the sterols were detected in groundwater samples.

25
Table 3. Analytical results for target compounds. Blank fields indicate compound was not analyzed in that sample. UCM = Unresolved complex mixture of organic material. * Detection is likely a sampling artifact, as discussed in text. LLNL ID Collection
Date Well ID TOC Caffeine Nonylphenol NP1EC NP2EC Chloroform Carbamazepine Primadone Desmethyl
norflurazon Nor flurazon
Additional Detections (concentration)
mg/L ng/L ng/L ng/L ng/L ng/L ng/L ng/L ng/L ng/L ng/L Tehama County 102836 4/19/2005 SWRCB-691-
Tehama <15 24* <3 <3 <10 <10
102885 4/26/2005 SWRCB-726-Tehama
<15 <10 <10 <10
102886 4/26/2005 SWRCB-775-Tehama
<15 <10 <10 <10
102890 4/27/2005 SWRCB-780-Tehama
<15 <10 <10 <10
102891 4/27/2005 SWRCB-729-Tehama
<15 <20 <10 <10
102892 4/27/2005 SWRCB-730-Tehama
<15 <10 <10 <10
102893 4/27/2005 SWRCB-751-Tehama
<15 <10 <10 <10
102894 4/28/2005 SWRCB-764-Tehama
<15 <10 <10 <10
102917 5/3/2005 SWRCB-744-Tehama
<15 690* (<1μg/L)
<3 <3 <10 <10
102918 5/4/2005 SWRCB-754-Tehama
<15 <10 <10 <10
102919 5/4/2005 SWRCB-755-Tehama
<15 <10 <10 <10
102920 5/4/2005 SWRCB-753-Tehama
<15 <10 <10 <10
102921 5/10/2005 SWRCB-792-Tehama
<15 <10 <10 <10
102922 5/10/2005 SWRCB-803-Tehama
<15 <20 <10 <10
102928 5/11/2005 SWRCB-808-Tehama
<10 <20 <10 <10
102929 5/11/2005 SWRCB-821-Tehama
<10 <10 <10 <10
102930 5/16/2005 SWRCB-841-Tehama
<10 <10 <10 <10
102931 5/19/2005 SWRCB-844-Tehama
<10 <10 <10 <10
102932 5/19/2005 SWRCB-801-Tehama
<10 <10 <10 <10
102933 5/19/2005 SWRCB-838- <10 <10 <10 <10

26
LLNL ID Collection Date
Well ID TOC Caffeine Nonylphenol NP1EC NP2EC Chloroform Carbamazepine Primadone Desmethyl norflurazon
Nor flurazon
Additional Detections (concentration)
Tehama 102934 5/24/2005 SWRCB-871-
Tehama <10 <10 <10 <10
102935 5/25/2005 SWRCB-816-Tehama
<10 <10 <10 <10
102945 6/1/2005 SWRCB-890-Tehama
<10 <20 <10 <10
102946 6/1/2005 SWRCB-876-Tehama
<10 28* <10 <10
102947 6/1/2005 SWRCB-781-Tehama
<10 <10 <10 <10
102948 6/1/2005 SWRCB-786-Tehama
<10 <20 <10 <10
Chico 103023 10/25/2005 DMW-11 1 <7 <10 230 <10 <10 103022 10/25/2005 DMW-13 1 <7 <10 <20 <10 <10 103021 10/13/2005 MW-21 1 <7 <20 <20 <40 <10 <10 UV absorbing sunscreen
agents of oxybenzone and parsol MCX (2-ethylhexyl cinnamate), polycyclic musk compounds AHTN (tonalide) and HHCB (galaxolide), and the HHCB transformation product HHCB-lactone (galaxolidone), flame retardant tris (1,3-dichloroisopropyl) phosphate
103020 10/13/2005 102-A <0.5 <7 <10 <20 <40 <10 <10 103019 10/5/2005 MW-28 1 <20 <40 <10 <10 103018 10/5/2005 MW-22 <0.5 <6 <5 39 <40 <10 <10 103017 10/5/2005 DMW-7 <0.5 <6 <5 <20 <40 <10 <10 103014 10/5/2005 MW-25 1 <6 <5 <20 <40 <10 <10 103013 10/5/2005 DMW-18 1 16 6 <3 <3 <20 <40 <10 <10 103012 8/18/2005 CWS 52-01 <0.5 <10 <36 <20 <40 <10 <10 UCM 103011 8/18/2005 CWS 30-01 <0.5 <20 <40 <10 <10 UCM 103010 8/18/2005 CWS 27-01 <0.5 <20 <40 <10 <10 103009 8/18/2005 CWS 47-01 <0.5 <20 <40 <10 <10 103008 8/18/2005 CWS 68-01 <0.5 <20 <40 <10 <10

27
LLNL ID Collection Date
Well ID TOC Caffeine Nonylphenol NP1EC NP2EC Chloroform Carbamazepine Primadone Desmethyl norflurazon
Nor flurazon
Additional Detections (concentration)
103007 8/18/2005 CWS 59-01 1 <20 <40 <10 <10 103006 7/14/2005 DMW-2 1 <15 <36 <20 <40 140 <10 103005 7/13/2005 DMW-3 2 <10 <36 <20 <40 <10 <10 103004 7/13/2005 2-D1 <0.5 <10 <36 <20 <40 <10 <10 103003 7/13/2005 2-I1 <0.5 <10 <36 <20 <40 <10 <10 103002 7/13/2005 2-S1 1 <10 110 <3 <3 <20 <40 <10 <10 DEET (16) 103001 10/13/2005 FCMW2 1 <14 <10 <20 <40 <10 <10 103000 10/12/2005 DMW-14 1 <7 <10 <20 <40 <10 <10 UCM, desisopropyl
atrazine (25), simazine (6)
102999 10/12/2005 DMW-15 1 <7 <10 120 <40 <10 <10 102998 10/12/2005 46-S1 <0.5 <7 <10 <20 <40 <10 <10 102997 10/12/2005 DMW-16 1 <7 <10 <20 <40 <10 <10 atrazine (33),
desethylatrazine (12) 102996 10/5/2005 DMW-6 <0.5 <6 <5 30 <40 <10 <10 102995 10/5/2005 DMW-5 1 <6 <5 <20 <40 <10 <10 102994 6/14/2005 DMW-17 1 <10 <36 <20 <40 <10 <10 102993 6/14/2005 022N001E28J002
M 30 <36 4 <3 <20 <40 <10 <10 UCM
102992 6/14/2005 MEADOWS PARK
<0.5 <10 <36 <20 <40 <10 <10
Dairies 102685 3/8/2005 MCD V1 13 <15 <30 11 <10 <10 102673 3/7/2005 MCD V14 6 <15 67 <5 <10 <10 102981 6/7/2005 MCD V18 <10 <20 <10 <10 102675 3/7/2005 MCD V18 8 <15 130 18 <10 <10 102677 3/7/2005 MCD V21 23 <15 <30 <5 <10 <10 carbon disulfide (90) 102676 3/7/2005 MCD V24 5 <15 78 <5 <10 <10 102674 3/7/2005 MCD V99 12 <15 <60 8 <10 <10 102988 6/7/2005 MCD W2 <10 29 <10 <10 102689 3/8/2005 MCD W2 13 <15 <60 <5 <10 <10 carbon disulfide (13) 102690 3/8/2005 MCD W3 15 <15 <30 6 <10 <10 102679 3/7/2005 MCD W10 12 <15 <30 7 <10 <10 102985 6/7/2005 MCD W16 <10 80 <10 <10 102684 3/8/2005 MCD W16 9 <15 <60 <5 <10 <10 carbon disulfide (38) 102986 6/7/2005 MCD W17 <10 25 <10 <10

28
LLNL ID Collection Date
Well ID TOC Caffeine Nonylphenol NP1EC NP2EC Chloroform Carbamazepine Primadone Desmethyl norflurazon
Nor flurazon
Additional Detections (concentration)
102683 3/8/2005 MCD W17 10 <15 <30 <5 <10 <10 carbon disulfide (33) 102678 3/7/2005 MCD W23 10 <15 <30 11 <10 <10 102680 3/8/2005 MCD W98 2 <15 <60 4975 <10 <10 carbon disulfide (17) 102687 3/8/2005 SCD Y3 18 <15 4700 <5 <10 <10 carbon disulfide (30) 102686 3/8/2005 SCD Y10 3 <15 <30 <5 <10 <10 103379 8/25/2005 KCD DAIRY <10 <10 103353 8/25/2005 KCD PVT <10 <10 103351 8/25/2005 KCD LAGOON3 27 carbon disulfide (790),
coprostanol, cholesterol, stigmastanol
103380 8/25/2005 CANAL <10 <10 102634 2/15/2002 KCD 1S2 2 <15 120 <5 <10 <10 102632 2/15/2005 KCD 1S3 1 <15 210 <5 <10 <10 carbon disulfide (9.3) 102631 2/15/2005 KCD 1S4 1 <5 <10 <10 carbon disulfide (27) 103352 8/25/2005 KCD 2S1 460* 45 26 14500 9500 dichlorobenzamine (20),
3,4,Dichlorophenyl isocyanate (58)
102627 2/16/2005 KCD 2S2 <15 <60 6 5900 9600 dichlorobenzamine (690)
102628 2/15/2005 KCD 2S3 <15 63 10 1900 4300 dichlorobenzamine (440),3,4,Dichlorophenyl isocyanate (2100)
102633 2/15/2005 KCD 2S4 <5 <10 <10 carbon disulfide (37) 102623 2/16/2005 KCD 3S1 4 <15 <60 85 60 <10 102624 2/16/2005 KCD 3S2 14 <15 72 <5 910 30 102629 2/16/2005 KCD 3S3 6 <5 330 14 102630 2/16/2005 KCD 3S4 6 <5 175 10 102625 2/16/2005 KCD 4S2 1 <15 66 <5 <10 <10 102636 2/17/2005 KCD 4S3 1 102639 2/17/2005 KCD 4S4 1 <15 330 <5 <10 <10 carbon disulfide (17) 102849 4/26/2005 KCD 5S1 <5 MTBE (360) 102626 2/17/2005 KCD 5S1 <15 95 <5 <10 <10 MTBE (350), 3-
Chlorophenyl isocyanate (150), 3,4,Dichlorophenyl isocyanate (30)
103348 8/25/2005 KCD TEMP1 12 245* 510 <5 <10 <10 carbon disulfide (8.6) 102887 5/10/2005 KCD TEMP1 <5 carbon disulfide (9.5) 102635 2/17/2005 KCD TEMP1 <15 770 <5 <10 <10 carbon disulfide (25)

29
LLNL ID Collection Date
Well ID TOC Caffeine Nonylphenol NP1EC NP2EC Chloroform Carbamazepine Primadone Desmethyl norflurazon
Nor flurazon
Additional Detections (concentration)
103349 8/25/2005 KCD TEMP2 12 890* 450 <5 <10 <10 102888 5/10/2005 KCD TEMP2 <5 carbon disulfide (6.5) 102637 2/17/2005 KCD TEMP2 <15 3000 <5 <10 <10 carbon disulfide (93) 103350 8/25/2005 KCD TEMP3 5 <5 carbon disulfide (9.1) 102638 2/17/2005 KCD TEMP3 <5 <10 <10 carbon disulfide (6.3) Gilroy 103446 10/4/2005 Bolsa-2 <6 67 4 12 8 <20 E40 <10 <10 MTBE (25) 103445 10/4/2005 Bloom-1 7 74 <3 <3 <5 <20 <40 <10 <10 103444 9/28/2005 MW-24 27 <3 <3 <5 <20 <40 <10 <10 101768 8/19/2003 MW-24 <3 <3 103443 9/28/2005 MW-22 <6 60 840 125 <5 150 E40 <10 <10 diphenamide, MTBE
(43) 101767 8/19/2003 MW-22 28 1700 800 103442 9/28/2005 MW-21 <6 36 8 13 40 150 E40 <10 <10 MTBE (7.2) 101766 8/19/2003 MW-21 23 <3 <3 103441 9/26/2005 CH-3 <6 120 <3 <3 414 <20 <40 <10 <10 103440 9/26/2005 CH-2 <6 150 <3 <3 340 <20 <40 <10 <10 103439 9/26/2005 CH-1 <6 225 <3 <3 225 <20 <40 <10 <10 Livermore 103560 11/9/2005 2J2 2 <7 <10 125 18 <20 <40 <10 <10 benzothiazole (22),
desisopropyl atrazine (16), simazine (83)
101792 8/25/2003 2J2 <7 140 170 103559 11/9/2005 1P2 1 <7 <10 4.5 <3 <20 <40 <10 18 benzothiazole (35),
desisopropyl atrazine (36), simazine (110), oxadiazon
101794 8/26/2003 1P2 <7 <10 <10 101796 8/28/2003 2R1 <7 60 90 101798 8/28/2003 11C3 <7 <10 <10 101793 8/25/2003 2Q1 <7 <10 <10 101795 8/25/2003 11B1 <7 <10 <10

30
RESULTS FOR TEHAMA GROUNDWATER
Twenty six groundwater samples, collected from Tehama County wells as part of the SWRCB GAMA Voluntary Domestic Well program, were received through the Spring of 2005. The samples were collected by SWRCB personnel using the collection protocol described previously. Samples were collected at ports upstream of holding tanks, and represent a small subset of the >200 wells included in the Voluntary Domestic Well program for Tehama County. Figure 6 shows the locations of the wells that were sampled for wastewater indicator compounds.
In summary, no target analyte was detected with confidence in any of the well water samples. One relatively high level detection of nonylphenol can be attributed to the sampling container (not the standard I-Chem bottle), which had a black phenolic cap instead of a Teflon-lined cap. The result for that sample is reported as ‘< 1 μg/L’. Two more samples with nonylphenol detections below 30 ng/L cannot be excluded as readily, but results from the blank studies provide ample evidence for suspecting that the source of the nonylphenol may be contamination of the sample during or after sampling.
The samples did not contain ibuprofen or estrogenic compounds at detectable concentration levels (i.e., above 10 ng/L). Extraction method blank samples did not contain detectable levels of ibuprofen or estrogenic compounds. Notably, surrogate recoveries in groundwater for the isotopically labeled ibuprofen standard varied considerably.
Figure 6. Map showing locations of private domestic wells sampled for wastewater indicator compounds. Numerical labels refer to three samples discussed in the text.

31
Duplicate water samples were also extracted by solid phase extraction using Waters Oasis
HLB cartridges, and analyzed by GC/MS. None of the GC/MS target analytes were detected in these water samples. Total extracts were screened with the mass spectrometer in full-scan mode and no additional compounds of interest were detected, but elemental sulfur was present in a few of the extracts (likely indicating that sulfide was present in the samples). Three GC/MS total ion chromatograms (TICs) for Tehama are shown in Figures 7-9. Figure 7 is the chromatogram of the total extract for sample 102935 and is representative of most water samples analyzed from this study area. Peak labels identify the surrogate compound and internal standard. Additional peak labels identify a second extraction surrogate, which was added during this time as a method development check, and some minor contaminants, including butylated hydroxytoluene (BHT), several phthalates, and a trace compound from the injection port septum. No target compounds were detected in the GC/MS run and the concentrations of the minor contaminants were similar to those observed in the method blanks.
Figure 8 is the TIC from sample 102929. The total extract of this sample is unique because it contains an anomalously high level of one particular phthalate, bis (2-ethylhexyl) phthalate (a non-target analyte), with a concentration estimated at 4 μg/L. Phthalates are common plasticizers and routine artifacts in concentrated organic extracts but the level of this one particular phthalate in this sample was quite high. Bis (2-ethylhexyl) phthalate may have been in this water sample but it is very likely that this phthalate could have been introduced during the initial sampling or later on during sample handling and extraction.
Figure 9 is the TIC from sample 102917. The total extract of this sample contained a high concentration of elemental sulfur, along with lesser amounts of the S6 and S7 allotropes (these allotropes could have been formed in the injection port of the GC). Except for the typical phthalates and other low-level contaminants, no target compounds were identified in the analysis by GC/MS.
As mentioned above, none of the priority target compounds were detected (e.g., DEET (N,N-diethyl-3-methylbenzamide), tris (2-chloroethyl) phosphate, tris (1,3-dichloroisopropyl) phosphate, triphenyl phosphate, triclosan, and C27 and C29 fecal sterols). In addition to the above target compounds, the mass spectrometer was run in full-scan mode and a general survey was performed on each sample extract. Most water samples were quite clean and not significantly different from the method blanks.

32
Tehama - 102935
0.0E+00
5.0E+05
1.0E+06
1.5E+06
2.0E+06
2.5E+06
3.0E+06
10 15 20 25 30 35 40 45 50 55 60
Time (minutes)
Res
pons
e
D5-Atrazine(Surrogate)
5α-Cholestane(Int. Std.)
BHT
Surr
ogat
e
Sept
um B
leed
Phth
alat
e
Phth
alat
e
Phth
alat
e
Figure 7. TIC of sample 102935. This GC/MS chromatogram is representative of the typical water extract from the Tehama study area.
Tehama - 102929
0.0E+00
1.0E+06
2.0E+06
3.0E+06
4.0E+06
5.0E+06
6.0E+06
10 15 20 25 30 35 40 45 50 55 60
Time (minutes)
Sign
al R
espo
nse
5α-Cholestane(Int. Std.)
D5-Atrazine(Surrogate)
Bis (2-ethylhexyl) phthalate
Pht
hala
te
Phth
alat
e
Surr
ogat
eBH
T
Sept
um B
leed
Figure 8. TIC of sample 102929, showing an unusually large amount of bis (2-ethylhexyl) phthalate.

33
Tehama - 102917
0.0E+00
2.0E+06
4.0E+06
6.0E+06
8.0E+06
1.0E+07
1.2E+07
1.4E+07
10 15 20 25 30 35 40 45 50 55 60
Time (minutes)
Res
pons
e
5α-Cholestane(Int. Std.)D5-Atrazine
(Surrogate)Surr
ogat
e
Phth
alat
e
Phth
alat
e
Phth
alat
e
Elemental Sulfur
Figure 9. TIC of sample 102917. This sample had a high concentration of elemental sulfur.

34
RESULTS FOR GROUNDWATER AT CALIFORNIA DAIRIES
Thirteen monitoring wells from a Kings County dairy, 12 monitoring wells from a Merced County dairy and 2 monitoring wells from a Stanislaus County dairy were sampled for a large number of chemical and isotopic constituents, including trace organic compounds and low level VOCs (see Esser et al., 2006 for a complete description of analytes and results). The main goal of the sampling at dairy sites was to ascertain the fate and transport of nitrate (Esser et al., 2006). Trace organic compounds were analyzed in an effort to determine whether groundwater contains tracers of the various dairy operations. For example, one might expect C27 and C29 sterols to be useful as tracers of groundwater influenced by manure lagoon seepage or by irrigation return flow from fields fertilized by liquid or solid manure.
The Kings County dairy site was instrumented and studied extensively in the nitrate study (Esser et al., 2006). Overall, groundwater from the Kings County dairy is remarkably free of VOCs, considering that these are shallow wells in an area of significant human activity. Low-level MtBE is found at the highest concentration in the well nearest to an unlined irrigation canal (350 ng/L), and is almost certainly sourced from boating activity on the Kings River, which feeds the canal. Carbon disulfide is found frequently at diary wells, and likely has a natural source. It occurs in wells producing chemically reduced groundwater and not in wells with significant dissolved oxygen concentrations.
Nonylphenol was detected at several Kings County dairy monitoring wells, with the highest concentrations detected in temporary wells adjacent to manure lagoons that are sampled by bailing or using a low flow bladder pump. Lower concentrations were also found in shallow monitoring wells in dairy fields. In Merced County diary monitoring wells, NP was detected at a maximum concentration of 80 ng/L in wells adjacent to manure lagoons. NP was not detected in wells distant from manure lagoons at the Merced County site. At the Stanislaus county dairy, the well adjacent to the lagoon had a high concentration of NP (3000 ng/L), while the result for the well in the field was <30 ng/L. NP may therefore be an indicator of the influence of lagoon seepage in recently recharged groundwater. However, in dairy monitoring well samples, NP occurrence as a sampling artifact cannot be ruled out. The temporary wells adjacent to lagoons at the Kings County site are especially likely to produce compromised samples since they are ¾” piezometers with slots in the PVC over 2’ intervals, and cannot be purged or sampled using a submersible pump.
Caffeine was detected in only three of 33 dairy monitoring wells in which it was analyzed. The three wells with detections are those adjacent to or downgradient from manure lagoons at the Kings County dairy site. (On a separate sampling occasion, the same wells were non-detect at <15 ng/L for caffeine.)
As mentioned above, the ratios of certain sterols can be useful in fingerprinting sources of fecal material. For example, C27: coprostanol is a human fecal biomarker, and cholesterol, cholestanol, C29: 24-ethylcoprostanol is an herbivore fecal biomarker. To calculate the proportion of human vs. herbivore fecal contribution, the most useful formula is the following: (coprostanol/(coprostanol + 24-ethylcoprostanol))x100. If this ratio is <30, then the observed sterols are likely 100% herbivore-derived, if it is >75, then they are likely 100% human-derived. The calculated ratio from the lagoon effluent at the Kings County Dairy is ~25, and therefore indicates an exclusively herbivore source, as expected. However, there were no detections of any of the sterol compounds at dairy site wells. Therefore, while the tracer is present in lagoon

35
water, biodegradation of these compounds in the unsaturated zone makes detections in groundwater unlikely.
Of greater interest are the detections of pesticides and pesticide degradation products in dairy monitoring wells. At the Kings County dairy site, norflurazon and its degradation product, desmethylnorflurazon, were detected in a subset of the monitoring wells. Norflurazon was applied to a corn field in excess of the intended amount approximately two years prior to sampling. Figure 10 shows the locations of wells with detections of norflurazon and desmethylnorflurazon (2S and 3S), along with the approximate area where the over-application occurred. The 2S set of nested wells shows a pattern of decreasing concentrations of norflurazon with depth. In the same samples, the relative proportions of norflurazon:desmethylnorflurazon decrease from 1.6 to 0.6 to 0.4, suggesting that conversion to the degradation product takes place during transport in the saturated zone. Overall, significant removal of constituents presumed to be present in manure lagoon water (which is used for crop fertilization) seems to take place during recharge and transport to wells.
3S
1S
2S
Near-lagoon “temp” wells
4S
Manure lagoons
Irrigation canalScale (approximate): 500 m
Dairy facility
Irrigated field
Irrigated field
Area of pesticide application
3S
1S
2S
Near-lagoon “temp” wells
4S
Manure lagoons
Irrigation canalScale (approximate): 500 m
Dairy facility
Irrigated field
Irrigated field
Area of pesticide application
Figure 10. Location map for Kings County dairy site. Nonylphenol was detected at high concentrations in near-lagoon “temp” wells. Pesticides and degradates were found in 2S and 3S nested wells.
RESULTS FOR CHICO GROUNDWATER Twenty three shallow monitoring wells and seven longer-screened drinking water wells
in the Chico area were sampled for trace organics, as part of a larger study to determine the source(s) and fate of nitrate (Figure 11). High nitrate concentrations have been detected in the study area for the past two decades (http://www.buttecounty.net/cob/nitratefiles/execsum.htm; Butte County Environmental Health), and the monitoring wells were installed to monitor for nitrate. One potential major source of nitrate is discharge from septic systems, which serve as

36
onsite wastewater treatment systems over a significant part of the study area. The other potential major source of nitrate is from fertilizer applied for agriculture over many preceding decades. Some target compounds are much more likely to come from septic system discharge than from agricultural irrigation return flow (caffeine, surfactant-derived compounds such as APECs and LAS, ibuprofen and other pharmaceuticals and estrogenic compounds), others are more likely to be present in irrigation return (herbicides and their breakdown products). Wastewater indicator compounds could thus potentially serve as a way to distinguish nitrate sources.
In all, 14 different target compounds were detected at 11 monitoring wells. Carbamazepine was detected at 4 wells, polycyclic musk compounds and flame retardants were detected at one, caffeine was detected at 2 wells, DEET and NP were detected at one well, and herbicides and their breakdown products were detected at 3 wells. Each of the detections is discussed below. Seven drinking water wells in Chico had no detections of any of the target analytes.
Figure 11. Map showing locations of private domestic wells sampled for wastewater indicator compounds. Numerical labels refer to samples discussed in the text.
Several GC/MS TICs for Chico are provided in Figures 12-15. A large number of chromatographically unresolved organic compounds are present in sample 102993. The GC/MS chromatogram of this sample is shown in Figure 12 and this chromatogram consists primarily of a large, smooth “hump” in the baseline with a few resolved peaks. This is known as an unresolved complex mixture (UCM) and is made up of hundreds of chromatographically unresolved compounds. Other than caffeine, detected at 30 ng/L by LC/MS/MS, no target compounds were detected and no additional non-target compounds could be identified in the chromatogram. The bulk of the organic compounds consist of polycyclic and polyalkylated hydrocarbons, perhaps with some oxygenated moieties, consistent with dissolved naturally-occurring organic matter or biologically reworked organic matter. Except for the two additional
Chico

37
samples 103012 and 103013, both of which had evidence of trace amounts of a UCM, the remaining extracts possessed relatively flat baselines. In sample 103013, caffeine and NP were detected at 16 and 6 ng/L, respectively.
Chico - 102993
0.0E+00
2.0E+06
4.0E+06
6.0E+06
8.0E+06
1.0E+07
10 15 20 25 30 35 40 45 50 55 60
Time (minutes)
Res
pons
e
5α-Cholestane(Int. Std.)
D5-Atrazine(Surrogate)
Figure 12. TIC of Chico sample 102993 showing the large amount of unresolved organic material present in this water sample. For scale, the internal standard in this sample represents 1 μg/L.
Three samples from the Chico study area contained low levels of herbicides or herbicide breakdown products. Two water samples contained triazine herbicides. Shown in Figure 13 is the TIC of sample 103000. This sample contained desisopropyl atrazine (25 ng/L) and a trace amount of simazine (6 ng/L) but no additional groundwater organic tracer compounds were found. Sample 102997 contained atrazine (33 ng/L) and desethylatrazine (12 ng/L). Except for the parent triazine herbicides and the breakdown products, the GC/MS TIC was clean and no additional compounds were found. Desmethylnorflurazon was present in sample 103006 at a concentration of 140 ng/L but the parent herbicide norflurazon was not detected. These three samples did not have detections of any of the wastewater indicator compounds, and are all located on the outer fringe of the study area, where irrigation return flow from agriculture is most likely to affect shallow groundwater.

38
Chico - 103000
0.0E+00
5.0E+05
1.0E+06
1.5E+06
2.0E+06
2.5E+06
3.0E+06
10 15 20 25 30 35 40 45 50 55 60
Time (minutes)
Res
pons
e
Bis
(2-e
thyl
hexy
l pht
hala
te)
5α-Cholestane(Int. Std.)
D5-Atrazine(Surrogate)
BH
T
Des
isop
ropy
l atra
czin
e
Figure 13. TIC of sample 103000, showing internal standard, surrogate compound, and desisopropyl atrazine (25 ng/L).
Two samples (102999 and 103023) contained the antiepileptic drug carbamazepine at levels > 100 ng/L. Carbamazepine is an anticonvulsant that has been used as a tracer of municipal wastewater effluent in both surface and ground waters (Clara et al., 2004). Recent studies suggest that it is one of the most refractory of the high-use pharmaceuticals, and is likely to persist in groundwater (e.g., Drewes et al., 2002, Fenz et al., 2005). It was also detected at lower levels in the GC/MS selected ion monitoring (SIM) analyses of samples 102996 and 103018 but definitive mass spectra in the full scan runs were not obtained. The presence of carbamazepine in these samples suggests that the shallow groundwater in the central part of the study area has a component of wastewater, perhaps from septic discharge, although a direct connection between septic systems and the wells with occurrences cannot be made with the data at hand. Both NP (110 ng/L) and DEET (16 ng/L) were detected in sample 103002
One of the GC/MS target compounds, tris (1,3-dichloroisopropyl) phosphate, was detected in sample 103021 at a concentration of 27 ng/L. This compound is a commonly used flame retardant chemical and typically found in effluent from waste water treatment plants. The concentration of this compound was determined in the SIM analysis but it is shown in Figure 14 as one of the minor peaks in the full-scan run. A definitive mass spectrum provided absolute compound verification. This water sample also contained the common UV absorbing sunscreen agents oxybenzone and parsol MCX (2-ethylhexyl cinnamate), the two most commonly found polycyclic musk compounds AHTN (tonalide) and HHCB (galaxolide), and the HHCB transformation product HHCB-lactone (galaxolidone). The total polycyclic musk concentration was estimated at 180 ng/L. The polycyclic musks are common fragrance compounds present in a

39
wide variety of consumer personal care products. In this sample, the detections of sunscreen agents as well as the polycyclic musk compounds may be the result of contamination of the sample during sample collection. Numerous polycyclic musk fragrances have been found in wastewater effluents. Once discharged, these compounds can end up as trace contaminants in a variety of surface waters (Bester et al., 1998; Simonich et al., 2000; Osemwengie and Steinberg, 2001; Artola-Garicano et al., 2003; Buerge et al., 2003; Heberer, 2003; Ricking et al., 2003; Peck and Hornbuckle, 2004; Bester, 2005).
Chico - 103021
0.0E+00
5.0E+05
1.0E+06
1.5E+06
2.0E+06
2.5E+06
3.0E+06
3.5E+06
10 15 20 25 30 35 40 45 50 55 60
Time (minutes)
Res
pons
e
5α-Cholestane(Int. Std.)
D5-Atrazine(Surrogate)
Bis
(2-e
thyl
hexy
l pht
hala
te)
Gal
axol
ide
Tona
lide
Gal
axol
idon
e +
Par
sol M
CX
Oxy
benz
one
Sept
um B
leed
Tris
(1,3
-dic
hlor
oiso
prop
yl) p
hosp
hate
Unk
now
n
Figure 14. TIC of sample 103021, showing polycyclic musks, sunscreen compounds and tris (1,3-dichloroisopropyl) phosphate.
Figure 15 is the GC/MS chromatogram of the total extract for sample 103011 and is representative of the remaining samples from this study area, including the seven drinking water supply wells sampled. No target compounds were detected in the GC/MS SIM analysis and the extract was free of any GC/MS nontarget compounds. Peak labels identify the surrogate and internal standard and the typical minor contaminants, including butylated hydroxytoluene (BHT), several phthalates, and a trace compound from the injection port septum.
In summary, the small number of low-level detections of different trace organic compounds in shallow wells from the Chico area are difficult to interpret in connection with specific sources. The infrequent detections of carbamazepine, nonylphenol, and caffeine suggest that transport of wastewater, possibly from septic discharge, affects groundwater locally, at individual wells that sample recent recharge. (The monitoring wells included in this study are screened just below the water table and most have tritium-helium groundwater ages of less than 2 years.) The lack of detections in many of the shallow monitoring wells and in drinking water wells suggests that transport of wastewater indicator compounds is not widespread. Future work

40
should include closer inspection of discharge and transport of wastewater indicator compounds from individual septic systems to potentially affected groundwater.
Chico - 103011
0.0E+00
4.0E+05
8.0E+05
1.2E+06
1.6E+06
2.0E+06
10 15 20 25 30 35 40 45 50 55 60
Time (minutes)
Res
pons
e
5α-Cholestane(Int. Std.)
D5-Atrazine(Surrogate)
Phth
alat
e
Phth
alat
e
Phth
alat
e
BHT
Sept
um B
leed
Figure 15. TIC of sample 103011. The GC/MS chromatogram is representative of the clean water extracts from the Chico study area.
RESULTS FOR GILROY GROUNDWATER The South County Regional Wastewater Authority (SCRWA) operates a wastewater treatment, disposal, and water recycling facility for the cities of Morgan Hill and Gilroy. Biosolids are removed from the site and disposed of elsewhere, while secondary effluent is discharged to percolation over a 394-acre area around the facility. The capacity of both the wastewater treatment facility and the recycled water distribution system are presently being expanded to include a greater volume of water and areas of non-potable re-use. During the study period, the SCRWA distributed roughly 700 acre-ft of tertiary treated recycled water per year to three customers for non-potable uses, all irrigation. Two of the areas irrigated with treated wastewater, Christmas Hill Park and a farm, were sampled for this study. Treated wastewater has been used for irrigation at the farm site since 1999 and at the park since 2002. Groundwater occurs at depths of less than 20’ below ground surface at both sites, and groundwater levels are influenced by rainfall, irrigation, and regional pumpage. Groundwater flow is in a south-southeast direction. Five wells in the farm location and three wells in Christmas Hill Park were sampled and analyzed for the full suite of trace organic compounds, along with general minerals, tracers of water (stable isotopes and groundwater age), and tracers of nitrate fate and transport (Figure 16).
Relatively high chloride, sulfate, and sodium concentrations are obvious indicators of the presence of recycled water. In general, total dissolved solids concentrations in groundwater from

41
the study area exceed the concentrations observed in Llagas subbasin groundwater. Enrichment of salts in the vadose zone occurs during evapotranspiration, which is highest during periods of irrigation. Complex patterns of recharge from both irrigation return and precipitation that vary in time make interpretation of dissolved ion concentrations difficult. Therefore, salt concentrations are not reliable indicators of the presence or absence of a wastewater component and are even less reliable as tracers for quantifying the fraction of well water that originated as wastewater.
Tritium-helium groundwater ages in shallow wells are all 15 years or less, and the well showing the strongest influence of recycled water (MW-22 sample ID 103443), has a groundwater age of only 3 years, confirming a direct and fast connection between the well water and the recharge source (mainly applied irrigation water). Groundwater ages from wells in the immediate vicinity increase sharply as a function of depth to the top perforation (Table 4), and groundwater produced from a well with a top perforation at 100 ft. is tritium dead (indicating that it recharged more than about 50 years ago). A clay confining unit has been observed at a depth of approximately 100 ft in previous hydrogeologic characterization studies (DWR Bulletin 118).
Figure 16. Aerial photograph of Gilroy and surrounding area. The location of the SCRWA facilities is indicated with a red label; well locations are labeled with sample IDs discussed in the text.
Llagas Creek
Uvas Creek
SCRWA
deep
Christmas Hill Park
.2 km

42
δ18O that is enriched by about +1 ‰ in wells affected by recycled water recharge compared to shallow wells upgradient of the area of recycled water application (Figure 17) is another way in which the recycled water stands out. This shift in δ18O is also likely due to evaporation, either at the treatment plant or after water is applied to fields. Strongly enriched δ18O and δ15N of nitrate (Figure 18) are additional indicators of the influence of the recycled water on the produced groundwater. The trend in the observed shift, along a slope of roughly 0.5 on a plot of δ18O versus δ15N, is characteristic of denitrification. A denitrification step was added to the SCRWA treatment process in 1995.
Figure 17. The ratio of nitrate versus stable isotope signatures of oxygen in wells from the region affected by wastewater irrigation (pink symbols) and in other shallow wells in the Llagas Basin (yellow symbols). Wastewater-influenced groundwater is shifted to more enriched isotopic values compared to ambient groundwater.

43
0.0
2.0
4.0
6.0
8.0
10.0
12.0
14.0
16.0
18.0
0.0 5.0 10.0 15.0 20.0 25.0 30.0
δ15N of NO3- (per mil)
δ18O
of N
O3- (p
er m
il)
other Llagas Basin wellsStudy area wells
Figure 18. Nitrogen and oxygen isotope ratios in nitrate show a pattern characteristic of denitrification in samples influenced by recharge of wastewater.
Most significantly, the NP precursors NP1EC and NP2EC were detected in two shallow
monitoring wells (labeled 103443 and 103442 in Figure 19 and Table 3). Samples acquired one year apart from the same wells showed similar results (Table 3). The relatively high concentration observed in 103443, a sample estimated to be nearly 100% wastewater-derived, suggests that these surfactant-derived metabolites are transported through the vadose and saturated zones. In addition, there were detections of the endocrine-disrupting compound nonylphenol at concentrations up to 225 ng/L. Low level detections of NP in these wells may or may not be sampling artifacts. Low-level NP was also detected in Christmas Hill Park wells, although none of the other target compounds were detected in that area.

44
Figure 19. LC/MS/MS chromatogram of NP1EC (m/z 277 219) and NP2EC (m/z 321 219) in a Gilroy groundwater sample . The effective concentration of the internal standard (m/z 279 219) is 1 μg/L. The likely reason that the NP1EC and NP2EC peaks are broader than the internal standard peak (which is a labeled form of AP1EC) is that the former peaks represent mixtures of isomers whereas the internal standard peak represents a single compound only.
Figure 20 is the TIC from sample 103443. Two fatty acids (dodecanoic and tetradecanoic
acid) were found and a moderate UCM was present, which made it difficult to obtain definitive mass spectra for some of the compounds. Carbamazepine was detected in the concentrated extract and primidone was tentatively identified. Both of these compounds are anticonvulsant pharmaceuticals that have been found to be nearly conservative ground water tracers (Drewes et al., 2002; 2003), and therefore useful for tracing sewer exfiltration (Stamatelatou et al., 2003; Clara et al., 2004; Heberer and Adam, 2004; Fenz et al., 2005; Hinkle et al., 2005). There is a consensus in these recent publications on the fate and transport of pharmaceuticals in the groundwater that these antiepileptics and perhaps some metabolites appear to be some of the best organic tracers of groundwater contamination from municipal wastewater. The compound diphenamid was also tentatively identified in the extract. Diphenamid is a common amide herbicide and the identification was based on the mass spectrum. Carbamazepine and primidone were also detected in samples 103442, and sample 103446 had only primidone above the reporting limit (Figure 21). For the remaining samples (103439-103441, 103444-103445) no target compounds were detected in the GC/MS SIM runs and no additional non-target
NP2EC
NP1EC
Internal std.

45
compounds were detected in GC/MS full-scan runs. Caffeine was not detected (6 ng/L detection limit), suggesting a high removal rate in the soil or aquifer material. Likewise, many of the other target compounds, likely to be present in the irrigation water, were absent in groundwater samples.
Gilroy - 103443
0.0E+00
5.0E+03
1.0E+04
1.5E+04
2.0E+04
2.5E+04
39 40 41 42 43 44 45 46 47 48 49 50
Time (minutes)
Res
pons
e
Prim
idon
e
Car
bam
azep
ine
5α-Cholestane(Int. Std.)
Figure 20. TIC of sample 103443, showing the anticonvulsants primidone and carbamazepine.

46
Gilroy - 103446
0.0E+00
5.0E+03
1.0E+04
1.5E+04
2.0E+04
2.5E+04
39 40 41 42 43 44 45 46 47 48 49 50
Time (minutes)
Res
pons
e
Prim
idon
e
5α-Cholestane(Int. Std.)
Figure 21. TIC of sample 103446, showing common plasticizer contaminants and primidone.

47
RESULTS FOR LIVERMORE GOLF COURSE GROUNDWATER Livermore Water Reclamation Plant
Recycled water has been used at the Las Positas Golf Course (LPGC) in Livermore, California (Figure 22) since 1978 to provide turf irrigation for the golf course in what is a relatively arid climate. Average yearly precipitation at LPGC is approximately 15” per year and occurs primarily in the winter (Figure 23). Irrigation is necessary in the summer and approximately 36” per year of recycled water is required to maintain vegetation at the LPGC. Since 1978, irrigation of this area with treated wastewater has dominated the overall water budget.
LLNL has had regular, permitted releases of tritium to the LWRP, which have been carefully monitored by LLNL and by the LWRP. Since the release of radioactive materials into the environment is a source of community concern, LLNL developed detailed and aggressive environmental monitoring programs to monitor radioactive material releases. It is the combination of the tritium releases combined with detailed monitoring programs that makes the LPGC an interesting site to examine the fate and transport of wastewater indicators. It is appropriate to note that the release of trace amounts of tritium is not unique to LLNL. Many large cities have far larger annual tritium releases to their wastewater systems. Again, these other releases are carefully regulated, but do not receive the level of monitoring that LLNL has put in place. In the mid 1970s, the city of Livermore began a program to recycle wastewater and use the water to irrigate the LPGC. A group of 10 monitoring wells were installed to evaluate wastewater impacts on the local groundwater. Additionally, these wells were regularly monitored for tritium (3H). Overall volumes of irrigation water have been recorded along with total flows through the Livermore Water Reclamation Plant (LWRP). These data have been used to accurately calculate the 3H concentration in the applied irrigation water as a function of time. This was accomplished by performing two carefully monitored tritium releases from LLNL and following the 3H through the LWRP. Combining these data with 3H-3He groundwater age results, it was possible determine both the age and the degree of dilution from other water sources. This information was critical in the evaluation of observed concentrations of trace organic compounds from wastewater.

48
Figure 22. Aerial view of study site with monitoring well locations highlighted. Numbered sites refer to sample IDs discussed in the text.
Figure 23. Rainfall trends for the study area since 1970.
Livermore Rainfall
0
500
1000
1500
2000
2500
3000
3500
1970 1975 1980 1985 1990 1995Date
TotalApril-OctNov-MarchAverage
LWRP
LPGC

49
The monitoring results show the clear connection between the application of recycled water and the local shallow groundwater (Figure 24). The overall trend in tritium releases from LLNL is decreasing. While the LLNL tritium releases have always been well below regulatory limits, the general goal of programs using tritium at LLNL has been to reduce releases as much as can be reasonably achieved. Figure 24 shows a close match between the monitoring wells and the recycled water. As will be discussed, the relationship between the tritium concentration observed in the monitoring wells and the irrigation water is relatively complex, nevertheless, the presence of the tritium tracer provides a clear indication of the connection.
Figure 24. Time trends for tritium concentrations in LWRP effluent and selected monitoring wells.
Additional Isotopic Tracers of the Wastewater Component
Other isotopic tracers help to constrain the relationship between the sampled groundwater and its potential sources. The stable isotopes of H and O can potentially be used to identify contributions from local precipitation and wastewater from the LWRP. Most of the water used in the Livermore Valley comes from the State Water Project and consists of precipitation that fell in the Sierra Nevada at high altitude. This water is significantly depleted in the heavier stable isotopes of H and O when compared to local precipitation in the Livermore Valley. The ratio of oxygen isotopes in water (δ18O, expressed as ‰ deviation from standard mean ocean water) is about -7.5 for precipitation and -9.5 for wastewater from the LWRP. The data for O and H stable isotopes is shown in Figure 25. Evaporation of the applied irrigation water also produces shifts in the H and O isotopic compositions. The initial water compositions are connected by a line of slope 8, evaporation enriches both δ2H and δ18O along a line of slope 5. These data suggest that the samples represent a strongly evaporated mixture of wastewater and local precipitation. However, the uncertainties preclude an accurate determination of the mixing ratio of the two water sources.
10
100
1000
10000
1975 1980 1985 1990 1995 2000 2005Date
1P22R111B1LWRPExpon. (LWRP)

50
-65
-60
-55
-50
-45
-9.5 -8.5 -7.5 -6.5
δ 18O
LWRP
Precipitation
Evaporation trend
Figure 25. Isotopic signatures for LWRP effluent and LPGC groundwater samples. The isotopic composition of N and O in the nitrate present in the groundwater samples also shows the contribution of a wastewater component. Denitrification occurring during treatment leads to the correlated enrichment of δ15N and δ18O in the remaining nitrate. All of the groundwater samples from the golf course area, but not from other areas in Livermore, show this effect (Figure 26).
δD

51
0
2
4
6
8
10
12
14
16
18
0 10 20 30 40
δ15N of NO3 (per mil)
δ18O
of
NO
3 (
per
mil)
Other Shallow LWRP shallow
Figure 26. Shallow wells whose recharge source is treated wastewater from LWRP have isotopic signatures of nitrate that are distinct from other wells and indicate isotopic fractionation mediated by denitrification.
The 3H concentrations measured in groundwater fall between the two sources (LWRP water and precipitation) and one can calculate that the fraction of the groundwater due to the LWRP contribution ranges from 27 to 67%, and is 50% for sample 2J2. The initial estimate of 36” of irrigation water versus 15” of precipitation is easily reconciled with this result when evaporation is taken into account. Irrigation water applied in the summer undergoes much greater evaporation than does winter precipitation. This model predicts significant enrichment in nonvolatile dissolved components such as chloride. The LWRP wastewater averages 161 mg/L of Cl- over the period 1975 – 2000. The recovered groundwater samples show values greater than or equal to the LWRP value for Cl- (>400 mg/L). Thus, even though precipitation accounts for about half of the water, evaporation of the LWRP source more than makes up for this dilution. In summary, the recovered groundwater samples for this study were derived from a mixture of wastewater and local precipitation that infiltrated from surface application between about 1980 and 1995. While local precipitation causes some dilution of the wastewater, evaporative enrichment has produced net enrichments of nonvolatile dissolved components such as Cl-.

52
Results of Wastewater Indicator Analyses in LWRP Effluent and at LPGC Wells
One liter water samples were collected from two locations (E2R Outlet and UV Outlet) at the Livermore Water Reclamation Plant (LWRP). These samples were extracted using Waters Oasis HLB solid phase extraction cartridges and components eluted with 5 mL ethyl acetate. The eluents were adjusted to 1 mL and screened by GC/MS. LWRP effluent samples were also analyzed by LC/MS/MS using the procedures described previously.
In general, the findings for LWRP effluent are similar to findings (both the types of compounds and their concentrations) from previous studies of tertiary treated wastewater (e.g., Johnson and Sumpter, 2001). For example, caffeine was detected at approximately 1 μg/L, NP concentrations were 2 to 4 μg/L, AP1EC and AP2EC were detected at approximately 20 μg/L and 60 μg/L, respectively. Estrone 3-sulfate, estrone, and 17β-estradiol were not detected in LWRP effluent, despite detection limits in the low ng/L range. Removal of these compounds during advanced treatment is likely.
TICs were obtained for each sample. There was no significant difference in compositions or concentrations of the two extracts from the E2R and UV Outlet. Figure 27 shows the TIC of the E2R Outlet with some of the major compounds labeled. These compounds were identified using a combination of authentic standards, published mass spectra (e.g., Bester et al., 1997; 1998), and best mass spectra fits to mass spectra library databases (e.g., NBS Mass Spectra Library). Prominent unidentified compounds are labeled with key ion fragments. Full-scale response represents approximately 10 μg/L of analyte.
In addition to compounds detected by LC/MS/MS, other compounds of interest shown on the TIC are the following: benzothiazole and 2-(methylthio)-benzothiazole (Bester et al., 1997), N,N-diethyl-3-methylbenzamide (DEET, insect repellent); at least two polycyclic musk fragrances HHCB and AHTN (Bester et al., 1998); the alkyl- and aryl-phosphate fire retardants (tris (2-chloroethyl) phosphate, tris (1,3-dichloroisopropyl) phosphate and triphenyl phosphate), which have been shown to have low removal rates in simulated waste treatment processes (Westerhoff et al., 2005); and pharmaceuticals such as diphenylhydramine (antihistamine, diphenylhydramine hydrochloride is the active ingredient in Benadryl), gemfibrozil (lipid regulating agent) and carbamazepine (anti-seizure medication). [Note: No. 28 refers to cluster of five compounds with similar mass spectra (common ion fragments of m/z 107, 135, 165 and 193) and which are presumed to be structurally-related isomers.]

53
LWRP E2R Outlet - GC-MS of Total Extract
0.0E+00
1.0E+05
2.0E+05
3.0E+05
4.0E+05
5.0E+05
5 10 15 20 25 30 35 40 45 50
Time (minutes)
Res
pons
e
1 2
3 46 7
20
28
1621
14
37
13
109
35
36
5 12
118
19 23
18
33
1722
24
15
30
343231
25
26
2927
Figure 27. GC/MS TIC of total extract from E2R Outlet, Livermore Water Reclamation Plant with major peaks identified. 1. Benzaldehyde 21. Tris (2-chloroethyl) phosphate 2. Dichlorobenzene 22. N-Butylbenzenesulfonamide 3. 3,3,5-Trimethylcyclohexane 23. HHCB 4. Acetophenone 24. AHTN 5. Tetramethylpyrazine 25. 89,109,151 6. Camphene hydrate 26. Diphenylhydramine 7. 2-(1,1-Dimethylethyl)-cyclohexanol 27. Gemfibrozil 8. Benzothiazole 28. 107,135,165,193 9. 4-(1,1-Dimethylethyl)-cyclohexanone 29. Elemental sulfur 10. (68,80,83,107,109,135) 30. 58,91,119,134 11. Dimethylphenol 31. 145,173 12. 57,82,85,125 32. 58,257,272 13. 57,69,109,151,169 33. Tris (1,3-dichloroisopropyl) phosphate 14. 77,79,107 34. Carbamazepine 15. N-Cyclohexyl-2-pyrrolidone 35. Triphenyl phosphate 16. N,N-Diethyl-3-methylbenzamide (DEET) 36. Tris (2-butoxyethyl) phosphate 17. 2-(Methylthio)-benzothiazole 37. Bis (2-ethylhexyl) phthalate 18. Benzophenone 19. 109,151,213 20. 91,119,157,191

54
Wells from the Livermore golf course were sampled by pumping and bailing. Teflon-
lined pump tubing, and Teflon bailers were employed. Only two wells had detections of target compounds (well 2J2 with sample ID 103560, and well 1P2 sample ID 103559). After two rounds of sampling in which NP detections were determined to be sampling artifacts, subsequent samples collected with Teflon-lined pump tubing showed no detections of NP with a reporting limit of 10 ng/L. Most significantly, NP1EC and NP2EC were detected at concentrations of 130 ng/L and 18 ng/L, respectively, in well 2J2 (103560; Figure 28). Well 1P2 (103559) had a very low-level detection of NP1EC (4.5 ng/L). Compared to concentrations determined in LWRP water, these concentrations are more than 100-fold lower.
Figure 28. LC/MS/MS chromatogram of AP1EC (m/z 277 219) in a Livermore golf course groundwater sample. The effective concentration of the internal standard (m/z 279 219) is 1 μg/L.
Both pumped and bailed samples had low concentrations of herbicides but significant differences were observed between the pumped and bailed samples for both of these wells. Additional compounds, both target and non-target compounds, were detected in the bailed samples but these compounds are interpreted as contaminants introduced during the bailing process. Figure 29 shows the GC/MS TIC of sample 103559 (well 1P2). Three herbicides (simazine, oxadiazon and norflurazon) were detected in both the pumped and bailed samples. No additional target compounds were detected but a moderate amount of chromatographically unresolved compounds was present.
NP1EC
Internal std.

55
Livermore Golf Course - 1P2
0.0E+00
1.0E+06
2.0E+06
3.0E+06
4.0E+06
5.0E+06
6.0E+06
10 15 20 25 30 35 40 45 50 55 60
Time (minutes)
Res
pons
e
5α-Cholestane(Int. Std.)
D5-Atrazine(Surrogate)
Phth
alat
e
Phth
alat
e
Oxa
diaz
on
Sim
azin
e
Nor
flura
zon
Figure 29. The GC/MS TIC of well 1P2 (sample 103559).
Figure 30 shows the GC/MS TIC of sample 103560 (well 2J2). Only one herbicide (simazine) and the triazine herbicide breakdown product desethylatrazine were detected in the pumped and bailed water samples. The source of the triazine herbicides in these samples is likely application of these compounds in the vicinity of the wells, as the compounds detected are in widespread use for pest and weed control. The herbicide compounds were not detected in full scans of the wastewater effluent. A trace amount of benzothiazole was also detected in both the pumped and bailed samples. Benzothiazole and structurally-related compounds have been identified as a relevant class of chemicals that survive municipal wastewater treatment and may be useful as organic tracers of municipal wastewater (Bester et al., 1997; Kloepfer et al., 2005). Numerous additional compounds were present in the bailed sample, including several fatty acids, fatty acid methyl esters, N-butylbenzene sulfonamide, and triallyl isocyanurate, a crosslinking agent. The bailed water sample also had a higher than normal amount of bis (2-ethylhexyl) phthalate and a high level of the herbicide oryzalin. The additional compounds found in the bailed sample are interpreted as sampling artifacts. The bailed water sample also had a higher amount of chromatographically unresolved compounds that resulted in an increase in the baseline signal during the GC/MS sample run.
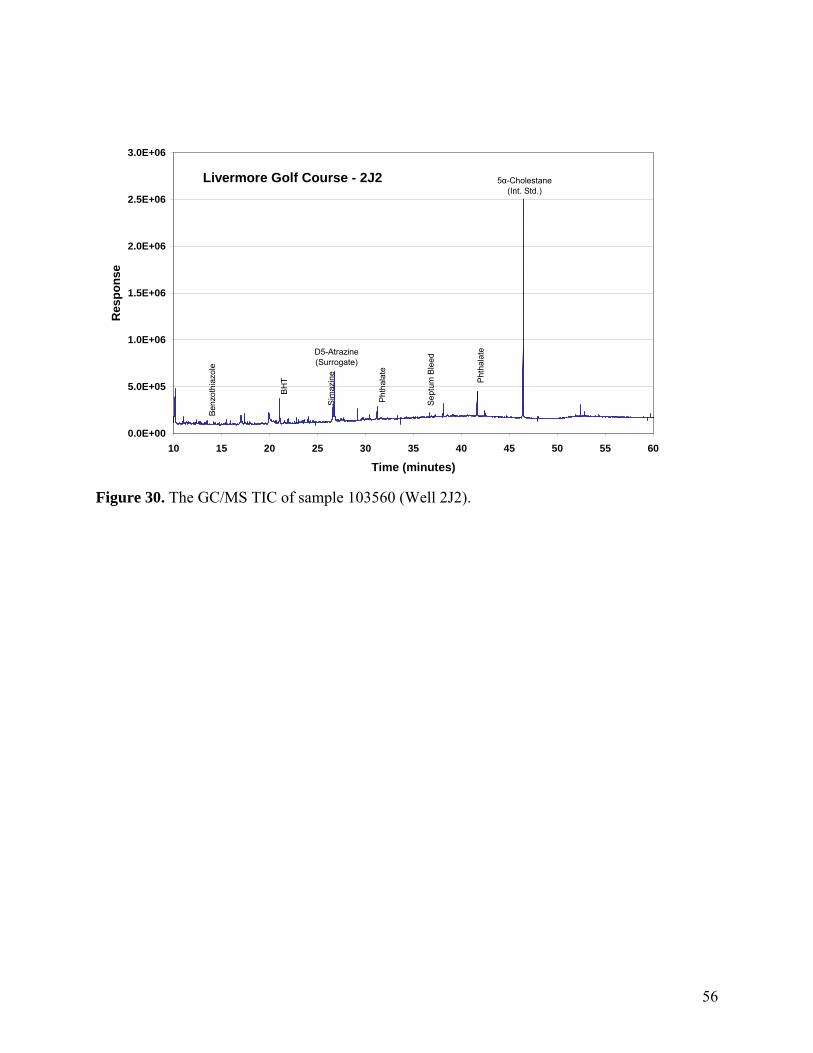
56
Livermore Golf Course - 2J2
0.0E+00
5.0E+05
1.0E+06
1.5E+06
2.0E+06
2.5E+06
3.0E+06
10 15 20 25 30 35 40 45 50 55 60
Time (minutes)
Res
pons
e
5α-Cholestane(Int. Std.)
D5-Atrazine(Surrogate)
Sim
azin
e
Phth
alat
e
Phth
alat
e
Sept
um B
leed
BH
T
Benz
othi
azol
e
Figure 30. The GC/MS TIC of sample 103560 (Well 2J2).

57
COMPARING RESULTS FROM TWO AREAS OF RECYCLED WATER APPLICATION
Similarities between the Livermore and Gilroy sites include the relatively long time period that recycled water has been applied (10 to 25 years), the wastewater treatment methods (both the LWRP and SCRWA underwent upgrades that included enhanced treatment with a denitrification step), and the amount of water applied per acre per year (about 3 ft). The semi-arid climate of both settings leads to high evapotranspiration, and opportunity for volatilization of some organic compounds, during the time that recycled water is applied.
In both areas of recycled water application, groundwater quality is characterized by high chloride, sulfate, and sodium concentrations compared to ambient groundwater. Somewhat higher TOC concentrations and lower nitrate concentrations than ambient groundwater are also characteristic of groundwater with a significant wastewater component. With respect to isotopic abundances, stable isotopes of the water molecule are enriched due to evaporation in both locations. In Gilroy, δ18O values of wastewater-influenced groundwater are about -5.0‰, compared to about -6.0‰ for other local groundwater sources (Figure 17), whereas in Livermore a similar shift of about 1‰ in oxygen isotope ratios is observed. Significantly, stable isotopes of nitrate show a large shift to values lighter than those recorded in ambient groundwater (Figures 18 and 26). Compared to other tracers of wastewater influence on groundwater, the shift in N and O isotopes of nitrate is robust and sensitive (i.e., a large signal relative to analytical uncertainty). The observed isotopic fractionation is due to denitrification, most of which likely occurs during wastewater treatment. Small amounts of dissolved excess nitrogen, equivalent to up to 12.5 mg/L as NO3
- were observed in wastewater-influenced groundwater, indicating that a small amount of saturated zone denitrification takes place at both sites. Groundwater age in water showing a wastewater component ranges from 2 to 24 years; ages on the young end are prevalent in Gilroy.
In spite of the high fraction of wastewater recharge produced at monitoring wells, as evidenced by multiple geochemical and isotopic indicators described above, occurrence of trace organic compounds that originate in wastewater is quite limited at both sites (Table 4). Sampling and analytical reliability is extremely well controlled at these sites – samples were collected with Teflon bailers and Teflon-lined pump tubing (decontaminated between wells), multiple sampling, trip, and analytical blanks were examined, and sampling and analysis was repeated using the same techniques in 2003 and 2005. Results from the two sampling campaigns are nearly identical. Reliable, reproducible detections above 50 ng/L of the two NPEC compounds were found in two wells (2J2 at Las Positas golf course in Livermore and MW22 in Gilroy). The concentrations observed were 130 and 840 ng/L, respectively. Other geochemical and isotopic indicators of wastewater influence are readily observable at these two wells. Lower level detections of NPEC compounds occurred in one additional well in Livermore and two additional wells in Gilroy. Very low-level detections (<50 ng/L) of nonylphenol occurred in all of the Gilroy wells that showed evidence of wastewater recharge, but nonylphenol was not detected above the reporting limit in Livermore. Carbamazepine and primadone were detected in Gilroy in the same two wells that had detections of NPECs, and primadone was detected in one additional well in Gilroy.

58
Table 4. Key parameters for comparing results from the Livermore study area (shaded) and the Gilroy study area (unshaded). Wells in bold text are those most strongly influenced by a wastewater signature. (Fraction recycled water is calculated using the observed tritium concentration and a hydrologic model as described in the text for Livermore. For Gilroy wells, the recycled water fraction was determined via mixing ratios that are based on approximations for major ion concentrations in irrigation water and ambient groundwater end members.)
Gilroy parkGilroy park
Gilroy farm
Gilroy farm offsite
Gilroy farm
Gilroy farm
LPGCLPGCLPGC
LPGC offiste
LPGC
Location
NPECs, herbicides, benzothiazole
36-4919312J2
NC~10
0
~30
~40
~756739-4827-29
50-67
Fraction Recycled H2O (%)
primadone248Bloom-1
none<129CH-1&2none2770Bolsa-2
none>50100MW-21
NPECs, carbamazepineprimadone
1520MW-24
NPECs, carbamazepineprimadone
310MW-22none145511C3none7212R1none24352Q1
NPECs, herbicides5401P2
Target compounds detected (ng/L)
GW age (yrs)Depth to top perf (ftbgs)
Well
Given that these compounds are present in typical municipal tertiary treated wastewater
effluent at concentrations in the low μg/L range, their presence at the low concentrations observed (or, more frequently, their complete absence) in groundwater indicates substantial removal during recharge. Overall, concentrations of NP, NP1EC, NP2EC, and caffeine were from ~130- to 360-fold lower in LPGC groundwater than in irrigation water (i.e., LWRP effluent). Since hydrological modeling indicates that irrigation water was diluted only 33 to 73% with local precipitation in the aquifer, attenuation of these compounds during transport through the vadose zone and saturated zone (e.g., by sorption for the NPECs and NP, and by biodegradation for caffeine) must have been quite substantial. The detections of carbamazepine and primadone differ in that the concentrations typically observed in tertiary treated wastewater

59
are of the same order of magnitude as the maximum concentrations observed in the groundwater samples, suggesting a low rate of removal during recharge and transport.
The occurrence of NPECs in groundwater from the two areas directly influenced by wastewater recharge sets those areas apart from ambient groundwater. Although groundwater from the two areas of wastewater recharge has distinctive major ion chemistry and isotopic signatures, with the exception of NPECs, it does not differ significantly from ambient groundwater with respect to occurrence of wastewater indicator compounds.
Findings on the fate of pharmaceuticals and PCPs from riverbank infiltration sites (Vogel et al., 2005, Schmidt et al., 2003), and from the well-studied Sweetwater soil-aquifer treatment site in Arizona (Fox et al., 2001, Drewes et al., 2002) indicate that significant attenuation and/or removal occurs for most compounds analyzed. Compared to those studies, the Livermore and Gilroy sites offer evidence for even more attenuation and/or removal. For example, the Schmidt et al. (2003) study shows that organophosphate esters persist in groundwater some distance from the recharge zone, while these compounds were not found in Livermore or Gilroy groundwater. Certain characteristics of the two sites likely contribute to the even greater attenuation rate observed in Livermore and Gilroy:
• In riverbank filtration sites, as well as at the Sweetwater SAT site, transport is predominantly by saturated flow, whereas the Livermore and Gilroy sites have well-established vadose zones. Vadose zone transport is likely important for removal of a number of compounds by biodegradation and sorption.
• Groundwater is initially oxygenated at the Livermore and Gilroy sites, but conditions become anaerobic at a shallow depth in the saturated zone, which likely promotes degradation of, e.g., sulfamethoxazole and other pharmaceuticals (Jekels and Gruenheid, 2005).
• Compared to the riverbank infiltration and Sweetwater sites, the groundwater examined in Livermore and Gilroy has had a longer residence time in the subsurface. Mean groundwater ages point to residence times of 2 to 27 years, while subsurface residence times at the riverbank infiltration and Sweetwater sites are measured in weeks to months. A longer subsurface residence time offers more opportunity for both degradation and for mixing with other water sources, including water that recharged at much earlier times.
This last factor may be the controlling one for the observed differences between the
Livermore and Gilroy sites. For example, the pharmaceuticals that were observed in Gilroy (carbamazepine and primadone) may have been attenuated during the longer residence time for Livermore groundwater. Detecting even the most refractory compounds becomes quite unlikely at longer residence times and with greater dilution by ambient groundwater.

60
REFERENCES Ahel, M., Giger, W., and M. Koch. 1994. Behavior of alkylphenol polyethoxylate surfactants in the aquatic environment – I. occurrence and transformation in sewage treatment. Water Research. 28:1131-1142. Andresen J. and Bester K. (2006) Elimination of organophosphate ester flame retardants and plasticizers in drinking water purification. Water Res. 40, 621-629. Andresen J. A., Grundmann A. and Bester K. (2004) Organophosphorous flame retardants and plasticizers in surface waters. Sci. Total Environ. 332, 155-166. Artola-Garicano E., Borkent I., Hermens J. L. M. And Vaes W. H. J. (2003) Removal of two polycyclic musks in sewage treatment plants: Freely dissolved and total concentrations. Environ. Sci. Tech. 37, 3111-3116. Barnes K. K., Christenson S. C., Kolpin D. W., Focazio M. J., Furlong E. T., Zaugg S. D., Meyer M. T. and Barber L. B. (2004) Pharmaceuticals and other organic waste water contaminants within a leachate plume downgradient of a municipal landfill. Ground Water Monit. Remed. 24, 119-126. Benijts T., Lambert W. and De Leenheer A. (2004) Analysis of multiple endochrine disruptors in environmental waters via wide-spectrum solid-phase extraction and dual-polarity ionization LC-ion trap-MS/MS. Anal. Chem. 76, 704-711. Berna J. L., Ferrer J., Moreno A., Prats D. And Ruiz Bevia F. (1989) The fate of LAS in the environment. Tenside Surfactants Detergents 26, 101-107. Bester K. (2005) Polycyclic musks in the Ruhr catchment area – Transport, discharges of wastewater, and transformations of HHCB, AHTN and HHCB-lactone. J. Environ. Monit. 7, 43-51. Bester K., Huhnerfuss H., Lange W., Rimkis G. and Theobald N. (1998) Results of non target screening of lipophilic organic pollutants in the German Bight II: Polycyclic musk fragrances. Wat. Res. 32, 1857-1863. Bester K., Huhnerfuss H., Lange W. and Theobald N. (1997) Results of non-target screening of lipophilic organic pollutants in the German Bight I: Benzothiazoles. Sci. Total Environ. 207, 111-118. Blackburn, M. A. and M. J. Waldock. 1995. Concentrations of alkyphenols in rivers and estuaries in England and Wales. Water Research. 29:1623-1629.

61
Buerge I. J., Buser H.-R., Muller M. D. and Poiger T. (2003) Behavior of the polycyclic musks HHCB and AHTN in lakes, two potential anthropogenic markers for domestic wastewater in surface waters. Environ. Sci. Tech. 37, 5636-5644. Buerge I. J., Poiger T., Muller M. D. and Buser H.-R. (2003) Caffeine, an anthropogenic marker for wastewater contamination of surface waters. Environ. Sci. Tech. 37, 691-700. Clara M., Strenn B. and Kreuzinger N. (2004) Carbamazepine as a possible anthropogenic marker in the aquatic environment: Investigation on the behavior of carbamazepine in wastewater treatment and during groundwater infiltration. Water Res. 38, 947-954. Cavill G. W. (1969) Insect terpenoids and nepetalactone. In Cyclopentanoid Terpene Derivatives (Eds. W. I. Taylor and A. R. Battersby), pp. 203-238. Marcel Dekker, New York. Cavill G. W. and Houghton E. (1974) Volatile constituents of the Argentine ant, Iridomyrmex humilis. J. Insect Physiol. 10, 2049-2059. Dougan J. and Tan L. (1973) Detection and quantitative measurement of fecal water pollution using a solid-injection gas chromatographic technique and fecal steroids as a chemical index. J. Chrom. 86, 107-116. Drewes J. E., Heberer T., Rauch T. and Reddersen K. (2003) Fate of pharmaceuticals during groundwater recharge. Groundwater Monit. Remed. 23, 64-72. Drewes J. E., Heberer T. and Reddersen K. (2002) Fate of pharmaceuticals during indirect potable reuse. Water Sci. Tech. 46, 73-80. Eglinton G., Simoneit B. R. T. and Zoro J. A. (1975) Recognition of organic pollutants in aquatic sediments. Pro. Royal Soc. Lond. Ser. B 189, 415-442. Fenz R., Blaschke A. P., Clara M., Kroiss H., Mascher D. And Zessner M. (2005) Monitoring of carbamazepine concentrations in wastewater and groundwater to quantify sewer leakage. Water Sci. Tech. 52, 205-213. Federle T. W., Kaiser S. K. and Nuck B. A. (2002) Fate and effects of triclosan in activated sludge. Environ. Tox. Chem. 21, 1330-1337. Fox P, Narayanaswamy K, Genz A, Drewes JE (2001) Water quality transformations during soil aquifer treatment at the Mesa Northwest Water Reclamation Plant, USA. Water Sci Technol.;43(10):343-50. Fradin M. S. (1998) Mosquitos and mosquito repellents: A clinician’s guide. Annals Int. Med. 128, 931-940. Fries E. and Puttmann W. (2001) Occurrence of organophosphate esters in surface waters and ground waters in Germany. J. Environ. Monit. 3, 621-626.

62
Fries E. and Puttmann W. (2003) Monitoring of the three organophosphate esters TBE, TCEP and TBEP in river water and ground water (Oder, Germany). J. Environ. Monit. 5, 346-352. Gregor J., Garrett N., Gilpin B., Randall C. and Saunders D. (2002) Use of classification and regression tree (CART) analysis with chemical faecal indicators to determine sources of contamination. New Zealand J. Mar. Freshwater Res. 36, 387-398. Halden R. U. and Paull D. H. (2005) Co-occurrence of triclocarban and triclosan in U.S. water resources. Environ. Sci. Tech. 39, 1420-1426. Halvorsan H. (1969) Microbiology of domestic wastes. 3. Metabolism of LAS-type detergents by bacteria from a sewage lagoon. Can. J. Microbiol. 15, 571-576. Hand V. C. and Williams G. K. (1987) Structure-activity relationships for sorption of linear alkylbenzenesulfonates. Environ. Sci. Tech. 21, 370-373. Hatcher P. G., Keister L. E. and McGillivary P. A. (1977) Steroids as sewage specific indicators in New York Bight sediments. Bull. Environ. Contam. Tox. 17, 491-498. Hatcher P. G. and McGillivary P. A. (1979) Sewage contamination in the New York Bight. Coprostanol as an indicator. Environ. Sci. Tech. 13, 1225-1229. Heberer T. (2003) Occurrence, fate, and assessment of polycyclic musk residues in the aquatic environment – A review. Acta Hydrochim. Hydrobiol. 30, 227-243. Heberer T. and Adam M. (2004) Transport and attenuation of pharmaceutical residues during artificial groundwater replenishment. Environ. Chem. 1, 22-25. Hinkle S. R., Weick R. J., Johnson J. M., Cahill J. D., Smith S. D. and Rich B. J. (2005) Organic Wastewater Compounds, Pharmaceuticals, and Coliphage in Groundwater Receiving Discharge from Onsite Wastewater Treatment Systems Near La Pine, Oregon: Occurrence and Implications for Transport. Project No. WU-HT-03-05. Prepared for the National Decentralized Water Resources Capacity Development Project, Washington University, St. Louis, MO, by the Oregon Department of Environmental Quality, Portland, OR. Isobe K. O., Tarao M., Zakaria M. P., Chiem N. H., Minh L. Y. And Takada H. (2002) Quantitative application of fecal sterols using gas chromatography-mass spectrometry to investigate fecal pollution in tropical waters: Western Malaysia and Mekong Delta, Vietnam. Environ. Sci. Tech. 36, 4497-4507. Jekel, M. and Gruenheid, S. (2005) Bank filtration and groundwater recharge for treatment of polluted surface waters. Water science & technology : Water supply. 5: 57-66. Johnson, A. C., and J. P. Sumpter. 2001. Removal of endocrine-disrupting chemicals in activated sludge treatment works. Environmental Science and Technology. 35:4697-4703.

63
Karsa D. R. (1998) Coming clean: The world market for surfactants. Chem. Ind. 17, 685-689. Kiely T., Donaldson D. and Grube A. (2004) Pesticides Industry Sales and Usage: 2000 and 2001 market estimates. U. S. EPA Office of Prevention, Pesticides and Toxic Substances. Office of Pesticides Programs. Biological and Economic Analysis Division. Washington D.C. Kolpin, D. W., Furlong, E. T., Meyer, M. T., Thurman, E. M., Zaugg, S. D., Barber, L. B., and H. T. Buxton. 2002. Pharmaceuticals, hormones, and other organic wastewater contaminants in U.S. streams, 1999-2000: a national reconnaissance. Environmental Science and Technology. 36:1202-1211. Krueger C. J., Barber L. B., Metge D. W. and Field J. A. (1998) Fate and transport of linear alkylbenzenesulfonate in a sewage-contaminated aquifer: A comparison of natural-gradient pulse tracer tests. Environ. Sci. Tech. 32, 1134-1142. Leeming R., Ball A., Ashbolt N., Jones G. and Nichols P. (1994) Distinguishing between human and animal sources of faecal pollution. Chem. Australia 61, 434-435. Leeming R., Ball A., Ashbolt N. and Nichols P. (1996) Using faecal sterols from humans and animals to distinguish faecal pollution in receiving waters. Wat. Res. 30, 2893-2900. Leeming R., Nichols P. D. and Ashbolt N. (1998) Distinguishing sources of faecal pollution in Australian inland coastal waters using sterol biomarkers and microbial faecal indicators. CSIRO Report 98-WSAA. Repost prepared for the Water Services Association of Australia. Lindqvist N., Tuhkanen T. and Kronberg L. (2005) Occurrence of acidic pharmaceuticals in raw and treated sewages and in receiving waters. Wat. Res. 39, 2219-2228. Liu R., Zhou J. and Wilding A. (2004) Simultaneous determination of endochrine disrupting phenolic compounds and steroids in water by solid-phase extraction-gas chromatography-mass spectrometry. J. Chrom. A 1022, 179-189. McAvoy D. C., Schatowitz B., Jacob M., Hauk A. and Eckhoff W. S. (2002) Measurement of triclosan in wastewater treatment systems. Environ. Tox. Chem. 21, 1323-1329. Meyer J. and Bester K. (2004) Organophosphate flame retardants and plasticizers in wastewater treatment plants. J. Environ. Monit. 6, 599-605. Moran J.E., Hudson, G.B., Eaton, G.F., and Leif, R. (2005) California GAMA Program: Groundwater Ambient Monitoring and Assessment Results for the Sacramento Valley and Volcanic Provinces of Northern California. Lawrence Livermore National Laboratory internal report, UCRL-TR-209191, 71 pp.

64
Osemwengie L. I. and Steinberg S. (2001) On-site solid-phase extraction and laboratory analysis of ultra-trace synthetic musks in municipal sewage effluent using gas chromatography-mass spectrometry in the full-scan mode. J. Chrom. A 932, 107-118. Painter H. A. and Zabel T. (1989) The behaviour of LAS in sewage treatment. Tenside Surfactants Detergents 26, 108-115. Peck A. M. and Hornbuckle K. C. (2004) Synthetic musk fragrances in Lake Michigan. Environ. Sci. Tech. 38, 367-372. Planas C., Guadayol J. M., Droguet M., Escalas A., Rivera J. and Caixach J. (2002) Degradation of polyethoxylated nonylphenols in a sewage treatment plant. Quantitative analysis by isotopic dilution-HRGC/MS. Wat. Res. 36, 982-988. Quintana J., Carpinteiro J., Rodriguez I., Lorenzo R., Carro A. And Cela R. (2004) Determination of natural and synthetic estrogens in water by gas chromatography with mass spectrometric detection. J. Chrom. A 1024, 177-185. Ricking M., Schwarzbauer J., Hellou J., Svenson A. and Zitko V. (2003) Polycyclic aromatic musk compounds in sewage treatment plant effluents of Canada and Sweden – First results. Mar. Poll. Bull. 46, 410-417. Rudel R. A., Melly S. J., Geno P. W., Sun G. And Brody J. G. (1998) Identification of alkylphenols and other estrogenic phenolic compounds in wastewater, septage, and groundwater on Cape Cod, Massachusetts. Environ. Sci. Tech. 32, 861-869. Schleheck D. Knepper T. P., Fischer K. and Cook A. M. (2004) Mineralization of individual congeners of linear alkylbenzenesulfonate by defined pairs of heterotrophic bacteria. Appl. Environ. Microbiol. 70, 4053-4063. Schmidt et al., (2003) http://www.tzw.de/pdf/bankfiltration.pdf Seiler, R. L., Zaugg, S. D., Thomas, J. M., and D. L. Howcroft. 1999. Caffeine and pharmaceuticals as indicators of wastewater contamination in wells. Ground Water. 37:405-410. Simonich S. L., Begley W. M., Debaere G. and Eckhoff W. S. (2000) Trace analysis of fragrance materials in wastewater and treated wastewater. Environ. Sci. Tech. 34, 959-965. Singer H. P., Muller S. R., Tixier C. and Pillonel L. (2002) Occurrence and fate of a widely used biocide in the aquatic environment: Field measurements in wastewater treatment plants, surface waters and lake sediments. Environ. Sci. Tech. 36, 3482-3489. Stackelberg P. E., Furlong E. T., Meyer M. T., Zaugg S. D., Henderson A. K. and Reissman D. B. (2004) Persistence of pharmaceutical compounds and other organic wastewater contaminants in a conventional drinking-water-treatment plant. Sci. total Environ. 329, 99-113.

65
Stamatelatou K., Frouda C., Fountoulakis M. S., Drillia P., Kornaros M. and Lyberatos G. (2003) Pharmaceuticals and health care products in wastewater effluents: the example of carbamazepine. Water Sci. Tech.: Water Supply 4, 131-137. Standley, L. J., Kaplan, L. A., and D. Smith. 2000. Molecular tracers of organic matter sources to surface water resources. Environmental Science and Technology. 34:3124-3130. Swisher R. D. (1963) The chemistry of surfactant biodegradation. J. Am. Oil Chem. Soc. 40, 648-656. Swisher R. D. (1987) Surfactant Biodegradation, 2nd ed., Marcel Dekker, New York, pp 431-445. Tabor C. F. and Barber L. B. (1996) Fate of linear alkylbenzene sulfonate in the Mississippi River. Environ. Sci. Tech. 30, 161-171. Tan L. J., Nielsen N. H., Young D. C. and Trizna Z. (2002) Use of antimicrobial agents in consumer products. Archives Derm. 138, 1082-1086. Teshima S. and Kanazawa A. (1978) Occurrence of coprostanol, 24-ethylcoprostanol and 5α-stanols in the marine environment. J. Ocean. Soc. Japan 34, 85-92. Tixier, C., H. P. Singer, Canonica S., and S. R. Muller (2002) Phototransformation of triclosan in surface waters: A relevant elimination process for this widely used biocide – Laboratory studies, field measurements, and modeling. Environ. Sci. Tech. 36, 4998-5004. Tixier, C., H. P. Singer, S. Oellers, and S. R. Muller. 2003. Occurrence and fate of carbamazepine, clofibric acid, diclofenac, ibuprofen, ketoprofen, and naproxen in surface waters. Environmental Science and Technology 37:1061-1068. U.S. EPA (1998) Reregistration Eligibility Decision (RED): DEET. Office of Pesticide Programs. Special Review and Reregistration. EPA738-R-98-010. Washington D.C. Vogel et al., (2005) http://pubs.usgs.gov/ds/2005/117/pdf/ds117_front.pdf Wagener S. and Schink B. (1987) Anaerobic degradation of nonionic and ionic surfactants in enrichment cultures and fixed-bed reactors. Wat. Res. 5, 615-622. Weigel S., Kuhlmann J. and Huhnerfuss H. (2002) Drugs and personal care products as ubiquitous pollutants: Occurrence and distribution of clofibric acid, caffeine and DEET in the North Sea. Sci. Total Environ. 295, 131-141. Westerhoff P., Yoon Y., Snyder S. and Wert E. (2005) fate of endocrine-disruptor, pharmaceutical, and personal care product chemicals during simulated drinking water treatment processes. Environ. Sci. Tech. 39, 6649-6663.

66
WHO (1991) Environmental Health Criteria 111: Triphenyl Phosphate. World Health Organization, Geneva. WHO (1991) Environmental Health Criteria 169: Linear Alkylbenzene Sulfonates and Related Compounds. World Health Organization, Geneva. WHO (1998) Environmental Health Criteria 209: Flame Retardants: Tris (Chloropropyl) Phosphate and Tris (2-Chloroethyl) Phosphate. World Health Organization, Geneva. Ying G.-G., Williams B. and Kookana R. (2002) Environmental fate of alkylphenols and alkylphenol ethoxylates – A review. Environ. Int. 28, 215-226.