Embed Size (px)
Citation preview
California Public Employees’ Retirement System Actuarial Office
P.O. Box 942701 Sacramento, CA 94229-2701 TTY: (916) 795-3240 (888) 225-7377 phone • (916) 795-2744 fax www.calpers.ca.gov
October 2012
MISCELLANEOUS PLAN OF THE VANDENBERG VILLAGE COMMUNITY SERVICES DISTRICT (CalPERS ID 1149117798) Annual Valuation Report as of June 30, 2011 Dear Employer, As an attachment to this letter, you will find a copy of Section 1 of the June 30, 2011 actuarial valuation report of your pension plan. Since your plan had less than 100 active members in at least one valuation since June 30, 2003, it is required to participate in a risk pool. The valuation report is divided into two Sections:
Section 1 contains specific information for your plan, including the development of your pooled employer
contribution rate, and Section 2 contains the Risk Pool Actuarial Valuation appropriate to your plan, as of June 30, 2011.
Section 2 may be found on the CalPERS website (www.calpers.ca.gov) then selecting Employers >Actuarial & GASB 27 Information >Risk Pooling >Risk Pool Annual Valuation Report, or at the following address: http://ow.ly/eNpMg. This report contains important actuarial information about your pension plan at CalPERS. Your CalPERS staff actuary is available to discuss the report with you.
Changes Since the Prior Valuation The CalPERS’ Board of Administration adopted updated actuarial assumptions to be used beginning with the June 30, 2011 valuation. The inflation rate changed from 3% to 2.75% and the discount rate changed from 7.75% to 7.5%. In addition, a temporary modification to our method of determining the actuarial value of assets and amortizing gains and losses was implemented for the valuations as of June 30, 2009 through June 30, 2011. The effect of those modifications continues in this valuation. There may also be changes specific to your plan such as contract amendments and funding changes. Future Contribution Rates The exhibit below displays the required employer contribution rate and Superfunded status for 2013/2014 along with an estimate of the contribution rate and Superfunded status for 2014/2015. The estimated rate for 2014/2015 is based on a projection of the most recent information we have available, including an estimate of the investment return for fiscal 2011/2012, namely 0%. See Section 2 Appendix E, “Analysis of Future Investment Return Scenarios”, for how much the Risk Pool’s portion of your rate is expected to increase in 2015/2016 rate projections
under a variety of investment return scenarios for the Risk Pool’s portion of your rate. Please disregard any projections that we may have provided to you in the past.
Fiscal Year Employer Contribution Rate Superfunded?
2013/2014 15.685% No 2014/2015 16.6% (projected) No
Member contributions (whether paid by the employer or the employee) are in addition to the above rates. Further, these rates do not reflect any cost sharing. The estimate for 2014/2015 assumes that there are no future amendments and no liability gains or losses (such as larger than expected pay increases, more retirements than expected, etc.). This is a very important assumption because these gains and losses do occur and can have a significant effect on your contribution rate. Even for the largest plans, such gains and losses can impact the employer’s contribution rate by one or two percent or even more in some less common instances. These gains and losses cannot be predicted in advance so the projected employer contribution rate for 2014/2015 is just an estimate. Your actual rate for 2014/2015 will be provided in next year’s report.
MISCELLANEOUS PLAN OF THE VANDENBERG VILLAGE COMMUNITY SERVICES DISTRICT (CalPERS ID 1149117798) October 2012 Page 2
California Actuarial Advisory Panel Recommendations The report satisfies all basic disclosure requirements under the Model Disclosure Elements for Actuarial Valuation Reports recommended by the California Actuarial Advisory Panel, except for the original base amounts of the unfunded liability amortization. The report gives the following additional information classified as enhanced risk disclosures under the Model Disclosure Elements for Actuarial Valuation Reports recommended by the California Actuarial Advisory Panel:
“Deterministic stress test”, projecting future results under different investment income scenarios. (See Appendix E’s Analysis of Future Investment Return Scenarios, from Section 2 of this report.)
“Sensitivity analysis”, showing the impact on current valuation results of a plus or minus 1% change in the discount rate. (See Appendix E’s Analysis of Discount Rate Sensitivity, from Section 2 of this report.)
We are very busy preparing actuarial valuations for other public agencies and expect to complete all such valuations by the end of October. We understand that you might have a number of questions about these results. While we are very interested in discussing these results with your agency, in the interest of allowing us to give every public agency their result, we ask that, if at all possible, you wait until after October 31 to contact us with questions. If you have questions, please call (888) CalPERS (225-7377). Sincerely,
ALAN MILLIGAN, Chief Actuary
ACTUARIAL VALUATION as of June 30, 2011
for the MISCELLANEOUS PLAN
of the VANDENBERG VILLAGE COMMUNITY
SERVICES DISTRICT (CalPERS ID 1149117798)
REQUIRED CONTRIBUTIONS
FOR FISCAL YEAR July 1, 2013 - June 30, 2014

TABLE OF CONTENTS
SECTION 1 – PLAN SPECIFIC INFORMATION
SECTION 2 – RISK POOL ACTUARIAL VALUATION INFORMATION
FIN PROCESS CONTROL ID (CY): 399866 FIN PROCESS CONTROL ID (PY): 369323 REPORT ID: 70681


Section 1
C A L I F O R N I A P U B L I C E M P L O Y E E S ’ R E T I R E M E N T S Y S T E M
Plan Specific Information for the MISCELLANEOUS PLAN
of the VANDENBERG VILLAGE COMMUNITY SERVICES DISTRICT
(CalPERS ID 1149117798)
(Rate Plan # 1612)

TABLE OF CONTENTS
ACTUARIAL CERTIFICATION 1
HIGHLIGHTS AND EXECUTIVE SUMMARY 3
PURPOSE OF SECTION 1 3
REQUIRED EMPLOYER CONTRIBUTIONS 4
PLAN’S FUNDED STATUS 5
SUPERFUNDED STATUS 5
PROJECTED CONTRIBUTIONS 5
RATE VOLATILITY 6
SUMMARY OF FINANCIAL AND DEMOGRAPHIC INFORMATION 7
PLAN’S SIDE FUND 7
DEVELOPMENT OF THE ACTUARIAL VALUE OF ASSETS 8
FUNDING HISTORY 8
PLAN’S TOTAL NORMAL COST RATE 8
HYPOTHETICAL TERMINATION LIABILITY 9
SUMMARY OF PARTICIPANT DATA 9
LIST OF CLASS 1 BENEFIT PROVISIONS 9
INFORMATION FOR COMPLIANCE WITH GASB STATEMENT NO. 27 10
SUMMARY OF PLAN’S MAJOR BENEFIT OPTIONS 11

SECTION 1 – PLAN SPECIFIC INFORMATION FOR THE MISCELLANEOUS PLAN OF THE VANDENBERG VILLAGE COMMUNITY SERVICES DISTRICT
CalPERS Actuarial Valuation – June 30, 2011 Page 1 Rate Plan belonging to Miscellaneous 2.7% at 55 Risk Pool
ACTUARIAL CERTIFICATION
Section 1 of this report is based on the member and financial data contained in our records as of June 30, 2011 which was provided by your agency and the benefit provisions under your contract with CalPERS. Section 2 of this report is based on the member and financial data as of June 30, 2011 provided by employers participating in the risk pool to which your plan belongs and benefit provisions under the CalPERS contracts for those agencies. As set forth in Section 2 of this report, the Pool Actuary has certified that, in her opinion, the valuation of the Risk Pool containing your MISCELLANEOUS PLAN has been performed in accordance with generally accepted actuarial principles consistent with standards of practice prescribed by the Actuarial Standards Board, and that the assumptions and methods are internally consistent and reasonable for the Risk Pool, as prescribed by the CalPERS Board of Administration according to provisions set forth in the California Public Employees’ Retirement Law.
Having relied upon the information set forth in Section 2 of this report and based on the census and benefit provision information for your plan, it is my opinion as your Plan Actuary that the Side Fund as of June 30, 2011 and employer contribution rate as of July 1, 2013, have been properly and accurately determined in accordance with the principles and standards stated above.
The undersigned is an actuary for CalPERS, who is a member of both the American Academy of Actuaries and Society of Actuaries and meets the Qualification Standards of the American Academy of Actuaries to render the actuarial opinion contained herein.
KERRY J. WORGAN, MAAA, FSA, FCIA Senior Pension Actuary, CalPERS Plan Actuary

SECTION 1 – PLAN SPECIFIC INFORMATION FOR THE MISCELLANEOUS PLAN OF THE VANDENBERG VILLAGE COMMUNITY SERVICES DISTRICT
CalPERS Actuarial Valuation – June 30, 2011 Page 2 Rate Plan belonging to Miscellaneous 2.7% at 55 Risk Pool
THIS PAGE
INTENTIONALLY
LEFT BLANK
SECTION 1 – PLAN SPECIFIC INFORMATION FOR THE MISCELLANEOUS PLAN OF THE VANDENBERG VILLAGE COMMUNITY SERVICES DISTRICT
CalPERS Actuarial Valuation – June 30, 2011 Page Rate Plan belonging to Miscellaneous 2.7% at 55 Risk Pool
3
HIGHLIGHTS AND EXECUTIVE SUMMARY
Purpose of Section 1
This section 1 report for the MISCELLANEOUS PLAN of the VANDENBERG VILLAGE COMMUNITY SERVICES DISTRICT of the California Public Employees’ Retirement System (CalPERS) was prepared by the Plan Actuary in order to: set forth the actuarial assets and accrued liabilities of this plan as of June 30, 2011; determine the required employer contribution rate for this plan for the fiscal year July 1, 2013 through
June 30, 2014; provide actuarial information as of June 30, 2011 to the CalPERS Board of Administration and other
interested parties; and provide pension information as of June 30, 2011 to be used in financial reports subject to Governmental
Accounting Standards Board (GASB) Statement Number 27 for a Cost Sharing Multiple Employer Defined Benefit Pension Plan.
The use of this report for any other purposes may be inappropriate. In particular, this report does not contain information applicable to alternative benefit costs. The employer should contact their actuary before disseminating any portion of this report for any reason that is not explicitly described above.
SECTION 1 – PLAN SPECIFIC INFORMATION FOR THE MISCELLANEOUS PLAN OF THE VANDENBERG VILLAGE COMMUNITY SERVICES DISTRICT
CalPERS Actuarial Valuation – June 30, 2011 Page Rate Plan belonging to Miscellaneous 2.7% at 55 Risk Pool
4
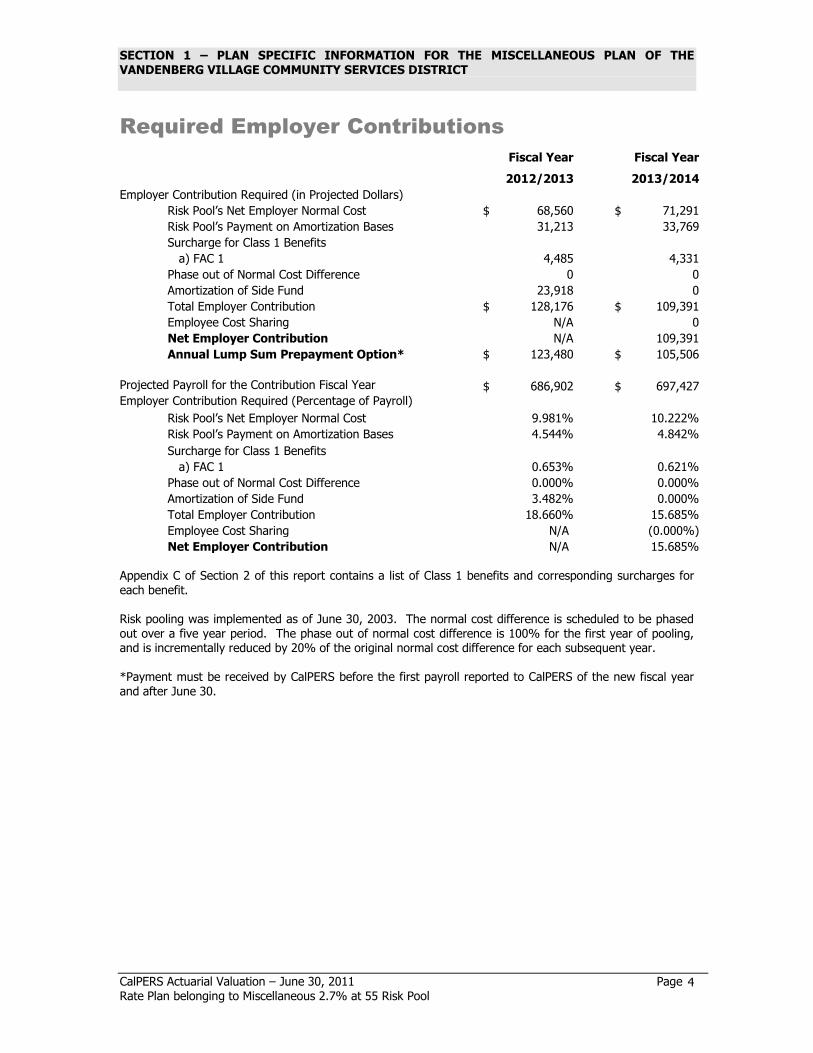
Required Employer Contributions
Fiscal Year Fiscal Year
2012/2013 2013/2014
Employer Contribution Required (in Projected Dollars)
Risk Pool’s Net Employer Normal Cost $ 68,560 $ 71,291
Risk Pool’s Payment on Amortization Bases 31,213 33,769
Surcharge for Class 1 Benefits
a) FAC 1 4,485 4,331
Phase out of Normal Cost Difference 0 0
Amortization of Side Fund 23,918 0
Total Employer Contribution $ 128,176 $ 109,391
Employee Cost Sharing N/A 0
Net Employer Contribution N/A 109,391
Annual Lump Sum Prepayment Option* $ 123,480 $ 105,506
Projected Payroll for the Contribution Fiscal Year $ 686,902 $ 697,427 Employer Contribution Required (Percentage of Payroll)
Risk Pool’s Net Employer Normal Cost 9.981% 10.222%
Risk Pool’s Payment on Amortization Bases 4.544% 4.842%
Surcharge for Class 1 Benefits
a) FAC 1 0.653% 0.621%
Phase out of Normal Cost Difference 0.000% 0.000%
Amortization of Side Fund 3.482% 0.000%
Total Employer Contribution 18.660% 15.685%
Employee Cost Sharing N/A (0.000%)
Net Employer Contribution N/A 15.685% Appendix C of Section 2 of this report contains a list of Class 1 benefits and corresponding surcharges for each benefit. Risk pooling was implemented as of June 30, 2003. The normal cost difference is scheduled to be phased out over a five year period. The phase out of normal cost difference is 100% for the first year of pooling, and is incrementally reduced by 20% of the original normal cost difference for each subsequent year. *Payment must be received by CalPERS before the first payroll reported to CalPERS of the new fiscal year and after June 30.
SECTION 1 – PLAN SPECIFIC INFORMATION FOR THE MISCELLANEOUS PLAN OF THE VANDENBERG VILLAGE COMMUNITY SERVICES DISTRICT
CalPERS Actuarial Valuation – June 30, 2011 Page Rate Plan belonging to Miscellaneous 2.7% at 55 Risk Pool
5
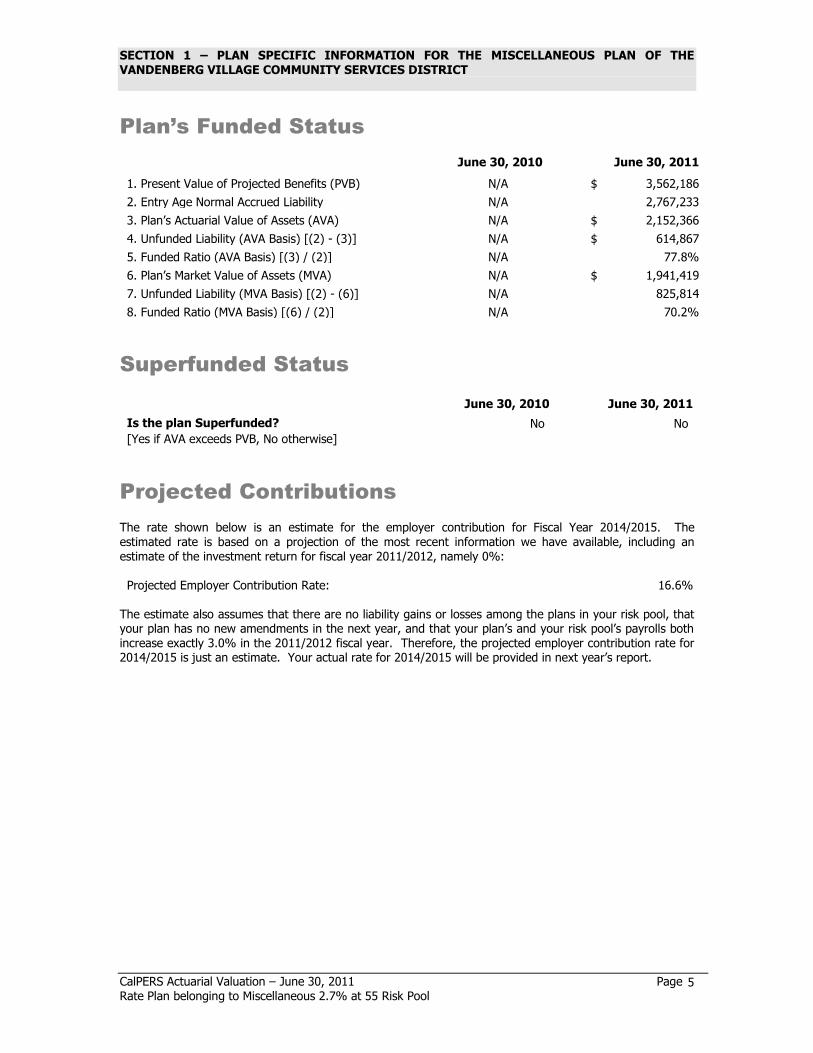
Plan’s Funded Status
June 30, 2010 June 30, 2011
1. Present Value of Projected Benefits (PVB) N/A $ 3,562,186
2. Entry Age Normal Accrued Liability N/A 2,767,233
3. Plan’s Actuarial Value of Assets (AVA) N/A $ 2,152,366
4. Unfunded Liability (AVA Basis) [(2) - (3)] N/A $ 614,867
5. Funded Ratio (AVA Basis) [(3) / (2)] N/A 77.8%
6. Plan’s Market Value of Assets (MVA) N/A $ 1,941,419
7. Unfunded Liability (MVA Basis) [(2) - (6)] N/A 825,814
8. Funded Ratio (MVA Basis) [(6) / (2)] N/A 70.2%
Superfunded Status
June 30, 2010 June 30, 2011
Is the plan Superfunded? No No
[Yes if AVA exceeds PVB, No otherwise]
Projected Contributions
The rate shown below is an estimate for the employer contribution for Fiscal Year 2014/2015. The estimated rate is based on a projection of the most recent information we have available, including an estimate of the investment return for fiscal year 2011/2012, namely 0%:
Projected Employer Contribution Rate: 16.6% The estimate also assumes that there are no liability gains or losses among the plans in your risk pool, that your plan has no new amendments in the next year, and that your plan’s and your risk pool’s payrolls both increase exactly 3.0% in the 2011/2012 fiscal year. Therefore, the projected employer contribution rate for 2014/2015 is just an estimate. Your actual rate for 2014/2015 will be provided in next year’s report.
SECTION 1 – PLAN SPECIFIC INFORMATION FOR THE MISCELLANEOUS PLAN OF THE VANDENBERG VILLAGE COMMUNITY SERVICES DISTRICT
CalPERS Actuarial Valuation – June 30, 2011 Page Rate Plan belonging to Miscellaneous 2.7% at 55 Risk Pool
6
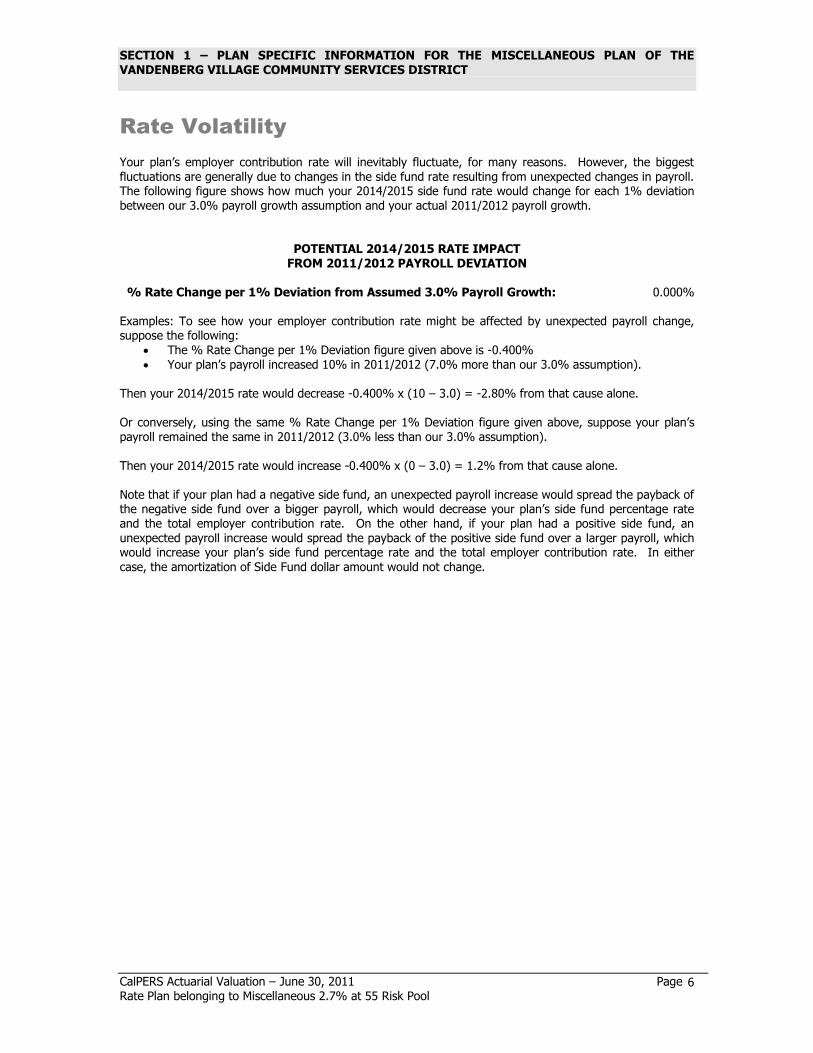
Rate Volatility
Your plan’s employer contribution rate will inevitably fluctuate, for many reasons. However, the biggest fluctuations are generally due to changes in the side fund rate resulting from unexpected changes in payroll. The following figure shows how much your 2014/2015 side fund rate would change for each 1% deviation between our 3.0% payroll growth assumption and your actual 2011/2012 payroll growth.
POTENTIAL 2014/2015 RATE IMPACT FROM 2011/2012 PAYROLL DEVIATION
% Rate Change per 1% Deviation from Assumed 3.0% Payroll Growth: 0.000%
Examples: To see how your employer contribution rate might be affected by unexpected payroll change, suppose the following:
The % Rate Change per 1% Deviation figure given above is -0.400% Your plan’s payroll increased 10% in 2011/2012 (7.0% more than our 3.0% assumption).
Then your 2014/2015 rate would decrease -0.400% x (10 – 3.0) = -2.80% from that cause alone. Or conversely, using the same % Rate Change per 1% Deviation figure given above, suppose your plan’s payroll remained the same in 2011/2012 (3.0% less than our 3.0% assumption). Then your 2014/2015 rate would increase -0.400% x (0 – 3.0) = 1.2% from that cause alone. Note that if your plan had a negative side fund, an unexpected payroll increase would spread the payback of the negative side fund over a bigger payroll, which would decrease your plan’s side fund percentage rate and the total employer contribution rate. On the other hand, if your plan had a positive side fund, an unexpected payroll increase would spread the payback of the positive side fund over a larger payroll, which would increase your plan’s side fund percentage rate and the total employer contribution rate. In either case, the amortization of Side Fund dollar amount would not change.
SECTION 1 – PLAN SPECIFIC INFORMATION FOR THE MISCELLANEOUS PLAN OF THE VANDENBERG VILLAGE COMMUNITY SERVICES DISTRICT
CalPERS Actuarial Valuation – June 30, 2011 Page Rate Plan belonging to Miscellaneous 2.7% at 55 Risk Pool
7
SUMMARY OF FINANCIAL AND DEMOGRAPHIC
INFORMATION
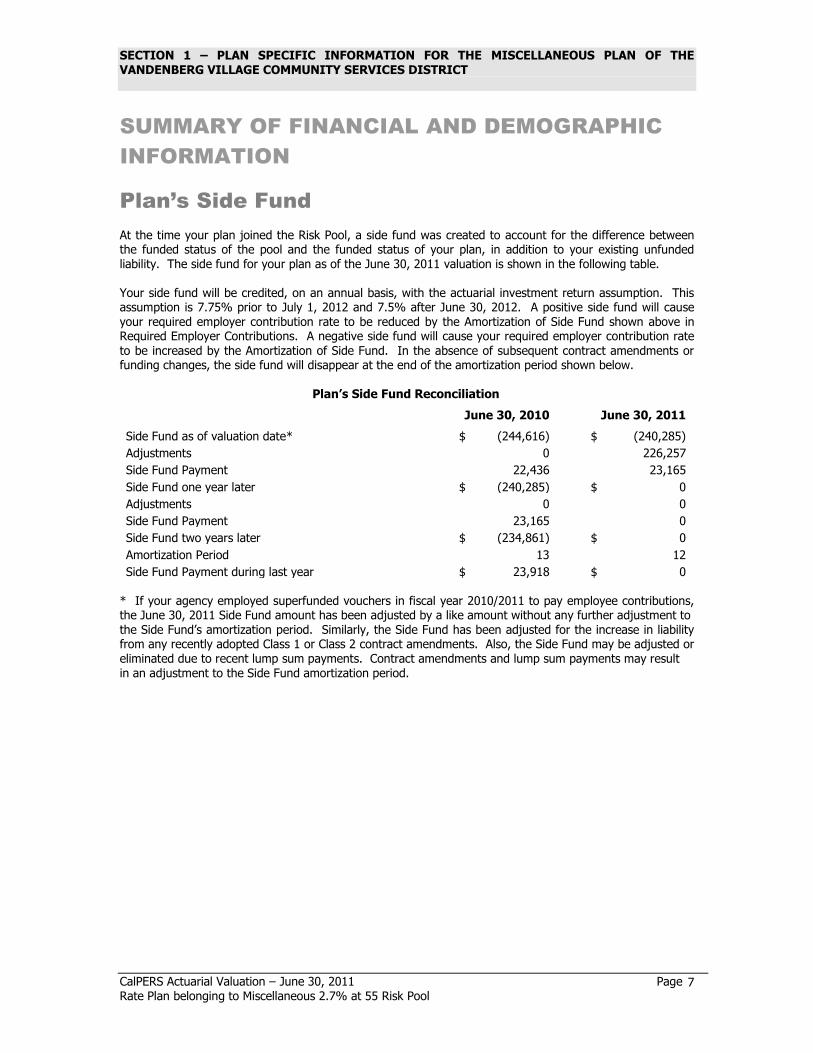
Plan’s Side Fund
At the time your plan joined the Risk Pool, a side fund was created to account for the difference between the funded status of the pool and the funded status of your plan, in addition to your existing unfunded liability. The side fund for your plan as of the June 30, 2011 valuation is shown in the following table. Your side fund will be credited, on an annual basis, with the actuarial investment return assumption. This assumption is 7.75% prior to July 1, 2012 and 7.5% after June 30, 2012. A positive side fund will cause your required employer contribution rate to be reduced by the Amortization of Side Fund shown above in Required Employer Contributions. A negative side fund will cause your required employer contribution rate
to be increased by the Amortization of Side Fund. In the absence of subsequent contract amendments or funding changes, the side fund will disappear at the end of the amortization period shown below.
Plan’s Side Fund Reconciliation
June 30, 2010 June 30, 2011
Side Fund as of valuation date* $ (244,616) $ (240,285)
Adjustments 0 226,257
Side Fund Payment 22,436 23,165
Side Fund one year later $ (240,285) $ 0
Adjustments 0 0
Side Fund Payment 23,165 0
Side Fund two years later $ (234,861) $ 0
Amortization Period 13 12
Side Fund Payment during last year $ 23,918 $ 0 * If your agency employed superfunded vouchers in fiscal year 2010/2011 to pay employee contributions, the June 30, 2011 Side Fund amount has been adjusted by a like amount without any further adjustment to the Side Fund’s amortization period. Similarly, the Side Fund has been adjusted for the increase in liability from any recently adopted Class 1 or Class 2 contract amendments. Also, the Side Fund may be adjusted or eliminated due to recent lump sum payments. Contract amendments and lump sum payments may result in an adjustment to the Side Fund amortization period.
SECTION 1 – PLAN SPECIFIC INFORMATION FOR THE MISCELLANEOUS PLAN OF THE VANDENBERG VILLAGE COMMUNITY SERVICES DISTRICT
CalPERS Actuarial Valuation – June 30, 2011 Page Rate Plan belonging to Miscellaneous 2.7% at 55 Risk Pool
8
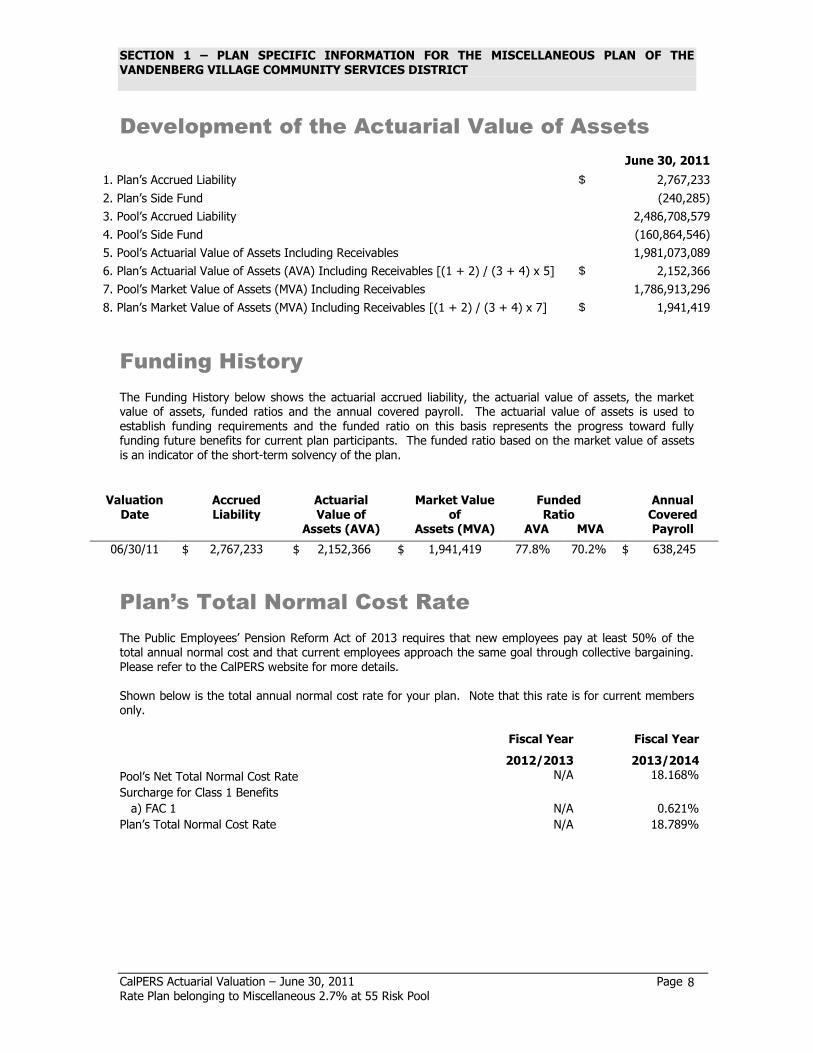
Development of the Actuarial Value of Assets
June 30, 2011
1. Plan’s Accrued Liability $ 2,767,233
2. Plan’s Side Fund (240,285)
3. Pool’s Accrued Liability 2,486,708,579
4. Pool’s Side Fund (160,864,546)
5. Pool’s Actuarial Value of Assets Including Receivables 1,981,073,089
6. Plan’s Actuarial Value of Assets (AVA) Including Receivables [(1 + 2) / (3 + 4) x 5] $ 2,152,366
7. Pool’s Market Value of Assets (MVA) Including Receivables 1,786,913,296
8. Plan’s Market Value of Assets (MVA) Including Receivables [(1 + 2) / (3 + 4) x 7] $ 1,941,419
Funding History
The Funding History below shows the actuarial accrued liability, the actuarial value of assets, the market value of assets, funded ratios and the annual covered payroll. The actuarial value of assets is used to establish funding requirements and the funded ratio on this basis represents the progress toward fully funding future benefits for current plan participants. The funded ratio based on the market value of assets is an indicator of the short-term solvency of the plan.
[funding_history] Valuation
Date
Accrued Liability
Actuarial Value of
Assets (AVA)
Market Value of
Assets (MVA)
Funded Ratio
AVA MVA
Annual Covered Payroll
06/30/11 $ 2,767,233 $ 2,152,366 $ 1,941,419 77.8% 70.2% $ 638,245
Plan’s Total Normal Cost Rate
The Public Employees’ Pension Reform Act of 2013 requires that new employees pay at least 50% of the total annual normal cost and that current employees approach the same goal through collective bargaining. Please refer to the CalPERS website for more details. Shown below is the total annual normal cost rate for your plan. Note that this rate is for current members only. Total Normal Cost Rate Fiscal Year Fiscal Year
2012/2013 2013/2014
Pool’s Net Total Normal Cost Rate N/A 18.168%
Surcharge for Class 1 Benefits
a) FAC 1 N/A 0.621%
Plan’s Total Normal Cost Rate N/A 18.789%
SECTION 1 – PLAN SPECIFIC INFORMATION FOR THE MISCELLANEOUS PLAN OF THE VANDENBERG VILLAGE COMMUNITY SERVICES DISTRICT
CalPERS Actuarial Valuation – June 30, 2011 Page Rate Plan belonging to Miscellaneous 2.7% at 55 Risk Pool
9
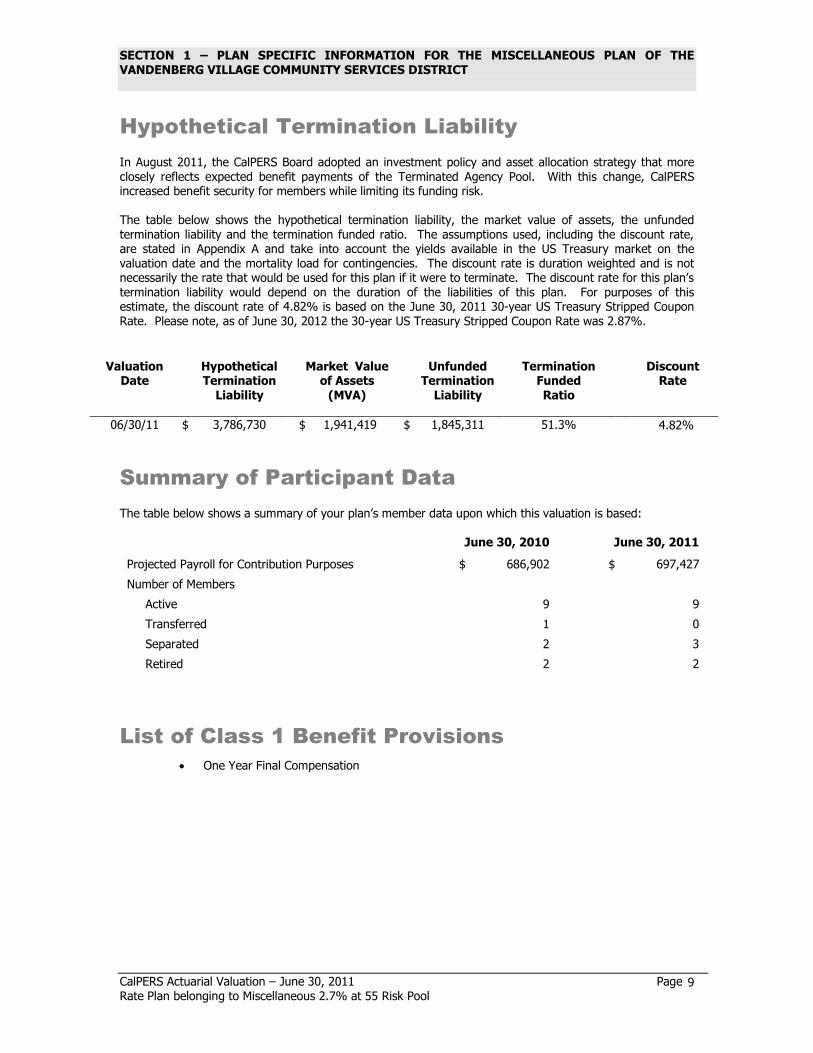
Hypothetical Termination Liability
In August 2011, the CalPERS Board adopted an investment policy and asset allocation strategy that more closely reflects expected benefit payments of the Terminated Agency Pool. With this change, CalPERS increased benefit security for members while limiting its funding risk. The table below shows the hypothetical termination liability, the market value of assets, the unfunded termination liability and the termination funded ratio. The assumptions used, including the discount rate, are stated in Appendix A and take into account the yields available in the US Treasury market on the valuation date and the mortality load for contingencies. The discount rate is duration weighted and is not necessarily the rate that would be used for this plan if it were to terminate. The discount rate for this plan’s termination liability would depend on the duration of the liabilities of this plan. For purposes of this estimate, the discount rate of 4.82% is based on the June 30, 2011 30-year US Treasury Stripped Coupon Rate. Please note, as of June 30, 2012 the 30-year US Treasury Stripped Coupon Rate was 2.87%.
[hypothetical_termination_liability] Valuation
Date
Hypothetical Termination
Liability
Market Value of Assets
(MVA)
Unfunded Termination
Liability
Termination Funded Ratio
Discount Rate
06/30/11 $ 3,786,730 $ 1,941,419 $ 1,845,311 51.3% 4.82%
Summary of Participant Data
The table below shows a summary of your plan’s member data upon which this valuation is based:
June 30, 2010 June 30, 2011
Projected Payroll for Contribution Purposes $ 686,902 $ 697,427
Number of Members
Active 9 9
Transferred 1 0
Separated 2 3
Retired 2 2
List of Class 1 Benefit Provisions
One Year Final Compensation
SECTION 1 – PLAN SPECIFIC INFORMATION FOR THE MISCELLANEOUS PLAN OF THE VANDENBERG VILLAGE COMMUNITY SERVICES DISTRICT
CalPERS Actuarial Valuation – June 30, 2011 Page Rate Plan belonging to Miscellaneous 2.7% at 55 Risk Pool
10
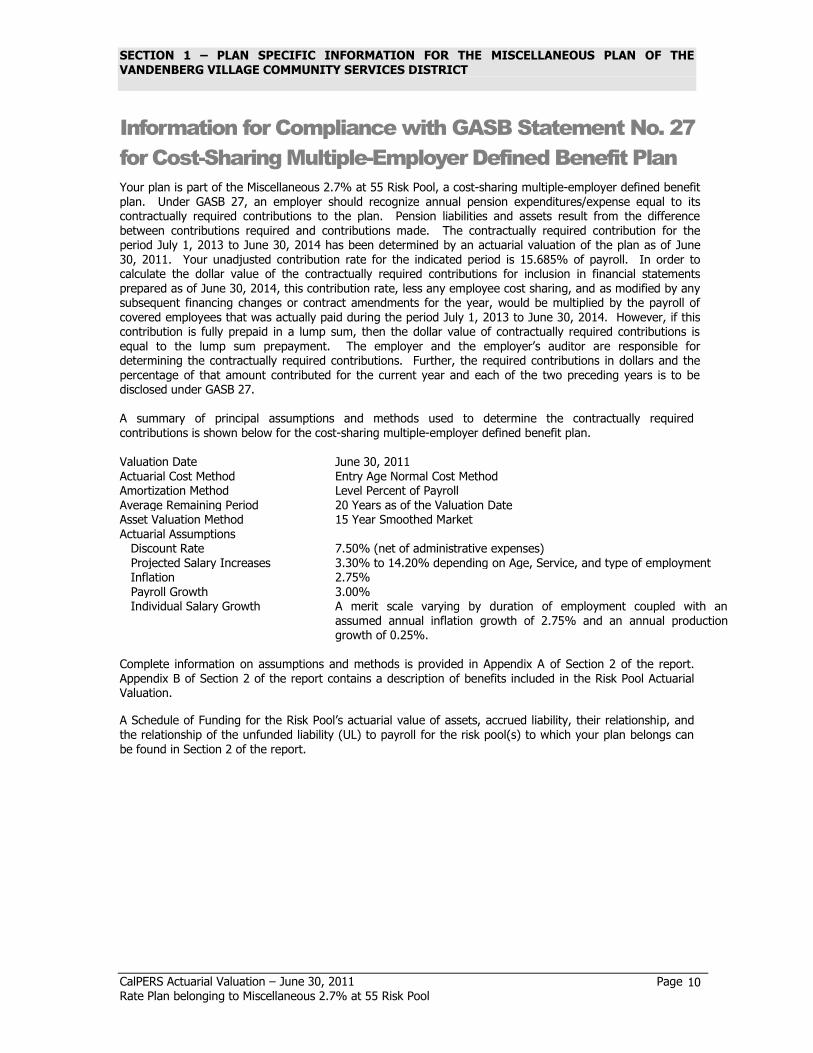
Information for Compliance with GASB Statement No. 27
for Cost-Sharing Multiple-Employer Defined Benefit Plan
Your plan is part of the Miscellaneous 2.7% at 55 Risk Pool, a cost-sharing multiple-employer defined benefit plan. Under GASB 27, an employer should recognize annual pension expenditures/expense equal to its contractually required contributions to the plan. Pension liabilities and assets result from the difference between contributions required and contributions made. The contractually required contribution for the period July 1, 2013 to June 30, 2014 has been determined by an actuarial valuation of the plan as of June 30, 2011. Your unadjusted contribution rate for the indicated period is 15.685% of payroll. In order to calculate the dollar value of the contractually required contributions for inclusion in financial statements prepared as of June 30, 2014, this contribution rate, less any employee cost sharing, and as modified by any subsequent financing changes or contract amendments for the year, would be multiplied by the payroll of covered employees that was actually paid during the period July 1, 2013 to June 30, 2014. However, if this contribution is fully prepaid in a lump sum, then the dollar value of contractually required contributions is
equal to the lump sum prepayment. The employer and the employer’s auditor are responsible for determining the contractually required contributions. Further, the required contributions in dollars and the percentage of that amount contributed for the current year and each of the two preceding years is to be disclosed under GASB 27. A summary of principal assumptions and methods used to determine the contractually required contributions is shown below for the cost-sharing multiple-employer defined benefit plan. Valuation Date June 30, 2011 Actuarial Cost Method Entry Age Normal Cost Method Amortization Method Level Percent of Payroll Average Remaining Period 20 Years as of the Valuation Date Asset Valuation Method 15 Year Smoothed Market Actuarial Assumptions Discount Rate 7.50% (net of administrative expenses) Projected Salary Increases 3.30% to 14.20% depending on Age, Service, and type of employment Inflation 2.75% Payroll Growth 3.00% Individual Salary Growth A merit scale varying by duration of employment coupled with an
assumed annual inflation growth of 2.75% and an annual production growth of 0.25%.
Complete information on assumptions and methods is provided in Appendix A of Section 2 of the report. Appendix B of Section 2 of the report contains a description of benefits included in the Risk Pool Actuarial Valuation.
A Schedule of Funding for the Risk Pool’s actuarial value of assets, accrued liability, their relationship, and the relationship of the unfunded liability (UL) to payroll for the risk pool(s) to which your plan belongs can be found in Section 2 of the report.
SECTION 1 – PLAN SPECIFIC INFORMATION FOR THE MISCELLANEOUS PLAN OF THE VANDENBERG VILLAGE COMMUNITY SERVICES DISTRICT
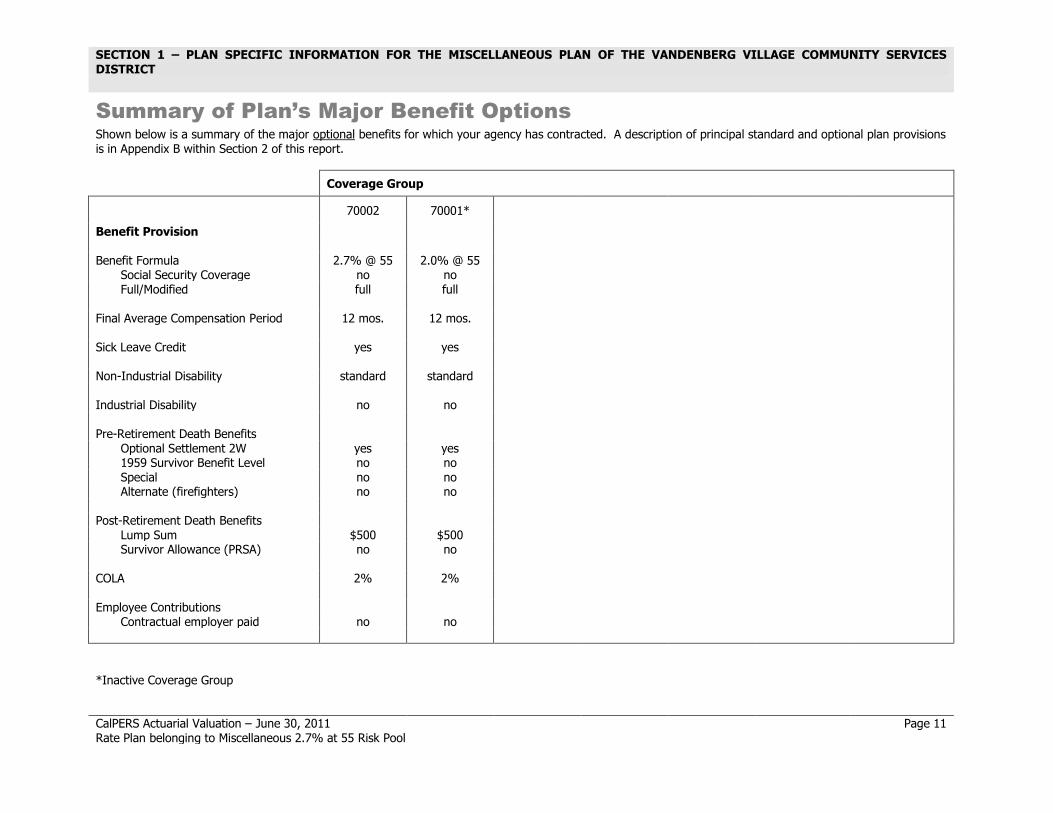
Summary of Plan’s Major Benefit Options
Shown below is a summary of the major optional benefits for which your agency has contracted. A description of principal standard and optional plan provisions is in Appendix B within Section 2 of this report.
Coverage Group
{sum_of_major_ben_1} 70002 70001*
Benefit Provision
Benefit Formula 2.7% @ 55 2.0% @ 55 Social Security Coverage no no Full/Modified full full
Final Average Compensation Period 12 mos. 12 mos. Sick Leave Credit yes yes Non-Industrial Disability standard standard Industrial Disability no no Pre-Retirement Death Benefits
Optional Settlement 2W yes yes 1959 Survivor Benefit Level no no Special no no Alternate (firefighters) no no
Post-Retirement Death Benefits
Lump Sum $500 $500 Survivor Allowance (PRSA) no no
COLA 2% 2% Employee Contributions
Contractual employer paid no no
*Inactive Coverage Group
CalPERS Actuarial Valuation – June 30, 2011 Page 11 Rate Plan belonging to Miscellaneous 2.7% at 55 Risk Pool

SECTION 1 – PLAN SPECIFIC INFORMATION FOR THE MISCELLANEOUS PLAN OF THE VANDENBERG VILLAGE COMMUNITY SERVICES DISTRICT
Summary of Plan’s Major Benefit Options
Shown below is a summary of the major optional benefits for which your agency has contracted. A description of principal standard and optional plan provisions is in the following section of this Appendix.
{sum_of_major_ben_2} Coverage Group
Benefit Provision
Benefit Formula Social Security Coverage Full/Modified
Final Average Compensation Period Sick Leave Credit Non-Industrial Disability Industrial Disability Pre-Retirement Death Benefits
Optional Settlement 2W 1959 Survivor Benefit Level Special Alternate (firefighters)
Post-Retirement Death Benefits
Lump Sum Survivor Allowance (PRSA)
COLA Employee Contributions
Contractual employer paid
*Inactive Coverage Group
CalPERS Actuarial Valuation – June 30, 2011 Page 12 Rate Plan belonging to Miscellaneous 2.7% at 55 Risk Pool
Section 2
C A L I F O R N I A P U B L I C E M P L O Y E E S ’ R E T I R E M E N T S Y S T E M
Section 2 may be found on the CalPERS website
(www.calpers.ca.gov) then selecting:
Employers
Actuarial & GASB 27 Information
Risk Pooling
Risk Pool Annual Valuation Report
Or at the following address: http://ow.ly/eNpMg