Embed Size (px)
Citation preview

$191,028 $207,977 $78,139 $81,477 $78,183 $112,889
General Assembly
Judges’
State Employees’
State Universities
Teachers’
Actuarial AccruedLiability
RETIREMENTSYSTEM
Actuarial Value ofAssets – Smoothed
Unfunded ActuarialAccrued Liability –
Smoothed
Funded Ratio(2)
118,630
40,923 17,701
15,632
871
51
23,222
29,883
1,675
312
45,515
2,546
363
47,222
$80,018
17,005
15,038
840
49
45,251
17,463
15,259
834
55
46,40745,435 71,408 39.8%
43.3%
34.3%
34.2%
14.0%
TOTAL
108,122$
39,521 17,105
14,742
804
53
22,416
26,001
1,510
275
40,743
2,314
328
62,687 42.0%
43.3%
36.2%
34.8%
16.0%
39.2%
42.9%
44.2%
37.5%
36.0%
16.6%
38.1%
41.6%
33.0%
33.0%
13.5%
41.9% 37.6%40.9%
(c) / (a) (d) / (b) (e) / (a) (f) / (b)(a) – (c) (b) – (d) (a) – (e) (b) – (f)(f)(c) (d)(a) (b) (e)
20162015 20162015 2016 2016201520162015 2015 2016 201620152015
(continued)
Source: Information derived from the current and previous Supplemental Digests to Retirement Systems’ Audits and Retirement Systems’ actuarial valuation reports.
(1) State Universities Retirement System’s Net Assets at market value only include that portion of the Net Assets applicable to the defined benefit plan.(2) Some percentages may differ from amounts reported by the retirement systems when computing for this table because of rounding.
Ten Year Historical TrendFor the Fiscal Years Ending June 30, 2007 through June 30, 2016
Net Assets atMarket Value(1)
Unfunded ActuarialAccrued Liability –Market Value
$ $ $ $ $ $
$126,500 $111,010 $129,794
22,058
25,484
1,480
273
61,715$
23,918
30,477
1,706
314
73,379$
SPRINGFIELD OFFICE:ILES PARK PLAZA
740 EAST ASH • 62703-3154PHONE: 217/782-6046
FAX: 217/785-8222 • TTY: 888/261-2887FRAUD HOTLINE: 1-855-217-1895
INTERNET ADDRESS: [email protected]
RECYCLED PAPER: SOYBEAN INKS
CHICAGO OFFICE:MICHAEL A. BILANDIC BLDG. • SUITE S-900
160 NORTH LASALLE • 60601-3103PHONE: 312/814-4000FAX: 312/814-4006
FRAUD HOTLINE: 1-855-217-1895
OFFICE OF THE AUDITOR GENERAL
FRANK J. MAUTINO
$
Smoothed Market Value
Unfunded Actuarial Accrued Liability and Funded Ratio for Statutory FundingFor the Fiscal Years Ending June 30, 2015 and 2016 (in millions)
Table No. 1
Table No. 2
SUPPLEMENTAL DIGEST TO RETIREMENT SYSTEMS’ AUDITSFor the years ending June 30, 2016, and June 30, 2015
According to figures provided by the retirement systems for statutory funding purposes, the cumulative unfunded actuarial accrued liabil-ity increased $13.6 billion to $126.5 billion during FY16 when using the “smoothed” valuation of assets. This method “smooths” actuarialgains or losses incurred during a fiscal year in equal amounts over a five year period. When using the market value of assets, the cumulativeunfunded actuarial accrued liability increased $18.8 billion during FY16 to $129.8 billion. The cumulative funded ratio decreased from 41.9% to 37.6% in FY16 when using the market value of assets and decreased 1.7% to 39.2% when using the “smoothed” valuation of assets.
In Millions
$ 3,377.71,544.21,804.3134.015.9
$ 6,876.1
$ 578.482.3
313.115.55.0
$ 994.3
$ 3,986.61,671.42,014.5131.321.7
$ 7,825.5
$ 244.169.9
132.3(0.8)5.6
$ 451.1
$ 3,742.51,601.51,882.2132.116.1
$ 7,374.4
$ 364.857.377.9(1.9)0.2
$ 498.3
$ (60.7)34.4
104.97.21.9
$ 87.7
$ 4,565.01,753.72,327.6146.826.7
$ 8,819.8
FY 2017 (1)FY 2016 FY 2018 (2)FY 2015Increase
(Decrease) fromprevious year
Increase(Decrease) fromprevious year
Increase(Decrease) fromprevious year
Required StateContribution& Debt Service
Required StateContribution& Debt Service
TotalAppropriation& Debt Service
TotalAppropriation& Debt Service
Increase(Decrease) fromprevious year
Teachers’(3)
State UniversitiesState Employees’Judges’General Assembly
REQUIRED STATE CONTRIBUTION
Debt Service PaymentsG.O. Bonds:
Retirement System
$ (3.9) $ 614.7$ 19.5$ 595.2$ 20.7$ 574.5$ (4.1)
$ 56.8 $ 8,730.8 $ 742.1 $ 9,472.9 $ 965.5 $10,438.4$ 251.5 $ 8,674.0
$ 578.6
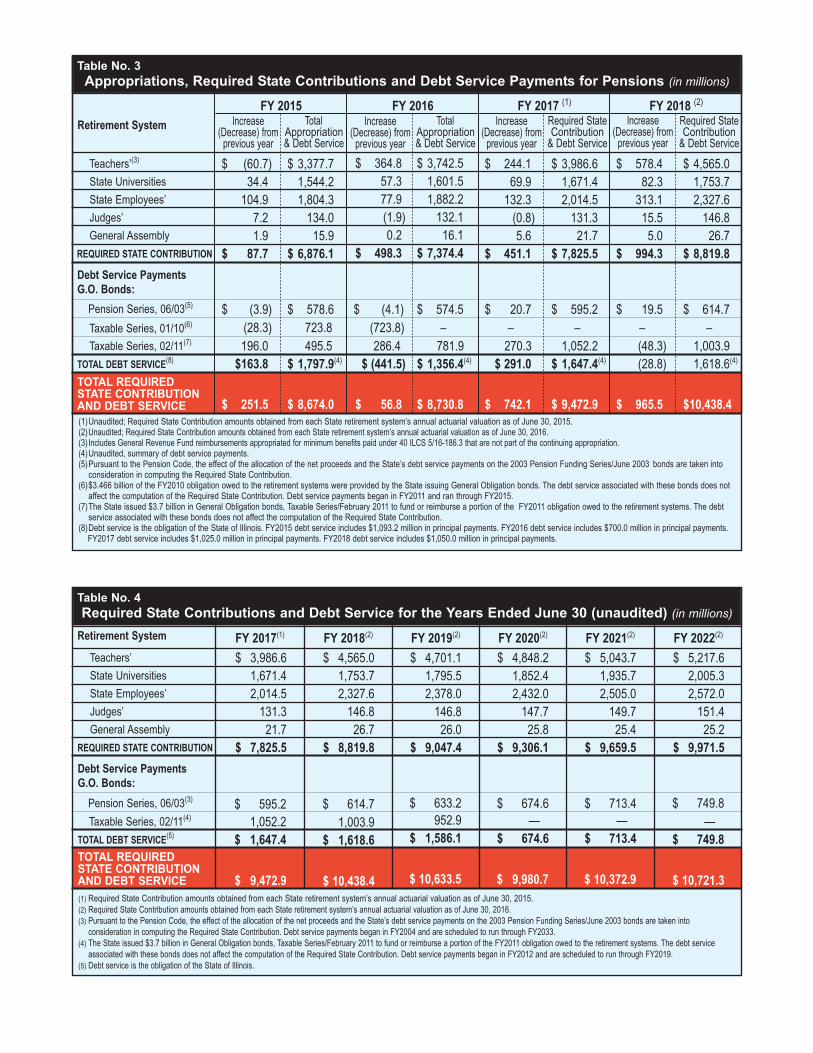
Table No. 3Appropriations, Required State Contributions and Debt Service Payments for Pensions (in millions)
Pension Series, 06/03(5)
(28.3) –––––(723.8)723.8Taxable Series, 01/10(6)
196.0 (48.3)1,052.2270.3781.9286.4495.5Taxable Series, 02/11(7) 1,003.9$163.8 1,618.6(4)(28.8)$ 1,647.4(4)$ 291.0$ 1,356.4(4)$ (441.5)$ 1,797.9(4)TOTAL DEBT SERVICE(8)
TOTAL REQUIRED STATE CONTRIBUTIONAND DEBT SERVICE
$ 3,986.61,671.42,014.5131.321.7
$ 7,825.5
FY 2017(1)
Teachers’State UniversitiesState Employees’Judges’General Assembly
REQUIRED STATE CONTRIBUTION
Retirement System
$ 595.2
$ 4,565.01,753.72,327.6146.826.7
$ 8,819.8
FY 2018(2)
$ 614.7
$ 4,701.11,795.52,378.0146.826.0
$ 9,047.4
FY 2019(2)
$ 633.2
$ 4,848.21,852.42,432.0147.725.8
$ 9,306.1
FY 2020(2)
$ 674.6
$ 5,217.62,005.32,572.0151.425.2
$ 9,971.5
$ 5,043.71,935.72,505.0149.725.4
$ 9,659.5
FY 2021(2) FY 2022(2)
$ 749.8
Table No. 4Required State Contributions and Debt Service for the Years Ended June 30 (unaudited) (in millions)
(1) Required State Contribution amounts obtained from each State retirement system’s annual actuarial valuation as of June 30, 2015. (2) Required State Contribution amounts obtained from each State retirement system’s annual actuarial valuation as of June 30, 2016.(3) Pursuant to the Pension Code, the effect of the allocation of the net proceeds and the State’s debt service payments on the 2003 Pension Funding Series/June 2003 bonds are taken into
consideration in computing the Required State Contribution. Debt service payments began in FY2004 and are scheduled to run through FY2033.(4) The State issued $3.7 billion in General Obligation bonds, Taxable Series/February 2011 to fund or reimburse a portion of the FY2011 obligation owed to the retirement systems. The debt service
associated with these bonds does not affect the computation of the Required State Contribution. Debt service payments began in FY2012 and are scheduled to run through FY2019. (5) Debt service is the obligation of the State of Illinois.
Debt Service PaymentsG.O. Bonds:
Pension Series, 06/03(3)
Taxable Series, 02/11(4)
TOTAL DEBT SERVICE(5)
TOTAL REQUIRED STATE CONTRIBUTIONAND DEBT SERVICE
1,052.2 1,003.9 952.9 — —$ 1,647.4 $ 1,618.6 $ 1,586.1 $ 674.6 $ 749.8
$ 9,472.9 $ 10,438.4 $ 10,633.5 $ 9,980.7
$ 713.4—
$ 713.4
$ 10,372.9 $ 10,721.3
(1)Unaudited; Required State Contribution amounts obtained from each State retirement system’s annual actuarial valuation as of June 30, 2015.(2)Unaudited; Required State Contribution amounts obtained from each State retirement system’s annual actuarial valuation as of June 30, 2016.(3)Includes General Revenue Fund reimbursements appropriated for minimum benefits paid under 40 ILCS 5/16-186.3 that are not part of the continuing appropriation.(4)Unaudited, summary of debt service payments. (5)Pursuant to the Pension Code, the effect of the allocation of the net proceeds and the State’s debt service payments on the 2003 Pension Funding Series/June 2003 bonds are taken into
consideration in computing the Required State Contribution. (6)$3.466 billion of the FY2010 obligation owed to the retirement systems were provided by the State issuing General Obligation bonds. The debt service associated with these bonds does not
affect the computation of the Required State Contribution. Debt service payments began in FY2011 and ran through FY2015.(7)The State issued $3.7 billion in General Obligation bonds, Taxable Series/February 2011 to fund or reimburse a portion of the FY2011 obligation owed to the retirement systems. The debt
service associated with these bonds does not affect the computation of the Required State Contribution. (8)Debt service is the obligation of the State of Illinois. FY2015 debt service includes $1,093.2 million in principal payments. FY2016 debt service includes $700.0 million in principal payments.
FY2017 debt service includes $1,025.0 million in principal payments. FY2018 debt service includes $1,050.0 million in principal payments.

TIMELINE OF SIGNIFICANT CHANGES TO PENSION LAWSEffective Date Public Act Number/Summary of Change
August 22, 1994 P.A. 88-0593: Created a 50-year funding plan designated to increase pension funding incrementallyuntil a 90% funding level is achieved; established continuing appropriation mechanism for payment ofState contributions.
June 25, 2002 P.A. 92-0566: Provided an early retirement incentive (ERI) for SERS participants retiring before12/31/02 (4/30/03 in some cases).
April 7, 2003 P.A. 93-0002: Authorized the State to issue $10 billion in general obligation bonds; bonds were issued6/12/03; $2.7 billion of the proceeds were used to pay part of FY2003 and all of FY2004 RequiredState Contributions, bond issuance costs and first year’s interest on the bonds; balance of $7.3 billionwas allocated to the retirement systems.
Commencing with FY 2005, the maximum Required State Contribution to the systems equals the contribution that would have been required under the 50-year funding plan (P.A. 88-0593), if the general obligation bond contribution had not been made, reduced – but not below zero – by the State’sdebt service on the pension bonds (series June, 2003).
July 30, 2004 P.A. 93-0839: Changed the measurement and calculation of liabilities due to the ERI (see P.A. 92-0566); funding spread over a 12-year period.
June 1, 2005 P.A. 94-0004: Suspended payments required under P.A. 88-0593 for FY2006 and FY2007. Instead,fixed specific amounts for FY2006 and FY2007 contributions to retirement systems; ramps up contribu-tions in FY2008 through FY2010 so that, by FY2011, contributions will be at an amount sufficient tomeet the 90% funding level specified in P.A. 88-0593 by FY2045; beginning in FY2008, changes funding mechanism for ERI (eliminates 12 year funding mechanism provided in P.A. 93-0839).
(continued)
$ 7,501.97,004.46,937.75,893.95,009.94,299.34,130.82,897.02,156.21,477.4
$ –––
7,015.26,612.45,399.84,761.54,076.53,729.23,665.6
$ 8,390.27,928.77,751.5
–––––––
$ (888.3)(924.3)(813.8)
(1,121.3)(1,602.5)(1,100.5)(630.7)
(1,179.5)(1,573.0)(2,188.2)
2016201520142013201220112010200920082007
Notes:(1) Summarized per retirement systems’ annual financial statements. Annual amounts for this table include, as applicable, payments for: ERO contributions, federal and trust funds, excess salarycontributions, and 2.2 benefit formula contributions. These items are taken into consideration in determining the retirement systems’ overall total pension liability. For State Universities, contributions received by the system only include that portion applicable to the defined benefit plan. Because of including or excluding the noted items, the annual amounts in this table will notagree with the “Total Appropriation & Debt Service, Required State Contribution” in Table No. 3 on page 2 of this digest.. (2) Summarized per retirement systems’ annual actuarial valuations.(3) The Actuarial Determined Contribution is a target or recommended contribution determined in conformity with Actuarial Standards of Practice, based on each system’s actuarial assumptions for the period reported.(4) The Governmental Accounting Standards Board (GASB) issued Statement 25, which required the computation of the annual required contribution for the year, calculated in accordance with each system’s actuarial assumptions. The annual required contribution includes the employer’s normal cost and a provision for amortizing the total unfunded actuarial liability, for a term of not more than 30 years. GASB issued Statement 67: Financial Reporting for Pension Plans - An Amendment of GASB Statement No. 25, effective for fiscal year 2014. GASB Statement 67 removed the requirement for computing an annual required contribution as set forth in GASB Statement 25, and now requires an actuarial determined contribution as defined in Note (3).
TOTAL $ 47,308.5 $ 35,260.2$ 24,070.4 $ (12,022.1)
Fiscal Year Ending June 30Contributions Received
by Systems(1)Contributions per
GASB Statement #25(2)(4)Actuarial DeterminedContributions(2)(3) Difference
Ten Year Comparison of Contributions Received by the Systemsto Annual Actuarial Determined Contributions
Combined Teachers’, State Universities, State Employees’, Judges’ and General Assembly (in millions)
Table No. 5
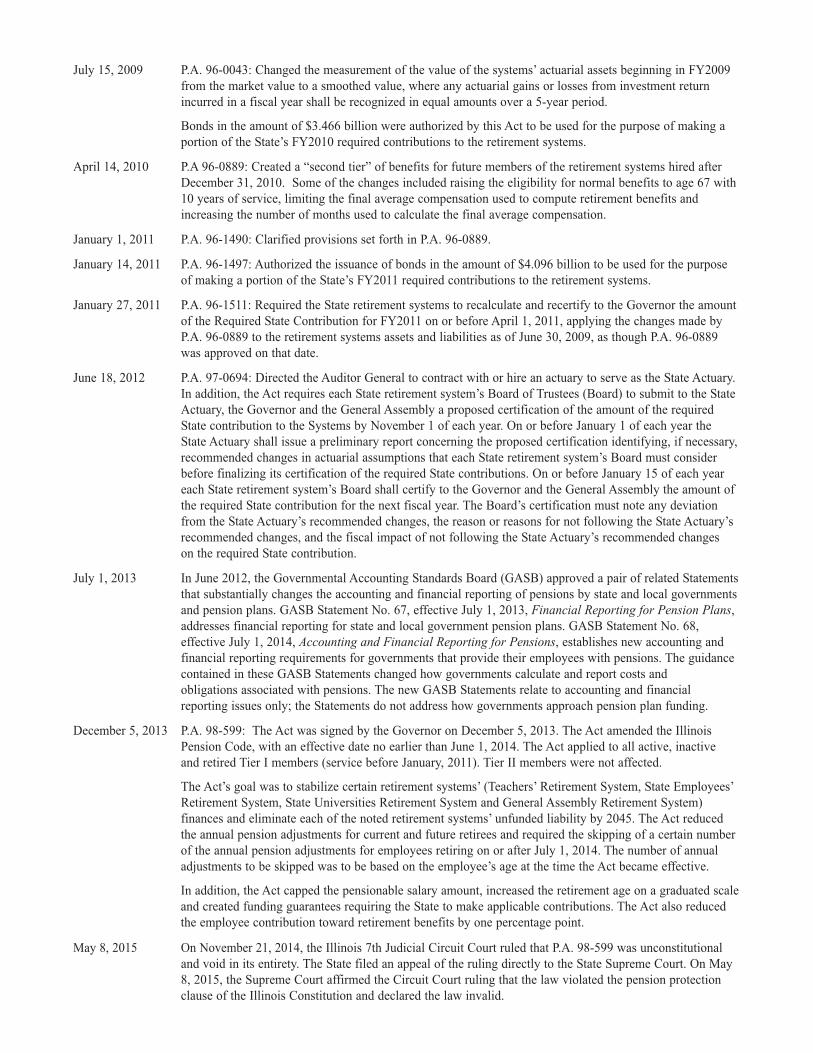
July 15, 2009 P.A. 96-0043: Changed the measurement of the value of the systems’ actuarial assets beginning in FY2009from the market value to a smoothed value, where any actuarial gains or losses from investment returnincurred in a fiscal year shall be recognized in equal amounts over a 5-year period.
Bonds in the amount of $3.466 billion were authorized by this Act to be used for the purpose of making aportion of the State’s FY2010 required contributions to the retirement systems.
April 14, 2010 P.A 96-0889: Created a “second tier” of benefits for future members of the retirement systems hired afterDecember 31, 2010. Some of the changes included raising the eligibility for normal benefits to age 67 with10 years of service, limiting the final average compensation used to compute retirement benefits andincreasing the number of months used to calculate the final average compensation.
January 1, 2011 P.A. 96-1490: Clarified provisions set forth in P.A. 96-0889.
January 14, 2011 P.A. 96-1497: Authorized the issuance of bonds in the amount of $4.096 billion to be used for the purposeof making a portion of the State’s FY2011 required contributions to the retirement systems.
January 27, 2011 P.A. 96-1511: Required the State retirement systems to recalculate and recertify to the Governor the amountof the Required State Contribution for FY2011 on or before April 1, 2011, applying the changes made byP.A. 96-0889 to the retirement systems assets and liabilities as of June 30, 2009, as though P.A. 96-0889was approved on that date.
June 18, 2012 P.A. 97-0694: Directed the Auditor General to contract with or hire an actuary to serve as the State Actuary.In addition, the Act requires each State retirement system’s Board of Trustees (Board) to submit to the StateActuary, the Governor and the General Assembly a proposed certification of the amount of the requiredState contribution to the Systems by November 1 of each year. On or before January 1 of each year the State Actuary shall issue a preliminary report concerning the proposed certification identifying, if necessary,recommended changes in actuarial assumptions that each State retirement system’s Board must considerbefore finalizing its certification of the required State contributions. On or before January 15 of each yeareach State retirement system’s Board shall certify to the Governor and the General Assembly the amount ofthe required State contribution for the next fiscal year. The Board’s certification must note any deviationfrom the State Actuary’s recommended changes, the reason or reasons for not following the State Actuary’srecommended changes, and the fiscal impact of not following the State Actuary’s recommended changes on the required State contribution.
July 1, 2013 In June 2012, the Governmental Accounting Standards Board (GASB) approved a pair of related Statementsthat substantially changes the accounting and financial reporting of pensions by state and local governmentsand pension plans. GASB Statement No. 67, effective July 1, 2013, Financial Reporting for Pension Plans,addresses financial reporting for state and local government pension plans. GASB Statement No. 68, effective July 1, 2014, Accounting and Financial Reporting for Pensions, establishes new accounting andfinancial reporting requirements for governments that provide their employees with pensions. The guidancecontained in these GASB Statements changed how governments calculate and report costs and obligations associated with pensions. The new GASB Statements relate to accounting and financial reporting issues only; the Statements do not address how governments approach pension plan funding.
December 5, 2013 P.A. 98-599: The Act was signed by the Governor on December 5, 2013. The Act amended the IllinoisPension Code, with an effective date no earlier than June 1, 2014. The Act applied to all active, inactive and retired Tier I members (service before January, 2011). Tier II members were not affected.
The Act’s goal was to stabilize certain retirement systems’ (Teachers’ Retirement System, State Employees’Retirement System, State Universities Retirement System and General Assembly Retirement System)finances and eliminate each of the noted retirement systems’ unfunded liability by 2045. The Act reducedthe annual pension adjustments for current and future retirees and required the skipping of a certain numberof the annual pension adjustments for employees retiring on or after July 1, 2014. The number of annualadjustments to be skipped was to be based on the employee’s age at the time the Act became effective.
In addition, the Act capped the pensionable salary amount, increased the retirement age on a graduated scaleand created funding guarantees requiring the State to make applicable contributions. The Act also reducedthe employee contribution toward retirement benefits by one percentage point.
May 8, 2015 On November 21, 2014, the Illinois 7th Judicial Circuit Court ruled that P.A. 98-599 was unconstitutionaland void in its entirety. The State filed an appeal of the ruling directly to the State Supreme Court. On May8, 2015, the Supreme Court affirmed the Circuit Court ruling that the law violated the pension protectionclause of the Illinois Constitution and declared the law invalid.


![Investor Update Q2 FY16 / H1 FY16 [Company Update]](https://img.pdfslide.net/doc/110x75/577ca80a1a28abea748caad0/investor-update-q2-fy16-h1-fy16-company-update.jpg)