Embed Size (px)
Citation preview
California SONGS\OTC Plants Assumptions
TEPPC – Data Work Group CallTuesday, September 15, 2015
2
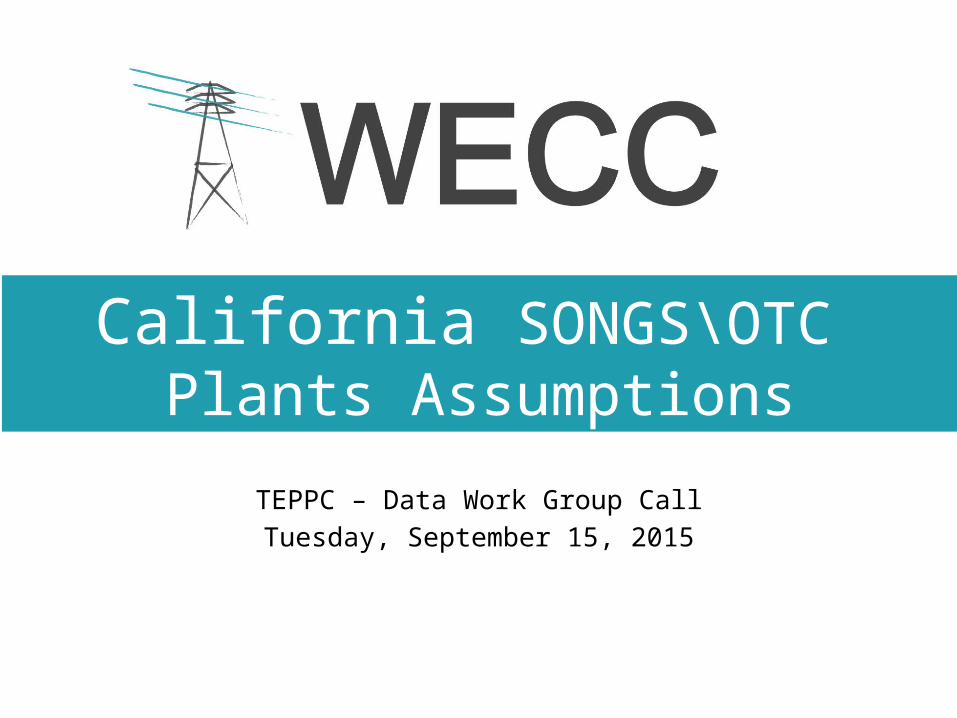
Overview• Status of OTC Replacement Assumptions For the TEPPC 2026
Common Case– CEC Demand Forecast– CEC Demand Response– CAISO\CEC
• Monthly Peak/Energy Load?• AAEE assumptions? Embedded in monthly load or separate?• Other EE assumptions? Embedded in monthly load or separate?• BTM DG assumptions? Embedded in monthly load or separate?• DR assumptions? Embedded in monthly load or separate?
– Additional Generic Preferred Resources in the LA Basin– OTC Replacement Assumptions for Northern California – Final OTC Plant Assumptions Table
3
Status
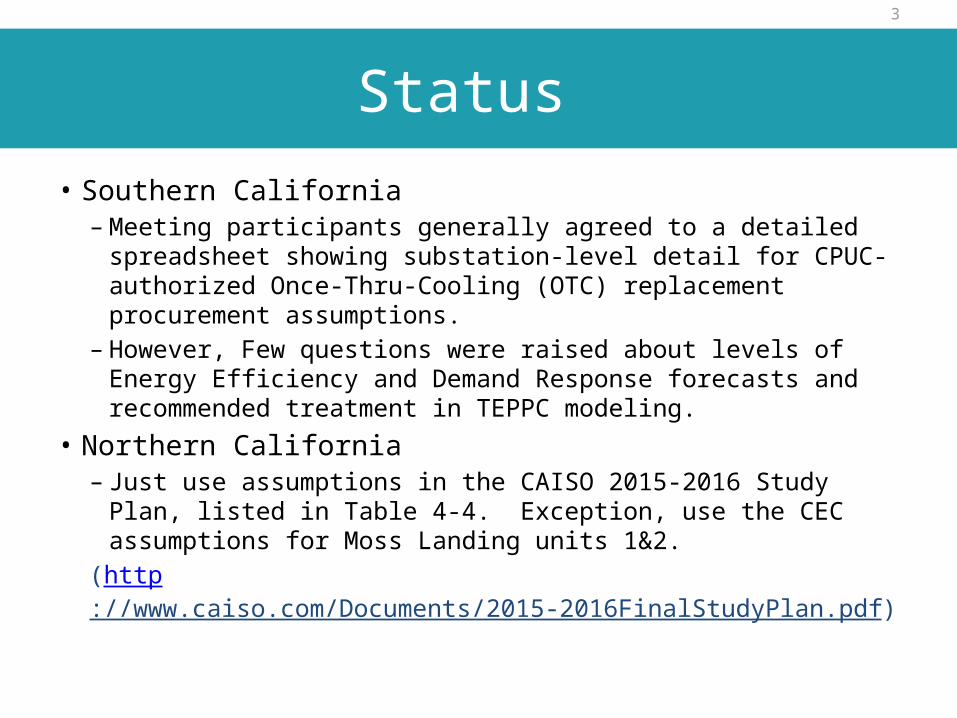
• Southern California – Meeting participants generally agreed to a detailed spreadsheet
showing substation-level detail for CPUC-authorized Once-Thru-Cooling (OTC) replacement procurement assumptions.
– However, Few questions were raised about levels of Energy Efficiency and Demand Response forecasts and recommended treatment in TEPPC modeling.
• Northern California– Just use assumptions in the CAISO 2015-2016 Study Plan, listed
in Table 4-4. Exception, use the CEC assumptions for Moss Landing units 1&2.
(http://www.caiso.com/Documents/2015-2016FinalStudyPlan.pdf)
4
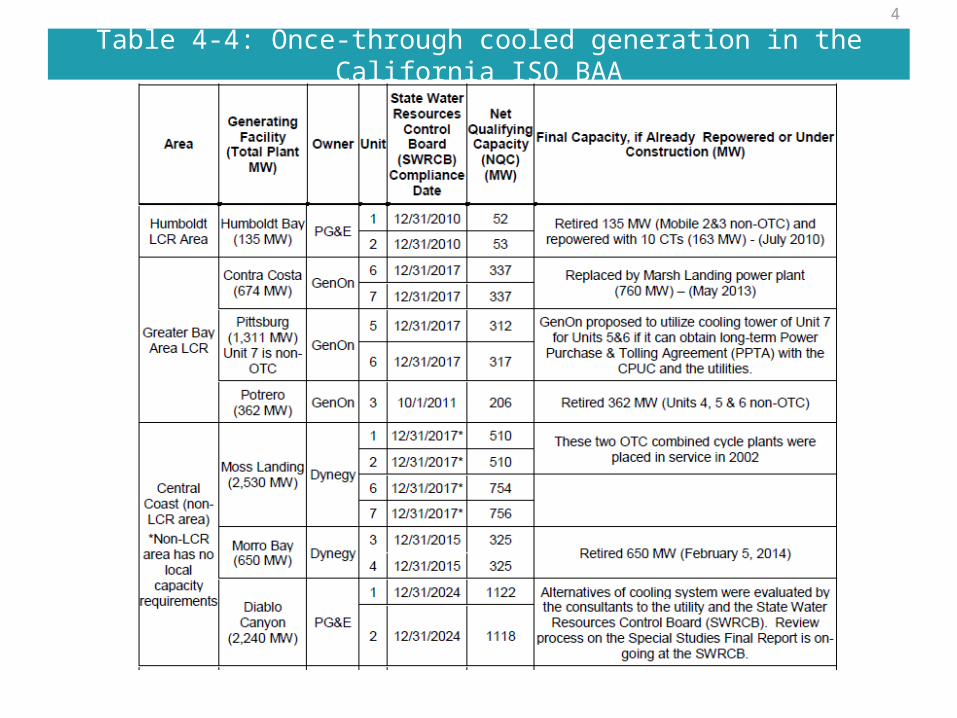
Table 4-4: Once-through cooled generation in the California ISO BAA
5
CEC Demand Forecast
Angela TanghettiCalifornia Energy Commission
CEC Demand Forecast
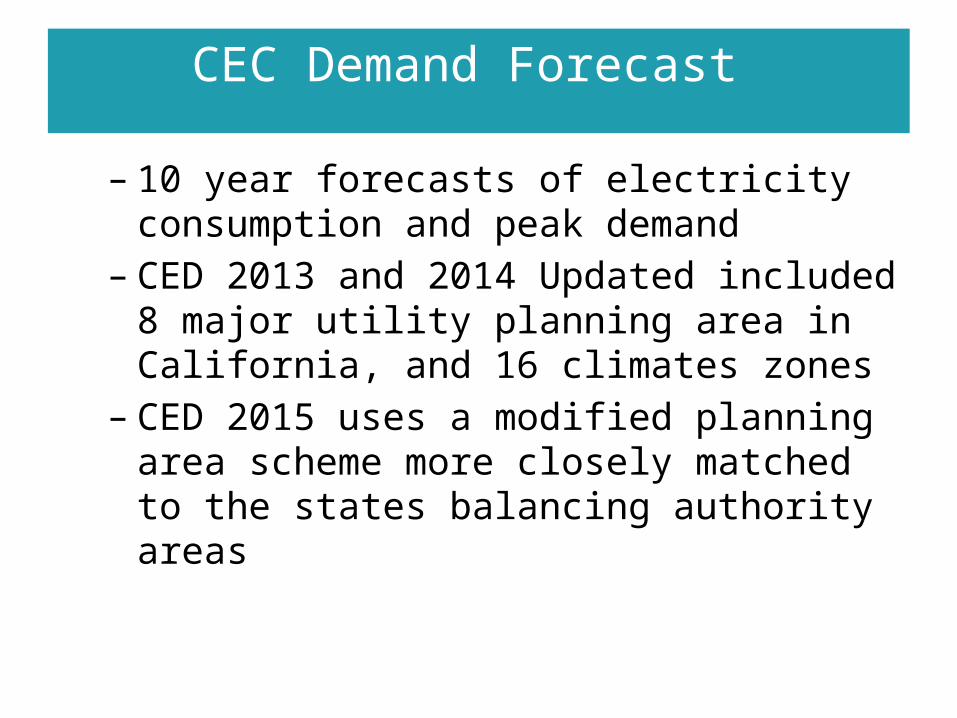
– 10 year forecasts of electricity consumption and peak demand
– CED 2013 and 2014 Updated included 8 major utility planning area in California, and 16 climates zones
– CED 2015 uses a modified planning area scheme more closely matched to the states balancing authority areas
P A G E 6
Energy Efficiency and CEC’s Demand Forecast
• Energy Efficiency – CEC demand forecasts seek to account for efficiency and conservation reasonably expected to occur. Reasonably expected to occur initiatives have been split into two types: committed and additional achievable energy efficiency
• The CED 2015 Preliminary baseline forecasts continue that distinction, with only committed efficiency included
P A G E 7
Energy Efficiency and CEC’s Demand Forecast
• Committed includes utility and public agency programs, codes and standards, and legislation and ordinances having final authorization, firm funding
• A demand forecast for resource planning requires a baseline forecast combined with additional achievable energy efficiency savings (not yet considered committed but deemed likely to occur)
P A G E 8
BTM PV Peak and Energy Impact On CEC Demand Forecast
• For CED 2015 Preliminary, staff spent time refining the peak factors used to translate PV installed capacity to impact during the utility annual peak hour.
• To refine PV peak factors staff examined simulated PV production profiles provided by CPUC relative to utility annual peak day between 2011 through 2014.
P A G E 9
PV Peak Factors
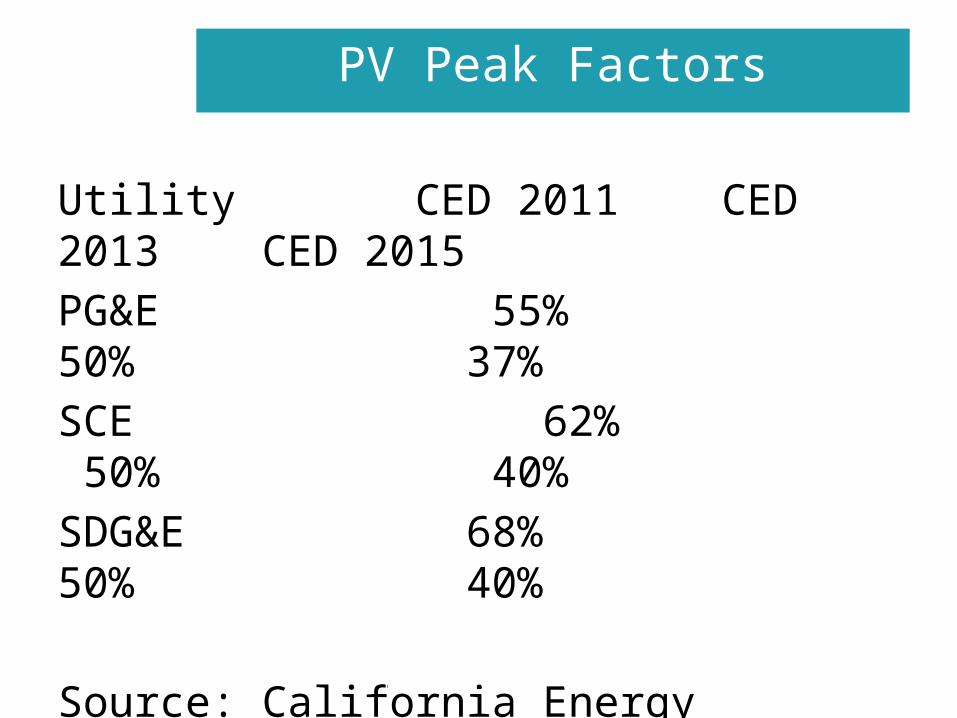
Utility CED 2011 CED 2013 CED 2015PG&E 55% 50% 37%SCE 62% 50% 40%SDG&E 68% 50% 40%
Source: California Energy Commission, Demand Analysis Office, 2015
P A G E 1 0
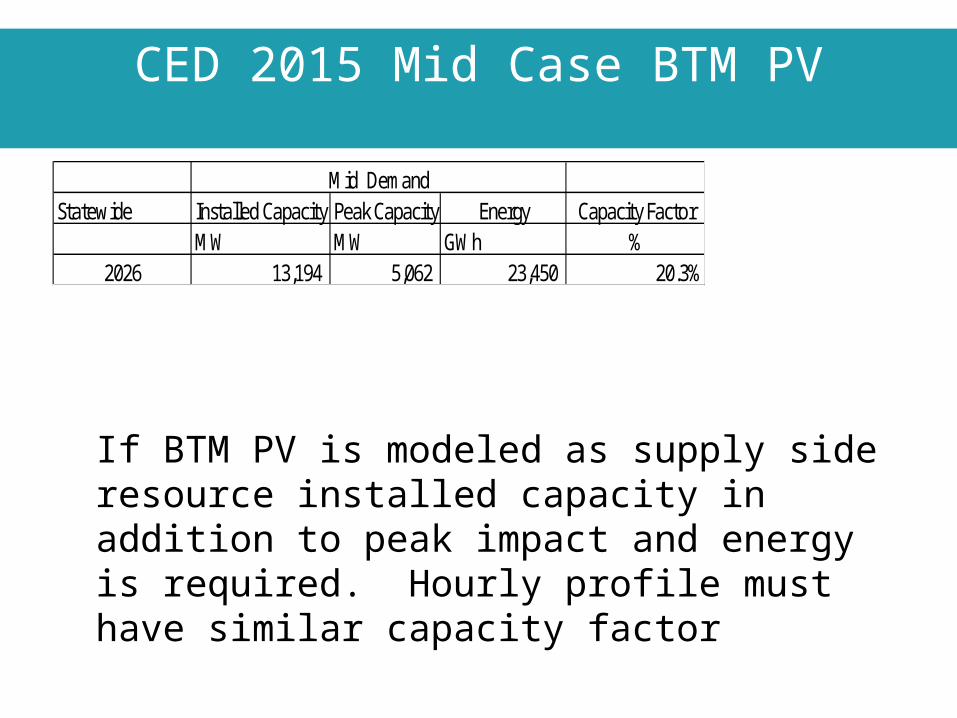
CED 2015 Mid Case BTM PV
Statewide Installed Capacity Peak Capacity Energy Capacity FactorMW MW GWh %
2026 13,194 5,062 23,450 20.3%
Mid_Demand
If BTM PV is modeled as supply side resource installed capacity in addition to peak impact and energy is required. Hourly profile must have similar capacity factor
P A G E 1 1
12
CEC Demand Response
Lana WongCalifornia Energy Commission
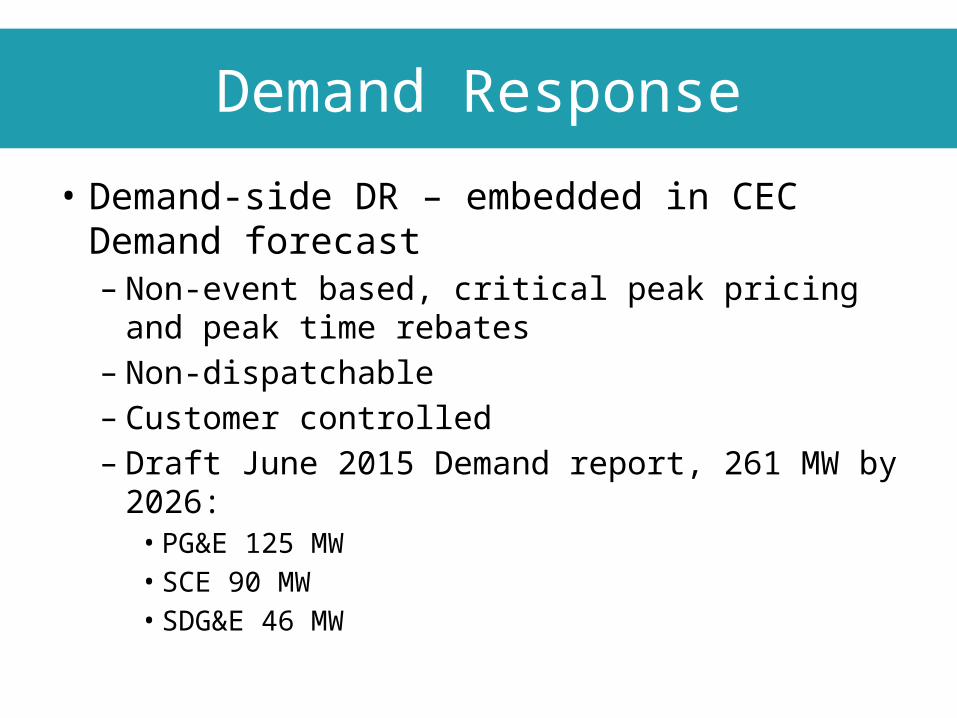
Demand Response
• Demand-side DR – embedded in CEC Demand forecast– Non-event based, critical peak pricing and peak time
rebates– Non-dispatchable– Customer controlled– Draft June 2015 Demand report, 261 MW by 2026:
• PG&E 125 MW• SCE 90 MW• SDG&E 46 MW
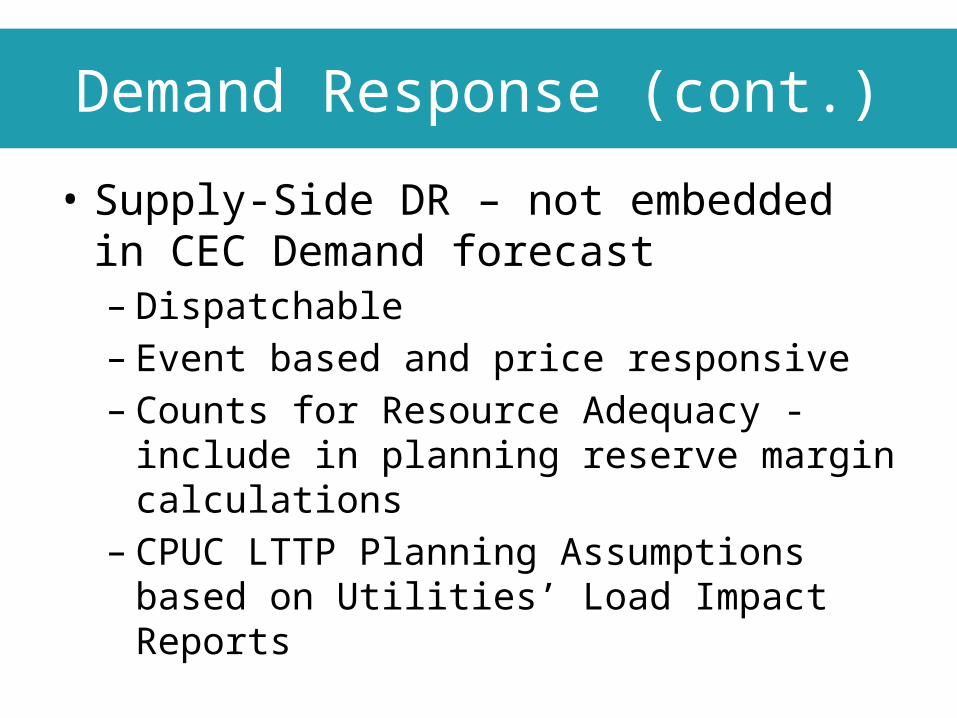
Demand Response (cont.)
• Supply-Side DR – not embedded in CEC Demand forecast– Dispatchable– Event based and price responsive– Counts for Resource Adequacy - include in
planning reserve margin calculations– CPUC LTTP Planning Assumptions based on
Utilities’ Load Impact Reports
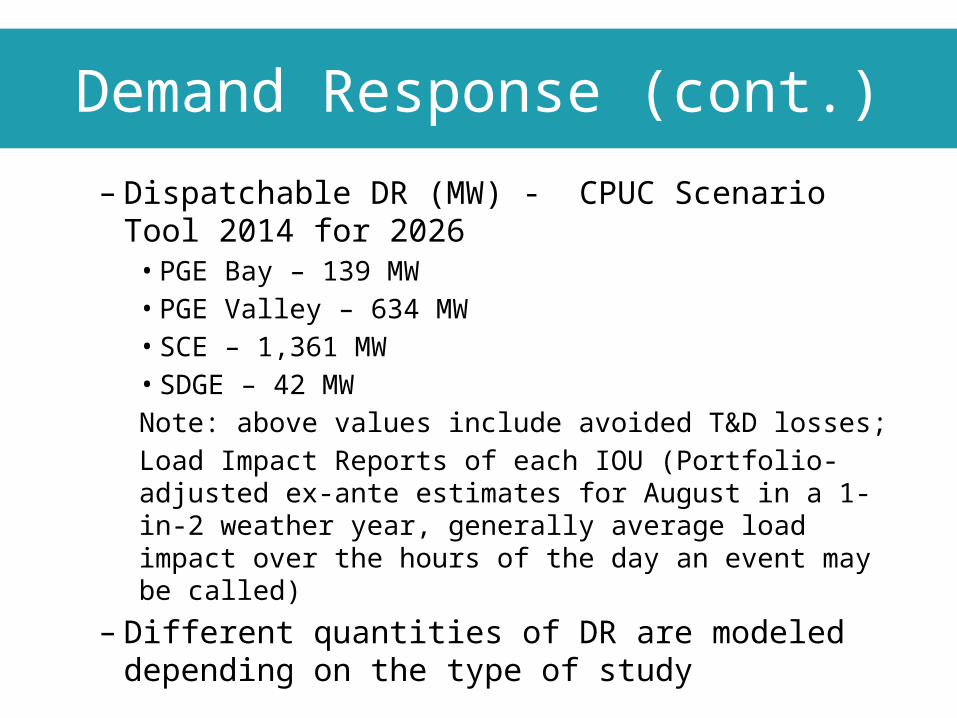
Demand Response (cont.)
– Dispatchable DR (MW) - CPUC Scenario Tool 2014 for 2026
• PGE Bay – 139 MW• PGE Valley – 634 MW• SCE – 1,361 MW• SDGE – 42 MWNote: above values include avoided T&D losses;Load Impact Reports of each IOU (Portfolio-adjusted ex-ante estimates for August in a 1-in-2 weather year, generally average load impact over the hours of the day an event may be called)
– Different quantities of DR are modeled depending on the type of study
16
CPUC-Authorized OTC Replacement Procurement Assumptions for TEPPC 2026 Common Case
Jan Strack Sempra Energy Utilities
17
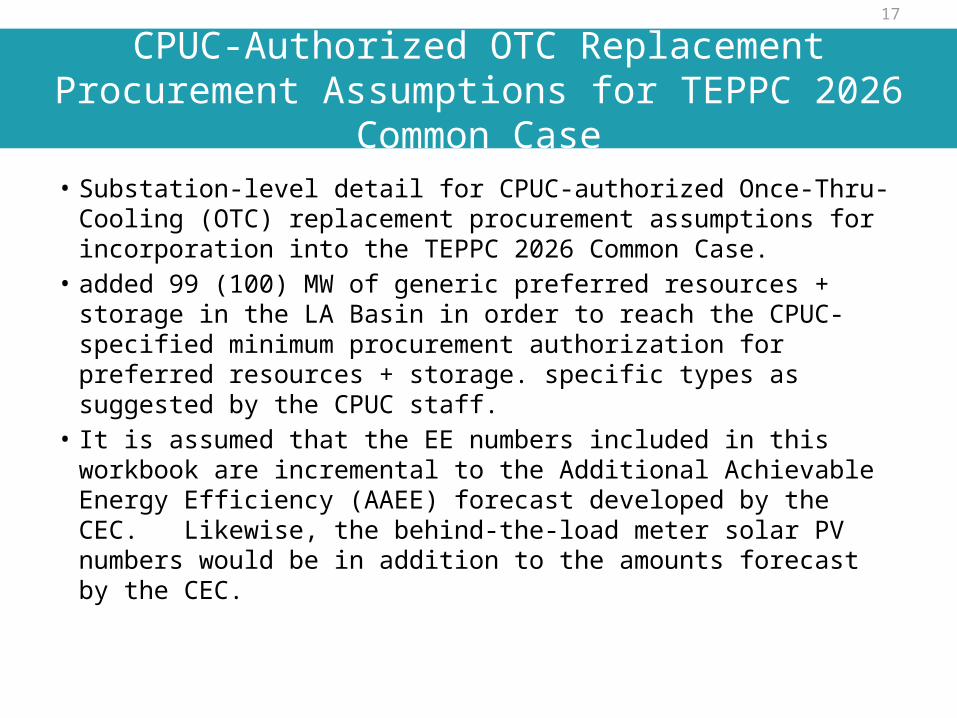
CPUC-Authorized OTC Replacement Procurement Assumptions for TEPPC 2026 Common Case
• Substation-level detail for CPUC-authorized Once-Thru-Cooling (OTC) replacement procurement assumptions for incorporation into the TEPPC 2026 Common Case.
• added 99 (100) MW of generic preferred resources + storage in the LA Basin in order to reach the CPUC-specified minimum procurement authorization for preferred resources + storage. specific types as suggested by the CPUC staff.
• It is assumed that the EE numbers included in this workbook are incremental to the Additional Achievable Energy Efficiency (AAEE) forecast developed by the CEC. Likewise, the behind-the-load meter solar PV numbers would be in addition to the amounts forecast by the CEC.
18
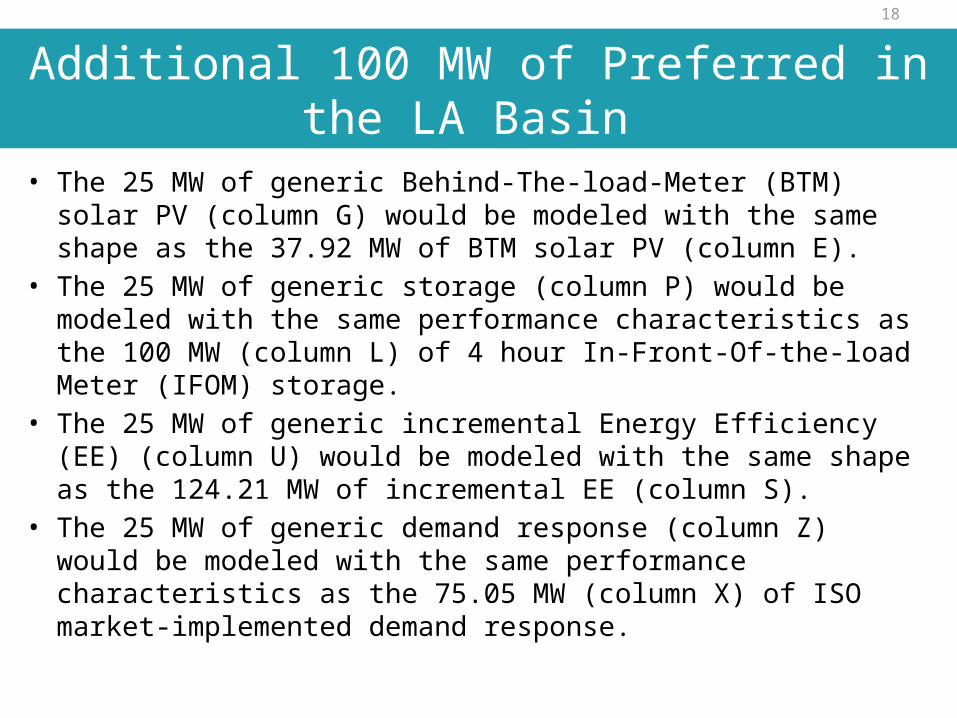
Additional 100 MW of Preferred in the LA Basin
• The 25 MW of generic Behind-The-load-Meter (BTM) solar PV (column G) would be modeled with the same shape as the 37.92 MW of BTM solar PV (column E).
• The 25 MW of generic storage (column P) would be modeled with the same performance characteristics as the 100 MW (column L) of 4 hour In-Front-Of-the-load Meter (IFOM) storage.
• The 25 MW of generic incremental Energy Efficiency (EE) (column U) would be modeled with the same shape as the 124.21 MW of incremental EE (column S).
• The 25 MW of generic demand response (column Z) would be modeled with the same performance characteristics as the 75.05 MW (column X) of ISO market-implemented demand response.

19