Embed Size (px)
Citation preview
California Environmental Protection Agency
California Air Resources Board
California’s Air Pollutionand Climate Change Policies
Bart Croes, ChiefResearch Division
Control policy drivers ...
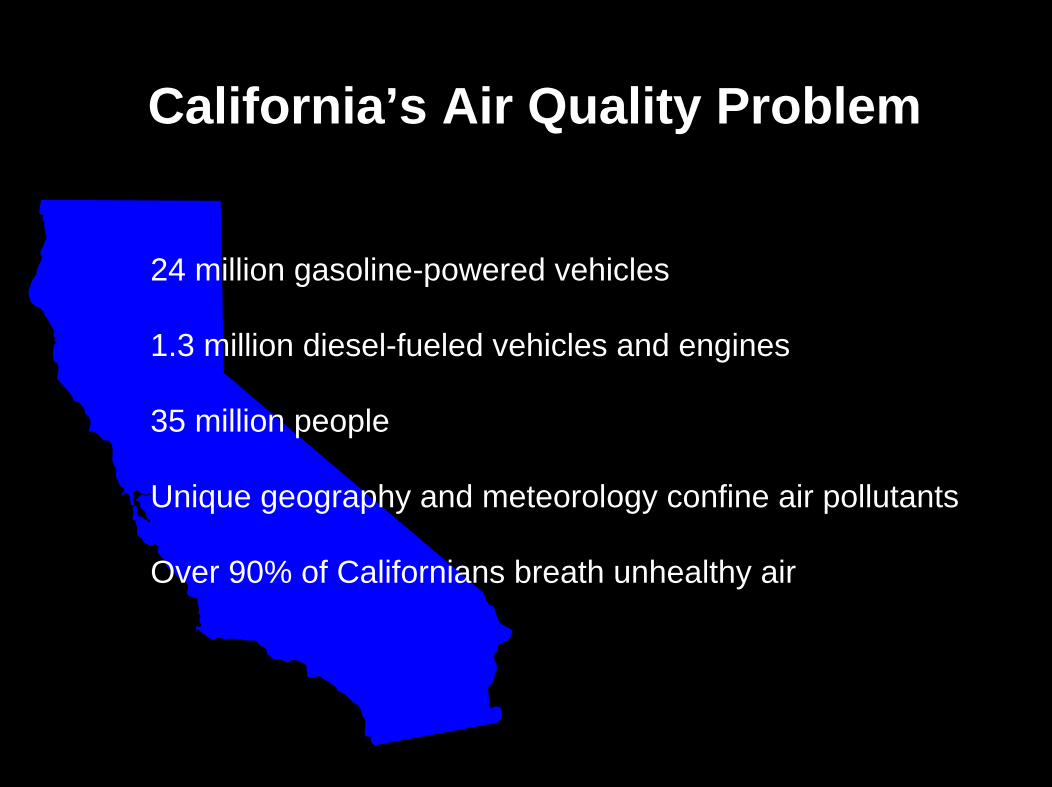
California’s Air Quality Problem
24 million gasoline-powered vehicles
1.3 million diesel-fueled vehicles and engines
35 million people
Unique geography and meteorology confine air pollutants
Over 90% of Californians breath unhealthy air
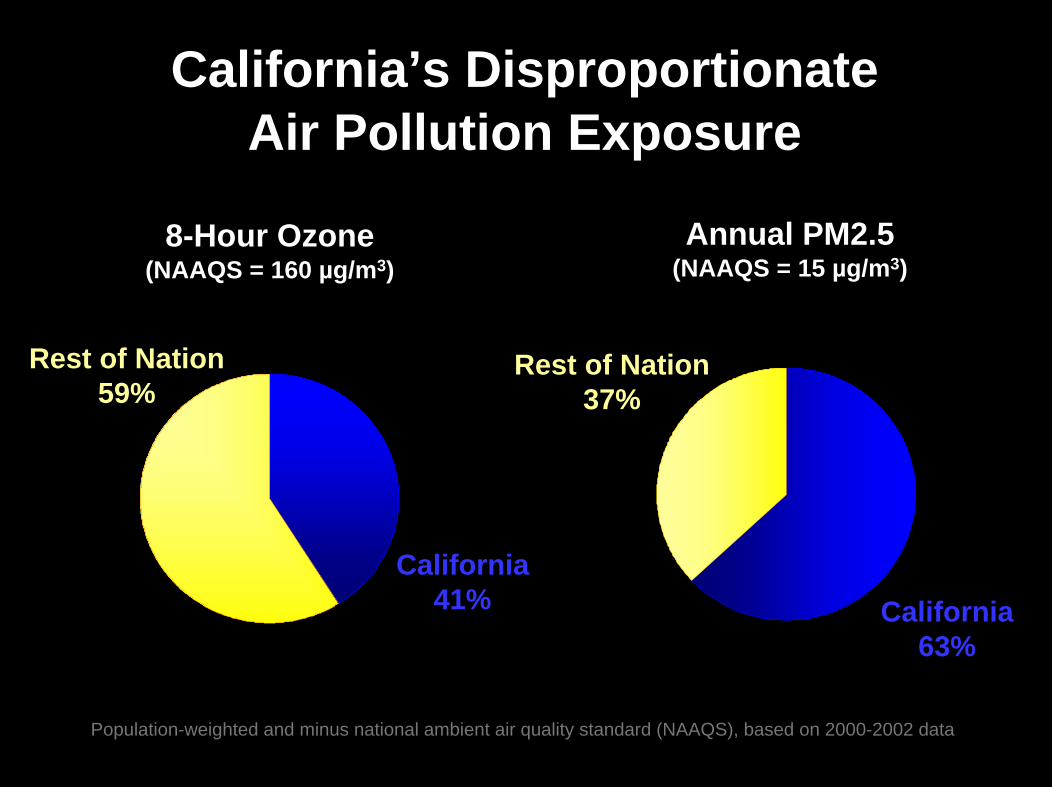
California’s Disproportionate Air Pollution Exposure
California41%
Rest of Nation59%
8-Hour Ozone(NAAQS = 160 µg/m3)
California63%
Rest of Nation37%
Annual PM2.5(NAAQS = 15 µg/m3)
Population-weighted and minus national ambient air quality standard (NAAQS), based on 2000-2002 data
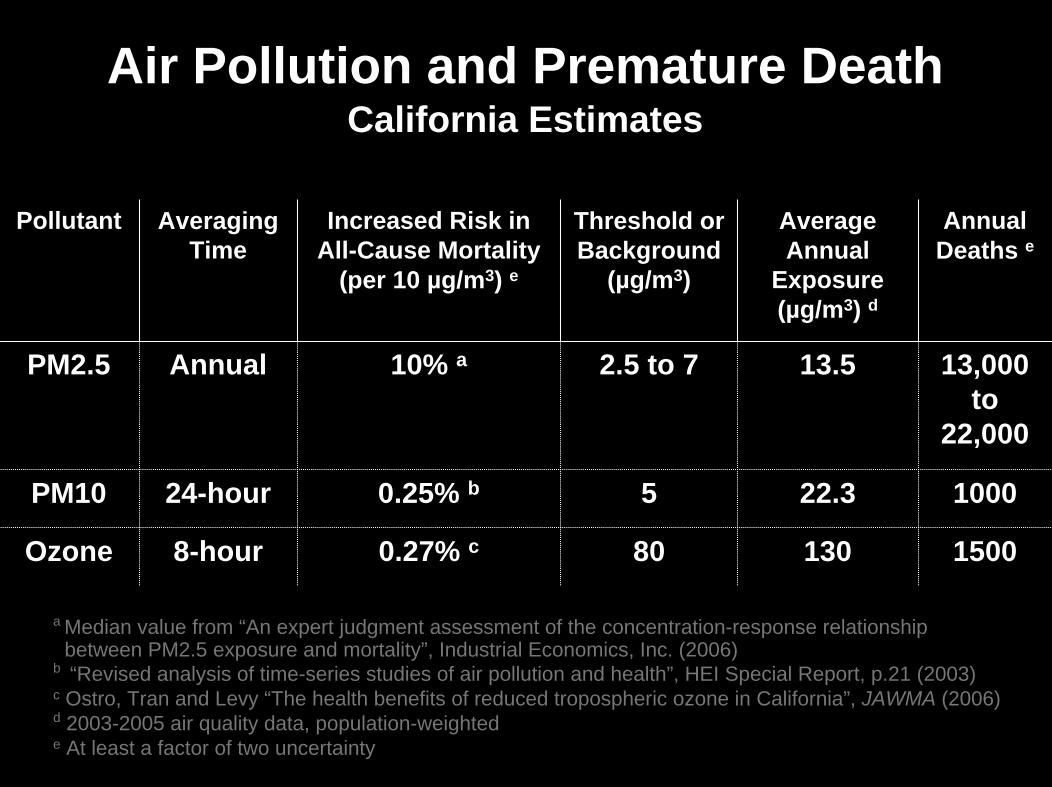
Air Pollution and Premature DeathCalifornia Estimates
a Median value from “An expert judgment assessment of the concentration-response relationshipbetween PM2.5 exposure and mortality”, Industrial Economics, Inc. (2006)
b “Revised analysis of time-series studies of air pollution and health”, HEI Special Report, p.21 (2003)c Ostro, Tran and Levy “The health benefits of reduced tropospheric ozone in California”, JAWMA (2006)d 2003-2005 air quality data, population-weightede At least a factor of two uncertainty
Pollutant Averaging Time
Increased Risk inAll-Cause Mortality
(per 10 µg/m3) e
Threshold or Background
(µg/m3)
Average Annual
Exposure(µg/m3) d
AnnualDeaths e
PM2.5 Annual 10% a 2.5 to 7 13.5 13,000to
22,000
PM10 24-hour 0.25% b 5 22.3 1000
Ozone 8-hour 0.27% c 80 130 1500
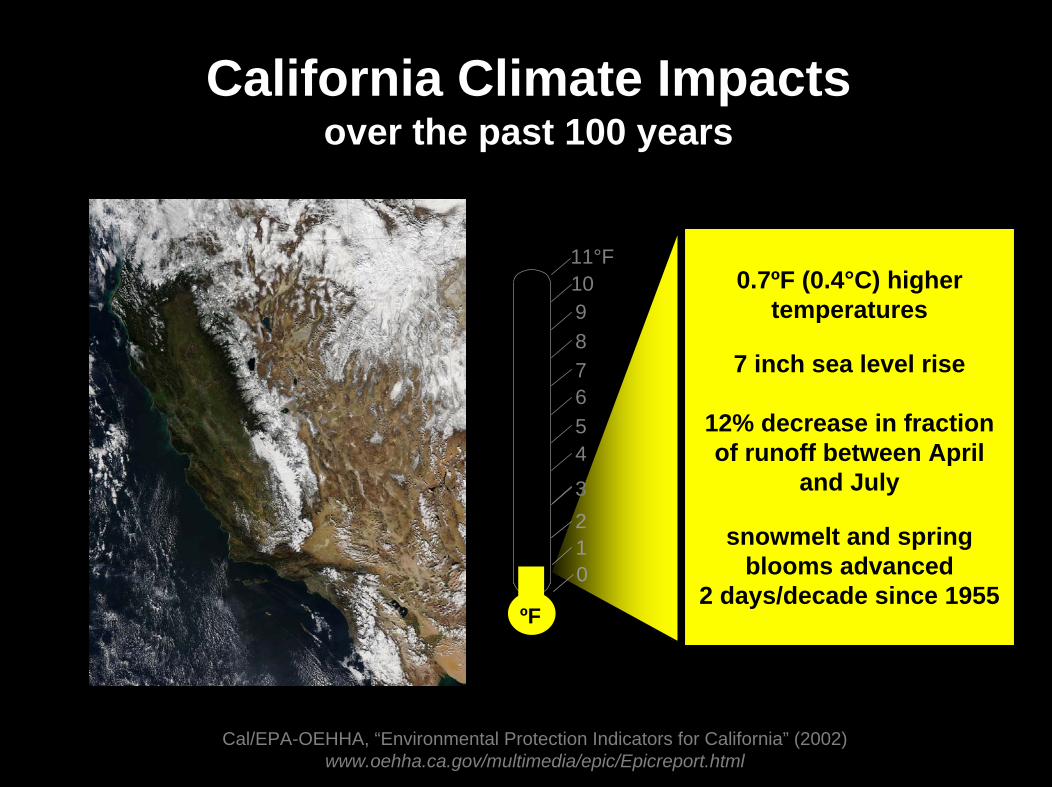
Cal/EPA-OEHHA, “Environmental Protection Indicators for California” (2002)www.oehha.ca.gov/multimedia/epic/Epicreport.html
California Climate Impactsover the past 100 years
0
2
8
7
1
9
10
11
12
13°F
3
4
0.7ºF (0.4°C) higher temperatures
7 inch sea level rise
12% decrease in fraction of runoff between April
and July
snowmelt and spring blooms advanced
2 days/decade since 1955
67891011
0
4
32
5
1
ºF
11°F
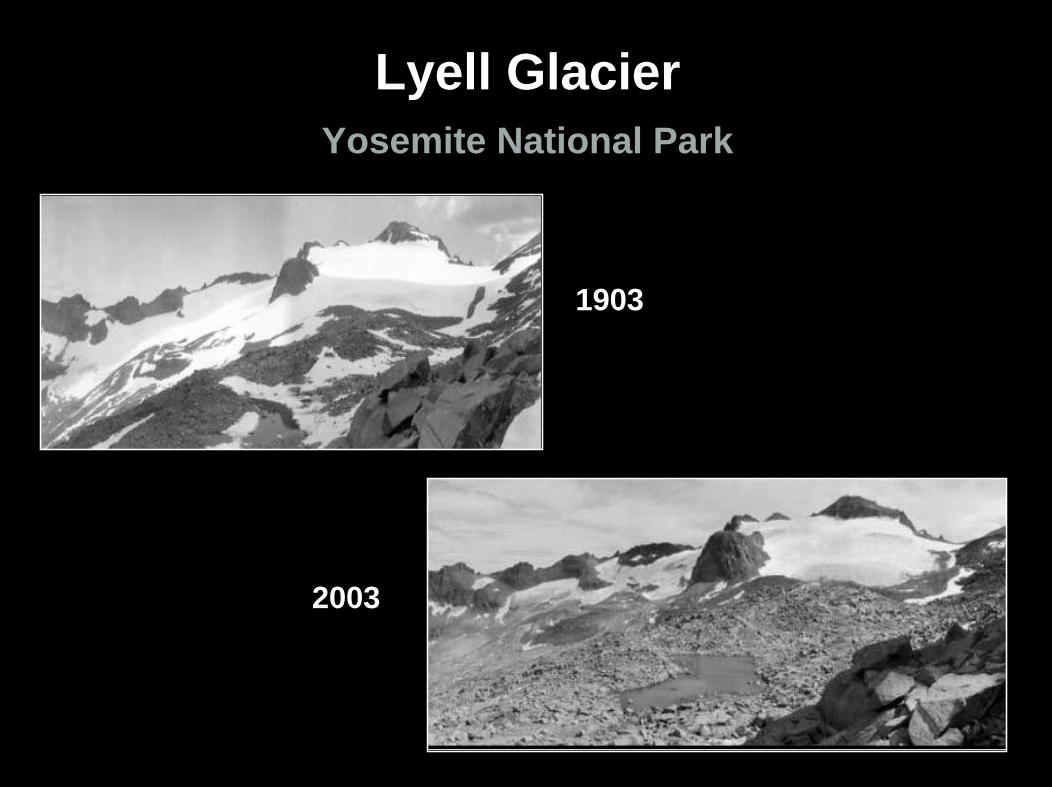
Lyell GlacierYosemite National Park
2003
1903
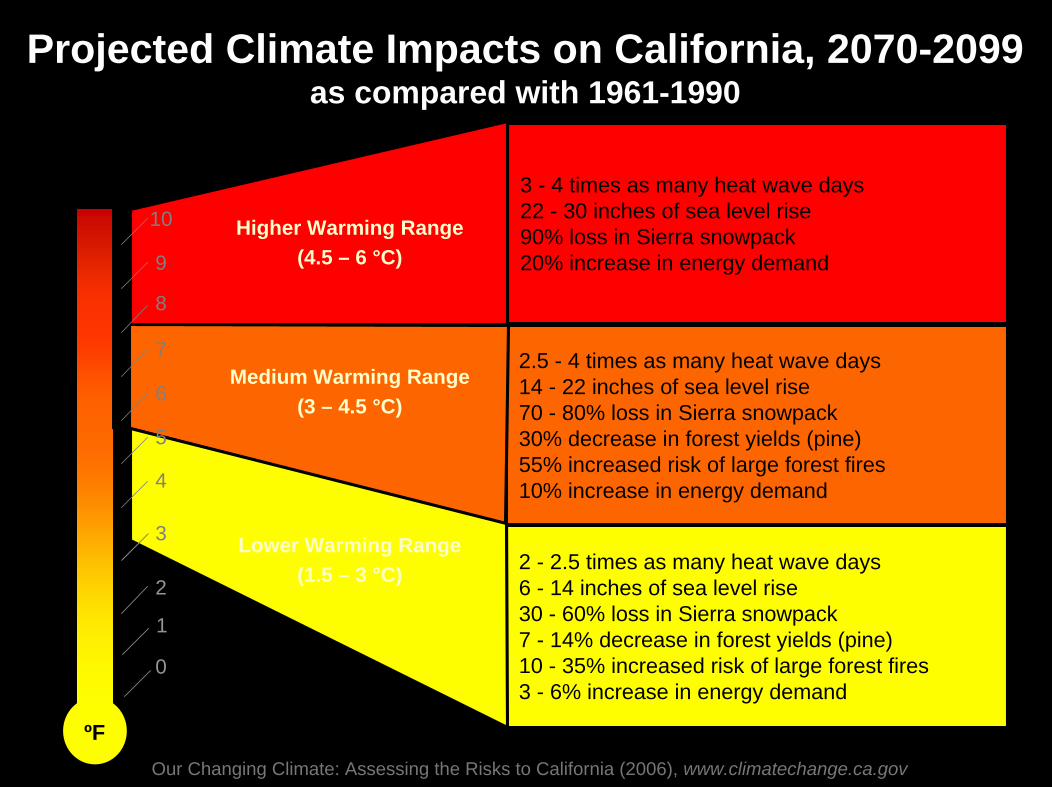
Projected Climate Impacts on California, 2070-2099as compared with 1961-1990
2.5 - 4 times as many heat wave days14 - 22 inches of sea level rise70 - 80% loss in Sierra snowpack30% decrease in forest yields (pine)55% increased risk of large forest fires10% increase in energy demand
Medium Warming Range(3 – 4.5 °C)
3 - 4 times as many heat wave days22 - 30 inches of sea level rise90% loss in Sierra snowpack20% increase in energy demand
Higher Warming Range(4.5 – 6 °C)
6
7
8
9
10
11
12
13°F
Our Changing Climate: Assessing the Risks to California (2006), www.climatechange.ca.gov
2 - 2.5 times as many heat wave days6 - 14 inches of sea level rise30 - 60% loss in Sierra snowpack7 - 14% decrease in forest yields (pine)10 - 35% increased risk of large forest fires3 - 6% increase in energy demand
Lower Warming Range(1.5 – 3 °C)
0
4
3
2
5
1
ºF
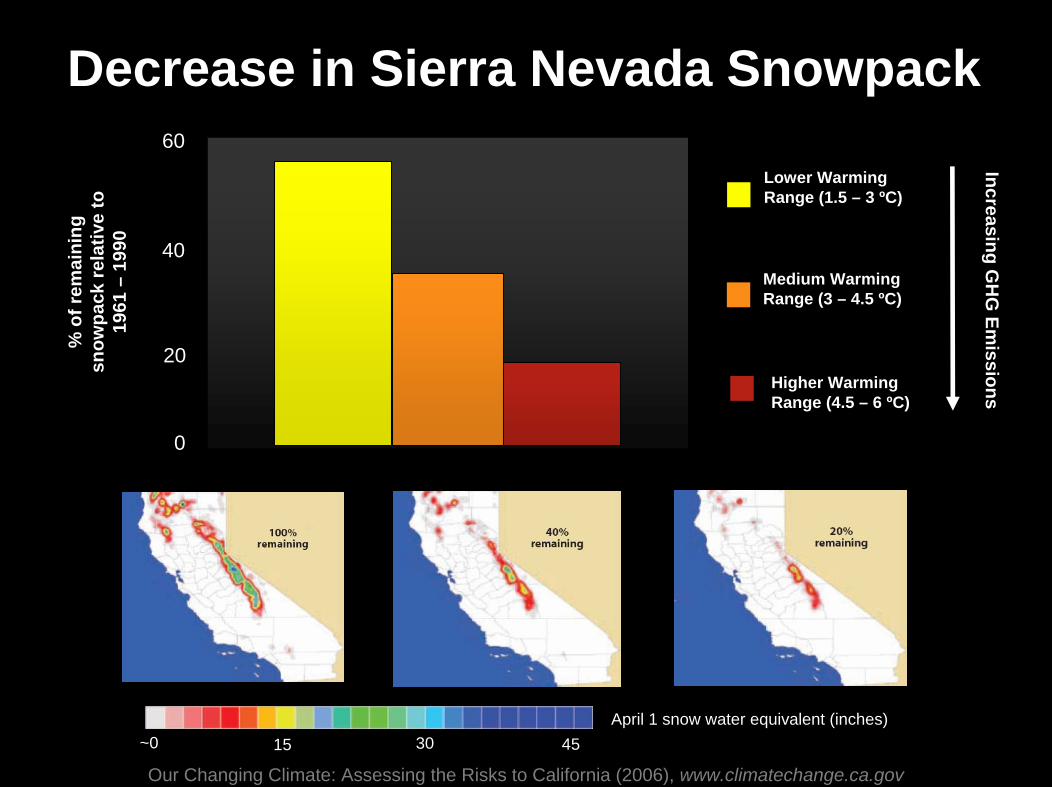
Decrease in Sierra Nevada Snowpack%
of r
emai
ning
sn
owpa
ckre
lativ
e to
19
61 –
1990
Increasing GH
G Em
issions
Lower WarmingRange (1.5 – 3 ºC)
Medium WarmingRange (3 – 4.5 ºC)
Higher WarmingRange (4.5 – 6 ºC)
60
40
20
0
April 1 snow water equivalent (inches)~0 453015
Our Changing Climate: Assessing the Risks to California (2006), www.climatechange.ca.gov
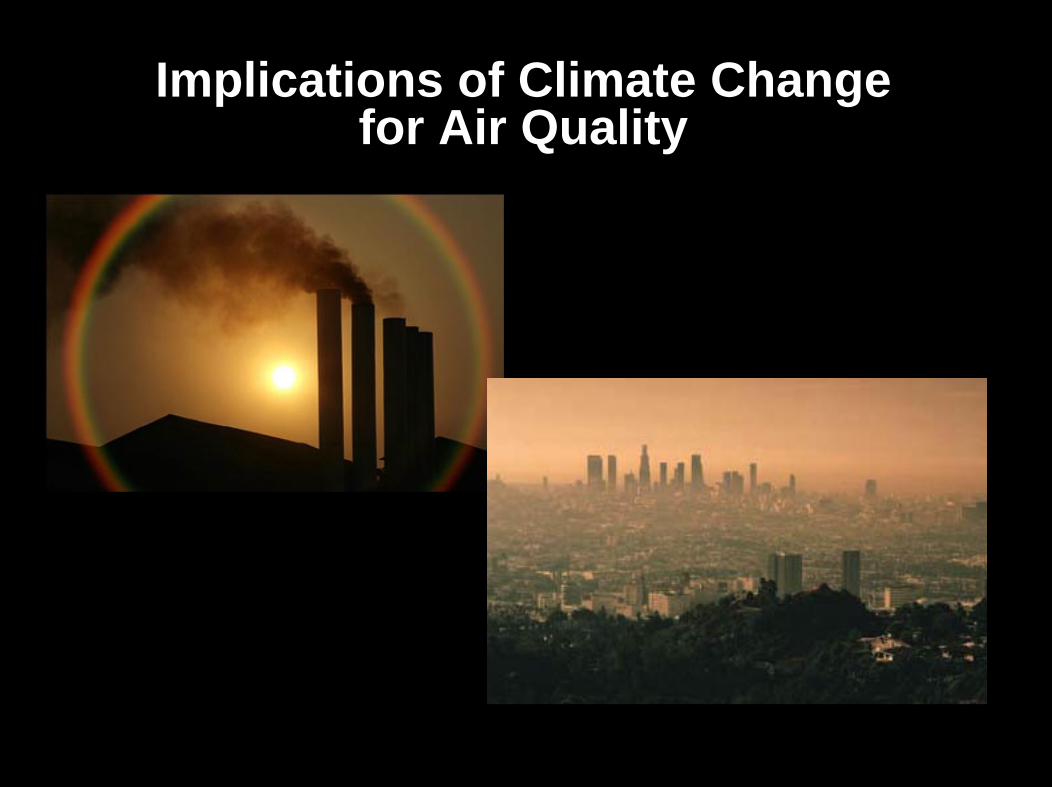
Implications of Climate Change for Air Quality
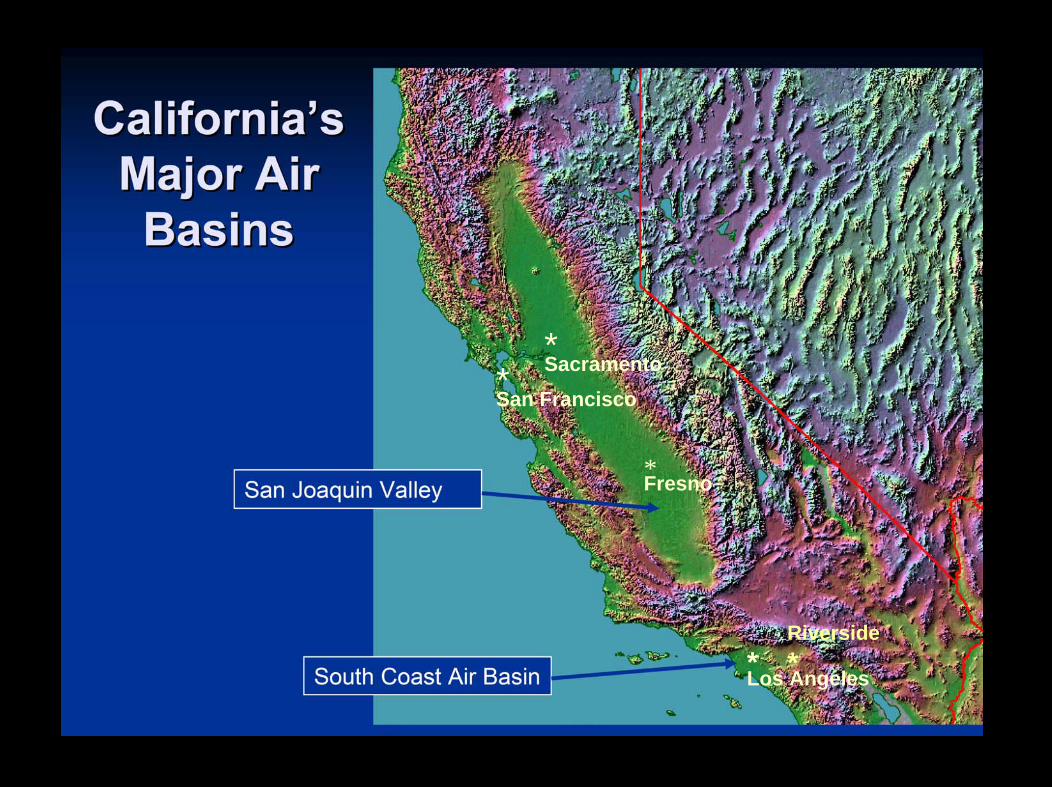
* Fresno
*Los Angeles
*San Francisco
*Sacramento
Riverside*
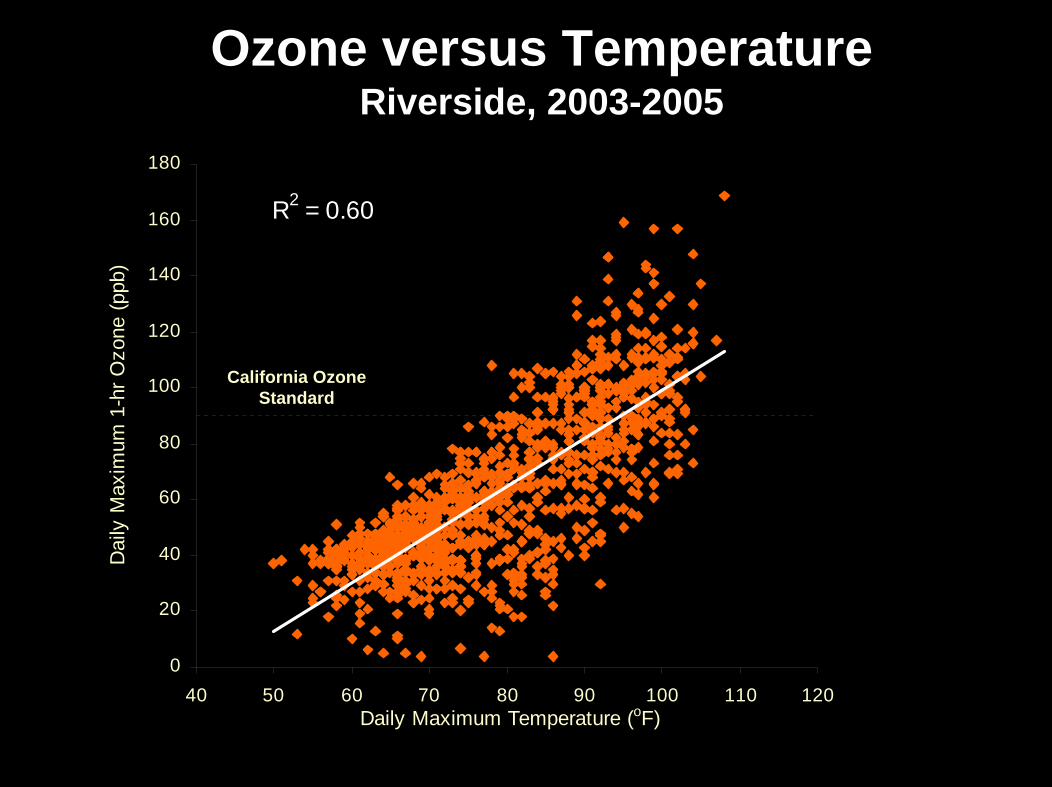
Ozone versus Temperature Riverside, 2003-2005
CaliforniaOzone
Standard
California Ozone Standard
R2 = 0.60
0
20
40
60
80
100
120
140
160
180
40 50 60 70 80 90 100 110 120Daily Maximum Temperature (oF)
Dai
ly M
axim
um 1
-hr O
zone
(ppb
)
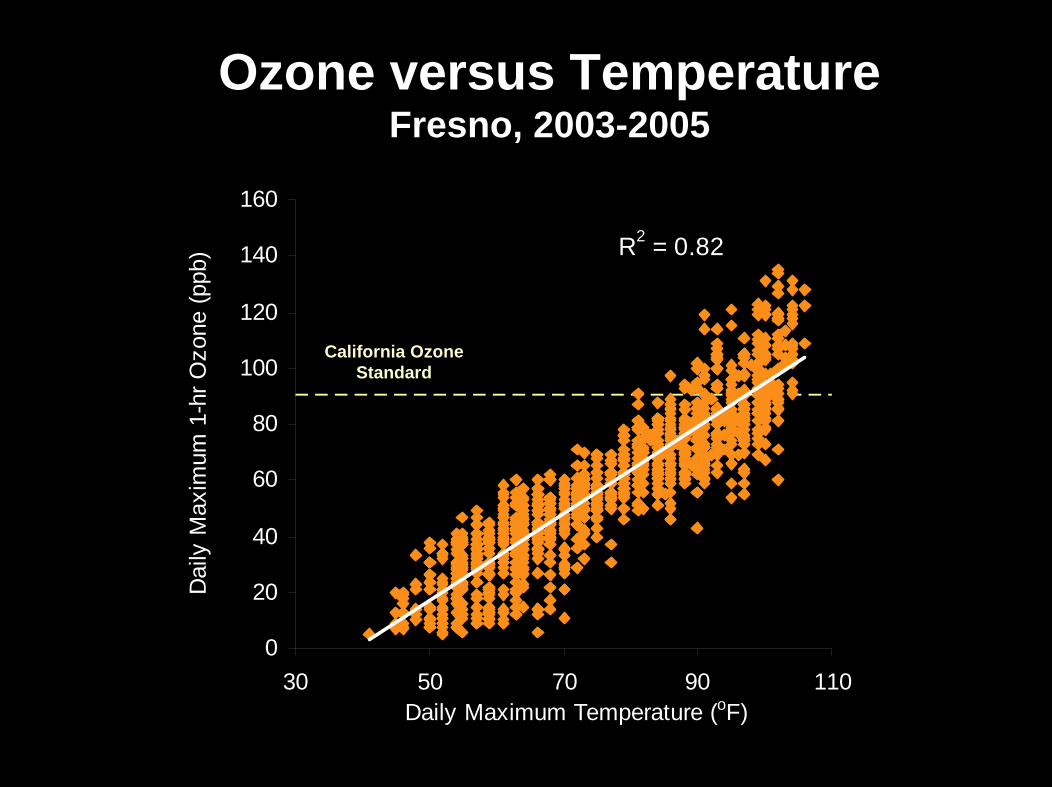
Ozone versus Temperature Fresno, 2003-2005
California Ozone Standard
R2 = 0.82
0
20
40
60
80
100
120
140
160
30 50 70 90 110Daily Maximum Temperature (oF)
Dai
ly M
axim
um 1
-hr O
zone
(ppb
)
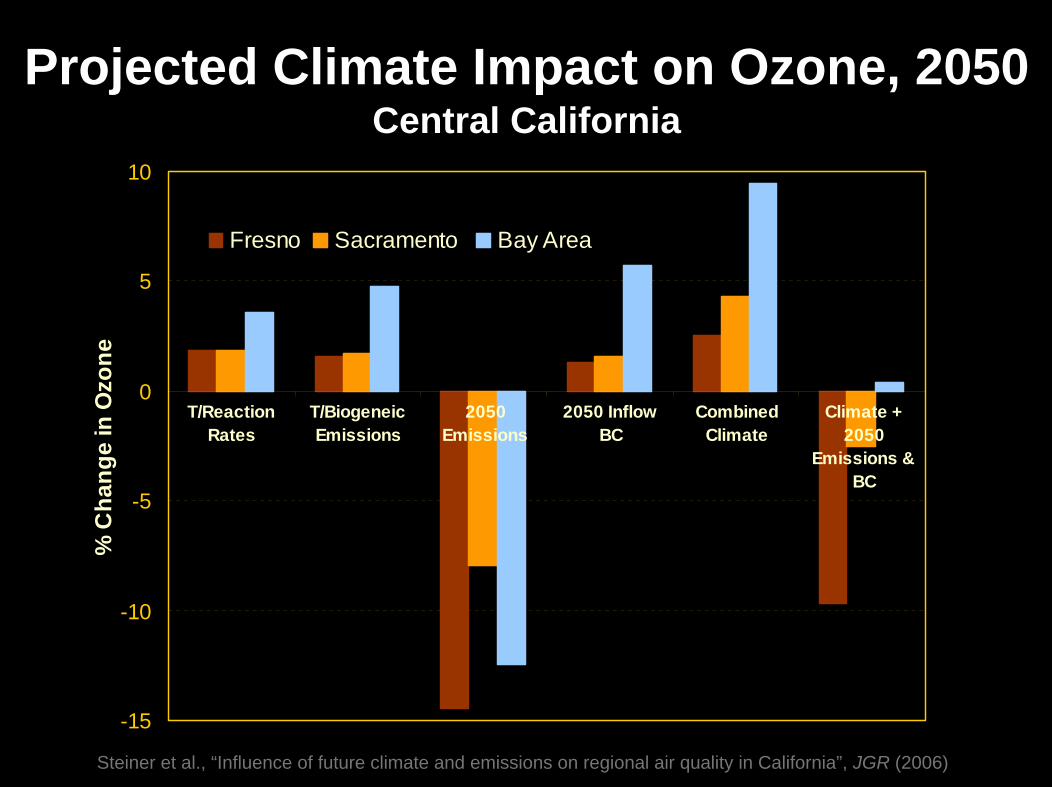
Projected Climate Impact on Ozone, 2050Central California
Rob Harley slide to be updated later-15
-10
-5
0
5
10
T/ReactionRates
T/BiogeneicEmissions
2050Emissions
2050 InflowBC
CombinedClimate
Climate +2050
Emissions &BC
% C
hang
e in
Ozo
ne
Fresno Sacramento Bay Area
Steiner et al., “Influence of future climate and emissions on regional air quality in California”, JGR (2006)
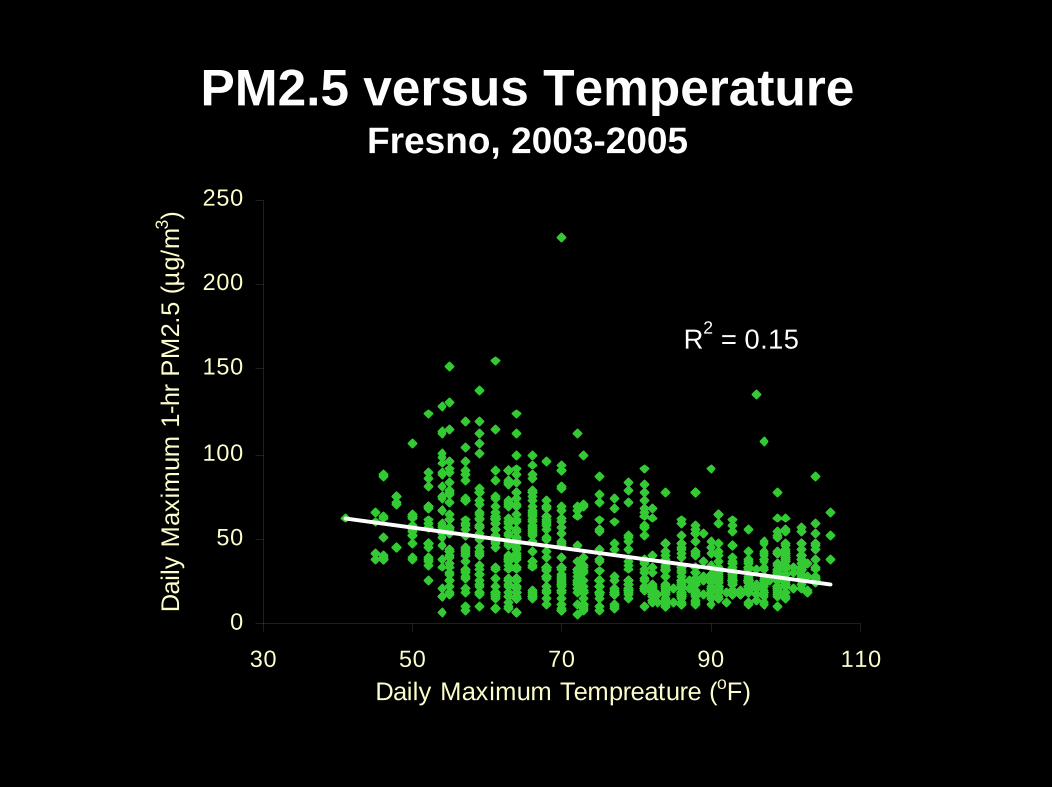
PM2.5 versus Temperature Fresno, 2003-2005
R2 = 0.15
0
50
100
150
200
250
30 50 70 90 110Daily Maximum Tempreature (oF)
Dai
ly M
axim
um 1
-hr P
M2.
5 (µ
g/m
3 )
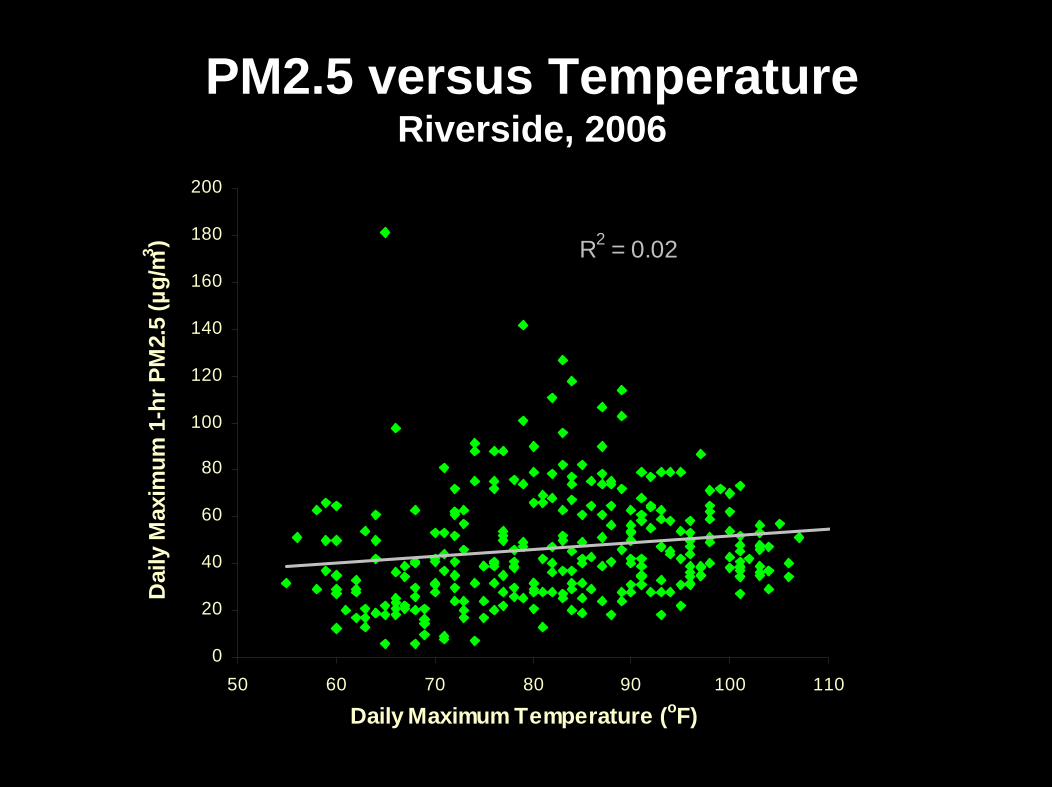
PM2.5 versus Temperature Riverside, 2006
R2 = 0.02
0
20
40
60
80
100
120
140
160
180
200
50 60 70 80 90 100 110
Daily Maximum Temperature (oF)
Dai
ly M
axim
um 1
-hr P
M2.
5 (µ
g/m3 )
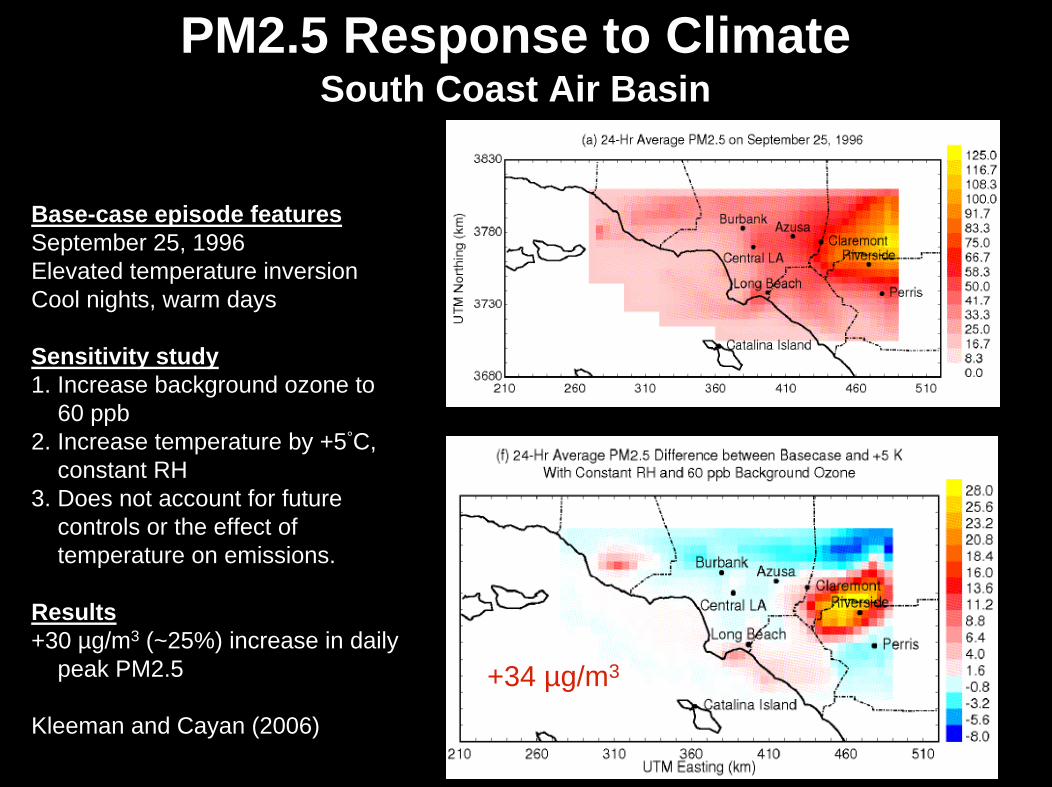
PM2.5 Response to ClimateSouth Coast Air Basin
+34 µg/m3
Base-case episode featuresSeptember 25, 1996Elevated temperature inversionCool nights, warm days
Sensitivity study1. Increase background ozone to
60 ppb2. Increase temperature by +5°C,
constant RH3. Does not account for future
controls or the effect of temperature on emissions.
Results+30 µg/m3 (~25%) increase in daily
peak PM2.5
Kleeman and Cayan (2006)
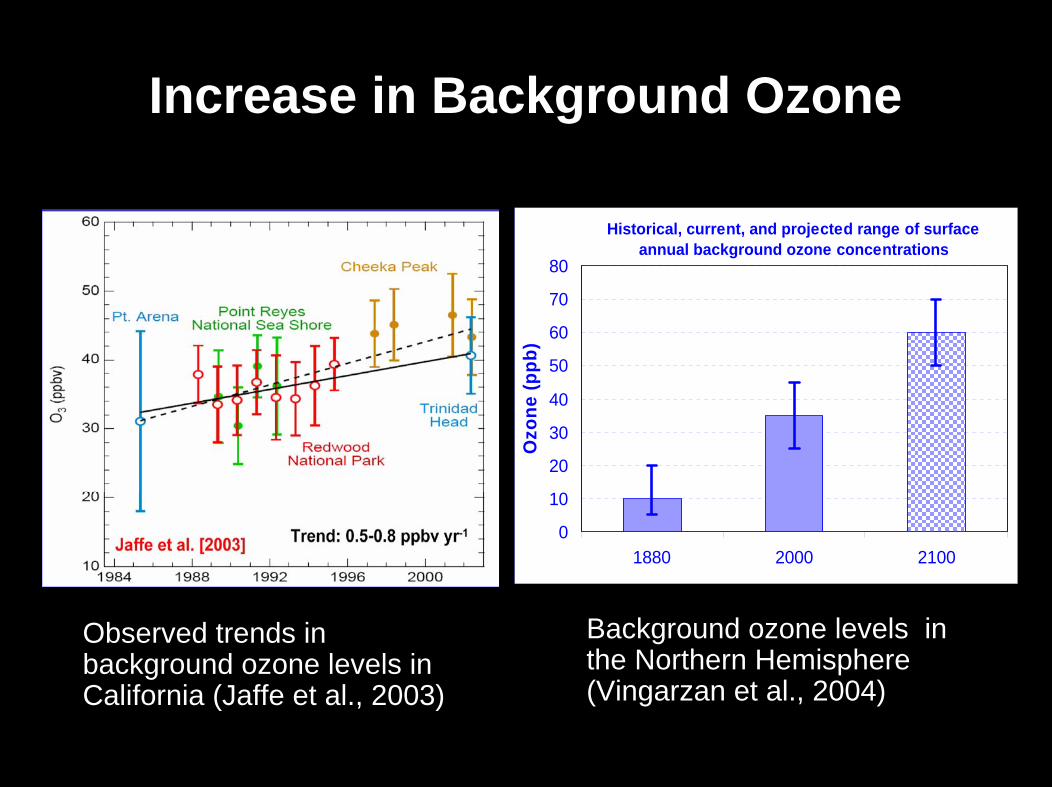
Increase in Background Ozone
Observed trends in background ozone levels in California (Jaffe et al., 2003)
Historical, current, and projected range of surface annual background ozone concentrations
0
10
20
30
40
50
60
70
80
1880 2000 2100O
zone
(ppb
)
Background ozone levels in the Northern Hemisphere (Vingarzan et al., 2004)
Policy response ...
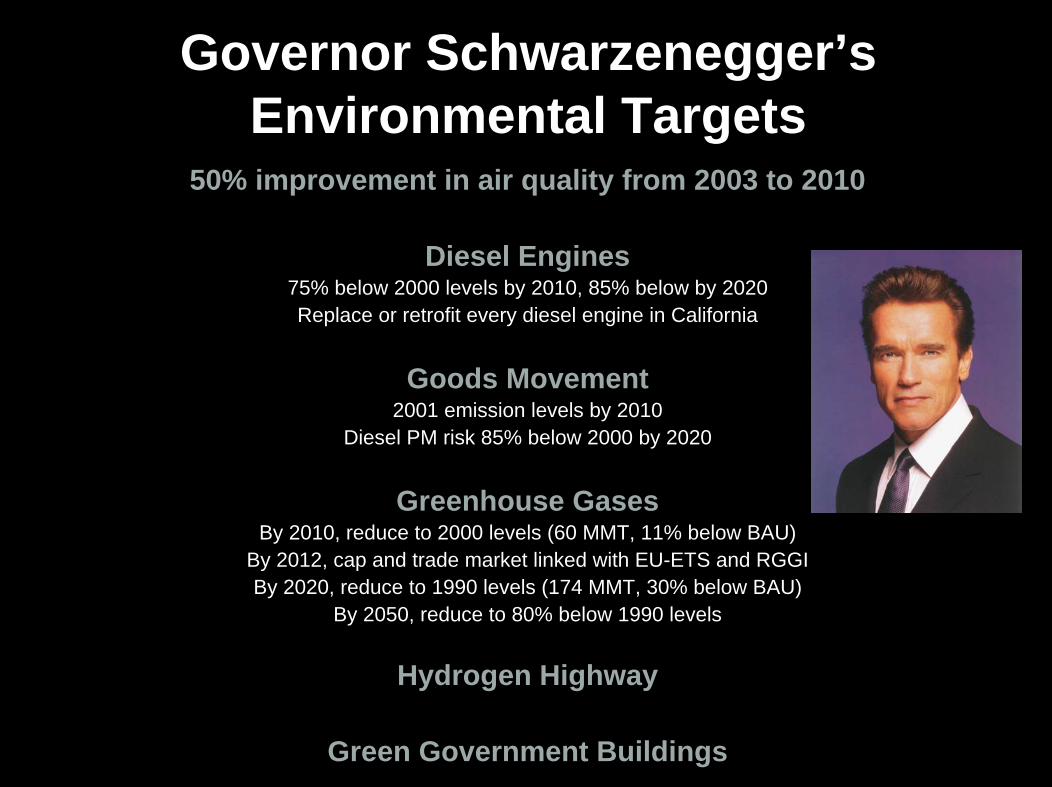
Governor Schwarzenegger’s Environmental Targets
50% improvement in air quality from 2003 to 2010
Diesel Engines75% below 2000 levels by 2010, 85% below by 2020Replace or retrofit every diesel engine in California
Goods Movement2001 emission levels by 2010
Diesel PM risk 85% below 2000 by 2020
Greenhouse GasesBy 2010, reduce to 2000 levels (60 MMT, 11% below BAU)
By 2012, cap and trade market linked with EU-ETS and RGGI By 2020, reduce to 1990 levels (174 MMT, 30% below BAU)
By 2050, reduce to 80% below 1990 levels
Hydrogen Highway
Green Government Buildings
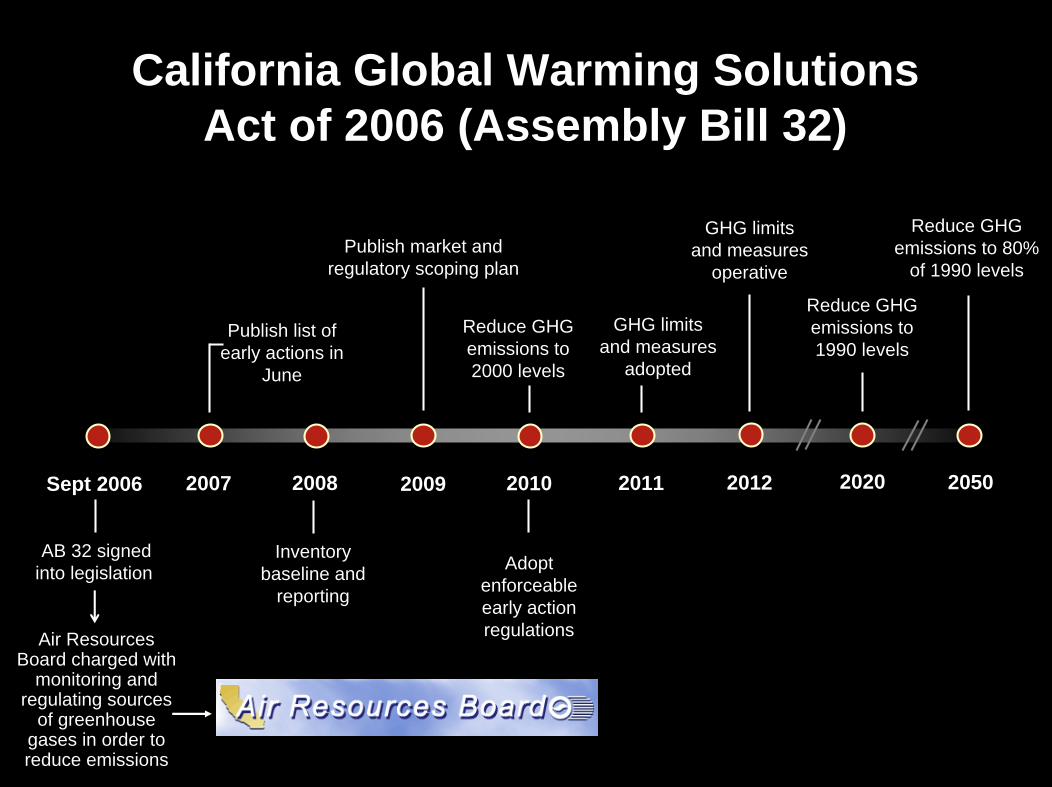
California Global Warming Solutions Act of 2006 (Assembly Bill 32)
Sept 2006 20502020
AB 32 signedinto legislation
Air Resources Board charged with
monitoring and regulating sources
of greenhouse gases in order to reduce emissions
Reduce GHG emissions to 2000 levels
Reduce GHG emissions to 80%
of 1990 levels
2007 2008 2009 2010 2011 2012
GHG limits and measures
operative
GHG limits and measures
adopted
Publish list of early actions in
June
Publish market and regulatory scoping plan
Inventory baseline and
reporting
Adopt enforceable early action regulations
Reduce GHG emissions to 1990 levels
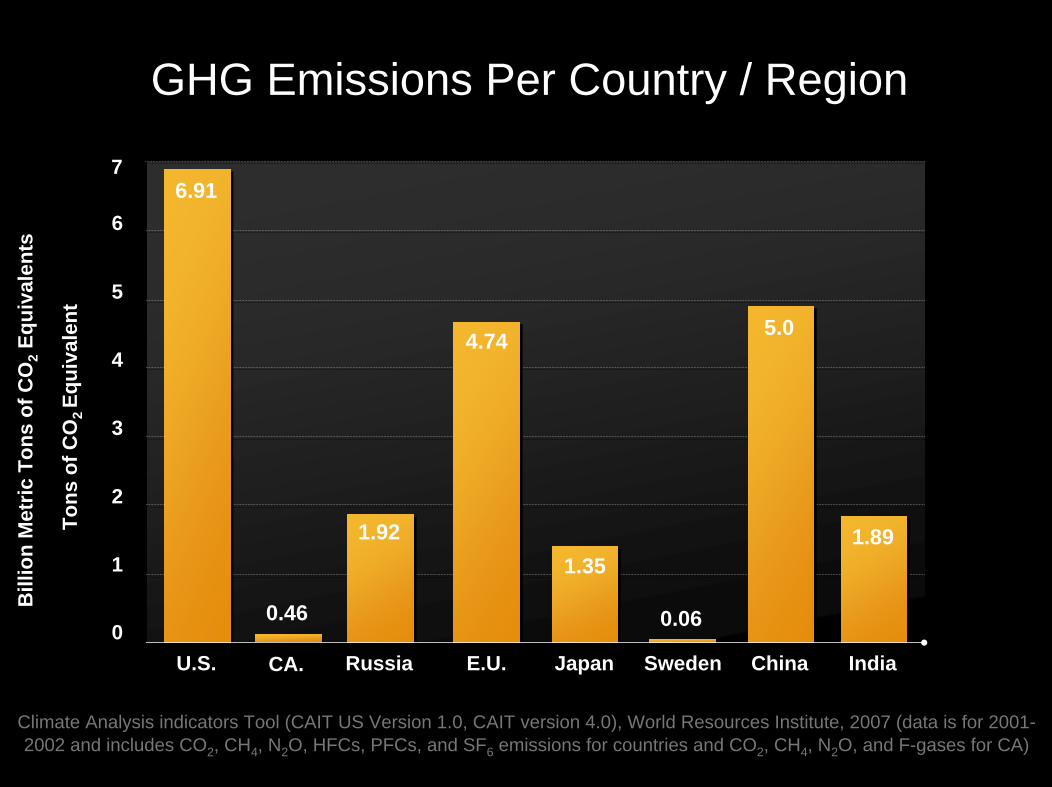
GHG Emissions Per Country / Region
6.91
U.S.
0.06
5.0
1.89
Sweden China India0
1
2
3
4
5
6
Russia E.U. Japan
1.92
4.74
1.35
7
Tons
of C
O2 Eq
uiva
lent
Bill
ion
Met
ric T
ons
of C
O2
Equi
vale
nts
Climate Analysis indicators Tool (CAIT US Version 1.0, CAIT version 4.0), World Resources Institute, 2007 (data is for 2001-2002 and includes CO2, CH4, N2O, HFCs, PFCs, and SF6 emissions for countries and CO2, CH4, N2O, and F-gases for CA)
0.46
CA.
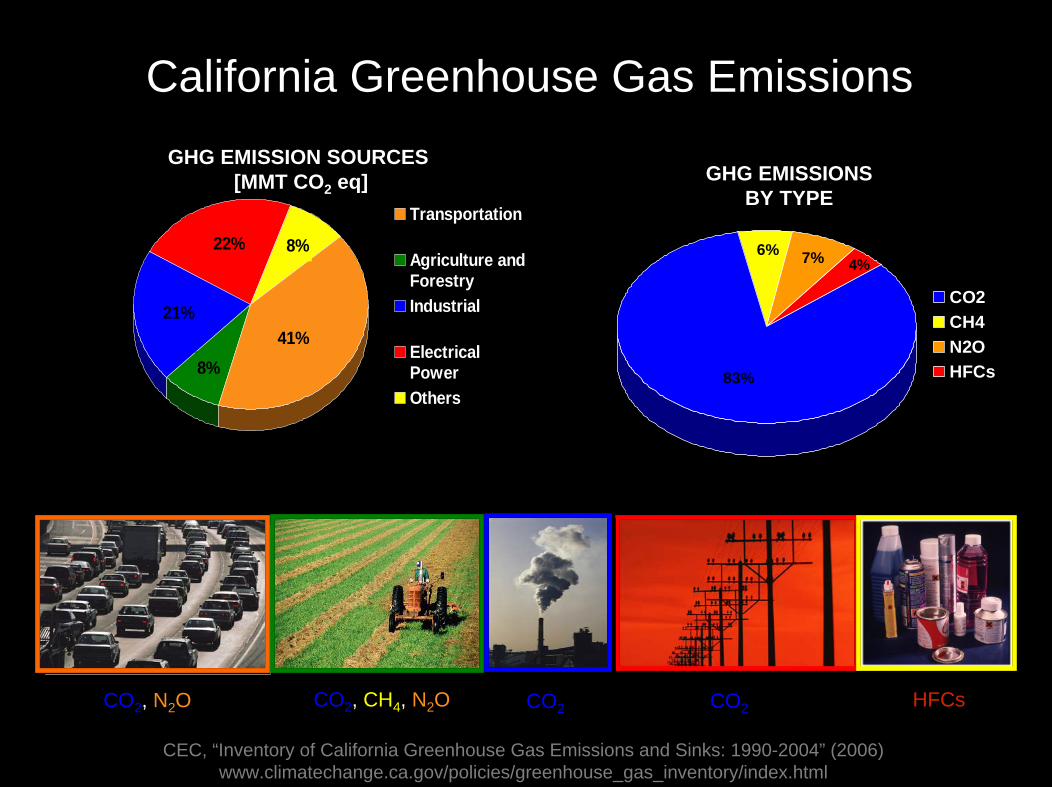
California Greenhouse Gas Emissions
22% 8%
21%
8%41%
Transportation
Agriculture andForestryIndustrial
ElectricalPowerOthers
83%
7%6%4%
CO2CH4N2OHFCs
CEC, “Inventory of California Greenhouse Gas Emissions and Sinks: 1990-2004” (2006)www.climatechange.ca.gov/policies/greenhouse_gas_inventory/index.html
GHG EMISSION SOURCES[MMT CO2 eq] GHG EMISSIONS
BY TYPE
CO2, N2O HFCsCO2, CH4, N2O CO2 CO2
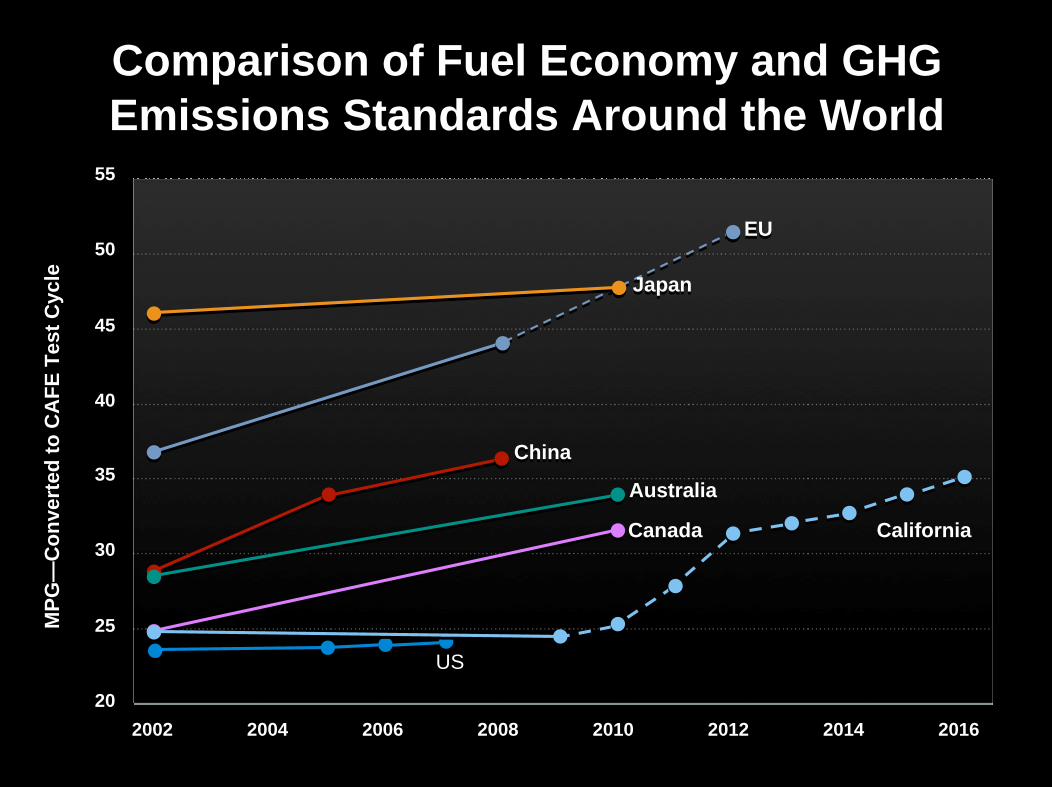
Comparison of Fuel Economy and GHG Emissions Standards Around the World
2002 201620142012201020082006200420
25
30
35
40
45
50
55
EUEU
JapanJapan
ChinaChina
AustraliaAustralia
USUS
MPG
—C
onve
rted
to C
AFE
Tes
t Cyc
le
CanadaCanada CaliforniaCalifornia
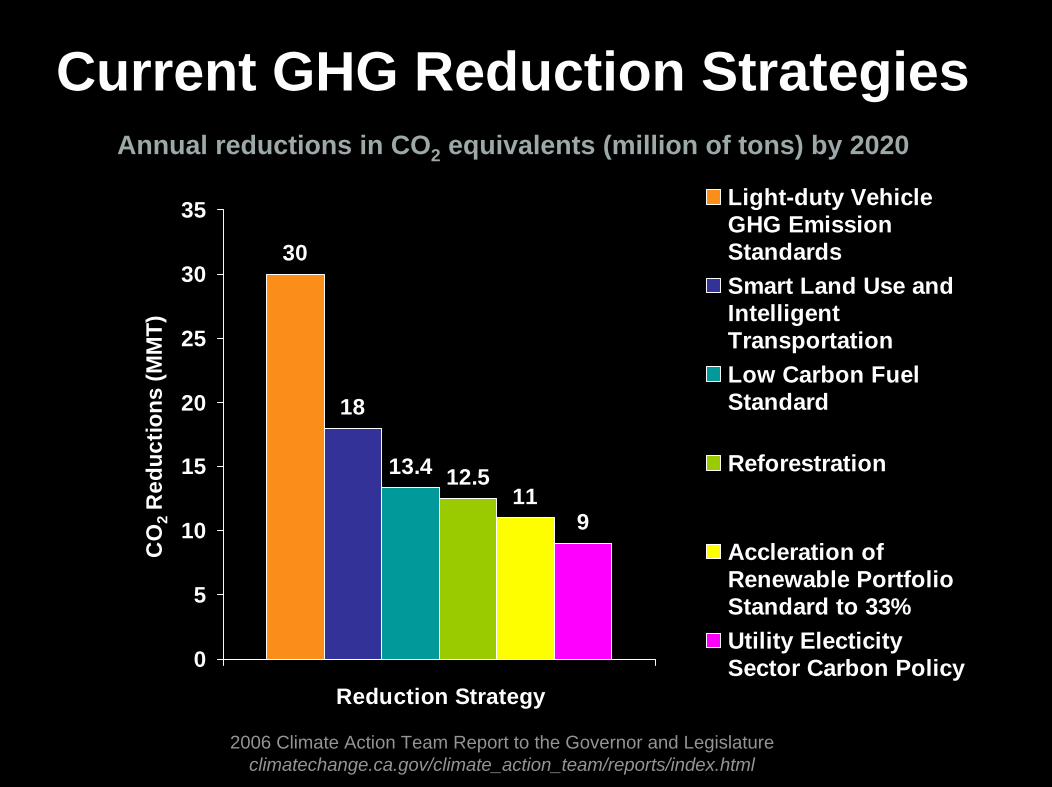
Current GHG Reduction Strategies
30
18
13.4 12.511
9
0
5
10
15
20
25
30
35
Reduction Strategy
CO
2 Red
uctio
ns (M
MT)
Light-duty VehicleGHG EmissionStandardsSmart Land Use andIntelligentTransportationLow Carbon FuelStandard
Reforestration
Accleration ofRenewable PortfolioStandard to 33%Utility ElecticitySector Carbon Policy
2006 Climate Action Team Report to the Governor and Legislatureclimatechange.ca.gov/climate_action_team/reports/index.html
Annual reductions in CO2 equivalents (million of tons) by 2020
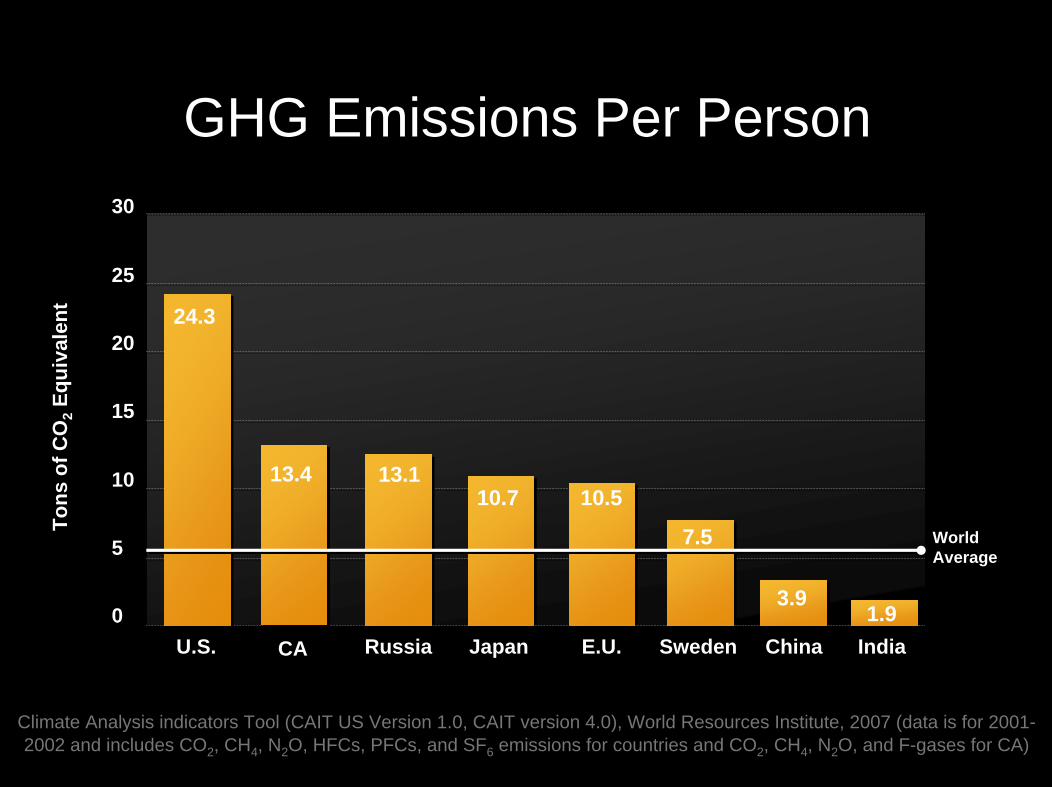
GHG Emissions Per Person
7.5
3.91.9
Sweden China India0
5
10
15
20
25
30
Russia Japan E.U.
13.110.7 10.5
Tons
of C
O2
Equi
vale
nt 24.3
U.S. CA
13.4
WorldAverageWorldAverage
Climate Analysis indicators Tool (CAIT US Version 1.0, CAIT version 4.0), World Resources Institute, 2007 (data is for 2001-2002 and includes CO2, CH4, N2O, HFCs, PFCs, and SF6 emissions for countries and CO2, CH4, N2O, and F-gases for CA)
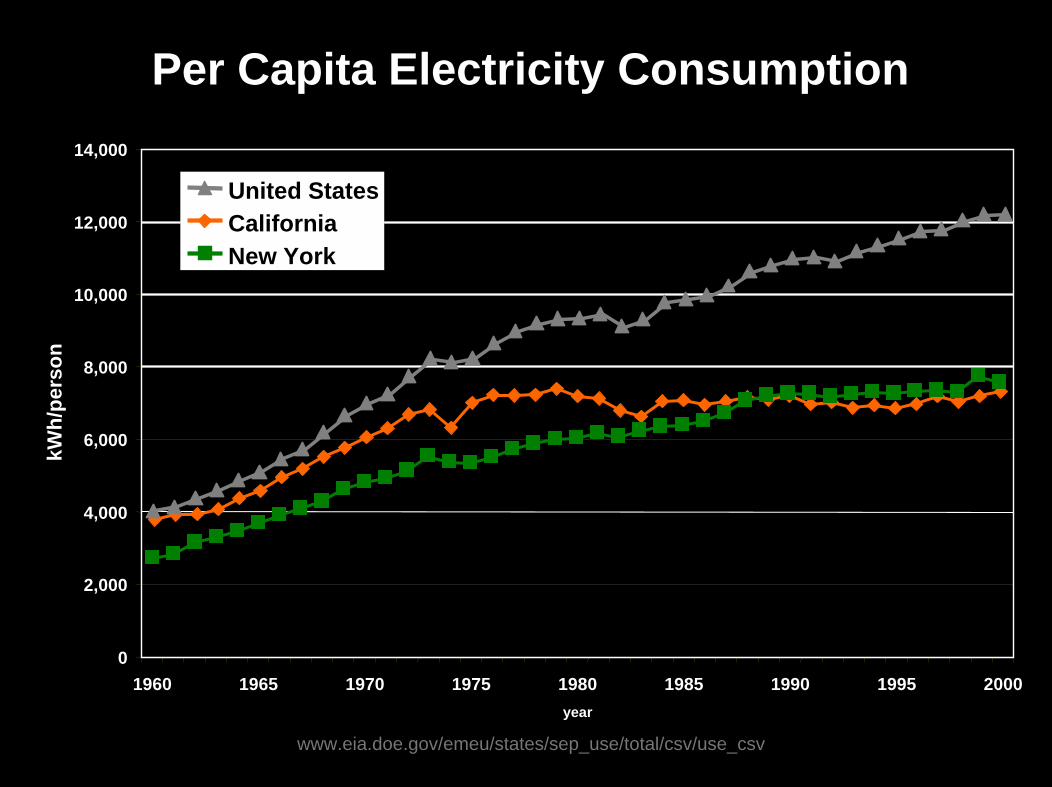
Per Capita Electricity Consumption
0
2,000
4,000
6,000
8,000
10,000
12,000
14,000
1960 1965 1970 1975 1980 1985 1990 1995 2000year
kWh/
pers
on
United StatesCaliforniaNew York
www.eia.doe.gov/emeu/states/sep_use/total/csv/use_csv
SummaryPublic health is the most important policy consideration –
especially premature deaths due to PM2.5
California already affected by climate change – future warming threatens water supply and agriculture
Climate change makes ozone standards more difficult to attain – impact on PM2.5 and PM10 is unclear
Greenhouse gas reduction policies– Adopted: light-duty vehicle standards, energy efficiency measures– Jan. 1, 2010: low carbon fuel standard, other early actions– Jan. 1, 2012: cap and trade market, other regulations