Embed Size (px)
Citation preview
California’s Gold: Ensuring a profitable and
sustainable sea urchin fishery
Sarah Teck
14 April 2011
CINMS J. Maassen
Santa BarbaraSan Miguel
Santa Rosa
Anacapa
Santa Cruz
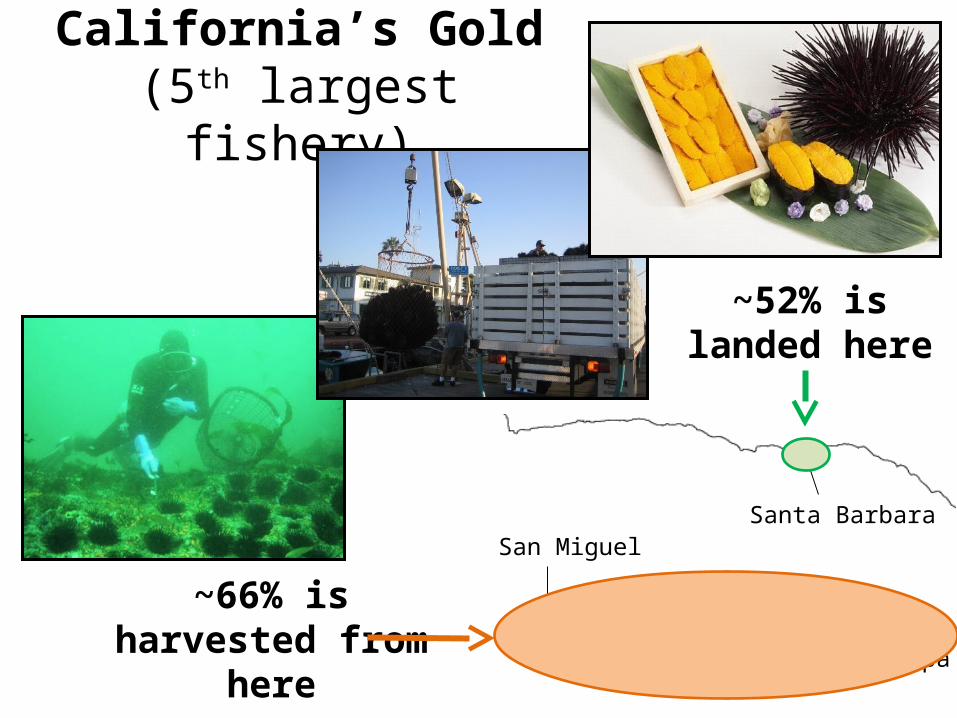
California’s Gold(5th largest fishery)
~66% is harvested from here
incabrain.com
~52% is landed here
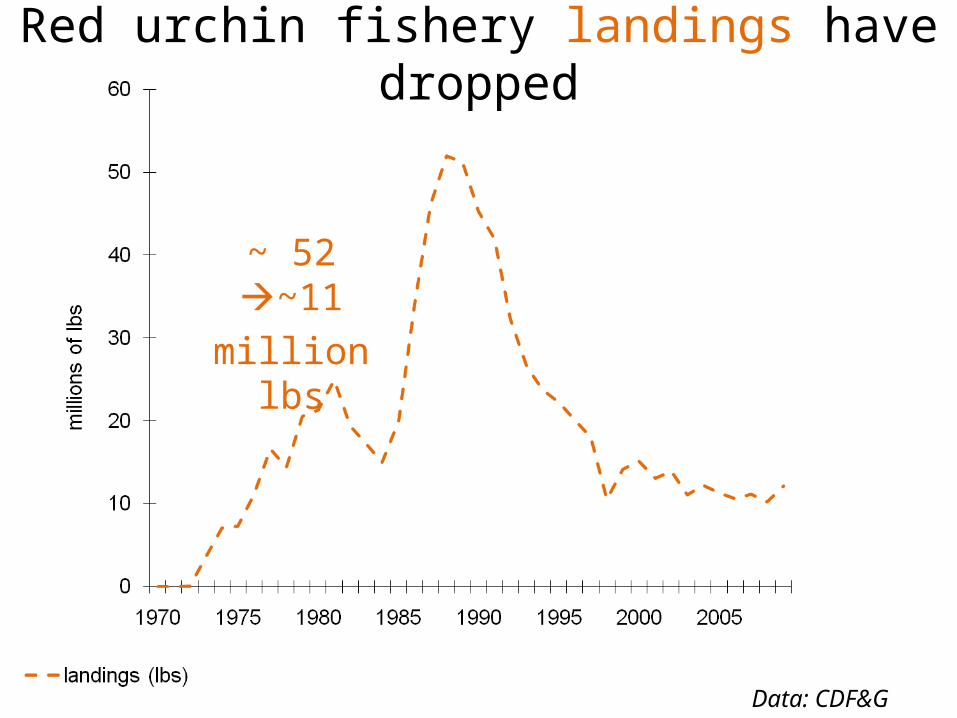
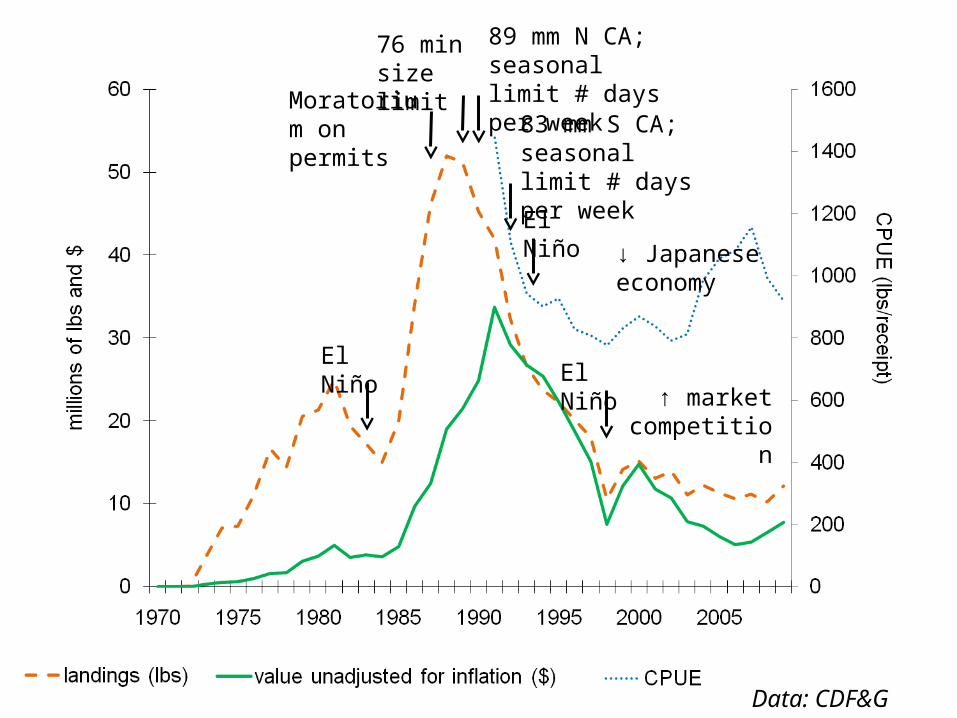
Red urchin fishery landings have dropped
Data: CDF&G
~ 52 ~11
million lbs
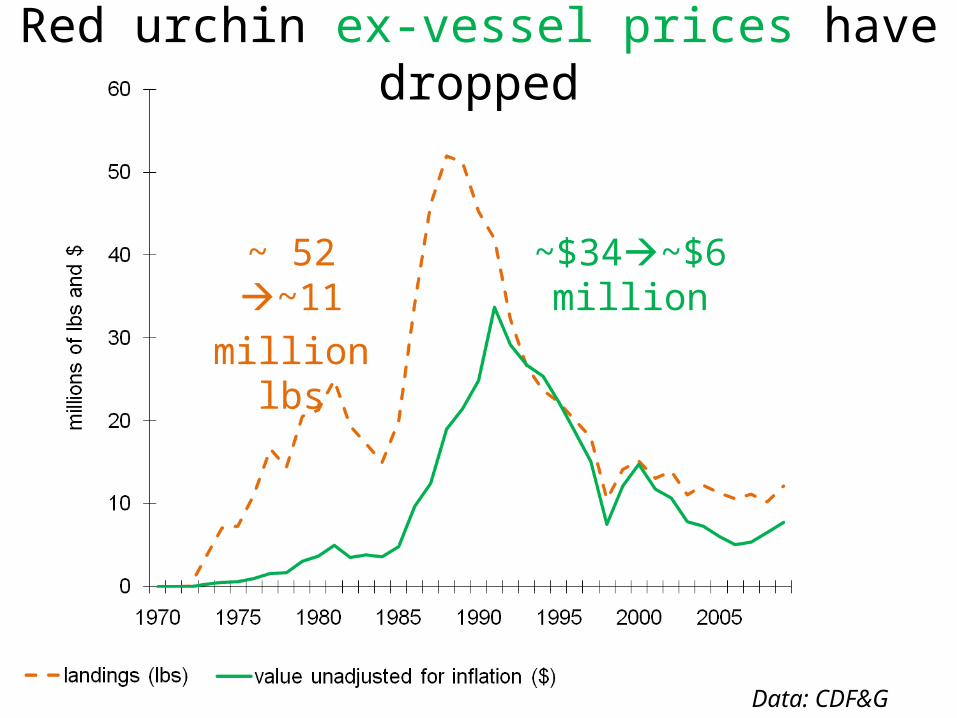
Red urchin ex-vessel prices have dropped
~$34~$6 million
~ 52 ~11
million lbs
Data: CDF&G
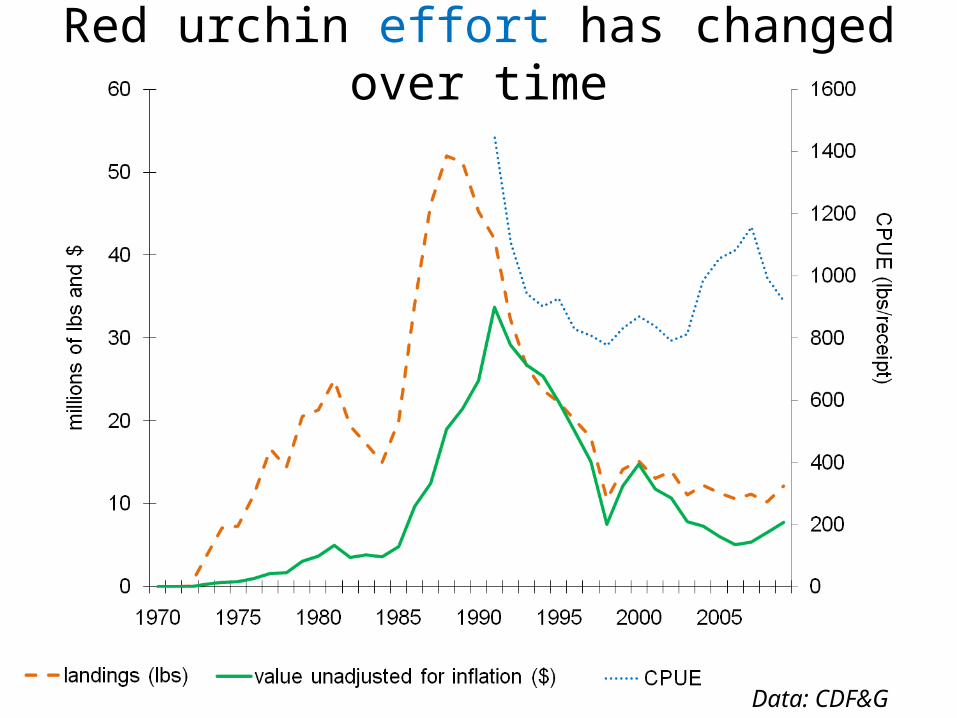
Red urchin effort has changed over time
Data: CDF&G
Data: CDF&G
83 mm S CA; seasonal limit # days per week
76 min size limit
Moratorium on permits
89 mm N CA; seasonal limit # days per week
El NiñoEl Niño
El Niño
↓ Japanese economy
↑ market competition
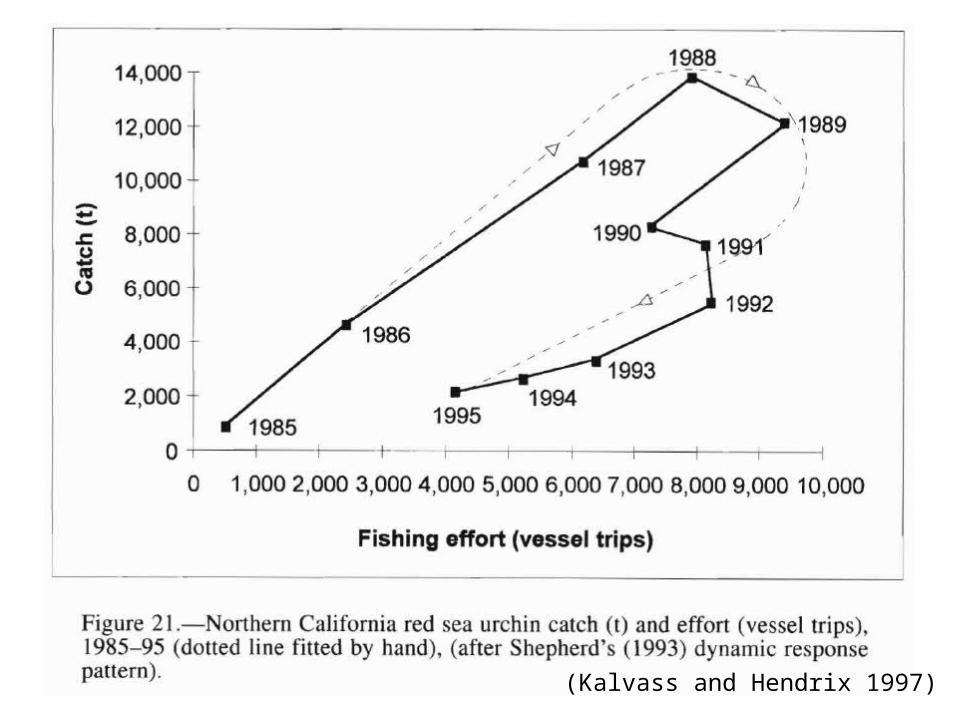
(Kalvass and Hendrix 1997)
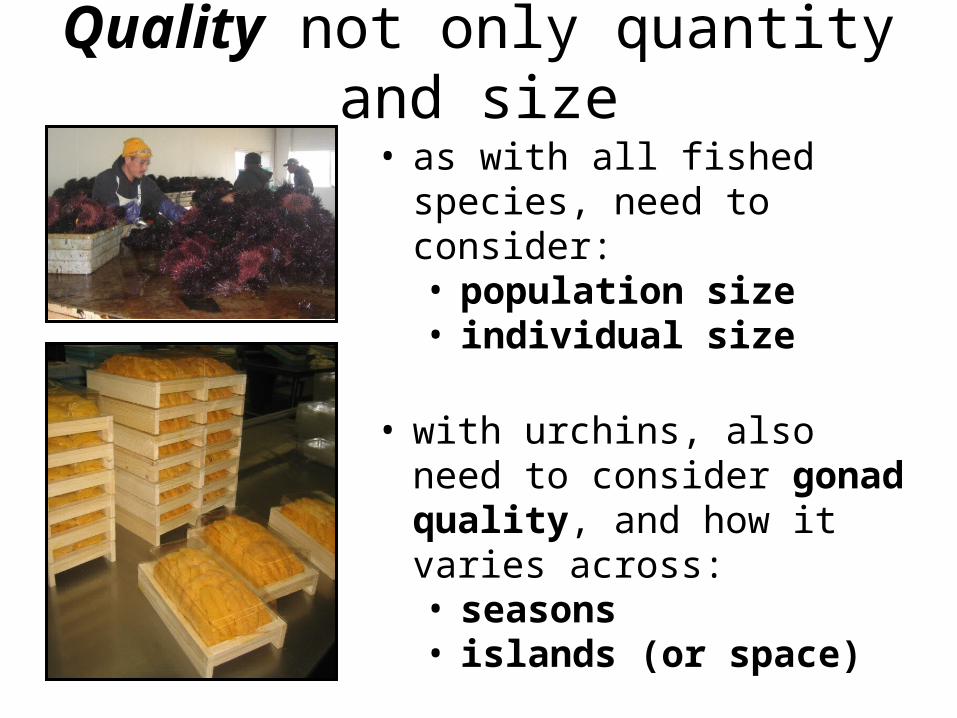
Quality not only quantity and size
• as with all fished species, need to consider:• population size• individual size
• with urchins, also need to consider gonad quality, and how it varies across:• seasons• islands (or space)
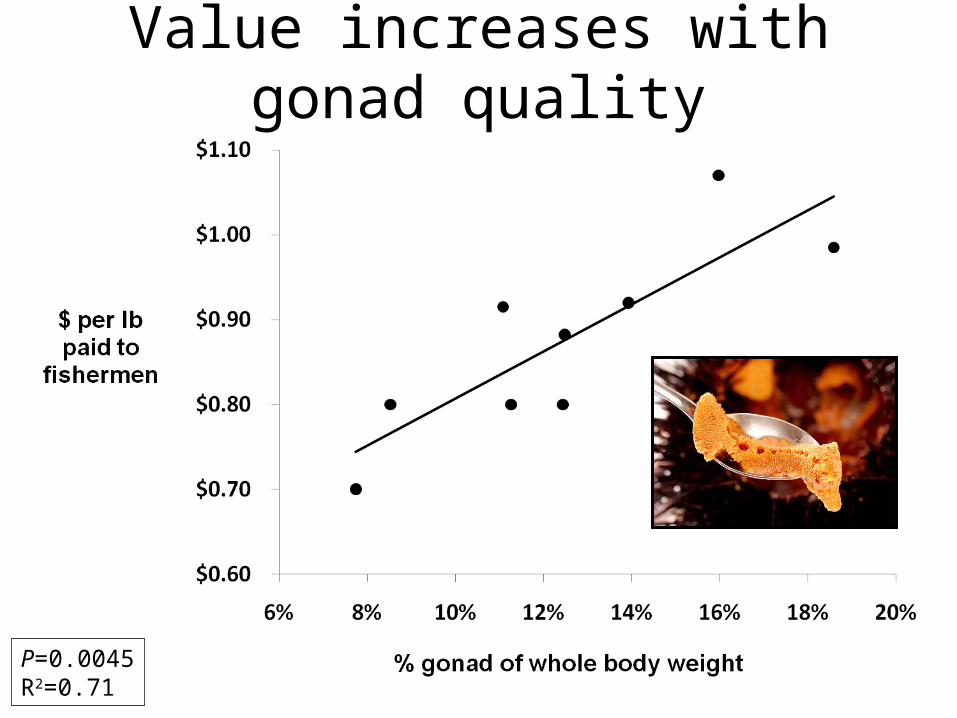
P=0.0045R2=0.71
Value increases with gonad quality
% gonad of whole body weight
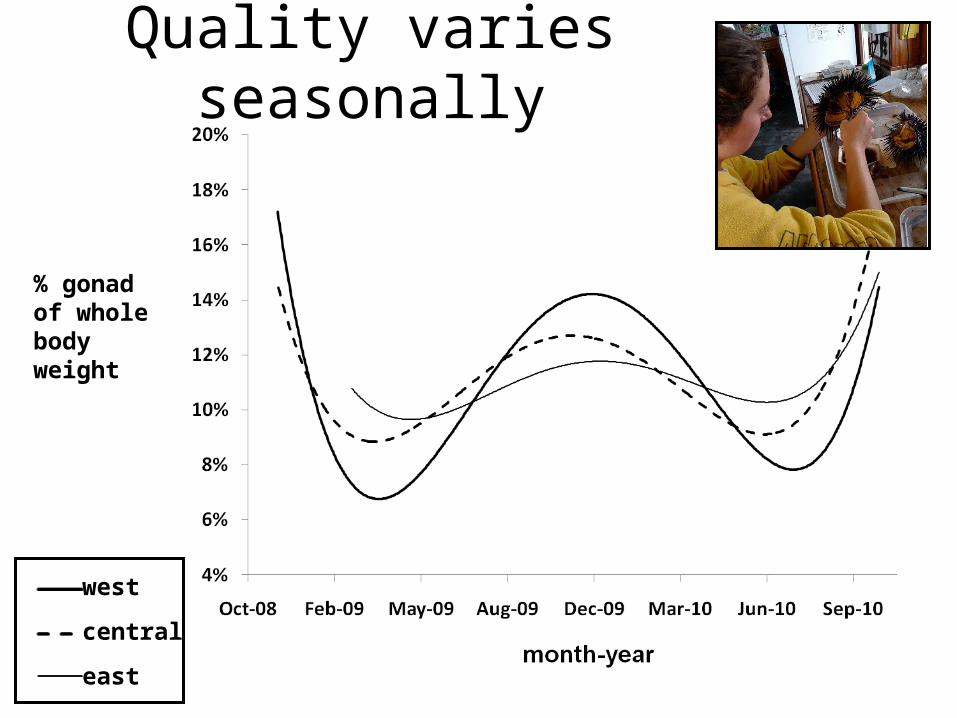
Quality varies seasonally
west
central
east
% gonad of whole body weight
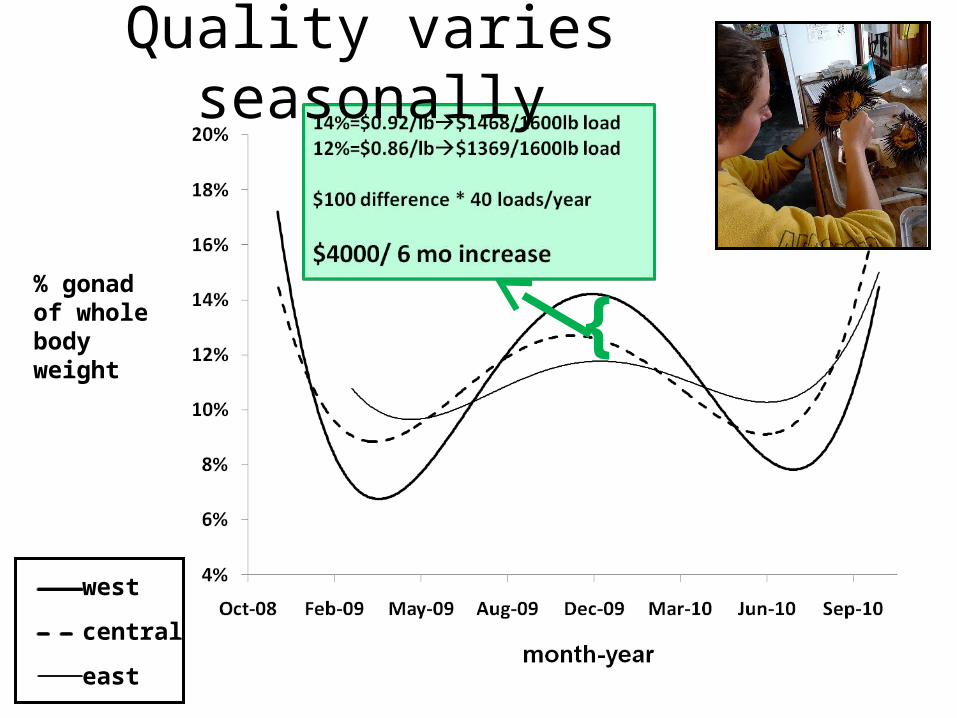
Quality varies seasonally
west
central
east
{
% gonad of whole body weight
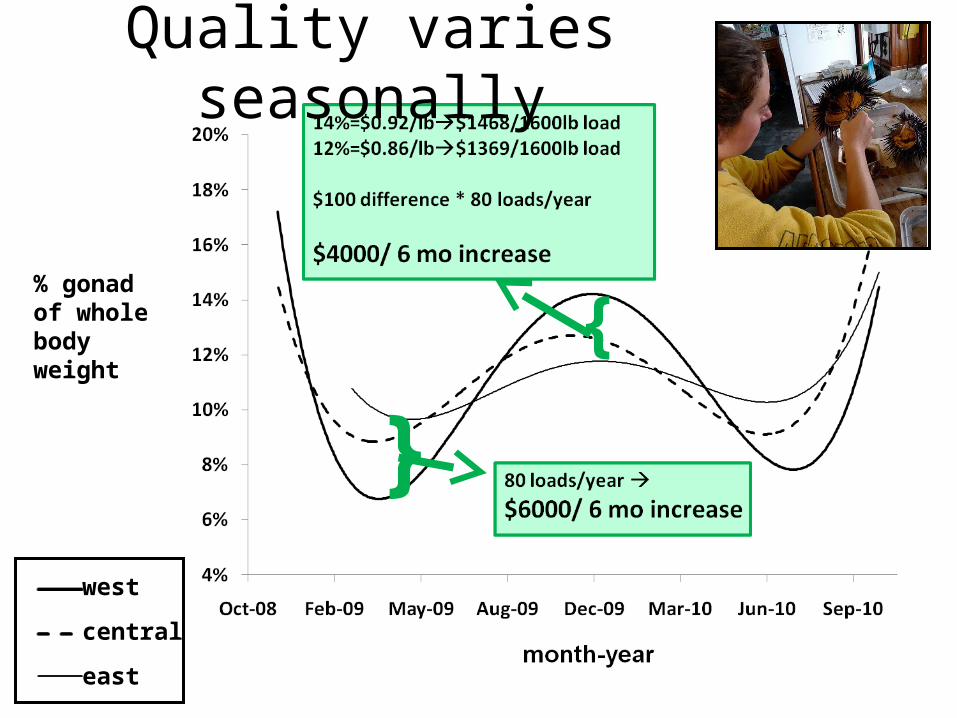
Quality varies seasonally
west
central
east
{
}
% gonad of whole body weight
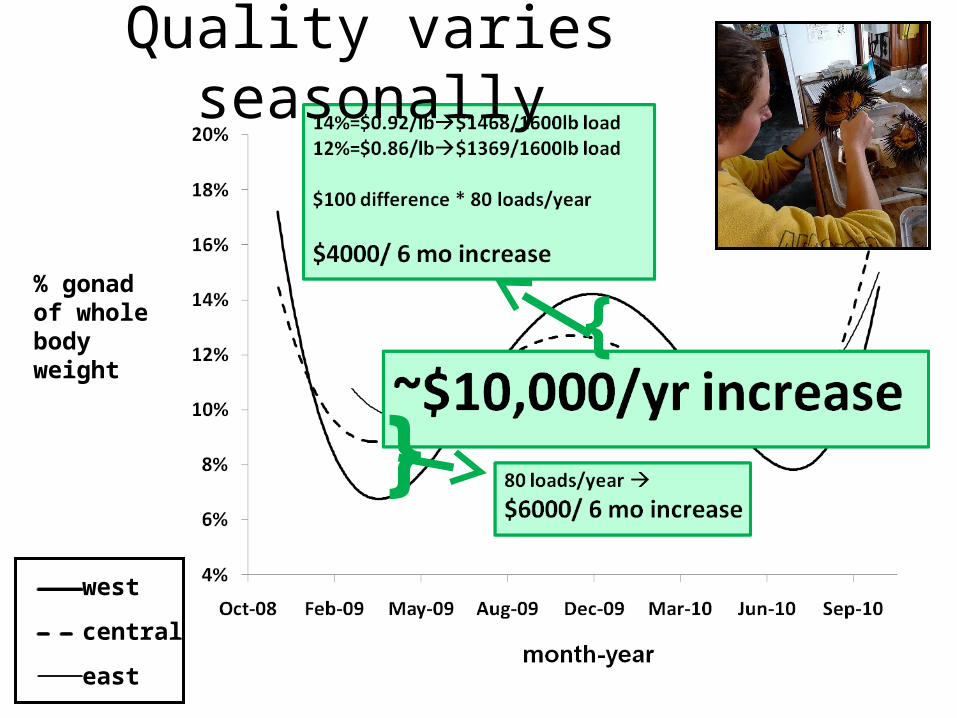
Quality varies seasonally
west
central
east
{
}
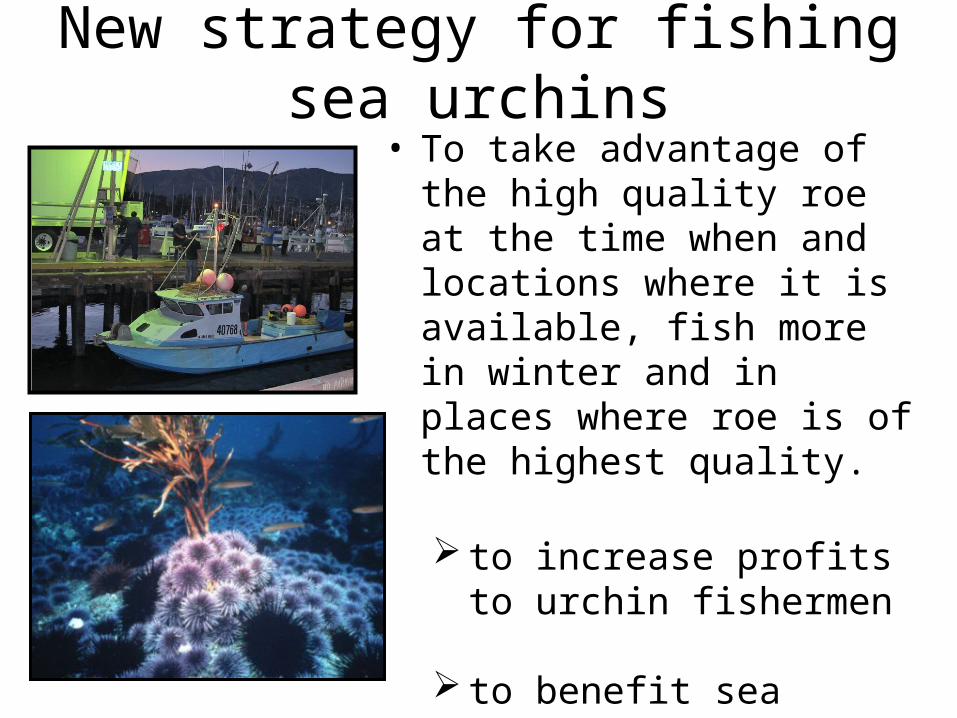
New strategy for fishing sea urchins• To take advantage of the high
quality roe at the time when and locations where it is available, fish more in winter and in places where roe is of the highest quality.
to increase profits to urchin fishermen
to benefit sea urchin populations
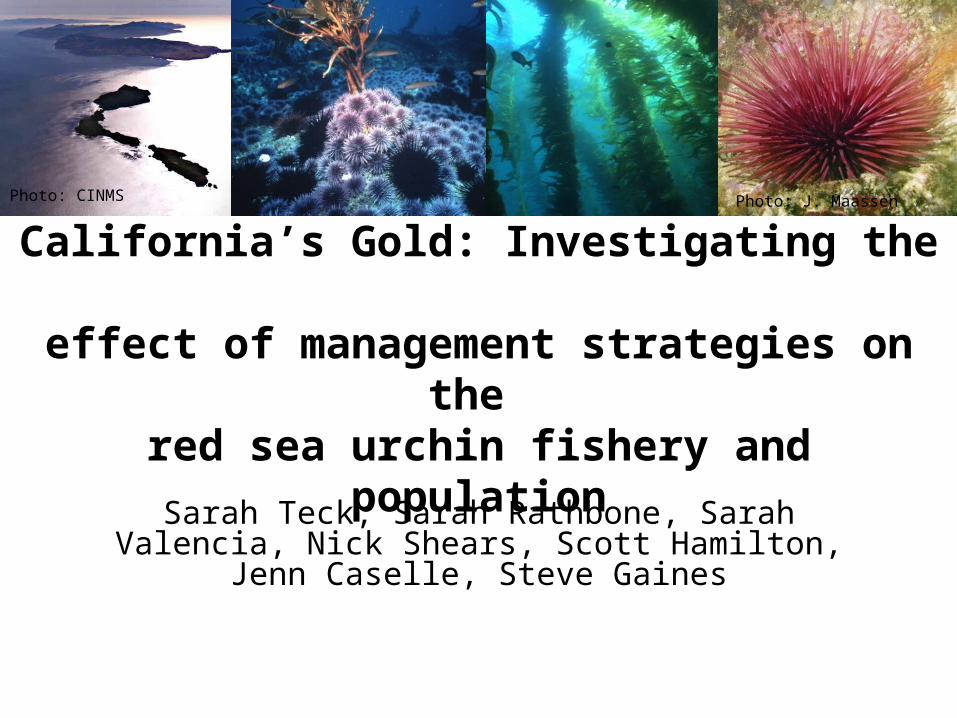
California’s Gold: Investigating the effect of management strategies on the red sea urchin fishery and population
Sarah Teck, Sarah Rathbone, Sarah Valencia, Nick Shears, Scott Hamilton, Jenn Caselle, Steve Gaines
Photo: CINMS Photo: J. Maassen
Santa BarbaraSan Miguel
Santa Rosa
Anacapa
Santa Cruz
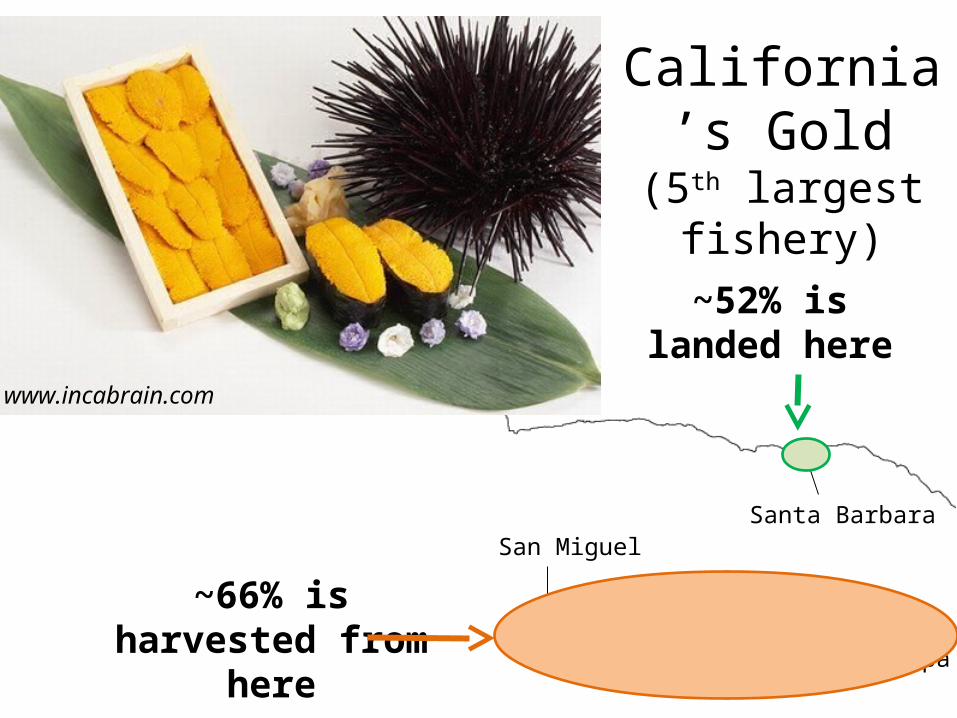
California’s Gold
(5th largest fishery)
~66% is harvested from here
www.incabrain.com
~52% is landed here

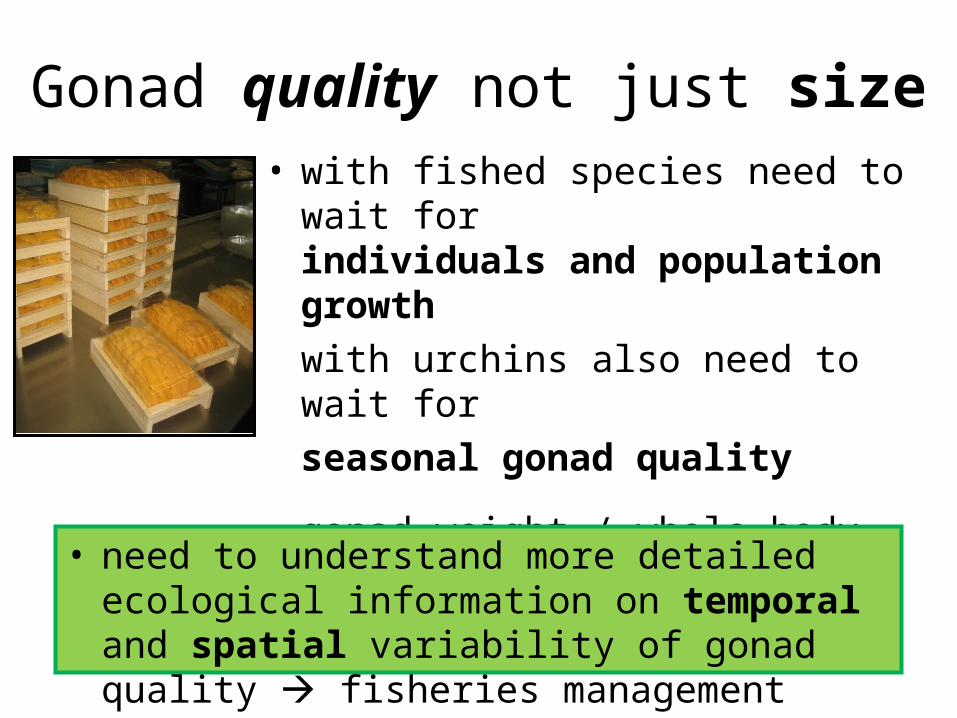
Gonad quality not just size• with fished species need to wait for
individuals and population growth
with urchins also need to wait for
seasonal gonad quality
• gonad weight / whole body weight OR
gonad: somatic index (GSI)
• need to understand more detailed ecological information on temporal and spatial variability of gonad quality fisheries management
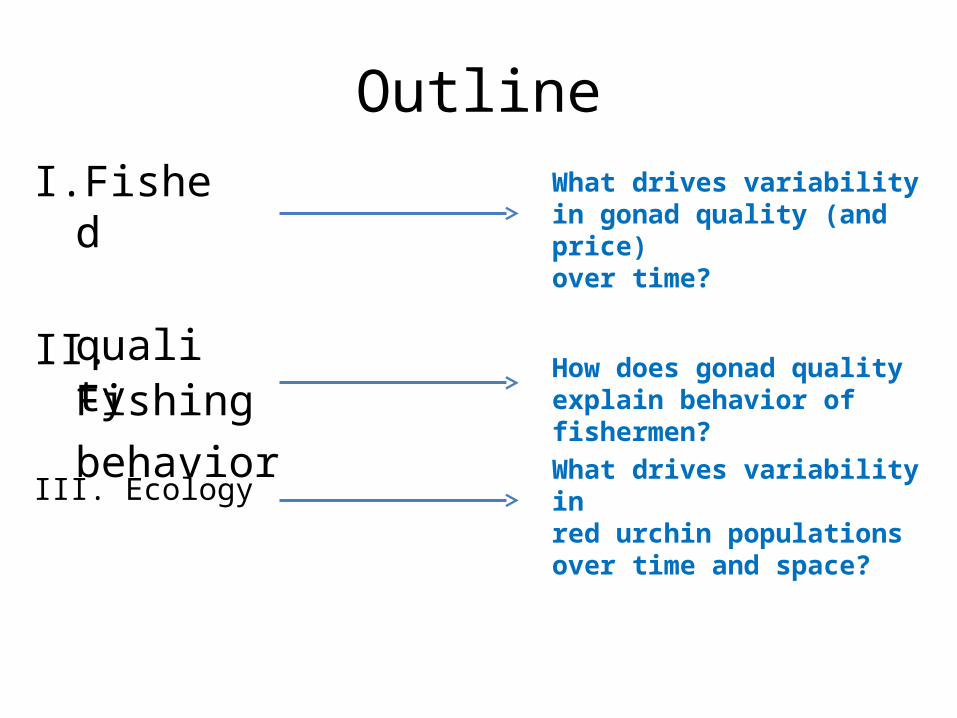
Outline
III. EcologyWhat drives variability in red urchin populations over time and space?
How do urchins and fishery profits respond to various management regimes?
IV. Management
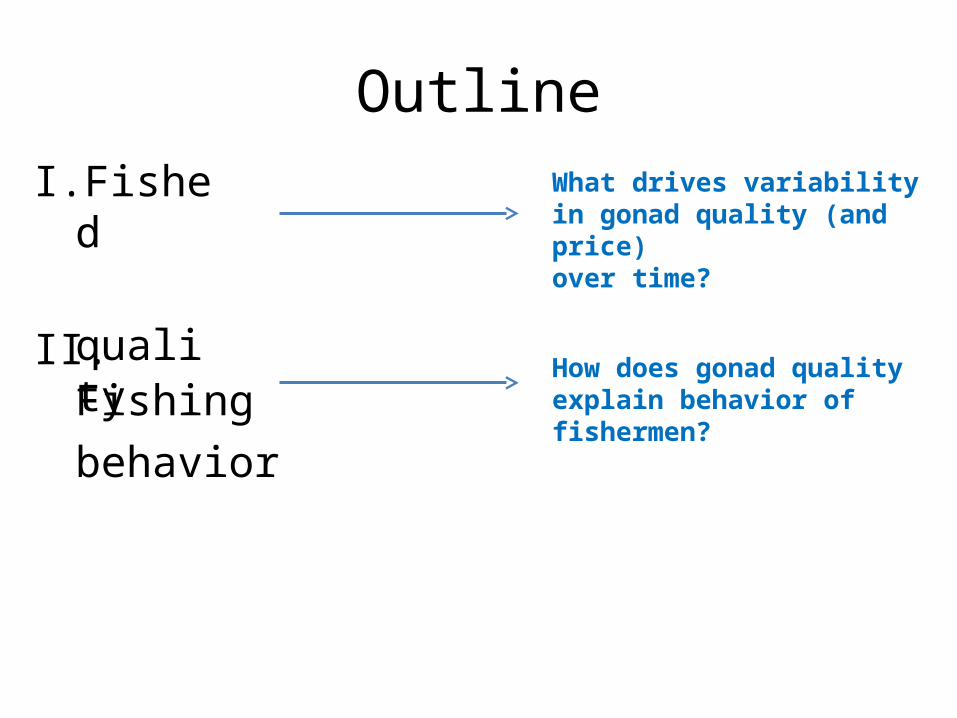
How does gonad quality explain behavior of fishermen?
II. Fishing
behavior
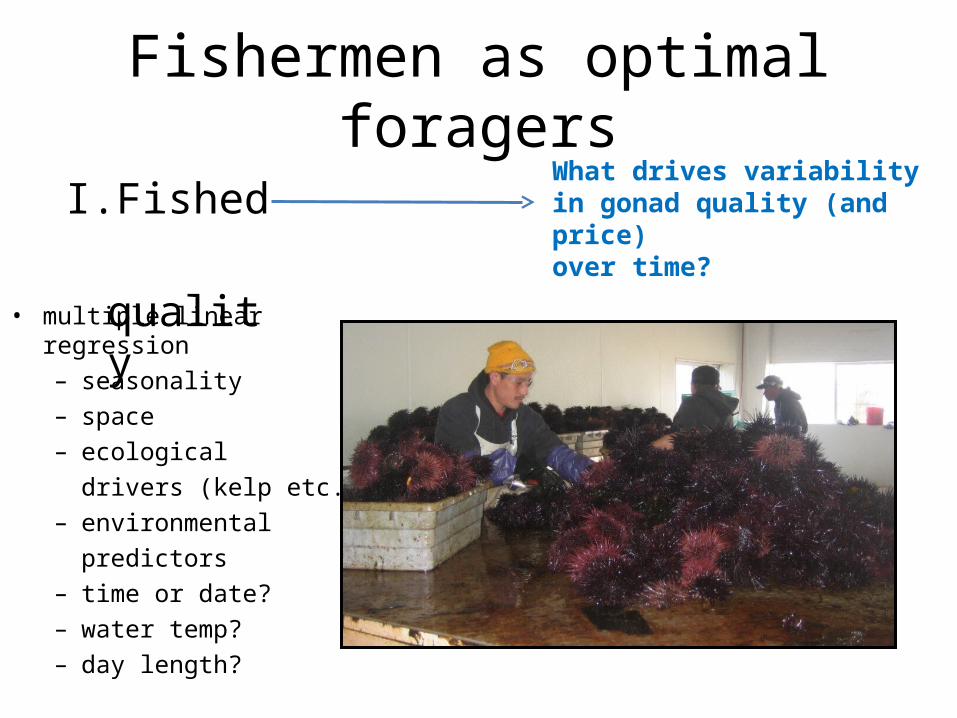
What drives variability in gonad quality (and price) over time?
I. Fished
quality
What drives variability in gonad quality (and price) over time?
I. Fished
quality
Fishermen as optimal foragers
• multiple linear regression– seasonality– space– ecological
drivers (kelp etc.)– environmental
predictors– time or date?– water temp?– day length?
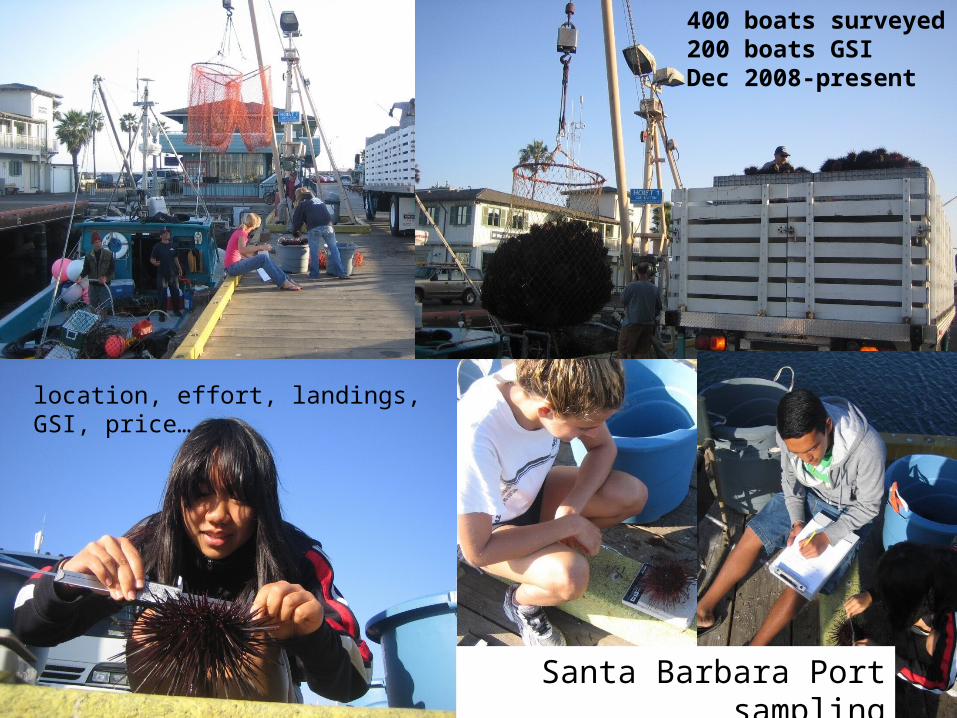
Santa Barbara Port sampling
400 boats surveyed200 boats GSIDec 2008-present
location, effort, landings, GSI, price…

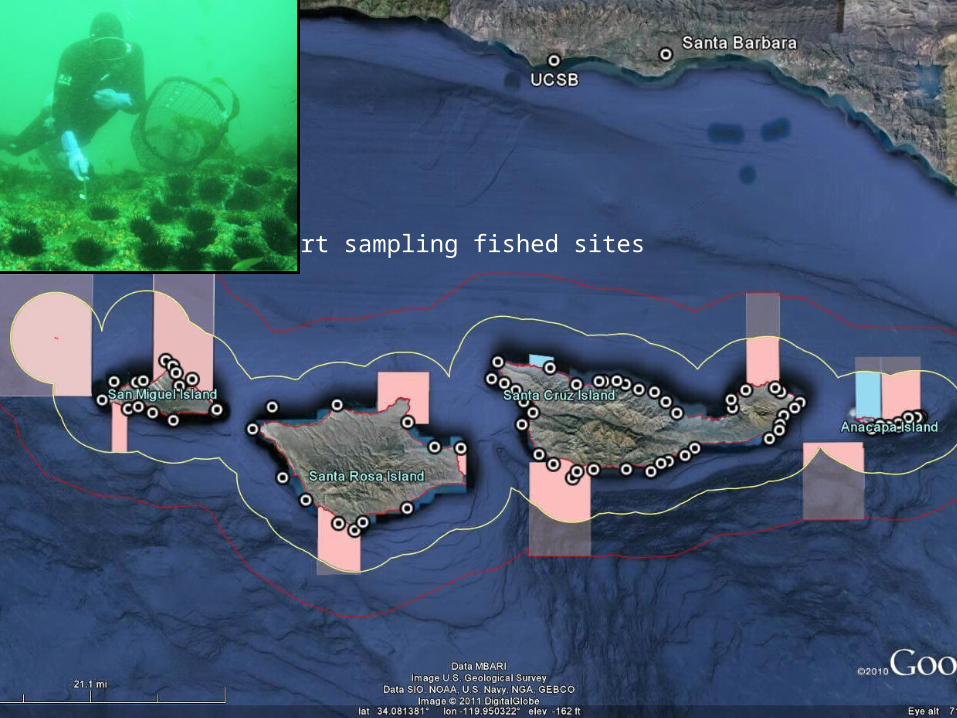
Port sampling fished sites
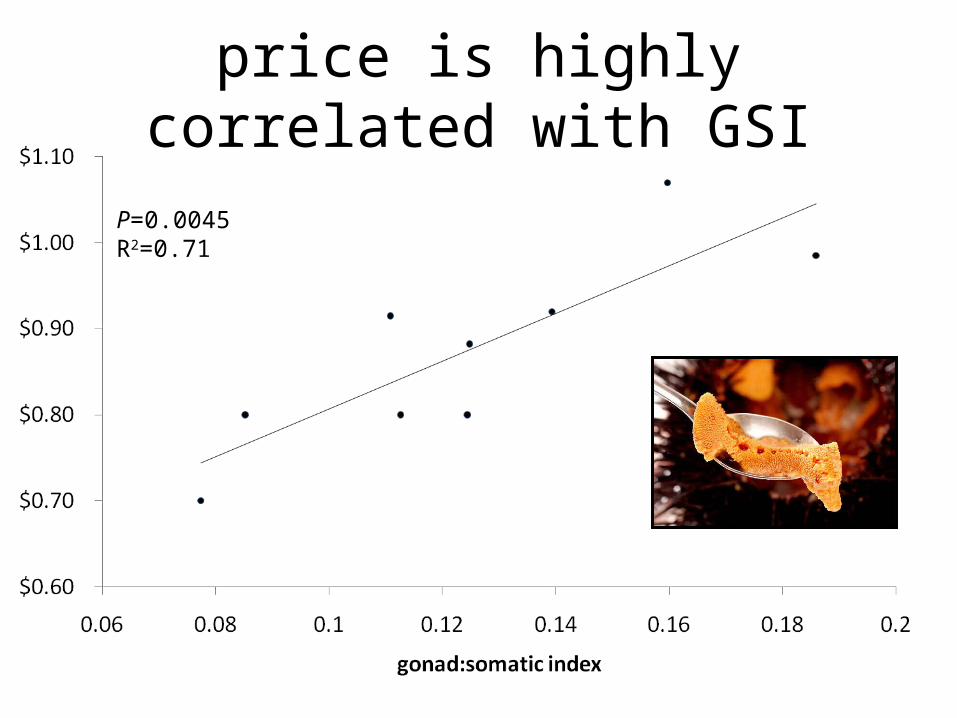
P=0.0045R2=0.71
price is highly correlated with GSI
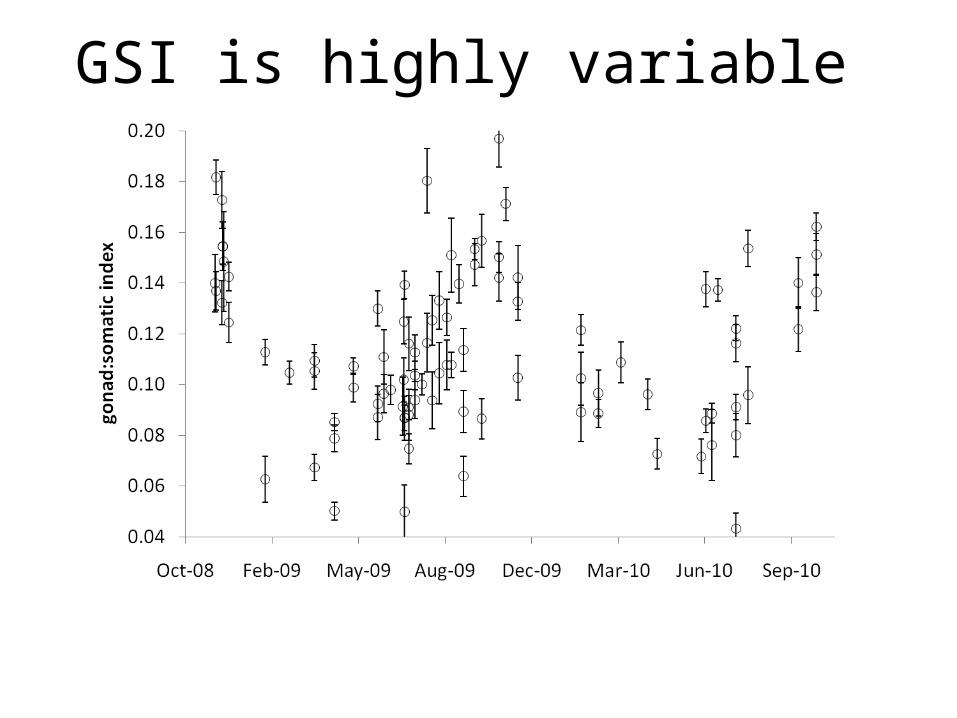
GSI is highly variable
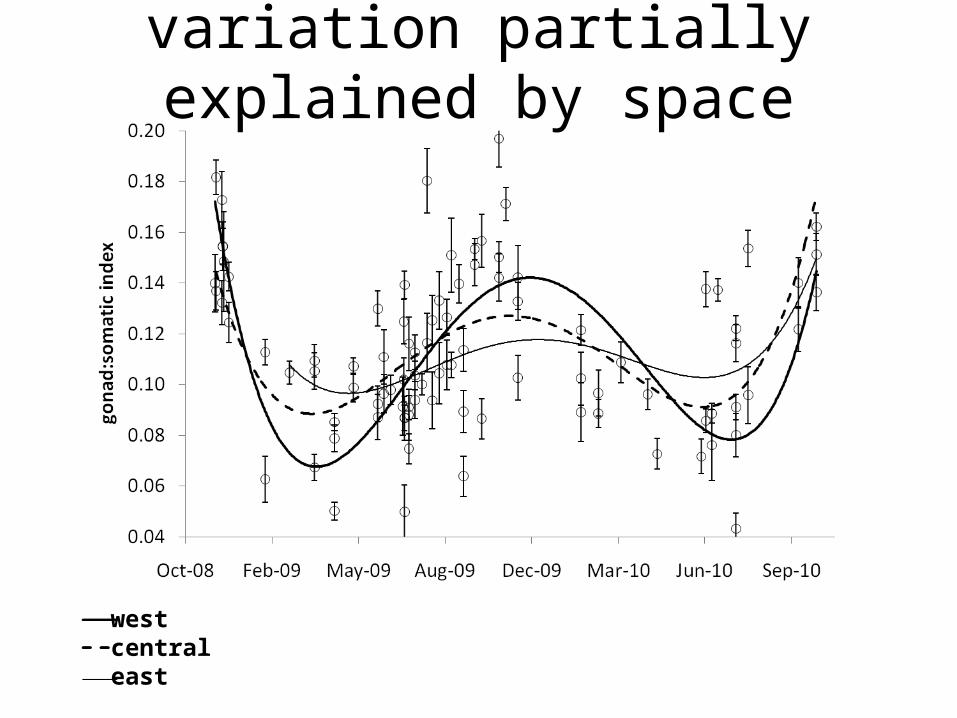
variation partially explained by space
westcentraleast
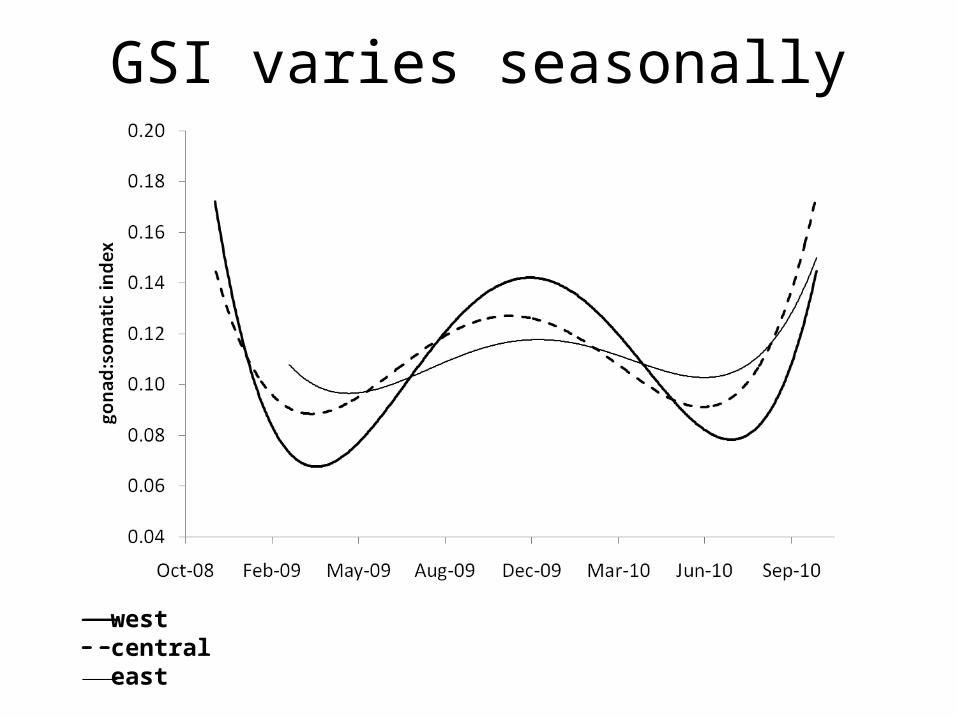
GSI varies seasonally
westcentraleast
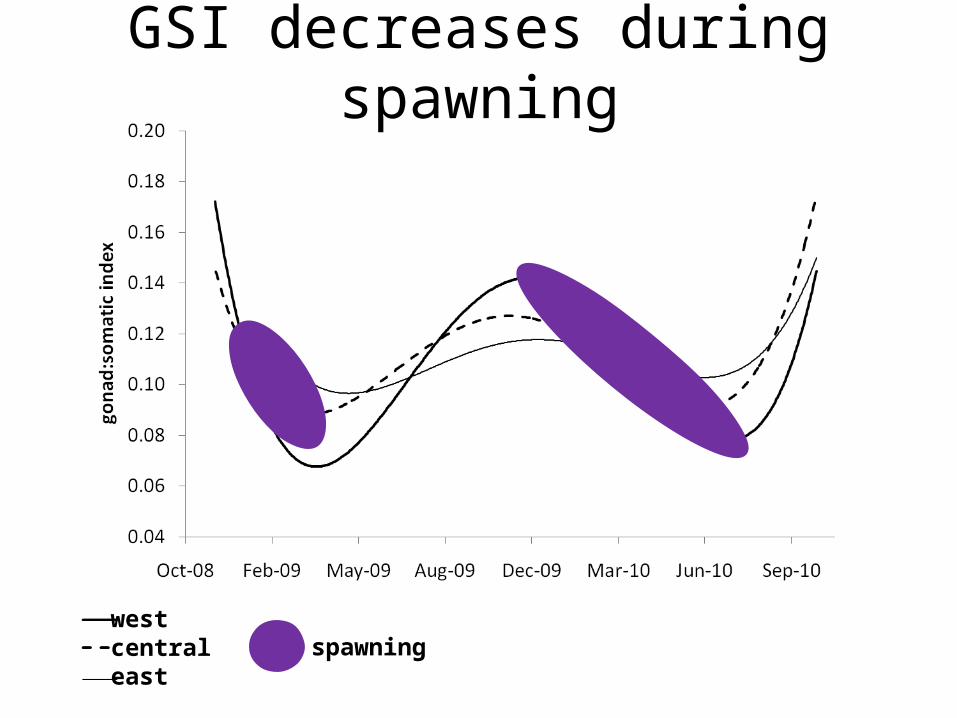
GSI decreases during spawning
westcentraleast
spawning
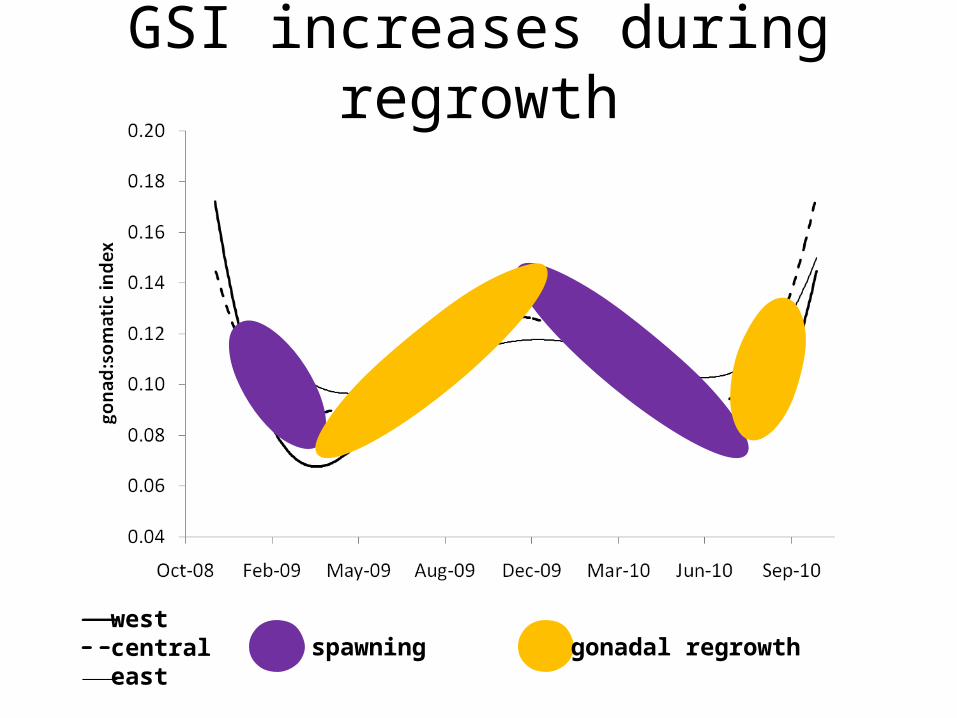
GSI increases during regrowth
westcentraleast
spawning gonadal regrowth
Outline
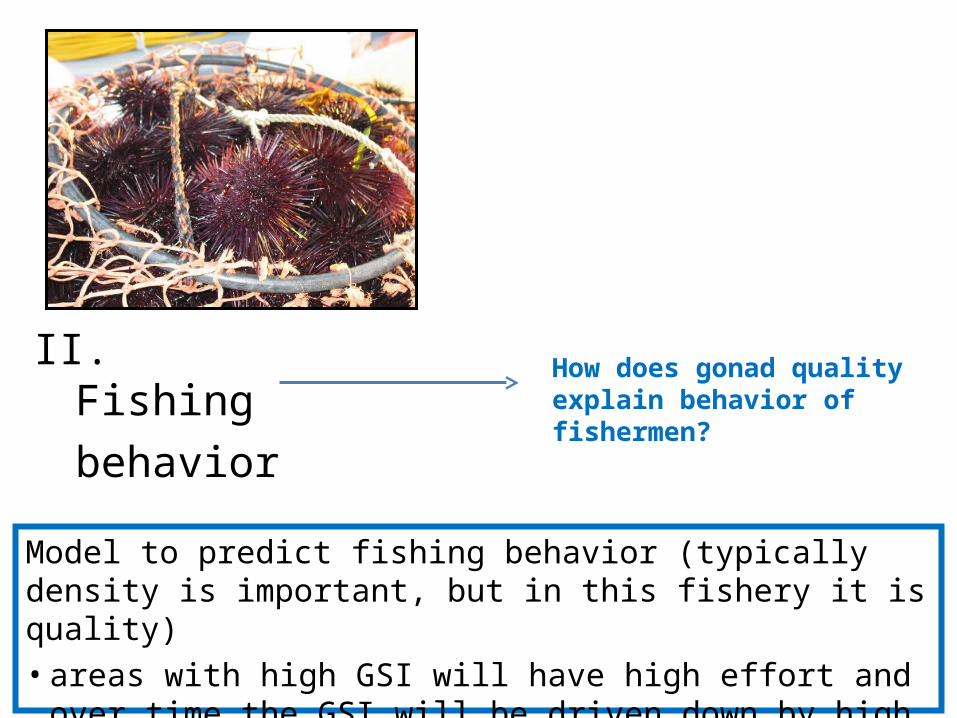
How does gonad quality explain behavior of fishermen?
II. Fishing
behavior
What drives variability in gonad quality (and price) over time?
I. Fished
quality
How does gonad quality explain behavior of fishermen?
II. Fishing
behavior
Model to predict fishing behavior (typically density is important, but in this fishery it is quality)• areas with high GSI will have high effort and over time the GSI
will be driven down by high effort—then fishermen move…
Outline
III. EcologyWhat drives variability in red urchin populations over time and space?
How does gonad quality explain behavior of fishermen?
II. Fishing
behavior
What drives variability in gonad quality (and price) over time?
I. Fished
quality
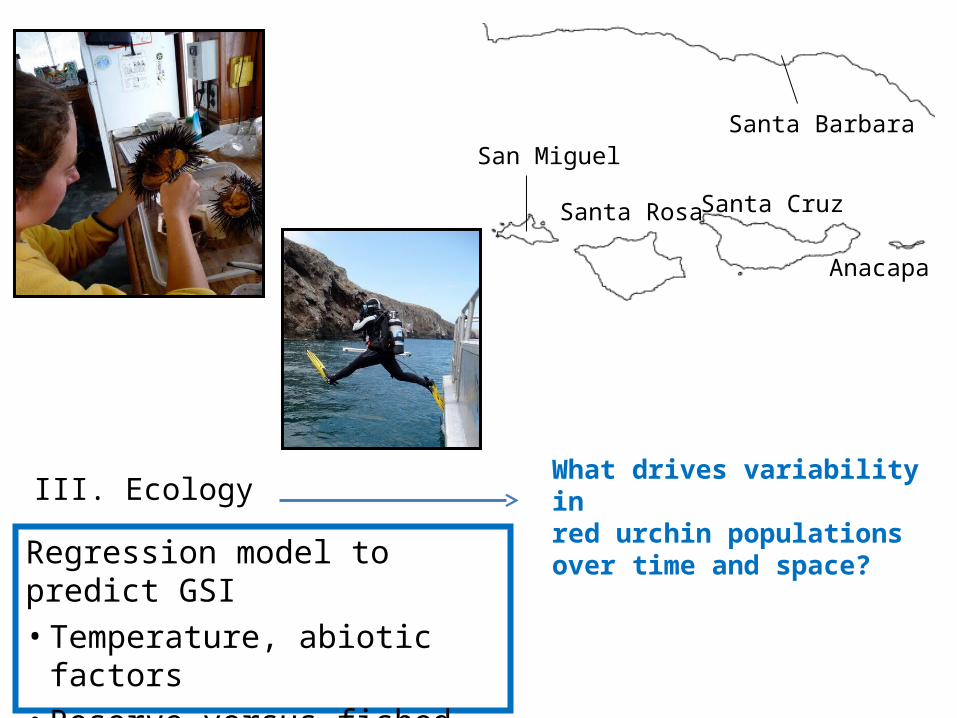
Santa BarbaraSan Miguel
Santa Rosa
Anacapa
Santa Cruz
III. EcologyWhat drives variability in red urchin populations over time and space?
Regression model to predict GSI• Temperature, abiotic factors • Reserve versus fished• Community data
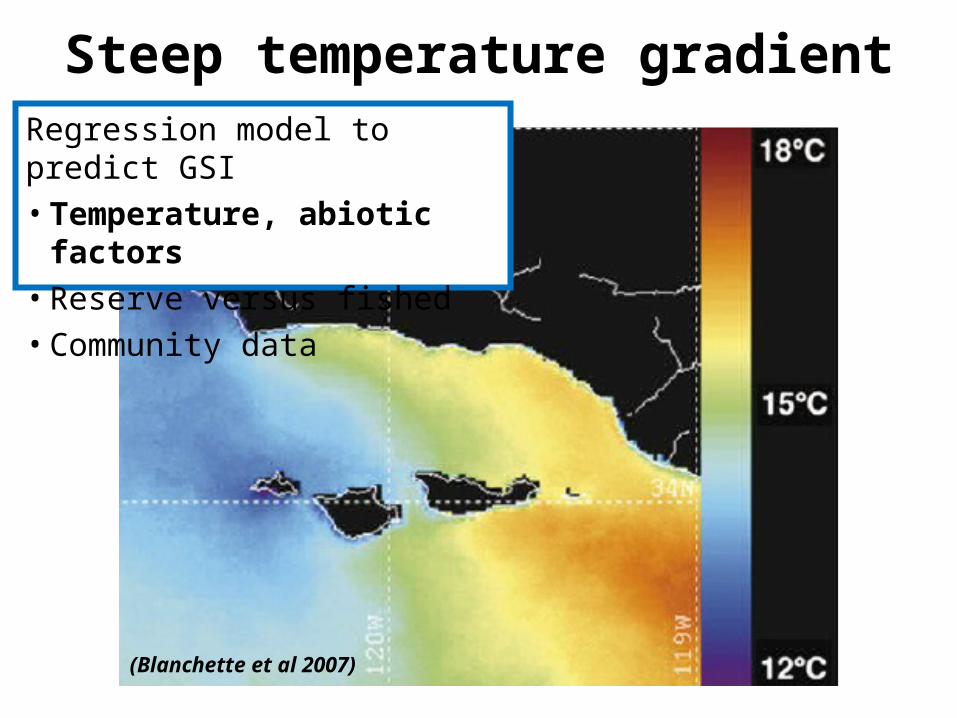
Steep temperature gradient
(Blanchette et al 2007)
Regression model to predict GSI• Temperature, abiotic factors • Reserve versus fished• Community data
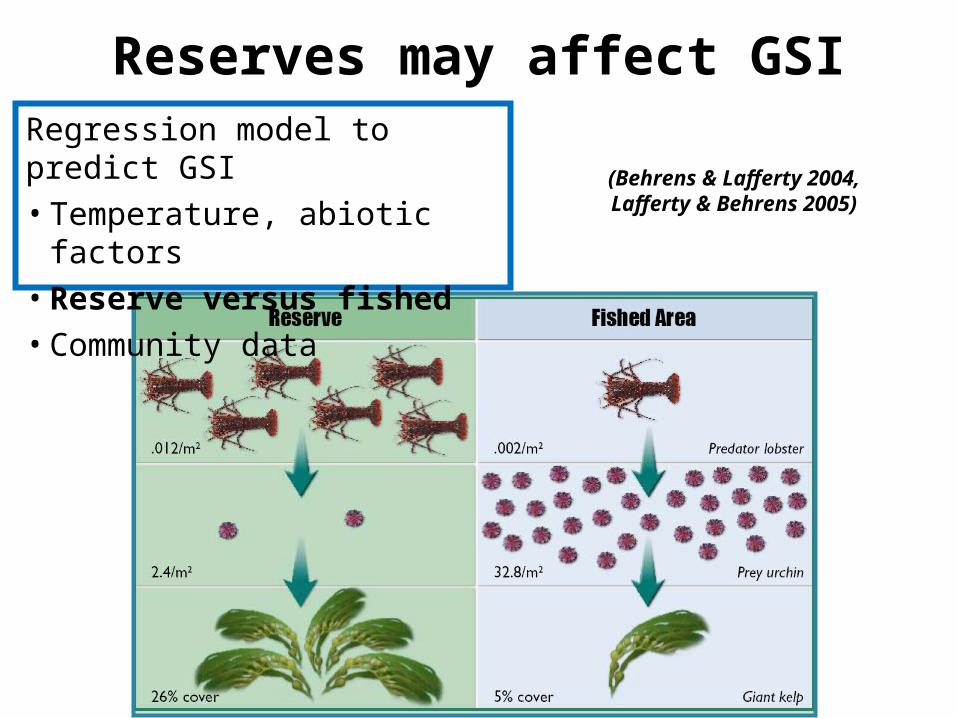
(Behrens & Lafferty 2004, Lafferty & Behrens 2005)
Regression model to predict GSI• Temperature, abiotic factors • Reserve versus fished• Community data
Reserves may affect GSI
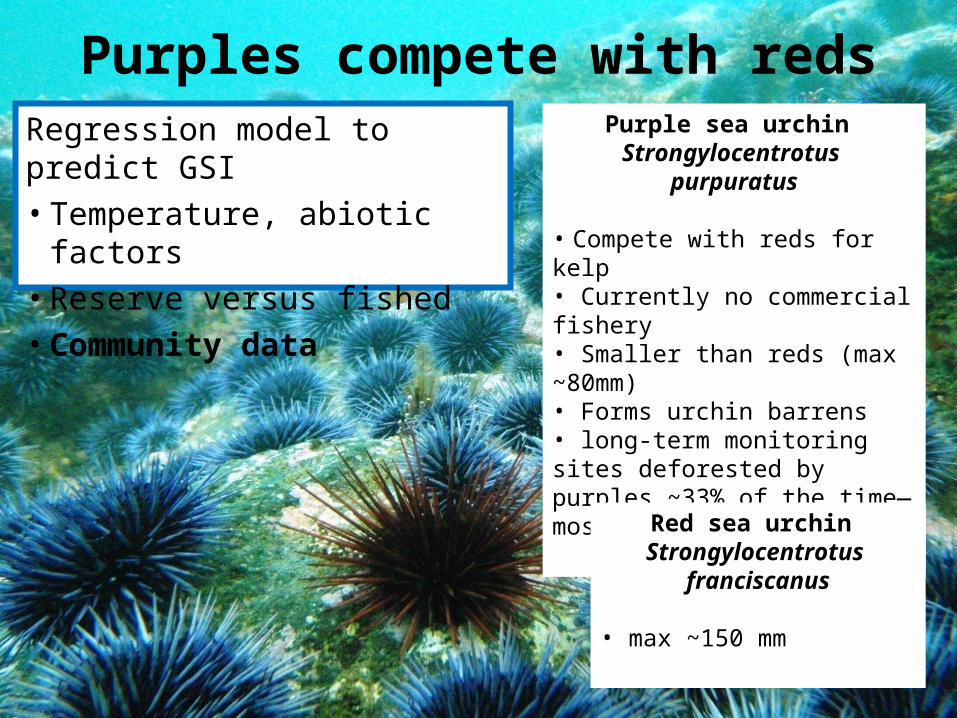
Purple sea urchin Strongylocentrotus
purpuratus
• Compete with reds for kelp• Currently no commercial fishery• Smaller than reds (max ~80mm) • Forms urchin barrens• long-term monitoring sites deforested by purples ~33% of the time—mostly in the east
Red sea urchin Strongylocentrotus
franciscanus
• max ~150 mm
Regression model to predict GSI• Temperature, abiotic factors • Reserve versus fished• Community data
Purples compete with reds
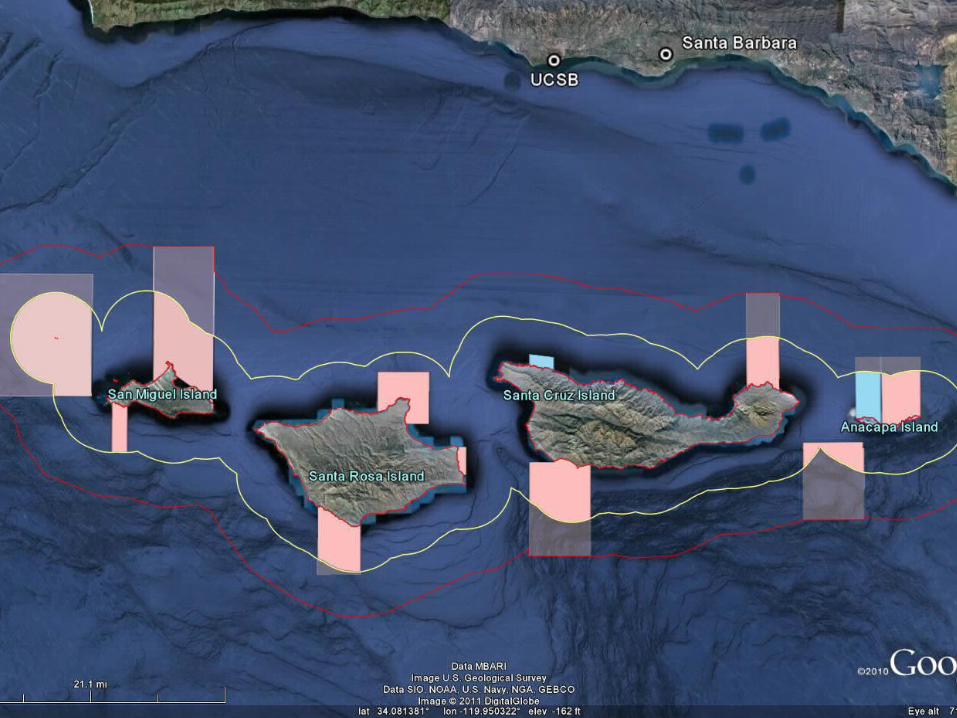
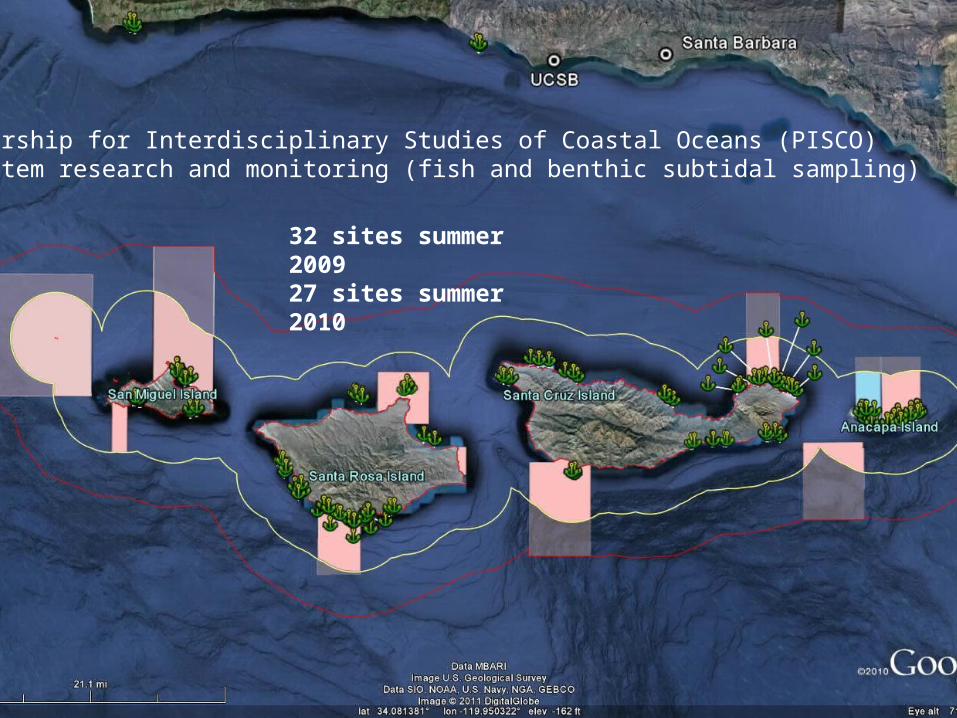
Partnership for Interdisciplinary Studies of Coastal Oceans (PISCO) ecosystem research and monitoring (fish and benthic subtidal sampling)
32 sites summer 200927 sites summer 2010
Santa BarbaraSan Miguel
Santa Rosa
Anacapa
Santa Cruz
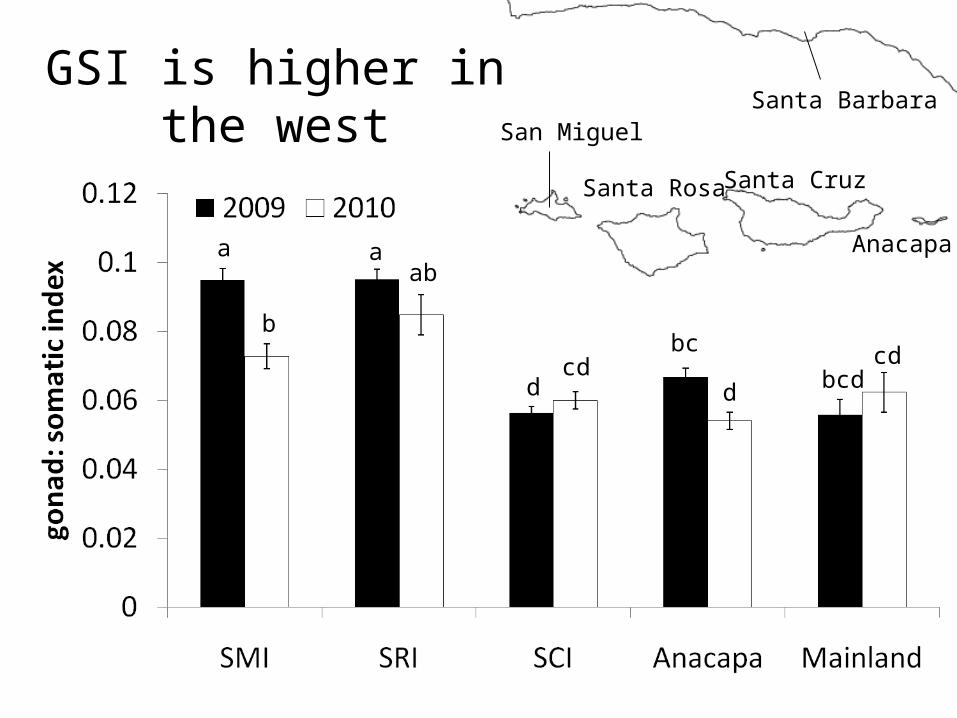
GSI is higher in the west
a aab
bbc cdcd
d d bcd
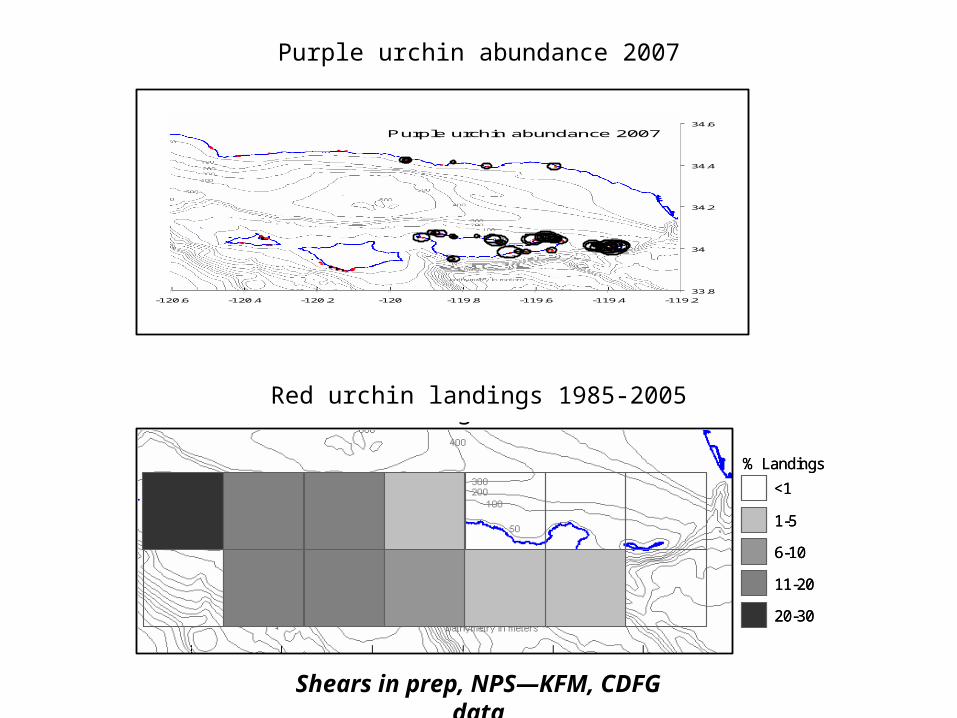
Red urchin landings 1985-2005
Purple urchin abundance 2007
a)
b)
Figure 4. (a) Spatial distribution of red urchin landings from 1985 to 2005 in the CINMS (landings are assigned to 10 x 10 nautical mile blocks as reported to CA Dept. of Fish and Game), and (b) spatial variation in purple urchin abundance (the larger the circle the greater the density; Data: PISCO/SBC-LTER)
<1
1-5
6-10
11-20
20-30
% Landings
<1
1-5
6-10
11-20
20-30
% Landings
Red urchin landings 1985-2005
Purple urchin abundance 2007
33.8
34
34.2
34.4
34.6
-120.6 -120.4 -120.2 -120 -119.8 -119.6 -119.4 -119.2
33.8
34
34.2
34.4
34.6
-120.6 -120.4 -120.2 -120 -119.8 -119.6 -119.4 -119.2
Red urchin landings 1985-2005
Purple urchin abundance 2007
a)
b)
Figure 4. (a) Spatial distribution of red urchin landings from 1985 to 2005 in the CINMS (landings are assigned to 10 x 10 nautical mile blocks as reported to CA Dept. of Fish and Game), and (b) spatial variation in purple urchin abundance (the larger the circle the greater the density; Data: PISCO/SBC-LTER)
<1
1-5
6-10
11-20
20-30
% Landings
<1
1-5
6-10
11-20
20-30
% Landings
Purple urchin abundance 2007
Shears in prep, NPS—KFM, CDFG data
0
2
4
6
8
10
12
14D
en
sity
(m-2
)Reserve (n=2)
Fished (n=5)
0
10
20
30
40
50
60
70
80
De
nsi
ty (
m-2)
Reserve (n=2)
Fished (n=5)
0
1
2
3
4
5
6
7
8
De
nsi
ty (
m-2)
Reserve (n=2)
Fished (n=5)
Kelp
Purple urchins
Red urchins
0
500
1000
1500
2000
2500
De
nsi
ty (
m-2
)
Reserve (n=2)
Fished (n=5)
Red urchin biomass
Bio
ma
ss (
g m
-2)
kelp
purple urchins
red urchins
0
500
1000
1500
2000
2500
Reserve (n=2)
Fished (n=5)
Red urchin biomass
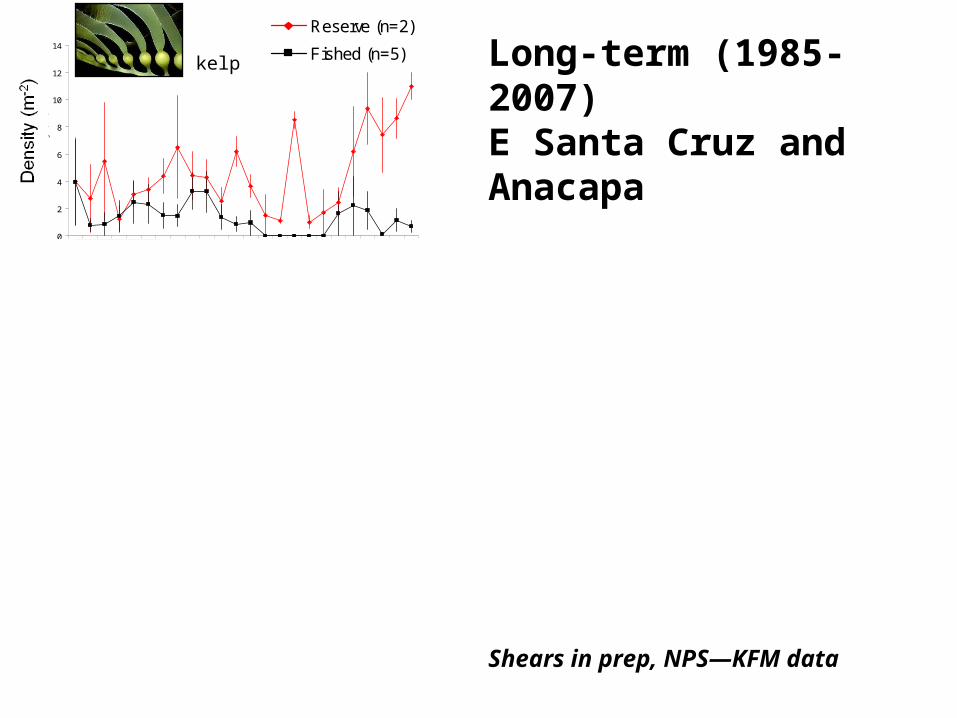
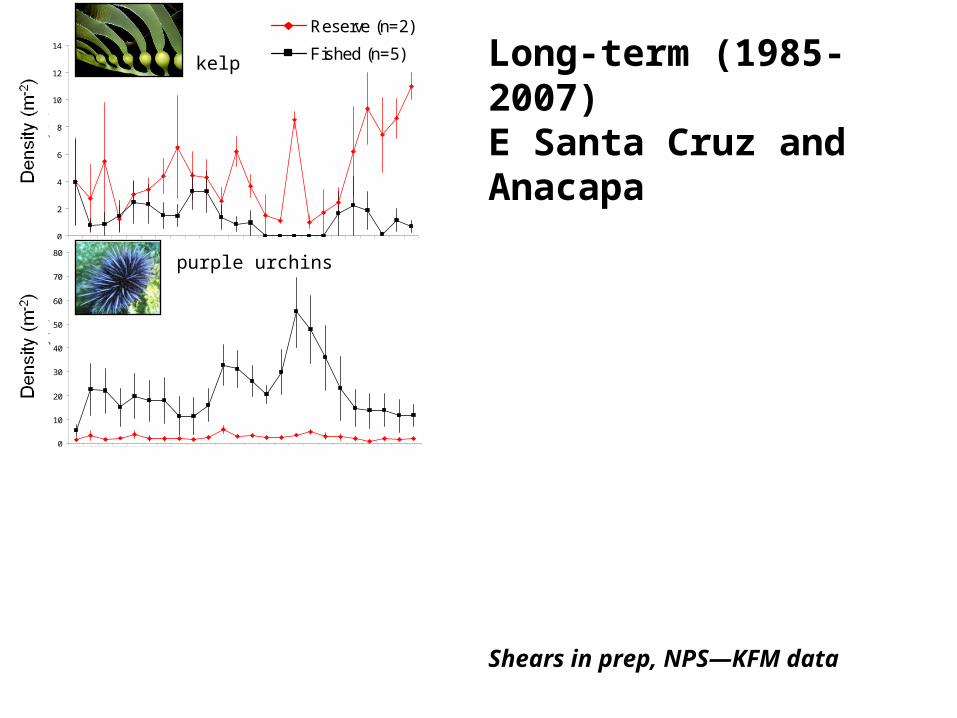
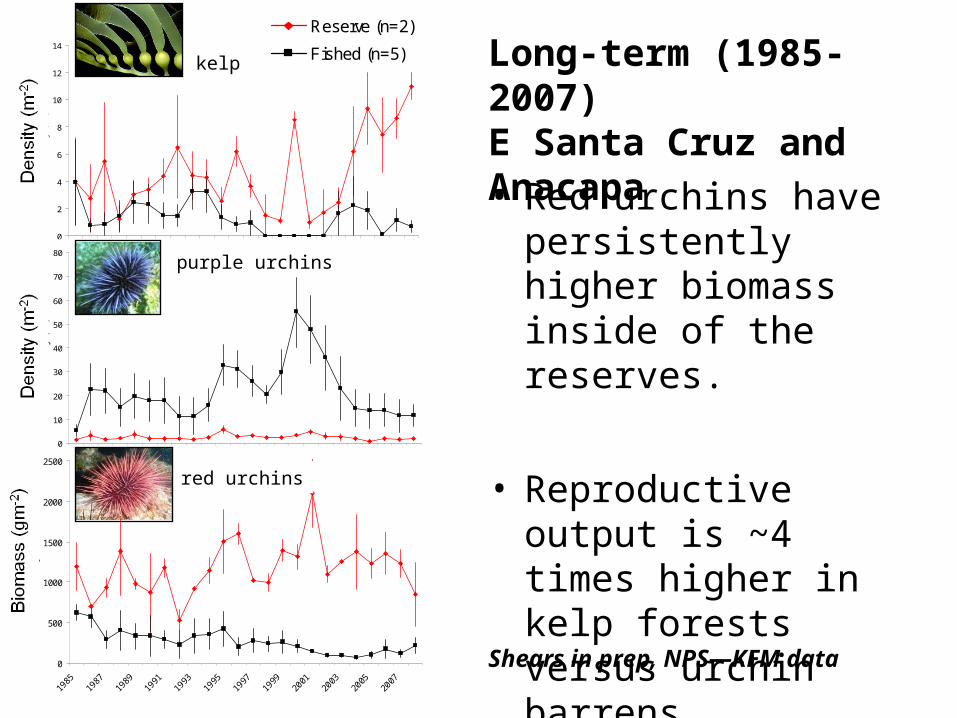
Long-term (1985-2007)E Santa Cruz and Anacapa
Shears in prep, NPS—KFM data
0
2
4
6
8
10
12
14D
en
sity
(m-2
)Reserve (n=2)
Fished (n=5)
0
10
20
30
40
50
60
70
80
De
nsi
ty (
m-2)
Reserve (n=2)
Fished (n=5)
0
1
2
3
4
5
6
7
8
De
nsi
ty (
m-2)
Reserve (n=2)
Fished (n=5)
Kelp
Purple urchins
Red urchins
0
500
1000
1500
2000
2500
De
nsi
ty (
m-2
)
Reserve (n=2)
Fished (n=5)
Red urchin biomass
Bio
ma
ss (
g m
-2)
kelp
purple urchins
red urchins
0
500
1000
1500
2000
2500
Reserve (n=2)
Fished (n=5)
Red urchin biomass
Long-term (1985-2007)E Santa Cruz and Anacapa
Shears in prep, NPS—KFM data
0
2
4
6
8
10
12
14D
en
sity
(m-2
)Reserve (n=2)
Fished (n=5)
0
10
20
30
40
50
60
70
80
De
nsi
ty (
m-2)
Reserve (n=2)
Fished (n=5)
0
1
2
3
4
5
6
7
8
De
nsi
ty (
m-2)
Reserve (n=2)
Fished (n=5)
Kelp
Purple urchins
Red urchins
Long-term (1985-2007)E Santa Cruz and Anacapa
Shears in prep, NPS—KFM data0
500
1000
1500
2000
2500
De
nsi
ty (
m-2
)
Reserve (n=2)
Fished (n=5)
Red urchin biomass
Bio
ma
ss (
g m
-2)
kelp
purple urchins
red urchins
• Red urchins have persistently higher biomass inside of the reserves.
• Reproductive output is ~4 times higher in kelp forests versus urchin barrens
0
500
1000
1500
2000
2500
Reserve (n=2)
Fished (n=5)
Red urchin biomass
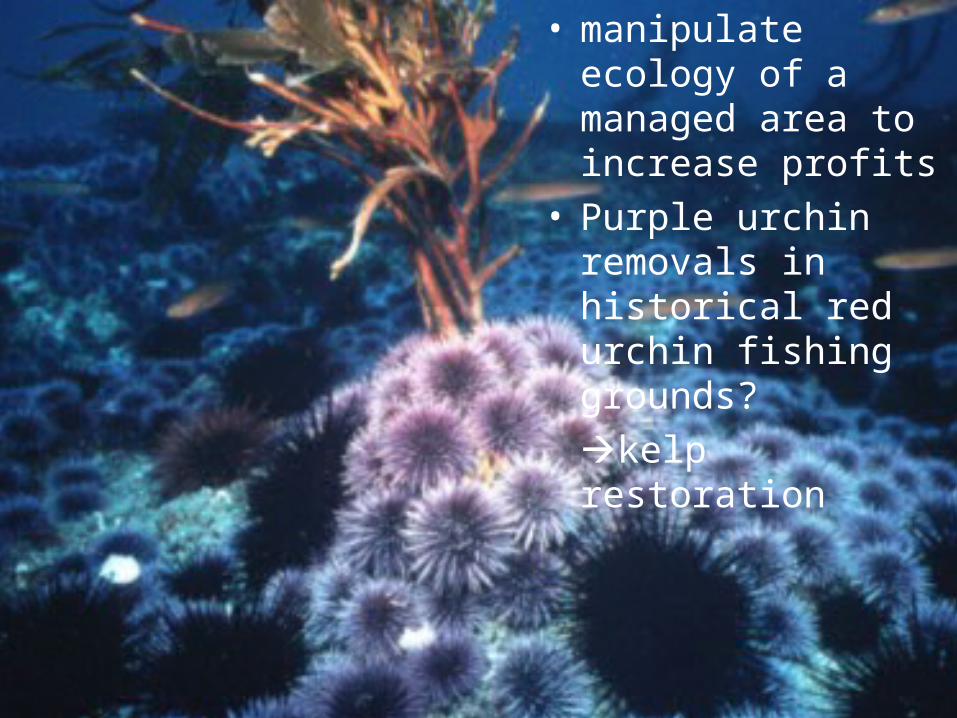
• manipulate ecology of a managed area to increase profits
• Purple urchin removals in historical red urchin fishing grounds?kelp restoration

Outline
III. EcologyWhat drives variability in red urchin populations over time and space?
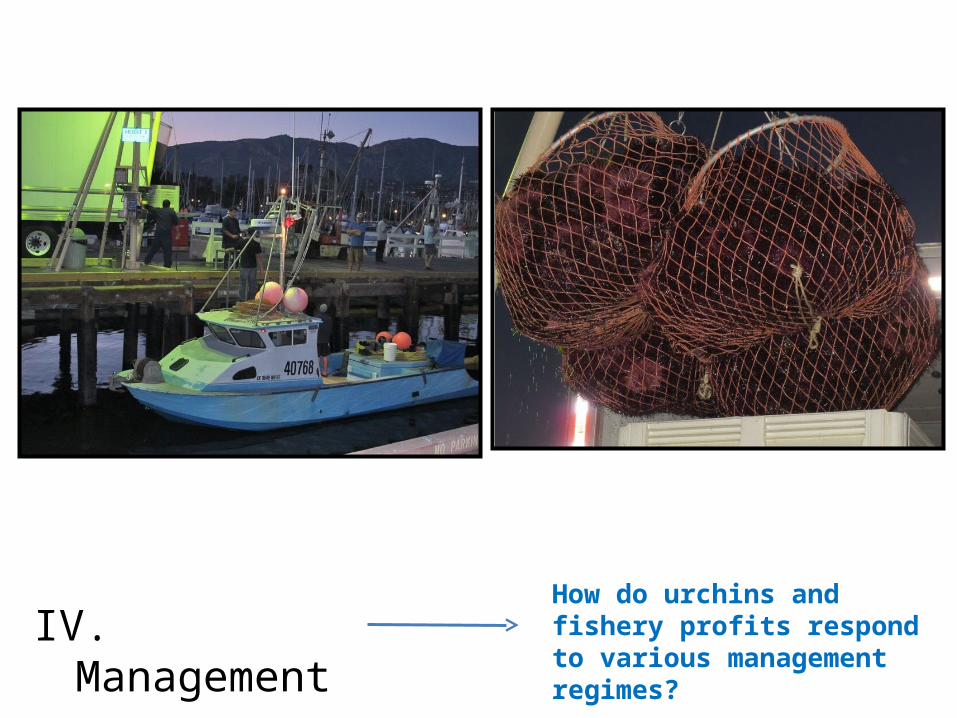
How do urchins and fishery profits respond to various management regimes?
IV. Management
How does gonad quality explain behavior of fishermen?
II. Fishing
behavior
What drives variability in gonad quality (and price) over time?
I. Fished
quality
How do urchins and fishery profits respond to various management regimes?
IV. Management
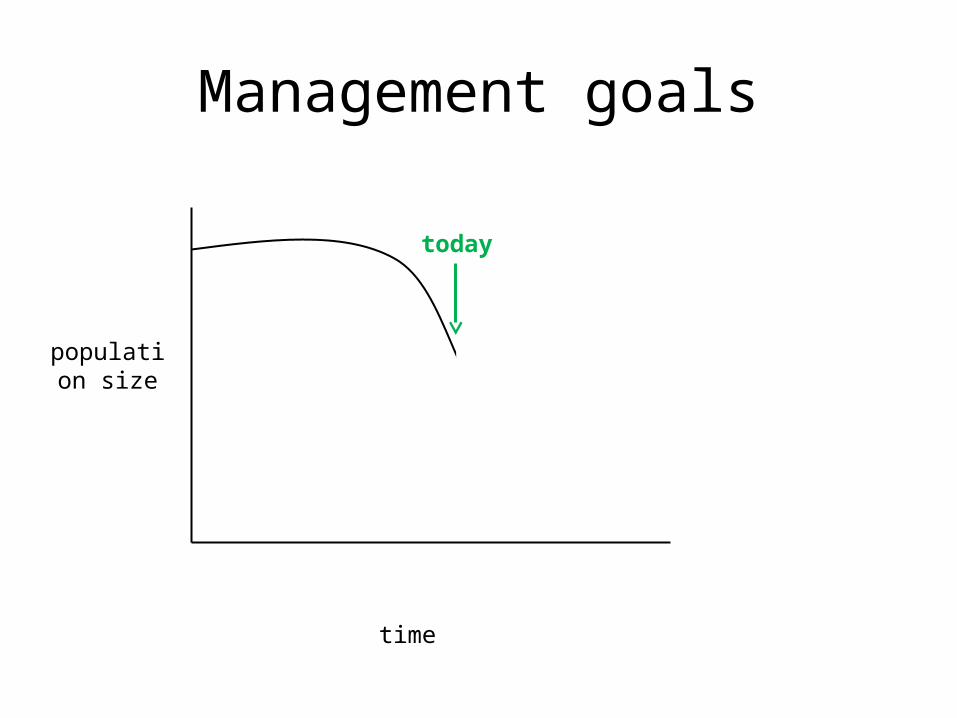
Management goals
time
population size
Fo
Freduced
Fhistorical
today
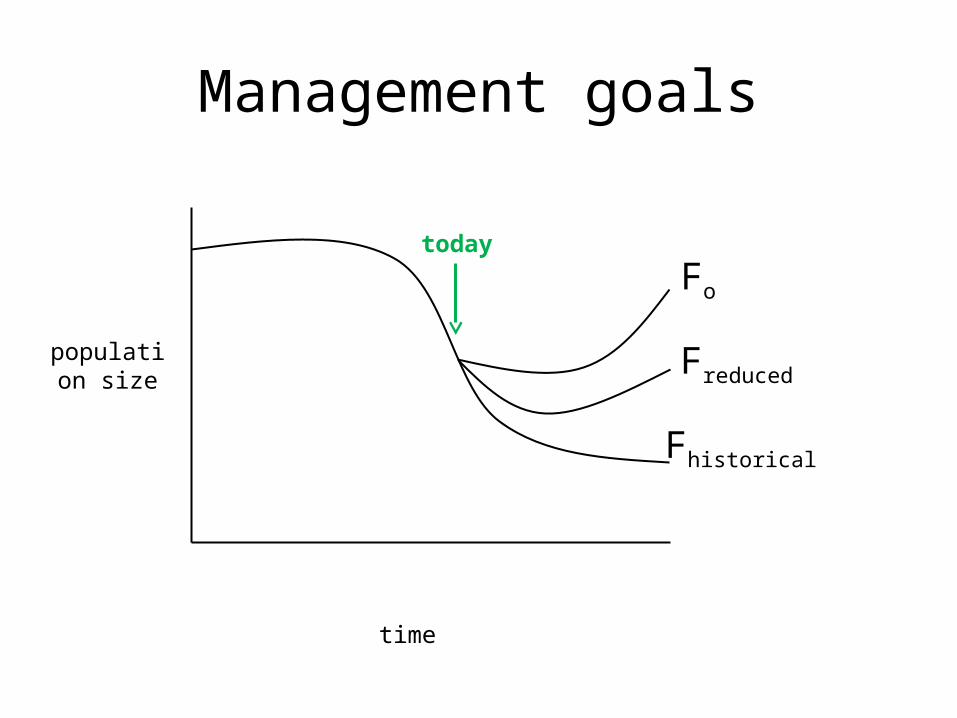
Management goals
time
population size
Fo
Freduced
Fhistorical
today
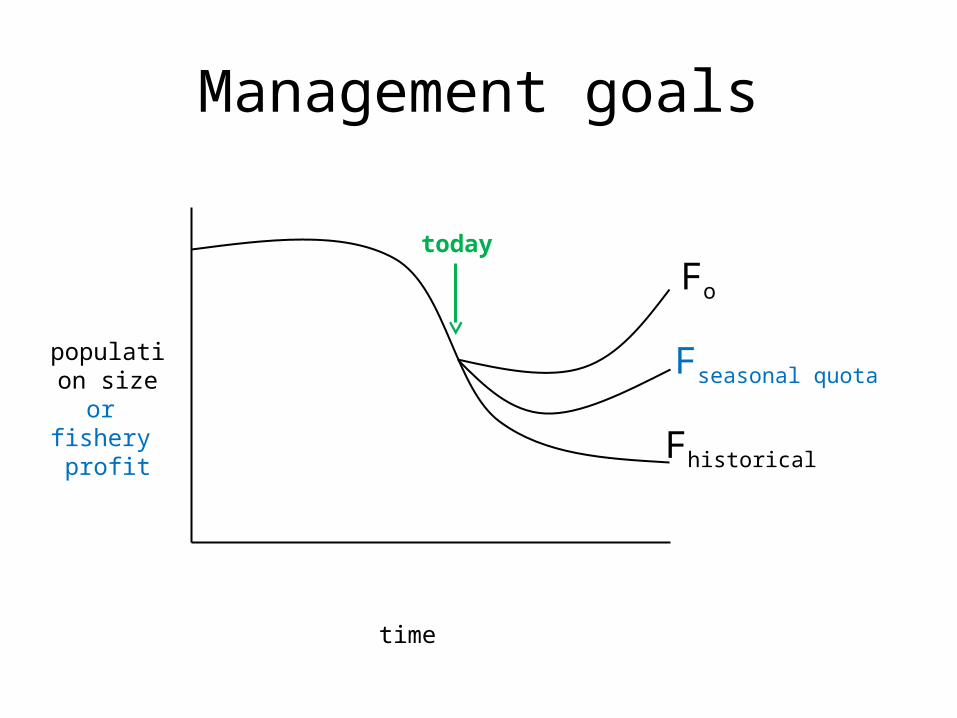
Management goals
time
population sizeor
fishery profit
Fo
Fseasonal quota
Fhistorical
today
Profits may increase with TURFs
• fishermen race to harvest year-round vs.
waiting for optimal quality
• How much more $ would they make,
if they waited?
• delaying harvest through spatial property rights,
TURF’s (Territorial Use Rights in Fisheries)
fishermen’s profits
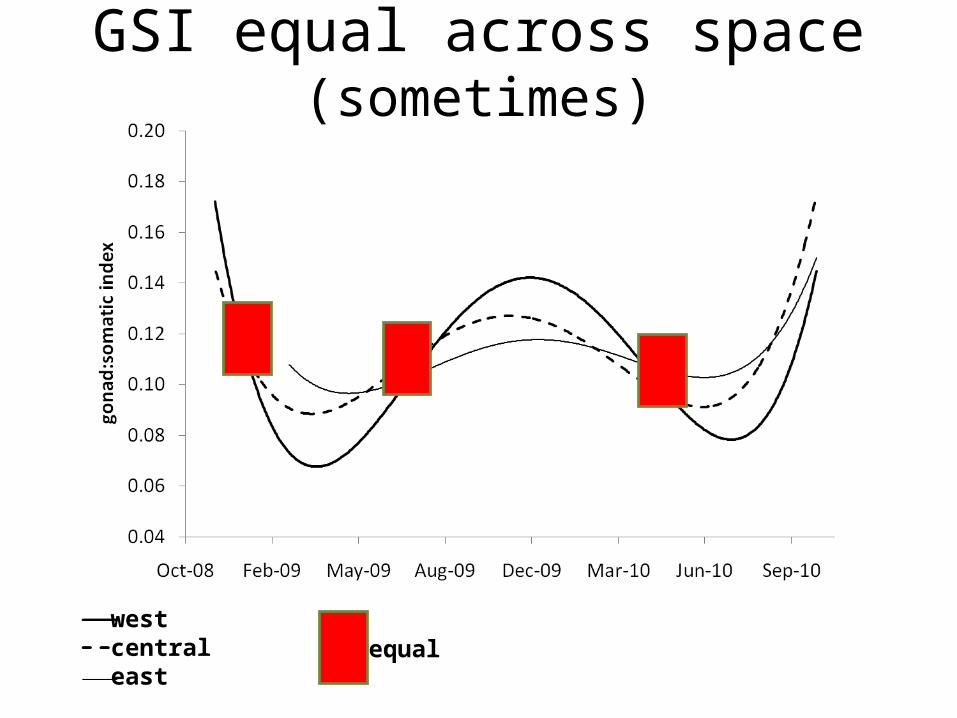
GSI equal across space (sometimes)
westcentraleast
equal
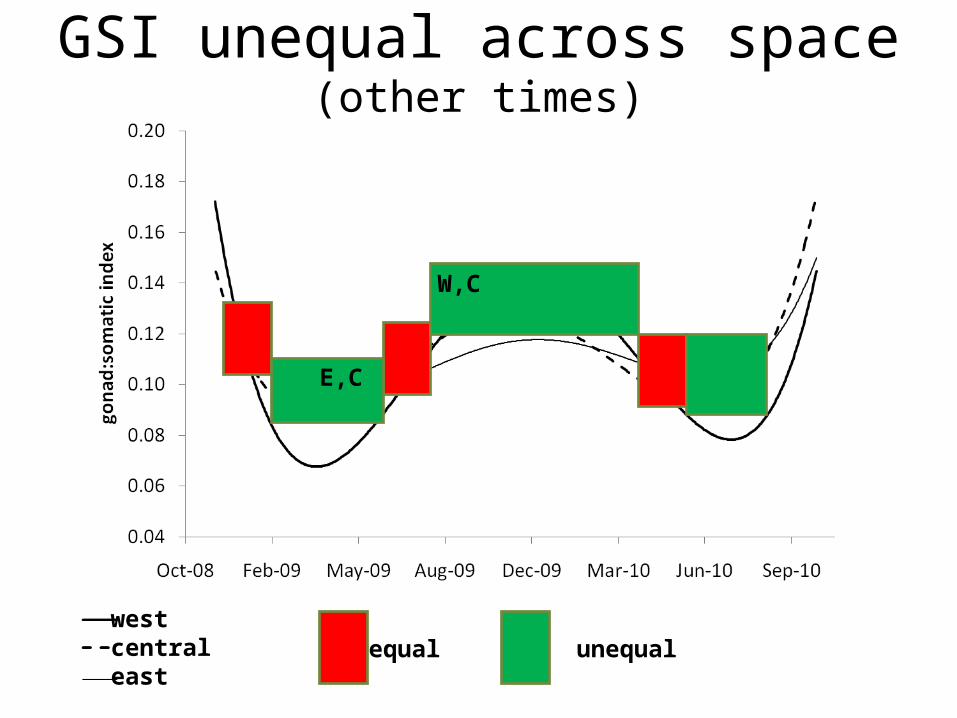
GSI unequal across space (other times)
westcentraleast
equal unequal
E,CE,C
W,C
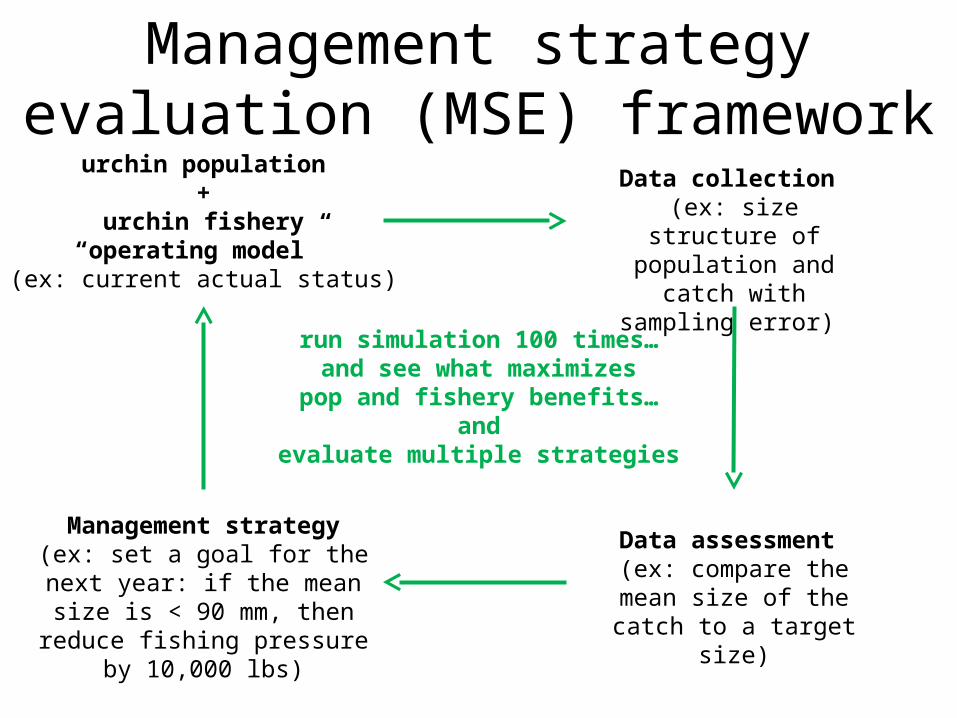
Management strategy evaluation (MSE) framework
urchin population+
urchin fishery“operating model”
(ex: current actual status)
Data collection (ex: size structure of population and catch with sampling error)
Data assessment (ex: compare the mean size of the catch to a
target size)
Management strategy(ex: set a goal for the next year:
if the mean size is < 90 mm, then reduce fishing pressure by
10,000 lbs)
run simulation 100 times…and see what maximizes
pop and fishery benefits…and
evaluate multiple strategies
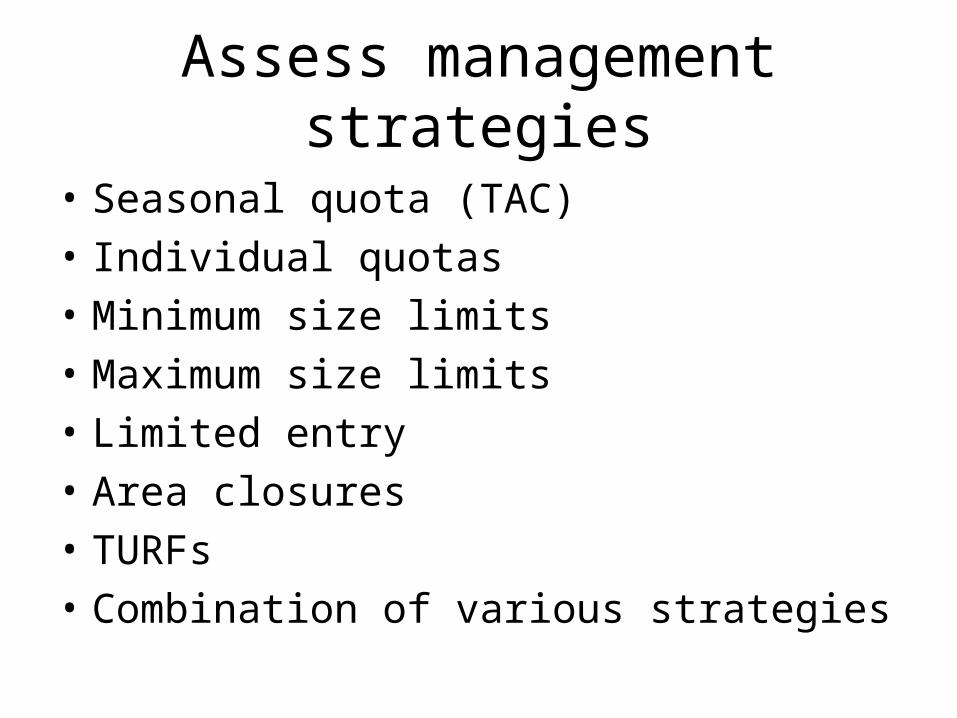
Assess management strategies
• Seasonal quota (TAC)• Individual quotas• Minimum size limits• Maximum size limits• Limited entry• Area closures• TURFs• Combination of various strategies
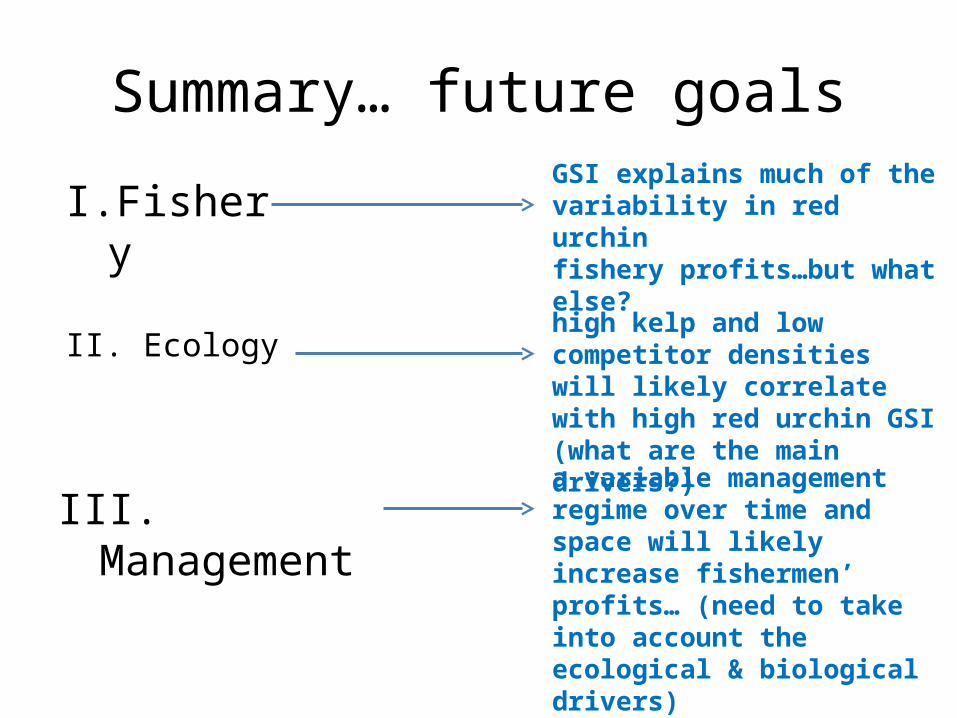
Summary… future goals
II. Ecologyhigh kelp and low competitor densities will likely correlate with high red urchin GSI (what are the main drivers?)
GSI explains much of the variability in red urchin fishery profits…but what else?
I. Fishery
a variable management regime over time and space will likely increase fishermen’ profits… (need to take into account the ecological & biological drivers)
III. Management
THANKS TO…• Commercial Fishermen of Santa Barbara: urchin divers, H. Liquornik, S. Mutz
• Lab assistants: M. Adams, A. Alger, G. Alongi, K. Asanion, M. Bogeberg, E.
Casas, D. Cooper, M. Hunt, S. Meinhold, W. Meinhold, A. Poppenwimer, J. Roh, R. Shen, T. Shultz, A. Stroud, K. Treiberg, O. Turnross, A. Wong,
• PISCO dive team: K. Davis, A. Parsons-Field, E. Nickisch, J. Benson, P. Carlson, L. Hesla, E. Hessell, C. Lantz, JA Macfarlan, C. Pierre, D. Salazar, B. Selden, A. Soccodato, N. Spindel, S. Windell,
• EEMB/Bren: Gaines lab, Lenihan lab
• J. Lorda, L. Pecquerie

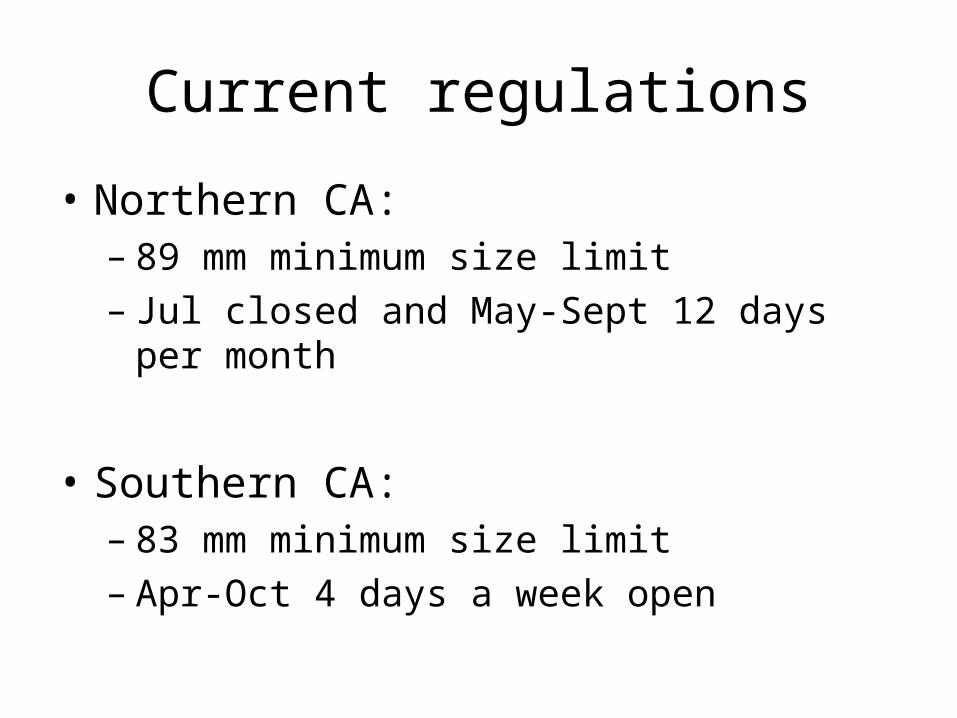
Current regulations
• Northern CA:– 89 mm minimum size limit– Jul closed and May-Sept 12 days per month
• Southern CA:– 83 mm minimum size limit– Apr-Oct 4 days a week open

Management evaluation framework (adaptive management)
Population model+
Fisheries model
Alter fleet dynamics,then assess
population and fisheries models
Optimal management strategy
(ex: set guidelines for a seasonal catch limit)
(ex: how much more would biomass and profits increase with
a seasonal catch limit?)
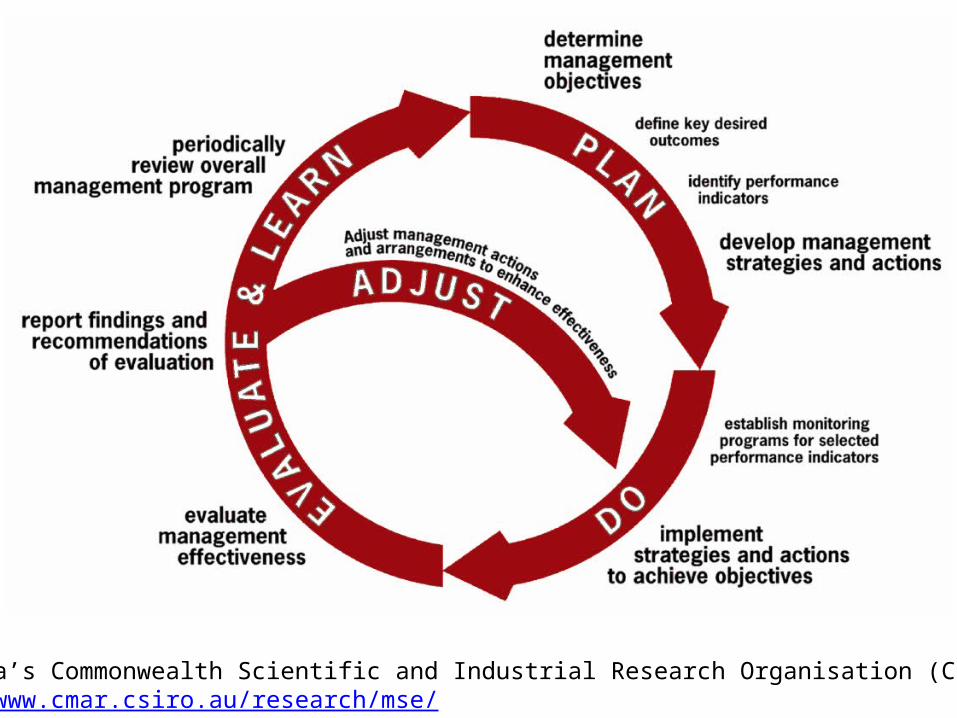
Australia’s Commonwealth Scientific and Industrial Research Organisation (CSIRO): http://www.cmar.csiro.au/research/mse/
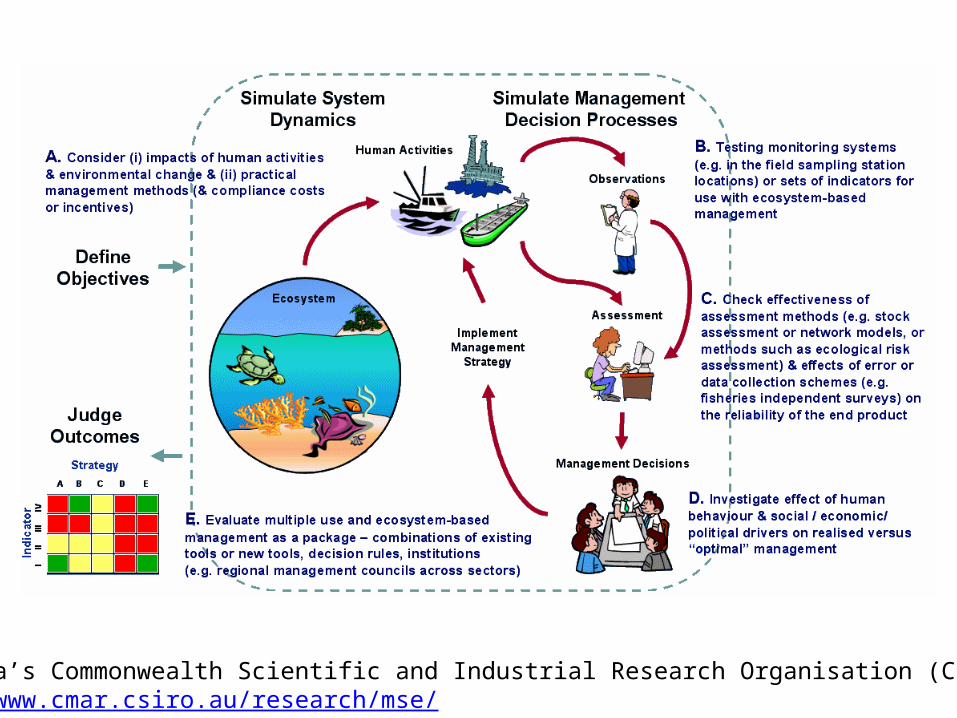
Australia’s Commonwealth Scientific and Industrial Research Organisation (CSIRO): http://www.cmar.csiro.au/research/mse/