Embed Size (px)
Citation preview

WP/12/218
Can Policies Affect Employment Intensity of Growth? A Cross-Country Analysis
E. Crivelli; D. Furceri; and J. Toujas-Bernaté

© 2012 International Monetary Fund WP/12/218
IMF Working Paper
Middle East and Central Asia
Can Policies Affect Employment Intensity of Growth? A Cross-Country Analysis
Prepared by Ernesto Crivelli; Davide Furceri; and Joël Toujas-Bernaté
Authorized for distribution by Joël Toujas-Bernaté
August 2012
Abstract
The aim of this paper is to provide new estimates of employment-output elasticities and assess the effect of structural and macroeocnomic policies on the employment-intensity of growth. Using an unbalanced panel of 167 countries over the period 1991–2009, the results suggest that structural policies aimed at increasing labor and product market flexibility and reducing government size have a significant and positive impact on employment elasticities. In addition, the results also suggest that in order to maximize the positive impact on the responsiveness of employment to economic activity, structural policies have to be complemented with macroeconomic policies aimed at increasing macroeconomic stability. JEL Classification Numbers: E29, J60, E32, D7. Keywords: employment; unemployment; employment elasticities; structural policies; reforms. Author’s E-Mail Address: [email protected]; [email protected]; and [email protected]
The authors would like to thank Prakash Loungani for suggestions and comments, and Désirée Amon and Kia Penso for excellent editorial assistance. Mailing address: IMF, 700 19th Street NW, Washington, DC 20431. Email: [email protected]. Phone: +1-202-623-6278; Fax: +1-202-589-5854. Mailing address: IMF, 700 19th Street NW, Washington, DC 20431. Email: [email protected]; Phone: +1-202-623-5854; Fax: +1-202-589-5854. Mailing address: IMF, 700 19th Street NW, Washington, DC 20431. Email: [email protected]; Phone: +1-202-623-6936; Fax: +1-202-589-5854.
This Working Paper should not be reported as representing the views of the IMF. The views expressed in this Working Paper are those of the author(s) and do not necessarily represent those of the IMF or IMF policy. Working Papers describe research in progress by the author(s) and are published to elicit comments and to further debate.
2
Contents Page
I. Introduction ............................................................................................................................3
II. Empirical Strategy and Data .................................................................................................5 A. Empirical Strategy .....................................................................................................5 B. Data ...........................................................................................................................8
III. Results ..................................................................................................................................9 A. Regional trends in employment elasticities ..............................................................9 B. Determinants of Employment Elasticities ...............................................................10
IV. Conclusions........................................................................................................................13
References ................................................................................................................................15 Tables 1. Descriptive Statistics and Sources ................................................................................................... 20 2. Spearman’s Rank Correlation Coefficient for Long-run Elasticities Estimates .............................. 21 4. Evolution of Employment Elasticities with Time ........................................................................... 22 5. Correlation Between Employment Elasticities and Structural Policy Variables ............................. 23 6. Effects of Structural Variables on Employment Elasticities ........................................................... 23 7. Effects of Structural and Macroeconomic Variables on Employment Elasticities .......................... 24 8. Effects of Structural and Demographic Variables on Employment Elasticities .............................. 25 9. Effects of Labor Market Policy Indicators on Employment Elasticities ......................................... 26 10. Effects of Product Market Policy Indicators on Employment Elasticities .................................... 27 11a. Non-Linear Effects of Structural Variables on Employment Elasticities—GDP ........................ 28 11b. Non-Linear Effects of Structural Variables on Employment Elasticities—Output Volatility .... 28 11c. Non-Linear Effects of Structural Variables on Employment Elasticities—Inflation ................... 29
Figures 1. The evolution of Unemployment Across Regions ..............................................................18 2. Real GDP and Employment Growth, by Income Level Group, 2000–09 ..........................18 3. Distribution of Long-Run Employment Elasticities ...........................................................19 Appendix ..................................................................................................................................30
3
I. INTRODUCTION
1. The Great Recession has renewed concerns about unemployment and job creation. According to ILO estimates (ILO’s Global Employment Trends), the number of unemployed has increased by 27 million units over the period 2007–10 and employment rates have fallen from 61.2 to 60 percent at the global level.
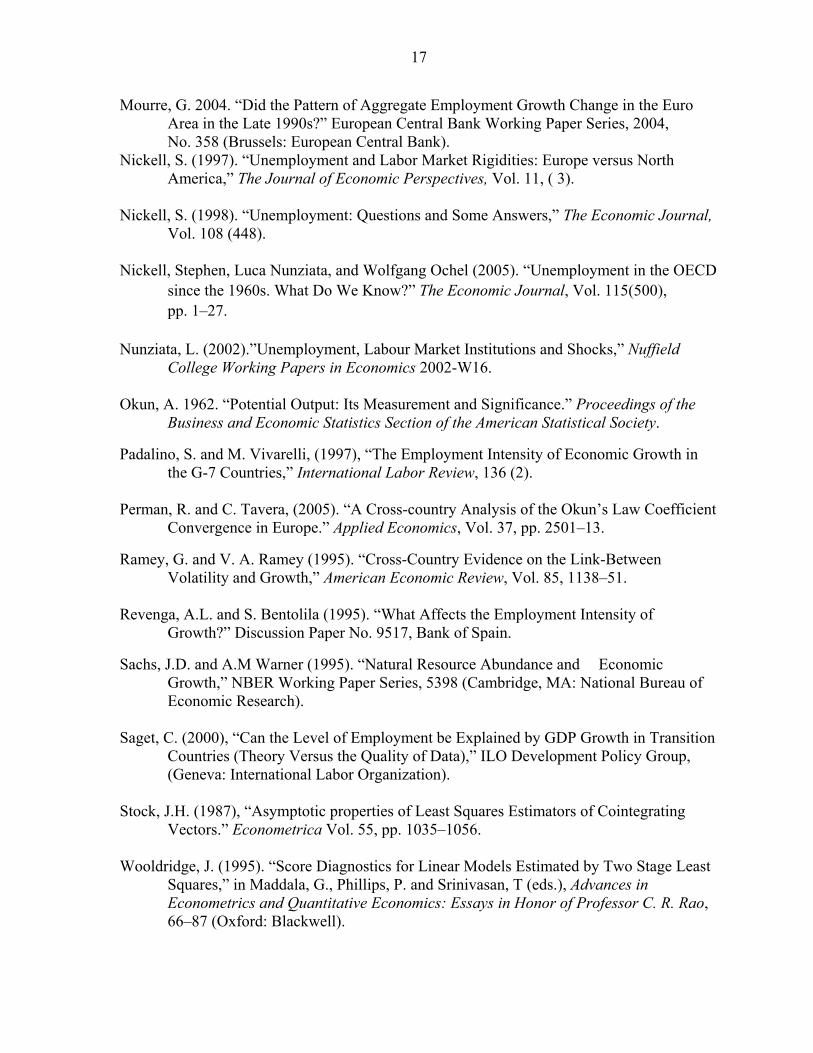
2. The response of unemployment, however, has been quite heterogeneous across countries. While many emerging market countries have generally weathered the crisis well, unemployment has increased substantially in advanced economies (Figure 1). A key factor explaining this heterogeneity across countries is the response of employment to GDP. Indeed, unemployment has increased more markedly in those countries (high-income countries) with the highest employment intensity of growth (Figure 2).
3. Unemployment tends to increase more in the short term in countries with employment elasticities; however, as economic conditions improve, unemployment is expected to decrease more quickly in those countries with a more responsive labor market (Bernal-Verdugo et al. 2012a). In this context, an understanding of the determinants of employment elasticities and the factors that can accelerate job creation is of crucial importance.
4. Although researchers have deeply analyzed the impact of real shocks on overall unemployment and the determinants of unemployment (Bruno and Sachs, 1985; Blanchard and Wolfers, 2000; Nickell et al., 2005; Bernal-Verdugo 2012a, b), few studies have estimated employment-output elasticities and even fewer their determinants. The majority of the papers looking at the relationship between output growth and employment refer to single country studies and are based on the seminal paper by Okun (1962). Only a few studies have focused on this relationship on a cross-country basis, and only for specific regions:, for example, Moosa (1997) and Padalino and Vivarelli (1997) for G-7 countries, Freeman (2001) and Kaufman (1988) for industrial countries, and Lee (2000), Baker and Schmitt (1999), and Erber (1994) for selected OECD countries. More recently, Perman and Tavera (2005) and Döpke (2001) focus on European countries, while Gabrisch and Buscher (2005), and Izyumov and Vahaly (2002) look at the experience of transition economies.
5. Among these studies, only a few have tried to explain the determinants of employment-output elasticities. Döpke (2001) finds that lower real labor costs, greater labor market flexibility, and less exchange rate volatility have a significant impact on employment elasticities for European countries. Also Mourre (2004) confirms the previous findings of lower real labor costs increasing employment elasticities in the euro area. He also finds that job intensity of growth has been highest in the services sector, and suggests that labor market reforms (including relaxation of job protection legislation) and structural changes might have played a role in employment performance in the euro area during the 1990s, though the effects are mixed and the overall results are not statistically significant. More recently, Kapsos (2005) investigates the linkages between employment elasticities and a set of

4
variables explaining the developments in demographics, the economic structure, macroeconomic volatility, trade openness, health, tax policy, and labor regulation in a study that includes 160 countries over the period 1991–2003. The results of this work suggest that employment elasticities are positively related with the share of services in the economy, and negatively related with inflation and taxes on labor. In contrast, no statistically significant relation is found between employment elasticities and (i) employment protection regulations; and (ii) measures of globalization and export orientation.
6. This paper contributes to the literature by providing new set of employment-output elasticities for an unbalanced panel of 167 countries over the period 1991–2009, and by assessing the role of structural and policy variables in affecting these elasticities. The main findings can be summarized as follows:
Point estimates of elasticities typically fall in the 0–1 range, with the majority ranging between 0.3 and 0.8;
Elasticities vary considerably across regions, income groups, and production sectors, with the highest estimates typically recorded for the most economically developed regions, and in industry and services sectors;
Structural policies aimed at increasing labor and product market flexibility and reducing government size have a significant and positive impact on employment elasticities;
Macroeconomic policies aimed at reducing macroeconomic volatility have a significant and positive impact on employment elasticities; and
In order to maximize the positive impact on the responsiveness of employment to economic activity, structural policies have to be complemented with macroeconomic policies aimed at increasing macroeconomic stability.
7. The rest of the paper is organized as follows. Section II describes the dataset and the empirical strategy. Section III summarizes the results for the estimated elasticities (across regions, sectors, and income groups), and presents the results on the cross-country determinants of employment elasticities. Section IV concludes.
5
II. EMPIRICAL STRATEGY AND DATA
A. Empirical Strategy
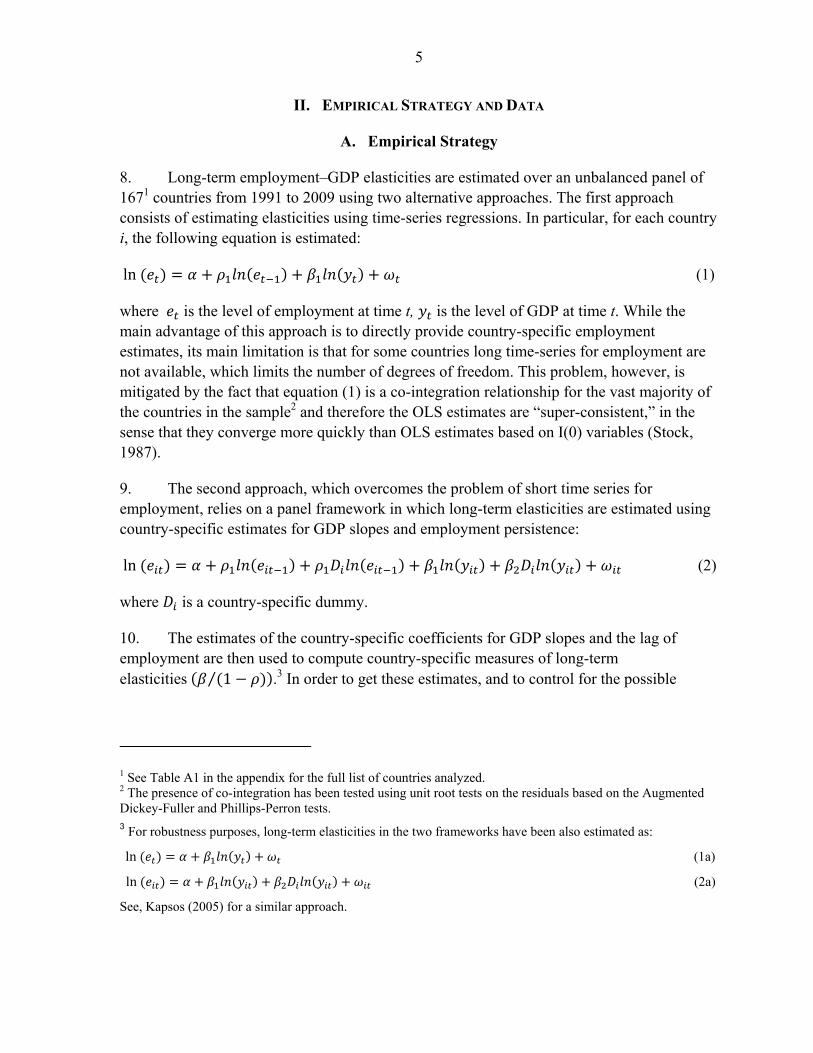
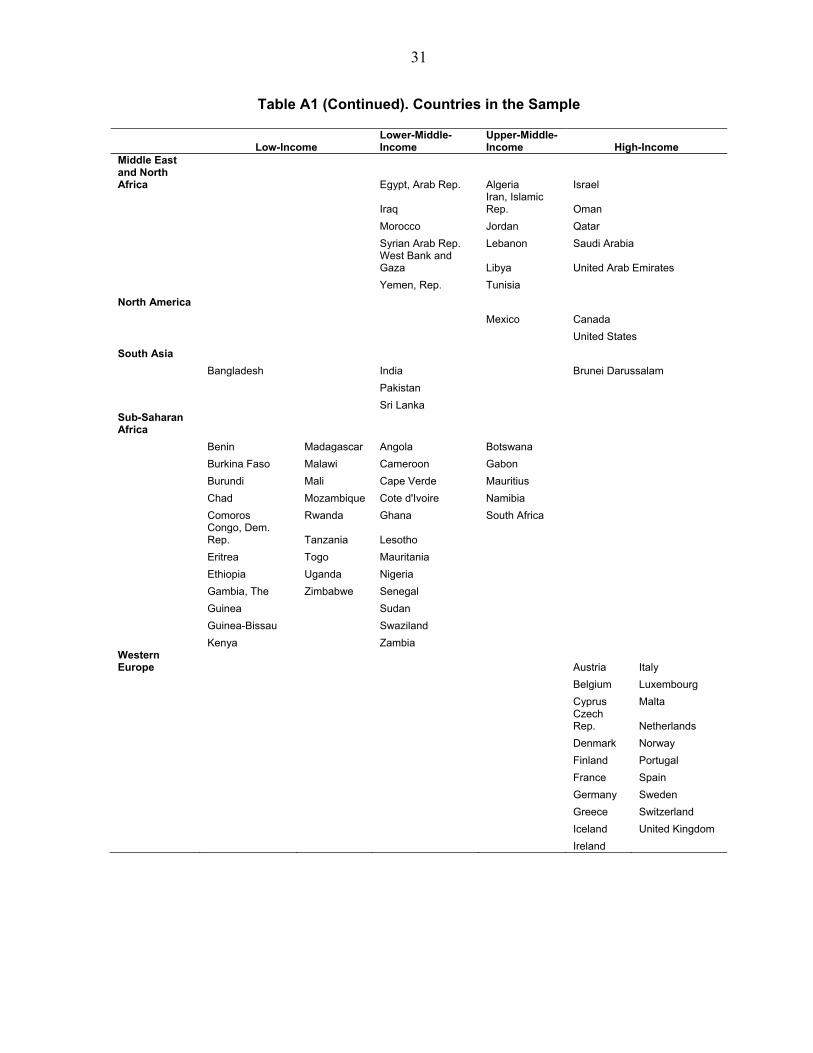
8. Long-term employment–GDP elasticities are estimated over an unbalanced panel of 1671 countries from 1991 to 2009 using two alternative approaches. The first approach consists of estimating elasticities using time-series regressions. In particular, for each country i, the following equation is estimated:
ln (1)
where is the level of employment at time t, is the level of GDP at time t. While the main advantage of this approach is to directly provide country-specific employment estimates, its main limitation is that for some countries long time-series for employment are not available, which limits the number of degrees of freedom. This problem, however, is mitigated by the fact that equation (1) is a co-integration relationship for the vast majority of the countries in the sample2 and therefore the OLS estimates are “super-consistent,” in the sense that they converge more quickly than OLS estimates based on I(0) variables (Stock, 1987).
9. The second approach, which overcomes the problem of short time series for employment, relies on a panel framework in which long-term elasticities are estimated using country-specific estimates for GDP slopes and employment persistence:
ln (2)
where is a country-specific dummy.
10. The estimates of the country-specific coefficients for GDP slopes and the lag of employment are then used to compute country-specific measures of long-term elasticities 1⁄ .3 In order to get these estimates, and to control for the possible
1 See Table A1 in the appendix for the full list of countries analyzed. 2 The presence of co-integration has been tested using unit root tests on the residuals based on the Augmented Dickey-Fuller and Phillips-Perron tests. 3 For robustness purposes, long-term elasticities in the two frameworks have been also estimated as:
ln (1a)
ln (2a)
See, Kapsos (2005) for a similar approach.
6
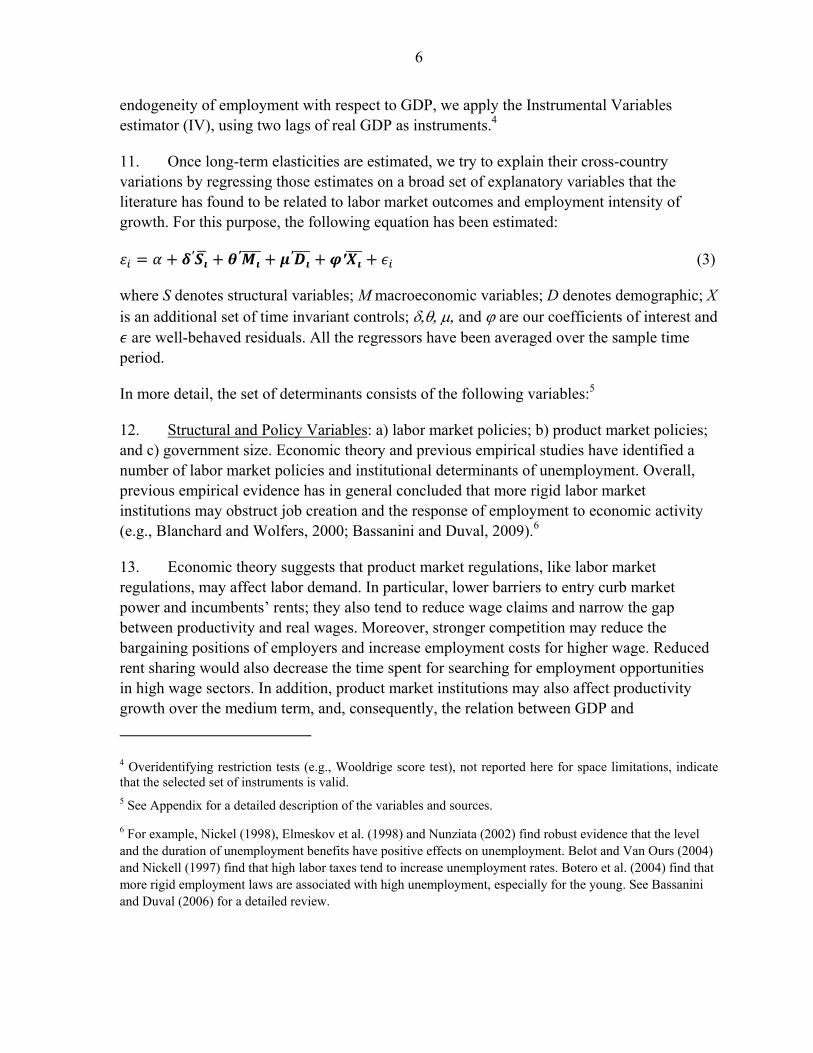
endogeneity of employment with respect to GDP, we apply the Instrumental Variables estimator (IV), using two lags of real GDP as instruments.4
11. Once long-term elasticities are estimated, we try to explain their cross-country variations by regressing those estimates on a broad set of explanatory variables that the literature has found to be related to labor market outcomes and employment intensity of growth. For this purpose, the following equation has been estimated:
′ ′ ′ ′ (3)
where S denotes structural variables; M macroeconomic variables; D denotes demographic; X is an additional set of time invariant controls; and are our coefficients of interest and are well-behaved residuals. All the regressors have been averaged over the sample time
period.
In more detail, the set of determinants consists of the following variables:5
12. Structural and Policy Variables: a) labor market policies; b) product market policies; and c) government size. Economic theory and previous empirical studies have identified a number of labor market policies and institutional determinants of unemployment. Overall, previous empirical evidence has in general concluded that more rigid labor market institutions may obstruct job creation and the response of employment to economic activity (e.g., Blanchard and Wolfers, 2000; Bassanini and Duval, 2009).6
13. Economic theory suggests that product market regulations, like labor market regulations, may affect labor demand. In particular, lower barriers to entry curb market power and incumbents’ rents; they also tend to reduce wage claims and narrow the gap between productivity and real wages. Moreover, stronger competition may reduce the bargaining positions of employers and increase employment costs for higher wage. Reduced rent sharing would also decrease the time spent for searching for employment opportunities in high wage sectors. In addition, product market institutions may also affect productivity growth over the medium term, and, consequently, the relation between GDP and
4 Overidentifying restriction tests (e.g., Wooldrige score test), not reported here for space limitations, indicate that the selected set of instruments is valid. 5 See Appendix for a detailed description of the variables and sources.
6 For example, Nickel (1998), Elmeskov et al. (1998) and Nunziata (2002) find robust evidence that the level and the duration of unemployment benefits have positive effects on unemployment. Belot and Van Ours (2004) and Nickell (1997) find that high labor taxes tend to increase unemployment rates. Botero et al. (2004) find that more rigid employment laws are associated with high unemployment, especially for the young. See Bassanini and Duval (2006) for a detailed review.
7
employment. Overall, previous empirical evidence has confirmed the hypothesis that product market regulations are correlated with the persistence and the responsiveness of unemployment to GDP shocks (Bassanini and Duval, 2006 and 2009).
14. Government size can also affect the elasticity between employment and GDP. First, a large government sector tends to crowd out private investment and reduce productivity growth over the medium term (Afonso and Furceri, 2009). Second, because the private sector is smaller, its ability to absorb new labor force entrants is correspondingly smaller. Third, a large government sector often involves higher taxes which can have depressive effects on aggregate demand and on the labor market (Daveri and Tabellini, 2000). Previous empirical evidence has confirmed the hypothesis that a larger government is associated with higher unemployment rates (e.g., Feldman, 2006).
15. Macroeconomic variables (M): a) GDP per capita; b) openness (proxied by the log of GDP’s share of total exports and imports); c) CPI-based inflation rate; d) GDP growth volatility (computed as the coefficient of variation of real GDP growth); e) country size (proxied by the log of total population); f) FDI inflows as a percentage of GDP; and g) the share of Services’ value added in total GDP. GDP per capita is examined to test whether employment elasticities vary with the level of economic development. Openness and FDI are included to test the role of trade and financial openness in affecting employment elasticities (Bruno et al. 2001). Growth volatility and inflation may affect employment elasticities as uncertainty as to prices and economic activity may have a significant impact on growth and employment (Ramey and Ramey, 1995; Judson and Orphanides, 1999; Imbs, 2007; Furceri, 2010). The share of value added in Services is included to test whether the service sector is usually characterized by higher employment intensity (Padalino and Vivarelli, 1997; Mourre 2004).
16. Demographic variables (D): a) the share of urban population; b) population density; c) the log of total labor force; and d) working-age population growth.7 The share of urban population and population density are included to test whether agglomeration factors have an effect on employment elasticities. Total labor force and working-age population growth are included to assess the effect of labor market supply on employment elasticities.
17. Additional time-invariant controls (X): a) latitude distance from the equator (log of absolute distance); and b) oil-exporting country dummy. These variables have been included in all the specifications presented in the empirical analysis, and aim to control for cross-country variation in employment elasticities. Specifically, latitude from the equator is
7 As suggested by La Porta et al. (1999), it is likely that latitude from the equator, income, and regional
dummies are related to the quality of government and institutions.
8
included to control for geographic factors that can affect labor market decisions and long-term growth (Sachs and Warner, 1995). Oil exporter dummies are included to control for the fact that the hydrocarbon sector usually absorbs only a small fraction of overall employment, relative to its share in total GDP, and that employment in this sector is usually not much correlated with changes in production. Finally, infectious deadly diseases are included to control for possible effects on productivity and employment.
18. Because our dependent variables are based on estimates, the regression residuals can be thought of as having two components. The first component is sampling error (the difference between the true value of the dependent variable and its estimated value). The second component is the random shock that would have been obtained even if the dependent variable were observed directly rather than estimated. This would lead to an increase in the standard deviation of the estimates, which would lower the t-statistics. Any correction to the presence of this unmeasurable error term will increase the significance of our estimates. Given that the dependent variable is measured with different degrees of precision across countries, equation (3) has been estimated by Weighted Least Squares (WLS). Specifically, the WLS estimator assumes that the errors are distributed as ~ 0, ⁄ , where are the estimated standard deviations of the residuals of the employment–GDP equation for each country i, and is an unknown parameter that is estimated in the second-stage regression.
B. Data
19. Most of the variables used in the empirical analysis, including employment and real GDP, are taken from the World Bank Development Indicators (WDI) database (Table 1).
20. Data for labor market policies are taken from the Global Competitiveness Report (GCR) and the Fraser Institute’s Economic Freedom of the World (EFW). Following the EFW’s methodology we construct a composite indicator of labor market policies rating countries between 0 and 10, with more flexible countries scoring higher values. The composite indicator is based on three policy indicators, each of them covering a different aspect: (i) Hiring and firing regulation (GCR); (ii) Centralized collective wage bargaining (GCR); and (iii) Conscription (EFW).
21. Data for product market policies are taken from the Fraser Institute’s Economic Freedom of the World (EFW). The database provides indicators of product market policies, rating countries between 0 and 10, with more flexible countries scoring higher values. The indicator of product market policies is a composite indicator based on seven policy indicators, each of them covering a different aspect: (i) Price controls; (ii) Administrative requirements; (iii) Bureaucracy costs; (iv) the Cost of starting a business; (v) Extra payments/bribes; (vi) Licensing restrictions; and (vii) the Cost of tax compliance.
9
III. RESULTS
A. Regional trends in employment elasticities
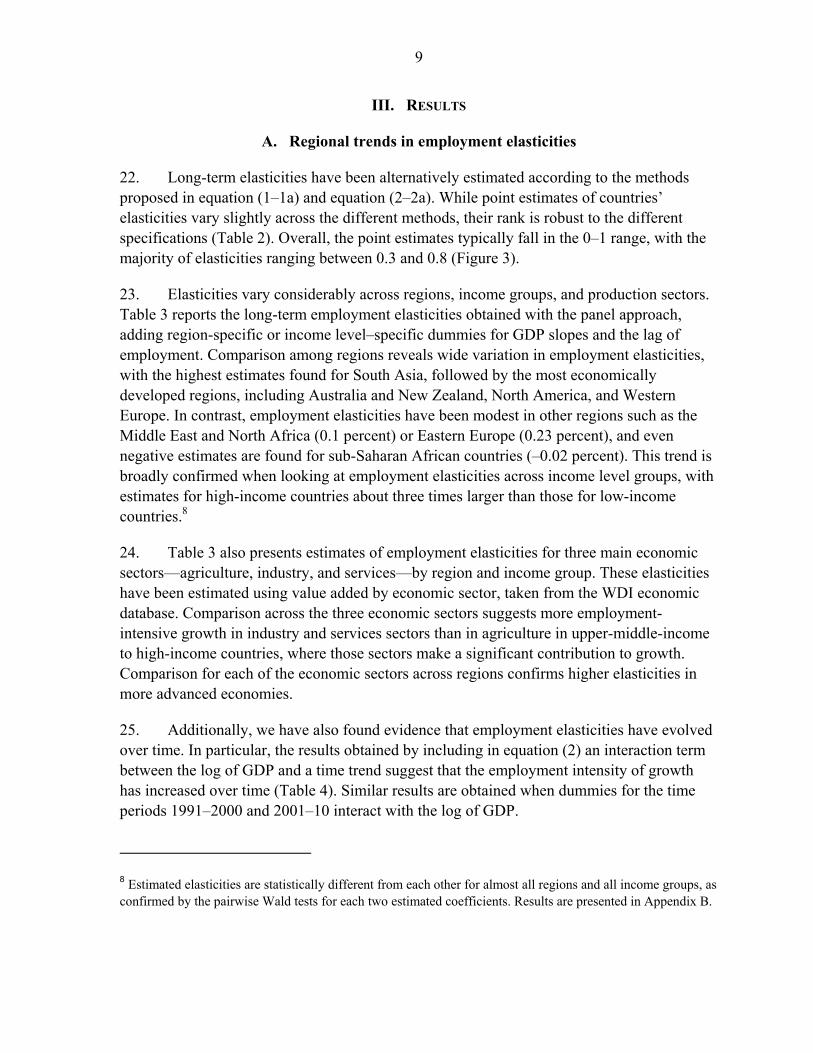
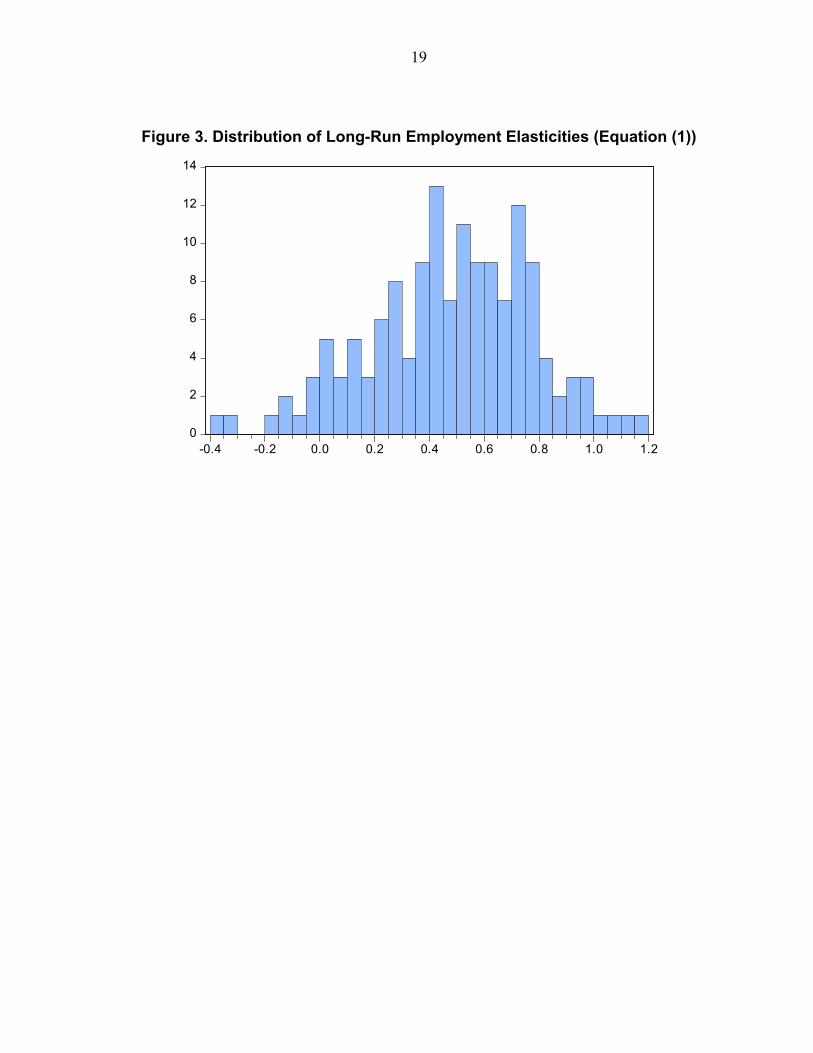
22. Long-term elasticities have been alternatively estimated according to the methods proposed in equation (1–1a) and equation (2–2a). While point estimates of countries’ elasticities vary slightly across the different methods, their rank is robust to the different specifications (Table 2). Overall, the point estimates typically fall in the 0–1 range, with the majority of elasticities ranging between 0.3 and 0.8 (Figure 3).
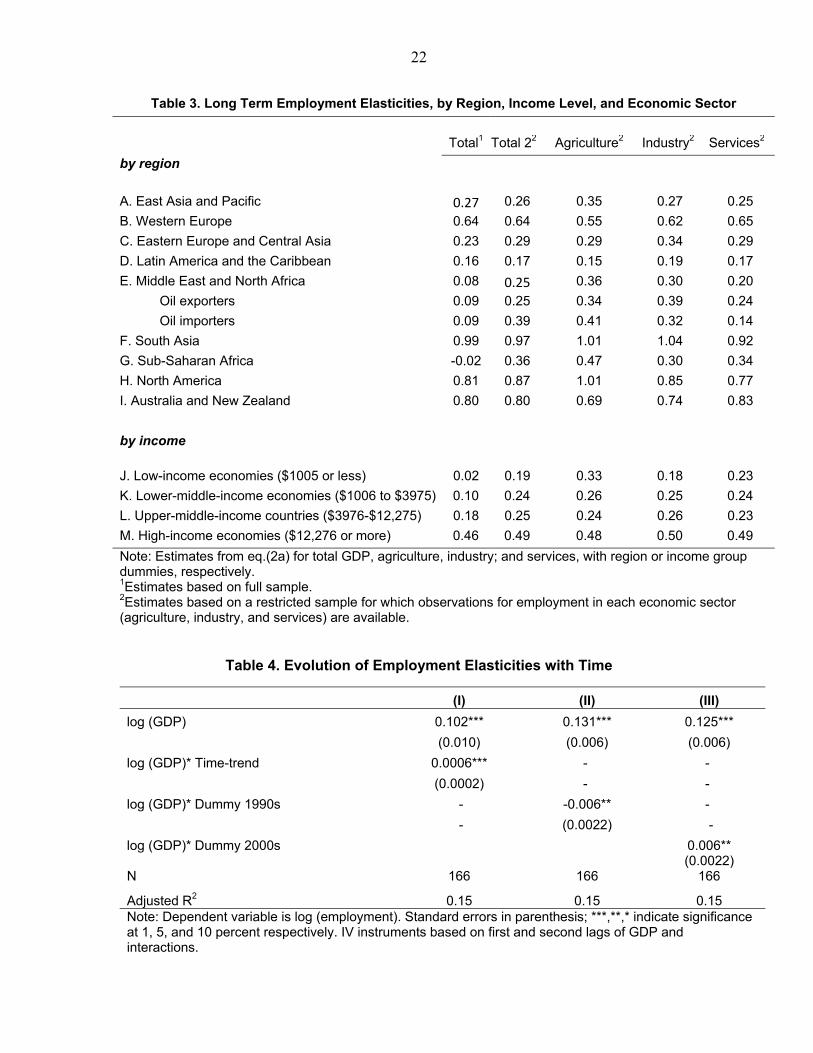
23. Elasticities vary considerably across regions, income groups, and production sectors. Table 3 reports the long-term employment elasticities obtained with the panel approach, adding region-specific or income level–specific dummies for GDP slopes and the lag of employment. Comparison among regions reveals wide variation in employment elasticities, with the highest estimates found for South Asia, followed by the most economically developed regions, including Australia and New Zealand, North America, and Western Europe. In contrast, employment elasticities have been modest in other regions such as the Middle East and North Africa (0.1 percent) or Eastern Europe (0.23 percent), and even negative estimates are found for sub-Saharan African countries (–0.02 percent). This trend is broadly confirmed when looking at employment elasticities across income level groups, with estimates for high-income countries about three times larger than those for low-income countries.8
24. Table 3 also presents estimates of employment elasticities for three main economic sectors—agriculture, industry, and services—by region and income group. These elasticities have been estimated using value added by economic sector, taken from the WDI economic database. Comparison across the three economic sectors suggests more employment-intensive growth in industry and services sectors than in agriculture in upper-middle-income to high-income countries, where those sectors make a significant contribution to growth. Comparison for each of the economic sectors across regions confirms higher elasticities in more advanced economies.
25. Additionally, we have also found evidence that employment elasticities have evolved over time. In particular, the results obtained by including in equation (2) an interaction term between the log of GDP and a time trend suggest that the employment intensity of growth has increased over time (Table 4). Similar results are obtained when dummies for the time periods 1991–2000 and 2001–10 interact with the log of GDP.
8 Estimated elasticities are statistically different from each other for almost all regions and all income groups, as confirmed by the pairwise Wald tests for each two estimated coefficients. Results are presented in Appendix B.
10
B. Determinants of Employment Elasticities
26. This section presents the econometric results obtained by estimating equation (3) under different specifications and sets of controls. While the results presented in this section are based on long-term elasticities obtained with country-specific time series regressions, qualitatively similar results are obtained using the elasticities estimated with panel regressions.
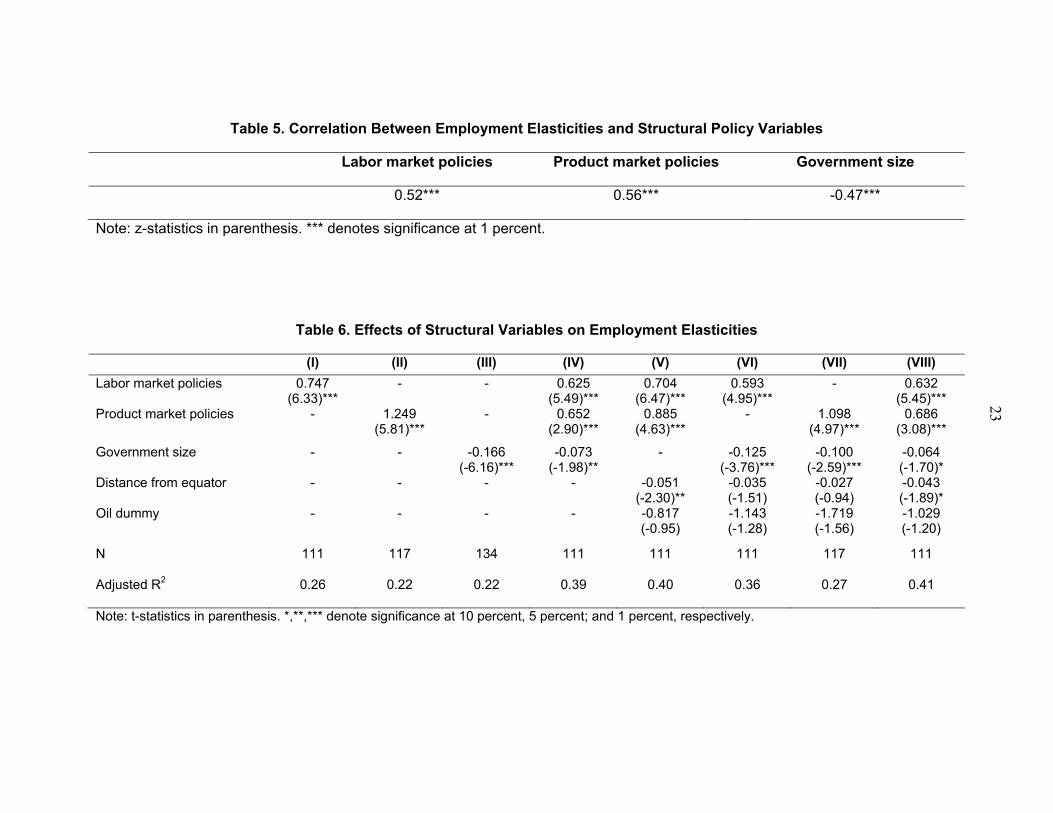
27. In particular, the analysis presented in this section focuses on the role of structural and policy variables in affecting employment-intensity of growth. Table 5 presents pairwise correlations—corrected for different precision in the estimated elasticities—between the estimated medium-term elasticities and the structural and policy variables of interest. Looking at the table, it emerges clearly that countries with higher elasticities are characterized by more flexible labor and product market and by lower government size. This relation will be formally tested in the next sections.
Structural Policies
28. Table 6 presents the estimation results for the effects of structural variables on employment elasticities. Starting with labor market policies, it can be noted that the indicator by itself is able to explain more than 25 percent of the cross-country variation in employment elasticities. The labor market indicator is found to have a significant and positive impact across all specifications. In particular, once other factors are controlled for, an increase of the indicator equal to one standard deviation of the average change (0.4) increases employment elasticities by about 30 percentage points.
29. Similar to labor market policies, the product market policies indicator has a significant and positive impact on employment elasticities across all specifications and sets of controls. The indicator by itself is able to explain a significant share of cross-country variation in employment elasticities. In terms of magnitude of the effect, the results suggest that an increase in the indicator equal to one standard deviation of the average change (0.6) increases employment elasticities by at least 30 percentage points.
30. Government size has also an important role in explaining cross-country variations in employment elasticities (about 22 percent). The results are in line with previous empirical evidence suggesting that countries with larger government tend to have lower employment elasticities. In particular, the results in Table 5 suggest that an increase of 1 percentage point in the share of government consumption in GDP would decrease employment elasticities by about 10 percentage points.
Macroeconomic Policies
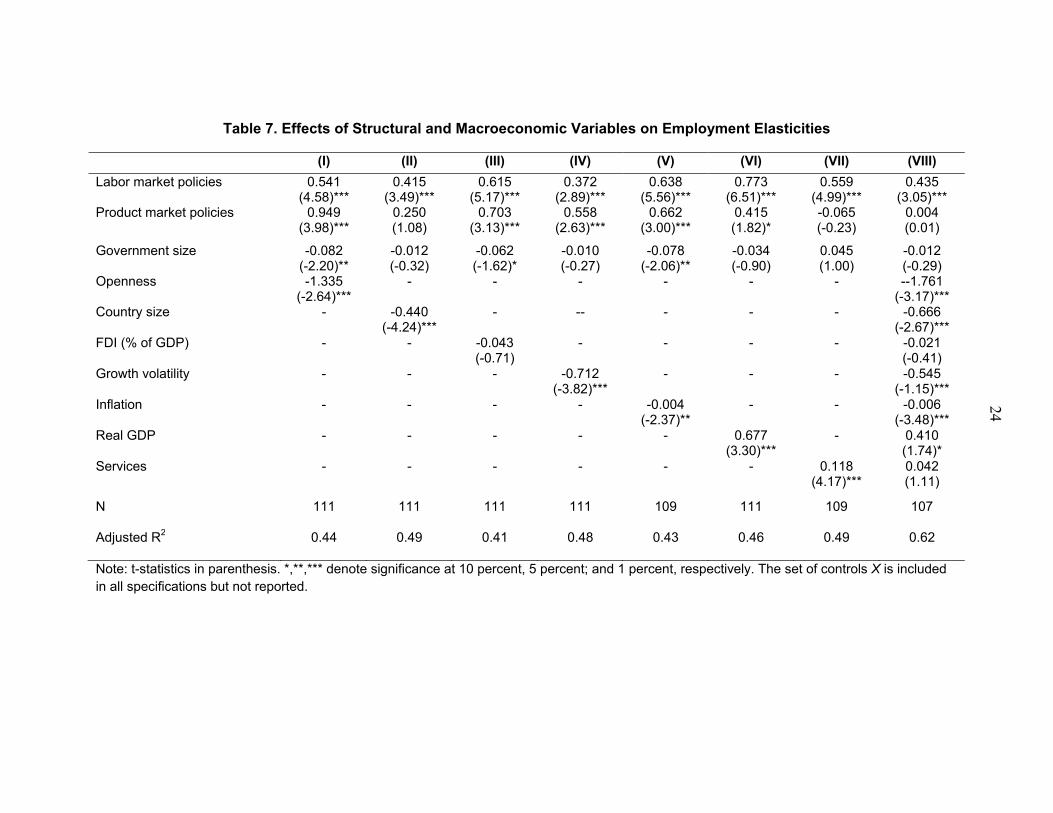
31. Table 7 presents the econometric results of estimating equation (3) when structural and macroeconomic variables are included in the specification. The results show that the
11
effects of labor market policies, and to a lesser extent product market policies, are robust to the inclusion of macroeconomic controls.
32. In addition to structural policies, macroeconomic policies aimed at reducing macroeconomic (output and price) volatility are found to have a significant effect in increasing employment elasticities. The results also show that different levels of economic development (proxied by the real GDP per capita) and trade openness contribute to explaining cross-country variations in employment elasticities. In particular, the results suggest that employment elasticities tend to be higher in more advanced and closed economies9. Finally, the results also confirm previous empirical evidence suggesting that the employment intensity of growth tends to be higher in countries with a larger service sector (Padalino and Vivarelli, 1997; Mourre 2004).
Demographic Variables
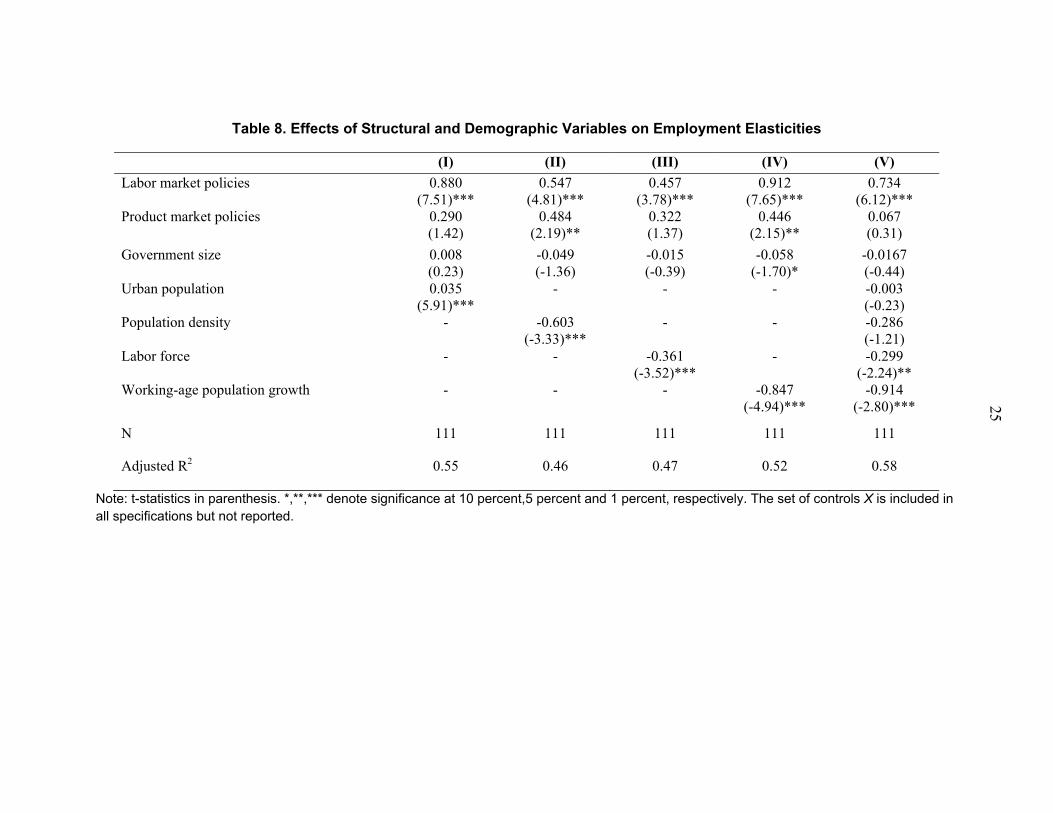
33. Table 8 presents the econometric results of estimating equation (3) when structural and demographic variables are included in the specification. The results show employment elasticities vary with demographic characteristics. In particular, the results in the table suggest that countries with a higher share of urban population are typically characterized by larger employment elasticities. In contrast, higher population density, labor force and working-age population growth are negatively correlated with employment-output elasticities, and urban population. Overall, the results for labor market policies, and to a lesser extent product market policies, are robust to the inclusion of demographic controls.
Labor Market Indicators
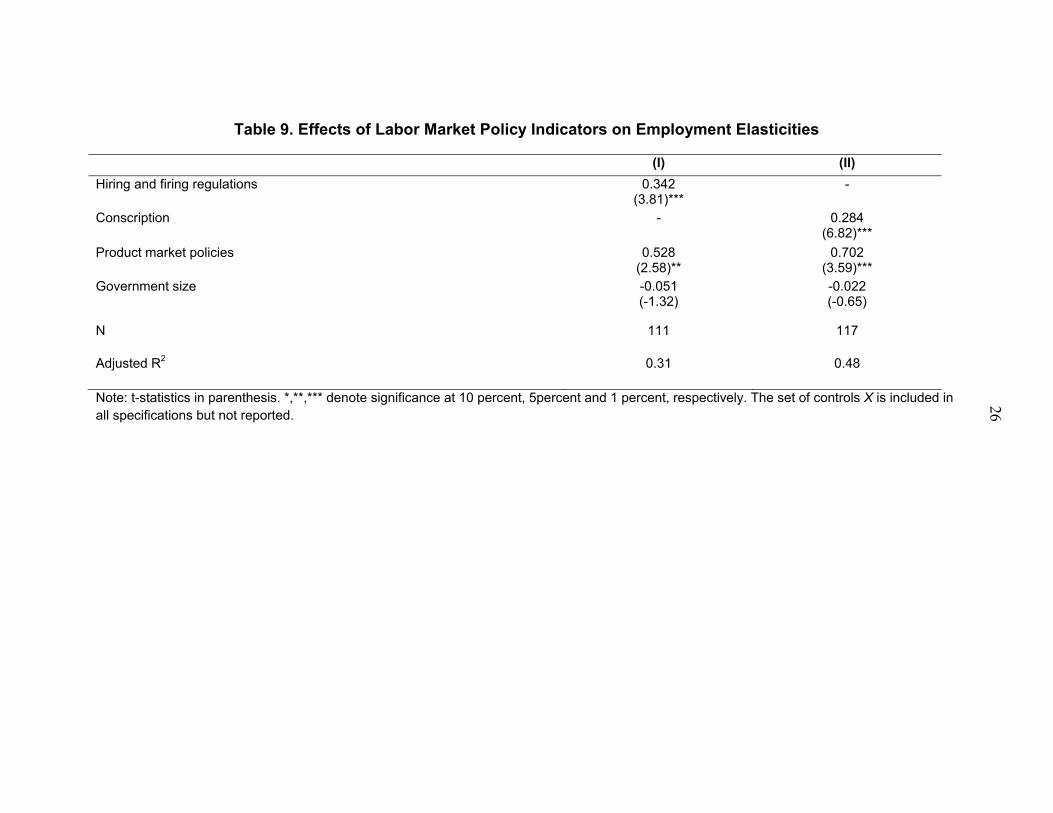
34. The results presented so far have provided robust evidence that labor market policies may have a sizeable and significant positive effect on employment elasticities. While the reason to consider a composite indicator is the inherently complex nature of labor market regulation, and the evidence that improvements in labor market efficiency are likely to require reforms in more than one area of the labor market (Bassanini and Duval, 2009), from a policy perspective it is also interesting to assess the role of the single components of each indicator in affecting employment elasticities.
35. For this purpose, equation (3) has been re-estimated using as explanatory variables the components of the composite labor market indicator described in the previous section. The results suggest that among these sub-indicators, those having a statistically significant and positive effect on employment elasticities are: (i) Hiring and firing regulations; and (ii) Conscription (Table 9). In contrast, there is no evidence of a statistically significant
9 From a theoretical point of view the effect of trade openness on employment elasticities is ambiguous.
12
relationship between employment elasticities and the indicator of centralized collective wage bargaining.
36. These results are consistent with the evidence presented in Bernal-Verdugo et al. (2012a and b) which show that these indicators are also the ones that have a significant impact on unemployment outcomes. Overall, the results for product market regulation and government size are in general robust to the inclusion of different labor market indicators.
Product Market Indicators
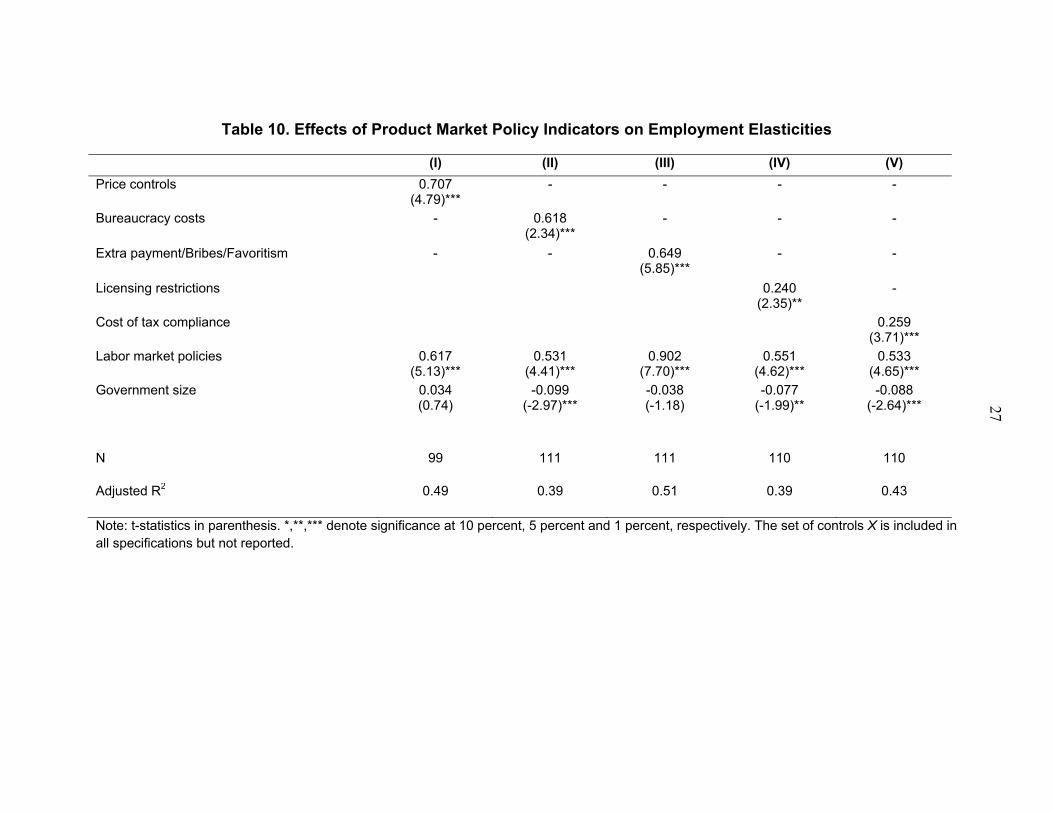
37. In order to assess the role of the different components of product market policies, equation (3) has been alternatively estimated using as explanatory variables the components of product market policies described in the previous section.
38. The estimation results presented in Table 10 show that most of the product market policy indicators have a positive and statistically significant effect on employment elasticities. In particular, price controls, bureaucracy costs and extra payments/bribes are those having the largest and most statistically significant impact.
39. The results for labor market policies and government size are robust across all specifications. An exception is the lack of significance of government size when the indicators of price controls and extra payments/bribes are considered. Interestingly, this result is driven by the strong negative correlation between these variables, suggesting that countries with larger governments tend to be associated with higher price controls and extra payments/bribes.
Non-Linear Effects
40. The results presented in the previous section have shown that structural and policy variables have a significant effect on employment elasticities. However, while these results present average effects for all countries in the sample, it could be the case that the effect differs across countries, depending on each country’s macroeconomic characteristics.
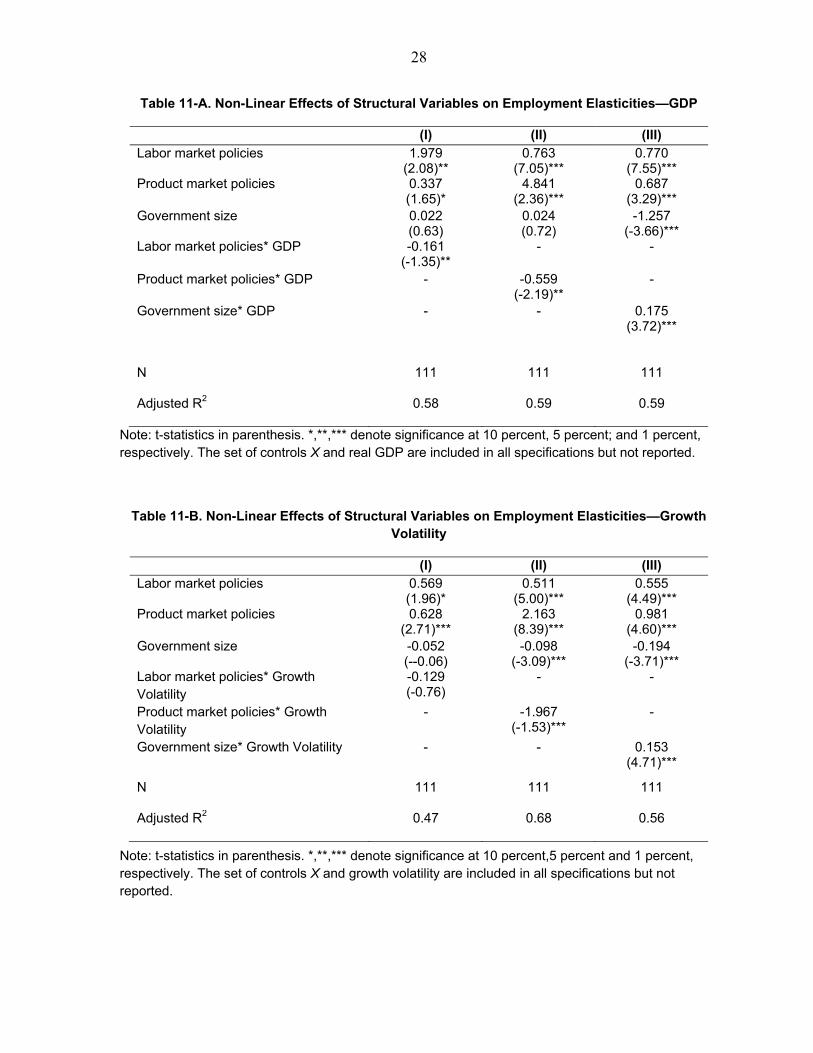
41. A first natural candidate to test for these non-linear effects is the level of economic development. To test whether the effect of structural policies on employment elasticities depends on the level of economic development, equation (3) has been estimated by including an interaction term between the level of real GDP per capita and each of the structural variables considered in the previous analysis. The results of this exercise show that, indeed, the effect of structural policies on employment elasticities is a decreasing function of the level of economic development (Table 11.A), suggesting that policies aimed at increasing labor and product market flexibility and reducing government size tend to have a larger effect in less developed countries. In addition, the inclusion of the interaction term in the analysis significantly increases the fitting power of the regression.
13
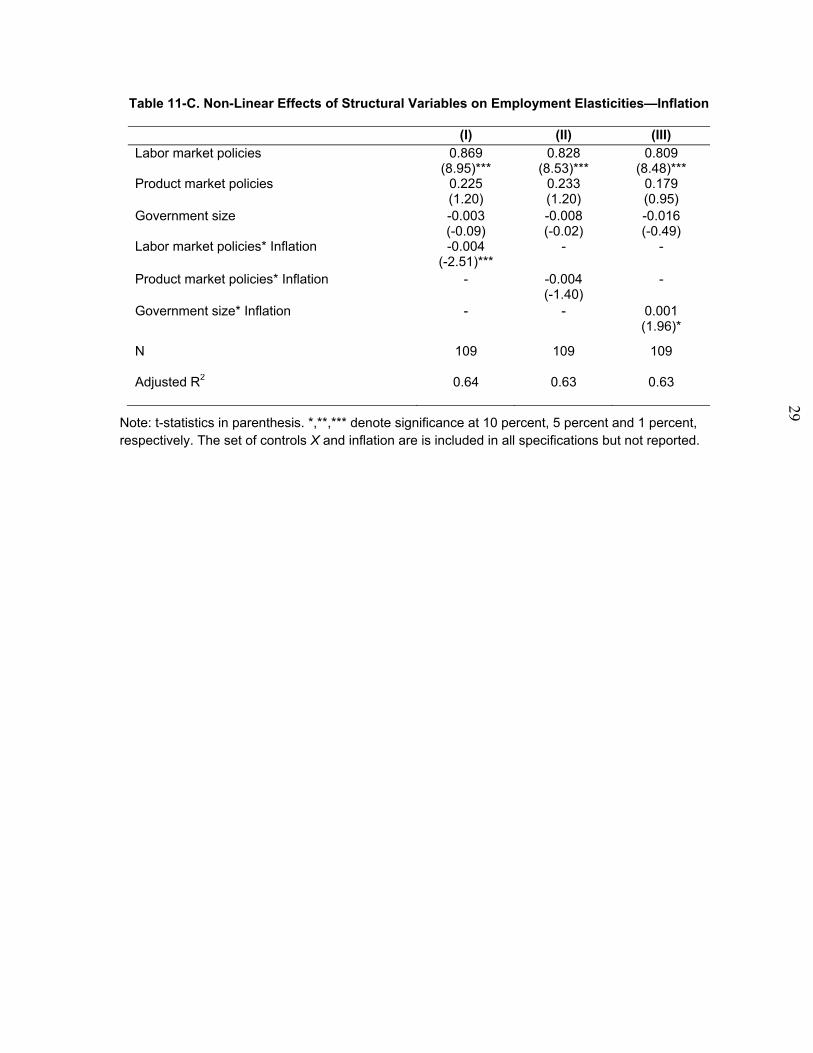
42. Finally, we analyze whether the effect of structural policies on employment elasticities is a function of the degree of macroeconomic volatility in the economy. The results show that growth volatility and inflation are important factors in shaping the response of employment elasticities to structural variables (Table 11.B and Table 11.C). In particular, the results suggest the lower the level of economic and price volatility in the economy, the larger the effects structural policies tend to have on employment elasticities; this implies that in order to maximize the effect of structural policies on employment responsiveness, structural reforms have to be complemented by macroeconomic policies aimed at increasing macroeconomic stability.
IV. CONCLUSIONS
43. The aim of this work is to contribute to the literature on employment-GDP elasticities in two main directions. First, it provides a new set of employment-GDP elasticities for a large set of advanced and developing economies. Second, it tries to assess the determinants of cross-country variations in employment elasticities, focusing in particular on the role played by structural variables.
44. The key results of the paper can be summarized as follows: (i) point estimates of elasticities typically fall in the 0–1 range, with the majority of them ranging between 0.3 and 0.8; (ii) elasticities vary considerably across regions, income groups, and production sectors, with the highest estimates typically recorded for the most economically developed regions, and in industry and services sectors; (iii) structural policies aimed at increasing labor and product market flexibility and reducing government size have a significant and positive impact on employment elasticities; (iv) macroeconomic policies aimed at reducing macroeconomic volatility have a significant and positive impact on employment elasticities; and (v) in order to maximize the positive impact on the responsiveness of employment to economic activity, structural policies have to be complemented with macroeconomic policies aimed at increasing macroeconomic stability.
45. Some of these results, however, have to be interpreted with caution. While we indeed find robust econometric evidence that structural policies are likely to have positive effects on employment-GDP elasticities and therefore on medium-term job creation, the results do not necessarily say that these policies would have a positive impact on job creation during periods of crisis. Actually, if we translate the interpretation of our (medium-term) results to short-term analysis (which we discourage), they would tend to suggest the opposite.
46. Finally, another and perhaps more important caveat, is that our results have nothing to say about the quality of jobs created. In particular, while the results suggest that structural policies may positively influence the elasticity of total employment to GDP, no inference can be drawn as to the quality of employment. In this context, policy makers should carefully design structural policies in such a way as to internalize social costs and to improve the quality of employment.

14
47. Building on our study, a number of interesting extensions can be pursued. First, several other types of structural policies, beyond those analyzed in the paper, could in principle affect employment-GDP elasticities. In this regard, tax policy, social benefits and measures of labor market mismatches are natural candidates. Second, it would be important to differentiate between labor market inflows and outflows (job creation vs. job destruction) and assess their respective responsiveness to upturns and downturns in economic activity, and the role that structural policies may have in influencing their responsiveness.
REFERENCES
Afonso, A. and D. Furceri (2010), “Government Size, Composition, Volatility and Economic Growth,” European Journal of Political Economy, 26(4), 517–532. Baker, D. and J. Schmitt, (1999), The Macroeconomic Roots of High Unemployment: The Impact of Foreign Growth, Economic Policy Institute.
Bassanini, A. and R. Duval (2006), “Employment Patterns in OECD Countries: Reassessing the Role of Policies and Institutions,” OECD Economics Department Working Papers, No. 486 (Paris: Organization for Economic Co-operation and Development). Bassanini, A. and R. Duval (2009), “Unemployment, Institutions, and Reform Complementarities: Re-assessing the Aggregate Evidence for OECD Countries,” Oxford Review of Economic Policy, Vol. 25(1), pp.40–59. Belot, Michèle, Jan C.van Ours, (2004). “Does the Recent Success of Some OECD Countries in Lowering their Unemployment Rates Lie in the Clever Design of Their Labor Market Reforms?” Oxford Economic Papers, 56 (4), 621–642. Bernal-Verdugo, L.E., D. Furceri, and D. Guillaume (2012a), “Crises, Labor Market Policy, and Unemployment,” IMF Working Papers 12/65 (Washington: International Monetary Fund). Bernal-Verdugo, L.E., D. Furceri, and D. Guillaume (2012b), “Labor Market Flexibility and Unemployment: New Empirical Evidence of Static and Dynamics Effects,” Comparative Economic Studies, Vol. 54(2), pp.251–273. Blanchard, O., and J. Wolfers (2000), “The Role of Shocks and Institutions in the Rise of European Unemployment: The Aggregate Evidence,” The Economic Journal, Vol. 110(462), pp. 1–33. Botero, Juan C., Simeon Djankov, Rafael La Porta, Florencio Lopez-de-Silanes, Andrei Shleifer (2004).“The Regulation of Labor,” Quarterly Journal of Economics, 119 (4), pp. 1339–382. Bruno, Michael and Jeffrey Sachs (1985), The Economics of Worldwide Stagflation. (Oxford: Blackwell). Bruno, S.F. et al. (2001). “Measuring the effect of Globalization on Labour Demand Elasticity: An Empirical Application to OECD Countries,” FLOWENLA Discussion Paper 2. Daveri, F. and G. Tabellini (2000). “Unemployment, Growth and Taxation in Industrial Countries,” Economic Policy.
16
Döpke, J. (2001). “The ‘Employment Intensity’ of Growth in Europe.” Kiel Working Paper No. 1021 (Kiel: Kiel Institute for the World Economy). Elmeskov, Jørgen, John P. Martin, Stefano Scarpetta (1998). “Key Lessons for Labour Market Reforms: Evidence from OECD Countries’ Experiences,” Swedish Economic Policy Review, Vol. 5 (2), 205–52. Erber, G. (1994). “Verdoorn’s or Okun’s law?” German Institute for Economic Research Discussion Paper, n.98, Berlin.
Feldmann, Horst, (2006). “Government Size and Unemployment: Evidence from Industrial Countries,” Public Choice, Vol. 127 (3–4), pp. 451–67. Freeman, D.G. (2001). “Panel Tests of Okun’s Law for Ten Industrial Countries.” Economic Inquiry, Vol. 39, pp.511–23.
Furceri, D. (2010). “Long-Run Growth and Volatility: Which Source Really Matters?” Applied Economics, Vol. 42, 1865–1874. Gabrisch, H., and H. Buscher (2005). “The Unemployment-Growth Relationship in Transition Countries.” IWH Discussion Paper, n. 5, (Halle, Germany: Halle Institute for Economic Research).
Kapsos, S. (2005). “The Employment Intensity of Growth: Trends and Macroeconomic Determinants,” ILO Employment Strategy Papers 12 (Geneva: International Labour Organization). Kaufman, R. (1988). “An International Comparison of Okun's Law.” Journal of Comparative Economics, Vol. 12, pp. 189–203.
Imbs, J. (2007). “ Growth and Volatility,” Journal of Monetary Economics, Vol. 54, 1848–62. Izyumov, A. and J. Vahaly (2002). “The Unemployment-Output Trade-Off in Transition Economies: Does Okun’s Law Apply?” Economics of Planning, Vol. 35, pp. 317–31.
Judson, R. and A. Orphanides (1999). “Inflation, Volatility and Growth,” International Finance, Vol. 2, pp. 117–38. La Porta, R., F. Lopez de Silanes, A. Shleifer, and R. Vishny (1998). “The Quality of Government,” Journal of Law, Economics and Organization, Vol. 15(1), 222–79.
Lee, J. (2000). “The Robustness of Okun’s Law: Evidence from OECD Countries.” Journal of Macroeconomics, Vol. 22, pp. 331–56.
Moosa, I.A. (1997). “A Cross-Country Comparison of Okun’s Coefficient,” Journal of Comparative Economics, Vol. 24, pp. 335–56.
17
Mourre, G. 2004. “Did the Pattern of Aggregate Employment Growth Change in the Euro Area in the Late 1990s?” European Central Bank Working Paper Series, 2004, No. 358 (Brussels: European Central Bank). Nickell, S. (1997). “Unemployment and Labor Market Rigidities: Europe versus North America,” The Journal of Economic Perspectives, Vol. 11, ( 3). Nickell, S. (1998). “Unemployment: Questions and Some Answers,” The Economic Journal, Vol. 108 (448). Nickell, Stephen, Luca Nunziata, and Wolfgang Ochel (2005). “Unemployment in the OECD since the 1960s. What Do We Know?” The Economic Journal, Vol. 115(500), pp. 1–27. Nunziata, L. (2002).”Unemployment, Labour Market Institutions and Shocks,” Nuffield College Working Papers in Economics 2002-W16. Okun, A. 1962. “Potential Output: Its Measurement and Significance.” Proceedings of the Business and Economic Statistics Section of the American Statistical Society.
Padalino, S. and M. Vivarelli, (1997), “The Employment Intensity of Economic Growth in the G-7 Countries,” International Labor Review, 136 (2). Perman, R. and C. Tavera, (2005). “A Cross-country Analysis of the Okun’s Law Coefficient Convergence in Europe.” Applied Economics, Vol. 37, pp. 2501–13.
Ramey, G. and V. A. Ramey (1995). “Cross-Country Evidence on the Link-Between Volatility and Growth,” American Economic Review, Vol. 85, 1138–51. Revenga, A.L. and S. Bentolila (1995). “What Affects the Employment Intensity of Growth?” Discussion Paper No. 9517, Bank of Spain.
Sachs, J.D. and A.M Warner (1995). “Natural Resource Abundance and Economic Growth,” NBER Working Paper Series, 5398 (Cambridge, MA: National Bureau of Economic Research).
Saget, C. (2000), “Can the Level of Employment be Explained by GDP Growth in Transition Countries (Theory Versus the Quality of Data),” ILO Development Policy Group, (Geneva: International Labor Organization). Stock, J.H. (1987), “Asymptotic properties of Least Squares Estimators of Cointegrating Vectors.” Econometrica Vol. 55, pp. 1035–1056. Wooldridge, J. (1995). “Score Diagnostics for Linear Models Estimated by Two Stage Least Squares,” in Maddala, G., Phillips, P. and Srinivasan, T (eds.), Advances in Econometrics and Quantitative Economics: Essays in Honor of Professor C. R. Rao, 66–87 (Oxford: Blackwell).
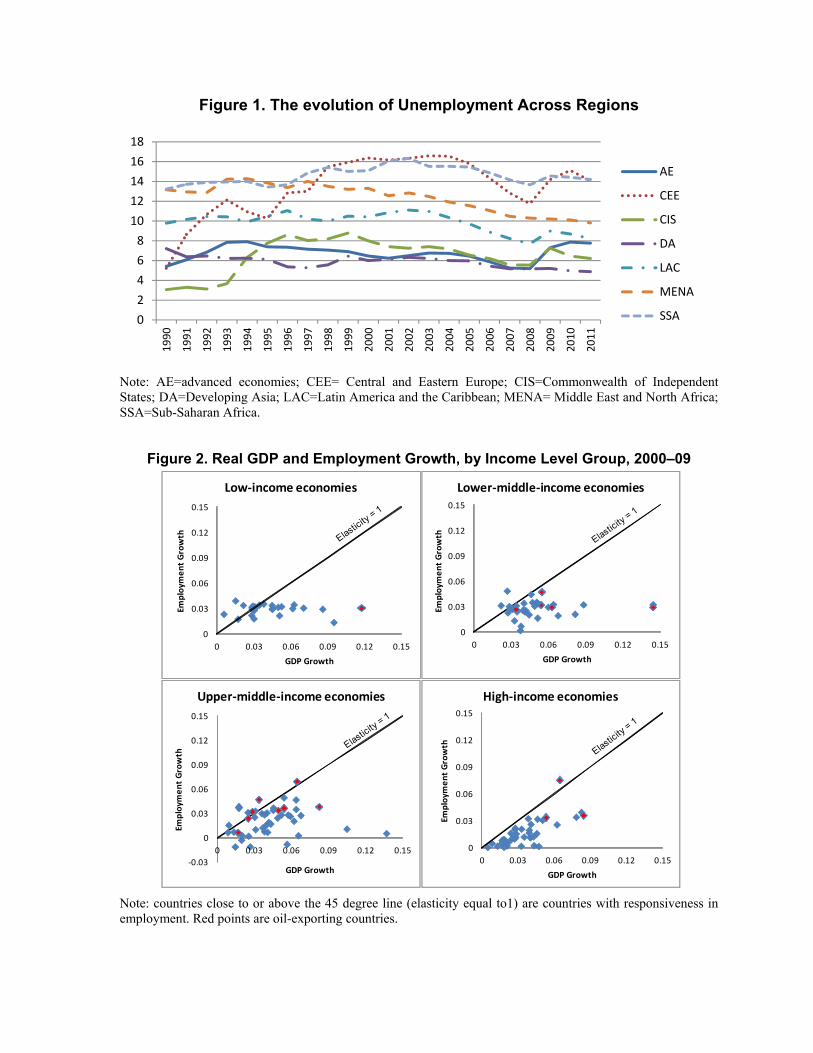
Figure 1. The evolution of Unemployment Across Regions
Note: AE=advanced economies; CEE= Central and Eastern Europe; CIS=Commonwealth of Independent States; DA=Developing Asia; LAC=Latin America and the Caribbean; MENA= Middle East and North Africa; SSA=Sub-Saharan Africa.
Figure 2. Real GDP and Employment Growth, by Income Level Group, 2000–09
Note: countries close to or above the 45 degree line (elasticity equal to1) are countries with responsiveness in employment. Red points are oil-exporting countries.
0
2
4
6
8
10
12
14
16
18
19
90
19
91
19
92
19
93
19
94
19
95
19
96
19
97
19
98
19
99
20
00
20
01
20
02
20
03
20
04
20
05
20
06
20
07
20
08
20
09
20
10
20
11
AE
CEE
CIS
DA
LAC
MENA
SSA
0
0.05
0.1
0.15
0.2
0 0.05 0.1 0.15 0.2
Emp
loym
en
t G
row
th
GDP Growth
Low-income economies
0
0.02
0.04
0.06
0.08
0.1
0 0.02 0.04 0.06 0.08 0.1
Emp
loym
en
t G
row
th
GDP Growth
Lower-middle-income economies
-0.03
1E-16
0.03
0.06
0.09
0.12
0.15
0.18
0 0.03 0.06 0.09 0.12 0.15 0.18
Emp
loym
en
t G
row
th
GDP Growth
Upper-middle-income economies
0
0.03
0.06
0.09
0.12
0 0.03 0.06 0.09 0.12 0.15 0.18 0.21
Emp
loym
en
t G
row
th
GDP Growth
High-income economies
0
0.03
0.06
0.09
0.12
0.15
0 0.03 0.06 0.09 0.12 0.15
Emp
loym
en
t G
row
th
GDP Growth
Low-income economies
0
0.03
0.06
0.09
0.12
0.15
0 0.03 0.06 0.09 0.12 0.15
Emp
loym
en
t G
row
th
GDP Growth
Lower-middle-income economies
-0.03
0
0.03
0.06
0.09
0.12
0.15
0 0.03 0.06 0.09 0.12 0.15
Emp
loym
en
t G
row
th
GDP Growth
Upper-middle-income economies
0
0.03
0.06
0.09
0.12
0.15
0 0.03 0.06 0.09 0.12 0.15
Emp
loym
en
t G
row
th
GDP Growth
High-income economies
19
Figure 3. Distribution of Long-Run Employment Elasticities (Equation (1))
0
2
4
6
8
10
12
14
-0.4 -0.2 0.0 0.2 0.4 0.6 0.8 1.0 1.2
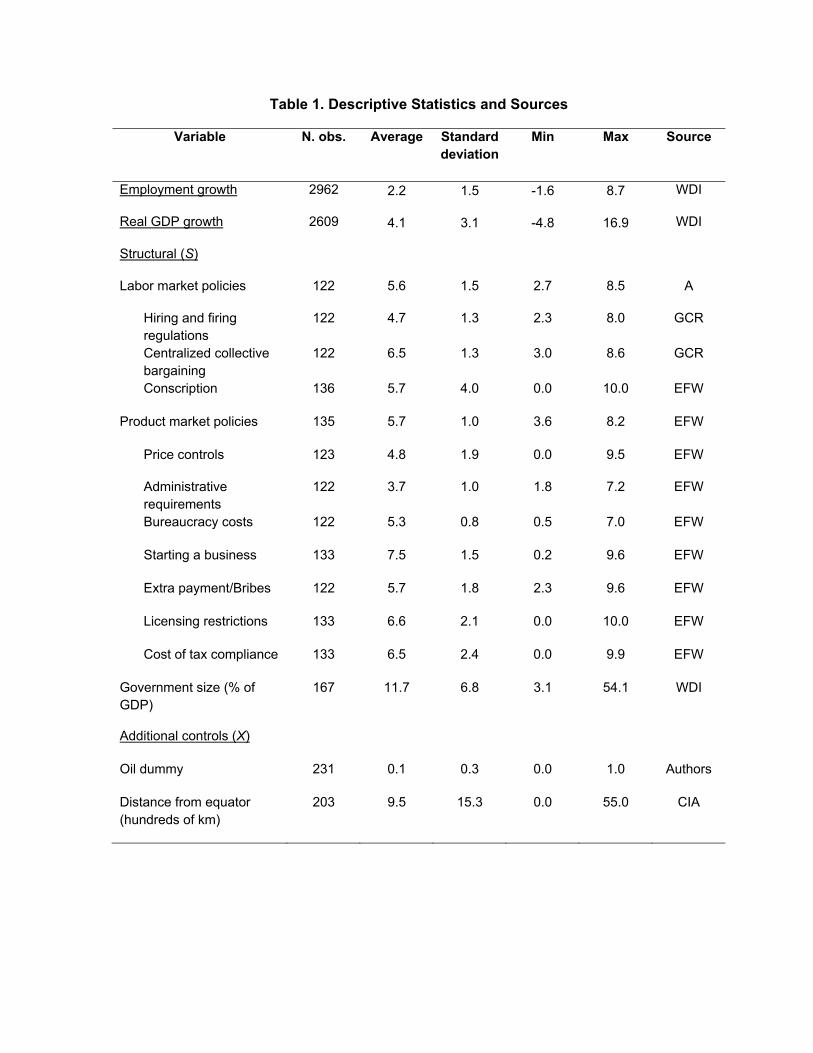
Table 1. Descriptive Statistics and Sources
Variable N. obs. Average Standard deviation
Min Max Source
Employment growth 2962 2.2 1.5 -1.6 8.7 WDI
Real GDP growth 2609 4.1 3.1 -4.8 16.9 WDI
Structural (S)
Labor market policies 122 5.6 1.5 2.7 8.5 A
Hiring and firing regulations
122 4.7 1.3 2.3 8.0 GCR
Centralized collective bargaining
122 6.5 1.3 3.0 8.6 GCR
Conscription 136 5.7 4.0 0.0 10.0 EFW
Product market policies 135 5.7 1.0 3.6 8.2 EFW
Price controls 123 4.8 1.9 0.0 9.5 EFW
Administrative requirements
122 3.7 1.0 1.8 7.2 EFW
Bureaucracy costs 122 5.3 0.8 0.5 7.0 EFW
Starting a business 133 7.5 1.5 0.2 9.6 EFW
Extra payment/Bribes 122 5.7 1.8 2.3 9.6 EFW
Licensing restrictions 133 6.6 2.1 0.0 10.0 EFW
Cost of tax compliance 133 6.5 2.4 0.0 9.9 EFW
Government size (% of GDP)
167 11.7 6.8 3.1 54.1 WDI
Additional controls (X)
Oil dummy 231 0.1 0.3 0.0 1.0 Authors
Distance from equator (hundreds of km)
203 9.5 15.3 0.0 55.0 CIA
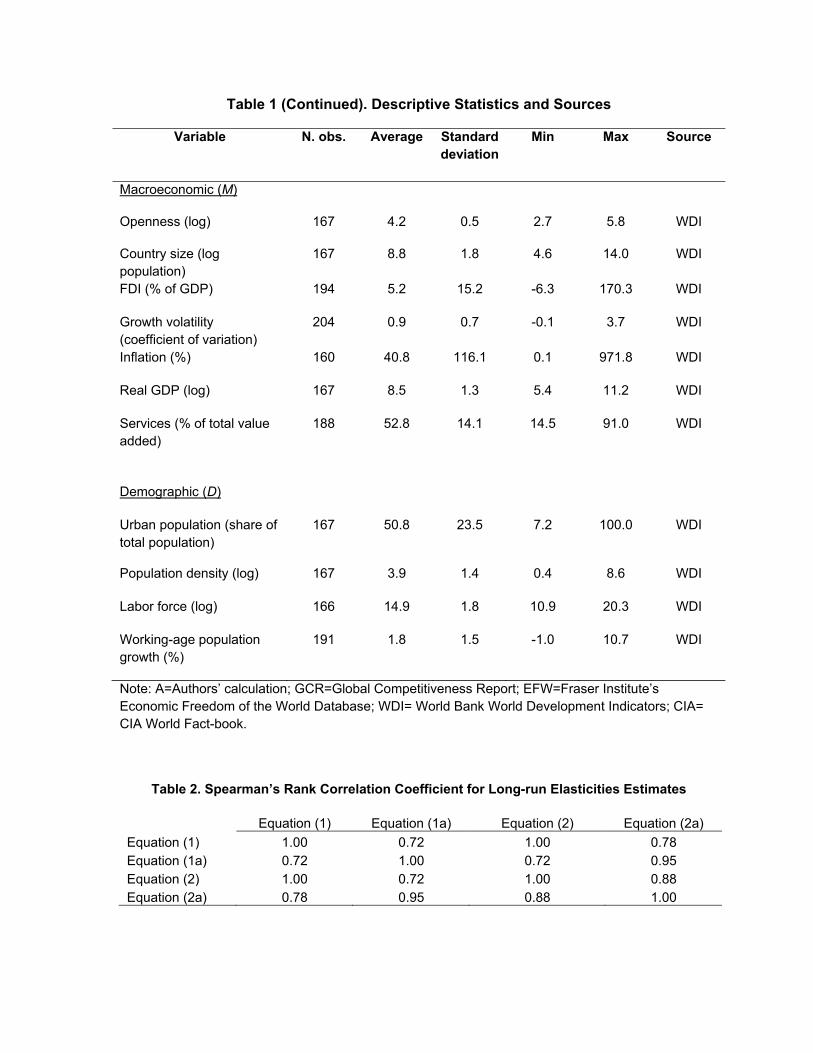
Table 1 (Continued). Descriptive Statistics and Sources
Variable N. obs. Average Standard deviation
Min Max Source
Macroeconomic (M)
Openness (log) 167 4.2 0.5 2.7 5.8 WDI
Country size (log population)
167 8.8 1.8 4.6 14.0 WDI
FDI (% of GDP) 194 5.2 15.2 -6.3 170.3 WDI
Growth volatility (coefficient of variation)
204 0.9 0.7 -0.1 3.7 WDI
Inflation (%) 160 40.8 116.1 0.1 971.8 WDI
Real GDP (log) 167 8.5 1.3 5.4 11.2 WDI
Services (% of total value added)
188 52.8 14.1 14.5 91.0 WDI
Demographic (D)
Urban population (share of total population)
167 50.8 23.5 7.2 100.0 WDI
Population density (log) 167 3.9 1.4 0.4 8.6 WDI
Labor force (log) 166 14.9 1.8 10.9 20.3 WDI
Working-age population growth (%)
191 1.8 1.5 -1.0 10.7 WDI
Note: A=Authors’ calculation; GCR=Global Competitiveness Report; EFW=Fraser Institute’s Economic Freedom of the World Database; WDI= World Bank World Development Indicators; CIA= CIA World Fact-book.
Table 2. Spearman’s Rank Correlation Coefficient for Long-run Elasticities Estimates
Equation (1) Equation (1a) Equation (2) Equation (2a)
Equation (1) 1.00 0.72 1.00 0.78 Equation (1a) 0.72 1.00 0.72 0.95 Equation (2) 1.00 0.72 1.00 0.88 Equation (2a) 0.78 0.95 0.88 1.00
22
Table 3. Long Term Employment Elasticities, by Region, Income Level, and Economic Sector
Total1 Total 22 Agriculture2 Industry2 Services2
by region
A. East Asia and Pacific 0.27 0.26 0.35 0.27 0.25
B. Western Europe 0.64 0.64 0.55 0.62 0.65
C. Eastern Europe and Central Asia 0.23 0.29 0.29 0.34 0.29
D. Latin America and the Caribbean 0.16 0.17 0.15 0.19 0.17
E. Middle East and North Africa 0.08 0.25 0.36 0.30 0.20
Oil exporters 0.09 0.25 0.34 0.39 0.24
Oil importers 0.09 0.39 0.41 0.32 0.14
F. South Asia 0.99 0.97 1.01 1.04 0.92
G. Sub-Saharan Africa -0.02 0.36 0.47 0.30 0.34
H. North America 0.81 0.87 1.01 0.85 0.77
I. Australia and New Zealand 0.80 0.80 0.69 0.74 0.83
by income
J. Low-income economies ($1005 or less) 0.02 0.19 0.33 0.18 0.23
K. Lower-middle-income economies ($1006 to $3975) 0.10 0.24 0.26 0.25 0.24
L. Upper-middle-income countries ($3976-$12,275) 0.18 0.25 0.24 0.26 0.23
M. High-income economies ($12,276 or more) 0.46 0.49 0.48 0.50 0.49
Note: Estimates from eq.(2a) for total GDP, agriculture, industry; and services, with region or income group dummies, respectively. 1Estimates based on full sample. 2Estimates based on a restricted sample for which observations for employment in each economic sector (agriculture, industry, and services) are available.
Table 4. Evolution of Employment Elasticities with Time
(I) (II) (III)
log (GDP) 0.102*** 0.131*** 0.125***
(0.010) (0.006) (0.006)
log (GDP)* Time-trend 0.0006*** - -
(0.0002) - -
log (GDP)* Dummy 1990s - -0.006** -
- (0.0022) -
log (GDP)* Dummy 2000s 0.006** (0.0022) N 166 166 166
Adjusted R2 0.15 0.15 0.15 Note: Dependent variable is log (employment). Standard errors in parenthesis; ***,**,* indicate significance at 1, 5, and 10 percent respectively. IV instruments based on first and second lags of GDP and interactions.
23
Table 5. Correlation Between Employment Elasticities and Structural Policy Variables
Labor market policies Product market policies Government size
0.52*** 0.56*** -0.47***
Note: z-statistics in parenthesis. *** denotes significance at 1 percent.
Table 6. Effects of Structural Variables on Employment Elasticities
(I) (II) (III) (IV) (V) (VI) (VII) (VIII)
Labor market policies 0.747 (6.33)***
- - 0.625 (5.49)***
0.704 (6.47)***
0.593 (4.95)***
- 0.632 (5.45)***
Product market policies - 1.249 (5.81)***
- 0.652 (2.90)***
0.885 (4.63)***
- 1.098 (4.97)***
0.686 (3.08)***
Government size - - -0.166 (-6.16)***
-0.073 (-1.98)**
- -0.125 (-3.76)***
-0.100 (-2.59)***
-0.064 (-1.70)*
Distance from equator - - - - -0.051 (-2.30)**
-0.035 (-1.51)
-0.027 (-0.94)
-0.043 (-1.89)*
Oil dummy - - - - -0.817 (-0.95)
-1.143 (-1.28)
-1.719 (-1.56)
-1.029 (-1.20)
N 111 117 134 111 111 111 117 111
Adjusted R2 0.26 0.22 0.22 0.39 0.40 0.36 0.27 0.41
Note: t-statistics in parenthesis. *,**,*** denote significance at 10 percent, 5 percent; and 1 percent, respectively.
24
Table 7. Effects of Structural and Macroeconomic Variables on Employment Elasticities
(I) (II) (III) (IV) (V) (VI) (VII) (VIII)
Labor market policies 0.541 (4.58)***
0.415 (3.49)***
0.615 (5.17)***
0.372 (2.89)***
0.638 (5.56)***
0.773 (6.51)***
0.559 (4.99)***
0.435 (3.05)***
Product market policies 0.949 (3.98)***
0.250 (1.08)
0.703 (3.13)***
0.558 (2.63)***
0.662 (3.00)***
0.415 (1.82)*
-0.065 (-0.23)
0.004 (0.01)
Government size -0.082 (-2.20)**
-0.012 (-0.32)
-0.062 (-1.62)*
-0.010 (-0.27)
-0.078 (-2.06)**
-0.034 (-0.90)
0.045 (1.00)
-0.012 (-0.29)
Openness -1.335 (-2.64)***
- - - - - - --1.761 (-3.17)***
Country size - -0.440 (-4.24)***
- -- - - - -0.666 (-2.67)***
FDI (% of GDP) - - -0.043 (-0.71)
- - - - -0.021 (-0.41)
Growth volatility - - - -0.712 (-3.82)***
- - - -0.545 (-1.15)***
Inflation - - - - -0.004 (-2.37)**
- - -0.006 (-3.48)***
Real GDP - - - - - 0.677 (3.30)***
- 0.410 (1.74)*
Services - - - - - - 0.118 (4.17)***
0.042 (1.11)
N 111 111 111 111 109 111 109 107
Adjusted R2 0.44 0.49 0.41 0.48 0.43 0.46 0.49 0.62
Note: t-statistics in parenthesis. *,**,*** denote significance at 10 percent, 5 percent; and 1 percent, respectively. The set of controls X is included in all specifications but not reported.
25
Table 8. Effects of Structural and Demographic Variables on Employment Elasticities
(I) (II) (III) (IV) (V)
Labor market policies 0.880 (7.51)***
0.547 (4.81)***
0.457 (3.78)***
0.912 (7.65)***
0.734 (6.12)***
Product market policies 0.290 (1.42)
0.484 (2.19)**
0.322 (1.37)
0.446 (2.15)**
0.067 (0.31)
Government size 0.008 (0.23)
-0.049 (-1.36)
-0.015 (-0.39)
-0.058 (-1.70)*
-0.0167 (-0.44)
Urban population 0.035 (5.91)***
- - - -0.003 (-0.23)
Population density - -0.603 (-3.33)***
- - -0.286 (-1.21)
Labor force - - -0.361 (-3.52)***
- -0.299 (-2.24)**
Working-age population growth - - - -0.847 (-4.94)***
-0.914 (-2.80)***
N 111 111 111 111 111
Adjusted R2 0.55 0.46 0.47 0.52 0.58
Note: t-statistics in parenthesis. *,**,*** denote significance at 10 percent,5 percent and 1 percent, respectively. The set of controls X is included in all specifications but not reported.
26
Table 9. Effects of Labor Market Policy Indicators on Employment Elasticities
(I) (II)
Hiring and firing regulations 0.342 (3.81)***
-
Conscription - 0.284 (6.82)***
Product market policies 0.528 (2.58)**
0.702 (3.59)***
Government size -0.051 (-1.32)
-0.022 (-0.65)
N 111 117
Adjusted R2 0.31 0.48
Note: t-statistics in parenthesis. *,**,*** denote significance at 10 percent, 5percent and 1 percent, respectively. The set of controls X is included in all specifications but not reported.
27
Table 10. Effects of Product Market Policy Indicators on Employment Elasticities
(I) (II) (III) (IV) (V)
Price controls 0.707 (4.79)***
- - - -
Bureaucracy costs - 0.618 (2.34)***
- - -
Extra payment/Bribes/Favoritism - -
0.649 (5.85)***
- -
Licensing restrictions 0.240 (2.35)**
-
Cost of tax compliance 0.259 (3.71)***
Labor market policies 0.617 (5.13)***
0.531 (4.41)***
0.902 (7.70)***
0.551 (4.62)***
0.533 (4.65)***
Government size 0.034 (0.74)
-0.099 (-2.97)***
-0.038 (-1.18)
-0.077 (-1.99)**
-0.088 (-2.64)***
N 99 111 111 110 110
Adjusted R2 0.49 0.39 0.51 0.39 0.43
Note: t-statistics in parenthesis. *,**,*** denote significance at 10 percent, 5 percent and 1 percent, respectively. The set of controls X is included in all specifications but not reported.
28
Table 11-A. Non-Linear Effects of Structural Variables on Employment Elasticities—GDP
(I) (II) (III) Labor market policies 1.979
(2.08)** 0.763
(7.05)*** 0.770
(7.55)*** Product market policies 0.337
(1.65)* 4.841
(2.36)*** 0.687
(3.29)*** Government size 0.022
(0.63) 0.024 (0.72)
-1.257 (-3.66)***
Labor market policies* GDP -0.161 (-1.35)**
- -
Product market policies* GDP - -0.559 (-2.19)**
-
Government size* GDP - - 0.175 (3.72)***
N 111 111 111
Adjusted R2 0.58 0.59 0.59
Note: t-statistics in parenthesis. *,**,*** denote significance at 10 percent, 5 percent; and 1 percent, respectively. The set of controls X and real GDP are included in all specifications but not reported.
Table 11-B. Non-Linear Effects of Structural Variables on Employment Elasticities—Growth Volatility
(I) (II) (III) Labor market policies 0.569
(1.96)* 0.511
(5.00)*** 0.555
(4.49)*** Product market policies 0.628
(2.71)*** 2.163
(8.39)*** 0.981
(4.60)*** Government size -0.052
(--0.06) -0.098
(-3.09)*** -0.194
(-3.71)*** Labor market policies* Growth Volatility
-0.129 (-0.76)
- -
Product market policies* Growth Volatility
- -1.967 (-1.53)***
-
Government size* Growth Volatility - - 0.153 (4.71)***
N 111 111 111
Adjusted R2 0.47 0.68 0.56
Note: t-statistics in parenthesis. *,**,*** denote significance at 10 percent,5 percent and 1 percent, respectively. The set of controls X and growth volatility are included in all specifications but not reported.
29
Table 11-C. Non-Linear Effects of Structural Variables on Employment Elasticities—Inflation
(I) (II) (III) Labor market policies 0.869
(8.95)*** 0.828
(8.53)*** 0.809
(8.48)*** Product market policies 0.225
(1.20) 0.233 (1.20)
0.179 (0.95)
Government size -0.003 (-0.09)
-0.008 (-0.02)
-0.016 (-0.49)
Labor market policies* Inflation -0.004 (-2.51)***
-
-
Product market policies* Inflation - -0.004 (-1.40)
-
Government size* Inflation - - 0.001 (1.96)*
N 109 109 109
Adjusted R2 0.64 0.63 0.63
Note: t-statistics in parenthesis. *,**,*** denote significance at 10 percent, 5 percent and 1 percent, respectively. The set of controls X and inflation are is included in all specifications but not reported.

30
APPENDIX
Table A1. Countries in the Sample
Low-Income Lower-Middle-Income Upper-Middle-Income High-Income Australia and New Zealand
Australia
New Zealand
East Asia and Pacific
Cambodia Indonesia China Hong Kong SAR, China
Myanmar Lao PDR Malaysia Japan
Mongolia Thailand Korea, Rep.
Papua New Guinea Macao SAR, China
Philippines Singapore
Vietnam
Eastern Europe and Central Asia
Kyrgyz Republic Armenia Albania Croatia
Tajikistan Georgia Azerbaijan Estonia
Moldova Belarus Hungary
Turkmenistan Bosnia and Herzegovina Poland
Ukraine Bulgaria Slovak Republic
Uzbekistan Kazakhstan Slovenia
Latvia
Lithuania
Macedonia, FYR
Romania
Russian Federation
Turkey
Latin America and the Caribbean
Haiti Belize Argentina Bahamas, The
Bolivia Brazil Trinidad and Tobago
El Salvador Chile
Guatemala Colombia
Guyana Costa Rica
Honduras Cuba
Nicaragua Dominican Republic
Paraguay Ecuador
Jamaica
Panama
Peru
Uruguay
Venezuela, RB
31
Table A1 (Continued). Countries in the Sample
Low-Income Lower-Middle-Income
Upper-Middle-Income High-Income
Middle East and North Africa Egypt, Arab Rep. Algeria Israel
Iraq Iran, Islamic Rep. Oman
Morocco Jordan Qatar
Syrian Arab Rep. Lebanon Saudi Arabia
West Bank and Gaza Libya United Arab Emirates
Yemen, Rep. Tunisia
North America
Mexico Canada
United States
South Asia
Bangladesh India Brunei Darussalam
Pakistan
Sri Lanka Sub-Saharan Africa
Benin Madagascar Angola Botswana
Burkina Faso Malawi Cameroon Gabon
Burundi Mali Cape Verde Mauritius
Chad Mozambique Cote d'Ivoire Namibia
Comoros Rwanda Ghana South Africa
Congo, Dem. Rep. Tanzania Lesotho
Eritrea Togo Mauritania
Ethiopia Uganda Nigeria
Gambia, The Zimbabwe Senegal
Guinea Sudan
Guinea-Bissau Swaziland
Kenya Zambia Western Europe Austria Italy
Belgium Luxembourg
Cyprus Malta
Czech Rep. Netherlands
Denmark Norway
Finland Portugal
France Spain
Germany Sweden
Greece Switzerland
Iceland United Kingdom
Ireland